soil microclimatology - national open university of nigeria
TRANSCRIPT

SLM307 MODULE 1
1
COURSE CODE: SLM 307
COURSE TITLE:
INTRODUCTION TO SOIL MICROCLIMATOLOGY

SLM 307 MODULE 1
2
SLM 301
INTRODUCTION TO SOIL MICROCLIMATOLOGY
Course Team:
Dr. A. M. Yamusa, ABU Zaria (Course Developer)
Dr. A. M. Yamusa, ABU Zaria (Course Writer)
Prof. Grace E. Jokthan, NOUN (Programme Leader)
Dr. Nasir M. Danmowa (Course Editor)
Dr. Aliyu Musa, NOUN (Course Coordinator)

SLM 307 MODULE 1
3

SLM 307 MODULE 1
4
CONTENTS PAGE
Introduction
What you will learn in this course
Course Aim
Course Objectives
Working through this course
Course Material
Study Units
Text Books and References
Assessment
Tutor – Marked assignment
Final Examination and Grading
Summary
INTRODUCTION

SLM 307 MODULE 1
5
Soil Microclimatology is the study concerned with the influence of weather and climate on
boundary layer. Microclimatology of soil is the distance between the deepest tree-root to
about one meter above crop canopy.
Soil microclimate can be defined as a complex of certain factors which determine the state of
a soil considering the soil as an environment for plants, animals or other objects.
Temperature, Humidity, aeration – but also composition of the soil air and of the soil solution
and permeability to water and to air – are examples of such factors (van Wijk, 1965).
Weather is the physical state of the atmosphere at a given point in time at a given location. It
is described in terms of the instantaneous or short period mean value of the various
atmospheric variables such as precipitation, temperature, humidity, sunshine, pressure,
cloudiness and evaporation. Weather determines the period of day-to-day human activities
and comport of both plants and livestock. Climate on the other hand is the long term regime
of the atmospheric variables or the aggregate of the day-to-day values of the weather
elements over a long period of time for a given location. The standard used in expressing
climatic condition of an area is about 30 – 35.
The field of interest of soil microclimatology extends from the soil surface layer to the depth
up to which tree roots penetrate while in the atmosphere it is interested in the air layer near
the ground in which crops and higher organisms live.
The importance of microclimate in influencing ecological processes such as plant
regeneration and growth, soil respiration, nutrient cycling, and wildlife habitat selection has
become an essential component of current ecological research (Chen et al. 1999). It therefore
follows that ecosystem processes such as decomposition, nutrient cycling, succession, and
productivity are partially dependent on microclimatic variables too. Many animals are also
adapted to specific microclimatic conditions. Wind speed, air temperature, humidity, and
solar radiation can influence migration and dispersal of flying insects. Soil microbe activity is
affected by soil temperature and moisture. In addition, most fish have specific thermal ranges
in which they are able to survive and reproduce, suggesting that changes in variables that
affect stream temperature, such as solar radiation, cause changes in habitat suitability.
WHAT YOU WILL LEARN IN THIS COURSE
From the course material, the course guide will tell you what to expect as you read through.
The study of soil microclimatology cuts across two broad disciplines, climatology and soil
science. The biotic and abiotic components of the environment respond in different ways to
the atmospheric situations. The interaction between the atmospheric environment and soil
land scape is what constitute the major concern to soil microclimatology.
In terms of approach, the study can be subdivided into microclimatic zone which is the
description of climate near the earth surface; soil climatic zone which is the description of
climatic zones based on soil and climate regimes; agroclimatic zone which is the description
of agroecological zones based on soil grouping.

SLM 307 MODULE 1
6
COURSE AIM
This course aims at providing a good understanding of microclimatic environment of soil for
better management of agricultural activities and expressly states the relationship between
climate and agriculture
COURSE OBJECTIVES
After going through this course, you should be able to:
Explain the nature and scope of soil microclimatology
Explain weather and climatic variables
Appreciate the seasonal variation of the soil environments
Appreciate the influence of soil factors on microclimatology
Differentiate between the influence of soil and air temperature on crops
Identify the equipments used in measuring various elements of climate and how to
maintain them
WORKING THROUGH THIS COURSE
This course has been designed as an introductory course. Much effort has been put in place to
adequately explain the important concepts and issues to be treated in the work. Table and
diagrams have been used where necessary to aid your understanding. You are advised to
spend good time to study the work with your classmate and compare knowledge.
COURSE MATERIALS
You will be provided with the following materials:
A course guide
Study units
Also, the course comes with a list of recommended text books which though not compulsory
for you to acquire, are essential to give you more insight into the topics discussed.

SLM 307 MODULE 1
7
STUDY UNITS
The course is divided into 3 modules, with each module containing 5 units (15 units in all).
The following are the study units contained in the course:
Module 1
Unit 1: The Principles, Aims and Scope of Soil Microclimatology
Unit 2: Elements of Weather and Climate
Unit 3: Atmospheric Dynamics
Unit 4: Solar Radiation and Heating effects of the Atmosphere
Unit 5: Heat transfer in soils
Module 2
Unit 1: Forcing Mechanisms in the Boundary layer
Unit 2: Atmospheric Moisture
Unit 3: Soil Moisture
Unit 4: Soil Properties
Unit 5: Soil Conservation
Module 3
Unit 1: Equipments and Maintenance of a Standard Meteorological Station
Unit 2: Measurement of Climatic Variables
Unit 3: Measurement of Evaporation and Evapotranspiration
Unit 4: Microclimate and Soil Management in the Tropics
Unit 5: Influence of Microclimate on Agriculture
Module 1
In the opening unit, you will be taken through the definitions of both soil and
microclimatology and how the activities of man influence these two phenomena. Elements of
weather and climate will be discussed in unit two as well as the factors controlling them. In
unit three, the major focus will be on the dynamics of the atmosphere. Here, you will be taken
through the peculiarities of the atmospheric circulation system which includes the general
circulation system among others.
Unit four will discuss the general principles of atmospheric radiation system. You will be
taken through the form and nature of solar radiation and how the atmosphere is heated up by
short wave radiation and counter radiation or terrestrial radiation (long wave). You will also
learn about heat transfer within the soil as influenced by soil physical and chemical properties

SLM 307 MODULE 1
8
Module 2
Unit one will introduce the students to the forcing mechanisms within the boundary layer
which is the microclimatic environment in the lowest layer of the atmosphere. Unit two will
discuss the source of the moisture in the atmosphere. The students will also be introduced to
the knowledge of the amount and distribution of atmospheric moisture. Unit three will
introduce you to the sources and dynamics of soil moisture. You will also learn about the
various factors affecting soil i.e physical and chemical properties of the soil in unit four. In
unit five, you will learn about soil conservation and how it affects the growth and
development of crops.
Module 3
In unit one of this module, you will learn about the categories of weather stations and how to
maintain them. The measurement of elements like rainfall, air temperature and humidity will
be dealt with in unit two. You will be exposed to the instruments and procedures of
measuring air pressure, wind speed, wind direction, radiation and sunshine duration.
In unit three, you will learn about the influence of Evapotranspiration on relative humidity.
Unit four introduces you to the microclimate of the tropical environment and the type of
agricultural management practiced in that environment. You will further learn about
agriculture and pests and diseases and the relationships between climate and livestock in unit
five.
TEXT BOOKS AND REFERENCES
The following textbooks are recommended for further reading
Ayoade, J.O. (2004). Introduction to Climatology for the Tropics.
Ibadan: Spectrum Books Limited.
Ayoade, J.O. (2008). Introduction to Agroclimatology. University of Ibadan Press PLC.
Reddy S.R. and D.S. Reddy (2007). Agrometeorology. Kalyani Publishers, New Delhi
India

SLM 307 MODULE 1
9
ASSESSMENT
There are three components of assessment for this course. They are the Tutor-Marked
Assignment (TMA), Practical and the end of course examination.
TUTOR-MARKED ASSIGNMENT
The TMA is the continuous assessment component of your course. It accounts for 30% of the
total score. A written test will be given to you at the end of mid-semester
PRACTICAL ASSESSMENT
It accounts for 10% of the total score. The practical assessment will be given to you by your
facilitator and you will return it after you have done the assignment.
FINAL EXAMINATION AND GRADING
This examination concludes the assessment for the course. It constitutes 60% of the whole
course. You will be informed of the time for the examination.
SUMMARY
This course intends to provide you with the knowledge of microclimatology of soil as it
affects agricultural production. By the end of this course you will be able to answer the
following questions.
• What is weather and climate and how do they affect human activities?
• Discuss the nature and scope of soil microclimatology.
• Discuss solar radiation and heating effects of the atmosphere.
• Describe and explain atmospheric dynamics.
• Discuss the global distribution of soil moisture, temperature and aeration.
• Discuss the important steps to be adopted in the maintenance of meteorological
stations.
• Explain the influence of evapotranspiration on crop growth and development.
• Explain the influences of microclimatology on crop production in the tropics.
We wish you a better understanding of the microclimatic phenomena in your environment.

SLM 307 MODULE 1
10
MAIN
COURSE
CONTENTS PAGE
Module 1
Unit 1 The Principles, Aims and Scope of soil microclimatology
Unit 2 Elements of Climate and Weather
Unit 3 Atmospheric Dynamics
Unit 4 Solar Radiation and Heating effects of the Atmosphere
Unit 5 Heat transfer in the soils
Module 2
Unit 1 Forcing Mechanisms in the Boundary layer
Unit 2 Atmospheric Moisture
Unit 3 Soil Moisture
Unit 4 Soil Properties
Unit 5 Soil Conservation
Module 3
Unit 1 Equipment and Maintenance of a Standard Meteorological
Station
Unit 2 Measurement of climatic variables
Unit 3 Measurement of Evaporation and Evapotranspiration
Unit 4 Microclimate and Soil Management in the Tropics
Unit 5 Influence of Microclimate on Agriculture

SLM 307 MODULE 1
11
MODULE 1
Unit 1 The Principles, Aims and Scope of soil microclimatology
Unit 2 Elements of Climate and Weather
Units3 Atmospheric Dynamics
Unit 4 Solar Radiation and Heating effects of the Atmosphere
Unit 5 Heat transfer in soils
UNIT 1 PRINCIPLES, AIMS AND SCOPE OF
MICROCLIMATOLOGY
CONTENTS
1.0 Introduction
2.0 Objectives
3.0 Main Content
3.1 Weather and Climate
3.2 Principles and Scope of microclimatology
4.0 Conclusion
5.0 Summary
6.0 Tutor-Marked Assignment
7.0 References/Further Readings
1.0 INTRODUCTION
The various activities of man revolve around his search for food, shelter and clothing which
are in numerous ways influenced by the weather. The study of the weather and microclimatic
environment of soil as a medium of plant growth and development is therefore as ancient as
man‘s curiosity about his environment. The way man lives, the air he breathes, the food he
eats and the water he drinks are all weather related. The works represented the sum of
knowledge on weather and soil microclimatology atmosphere interface. Modern climatology
emerged from the challenges posed by the needs of society and the improvement in data
collection and analysis. This unit examines the principles, aims and scope of climatology.

SLM 307 MODULE 1
12
2.0 OBJECTIVES
At the end of this unit, you should be able to:
• define weather and climate
• define microclimatology
• understand the principles and aims of microclimatology
• understand the scope of climatology and microclimatology.
3.0 MAIN CONTENT
3.1 Weather and Climate
Weather refers to the state of the atmosphere at a given point in time at a given location.
Weather is the day-to-day state of the atmosphere and pertains to short-term changes in
conditions of heat, moisture and air movement. Weather is therefore the instantaneous state
of the atmosphere which results from the processes that attempt to equalize the differences
in the distribution of net radiant energy from the sun. Climate on the other hand, is the
process of heat exchange between the earth and the atmosphere over a long period of time.
Climate is therefore the accumulation of daily and seasonal weather events of a given
location over a period of 30-35 years. The concept of climate is not limited to average
weather condition, it also includes weather events, considerations of variability (departure
from averages), extreme conditions, and the probabilities of frequencies of occurrences of
given weather conditions. Weather and climate play a major role in our lives. Weather is
what determine crop yield and if the planted crops will grow to maturity, while climate
determines what types of crops can be planted and when to plant the crops. The most
immediate effect of weather and climate is on our comfort. On a cold, windy day the effects
of wind chill tell us that it feels much colder than it really is, and if not properly dressed, we
run the risk of catching cold or developing catarrh. On a hot humid day we normally feel
uncomfortably warm and blame it on the humidity of the weather. If we become too warm
our bodies overheat and heat exhaustion may result.
1. How does weather differ from climate?
2. Describe the role of weather and climate in our lives.
3.2 Principles and Scope of Soil microclimatology
Microclimatology is the scientific study of microclimate that deals with pertinent factors like
solar radiation, temperature, wind, vapour pressure and carbon dioxide of the environment in
the zone lying between the highest level reached by the plant and the lowest depth to which
air penetrates into the soil. This area is within what is known as ―Boundary layer‖, that part
of the troposphere responds to the surface forcings with a time scale of about an hour or less.‖

SLM 307 MODULE 1
13
Soil microclimatology focuses on the micro scale portion of the meteorological spectrum of
soil, those phenomena with spatial scales between the deepest plant root to about 1m above
the highest level reached by plant and with temporal scales between a few seconds up to a
couple of hours.
Soil microclimatology has a wide scope. It can be classified largely on the purpose for which
it is needed. Three broad classifications can be made as follows:
1. Empirical: This is based on quantification of observable elements of weather by
statistics and / or experiments and their impacts on soil of a microclimatic
environment. On the basis of temperature, soil may be hot, warm or cold etc and on
the basis of moisture (rainfall) – wet, humid or dry etc. Combination of temperature
and moisture may give soil types hot-wet, hot-humid, hot-dry etc. These
classifications are more reliable and stable as they are based on experimentation and
mathematical coding.
2. Genetic: It is based on the genesis of the soil of the microclimatic environment.
Explanations are often theoretical, incomplete and generalized. This is because soils
developed from a variety of parent materials derived from weathering of sedimentary
rocks and from recent fluvial and marine deposits. Factors like latitude, general
circulation, effects of oceans and continents, mountain barriers, polar, temperate and
tropical climates are the basis for this classification.
3. Applied: It is based on the effect of climatic factors on non-climatic features such as
wild vegetation, cultivated crops etc. Examples of this type of classification are aquic,
ustic, aridic, xeric soil moisture regimes etc.
1. Define microclimatology. How does it differ from climatology?
2. Explain the scope of soil microclimatology
4.0 CONCLUSION
The study of soil microclimatology`is essentially hinged on the knowledge of weather and
climate, the processes of soil development at micro scale level.
5.0 SUMMARY
In this unit we have learnt that:
1. All human activities are influenced by the weather
2. Weather is the state of the atmosphere at a given time and place while climate is the
aggregate of weather over a long period of time
3. Microclimate is that part of the troposphere responds to the surface forcings with a
time scale of about an hour or less
4. Soil microclimatology focuses on the micro scale portion of the meteorological
spectrum of soil

SLM 307 MODULE 1
14
6.0 TUTOR-MARKED ASSIGNMENT
Genetic classification of soil is based on the genesis of the soil of the microclimatic
environment. Explain the above.
7.0 REFERENCES/FURTHER READING
Reddy, S.R. and D.S. Reddy (2011). Agrometeorology. New Delhi: Kayani Publishers.
Ojanuga, A.G. (2006). Agroecological Zones of Nigeria Manual. National Special
Programme for Food Security

SLM 307 MODULE 1
15
UNIT 2 ELEMENTS OF CLIMATE AND WEATHER
CONTENTS
1.0 Introduction
2.0 Objectives
3.0 Main Content
3.1 Climatic Elements
3.2 Non-Climatic Elements
3.3 Solar Radiation
3.3.1 Factors of Solar Radiation
4.0 Conclusion
5.0 Summary
6.0 Tutor-Marked Assignment
7.0 References/Further Readings
1.0 INTRODUCTION
The elements of weather and climate are normally observed and measured using weather
instruments at synoptic hours by observers. These elements include temperature,
precipitation, pressure, winds and humidity. The spatial distribution of these elements are
controlled by one or all these factors; latitude, altitude, continentality, ocean currents,
insolation, prevailing winds, natural vegetation and soil. This unit will discuss the
characteristics of temperature, precipitation and winds as well as their control.
2.0 OBJECTIVES
At the end of this unit, you should be able to:
• Understand the characteristics of these climatic elements
• Understand the effects of non-climatic factors on these elements

SLM 307 MODULE 1
16
3.0 MAIN CONTENT
3.1 Climatic Elements
Temperature
Temperature is defined as the degree of hotness or coldness of a body. This is as a result of
the heat absorbed by the earth and atmosphere from the main source of energy to the earth
(sun) as solar radiation and partly converted into sensible heat or other form of energy.
Factors Influencing Temperature
Temperature characteristics of a place are influenced by climatic and non-climatic factors.
The climatic elements acting as factors include solar radiation, net radiation, pressure and
winds, humidity, evaporation and cloud cover. Non-climatic elements include type of surface,
latitude and continentality.
Solar and Net Radiation
The amount of solar or net radiation available on a particular surface is what greatly affects
temperature. Temperatures are particularly higher during summer than during winter period
because of higher insolation received during summer. During a daily cycle, on a sunny day,
temperatures are highest in the afternoons when values of solar radiation and consequently
net radiation are highest.
Pressure and Winds
In climatology, the foremost elements and important factors to temperature and precipitation
are pressure and winds. Atmospheric pressure can be defined as the weight exerted upon the
earth by the atmosphere. The average air pressure at sea level is around 1013mb with little
variation according to latitude. The air pressure decreases with altitude; at 5000m it is only
about 500mb. This is because at high altitude air is less dense.
Rise in temperature causes air to expand thereby reducing the pressure and vice versa. Over
the earth surface, air flow is from high pressure to low pressure areas. But because of earth
rotation, air flow is deflected to the right in the northern hemisphere and to the left in the
southern hemisphere.
Humidity and Evaporation
Humidity is the amount of water vapour in the atmosphere. Because of its origin, humidity
which is atmospheric water vapour is concentrated in the lower layers of the atmosphere.
There are different indices used in measuring this moisture content of the atmosphere which
includes absolute humidity, specific humidity, mass mixing ratio, relative humidity and dew-
point temperature. Evaporation is the process by which moisture in its liquid or solid form is
converted into gaseous form-water vapour. Moisture availability at the evaporating surface
and the ability of the atmosphere to vaporize the water, remove and transport the vapour

SLM 307 MODULE 1
17
upward are the fundamental factors that determine the rate of evaporation. Many factors
including solar radiation, temperature, wind speed and humidity also determine evaporation.
Cloud Cover
Another significant climatic element that influences temperature by reducing the amount of
energy received or absorbed at a particular place is cloud cover. This factor accounts for the
lower temperatures in the humid areas with a lot of clouds compared with the arid areas
where there is little or no cloud. The effects of cloud cover lessen the diurnal temperature
ranges by preventing high maxima by day and low minima by night. This is usually the
situation in the humid areas of the tropical rain forest of West Africa, compared with the arid
areas such as in the Sahara Deserts where the ranges of temperatures are always high.
3.2 Non-Climatic Elements
Types of Surfaces
Various types of surfaces react differently to solar radiation incidence in terms of reflection,
absorption, and transmission and these accounts for the variation in heating potentials.
Vegetation surface: Both the reflectivity and transmission coefficient affect the amount of
solar radiation over vegetated surfaces and consequently the amount of sensible heat
generated. Also, part of the heat is lost through evaporation and transpiration. Surfaces with
high evapotranspiration heat more slowly than surfaces with less evapotranspiration.
Land and water surface: Although the heating properties of the many kinds of land and
vegetated surfaces vary considerably, the greatest contrasts are those between land and water
surfaces, which react so differently to solar radiation. The surfaces of relatively deep bodies
of water heat and cool slowly compared with land surfaces. The most important reason for
this slowness of temperature change is that in water, a highly mobile matter, redistribution of
heat occurs mainly through turbulence. In contrast to this medium of heat distribution, heat in
the solid earth is distributed by molecular heat conduction, and so proceeds by moving from
particle to particle. In water, on the other hand ocean currents, waves, tides and conventional
overturning systems help dispersed to absorbed solar energy throughout a large mass of
water. Because there is no such mixing on land, and assuming that equal amount of energy
fall on both surfaces, water surfaces would heat up more slowly and have lower temperatures
than land surfaces.
Latitude: As a result of the earth‘s inclination, the midday sun is almost overhead within the
tropics but the sun‘s rays reach the earth at an angle outside the tropics. Thus there is a
decrease in temperature from the equatorial regions to the poles. This is illustrated in Figure
1. Band R1 falls vertically over the equatorial latitudes on surface E. Band R2 falls obliquely

SLM 307 MODULE 1
18
over the temperate latitudes on surface T. R1 travels through a shorter distance and its
concentrated solar insolation heats up a smaller surface area; temperature is thus high. On the
other hand, R2 travels through a longer distance and much of its heat is absorbed by clouds,
water vapour and dust particles. Its oblique rays have to heat up a larger area; temperature is
therefore low.
Figure 1: Varying distance in the distribution of Insolation and Continentality
(Distance from the Sea)

SLM 307 MODULE 1
19
Continentality (or distance from the sea) is another factor which affects the
characteristics of temperature in time and space. For example, near the ocean or water
surface, daily temperature extremes are smaller than within the continental areas.
Moreover, the variability of temperature is greater in areas far away from the sea than
along the coastal areas. Thus maximum temperatures are higher and minimum
temperatures are lower over continental climates than in oceanic or marine climates.
3.3 Solar RadiationAll of physical and biological processes of life taking place on the
earth‘s surface are dependent on solar radiation involving some form of energy transfer.
Solar radiation is also required for other processes related to water, land, soli, vegetation
and animals. The sun provides over 99% of the heat energy required for the physical
processes taking place in the atmospheric system.
3.3.1 Factors of Solar Radiation
Solar Input
The solar constant, which is the basic amount of solar input, is a major factor of solar
radiation received by the earth‘s surface, outside the atmosphere. In general the amount of
solar radiation received outside the atmosphere also depends on a number of other factors,
which include solar altitude and the duration of solar energy (length of day).
Solar Altitude
The altitude of the sun (angle between the rays of the sun and at tangent to the earth‘s surface
at a point of observation) is an important factor which affects the amount of insolation
received at the earth‘s surface. It depends on the time of the day, the latitude of the location
and the time of the year (session). When the sun‘s altitude is great, the solar radiation
intensity per unit area is highly concentrated at the earth‘s surface (Fig. 2). For example at
noon, the intensity of insolation is greatest, but in the morning and evening hours when the
sun is at a low angle, the amount of insolation is small. The same principle has a broader
application with respect to latitude and the seasons. In winter and at high latitudes even the
noon sun‘s angle is low. In summer and at low latitudes, it is more nearly vertical and the
oblique rays of the low angle sun are spread over a greater surface than are vertical rays, thus
less heating per unit areas is produced by the low -angle sun.
The angle at which the solar radiation strikes the earth‘s surface however, also depends
upon the surface configuration of the land. For example, in the middle and high latitudes of
the northern hemisphere, southern slopes receive more direct rays while northern slopes
may be entirely in the shade. Also the possible hours of sunshine in a deep valley may be
greatly reduced by surrounding hills.
The Length of Day
The longer the time of day during which the sun shines, the greater the quantity of radiation
which a given portion of the earth will be able to receive. Table 2 shows the latitudinal
SLM 307 MODULE 1
20
variations of sunshine hours during the solstices and the equinoxes. Note that there are
shorter days during winter solstice of every latitude to the north or south of the equator.
During equinoxes the length of days and nights are equal for each latitude. Also note that
there are six months of daylight hours during the summer solstice at the pole and zero hours
of daylight hours (six months of darkness) during the winter solstice.
The variation in the length of day is as a result of the revolution of the earth around the sun
and its rotation on its axis. Whereas the earth‘s rotation on its own axis causes day and night,
its orbit round the sun explains the seasons. A complete rotation takes 24 hours resulting in
the alternation of day and night, while a complete revolution takes 365 ¼ days at a variable
speed which averages about 26km per second.
The effect of the atmosphere slightly affects the radiation received on the earth‘s surface. The
atmosphere absorbs, reflects, scatters and reradiates solar energy. Among the atmospheric
constituents involved in the absorption are water vapour, liquid water carbon dioxide and
ozone. Part of the incoming solar radiation is also scattered or reflected back to space. About
80% of the incoming solar radiations are reflected by clouds; clouds are powerful reflectors
of shortwave radiation.
4.0 Conclusion
The spatial distributions of temperature are affected by climatic elements and non-climatic
elements.
5.0 Summary
In this unit, we have learnt that:
1. Temperature is influenced by climatic and non-climatic elements
2. Solar input, solar altitude and the length of day are some of the of the
factors that affects temperature
3. The main source of energy in the atmospheric system is solar radiation
6.0 Tutor-Marked Assignment
Enumerate the factors that influence temperature as an element of climate
7.0 References/Further Readings
Reddy, S.R. and D.S. Reddy (2011). Agrometeorology. New Delhi: Kayani Publishers.
Ojanuga, A.G. (2006). Agroecological Zones of Nigeria Manual. National Special
Programme for Food Security

SLM 307 MODULE 1
21
UNIT 3 ATMOSPHERIC DYNAMICS
CONTENTS
1.0 Introduction
2.0 Objectives
3.0 Main Content
3.1 Atmospheric Circulation
3.1.1 Factors Generating Circulation of the Atmosphere
3.2 Circulation Systems
3.2.1 General Atmospheric Circulation
3.2.2 Other Circulation
4.0 Conclusion
5.0 Summary
6.0 Tutor-Marked Assignment
7.0 References/Further Readings
1.0 INTRODUCTION
Atmospheric circulations are caused by energy inequalities which produce temperature and
pressure variations. These are variations in the net radiation over the earth‘s surface and
between the earth surface and the atmosphere. This is what is responsible for the dynamism
experienced in the atmosphere.
2.0 OBJECTIVES
At the end of this unit, you should be able to:
• Describe the atmospheric dynamism at various scales
• Explain some of the factors responsible for atmospheric circulation

SLM 307 MODULE 1
22
3.0 MAIN CONTENT
3.1 Atmospheric Circulations
3.1.1 Factors Generating Atmospheric Circulation
The major factors influencing the general atmospheric circulations include radiation balance,
pressure gradient force, earth‘s rotation etc.
Radiation Balance
This is the difference between the incoming short wave radiation from the sun and the
outgoing long wave or terrestrial radiation which adds up to zero for the earth‘s atmospheric
system over a period of one year. This equilibrium occurs at global level. In the low
latitudes, there is an excess of radiation balance while marked deficits is found in the high
latitudes. These results in a pole ward temperatures gradient both at the surface and in the
atmosphere. The tropics are thus belts serving as a heat source, while the poles serve as heat
sinks. If there were no circulation to transport the excess from equatorial regions to the poles,
the tropics would be getting hotter and the high latitude getting colder. With the general
circulation however, heat is transferred from the heat source to the heat sinks, so maintaining
the average temperatures of the world. The leveling up of temperature is done mostly through
the transfer of sensible heat and by the transportation of water vapour and its latent heat from
the zones where evaporation is predominant to zones where precipitation is predominant and
between the oceans, which provide 90 per cent of atmospheric water vapour and the
continents.
Pressure Gradient
Pressure gradient is the result of pressure differences as a result of differences in temperature
which produce air movements or winds. The atmosphere exerts pressure because air has
weight or mass. The mass of a column of air over a given point determines the atmospheric
pressure at the point. At sea level the average pressure is 1013 mb.
There are thus differences in the distribution of pressure due to thermal causes, and winds
generally move from the areas with cold heavy air to areas with the lighter warm air. In
addition there are also mechanical causes. The differences in the distribution of pressure
between two adjacent areas in turn sets the air in motion and causes winds to blow from areas
of high to areas of low pressure. The difference in relation to the slope of the two adjacent
areas is called pressure gradient. A pressure gradient is thus the immediate cause of all air
movement, the direction of air flow being from high pressure to low pressure, and the
velocity of the air flow being directly related to the pressure gradient, that is the rate of
change of pressure with distance. The pressure gradient is steep when the rate of change is
great, and the steeper the gradient, the more rapid will be the flow of the air.

SLM 307 MODULE 1
23
The Earth’s Rotation
The rotation of the earth prevents direct meridional circulation that would result from the
imbalance of net radiation of the world. Coriolis force is the term given to the force resulting
from the rotation of the earth. As mentioned earlier, the effect of the force is at maximum at
the poles while at the equator the effect becomes zero. The deflective force causes the winds
to be deflected to the right in a northern hemisphere and to the left in the southern
hemisphere.
Frictional force
The frictional force affects both wind speed and wind direction. The movement of air is
retarded by friction between the moving air and the surface of the earth. The frictional effect
of the earth‘s surface varies with height. It is of importance only below the frictional layer
1500 to 1000 meters although it tends to be deeper over rough terrain or under unstable
conditions
There is also internal friction within the air itself, although this is very small and varies with
height. Because the force acts in the opposite direction to the wind direction, the flow of
surface air is not essentially parallel to the isobars as is the air in the free atmosphere which
increases with the frictional force.
3.2 Circulation Systems.
Let us now examine the categories of the atmospheric circulations systems.
3.2.1 The General Atmospheric Circulation
The underlying cause of the general circulation is the unequal distribution of net radiation.
These inequalities exist between the atmosphere and earth‘s surface on one hand and between
the tropics and extra tropical areas on the other. To balance these inequalities, the atmosphere
transfers warm air pole-wards and cool air equator wards.
If we assume a homogenous non-rotating earth the global wind systems would look much
simpler than they are shown in Figure 3. However, with a homogenous rotating earth, the
winds will be subject to both the pressure gradient and coriolis forces. Winds moving from
areas of high pressure to those of low pressure are deflected as explained in unit 3, to the
right of their path in the northern hemisphere and to the left of their path in the southern
hemisphere. For a heterogeneous rotating earth, the pressure distribution patterns are more

SLM 307 MODULE 1
24
cellular than zonal owing to the differential heating of land and water surface. The global
wind systems will then be as shown in Figure 3. If we impose the varied topography of the
earth‘s surface on this, the pattern of wind system will be more complex than that shown in
Figure 3.
Fig 3: Global wind system
Relief can influence the wind systems in various ways. First they can pose a barrier to air
flow; secondly, they can have a channeling effect on air flow. Relief also reduces wind speed
at low levels through frictional drag on air flow.
The global pattern of general circulations is thus influenced by a change in any of the factors
discussed above. The global wind systems discussed above are for the surface level only.
Other wind systems like the Rossby waves, easterly waves and jet streams are also
encountered at the middle and upper levels of the atmosphere.
SLM 307 MODULE 1
25
3.2.2 Other Circulations
The day-to-day weather activities over a given area are determined more by secondary and
tertiary circulation systems which are embedded in the general circulation of the atmosphere.
These include the monsoon, cyclones, anticyclones, land and sea breeze.
The Monsoon
The seasonal variation in the temperature between the land and sea result in the seasonal
wind systems called monsoons. During summer, the continental land masses become warmer
than the surrounding water surfaces, resulting in temperature induced low pressure centre
over the land surface. The wind therefore blows from the sea to the land, bringing abundant
moisture. (Fig. 3). During the winter however, the continental land masses are much colder
than the seas. This consequently causes a shallow high pressure cell over land with a lower
pressure over the adjacent water surface which leads to the development of a land to sea
pressure gradient and wind. (Fig. 3). The cold dry air from the land is poor in moisture
content and brings no precipitation.
Monsoons are best developed in eastern and southern Asia, because of the size of the
continent which intensifies the continental effect on weather. In areas such as West Africa
and North America, the systems are not as well developed.
Land and Sea Breezes
These occur as a result of diurnal variation in the heating of land and water and they may be
called daily monsoons. They differ from the large seasonal monsoons because they result
from lesser changes in pressure. During the day, the air moves from the sea to the much
heated land while at night, a reversed condition occurs, the wind blows from the much cooled
land to the sea (Ayoade 2002).
4.0 CONCLUSION
The atmosphere is highly dynamic due to the variation in the amount of solar radiation
received over the earth‘s surface. Between the earth‘s surface and the atmosphere the global
atmospheric circulation system has the regional and local circulation embedded in it and it is
these lower level circulation systems that are responsible for the day to day weather activities
over any given area.
5.0 SUMMARY
In this unit we have learnt that:

SLM 307 MODULE 1
26
1. Radiation balance, pressure gradient force, rotation of the earth and frictional force are
some of the factors of the general circulation of the atmosphere.
2. General circulation of the atmosphere is caused by unequal distribution of net
radiation.
3. T
he atmosphere transfers heat from the equator pole wards and cold from the poles
towards the equator.
4. There are other wind systems in the middle and upper atmosphere i.e. Rossby wave,
easterly waves and jet stream.
5. The day-to-day weather is determined by secondary and tertiary circulation systems
like the monsoons, cyclones anticyclones, land and sea breezes among others.
6.0 TUTOR-MARKED ASSIGNMENT
Explain the main forces responsible for atmospheric circulation and enumerate the various
systems of atmospheric motion.
7.0 REFERENCES/FURTHER READING
Ayoade, J. O. (1983). Introduction to Climatology for the Tropics. ChiChester: John Wiley
and Sons.
Ojo, O. et al (2001). Fundamentals of Physical and DynamicClimatology. Lagos: SEDEC
Publishers.

SLM 307 MODULE 1
27
UNIT 4 SOLAR RADIATION AND HEATING EFFECTS OF THE ATMOSPHERE
CONTENTS
1.0 Introduction
2.0 Objectives
3.0 Main Content
3.1 Solar Radiation and Heating of the Atmospheric System
3.1.1 The Sun
3.1.2 Disposition of Solar Radiation in the Earth‘s
Atmospheric System
3.1.3 Terrestrial and Atmospheric Radiation
3.1.4 Radiation Balance
4.0 Conclusion
5.0 Summary
6.0 Tutor-Marked Assignment
7.0
References/Further Readings
1.0 INTRODUCTION
Solar energy represents almost all the energy available to the earth (99.97%). As earlier
mentioned, it is an important source of energy for life on the surface of the earth. It is the
great engine which drives the earth‘s atmosphere and oceanic circulations. It generates
weather and makes the earth a loveable place for plants and animals. Processes such as
photosynthesis, on which man‘s existence partly depends are almost impossible without
radiation
2.0 OBJECTIVES
At the end of this unit, you should be able to:
• describe the sun
• state how solar energy is transmitted to the earth
• state how the earth is heated
• state how the atmosphere is heated.

INTRODUCTION TO AGRO-CLIMATOLOGY
28
3.0 MAIN CONTENT
3.1 Solar Radiation and Heating of the Atmospheric System
3.1.1 The Sun
The sun, which is a star of about medium mass, has a surface temperature of about 6000oK.
It emits a form of energy known as electromagnetic radiation. This energy travels about
150 million kilometers to reach the earth‘s surface and takes about 9 ½ minutes to complete
the journey.
The totality of wavelength is known as solar spectrum. The solar spectrum consists of both
short and long wave radiation. A wavelength may be defined as the distance from crest to
crest of succeeding waves. The conventional unit used in the measurement of wavelength is
the micron (1 micron = 0.000km or 10-4
). The symbol used is µ. Another unit used which is
smaller than the micron is angstrom =108 cm. The total bulk of all solar radiation occurs in
the narrow range of wavelength from 0.30 µ to 0.74 µ, usually referred to as short wave
radiation. Short wave radiation is visible as light to human eye. The colours of visible
radiation are violet, indigo, blue, green, yellow, orange and red.
The solar spectrum consists of:
1. X-rays, gamma rays, alpha rays and ultraviolet rays consisting about 9% of the total
energy.
2. Visible light rays (0.4-0.74 µ) carrying 41%
3. Invisible infrared (heat) rays (0.7-3000 µ) consisting 50%.
The term short wave radiation is applied to the visible and ultraviolet portion of the
spectrum (wavelengths less than 0.7 µ) as distinct from the infrared or long wave portion
(longer than 0.7 µ). Radiation is energy in transit. When it comes in contact with an object
or substance it may be transmitted, reflected or absorbed in proportions which depend on
the nature of the medium and wavelength of the radiation. It is the amount of the radiation
absorbed by a medium that is effective in heating it.

AGR 205 MODULE 3
29
3.1.2 Disposition of Solar Radiation in the Earth’s Atmospheric System
The solar radiation intercepted by the earth is either absorbed or returned back to space by
scattering or reflection. Mathematically the disposition of solar radiation is expressed by
Qs = Cr+Ar+Ca+Aa+(Q+q)(1- σ )+(Q+q) σ
From the expression, the solar radiation incident on top of the atmosphere can be scattered
and reflected back to space by cloud (Cr), cloud cover blocks the penetration of insolation.
About 25% of incoming solar radiation is reflected back to space by clouds. Solar
radiation can also be scattered or reflected by air molecules, dust particles and water
vapour (Ar). Dust particles, air molecules and water vapour in the atmosphere are capable
of scattering a lot of solar radiation. The scattering is either upward towards the space or
downwards toward the earth‘s surface. About 6% of the insolation reaching the top of the
atmosphere is scattered downward and reaches the surface as diffuse radiation. Radiation
is also reflected by the earth‘s surface (CQ+q) σ), where Q and q are direct solar beam and
diffuse solar radiation respectively and σ is the surface albedo.
On the other hand, solar radiation can be absorbed by cloud (Ca). Clouds act as temporary
thermal reservoirs for they absorb a part of the energy they intercept. Solar radiation is
also absorbed by air molecules, dust and water vapour (Aa). About 18% of the insolation
is absorbed directly by ozone and water vapour. Ozone absorbs it mainly in the ultraviolet
region consisting Hartley band (0.20-0.33µ). Water vapour absorbs in the near infrared
band centering at 0.93, 1.13, 1.42 and 1.47µ.Water vapour is a selective absorber of
radiation. Carbon dioxide absorbs radiation with wavelengths greater than 4 µ. The earth‘s
surface represented by (CQ+q)(1- σ), also absorbs solar radiation. Land and water have
different thermal properties and react differently to insolation. Land heats up rapidly and
loses heat rapidly while water heats up slowly and releases heat slowly.
3.1.3 Terrestrial and Atmospheric Radiation
The surface of the earth when heated, becomes a source of long wave radiation. Because the
surface temperature of the earth is 285oK most of the radiation is emitted in infrared spectral
range from 4 µ to 100 µ with a peak near 10 µ.
Like the earth, the atmosphere absorbs and emits radiant energy. Although the atmosphere
is nearly transparent to short wave radiation, it easily absorbs terrestrial radiation. The
principal absorbers being water vapour (5.3-7.7 µ and beyond 20 µ), Ozone absorbs (9.4-
9.8 µ), carbon dioxide (16.9 µ) (13.1 -and clouds absorb radiation at all wavelengths.
While the atmosphere absorbs only 24% of incoming solar radiation (short wave), 91% of
infrared terrestrial radiation is absorbed.

AGR 205 MODULE 3
30
The atmosphere in turn re-radiates the absorbed terrestrial radiation partly to space and
partly back to the earth‘s surface. This is known as counter-radiation.
3.1.4 Radiation Balance
Radiation balance or net radiation is the difference between the absorbed solar
radiation by a surface and the effective outgoing radiation from the surface.
On the average, the earth‘s surface absorbs about 124 kilolangleys of solar
radiation each year and in turn effectively radiates 52 kilolangley yr-1
.
4.0 CONCLUSION
Solar radiation is very important to human existence on the earth‘s surface as it touches all
spheres of man‘s life, particularly agricultural activities.
5.0
SUMMARY
1. The sun emits a form of energy known as electromagnetic
radiation
2. The totality of wavelength is known as solar spectrum which
consists of short and long-wave
3. The incoming solar radiation is scattered, reflected or absorbed by
cloud, air molecules, dust particles, water vapour and the earth‘s
surface.
4.
The atmosphere is significantly heated by terrestrial radiation.
6.0
TUTOR-MARKED ASSIGNMENT
1. What is the importance of solar radiation to man?
2. Account for the disposition of solar radiation in the earth‘s
atmospheric system.
3. Explain the radiation balance of the earth‘s atmospheric system.
7.0 REFERENCES/FURTHER READING
Ayoade, J. O. (1983). Introduction to Climatology for the Tropics.
ChiChester: John Wiley and Sons..
Ojo, O. et al (2001).Fundamentals of Physical and DynamicClimatology.
Lagos: SEDEC Publishers.

AGR 205 MODULE 3
31
UNIT 5 HEAT TRANSFER IN SOILS
CONTENTS
1.0 Introduction
2.0 Objectives
3.0 Main Content
3.1 Sensible Heat Flux
3.2 Soil Temperature
3.2.1 Temperature Profile on bare Soil
3.2.2 Temperature Profile in Plant Canopy
4.0 Conclusion
5.0 Summary
6.0 Tutor-Marked Assignment
7.0 References/Further Readings
1.0 INTRODUCTION
Heat transfer in soil is influenced by the thermal properties of soil. These are properties which
influence how energy is partitioned in the soil profile. While related to soil temperature, it is
more accurately associated with the transfer of energy (mostly in the form of heat) throughout
the soil, by radiation, conduction and convection.
It is hard to say something general about the soil thermal properties at a certain location
because these are in a constant state of flux from diurnal and seasonal variations. Apart from
the basic soil composition, which is constant at one location, soil thermal properties are
strongly influenced by the soil volumetric water content, volume fraction of solids and
volume fraction of air. As such soil moisture properties and soil thermal properties are very
closely linked and are often measured and reported together. Temperature variations are most
extreme at the surface of the soil and these variations are transferred to sub surface layers but
at reduced rates as depth increases.
2.0 OBJECTIVES
At the end of this unit, the students should be able to:
Explain the thermal properties of soil based on composition of the soil
Explain how heat is transferred from surface to sub-surface layers as depth increases

AGR 205 MODULE 3
32
3.0 MAIN CONTENT
3.1 Sensible Heat Flux
The net energy flux available at the earth surface partly gets transferred in to the soil as soil
heat flux (S). This is used for heating the air as sensible heat flux (H) and partly used for
evaporation which is latent heat flux (λE). The net energy balance equation can be written as:
Rn = S + H + λE
Sensible heat flux is the heat exchange between ground surface and air, because this is the
flow of heat which determines air temperature, the property of air which we sense. Flow of
sensible heat per unit area per unit time is sensible heat flux and is, generally, measured in
Wm-2
(Wm-2
Jm-2
s-1
, 1 Langley = 697.7). Large quantities of heat energy are transferred
between the warm surface and air by the process of convection. During the day time, heat will
be transferred from warm ground or crop surface to the cooler air above. At night, when the
air is warm and the surface is cool, heat will be transferred to surface.
3.2 Soil Temperature
Soil temperature is one of the most important environmental factors of plant growth and
development. Heat exchange between the soil and its surface is through soil gain and lose of
heat. Soil gains heat by absorption of solar radiation and long wave counter radiation from the
atmosphere. downward transfer of sensible heat and horizontal transfer of heat from the
surrounding. On the other hand, soil lose heat by long wave radiation to the atmosphere,
evaporation, horizontal transfer of heat from the column to surrounding and upward transfer
of sensible heat to air when the soil surface is hotter than air.
3.2.1 Temperature Profile on bare Soil
Radiational heating and cooling, condensation, evaporation etc appear to be operative in
modifying the temperature profiles in the soil or ground vicinity. During the daytime, soil
gets heated thereby heating air layers above it. This heating by the absorbed ground heat will
go on decreasing with increasing height. Thus during the daytime, lapse conditions are
observed. During night, ground losses heat by Radiational cooling.
3.2.2 Temperature Profile in Plant Canopy
Temperature profiles into plant canopies differ from those in free air due to several reasons
such as shading, air movement, ground heating, evaporation of soil moisture etc.
In general, surface in soil vicinity will be colder than the upper surface. After sunrise, soil
surface and the crop surface nearby will get heated and the temperature will be comparatively
higher in the lower crop surface. Temperature of the crop surface goes on increasing from
morning till midday due to stomatal closure and radiation interception.

AGR 205 MODULE 3
33
4.0 CONCLUSION
Exchange of heat between the soil and its surface is through soil gain and lose of heat is one
of the most important environmental factors of plant growth and development. Soil gains heat
by absorption of solar radiation and terrestrial radiation from the atmosphere.
5.0 SUMMARY
1. Sensible heat flux is the flow of sensible heat per unit area per unit time,
generally, measured in Wm-2
(Wm-2
Jm-2
s-1
, 1 Langley = 697.7)
2. Soil temperature is the temperature within the soil profile that is important
for seed germination and crop growth and development
3. During the daytime, soil gets heated thereby heating air layers above it.
This heating by the absorbed ground heat will go on decreasing with increasing
height.
4. Temperature of the crop surface goes on increasing from morning till
midday due to stomatal closure and radiation interception.
6.0 TUTOR-MARKED ASSIGNMENT
1. Explain the process of heat transfer in the soil profile or ground vicinity
2. Derive the net energy balance equation
3. Define sensible heat flux giving its unit of measurement
7.0 REFERENCES/FURTHER READINGS
Reddy, S.R. and D.S. Reddy (2011). Agrometeorology. New Delhi: Kayani Publishers.
Ayoade, J. O. (1983). Introduction to Climatology for the Tropics.
ChiChester: John Wiley and Sons..
Ojo, O. et al (2001).Fundamentals of Physical and DynamicClimatology.
Lagos: SEDEC Publishers.

AGR 205 MODULE 3
34
Module 2
Unit 1Forcing Mechanisms in the Boundary layer
Unit 2 Atmospheric Moisture
Unit 3 Soil Moisture
Unit 4 Soil Properties
Unit 5 Soil Conservation
UNIT 1 FORCING MECHANISMS IN THE BOUNDARY LAYER
CONTENTS
1.0 Introduction
2.0 Objectives
3.0 Main Content
3.1 Forcing Mechanisms
3.1.1 Wind in the boundary layer
3.2 Turbulance
3.2.1 Turbulance and Taylor Hypothesis
4.0 4.0 Conclusion
5.0 Summary
6.0 Tutor-Marked Assignment
7.0 References/Further Readings
1.0 INTRODUCTION
The earth's surface is the lower boundary on the atmospheric domain and hence, interacts with
the lower part of the earth's atmosphere. It can be defined as: "that part of the troposphere that
is directly influenced by the presence of the earth's surface and responds to surface forcings
with a time scale of about an hour or less‖. Boundary layer depth is variable, typically
between 100-3000 m deep (see Fig. 1.1). The tropospheric depth is on one order of magnitude
greater than boundary layer depth ratio of tropospheric depth to radius of earth: 10 km/6400
km = 0.001 or .1% ratio of boundary layer depth to radius of earth: 1 km/6400 km = 0.0001 or
0.01%.
AGR 205 MODULE 3
35
2.0 OBJECTIVES
At the end of this course, the student should be able to understand,
1. The limit of boundary layer and its climate
2. The forcing mechanism within the boundary layer
3. Decomposition of observed wind within the boundary layer
3.0 MAIN CONTENT
1 UNIT 1 3.1 Forcing Mechanisms
Forcing mechanisms are physical processes that acts to modify a parcels temperature, moisture
content or wind velocity that are important in the boundary layer e.g. Heat transfer to/from the
ground, Frictional drag, Evaporation & Transpiration, Terrain - induced flow modification,
Pollution emission.
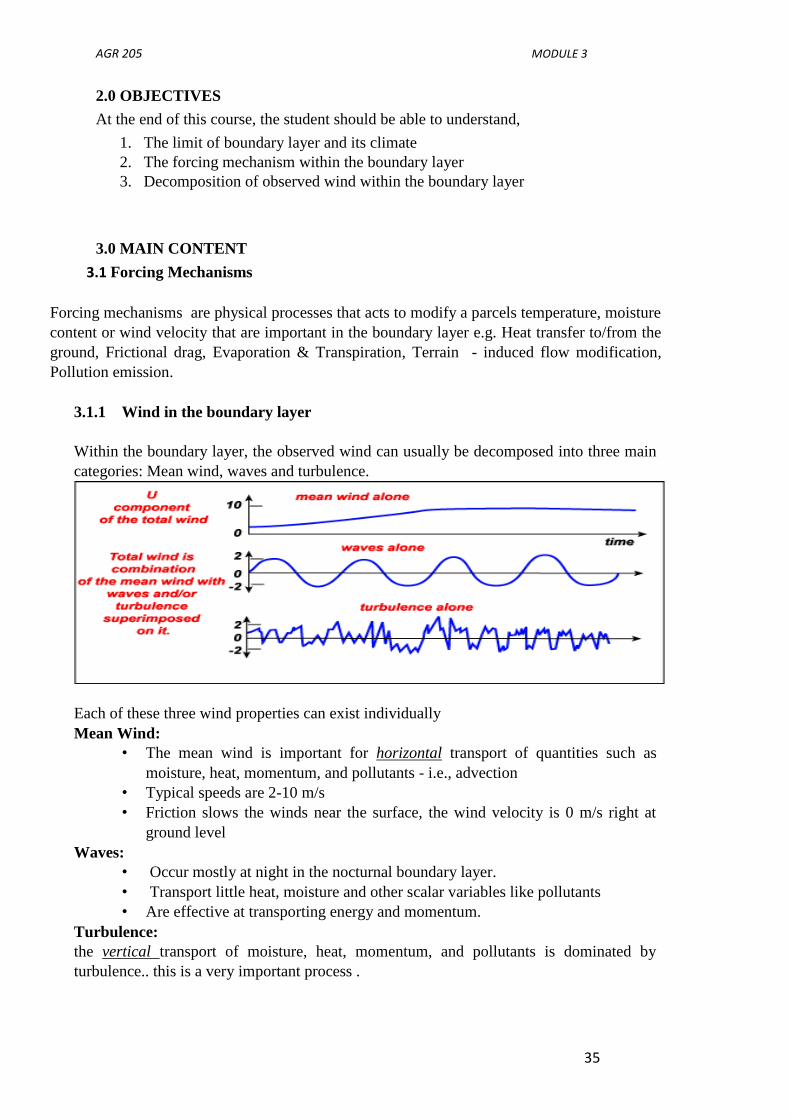
3.1.1 Wind in the boundary layer
Within the boundary layer, the observed wind can usually be decomposed into three main
categories: Mean wind, waves and turbulence.
Each of these three wind properties can exist individually
Mean Wind:
• The mean wind is important for horizontal transport of quantities such as
moisture, heat, momentum, and pollutants - i.e., advection
• Typical speeds are 2-10 m/s
• Friction slows the winds near the surface, the wind velocity is 0 m/s right at
ground level
Waves:
• Occur mostly at night in the nocturnal boundary layer.
• Transport little heat, moisture and other scalar variables like pollutants
• Are effective at transporting energy and momentum.
Turbulence:
the vertical transport of moisture, heat, momentum, and pollutants is dominated by
turbulence.. this is a very important process .
AGR 205 MODULE 3
36
3.2 Turbulence
This is the apparent chaotic nature of many wind flows which is manifested in the form of
irregular, almost random fluctuations in velocity, temperature and scalar concentrations
around their mean values in time and space. It is simply stated as GUSTINESS of wind
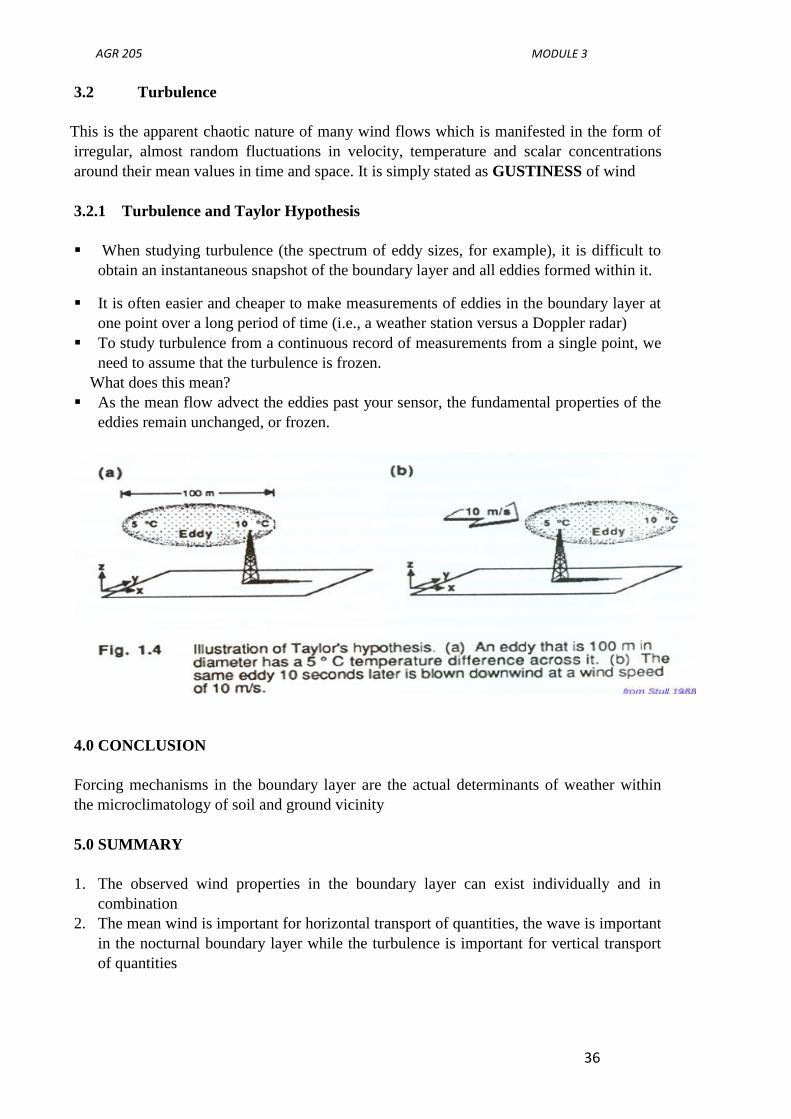
3.2.1 Turbulence and Taylor Hypothesis
When studying turbulence (the spectrum of eddy sizes, for example), it is difficult to
obtain an instantaneous snapshot of the boundary layer and all eddies formed within it.
It is often easier and cheaper to make measurements of eddies in the boundary layer at
one point over a long period of time (i.e., a weather station versus a Doppler radar)
To study turbulence from a continuous record of measurements from a single point, we
need to assume that the turbulence is frozen.
What does this mean?
As the mean flow advect the eddies past your sensor, the fundamental properties of the
eddies remain unchanged, or frozen.
4.0 CONCLUSION
Forcing mechanisms in the boundary layer are the actual determinants of weather within
the microclimatology of soil and ground vicinity
5.0 SUMMARY
1. The observed wind properties in the boundary layer can exist individually and in
combination
2. The mean wind is important for horizontal transport of quantities, the wave is important
in the nocturnal boundary layer while the turbulence is important for vertical transport
of quantities

AGR 205 MODULE 3
37
6.0 TUTORED-MARKED ASSIGNMENT
1. Distinguish between the three wind properties within the boundary layer
2. Explain how to study turbulence as hypothised by Taylor
3. Discuss forcing mechanisms in the boundary layer
7.0 REFERENCES/FURTHER READINGS
Reddy, S.R. and D.S. Reddy (2011). Agrometeorology. New Delhi: Kayani Publishers.
Stull R.B. (1950). An Introduction to Boundary layer Meteorology
Ayoade, J. O. (1983). Introduction to Climatology for the Tropics.
ChiChester: John Wiley and Sons..
Ojo, O. et al (2001).Fundamentals of Physical and Dynamic Climatology.
Lagos: SEDEC Publishers.

AGR 205 MODULE 3
38
UNIT 2 UNIT 2 ATMOSPHERIC MOISTURE
CONTENTS
1.0 Introduction
2.0 Objectives
3.0 Main Content
3.1 Atmospheric Moisture
3.1.1 Evaporation and Evapotranspiration
3.2 Humidity
3.2.1 Distribution of Humidity
4.0 Conclusion
5.0 Summary
6.0 Tutor-Marked Assignment
7.0 References/Further Readings
1.0 INTRODUCTION
Water can exist in solid, liquid or gaseous states. It is a highly important element for all living
things and the environment. Water in its gaseous state or ―water vapour‖ forms the bulk of
what we refer to as atmospheric moisture. Water vapour is of great significance in deciding
weather and climate and so climatologists and meteorologists are interested in its amount and
distribution over time and space. This unit examines the nature, amount and distribution of
atmospheric moisture.
2.0 OBJECTIVES
At the end of this unit, you should be able to:
• understand the term atmospheric moisture
• define humidity and the various indices of humidity
• explain the distribution of humidity.
3.0 MAIN CONTENT
3.1 Atmospheric Moisture
3.1.1 Evaporation and Evapotranspiration
Atmospheric water vapour is derived from evaporation and transpiration. Evaporation is
the process by which moisture in its liquid or solid form is converted into gaseous form –
water vapour.

AGR 205 MODULE 3
39
Transpiration on the other hand refers to the loss of water from plants to the atmosphere.
Evapotranspiration differs from evaporation because it describes water losses from surfaces
where transpiration is a major contributor. Essentially, it combines evaporation and
transpiration.
Availability of moisture at evaporating surface and the ability of the atmosphere to
vaporise the water, remove and transport the vapour upward are fundamental factors that
determine the rate of evaporation and evapotranspiration over any given area. Evaporation
and evapotranspiration will occur at the maximum level if moisture is always available at
the evaporating surface. This has given rise to the concept of potential evapotranspiration.
However, moisture is not always available at the evaporating surface, and evaporation and
evapotranspiration have often occurred below maximum level. This has also given rise to
the concept of actual evapotranspiration.
Many factors including solar radiation, temperature, wind speed and humidity also
determine evaporation and evapotranspiration. Energy is needed to vaporise water and in
the absence of radiation data, energy is indicated by air temperature. Wind speed removes
the moistened air lying over the evaporating surface and replaces it with dry air to maintain
the evaporation process. The humidity of air determines the capacity of the air to hold
moisture. It also affects the evaporation rate. The lower the humidity, the greater the
capacity of air to hold moisture while the higher the humidity the lower the capacity of air
to hold water.
Condensation and precipitation which have been explained in an earlier unit help to remove
water vapour from the atmosphere. The most conspicuous aspects of the weather (e.g. rain,
snow, hail, fog etc) result from the presence of water in the atmosphere.
3.2 Humidity
Humidity is a measure of the amount of water in the atmosphere. It does not cover the other
forms of moisture in the atmosphere, i.e. liquid form (water droplets) and solid form (ice).
Because of its origin (earth‘s surface) atmospheric water vapour is concentrated in the
lower layers of the atmosphere. In fact, about half of the total water vapour in the
atmosphere is found below 2000 metres. The amount of moisture in the atmosphere
decreases steadily with increase in height. Water vapour is virtually absent after the
tropopause.
There are different ways of measuring the moisture content of the atmosphere. The indices
of humidity usually applied include the following:
Absolute humidity: It is expressed in grains per cubic metres of air. It is the total mass of
water in a given volume of air.

AGR 205 MODULE 3
40
Specific humidity: This is the mass of water vapour per kilogram of air including its
moisture.
Mass mixing ratio or humidity mixing ratio: It is the mass of water vapour per kilogram of
dry air.
Relative humidity: It is the ratio of the actual moisture content of a sample of air to that
which the same volume of air can hold at the same temperature and pressure when saturated.
It is usually expressed in percentage.
Dew-point temperature: This is the temperature at which saturation will occur if the air is
cooled at constant pressure without addition or removal of vapour.
Vapour pressure is the pressure exerted by the vapour content of the atmosphere in millibars.
The relative humidity is the most popularly used index for measuring air humidity. It is easily
measured and indicates the degree of saturation of the air. However, it is highly influenced by
the air temperature. A change in air temperature can change the value of relative humidity
even though the moisture content remains constant. For instance, the relative humidity of the
air varies inversely with temperature, being lower in the early afternoon and higher at night. It
is important to note that relative humidity does not tell us about the quantity of moisture in
the air but tells us how close to saturation the air is.
Unless they have been obtained at about the same hour of the day when air temperatures are
not too different, relative humidity for different stations cannot be compared since the values
are dependent on air temperature. For the purpose of comparison other indicators of
atmospheric moisture such as the vapour pressure or the absolute humidity should be used.
Unlike relative humidity these measures are not unduly influenced by air temperatures.
3.2.1 Distribution of Humidity
Water vapour as earlier mentioned is the most important air component that has influence
on weather and climate. It is highly inconstant varying from nearly zero up to a maximum
of about 3% in the middle latitude, and 4% in the humid tropics. This variability in both
place and time is of outstanding importance for the following reasons.
Water vapour is the source of all forms of condensation and precipitation.
Water vapour is a principal absorber of solar and infrared radiation. It therefore has an
important influence on temperature. Because of its latent heat, the amount of vertical

AGR 205 MODULE 3
41
distribution of water vapour in the atmosphere indirectly affects the buoyancy of air and
hence its tendency to ascend. This in turn is closely related to the formation of clouds and
precipitation.
The latent heat of water vapour is an important energy source for atmospheric circulations.
Humidity is an important factor of evaporation, a process that is important for animal and
plant life.
Generally, relative humidity is greater over the ocean than over the continental areas. This
reflects the high rate of evaporation due to the fact that the supply of water is unlimited at
the ocean surface while over many land areas; water is an important limiting factor of
evaporation because it is scarce. Also relative humidity is high throughout in very humid
climates and low in arid and semi-arid climates. In seasonally humid areas, relative
humidity is higher during the rainy season than during the dry season
The vapour pressure distributions have similar characteristics with relative humidity over
the oceans and the very humid areas of the work; for instance, vapour pressures are almost
at saturation level. In the arid and semi -arid areas, vapour pressures are low, causing the
saturation deficit of evaporability of air to be high.
When vapour is continuously added to the atmosphere and the limit is reached, the air is
said to be saturated. The resulting vapour pressure of the upper limit of water holding
capacity is termed saturation vapour pressure. The saturation vapour pressure increases
with higher temperatures and reaches a maximum at 1013 mb at which point the
introduction of more water vapour into the air results in condensation of an equivalent
amount of water vapour.
The saturation point can be reached at a particular temperature without the moisture
content changing. The critical temperature at which the saturation vapour pressure is
reached is known as the dew point temperature, which may be defined as the temperature
at which the quantity of water vapour in the air represents the maximum holding capacity
of the air at that temperature. This critical temperature may be attained by increasing the
water vapour content of the air at a particular temperature, or decreasing the air
temperature and consequently, reducing the relative moisture content of the air at a
constant temperature. Once the dew point is reached, any further cooling beyond it will
result in condensation either in the form of minute particles of water if temperature is
above 00C or ice if it is below 0
0C. The dew point and relative humidity are closely
related. At high relative humidity, the air is close to saturation and only slight cooling will
be required to attain the dew point. On the other hand, when relative humidity is low, a
large amount of cooling is required for the dew point to be attained.
4.0 CONCLUSION
Atmospheric moisture is made up of water vapour, water droplets and ice. They are derived
from evaporation and removed by condensation and precipitation.

AGR 205 MODULE 3
42
5.0 SUMMARY
In this unit we have learnt that:
1. Water vapour highly influences weather and climate
2. Atmospheric moisture is derived through evaporation from the
water bodies on the earth‘s surface
3. Humidity is a measure of the amount of water vapour in the
atmosphere.
4. The amount of water vapour decreases with height.
5. There are different indices for measuring humidity
6. Relative humidity is the most popularly used index for measuring air
humidity.
7. Relative humidity is higher over the ocean than over the continent.
6.0 TUTOR-MARKED ASSIGNMENT
1. Explain the process of acquisition and removal of atmospheric moisture.
2. a. What do you understand by relative humidity?
b. Explain the dew point temperature and how it is related to relative
humidity.
7.0 REFERENCES/FURTHER READING
Ayoade, J.O. (2004). Introduction to Climatology for the Tropics. Ibadan: Spectrum
Books Limited.
Ayoade, J.O. (2002). Introduction to Agro Climatology. Ibadan:Vintage Publishers.
Ojo, O. et al (2001).Fundamentals of Physical and DynamicClimatology SEDEC
Publishers.

AGR 205 MODULE 3
43
UNIT 3 SOIL MOISTURE
CONTENTS
1.0 Introduction
2.0 Objectives
3.0 Main Content
3.1 Soil Moisture
3.1.1 Effective Precipitation
3.2 Soil Aeration
4.0 4.0 Conclusion
5.0 Summary
6.0 Tutor-Marked Assignment
7.0 References/Further Readings
1.0 INTRODUCTION
The term ‗soil moisture‘ refers to the moisture state of soil as influenced over time by either
groundwater or rain water held by the soil at different tensions. This is largely determined by
climate and soil physical and chemical properties. Soil and its moisture are very important in
acting as a buffer system for plants, between times of water supply and demand in the
microclimatic environment of plants.
Soil moisture is the water stored in the soil and is affected by precipitation, temperature, soil
characteristics, and more. These same factors help determine the type of biome present, and
the suitability of land for growing crops. The health of our crops relies upon an adequate
supply of moisture and soil nutrients, among other things. As moisture availability declines,
the normal function and growth of plants are disrupted, and crop yields are reduced. And, as
our climate changes, moisture availability is becoming more variable.
Where is the water in soil? Solids, liquids, and gasses, the three phases of matter, are always
present in soil. Small mineral and organic particles comprise the solid fraction, and there are
spaces (pores) between the solid particles. Some pores are large, and others are very small.
Air and water, the gas and liquid phases, exist in the pores.
2.0 Objectives
At the end of this unit, you should be able to:
• understand what soil moisture stands for
• define soil available water and the various indices
• explain the distribution of water within the soil.

AGR 205 MODULE 3
44
2.0 Main Content
This unit will discuss the aspect of soil moisture and available water of soil in a
microclimatic environment.
3.1 Soil Moisture
The macrospores are filled up with water immediately after heavy rain when the oxygen
content falls to near zero. When the soil is artificially drained again, the macrospores are
filled up with air and the oxygen content of the soil increases.
3.1.1 Effective precipitation
Effective precipitation is that fraction of the total precipitation available for the consumptive
use of crop. This is because all the intense precipitation received in a single occasion may
not be useful for crop as part of it may be lost as surface runoff, deep percolation beyond
root zone or by evaporation. The extent of its utility in any given region determines
effectiveness of rainfall or rainfall efficiency.
Effective precipitation is influenced by so many factors like, land characteristics such as
topography, soil texture and structure, bulk density, permeability and infiltration. There is
ground water contribution then management factors such as ridging, tillage, terracing and
mulching which are aimed at minimizing surface runoff. Crop characters like root zone
depth, degree of ground cover and growth stage also affect precipitation effectiveness.
Annual effective rainfall is estimated to be about one-third of total rainfall.
3.2 Soil Aeration
Soil consists of pore spaces of varying sizes, which are filled with either water or air. The air
present in soil is known as soil air.
Soil aeration is phenomenon of rapid exchange of oxygen and carbon dioxide between the
soil pore space and the atmosphere, in order to prevent the deficiency of oxygen and/or
toxicity of carbon dioxide in the soil air. The well aerated soil contains enough oxygen for
respiration of roots and aerobic microbes and for oxidation reaction to proceed at optimum
rate.
4.0 CONCLUSIONS
The main source of soil moisture is from the various forms of precipitation that falls from the
atmosphere. This is as a result of hydrological cycle in which part of the falling precipitation
will percolate into the soil while some will run-off to stream and rivers which may later be
used to irrigate lands. Within the soil profile, there is exchange of oxygen and carbon dioxide
between the soil pores and the atmosphere which useful for roots respiration and aerobic
microbes.

AGR 205 MODULE 3
45
5.0 SUMMARY
1. Effective precipitation is that fraction of the total precipitation available for the
consumptive use of crop.
2. Effective precipitation is influenced by so many factors like, land characteristics such
as topography, soil texture and structure, bulk density, permeability and infiltration.
3. Soil consists of pore spaces of varying sizes, which are filled with either water or air.
The air present in soil is known as soil air.
6.0 TUTOR-MARKED ASSIGNMENT
1. Differentiate between actual precipitation and effective precipitation
2. Discuss briefly the importance of soil aeration to crop performance
3. What is the main source of soil moisture?
7.0 REFERENCES/FURTHER READINGS
Ayoade, J.O. (2004). Introduction to Climatology for the Tropics. Ibadan: Spectrum
Books Limited.
Ayoade, J.O. (2002). Introduction to Agro Climatology. Ibadan:Vintage Publishers.
Ojo, O. et al (2001).Fundamentals of Physical and DynamicClimatology SEDEC
Publishers.

AGR 205 MODULE 3
46
UNIT 4 SOIL PROPERTIES
CONTENTS
1.0 Introduction
2.0 Objectives
3.0 Main Content
3.1 Soil Physical Properties
3.2 Soil Chemical Properties
4.0 Conclusion
4.0
5.0 Summary
6.0 Tutor-Marked Assignment
7.0 References/Further Readings
1.0 INTRODUCTION
Properties of the soil consist of the physical and chemical state of soil at a given period of
time. These properties are important to a soil manager because the chemical state of soil in
terms of cation and anion exchanges determines availability of nutrients while the soil
reaction is what determines the healthy state of the soil in a microclimatic environment.
2.0 OBJECTIVES
At the end of this course, the student will learn about
1. Soil properties as affected by the microclimate of an area
2. How to manage soils of a microclimate for optimum utilization
3. To describe the size of the soil particles, this is critical for understanding soil
behaviour and its management.
3.0 MAIN CONTENT
3.1 Soil Physical Properties
Soil Texture
Texture is what describes the size of the soil particles, which is critical for understanding soil
behaviour and its management. The main soil separates are Gravel (>2mm), sand (0.05-
2mm), silt (0.002-0.05mm) and clay (<0.002mm). Coarse soil reduces the volume of soil
available for water and nutrient retention and root growth. In dense soils however, the space
between them may create paths for water drainage and root penetration. Sandy soils are have

AGR 205 MODULE 3
47
low water holding capacities and are prone to drought. A Clay particle exhibit
electromagnetic charges that attracts positive and negative ions as well as water.
Soil Structure
This relates to the arrangement of primary soil particles into groupings known as aggregates.
Soil structure is important because it gives a more permeable soil through which roots can
explore more water. Water holding capacity is effectively increased and it enhances water
movement and good drainage.
3.2 Soil Chemical Properties
Cation Exchange Capacity
Cation exchange capacity is the quantity of cations that can be held or exchanged by a given
amount of soil. This is because soil particles have charges which attract simple and complex
ions of opposite charges. Clay soils for example have negatively charged sites in their lattices
and attract and hold positively charged cations.
Anion Exchange
The principles of anion exchange are similar to those of cation exchange. Anions are held by
soil colloids by anion adsorption mechanism and by reacting with surface oxides or
hydroxides of metallic ions. Anion exchange is very important in making anions available for
plant growth and at the same time in retarding the leaching of such anions.
Soil Reaction (pH)
Soil reaction is determined by soil pH which affects a wide variety of chemical and biological
phenomena in soils. Soil pH influences the availability of plant nutrients as well as
microorganisms activities in the soil. In strongly acid soils (pH 4 - 5) the availability of
macronutrients is curtailed. In contrast, availability of micronutrients is increased.
4
.
0
4.0 CONCLUSIONS
Availability of soil macro and micronutrients to the plant root is governed by the
chemical properties of the soil. The physical properties of the soil on the other hand
describes the soil structure and texture which are very important in knowing soil
behaviour and management
5
.
0
5.0 SUMMARY
1. Soil structure is important because it gives a more permeable soil through
which roots root can explore more water.
2. Soil texture is what creates paths for water drainage and root penetration
3. Soil reaction is determined by soil pH which affects a wide variety of
chemical and biological phenomena in soils.
4. Anion exchange is very important in making anions available for plant
growth and at the same time in retarding the leaching of such anions.

AGR 205 MODULE 3
48
6
.
0
TUTOR-MARKED ASSIGNMENT
1. Discuss the importance of soil properties
2. How does soil reaction affects the availability of nutrients supply to plants?
7
.
0
REFERENCES/FURTHER READINGS
Manual on soil fertility assessment
Reddy, S.R. and D.S. Reddy (2011). Agrometeorology. New Delhi: Kayani
Publishers.
Ayoade, J. O. (1983). Introduction to Climatology for the Tropics.
ChiChester: John Wiley and Sons..

AGR 205 MODULE 3
49
UNIT 5 SOIL CONSERVATION
CONTENTS
1.0 Introduction
2.0 Objectives
3.0 Main Content
3.1 Soil Conservation
3.1.1 Wind breaks
3.1.2 Cover crops/Crop rotation
3.1.3 Soil conservation farming
4.0 4.0 Conclusion
5.0 Summary
6.0 Tutor-Marked Assignment
7.0 References/Further Readings
1
.
0
1.0 INTRODUCTION
Soil Conservation is the name given to a handful of techniques aimed at preserving
the soil. Soil loss and loss of soil fertility can be traced back to a number of causes
including over-use, erosion, salinization and chemical contamination. Unsustainable
subsistence farming and the slash and burn clearing methods used in some less
developed regions, can often cause deforestation, loss of soil nutrients, erosion on a
massive scale and sometimes even complete desertification.
2
.
0
.0 OBJECTIVES
At the end of this course the student will learn about
1. Soil conservation techniques in a microclimate for sustainable land use
2. The various methods of soil conservation
3. How this techniques can affect both erosion and fertility
3
.
0
3.0 MAIN CONTENT
3.1 Soil Conservation
Soil conservation includes all those measures which help in protecting the soil from
erosion and exhaustion. Soil erosion has been continuing over, such a large part of
India for such a long time that it has assumed alarming proportions. Some of the
methods that must be adopted for conserving soil are as follows: Afforestation,
Checking Overgrazing, Constructing Dams and Changing Agricultural Practices
Slash-and-burn and other unsustainable methods of subsistence farming are practiced
in some lesser developed areas. A sequel to the deforestation is typically large scale
erosion, loss of soil nutrients and sometimes total desertification. Techniques for
improved soil conservation include crop rotation, cover crops, conservation tillage
and planted windbreaks, affect both erosion and fertility. When plants die, they decay
AGR 205 MODULE 3
50
and become part of the soil.
3.1.1 Windbreaks – Rows of tall trees are used in dense patterns around the
farmland and prevents wind erosion. Evergreen trees can provide year round
protection but deciduous trees can be adequate as long as foliage is apparent during
the seasons when the soil is bare.
3.1.2 Cover Crops/ Crop Rotation – Cover crops such as turnips and radishes are
rotated with cash crops in order to blanket the soil all year- round and produces green
manure the replenishes nitrogen and other critical nutrients. Using cover crops can
also suppress weeds.
3.1.3 Soil Conservation Farming – A mixture of farming methods intending the
mimic the biology of virgin land. These practices can be used to prevent erosion and
even restore damaged soil and encourage plant growth. Eliminating the use of
nitrogen fertilizer and fungicides can increase yields and protect crops from drought
and flooding.
4.0 4.0 CONCLUSION
Soil conservation is one a very vital technique in sustainable agriculture and there
several methods to conserve soil for maximum land use.
5
.
0
SUMMARY
1. Soil Conservation is aimed at preserving the soil against soil loss and loss of soil
fertility due to a number of causes including over-use, erosion, salinization and
chemical contamination.
2. Soil erosion and exhaustion has been continuing at an alarming proportion.
3. Techniques for improved soil conservation include crop rotation, cover crops,
conservation tillage and planted windbreaks, affect both erosion and fertility.
6
.
0
TUTOR-MARKED ASSIGNMENT
1. What is soil conservation and the techniques used in conserving soils?
2. What method of soil conservation will you adopt to increase yields and protect
crops from drought and flooding?
7
.
0
REFERENCES/FURTHER READINGS
Wikipedia.org
Brady N.C and Weil R.R. (2002). The nature and properties of Soils. Library
Cataloguing-in-publication Data. Macmillan Publishing Company

AGR 205 MODULE 3
51
MODULE 3
Unit 1 Equipments and Maintenance of Standard Meteorological Station
Unit 2 Measurements of Climatic Variables
Unit 3 Measurement of Evaporation and Evapotranspiration
Unit 4 Microclimate and Soil Management in the Tropics
Unit 5 Influence of Agriculture on Microclimate
UNIT 1 EQUIPMENT AND MAINTENANCE OF
STANDARD METEOROLOGICAL STATIONS
CONTENTS
1.0 Introduction
2.0 Objectives
3.0 Main Content
3.1 Categories of Weather Stations
3.2 Weather Measurement
3.2.1 Rainfall
3.2.2 Air Temperature
3.2.3 Humidity
4.0 Conclusion
5.0 Summary
6.0 Tutor-Marked Assignment
7.0 References/Further Readings
1.0 INTRODUCTION
A weather station otherwise known as a meteorological station or meteorological enclosure is
a place where all elements of weather are measured and recorded. In dimension, it measures
10 metres by 6 metres. It should be located on a level ground covered with short grasses.
Furthermore, the station should not be sited on or close to a hill, in a depression or on steep
slope, near buildings or tall trees. The station is also usually fenced around with wire gauze

AGR 205 MODULE 3
52
for the security of the instruments and to ensure free air circulation. Based on the number of
elements measured or observed and the frequency of observation of these elements, four
categories of weather stations are recognized.
Fig. 13: Layout of a Weather Station (Source: Ayoade, 2002)
2.0 OBJECTIVES
At the end of this unit, you should be able to:
• describe the layout of a weather station
• recognise the equipment for measuring rainfall, air temperature and humidity
• measure rainfall, air temperature and humidity.
3.0 MAIN CONTENT
3.1 Categories of Weather Stations
We have the following categories of weather stations:

AGR 205 MODULE 3
53
1. Rainfall stations: These are stations manned by part-time observers who take daily
readings of rainfall only. In the strictest sense of the term these are not weather
stations, as the only weather element measured is rainfall.
2. Climatological stations: These stations are also manned by parttime observers but in
addition to measuring daily rainfall, they make once or twice daily instrumental
observations of air temperature and humidity.
3. Agroclimatological stations: These are stations where daily instrumental observations
of temperature and humidity, as well as soil temperatures of various depths are
made once or twice. Other elements which are measured only once daily include
rainfall, wind speed and direction, evaporation, sunshine duration and radiation.
They are manned by part- time observers.
4. Synoptic station: These are stations manned by full-time professional observers.
Continuous weather monitoring and hourly instrumental observation are
maintained here. The main climatic elements observed include temperature,
humidity, pressure, rainfall, duration of sunshine, cloud amount and wind speed
and direction.
3.3 Weather Measurement
Elements of weather are observed and measured by weather instruments which are kept
within the confines of weather stations. Weather instruments may be manual or self-recording
(autographic). The autographic instruments provide continuous measurements of weather
elements over a period of time, usually 24 hours. Autographic instruments are more
expensive than manual instruments. The general procedures for the measurements of the
major weather elements are discussed here.
3.2.1 Rainfall
Rainfall is measured by a rain gauge. A rain gauge consists of a copper cylinder with a metal
funnel which leads into a smaller copper container or a glass bottle. The hole in the funnel
that leads down to the container is very small so that evaporation of the collected rain is
minimised. The gauge should be at least 30cm above the ground and firmly fastened to avoid
splashing. Rainfall falling in the funnel trickles into the jar below and at the end of a 24-hour
period this is poured into a graduated measuring cylinder which is tapered at the bottom to
enable very small amounts (such as 0.25mm) to be measured accurately. The reading should
be done at eye-level and to an accuracy of up to 0.1cm.

AGR 205 MODULE 3
54
Fig. 14: Rainguages
Rainfall is generally stated in units of inches, millimeters and centimeters that fall per unit of
time. For instance, 20mm of rainfall would cover the ground to a depth of 20mm, provided
that none is lost by runoff evaporation or sinking into the ground. For meteorological
recordings, a rain-day is reckoned by a period of 24 hours with at least 0.25mm of rain
recorded.
There are different types of autographic rain gauges, depending on the type of operating
mechanism; they include the tilting siphon, the tipping bucket and the weighing collector
system (W.M.O 1970). The most popular of these rain gauges is the tilting siphon autographic
rain gauge. It contains a collecting chamber fitted with a float. When the chamber fills up as
rain falls, the float rises and a pen attached to the top traces a graph on a chart fixed to a
cylindrical drum driven by clock wave. After the chamber is filled, it tilts over on its pivot and
the contents siphon out of the gauge. The float then returns to its original level and the pen
rests on the base of the chart. The chamber fills up again as the rain continues to fall and the
process is repeated until the rain stops. One complete cycle measures 5mm of rainfall.
3.2.2 Air Temperature
Air temperature is measured manually with the aid of maximum and minimum thermometers
and autographically by a thermograph.
Each weather station has a Stevenson screen in which the thermometers are kept. They are
maximum and minimum thermometers, wet bulb thermometer and dry bulb thermometer.

AGR 205 MODULE 3
55
The screen is built to provide shade under which the shade temperature of the air can be
measured. It is a wooden box whose four sides are louvered to allow adequate ventilation.
The roof is made of double boarding to prevent the sun‘s heat from reaching the inside of the
screen while the white paint further improves the insulation against solar radiation. It is
placed on a stand, about 121cm (4ft) above the ground level.
The maximum thermometer is a mercury-in-glass thermometer which contains
a small glass index. When the temperature rises the mercury expands and pushes the index
along the tube. When the temperature falls, the mercury contracts leaving behind the index.
The maximum temperature is read on the scale at the end of the index nearer the mercury.
Fig. 15: Maximum and minimum thermometers
The minimum thermometer is an alcohol in-glass thermometer in which when the
temperature rises, the alcohol expands and flows past the index and when the temperature
falls, the alcohol contracts and pulls the index
along the tube. The end of the index nearer the meniscus shows the minimum temperature.
The instrument is reset by tilting or by using a magnet to draw back the index to the mercury.
The maximum and minimum thermometers are used at weather stations to measure the
highest and lowest temperatures within the day respectively. The air temperature at any given
time can be read off an ordinary mercury in-glass thermometer with or without an index.
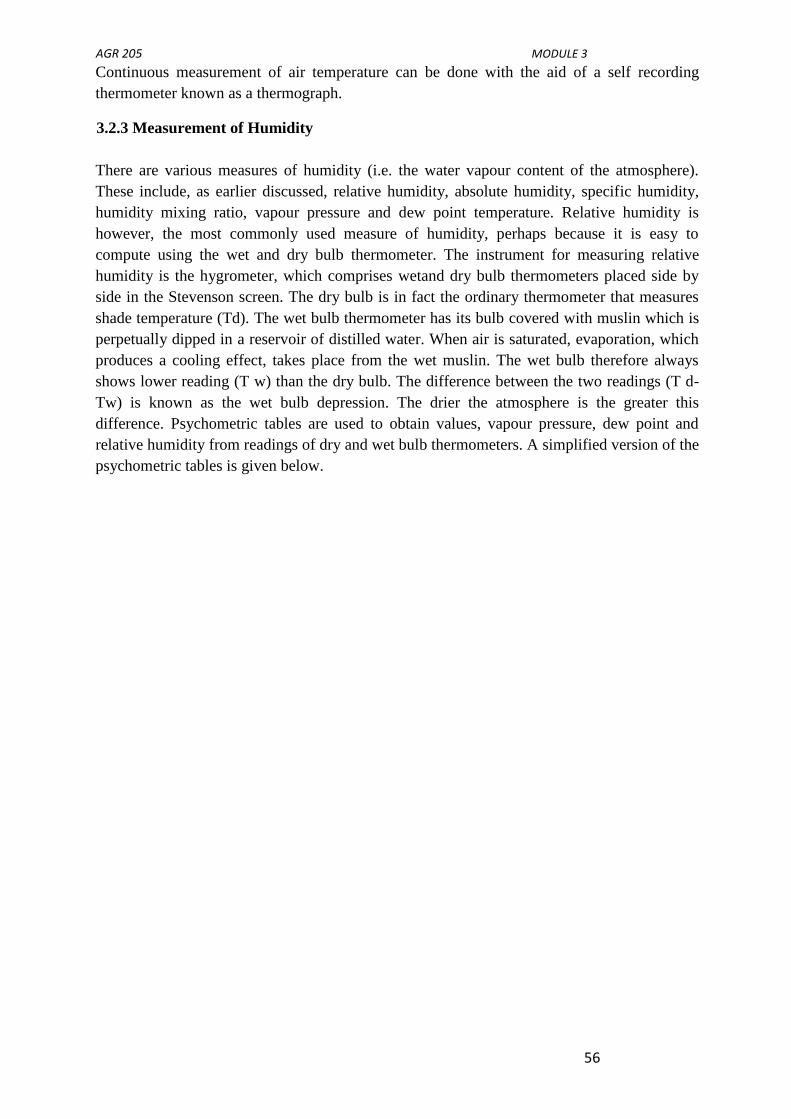
AGR 205 MODULE 3
56
Continuous measurement of air temperature can be done with the aid of a self recording
thermometer known as a thermograph.
3.2.3 Measurement of Humidity
There are various measures of humidity (i.e. the water vapour content of the atmosphere).
These include, as earlier discussed, relative humidity, absolute humidity, specific humidity,
humidity mixing ratio, vapour pressure and dew point temperature. Relative humidity is
however, the most commonly used measure of humidity, perhaps because it is easy to
compute using the wet and dry bulb thermometer. The instrument for measuring relative
humidity is the hygrometer, which comprises wetand dry bulb thermometers placed side by
side in the Stevenson screen. The dry bulb is in fact the ordinary thermometer that measures
shade temperature (Td). The wet bulb thermometer has its bulb covered with muslin which is
perpetually dipped in a reservoir of distilled water. When air is saturated, evaporation, which
produces a cooling effect, takes place from the wet muslin. The wet bulb therefore always
shows lower reading (T w) than the dry bulb. The difference between the two readings (T d-
Tw) is known as the wet bulb depression. The drier the atmosphere is the greater this
difference. Psychometric tables are used to obtain values, vapour pressure, dew point and
relative humidity from readings of dry and wet bulb thermometers. A simplified version of the
psychometric tables is given below.

AGR 205 MODULE 3
57
F
i
g
. 16: Hygrometer (Dry and Wet bulb thermometer)
4.0 CONCLUSION
There are four categories of weather stations. Weather equipment is kept in weather stations.
Thermometers and dry and wet bulb thermometers are kept in the Stevenson screen which in
turn is placed in a weather station.

AGR 205 MODULE 3
58
5.0 SUMMARY
In this unit we have learnt that:
1. A weather station is a place where all weather elements are measured and
recorded.
2. Four categories of weather stations are recognised – rainfall stations,
climatological stations, agroclimatological stations and synoptic stations.
3. The dimension of a weather station is 6x10m.
4. Rain gauges (both manual and self-recording) are used in measuring rainfall.
5. Thermometers (both manual and self recording) are used in measuring
temperature.
6. Dry and wet bulb thermometers are used to measure humidity.
6.0 TUTOR-MARKED ASSIGNMENT
1. Explain the main features of rain gauges and how the amount of rain is
measured with the equipment.
2. Explain how you will set up a standard meteorological station.
7.0 REFERENCES/FURTHER READING
Areola, O. (1999). Certificate Physical and Human Geography forSenior
Secondary Schools. Ibadan: University Press Plc.
Ayoade, J.O. (1983). Introduction to Climatology for the Tropics.
ChiChester: John Wiley and Sons.
Ayoade, J.O. (2002). Introduction to Agroclimatology. Ibadan: Vantage Publishers.
Bunnet, R.B. (1973). General Geography in Diagram. London:
Longman.
Nieuwolt, S (1977). Tropical Climatology. An Introduction to theClimates of
the Low latitudes. ChiChester: John Wiley and Sons.
Ojo, O. (1977). The Climates of West Africa. Ibadan: Heinemann Educational
Books.
Ojo,O.etal. (2001) .Fundamentals of Physical and Dynamic Climatology.
Lagos: SEDEC Publishers.

AGR 205 MODULE 3
59
UNIT 2 MEASUREMENT OF CLIMATIC VARIABLES
CONTENTS
1.0 Introduction
2.0 Objectives
3.0 Main Content
3.1 Measurement of Air Pressure
3.2 Measurement of Wind Speed
3.3 Measurement of Wind Direction
3.4 Measurement of Radiation
3.5 Measurement of Sunshine Duration
4
.
0
4.0 Conclusion
5
.
0
5.0 Summary
6
.
0
Tutor- Marked Assi6.0 Tutor-Marked Assignment
7
.
0
7.0 References/Further Readings
1.0 INTRODUCTION
Weather observation and measurements started in Unit 11 and continues in this unit.
2.0 OBJECTIVES
At the end of this unit, you should be able to:
• recognise the equipment for measuring air pressure, wind speed, wind direction,
radiation and sunshine duration
• measure air pressure, wind speed, wind direction, radiation and sunshine duration.
3.1 Measurement of Air Pressure

AGR 205 MODULE 3
60
Air has weight and the weight of the vertical column of air is measured by barometers. The
instrument which measures air pressure is called a barometer. There are various types of
barometers. They are the mercury barometer, the aneroid barometer, the barograph and
altimeter.
1. The mercury barometer: The principle which operates the mercury barometer is the
balancing of the column of air against a column of mercury in a scaled glass tube.
Fluctuations in air pressure produce corresponding differences in the height of the
mercury and a graduated vanier is mounted along the tube to facilitate accurate
reading to a thousandth of an inch. At sea level,
the atmosphere balances a column of mercury 29.29 inches. In general the mercury
barometer is large and cumbersome to carry about but it is very accurate and is used in
many weather stations.
2. T
he aneroid barometer measures pressure using the principle of sylphon cells, which is
partially evacuated metal wefer. When pressure in the outside air increases, the cell
tends to ―collapse‖; when pressure decreases, the cell expands. These fluctuations with
pressure changes are mechanically linked to an indicator or a calibrated dial. The dial
is commonly calibrated in inches of mercury. Although the aneroid barometer is less
reliable, it is more compact, portable and convenient to use on the field.
3. The altimeter is an altitude barometer. The principle is the same as that of the aneroid
barometer. The chief difference lies in the fact that barometric scales are calibrated in
terms of atmospheric pressure, whereas, altimeters are calibrated in feet or metric
height units.
4. The barograph: Atmospheric pressure can also be measured with the aid of a self-
recording barometer known as a barograph. The most commonly used barograph
employs the sylphon cells.
Sylphon cells activate pen arm which moves the ink record.

AGR 205 MODULE 3
61
Measurement of Wind Speed
3.2 Wind speed is measured by a cup anemometer which consists of three or four cups,
conical or hemispherical in shape mounted symmetrically about vertical axis.

AGR 205 MODULE 3
62
Fig. 19: Wind aneometer
The metal cups which are fixed to the ends of the arms rotate according to the prevailing
wind speed. In the cup generator anemometer the rotating cups are made to generate voltage,
which registers on a dial calibrated in knots, miles or kilometres per hour. In the cup-counter
anemometer the integrated flow of the air in miles or kilometres is registered on a counter. In
the latter case, wind speed is obtained by dividing in wind run between two observation times
by the intervening period of time, usually 24 hours. A self-recording anemometer which
produces a continuous record of wind velocity overtime is called an anemograph.
3.3 Measurement of Wind Direction
Wind direction is observed with the aid of a wind vane which consists of a rotating arm
pivoted on a vertical shaft. The arrow of the wind vane always points in the direction from
which the wind blows and the wind is named after the direction.
Fig. 20: Wind vanes

AGR 205 MODULE 3
63
3.4 Measurement of Insolation
A number of instruments are available for measuring the different components of the earth‘s
radiation balance, the equation of which is in the form
Rn = (Q+q) (1-σ) + I - I
Where R nis the net radiation, (Q+q) is the sum of the shortwave direct
(Q) and diffuse (q), solar radiation incident on the earth‘s surface, I is the counter radiation
from the atmosphere which is the long-wave (infrared) and I is the terrestrial radiation which
is also a long -wave or infrared.
Instruments used for measuring radiation are generally expensive and therefore are not
commonly used in many developing countries. The instruments fall into five basic types as
follows:
1. Net Radiometers – for measuring only the net radiation.
2. Pyranometers- for measuring the total short wave radiation from the sky incident on a
horizontal surface at the ground.
3. Pyrheliometers – for measuring the solar intensity or the direct beam solar radiation
(Q) at normal incidence. These are the most
accurate of all radiation instruments.
4. Pyrradiometers – for measuring only the albedo of the surface 5.Pyrgeometers – for
measuring infrared long wave radiation from the earth‘s surface or the atmosphere
depending upon whether it is downward facing or upward facing.
6.Albedometers – for measuring only the albedo of the surface.
Measurements of some radiation components are described below.
Pyrheliometers are instruments designed for measuring the direct beam solar radiation at
normal incidence, usually called solar intensity. It has a blackened receiving surface oriented
perpendicular to the solar beam and is either inserted in a blackened tube or surrounded by a
series of spaced diaphragms arranged in such a way that only radiation from the sun and a
narrow annulus of sky is intercepted.

AGR 205 MODULE 3
64
Fig. 21: Pyranometer
Pyronometers are more commonly used than pyrheliometers. They measure the total short
wave radiation from the sun and sky incident on a horizontal surface of the ground (i.e. both
direct and diffuse radiation). The receiver of the pyranometer is enclosed in a glass or quartz
casing that must be kept clean and dry. To provide the best possible result, the pyranometer
should be treated so that a shadow will not be cast on it at any time.
Fig. 22: Star Pyranometer
3.5 Measurement of Duration of Sunshine

AGR 205 MODULE 3
65
The duration of sunshine is measured with the aid of Campbell-stokes sunshine
recorder. It consists of a glass sphere which
Fig. 23: Campbell-Stokes Sunshine Recorder
concentrates the sun‘s rays on a sensitised card graduated in hours and minutes and held in a
metal half-bowl with which the sphere is concentric. The instrument is installed on a concrete
pillar in the open about 1-5m above the ground. Bright sunshine leaves a trace of burnt line
along the sensitised card while cloudy periods are blank. To measure the total duration of
sunshine for the day, the total length of the burnt traces on the card which is graduated in
hours and minutes is calculated.
3.6 Measurement of Soil Temperature
Soil temperatures are measured at various depths – 5cm, 10cm, 20cm, 50cm and 100cm. The
instrument used for measuring soil temperature is known as soil thermometer. It is a
mercurial thermometer with bulbs embedded in paraffin wax. The thermometer is suspended
in steel tubes and inserted into the soil at various depths.

AGR 205 MODULE 3
66
4.0 CONCLUSION
Equipment for measuring air pressure, wind speed and direction, radiation and sunshine
duration have been identified in this unit. Methods of measuring the climatic elements have
also been discussed.
5.0 SUMMARY
In this unit we have learnt that:
1. Various types of barometers are used for measuring air pressure.
2. Cup anemometer is the equipment used for measuring wind
speed.
3. The wind vane is used for measuring wind direction.
4. Various types of radiometers are used for measuring various
aspects of radiation.
5.
Campbell-stokes sunshine recorder is used for measuring the duration
of sunshine.
6.0
TUTOR-MARKED ASSIGNMENT
1. List all the equipment used for measuring all aspects of solar radiation
and describe pyrgeometers.
2. Explain how to measure wind speed.
3. Draw an annotated diagram of the mercury barometer.
7.0 REFERENCES/FURTHER READING
Areola, O. (1999). Certificate Physical and Human Geography forSenior
Secondary Schools. Ibadan: University Press Plc.
Ayoade, J.O. (1983). Introduction to Climatology for the Tropics ChiChester: John
Wiley and Sons.
Ayoade, J.O. (2002). Introduction to Agroclimatology. Ibadan: Vantage
Publishers, Tropical Climatology: A
Bunnet, R.B. (1973).GeneralGeography in Diagrams.London: Longman,
Nieuwolt, S (1977). An Introduction to the Climates of the LowLatitudes.
ChiChester: John Wiley and Sons.

AGR 205 MODULE 3
67
Ojo, O. (1977). The Climates of West Africa. Ibadan: Heinemann Educational
Books.
Ojo,O.et al. (2001).Fundamentals of Physical and Dynamic Climatology.
Lagos: SEDEC Publishers.

AGR 205 INTRODUCTION TO AGRO-CLIMATOLOGY
UNIT 3 MEASUREMENT OF EVAPORATION AND EVAPOTRANSPIRATION
CONTENTS
1
.
0
Introduction
2
.
0
Objectives
3
.
0
Main Content
3.1 Measurement of Evaporation
3.2 Measurement of Evapotranspiration
3.3 Maintenance of a Standard Meteorological Station
4
.
0
4.0 Conclusion
5.0 5.0 Summary
6
.
0
6.0 Tutor-Marked Assignment
7
.
0
7.0 References/Further Readings
1
.
0
1.0 INTRODUCTION
Weather observation and measurements started in Unit 11 continue in this unit.
2.0 OBJECTIVES
At the end of this unit, you should be able to:
• recognise the equipment for measuring evaporation and evapotranspiration
• take care of a meteorological station.

AGR 205 MODULE 3
69
3.0 MAIN CONTENT
3.1 Measurement of Evaporation
The equipment for measuring evaporation are generally called evaporimeters. There are two
basic types of evaporimeters: those in which evaporation takes place from a continuously
wetted porous surface of blotting-paper, fabric or ceramic material, an example of which is
the piche evaporimeter; and those in which evaporation takes place from a free water surface
in tanks or pans.
The Piche Evaporimeter
The most common instrument for measuring evaporation in West Africa is the piche
evaporimeter, a graduated measuring cylindrical tube

AGR 205 MODULE 3
70
22.5cm long with an internal diameter of 11mm and an external diameter of 14mm. It has a
closed and an open end. At the open end of the tube is a wetted surface (a filter paper disc)
held by a spring fitted with a disc and collar. The total evaporating surface is given in
centimeters. Water is supplied to the paper at the open end by a wick inking it to a small
water container normally graduated in millimeters. The evaporation from the instrument is
the difference between the readings of the container at the beginning and end of the period.
The Piche evaporimeter is not reliable and it has been criticised as measuring the drying
power of air rather than the amount of water lost by evaporation to the atmosphere. The piche
evaporimeter is also kept in the Stevenson screen.
Fig. 24: Piche Evaporimeter
There are different types of evaporation pans depending on their size, shape and manner of
exposure. Only the three most common ones are described here. These are the United States
Weather Bureau (USWB) Class A pan, the raised tank and the sunken tank. The USWB
Class A pan has been recommended for worldwide use by the WMO. It is circular with a
diameter of 1206mm and 254mm deep. It is made of galvanised iron and mounted on a
wooden open frame platform about 150mm above the ground. The pan is filled with water to
within 51mm of the rim.

AGR 205 MODULE 3
71
Fig. 25: Class A pan
The sunken tank is about 1829mm2 with the water level at the ground level and a rim of 76mm
protruding above the ground to prevent inflow of surface water when it rains.
A third type, the raised tank, is a rectangular tank which is 915mm by 1270mm and 432mm
deep. The depth of the water in the tank is about 350mm. A wooden platform is used to raise the
tank so that the water surface is about 457mm above the ground.

AGR 205 MODULE 3
72
Fig. 27: Raised Tank
The principle employed in all evaporation pans to measure evaporation rates is the same:
Evaporation measurements are taken by refilling the water in the tanks to a fixed level. After a
period of time, which is usually 24 hours, the level of water in the pan is checked. Unless some
rain has fallen during the intervening period, the level of water in the pan would have fallen
owing to evaporation. The pan is reset by filling it back with water to the original level. The
amount of water added to reset the pan represents the evaporation that has occurred in the
intervening period. Each pan has a cup specific to it and this is used to refill the pan. When rain
falls, the rain water is allowed for by adding the amount of rainfall measured in a nearby rain
gauge to the amount of the apparent evaporation.
There are a number of disadvantages to pans and sunken tanks. It is difficult to detect leakage.
Because of their closeness to the ground, the tanks tend to get dirty, which influences the rate of
evaporation. Another problem is that rain water can splash into the tanks or overflow from
them. The tanks and pans are difficult to clean. The tanks and pans about ground level may be
subject to radiation from the sides and bottom, so that readings may be higher.
One other common problem with evaporation pans and tanks is the difficulty of preventing
herds or stray animals from drinking water from the pan.

AGR 205 MODULE 3
73
However, tanks or pans have the advantage of being inexpensive to install and easy to handle.
They can be used throughout the life span of a crop.
3.2 Measuring of Evapotranspiration
Rates of evapotranspiration over a surface are measured by the cost of lysimeter. There are two
types of lysimeter; the weighing lysimeter and the drainage lysimeter. Lysimeter are tanks buried
in the ground to measure the percolation of water through the soils. They provide the most
reliable and accurate method for the direct measurement of evapotranspiration provided the
necessary precautions in designing, operating and sitting are taken. The installation of lysimeter
in West Africa has been impossible; however, one of the reasons is that it is very expensive.
The weighing lysimeter is a rather sophisticated device consisting of a soil-filled tank, the
evapotranspirometer tank, in which grass is planted.
Water enters through this tank and drains through an outlet pipe into an overflow chamber and
supported by a weighing mechanism.
Fig. 28: Evapotranspirometer
Evapotranspiration values are obtained directly by calculating changes in the weight of the soil-
vegetation system within the tank over a specified period of time, usually 24 hours, to obtain

AGR 205 MODULE 3
74
daily values of evapotranspiration. If the experimental surface is surrounded by a buffer zone
with the same type of vegetation and kept moist by watering. The values of evapotranspiration
obtained would be those of potential evapotranspiration. The buffer zone is necessary to ensure
that
energy and drier air are not advected over the experimental plot from the surrounding. Weighing
lysimeter are often used to measure actual evapotranspiration when the experimental surface
and the surroundings are not kept at field capacity.
The drainage lysimeter which operates on a sample water balance basis is more widely used
than the weighing lysimeter as it can be constructed. The principle on which it operates is that
evapotranspiration is the difference between water input in form of rainfall and irrigation if
necessary and water output in form of percolation and runoff in a soil plant system. (Chang,
1964). The drainage lysimeter is normally used to measure rates of potential evapotranspiration.
There is therefore, the need to keep the tank and the surrounding area continuously moist by
irrigation.
3.3 Maintenance of a Standard Meteorological Station
To ensure that observations at the meteorological stations are accurate and comparable over
time, the following should be observed:
1. Buildings should not be located close to the meteorological station.
2. Big trees should not be allowed to grow around the station.
3. The grass of the meteorological station should be kept low at all times.
4. Observation of the elements should be regular and prompt.
5. Animals should not be allowed access to the station, particularly the pans and tanks;
in drier areas birds and small animals use the tanks for bathing.
6. Malfunctioning equipment should be replaced promptly.
4.0 CONCLUSION
Equipment for measuring evaporation and evapotranspiration has been fully discussed in this
unit. The methods of maintenance of a weather station have also been discussed.

AGR 205 MODULE 3
75
5.0 SUMMARY
In this unit we have learnt that:
1. Evaporimeters which are of two types (piche evaporimeter, pans) are used for measuring
evaporation.
2. Lysimeter which are also of two types (drainage lysimeter, weighing lysimeter) are used
for measuring evapotranspiration.
3.
Keeping the grass inside the weather station low, clearing the
surrounding, fencing the weather station, reporting and replacing the
malfunctioning equipment are some of the ways of maintaining a
weather station.
6.0
TUTOR-MARKED ASSIGNMENT
1. With the aid of a diagram, describe how to measure
evapotranspiration.
2 a. Describe piche evaporimeter
b. What is its shortcoming as an instrument for measuring
evaporation?
3. List ways of maintaining a weather station.
4. Explain the main features of rain gauges and how the amount of
rain is measured with the equipment.
5. Explain how you will set up a standard meteorological station.
6. List all the equipment used in measuring all aspects of solar radiation
and describe pyrogeometers.
7. Explain how to measure wind speed.
8. Draw an annotated diagram of a mercury barometer.
9. With the aid of a diagram, describe how to measure
evapotransipiration.
10.
List ways of maintaining a weather station.
7.0 REFERENCES/FURTHER READING
Areola, O. (1999). Certificate Physical and Human Geography forSenior Secondary Schools.
Ibadan: University Press Plc.
Ayoade, J.O. (1983). Introduction to Climatology for the Tropics. ChiChester: John Wiley and
Sons.
Ayoade, J.O. (2002).Introduction to Agroclimatology. Ibadan: Vantage Publishers.

AGR 205 MODULE 3
76
Bunnet, R.B. (1973).General Geography in Diagram.London: Longman.
Nieuwolt,S.(1977).TropicalClimatology: An Introduction tothe Climates of the Low latitudes ChiChester: John Wiley and Sons.
Ojo, O. (1977). The Climates of West Africa. Ibadan: Heinemann Educational Books.
Ojo,O.et al. (2001).Fundamentals of Physical and Dynamic Climatology. Lagos: SEDEC
Publishers.

AGR 205 MODULE 3
77

AGR 205 MODULE 3
78
UNIT 4 MICROCLIMATE AND SOIL MANAGEMENT IN THE TROPICS
CONTENTS
1.0 Introduction
2.0 Objectives
3.0 Main Content
3.1 Microclimate of Soils
3.2 Soil Management in the Tropics
4.0 Conclusions
5.0 Summary
6.0 Tutor- Marked Assignment
7.0 Reference/Further Readings
1.0INTRODUCTION
Microclimate is the suite of climatic conditions measured in localized areas near the
earth's surface. These environmental variables—which include temperature, light, wind
speed, and moisture—provide meaningful indicators for habitat selection and other
ecological activities. In seminal studies, Shirley (1929, 1945) emphasized microclimate
as a determinant of ecological patterns in both plant and animal communities and a driver
of such processes as growth and mortality of organisms. The importance of microclimate
in influencing ecological processes such as plant regeneration and growth, soil
respiration, nutrient cycling, and wildlife habitat selection has become an essential
component of current ecological research (Chen et al. 1999).
2.0 OBJECTIVES
The objectives of this course is to learn about
1. The importance of microclimate in influencing ecological process
2. Determining effect of microclimate in both plant and animal
3. The environmental variables that provides meaningful indicators for habitat
selection
3.0 MAIN CONTENT
3.1 Microclimate and Soil Management in the Tropics
Soil microclimate may be defined as a complex of certain factors which determine the
state of the soil, considering the state of the soil as an environment for plants, animals or
other objects. Temperature and humidity are very important variables in determining soil

AGR 205 MODULE 3
79
microclimate, the knowledge of which enables quantitative discussion and comparison of
the microclimate in different soils under various meteorological conditions.
Human activities, such as agriculture and forestry, and natural disturbances, such as
outbreaks of insects and diseases, can modify the physical environment of an ecosystem
(i.e., the patterns of temperature, moisture, wind, and light) by altering structural features.
Typically, forest structure is described at the stand and landscape levels. Stand structure
is well defined in forestry (e.g., stocking densities, over story coverage, and species
composition). Landscape structure can be defined by the spatial arrangement (pattern) of
elements of topography, vegetation, soil, or the physical environment itself. However,
vegetative features are also commonly used at the landscape scale.
3.2 Overall influence of Temperature on Crop Growth
The uniform temperature and its small seasonal variation characteristic of the tropics
provide a wide range of choice of suitable crops in relation to temperature conditions;
therefore temperatures are rarely a critical factor in tropical agriculture (Nieuwolt, 1977).
As temperature conditions are frequently below optimum for most crops, there exists
close a correlation between yields and temperature. It is also expressed in the varit Hoff
law which states that dry matter production doubles for every rise in temperature of about
100C. Such correlations are however, not valid for many tropical crops.
Soil temperature is another significant control of crop growth and development. At times,
it is of greater ecological importance to crop life than air temperature. Soil temperature
affects the germination of seed and later influences root development and the growth of
the entire crop. Soil also affects the physical, chemical and biological processes in the
soil that determine overall crop growth. For instance, potatoes require air temperature of
between 80C and 28
0C, the optimum being 18
0C.
3.3 Pests, Diseases and Agriculture in the Tropics
The combination of high temperatures and high humidities characteristic of tropical
lowlands, carries serious drawbacks for tropical agriculture. For many tropical crops the
yields are reduced both in quantity and quality by high temperatures, mainly because
some diseases and pests thrive well under warm conditions. High temperatures and
humidities in the tropics also create highly favourable conditions for the proliferation and
growth of numerous micro-organisms and insects, which spread diseases and pests. They
also encourage rapid and profuse growth of weeds and parasites which can drastically
reduce yield. Losses are not limited to crops on the field; they are equally serious after
harvesting and during storage and transportation.

AGR 205 MODULE 3
80
In Nigeria, crop losses due to pests have been estimated to be of the order of 50 to 60%
of total crop production (Ayoade, 2002). The periodic or seasonal nature of outbreaks of
crop pests and diseases suggests that weather conditions play an important role.
Favourable temperature and humidity conditions encourage the growth and development
of crop pests and disease causing germs. Wind conditions control the transport and
distribution of disease causing germs and spores.
4.0 CONCLUSIONS
Environmental variables in localize areas of the earth‘s surface are very important in influencing
ecological processes such as plant regeneration and growth, soil respiration, nutrient cycling, and
wildlife habitat selection
3.0 SUMMARY
1. Microclimatic variables include temperature, light, wind speed, and moisture which are
useful as indicators for ecological activities.
2. Current ecological research has recognized the importance of microclimate in influencing
ecological process of plant growth and soil
3. Soil temperature is at times, of greater ecological importance to crop life than air
temperature.
4. Physical environment of an ecosystem is modified by human activities and natural
disturbances
5. As temperature conditions are frequently below optimum for most crops, there
exists close a correlation between yields and temperature.
6. The combination of high temperatures and high humidities characteristic of tropical
lowlands, carries serious drawbacks for tropical agriculture.
6.0 TUTOR- MARKED ASSIGNMENT
1. Discuss how physical environment of an ecosystem is being influenced by human
activities
2. Define soil microclimate and explain the influence of temperature and humidity on crop
diseases and pest
7.0 REFERENCE/FURTHER READINGS
Robert J. Naiman, ... Gene E. Likens, in Riparia, 2005
M.S. Fonseca, in Encyclopedia of Ecology, 2008

AGR 205 MODULE 3
81
van Wijk W.R. (1965). Meteorological Monographs
Nieuwolt, S. (1977).Tropical Climatology:An Introduction to theClimates of the Low Latitudes.
ChiChester: John Wiley & Sons.
Ojo, O. (1977). The Climates of West Africa. Ibadan:.Heinemann Educational Books.
AGR 205 MODULE 3
82
UNIT 5 INFLUENCE OF MICROCLIMATE ON AGRICULTURE
CONTENTS
1.0 Introduction
2.0 Objectives
3.0 Main Content
3.1 Effects of moisture on Crop Growth
3.2 Effects of Photoperiodism on Crop Growth
3.3 Microclimate – Livestock Relationship
4.0 Conclusion
5.0 Summary
6.0 Tutor-Marked Assignment
7.0 References/Further Readings
1.0 INTRODUCTION
World over, agriculture is one of the most important economic activities pursued by man and it is
also highly dependent on the weather. There is obvious need to study the relations between
microclimate and agriculture in all climates, but it is particularly important in the tropics.
Climatic conditions in the tropics are generally not as favourable for agriculture as is often
assumed (Nieuwolt, 1977). The luxuriant vegetation in many parts of the tropics and the rapid
growth of plants has erroneously led to the belief that food can be produced with very little effort.
The general relationship between climate and agriculture will be discussed below.
2.0 OBJECTIVES
At the end of this unit, you should be able to:
1. Explain the effects of solar radiation and moisture on crops
2. Explain the relationship between microclimate and pest and diseases on crops
3.0 MAIN CONTENT
3.1 Effects of moisture on Crop Growth
Water is the major constituent of the physiologically active plant tissue; a reagent in
photosynthesis and hydrolytic such as starch digestion; the solvent in which salt, sugar and other
solutes move from cell to cell and organ to organ; and an essential element of the maintenance of
plant turgidity necessary for cell enlargement and growth.

AGR 205 MODULE 3
83
It is not, however, easy to establish a relationship between water stress and the various aspects of
crop function. The relationship varies with crop characteristics, stages of soil development, and
climatic conditions. Water deficiency not only reduces the yield but also changes the pattern of
growth. In general, effective rooting depth decreases as the soil moisture level increases. Roots
developed under limited moisture conditions are finer and have more and longer branches than
roots developed under favourable moisture conditions. The ratio of root to shoot usually is
increased by water stress. Leaf area is often reduced but leaf thickness is increased.
Water deficit in crop has a profound effect in the rate of photosynthesis because dehydrated
protoplasm has lowered photosynthesis capacity. Indirectly, once the leaf looses its turgidity, the
stomata guard cell close, thus preventing any further intake of carbon dioxide for photosynthesis.
In general the respiration rate of crops tends to increase as moisture decreases. This change is
however, much smaller than the accompanying changes in photosynthesis.
Soil moisture which is an important source of moisture to crops is determined by rainfall,
evaporation rate and soil characteristics.
The supply of soil moisture may vary from wilting point when no water is available for crop use
to field capacity when the soil is fully saturated with moisture but is well drained. In a water
logged condition (i.e. when all the soil pores are completely filled with water), free movement of
air within the soil is impeded and compounds toxic to the roots of crops may be formed. At the
opposite end is the condition of drought in which the amount of water required for
evapotranspiration exceeds the amount available in the soil. Drought condition makes crops wilt
and eventually die. Hence, too little or too much water is not good for agriculture.
3.2 Effects of Photoperiodism on Crop Growth
The length of daily exposure to light is known as a photoperiod while the response of crop
development to a photoperiod is called photoperiodism.
Plants are divided into three groups on the basis of their response to the photoperiod namely;
long-day plants, short-day plants and day neutral plants. Long -day crops flower only under day-
light less than 14 hours. Examples are wheat, mustard, oats, burkey, rye and clover. In short day-
crops flowering are induced by short photoperiods of less than 10 hours. Examples are cotton,
millet, corn, beans, cucumber and sweet potatoes. The day neutral crops can form the flower buds
under any period of illumination. Examples are tomato and carrot. Later Allard (1938) added the
fourth group which is designated as intermediate. The intermediate crops flower at a day length
of 12 -14 hours but are inhibited in reproduction by day lengths either above or below this
duration.

AGR 205 MODULE 3
84
Photoperiodism is an important factor in the natural distribution of plants. In general plants that
have originated in low latitude require short- day for flowering while those from high latitudes
are long- day plants. When the latter are moved to low latitudes they will not produce blossom.
When the low latitudes plants are grown in high latitudes they will continue to grow vegetatively
until they are killed by frost.
3.3 Microclimate – Livestock Relationship
Weather and climate influence livestock directly or indirectly in three important ways. First,
climate conditions affect the availability of water for animal consumption and determine the
type, quantity and quality of pastures available for animal feed. Second, weather and climate
have direct effects on animals and their body physiologic functions. Third, weather and climate
affect livestock production indirectly by determining the type of animal pests and diseases that
would be prevalent in a given area.
The distribution of animals is affected by the availability and reliability of water supplies. The
distribution of precipitation over a given area provides a rough guide to the availability of water
in an area. Areas with little or no rainfall are deficient in water while areas of abundant rainfall
have plenty of water, all things being equal. Humid climates are however not very favourable for
most types of livestock because of the numerous pests and diseases such climatic breeds. Again,
climates promote forest ecosystems, whereas livestock prefer grass ecosystems, such grass
ecosystems of the world as the African savanna the veldt of South of Africa, the steppes of
Russia, the downs of Australia, the pampas of Argentina and the prairies of North America.
4.0 CONCLUSION
Microclimates have direct influences on crop and animal production through moisture, humidity
and the indirect influence on pest and diseases
5.0 SUMMARY
1. Microclimate of an environment determines the choice of crops that can be produced in
an area
2. Microclimate creates favourable conditions for the proliferation of numerous
microorganisms and insects which spreads pests and diseases
3. Moisture serves to regulate heat on both crops and livestock
4. Photoperiodism is an important factor in the natural distribution of plants.
6.0 TUTOR-MARKED ASSIGNMENT
1. Explain the direct and indirect influences of climate on crop growth
2. Discuss the effects of photoperiodism on crop growth and development

AGR 205 MODULE 3
85
3. Highlight the importance of moisture on tropical agriculture
7.0 REFERENCES/FURTHER READINGS
Ayoade, J.O. (1983). Introduction to Climatology for the Tropics.
ChiChester: John Wiley and Sons.
Ayoade, J.O. (2002).Introduction to Agro climatology. Ibadan: Vantage Publishers.
Nieuwolt, S. (1977).Tropical Climatology:An Introduction to theClimates of the Low Latitudes.
ChiChester: John Wiley & Sons.
Ojo, O. (1977). The Climates of West Africa. Ibadan:.Heinemann Educational Books.