soil & more international b.v. -...
TRANSCRIPT

Soil & More International Page 1 of 45
Soil & More International B.V.
March 2010
Comprehensive Carbon Footprint Assessment
Dole Bananas
Soil & More International Page 2 of 45
Title Comprehensive Carbon Footprint Assessment
Dole Bananas
Author Boki Luske
T: +31 188 007 95 02
Date March 2010
Copyright No part of this publication may be reproduced
in any form by print, photo print, microfilm or
any other means without permission of Soil &
More International.
Disclaimer Neither Soil & More International, nor its
partners, accepts any liability whatsoever for
any direct or consequential loss however
arising from any use of this document or its
contents or otherwise arising in connection
herewith.
Contact
address
Soil & More International
Transportweg 23
2742 RH Waddinxveen
The Netherlands
T: +31 088 007 95 00
F: +31 (0)180 890 420
W: www.soilandmore.com
Soil & More International Page 3 of 45
Content
Content ........................................................................................................ 3
Summary ...................................................................................................... 4
Acronyms and Glossary ................................................................................ 5
1 Public Awareness and Market Developments ............................................ 7
2 General information ................................................................................ 10
2.1 Introduction ................................................................................. 10
2.2 Company profile ............................................................................ 10
2.3 Background information ................................................................. 10
2.4 Goals of a Carbon Footprint ............................................................ 11
2.5 Functional unit .............................................................................. 11
3 Methodology............................................................................................ 12
3.1 General methodology .................................................................... 12
3.2 System boundary and scopes ......................................................... 12
3.3 Data sources ................................................................................ 14
3.4 Allocation with co-production .......................................................... 15
3.5 Exclusions .................................................................................... 15
4 Greenhouse Gas Inventory ...................................................................... 16
4.1 Farming stage .............................................................................. 16
4.2 Packaging stage ............................................................................ 20
4.3 Terminal and port operations and overseas transport ........................ 22
4.4 Ripening stage .............................................................................. 26
4.5 Distribution and retail stage ........................................................... 27
4.6 Losses in the production chain ........................................................ 27
4.7 Extra emissions due to exclusions ................................................... 27
5 Results .................................................................................................... 28
5.1 Total Carbon Footprint ................................................................... 28
5.2 Results per processing phase .......................................................... 30
6 Emission Reduction Potential .................................................................. 34
6.1 Emission calculations ..................................................................... 34
6.2 Emission reduction within the supply chain ....................................... 34
7 References .............................................................................................. 36
8 Annexes .................................................................................................. 38
Annex 1. Emission factors .................................................................... 38
Annex 2. Soil emissions ....................................................................... 40
Annex 3. Age of farms and representativeness of data ............................ 43
Annex 5. All results ............................................................................. 45
Soil & More International Page 4 of 45
Summary
This study aims to calculate the carbon footprint of bananas originating
from Dole plantations in Costa Rica which are sourced to German
supermarkets.
The approach chosen is “cradle-to–gate”, which means that the raw
materials are the start of the production chain and the study ends at the
retail shelf.
The study describes and defines the sources of greenhouse gas emissions
within the whole supply chain, including the production of input materials
that are used in the different production phases of bananas.
The phases included in the analysis are farming, packaging, inland
transportation, shipping, ripening and distribution.
The methodology that has been used to define the system boundaries and
the allocation method is in line with the PAS 2050, the ISO standard
14044 and verified by TÜV-Nord according to their standard.
Most of the data originates from Dole’s internal systems, including the
data from the overseas transport. However, in some cases estimates have
been made or secondary data has been used.
The results indicate that the carbon footprint of the bananas amounts to
1124 kg CO2e per ton of bananas.
Most of the emissions are related to the overseas transport. Also the
emissions related to fertilizer use have a significant impact on the total
carbon footprint of bananas.
Soil & More International Page 5 of 45
Acronyms and Glossary
Allocation Partitioning the input or output flows of a process or a
product system between the product system under study and one more other product system
Carbon Credit Certificate that represents 1 ton of CO2e that is generated by emission reduction projects
Carbon Footprint Sum of all GHG emissions produced by the product’s life
cycle (within the defined boundary)
Carbon label Quantitative or qualitative label on a product that
displays the carbon footprint of a product
Carbon neutral Emissions related to a product that have been compensated by the purchase of carbon credits
CH4 Methane Gas which has a GWP of 25 CO2e
CO2e Carbon Dioxide Equivalent
Co-products Products that originate from the same raw material
Functional Unit Quantified performance of a product system for use as a reference unit
GHG Greenhouse Gas
GWP Global Warming Potential
Input Products, material or energy flow that enters a unit process
IPPC Intergovernmental panel on climate change
ISO 14044 International standard for life cycle assessments, developed by ISO in 2006
Kyoto Protocol International treaty with the goal of achieving
“stabilization of greenhouse gas concentrations in the
atmosphere at a level that would prevent dangerous anthropogenic interference with the climate system”
Life Cycle Assessment Compilation and evaluation of the inputs, outputs and
the potential environmental impacts of a product system
throughout its life cycle
Life cycle Consecutive and interlinked stages of a product system, from raw materials acquisition to final disposal
N2O Nitrous Oxide which has a GWP of 298 CO2e
Soil & More International Page 6 of 45
Output Product, material or energy flow that leaves a unit process
PAS 2050 First international standard for carbon footprint assessments, developed by Carbon Trust in 2008
Product system Collection of all processes which model the life cycle of a
product
Scope 1 Direct GHG emissions that occur on the company itself
Scope 2 Indirect emissions that occur elsewhere due to the
generation of purchased electricity consumed by the company
Scope 3 All other indirect emissions (e.g. due to production of
purchased inputs and transport) that are related to the
product
System boundary Set of criteria specifying which unit processes are part of a product system
UNFCCC United Nations Framework Convention on Climate Change
VER Voluntary Emission Reduction or Verified Emission Reduction, also called Carbon Credit
Soil & More International Page 7 of 45
1 Public Awareness and Market Developments
Over the past few years, interest in global warming and climate change has
grown exponentially. People have realized that it is time to act. The Kyoto
Protocol1 - initially adopted for use on 11 December 1997 in Kyoto, Japan and
entering into force on 16 February 2005 – requires specific countries (developed
nations) to meet reduction targets of GHG emissions relative to their 1990 levels
during the period of 2008 to 2012. Thus, many governments are developing
initiatives to reduce GHG emissions through national policies, such as emissions
trading programs, carbon or energy taxes, regulations and standards on energy
efficiency and emissions. Global warming and climate change are viewed as part
of any sustainable development strategy. It is therefore crucial for companies to
be able to identify, analyze and understand their GHG risks in order to develop a
sustainable risk management strategy. Only then can companies be successful in
a competitive business environment for the long run.
Besides politicians, governmental authorities and organizations, another powerful
group - which is the “consumer on the street” - increasingly pays attention to
issues related to climate change and sustainability. The consumers’ expectations
have changed. Consumers will give preference to products which offer more than
just a single quality claim. Recently published studies around the globe clearly
show the consumers changing behavior and its willingness to pay more for
sustainable foods. In a study on the “new” lifestyle of health and sustainability
(LOHAS) carried out by Ernst & Young, the authors conclude that “consumers are
not only more demanding about their product choices for their own benefit, but
also realize the direct and indirect impact of their consumption on the
environment. Attributes like “organic farming”, “fair trade”, and “sustainability”
are becoming increasingly anchored in the consumers mind (LOHAS, 2004).
To meet these changing consumer expectations and to help mitigate climate
change, many initiatives related to carbon footprinting and carbon labeling were,
and are still being developed worldwide. Involved stakeholders are mainly retail
chains and labeling organizations that are driven by global warming and climate
change on the one hand, and by above mentioned consumer expectations on the
other hand. Nearly one out of two consumers are willing to pay more for
sustainable products (GfK, 2008), and carbon labeling is part of sustainability in
this regard.
The initiator of carbon footprinting and labeling schemes related to climate
friendliness of products was the British retail chain Tesco. Meanwhile, a number
of other initiatives have been developed (figure 1).
In reaction to this, Soil & More International developed a climate neutral product
label for products of which the GHG emissions related to their life cycle were
determined, calculated and offset (figure 2). The calculated carbon footprint of
such products was certified by TÜV-Nord CERT GmbH and launched at Deko and
BioMarché in the Benelux countries in 2007. All these different initiatives clearly
indicate that carbon labeling already is a unique selling point, which buyers and
consumers will acknowledge when making their purchase decision.
1 The Kyoto Protocol is a protocol to the United Nations Framework Convention on Climate Change (UNFCCC or FCCC), an international environmental treaty with the goal of achieving “stabilization of greenhouse gas concentrations in the atmosphere at a level that would prevent dangerous anthropogenic interference with the climate system” (www.unfccc.com).
Soil & More International Page 8 of 45
A list of worldwide initiatives related to carbon footprinting and carbon labeling is
displayed below (www.climatechangecorp.com):
BSI Standards Solutions led development of PAS 2050 (Publicly Available
Specification) at the request of Defra (Department for Environment, Food
and Rural Affairs) and the Carbon Trust. PAS 2050 is a standard for carbon
footprint assessment of goods and services and to date, it is the most
comprehensive standard that provides guidelines on how to assess carbon
footprint of a product and services. Tesco, the British retail chain, was the
largest test of the PAS 2050 draft product carbon footprinting method and
the Carbon Trust Carbon Reduction Label.
The French supermarket chain Casino was the first supermarket in Europe
that initiated carbon labeling. The label is called “l’Indice Carbone” and is a
quantitative label for their own products. The methodology was developed
by the Bio Intelligence Service (Bio IS). The supermarket chain E. Leclerc
was also one the first French companies to introduce voluntary carbon
labeling. Both these French labels were developed in cooperation with the
French Environment and Energy Agency (Ademe).
Migros, a Swiss supermarket chain, introduced its own product labeling
program. Migros label “Climatop” is displayed on the supermarket’s
products if the product’s emissions are 20% lower than those of its
counterparts within the same product category.
The European Eco label also aims to indicate the amount of emissions on
its label. However, the label will not be quantitative but qualitative.
In the US, Carbon Fund created a label called “Certified Carbon Free”. This
was done in cooperation with Carbon Trust and the calculated carbon
footprint of the product was offset.
The Californian Climate Conservancy, a spin off from Stanford University,
developed the “Climate Conscious” label, rating products and the GHG
emissions due to their production, thus classifying products into gold,
silver or bronze products.
KRAV (organic standards association) in Sweden is currently developing a
carbon footprint label for locally produced food products.
In Germany, WWF (World Wide Fund for Nature), the Öko-Institut, PIK
(the Potsdam Institute for Climate Impact Research) and THEMA 1
coordinated a pilot project for a labeling scheme for carbon labels.
The Californian Carbon Label aims to standardize the carbon footprint of
companies and oblige companies to give their input and output data.
The Canadian organization CarbonCounted developed a Carbon Counted
logo for companies.
Other countries that are assessing carbon labeling are China, Japan,
South-Korea, Australia and Finland.
Figure 1. Different carbon labeling initiatives that have been launched recently.
Soil & More International Page 9 of 45
The Soil & More label differentiates from other labels, as the offsetting takes place
within the agricultural sector. Soil & More’s emission reduction projects are
composting projects in developing countries, where green waste is composted to
ensure soil fertility. In Soil & More’s vision, soil degradation is one of the world’s
most important environmental and agricultural problems and composting of
organic materials enhances soil fertility, reduces climate change effect, water use
and amount of waste.
Figure 2. If the CO2 emissions which occur within the supply chain of a product are compensated by the purchase of an equal amount of carbon credits (verified by TÜV-Nord), products can be labeled with the Climate Neutral logo displayed above.
Soil & More International Page 10 of 45
2 General information
2.1 Introduction
This carbon footprint calculation was carried out by Soil & More International B.V.
and its representative, Boki Luske, upon request of Dole Food Company.
This study aims to layout and calculate a comprehensive CO2e (carbon dioxide
equivalent) footprint of bananas. The term “carbon footprint” stands for the total
sum of all greenhouse gas emissions caused by a product’s life cycle. The system
boundaries of the footprint are defined in section 3.2.
The term greenhouse gas emissions stands for compressible fluids that were
attributed a coefficient for their global warming potential by the
Intergovernmental Panel on Climate Change (IPCC). This study includes different
greenhouse gases that are emitted during different stages of a product’s life
cycle: carbon dioxide (CO2), methane (CH4), nitrous oxide (N2O), CFCs and
HCFCs. In the following footprint, all identified greenhouse gases are converted
into CO2e by multiplying them with the GWP value.
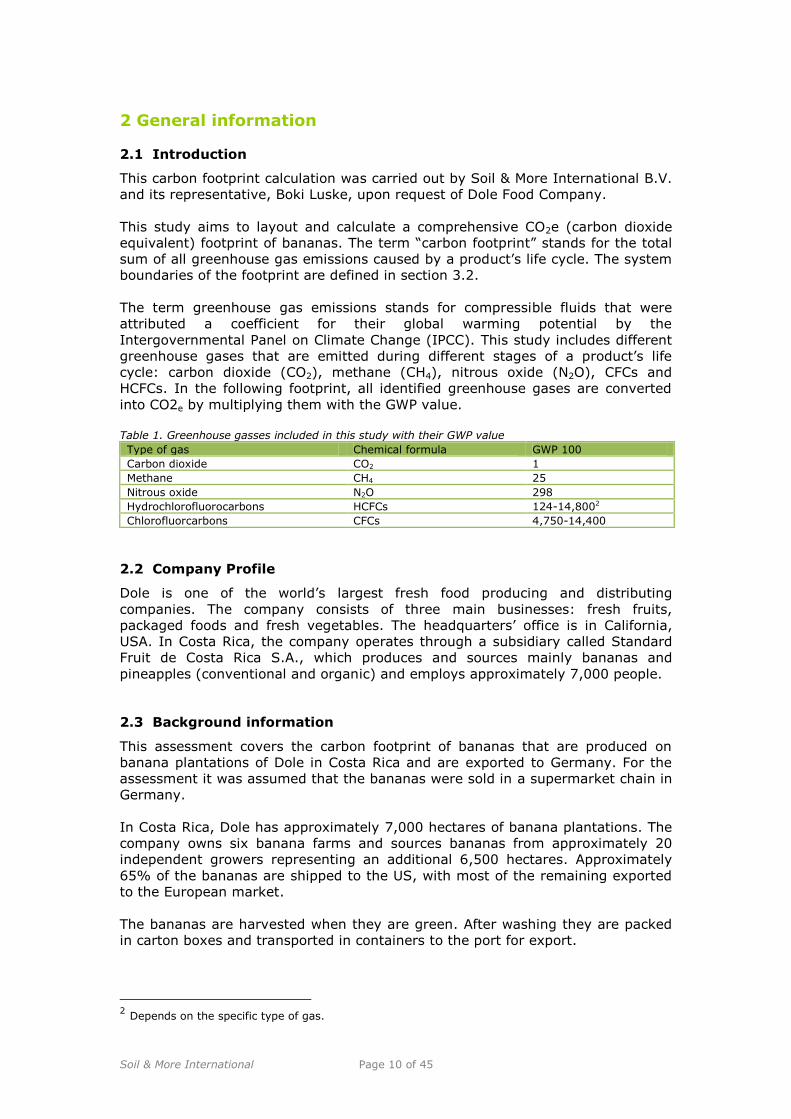
Table 1. Greenhouse gasses included in this study with their GWP value
Type of gas Chemical formula GWP 100
Carbon dioxide CO2 1
Methane CH4 25
Nitrous oxide N2O 298
Hydrochlorofluorocarbons HCFCs 124-14,8002
Chlorofluorcarbons CFCs 4,750-14,400
2.2 Company Profile
Dole is one of the world’s largest fresh food producing and distributing
companies. The company consists of three main businesses: fresh fruits,
packaged foods and fresh vegetables. The headquarters’ office is in California,
USA. In Costa Rica, the company operates through a subsidiary called Standard
Fruit de Costa Rica S.A., which produces and sources mainly bananas and
pineapples (conventional and organic) and employs approximately 7,000 people.
2.3 Background information
This assessment covers the carbon footprint of bananas that are produced on
banana plantations of Dole in Costa Rica and are exported to Germany. For the
assessment it was assumed that the bananas were sold in a supermarket chain in
Germany.
In Costa Rica, Dole has approximately 7,000 hectares of banana plantations. The
company owns six banana farms and sources bananas from approximately 20
independent growers representing an additional 6,500 hectares. Approximately
65% of the bananas are shipped to the US, with most of the remaining exported
to the European market.
The bananas are harvested when they are green. After washing they are packed
in carton boxes and transported in containers to the port for export.
2 Depends on the specific type of gas.
Soil & More International Page 11 of 45
After arrival in the terminal in Puerto Moín, the refrigeration units on the
containers are connected to an electric power source. Refrigeration delays the
banana ripening process. When the European vessel arrives in the port, it is
loaded with bananas that have been stored at the terminal yard and also by
containers that arrive directly from the farm to the vessel. Virtually all the
bananas travelling to Europe are loaded on pallets into the refrigerated holds of
the ship. After arrival in Europe (Antwerp or Hamburg) the bananas are
discharged and stored in refrigerated warehouses. They are subsequently
dispatched to different ripening facilities in Hamburg and Roisdorf. After ripening,
the bananas are then transported to several distribution centers in Germany and
then on to supermarkets.
2.4 Goals of a carbon footprint
This assessment results in the carbon footprint for bananas. The goal is to
identify sources of greenhouse gas emissions and to calculate the amount of such
gases emitted due to the assessed banana life cycle. The carbon footprint serves
to identify the environmental performance of a specific product as to greenhouse
gas emissions, thus assessing its impact on climate change.
Further goals of this carbon footprint are:
to collect information for the company in order to reduce GHG emissions
to identify cost saving opportunities for the company
to demonstrate environmental and responsible leadership of the company
to receive recognition for an early voluntary action
to respond to changing consumer expectations (see chapter 1)
The comprehensive carbon footprint has been verified and certified by an
independent third party, TÜV-NORD CERT GmbH. TÜV-NORD is accredited by the
UNFCCC (United Nations Framework Convention on Climate Change)3 to carry out
audits of emission reduction projects and therefore has the technical knowledge
on climate issues to carry out certifications.
Upon certification of the assessment by an accredited third party, the emissions
related to the product’s life cycle may be offset through the purchase of emission
rights or carbon credits.
2.5 Functional Unit
A functional unit is the quantified performance of a product for use as a reference
unit in a given assessment4. For this comprehensive carbon footprint assessment,
the functional unit was identified to be 1 ton of final product. The term “final
product” refers to the product which is placed on the retail shelf, ready to sell.
Therefore, all greenhouse gas emissions caused by the primary production stage,
the processing stage, and the retail and transportation stage of bananas are
broken down to a quantified unit of 1 ton final product.
3 Signed in 1992 at the Rio Earth Summit, the UNFCCC is a milestone Convention on Climate Change
Treaty that provides an overall framework for international efforts to mitigate climate change. The Kyoto Protocol is a protocol of the UNFCCC. 4 Guide to PAS 2050, how to assess the carbon footprint of goods and services, page 57.
Soil & More International Page 12 of 45
3 Methodology
3.1 General methodology
The methodology used for this assessment was developed by Soil & More and is
based upon the ISO 14044 standard and the PAS 2050.
3.2 System boundary and scopes
In this chapter, the system boundary, as well as the scopes of the assessed
bananas will be described. The term boundary refers to the set of criteria
specifying which unit processes are part of a product’s life cycle and are therefore
accounted for in the carbon footprint of a specific product. Once the system
boundary has been defined, the greenhouse gas emissions arising during the
different stages of the product’s life cycle will be identified and assigned to three
different scopes, as introduced by the WRI (World Resource Institute) and the
WBCSD (World Business Council for Sustainable Development) in the Greenhouse
Gas Protocol.
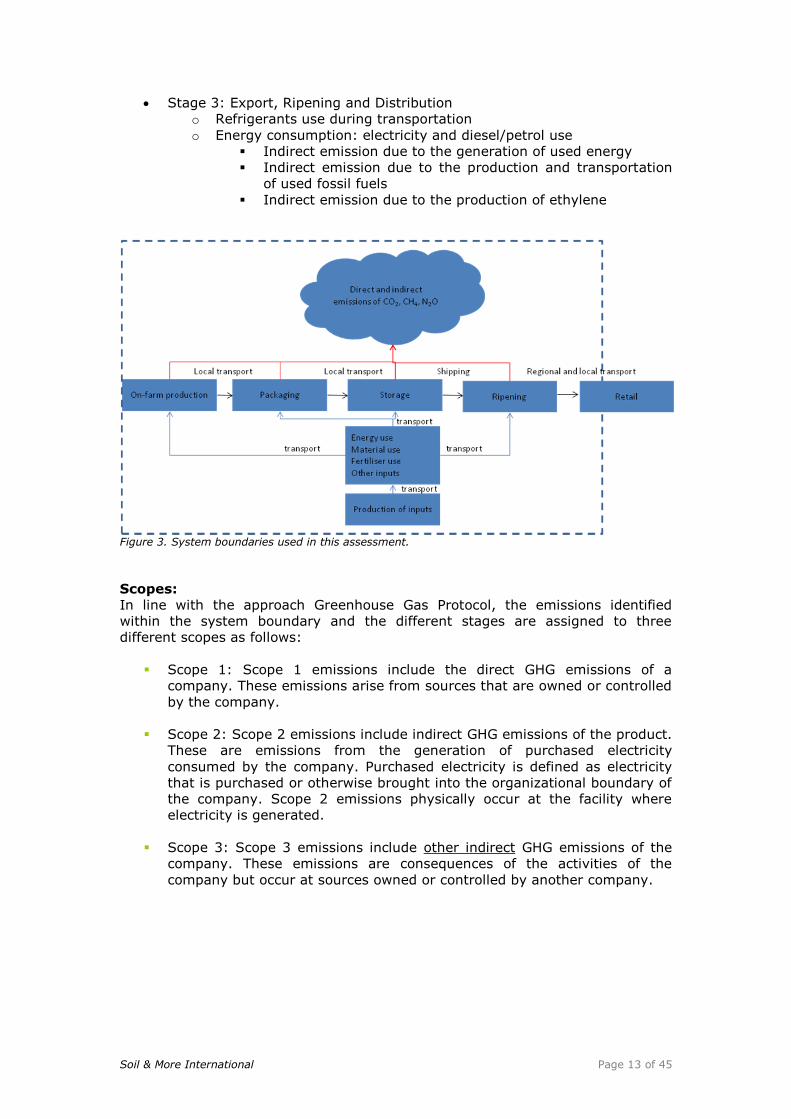
System boundaries
The carbon footprint includes the greenhouse gas emissions that are released
during different stages of the life cycle of bananas. The inputs and outputs are
analyzed for every production stage, and emissions related to production and
transportation are calculated.
The emissions that are directly emitted during one stage as well as the indirect
emissions are taken into account. For instance, the combustion of fossil fuels
causes a direct emission in a production or transport phase but the production of
fossil fuels is also related to greenhouse gas emissions. The latter one is called an
indirect emission.
For every production stage the inputs and outputs are inventoried. This means
that the yield (of main and co-products) is inventoried, just like the amount of
discarded products.
The following stages in the life cycle of bananas are included:
Stage 1: Farming
o Energy consumption: electricity and diesel/petrol for tractors and
other equipment
o Soil emissions (see annex 2 for the calculation method of direct and
indirect soil emissions related to fertilizer use)
o Transport to next stage
Indirect emissions due to the manufacturing and
transportation of agricultural inputs
Indirect emission due to the generation of used energy
Indirect emission due to the production and transport of
used fossil fuels
Stage 2: Packing
o Energy consumption: electricity and diesel/petrol use
Indirect emissions due to the manufacturing and
transportation of packing inputs (e.g. packaging materials)
Indirect emission due to the generation of used energy
Indirect emission due to the production and transportation
of used fossil fuels
Soil & More International Page 13 of 45
Stage 3: Export, Ripening and Distribution
o Refrigerants use during transportation
o Energy consumption: electricity and diesel/petrol use
Indirect emission due to the generation of used energy
Indirect emission due to the production and transportation
of used fossil fuels
Indirect emission due to the production of ethylene
Figure 3. System boundaries used in this assessment.
Scopes:
In line with the approach Greenhouse Gas Protocol, the emissions identified
within the system boundary and the different stages are assigned to three
different scopes as follows:
Scope 1: Scope 1 emissions include the direct GHG emissions of a
company. These emissions arise from sources that are owned or controlled
by the company.
Scope 2: Scope 2 emissions include indirect GHG emissions of the product.
These are emissions from the generation of purchased electricity
consumed by the company. Purchased electricity is defined as electricity
that is purchased or otherwise brought into the organizational boundary of
the company. Scope 2 emissions physically occur at the facility where
electricity is generated.
Scope 3: Scope 3 emissions include other indirect GHG emissions of the
company. These emissions are consequences of the activities of the
company but occur at sources owned or controlled by another company.
S T A ND A R D
Soil & More International Page 14 of 45
3.3 Data sources
Different forms of data may be taken to carry out a comprehensive carbon
footprint. The most commonly used types of data are:
Primary activity data: data taken from documents or computer systems
(financial accounting) that are directly linked to the specific assessment,
such as electricity invoices to calculate emissions caused by electricity.
Secondary data: such as databases, studies, and reports.
Assumptions: assumptions made based on internationally recognized
standards and studies.
Wherever possible, primary data was used to carry out this carbon footprint. In
case such primary data wasn’t available, secondary data was used. In case the
sources of this secondary data proved to be unreliable, assumptions were made.
The analysis of data was carried out on the basis of the following criteria:
Completeness: a comprehensive carbon footprint assessment must be
based on complete data, as too many assumptions might distort the final
result.
Reliability: data must be taken from reliable sources. It should be
transparent and traceable.
Accuracy: data must be as accurate as possible, including data related to
the specific process, product or company.
Time frame: data must be taken from one particular, clearly defined
period in time (which is usually a period of 12 months).
Geographical affiliation: specific data for the assessed region or country
must be taken for the assessment.
In the case of uncertainty or several different data sources, the most
conservative approach was chosen. That means the value causing the highest
amount of emissions was taken for the calculation.
In general, it is advisable to use as much primary data as possible so that the
actual emissions can be quantified in a more understandable way and
opportunities to improve efficiency can be easily identified.
For this assessment all primary activity data was collected from the year 20085.
Dole has a comprehensive accounting system that registers the costs of all the
products that are used and produced within the company. Apart from this system,
Dole has been working on the determination of their greenhouse gas emissions.
The calculations are connected to the accounting system and the same computer
system has been used to derive the data for this assessment. In some cases,
such as the use of plastic on the farm, not all information was available and
estimations were done.
The analyzed plantations, packing facilities, the terminal in Puerto Moín, the port
and the aerial spraying facilities were visited by the author of this study in 2009.
The secondary data, such as emission factors related to the production of input
materials were derived from different databases and studies. The year, accuracy
and age of this data are also mentioned in the assessment.
5 Unless stated otherwise
Soil & More International Page 15 of 45
3.4 Allocation with co-production
In general, during different processing steps, one raw material is used to produce
many different products (co-products) and the “upstream” emissions (gasses that
are emitted in earlier processing steps) have to be assigned to the different
products. This division of upstream environmental effects is called “allocation”
and can be done in several ways.
In this study, economic allocation is used for situations where the absolute or
relative price and the mass balance are known. A combination of the two
determines the allocation factors as shown in the table below. Mass allocation is
used in the situation where prices are unknown, or in situations where economic
allocation is not applicable (for instance, transport of different products in one
truck or packaging of many different products in one pack house). In this
document the used allocation method and allocation factors are mentioned for
each process phase.
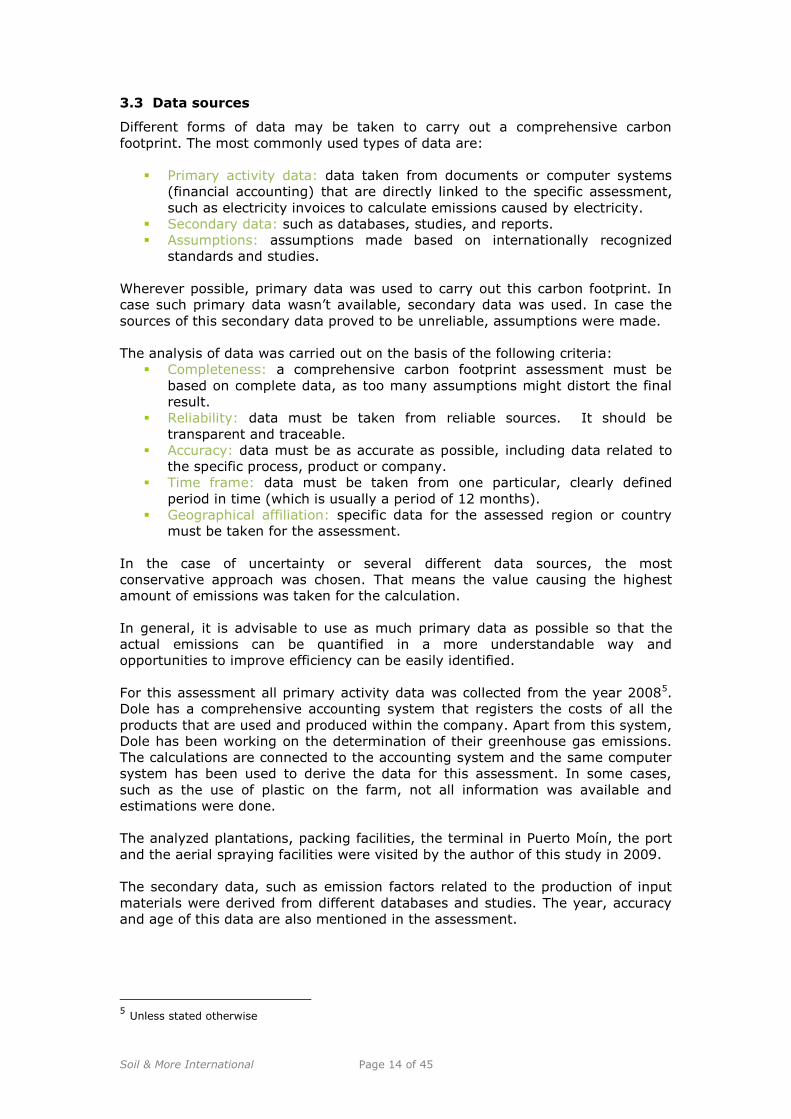
Mass balance of
co-products and mass allocation factor
Relative economic value of co-products
Mass* price Economic allocation factor
Co-product 1 60% 1 60 43%
Co-product 2 40% 2 80 57%
Total 100% 140 100%
3.5 Exclusions
In general the following sources of emissions are not included in the carbon
footprint:
The user phase of products is not included in the carbon footprint, as it
has a high level of uncertainty and the estimated emissions during the
user phase on the eventual carbon footprint is only minor.
The waste/recycling phase of the product is excluded because of high
uncertainty.
Land use change is a major worldwide source of greenhouse gas
emissions, but the methodology on how to allocate it to different products
is still under development and is therefore excluded in this assessment6.
Emissions from the production of capital goods (such as trucks, airplanes
and buildings).
Travelling of employees to and from their place of work.
Human energy requirements.
Animals providing transport services.
Transport of consumers to and from retail.
6 According to the PAS2050, land use changes from less than 20 years are taken in to account. The
last banana plantation developed by Dole was Bananito farm in 1990. The banana plantations La Estrella and Rio Frio date back from 1955 and 1968 (annex 3).
Soil & More International Page 16 of 45
4 Greenhouse Gas Inventory
4.1 Farming stage
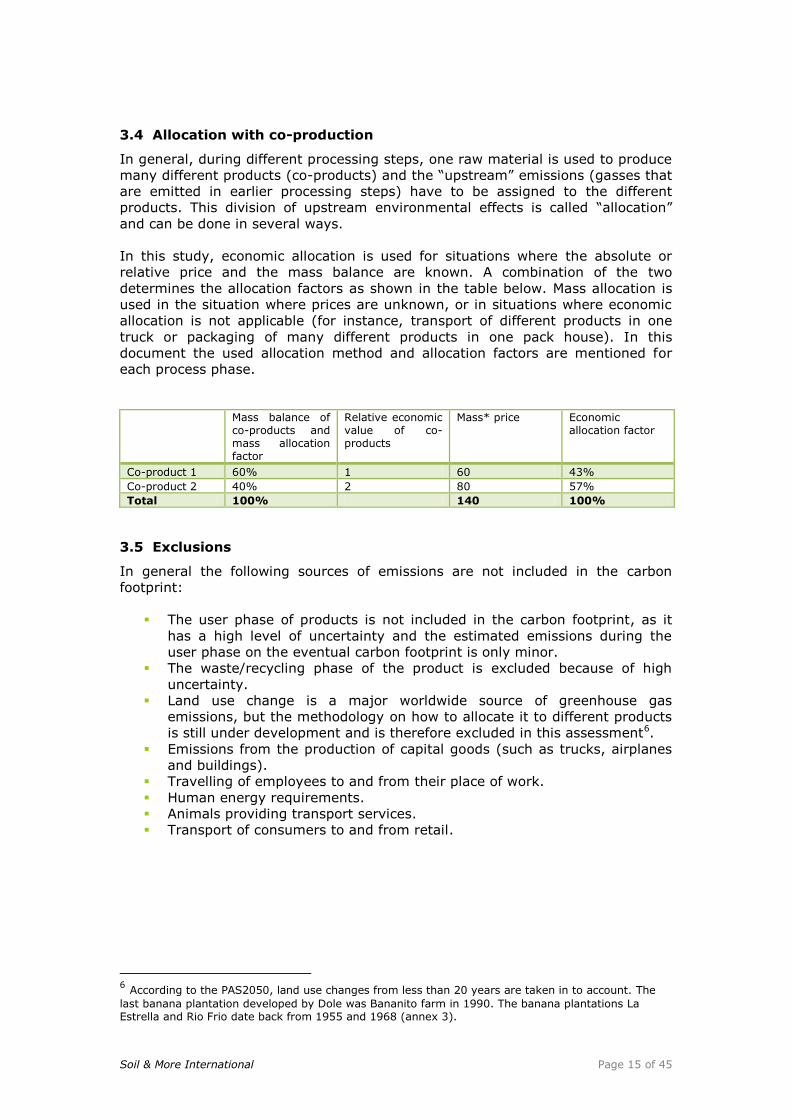
Location of the banana plantations
The banana plantations of Dole in Costa Rica are all situated on the Eastern side
of the country near the Atlantic Coast. Bananas that are of export quality are
packed at the plantations and transported by rail or by trucks to Puerto Moin.
From here the product is shipped to different continents. Some of the yield is not
suitable for export and is sold to a local company that makes processed banana
products.
For this study, data from two banana plantations was inventoried and used to
calculate the average. Valle de la Estrella and Rio Frio are banana plantations of
Dole covering 1,384 and 1,479 hectares respectively. The plantations are situated
in the south eastern and central eastern region of Costa Rica.
Figure 4. Geographical location of the banana plantations in Costa Rica.
Process description
The banana plantations of Dole are monocultures of the Cavendish species.
Because the plants are triploid, they don’t produce seeds but are propagated from
offshoots. After the first planting of banana shoots, it takes 9 months until the
first bunch of bananas can be harvested. When a mother plant is harvested the
plant is cut and the offshoot or “sucker” that is already present grows next to it
and starts to grow and develop fruit. The offshoot can be harvested 14 weeks
later. This system can go on for many years. At a banana plantation only one
sucker is allowed to grow at one time from a mother plant, so if more suckers
develop they are removed. The banana bunches are harvested by hand. The
banana stems are attached to steel cables and special pulleys which are hauled
by mules from the plantation towards the packing facility that is located on the
farm itself.
Soil & More International Page 17 of 45
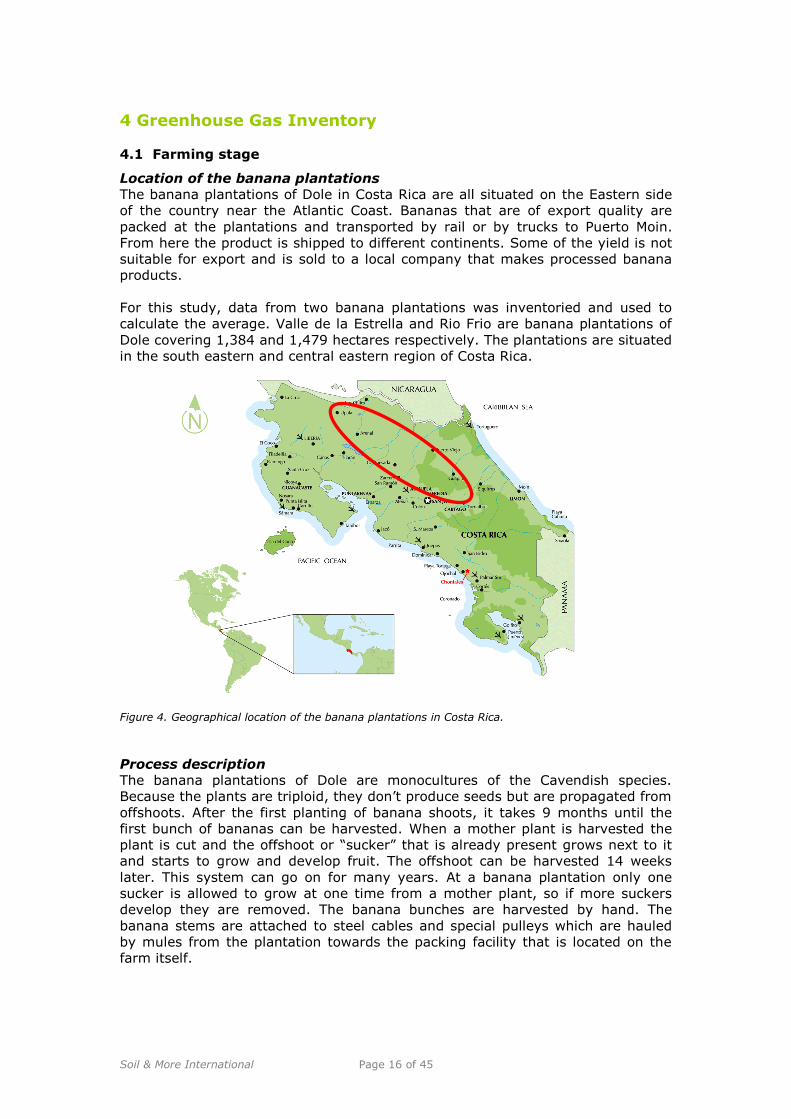
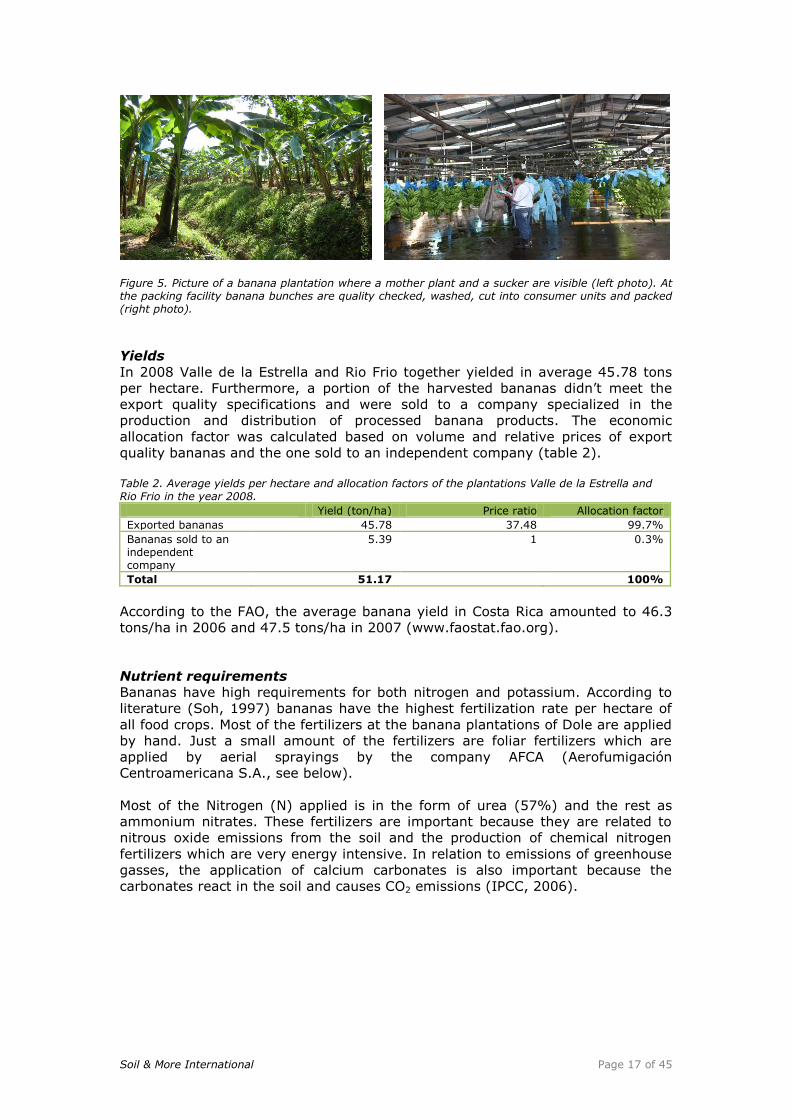
Figure 5. Picture of a banana plantation where a mother plant and a sucker are visible (left photo). At the packing facility banana bunches are quality checked, washed, cut into consumer units and packed (right photo).
Yields
In 2008 Valle de la Estrella and Rio Frio together yielded in average 45.78 tons
per hectare. Furthermore, a portion of the harvested bananas didn’t meet the
export quality specifications and were sold to a company specialized in the
production and distribution of processed banana products. The economic
allocation factor was calculated based on volume and relative prices of export
quality bananas and the one sold to an independent company (table 2).
Table 2. Average yields per hectare and allocation factors of the plantations Valle de la Estrella and Rio Frio in the year 2008.
Yield (ton/ha) Price ratio Allocation factor
Exported bananas 45.78 37.48 99.7%
Bananas sold to an independent company
5.39 1 0.3%
Total 51.17 100%
According to the FAO, the average banana yield in Costa Rica amounted to 46.3
tons/ha in 2006 and 47.5 tons/ha in 2007 (www.faostat.fao.org).
Nutrient requirements
Bananas have high requirements for both nitrogen and potassium. According to
literature (Soh, 1997) bananas have the highest fertilization rate per hectare of
all food crops. Most of the fertilizers at the banana plantations of Dole are applied
by hand. Just a small amount of the fertilizers are foliar fertilizers which are
applied by aerial sprayings by the company AFCA (Aerofumigación
Centroamericana S.A., see below).
Most of the Nitrogen (N) applied is in the form of urea (57%) and the rest as
ammonium nitrates. These fertilizers are important because they are related to
nitrous oxide emissions from the soil and the production of chemical nitrogen
fertilizers which are very energy intensive. In relation to emissions of greenhouse
gasses, the application of calcium carbonates is also important because the
carbonates react in the soil and causes CO2 emissions (IPCC, 2006).
Soil & More International Page 18 of 45
Pest and disease control
Especially in humid countries such as Costa Rica, banana plantations use
relatively high amounts of fungicides to protect the plants for the Black Sigatoka
fungus which causes significant loss of leaf area and yield reductions. The
company that performs the sprayings for Dole is called AFCA. AFCA uses a GPS
system to optimize the spraying activities that automatically open and close the
spray valves of the plane during flight. On average, the applications are done
every 4 to 7 days depending upon the incidence of the disease.
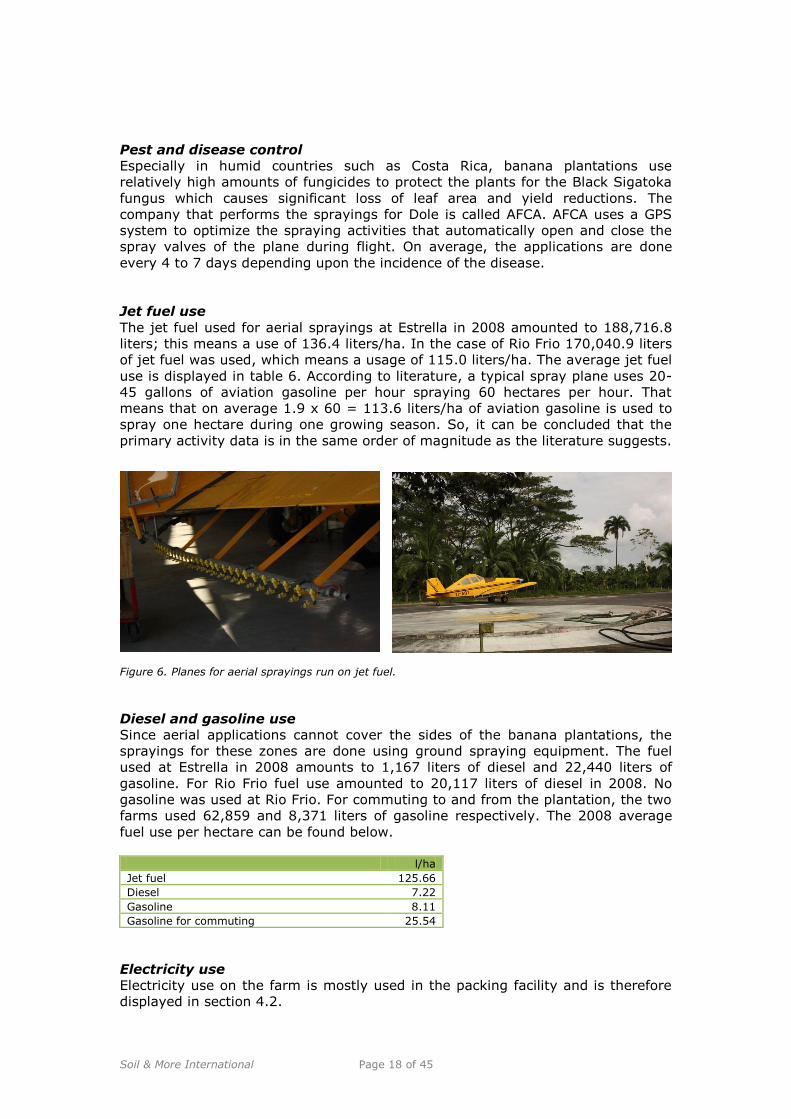
Jet fuel use
The jet fuel used for aerial sprayings at Estrella in 2008 amounted to 188,716.8
liters; this means a use of 136.4 liters/ha. In the case of Rio Frio 170,040.9 liters
of jet fuel was used, which means a usage of 115.0 liters/ha. The average jet fuel
use is displayed in table 6. According to literature, a typical spray plane uses 20-
45 gallons of aviation gasoline per hour spraying 60 hectares per hour. That
means that on average 1.9 x 60 = 113.6 liters/ha of aviation gasoline is used to
spray one hectare during one growing season. So, it can be concluded that the
primary activity data is in the same order of magnitude as the literature suggests.
Figure 6. Planes for aerial sprayings run on jet fuel.
Diesel and gasoline use
Since aerial applications cannot cover the sides of the banana plantations, the
sprayings for these zones are done using ground spraying equipment. The fuel
used at Estrella in 2008 amounts to 1,167 liters of diesel and 22,440 liters of
gasoline. For Rio Frio fuel use amounted to 20,117 liters of diesel in 2008. No
gasoline was used at Rio Frio. For commuting to and from the plantation, the two
farms used 62,859 and 8,371 liters of gasoline respectively. The 2008 average
fuel use per hectare can be found below.
l/ha
Jet fuel 125.66
Diesel 7.22
Gasoline 8.11
Gasoline for commuting 25.54
Electricity use
Electricity use on the farm is mostly used in the packing facility and is therefore
displayed in section 4.2.
Soil & More International Page 19 of 45
Use of plastics
To protect the banana bunches from insects during their growth they are covered
with plastic. To minimize plastic use, the plantations in Costa Rica re-use the
plastic. On average, one bag can be used 3 times before it is damaged and
needs to be renewed. In case of damage the plastics are collected and recycled
by the company Recyplast. The use of plastic per hectare has been estimated by
multiplying the number of bunches that are harvested per hectare per year with
the weight of a plastic bag (0.025 kg). Then a re-use rate of 30% was assumed.
The yearly amount of plastic was therefore estimated as 17.77 kg LLDPE (linear
low-density polyethylene) per ha/yr.
Transport to the packaging facility
Transport by mules of the banana bunches from the field to the packing facility
occurs via steel cables that move like a conveyer belt. As mentioned in the
methodology section, emissions due to animals are excluded from the
assessment. The packing facility is located on the farm itself. To protect the
bananas from damage, plastic is put in-between the banana clusters. This plastic
is recycled at the plantation.
Soil & More International Page 20 of 45
4.2 Packing stage
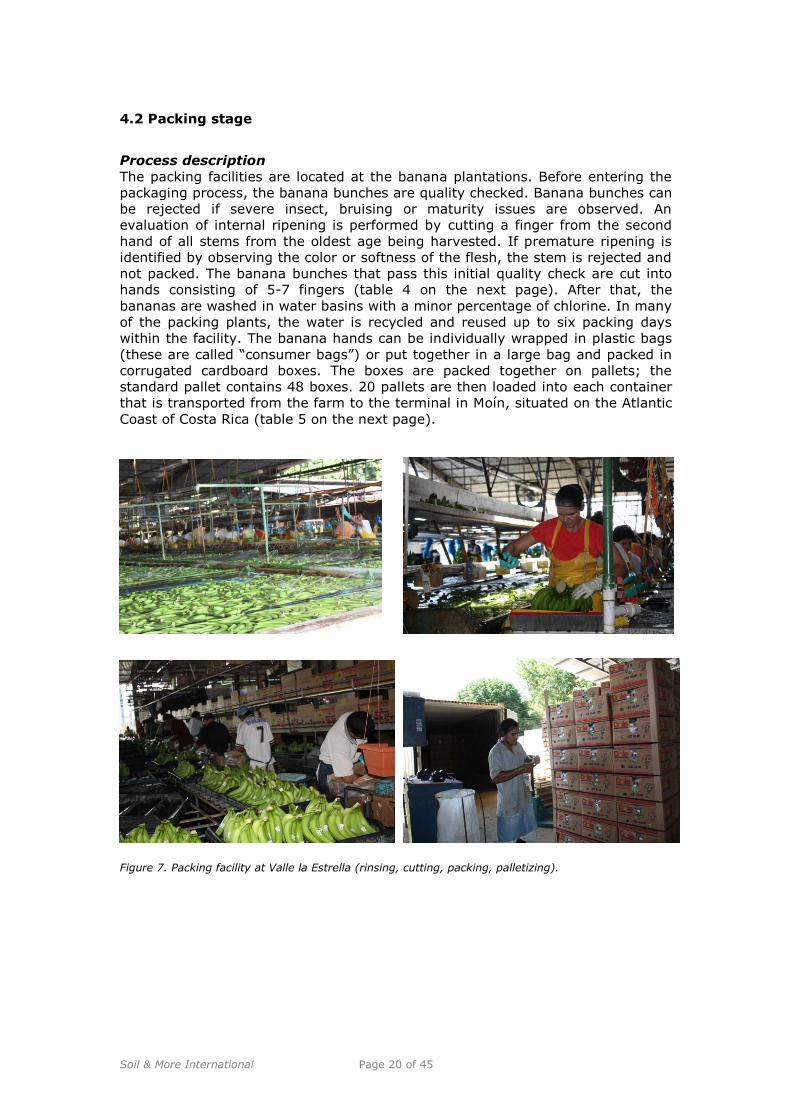
Process description
The packing facilities are located at the banana plantations. Before entering the
packaging process, the banana bunches are quality checked. Banana bunches can
be rejected if severe insect, bruising or maturity issues are observed. An
evaluation of internal ripening is performed by cutting a finger from the second
hand of all stems from the oldest age being harvested. If premature ripening is
identified by observing the color or softness of the flesh, the stem is rejected and
not packed. The banana bunches that pass this initial quality check are cut into
hands consisting of 5-7 fingers (table 4 on the next page). After that, the
bananas are washed in water basins with a minor percentage of chlorine. In many
of the packing plants, the water is recycled and reused up to six packing days
within the facility. The banana hands can be individually wrapped in plastic bags
(these are called “consumer bags”) or put together in a large bag and packed in
corrugated cardboard boxes. The boxes are packed together on pallets; the
standard pallet contains 48 boxes. 20 pallets are then loaded into each container
that is transported from the farm to the terminal in Moín, situated on the Atlantic
Coast of Costa Rica (table 5 on the next page).
Figure 7. Packing facility at Valle la Estrella (rinsing, cutting, packing, palletizing).
Soil & More International Page 21 of 45
Table 4. Terminology regarding to banana packing.
finger cluster hand bunch
Banana (finger) 1 5-7 15-20 200
cluster 1 3 30
hand 1 8-14
Table 5. Weight per different units of bananas.
box pallet container
kg 18.14 870.72 17.414
box 1 48 960
pallet 1 20
Electricity use
In the packing facilities the bananas are transported on conveyer belts powered
by electricity. The main use of electricity is for lighting and for operating the
pumps that extract water from the wells. The electricity is taken from the national
grid.
Fuel use
Sometimes the power supply fails and power is generated on the farm itself by
using diesel generators. Table 6 displays the average fuel use for electricity
generators for the packaging facilities of Valle la Estrella and Rio Frio in the year
2008.
Table 6. Average electricity use and fuel use per ton of product in the year 2008.
kWh electricity from grid L diesel
input/ton banana 13.93 0.11
Packaging material
The corrugated boxes weigh 1.286 kg and the plastic 0.025 kg, for each unit of
18.14 kg of bananas. The boxes and plastic used to be produced from paper and
plastic material in a facility that was owned by Dole in 2008, but the facility was
recently sold to a third-party. The facility uses paper, plastic, electricity and
bunker fuel to produce the boxes. For this assessment default emission factors for
the production of corrugated board and plastic were sourced from an online LCA
database (see annex 1).
Table 7. Use of packaging materials per ton of bananas packed.
Corrugated board Plastic (LLDPE) kg material/ton banana 70.9 1.4
Transport to the terminal
After packing, the bananas are transported to the container terminal yard in
Moin. There are two means of transport that are used. Most of the containers with
bananas are transported by trucks (67%). However, some of the farms have a
rail line available next to the packing facility. The railroad, owned by the National
Railroad Company (Incofer) is directly connected with the terminal yard. Although
the trains move slower than trucks and use diesel, this form of transportation is
more energy efficient than road transportation. Fuel use during transport in Costa
Rica is displayed in annex 3. The transport of bananas in Costa Rica does not use
refrigeration, as green bananas can easily resist going without cold storage for
over 24 hours.
Soil & More International Page 22 of 45
4.3 Terminal and port operations and overseas transport
Process description
After transportation by train and truck, the containers with bananas arrive at the
Dole terminal, located in Moin and very close to the port. The containers are
rinsed, taken off the train or trucks and connected to the grid for refrigeration.
Refrigeration at 57˚ Fahrenheit (14˚ Celsius) prevents the ripening process of
bananas. The container reefer units use refrigerants in their cooling systems.
After a storage ranging from hours to several days, the containers are
transported to the dock. Sometimes the containers are directly loaded on the
ships without connection to the grid, particularly in those cases where product is
shipped to the European Union. Bananas shipped to the US are mostly shipped in
containers, but in the case of transportation to Europe, pallets are taken out of
the containers and separately loaded below decks into reefer vessels. For Europe,
Dole uses two shipping services: Hamburg and Antwerp.
Electricity use
The electricity use in the terminal yard amounted to 21,695,569 kWh in 2008.
With a turnover of 63,075 containers that were connected to the grid in the
terminal, the average electricity use per container is approximately 344 kWh.
Table 8 displays the electricity use per ton of bananas.
Fuel use
Transportation at the terminal and in the port requires fuel use. In 2008 the total
fuel use amounted to 652.457,28 liters of diesel. Table 8 also displays the
average diesel use per ton of bananas.
Table 8. Electricity and fuel use during terminal and port operations in 2008.
l diesel kWh input/ton banana 0.59 19.75
Refrigerant use
With the data available it was not possible to identify the exact amount of
refrigerant that is used for storage of bananas in the container terminal. The
reason for this is that bananas are stored for varying time periods at the terminal
and the container units travel back and forth from the tropics to the market
countries (especially the U.S.). Much of the refrigerant use is due to the
transportation of pineapples which do require low temperature conditions after
being packed. Unlike bananas, pineapples are harvested ripe and therefore need
to be refrigerated during transport. With the data that was available, a
conservative estimate has been made on refrigerant use amounting to 12.22 kg
CO2e/ton banana.
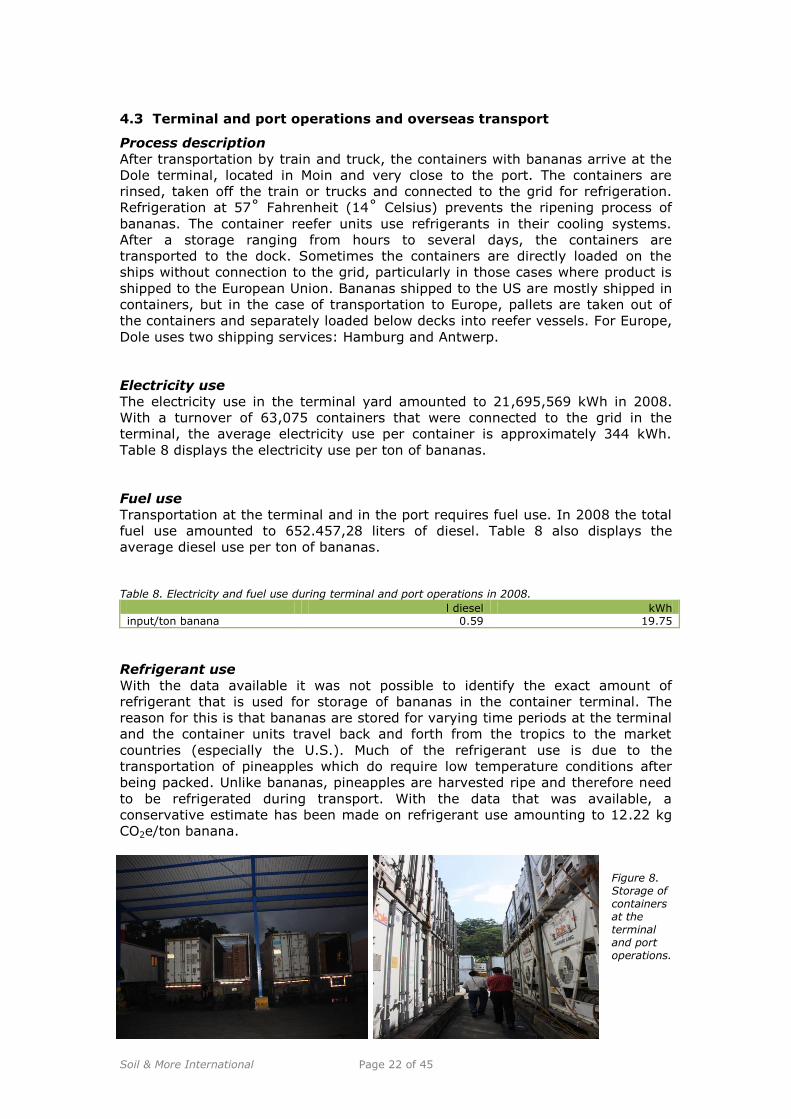
Figure 8. Storage of containers at the terminal and port operations.
Soil & More International Page 23 of 45
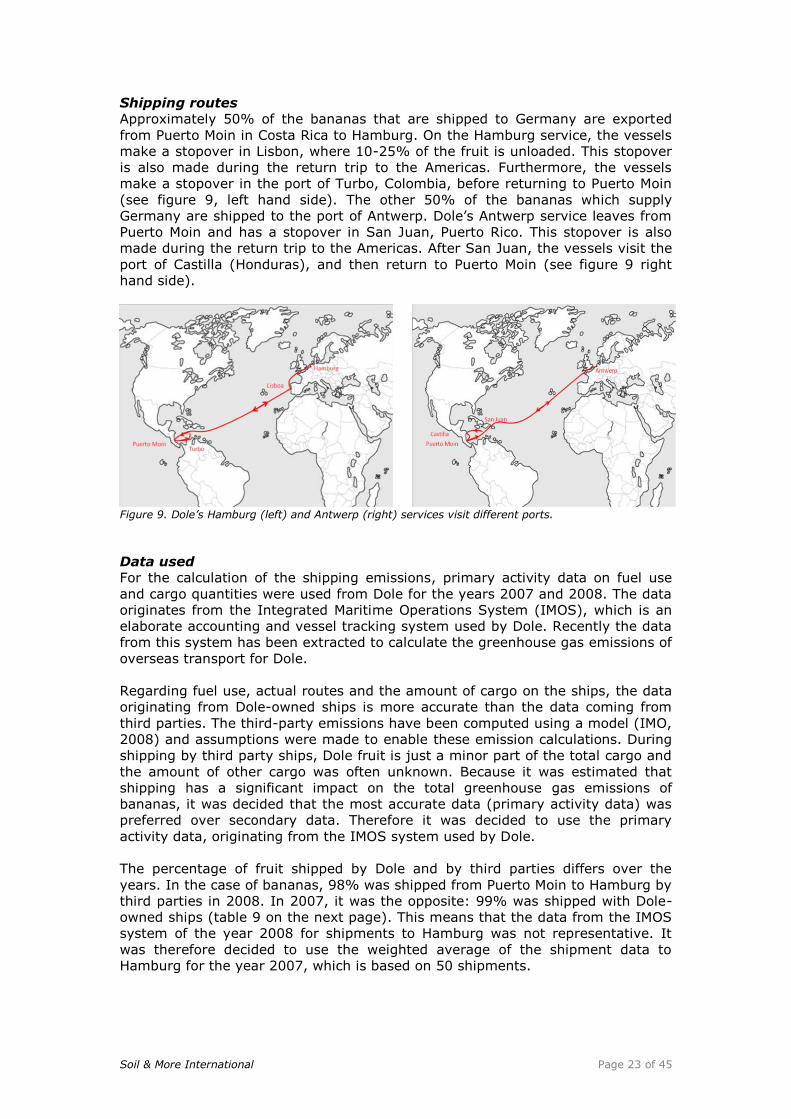
Shipping routes
Approximately 50% of the bananas that are shipped to Germany are exported
from Puerto Moin in Costa Rica to Hamburg. On the Hamburg service, the vessels
make a stopover in Lisbon, where 10-25% of the fruit is unloaded. This stopover
is also made during the return trip to the Americas. Furthermore, the vessels
make a stopover in the port of Turbo, Colombia, before returning to Puerto Moin
(see figure 9, left hand side). The other 50% of the bananas which supply
Germany are shipped to the port of Antwerp. Dole’s Antwerp service leaves from
Puerto Moin and has a stopover in San Juan, Puerto Rico. This stopover is also
made during the return trip to the Americas. After San Juan, the vessels visit the
port of Castilla (Honduras), and then return to Puerto Moin (see figure 9 right
hand side).
Figure 9. Dole’s Hamburg (left) and Antwerp (right) services visit different ports.
Data used
For the calculation of the shipping emissions, primary activity data on fuel use
and cargo quantities were used from Dole for the years 2007 and 2008. The data
originates from the Integrated Maritime Operations System (IMOS), which is an
elaborate accounting and vessel tracking system used by Dole. Recently the data
from this system has been extracted to calculate the greenhouse gas emissions of
overseas transport for Dole.
Regarding fuel use, actual routes and the amount of cargo on the ships, the data
originating from Dole-owned ships is more accurate than the data coming from
third parties. The third-party emissions have been computed using a model (IMO,
2008) and assumptions were made to enable these emission calculations. During
shipping by third party ships, Dole fruit is just a minor part of the total cargo and
the amount of other cargo was often unknown. Because it was estimated that
shipping has a significant impact on the total greenhouse gas emissions of
bananas, it was decided that the most accurate data (primary activity data) was
preferred over secondary data. Therefore it was decided to use the primary
activity data, originating from the IMOS system used by Dole.
The percentage of fruit shipped by Dole and by third parties differs over the
years. In the case of bananas, 98% was shipped from Puerto Moin to Hamburg by
third parties in 2008. In 2007, it was the opposite: 99% was shipped with Dole-
owned ships (table 9 on the next page). This means that the data from the IMOS
system of the year 2008 for shipments to Hamburg was not representative. It
was therefore decided to use the weighted average of the shipment data to
Hamburg for the year 2007, which is based on 50 shipments.
Soil & More International Page 24 of 45
In the case of shipments to Antwerp, in 2008 around 90% of the fruit was
shipped with Dole owned vessels. Therefore it was decided to use the weighted
average of the shipment data of 2008, based on 52 shipments.
Table 9. Quantities of Dole fruit shipped from Costa Rica to Hamburg and Antwerp.
Puerto Moin-Hamburg Puerto Moin-Antwerp
Total fruit shipped in 2008 (tons) 102,103 171,134
Dole owned vessels 2% 89%
Third party vessels 98% 11%
Total fruit shipped in 2007 (tons) 110,476 183,602
Dole owned vessels 99% 91%
Third party vessels 1% 9%
Fuel use during shipping and hotelling of vessels
The IMOS system differentiates the amount of fuel used during shipping and port
calls (table 10). For the different years and the different services there were
some deviations in these figures. Therefore it was decided to calculate the
weighted average of the bananas that were shipped to Germany (table 11).
Table 10. Average fuel use and cargo load on Dole’s Hamburg and Antwerp services. Puerto Moin-Hamburg Puerto Moin-Antwerp Average
Year 2007 2008
Heavy fuel oil use (l) 50,649.282.76 62,109,319.94 56,379,301,35
Yearly turnover (tons) 233,170.58 345,783.04 289,476,81
Heavy fuel oil (l/ton) 217.22 179.62 194.76
Cargo load during shipping
During most Dole shipments, cargo for internal operations is also transported (so
called ‘proprietary cargo’), just like cargo from third parties (‘commercial cargo’).
Dole has determined the amount of pallet space that is used for different cargo
types, expressed in pallet equivalents. This data allowed for calculation of the
weighted average of the fuel use per loaded pallet equivalent per shipment. The
fuel use was only allocated to the loaded pallets. Emissions for “transporting”
empty space on the vessels were therefore evenly divided over the loaded pallets,
not taking into account the type of cargo.
Allocation during shipping
In the case of bananas, one pallet consists of 48 boxes, each containing 18.14 kg
of bananas. For the calculation it was assumed that all loaded pallet equivalents
were used for bananas and loaded with 0.87 ton bananas. Although in reality
this was not the case, it was found to be the most straightforward and
conservative way of allocation7. If the emissions were evenly distributed over all
pallets, including the empty cargo spaces, the emissions per ton banana
transported would be approximately 35% lower.
Refrigerant use during shipping
7 In Dole’s emission accounting system, another allocation method has been used which allocates
emissions from shipping to fruit, commercial cargo, proprietary cargo and the ‘ocean carrier’. The
latter means the empty space during shipping. The emissions allocated to the ocean carrier are often a significant part. The way the emissions are allocated in this study is therefore more conservative.
Soil & More International Page 25 of 45
Data was available on refrigerant use during shipping from 4 ships that are used
on the European services in the year 2008. The average refrigerant use per ton
banana transported is 8.34 kg CO2e. While these vessels are over 10 years old,
the amount of refrigerant use is rather conservative.
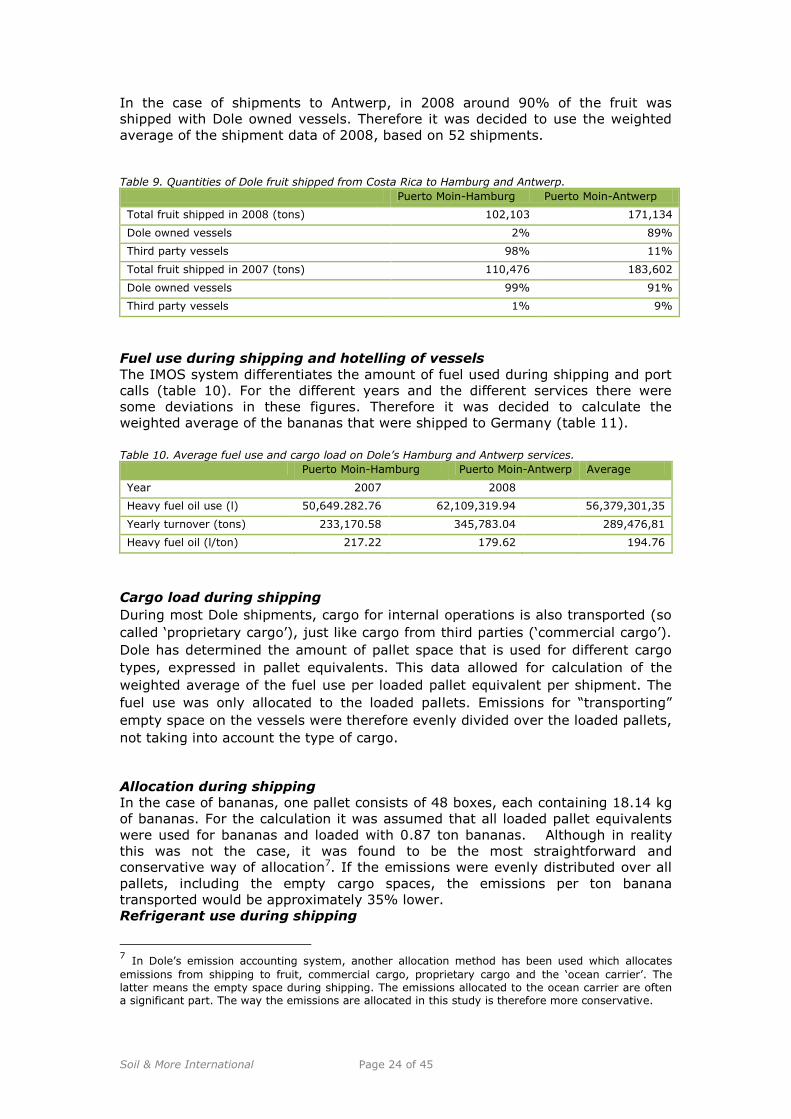
After arrival in Europe
The bananas that arrived in the port of Hamburg are transported to a ripening
facility located within the port (over a distance of 1.5 km). The bananas arrived in
the Port of Antwerp are transported by truck to the ripening facility in Hamburg
(about 20%) or to a ripening facility in Roisdorf/Bornheim (about 30%). 24 tons
of bananas per truck are transported with a fuel use of 0.3 liters of diesel/km.
The trucks return empty to the ports. The weighted average transport distance is
displayed in table 11. Using the weighted average distance and the fuel use, the
fuel use per ton transported is 4.58 liter/ton.
Table 11. Transport distances from port to the ripening facilities.
Distance of return trip (km) % of bananas
Hamburg-Hamburg 3 50%
Antwerp-Roisdorf 476 30%
Hamburg-Roisdorf 1112 20%
Weighted average 366 100%
Figure 10. Transport from the ports to the ripening facilities.
1 transport a week
2 transports a week
3 transports a week
Soil & More International Page 26 of 45
Refrigerant use during transport in Europe
The bananas are refrigerated during transport by truck in Germany. The
refrigerant gas R404A is used which is a colourless odourless mixture of CFCs and
HCFCs (chlorofluorocarbons and hydrochlorofluorocarbons). The Global Warming
Potential (GWP) of these gasses is very high (table 12). For this specific mixture a
GWP of 3,921 was calculated. The yearly use is 2.3 kg of refrigerant can be used
for 1,500 hours of cooling. Per hour cooled transport this means a use of 1.5
grams of refrigerant per truckload.
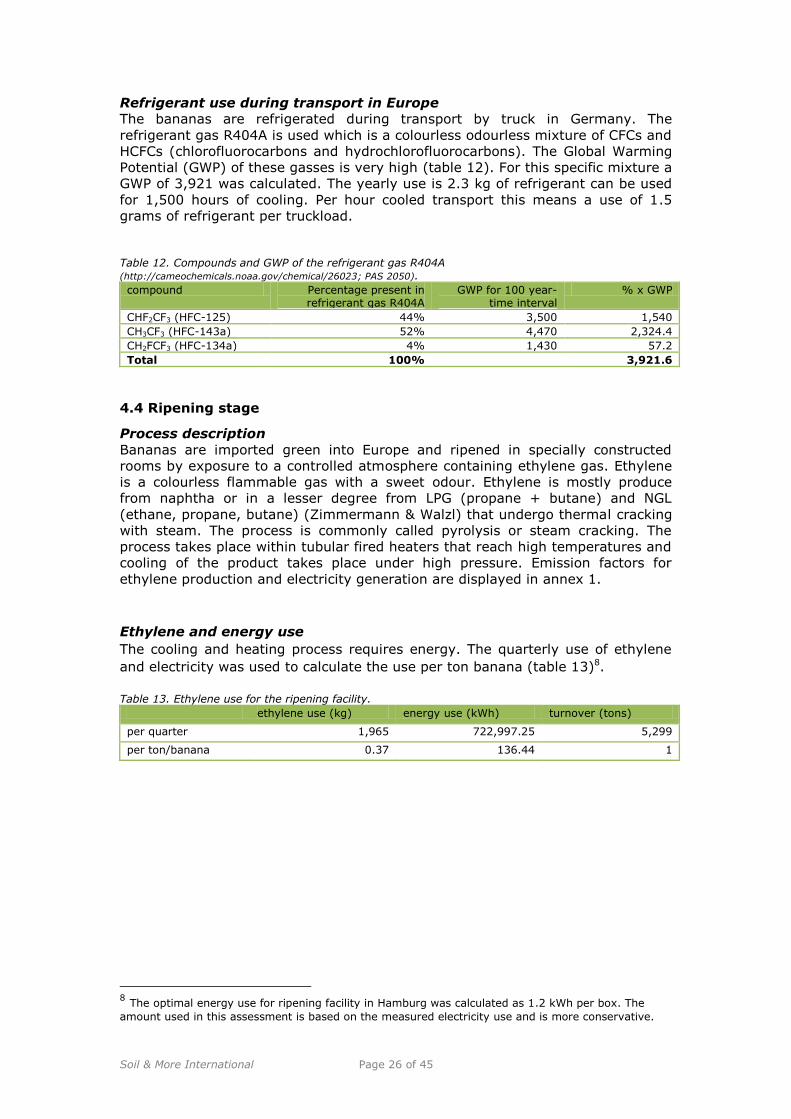
Table 12. Compounds and GWP of the refrigerant gas R404A (http://cameochemicals.noaa.gov/chemical/26023; PAS 2050).
compound Percentage present in refrigerant gas R404A
GWP for 100 year- time interval
% x GWP
CHF2CF3 (HFC-125) 44% 3,500 1,540
CH3CF3 (HFC-143a) 52% 4,470 2,324.4
CH2FCF3 (HFC-134a) 4% 1,430 57.2
Total 100% 3,921.6
4.4 Ripening stage
Process description
Bananas are imported green into Europe and ripened in specially constructed
rooms by exposure to a controlled atmosphere containing ethylene gas. Ethylene
is a colourless flammable gas with a sweet odour. Ethylene is mostly produce
from naphtha or in a lesser degree from LPG (propane + butane) and NGL
(ethane, propane, butane) (Zimmermann & Walzl) that undergo thermal cracking
with steam. The process is commonly called pyrolysis or steam cracking. The
process takes place within tubular fired heaters that reach high temperatures and
cooling of the product takes place under high pressure. Emission factors for
ethylene production and electricity generation are displayed in annex 1.
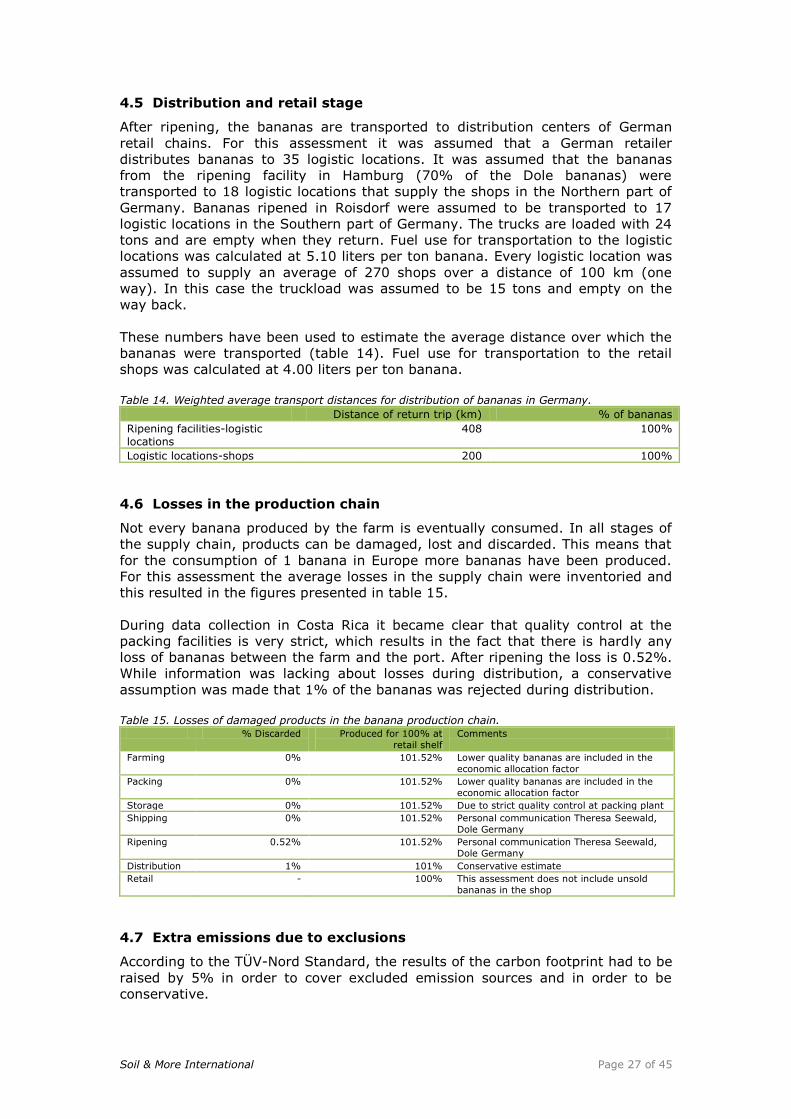
Ethylene and energy use
The cooling and heating process requires energy. The quarterly use of ethylene
and electricity was used to calculate the use per ton banana (table 13)8.
Table 13. Ethylene use for the ripening facility.
ethylene use (kg) energy use (kWh) turnover (tons)
per quarter 1,965 722,997.25 5,299
per ton/banana 0.37 136.44 1
8 The optimal energy use for ripening facility in Hamburg was calculated as 1.2 kWh per box. The
amount used in this assessment is based on the measured electricity use and is more conservative.
Soil & More International Page 27 of 45
4.5 Distribution and retail stage
After ripening, the bananas are transported to distribution centers of German
retail chains. For this assessment it was assumed that a German retailer
distributes bananas to 35 logistic locations. It was assumed that the bananas
from the ripening facility in Hamburg (70% of the Dole bananas) were
transported to 18 logistic locations that supply the shops in the Northern part of
Germany. Bananas ripened in Roisdorf were assumed to be transported to 17
logistic locations in the Southern part of Germany. The trucks are loaded with 24
tons and are empty when they return. Fuel use for transportation to the logistic
locations was calculated at 5.10 liters per ton banana. Every logistic location was
assumed to supply an average of 270 shops over a distance of 100 km (one
way). In this case the truckload was assumed to be 15 tons and empty on the
way back.
These numbers have been used to estimate the average distance over which the
bananas were transported (table 14). Fuel use for transportation to the retail
shops was calculated at 4.00 liters per ton banana.
Table 14. Weighted average transport distances for distribution of bananas in Germany.
Distance of return trip (km) % of bananas
Ripening facilities-logistic locations
408 100%
Logistic locations-shops 200 100%
4.6 Losses in the production chain
Not every banana produced by the farm is eventually consumed. In all stages of
the supply chain, products can be damaged, lost and discarded. This means that
for the consumption of 1 banana in Europe more bananas have been produced.
For this assessment the average losses in the supply chain were inventoried and
this resulted in the figures presented in table 15.
During data collection in Costa Rica it became clear that quality control at the
packing facilities is very strict, which results in the fact that there is hardly any
loss of bananas between the farm and the port. After ripening the loss is 0.52%.
While information was lacking about losses during distribution, a conservative
assumption was made that 1% of the bananas was rejected during distribution.
Table 15. Losses of damaged products in the banana production chain.
% Discarded Produced for 100% at
retail shelf
Comments
Farming 0% 101.52% Lower quality bananas are included in the
economic allocation factor
Packing 0% 101.52% Lower quality bananas are included in the
economic allocation factor
Storage 0% 101.52% Due to strict quality control at packing plant
Shipping 0% 101.52% Personal communication Theresa Seewald,
Dole Germany
Ripening 0.52% 101.52% Personal communication Theresa Seewald,
Dole Germany
Distribution 1% 101% Conservative estimate
Retail - 100% This assessment does not include unsold
bananas in the shop
4.7 Extra emissions due to exclusions
According to the TÜV-Nord Standard, the results of the carbon footprint had to be
raised by 5% in order to cover excluded emission sources and in order to be
conservative.
Soil & More International Page 28 of 45
5 Results
5.1 Total Carbon Footprint
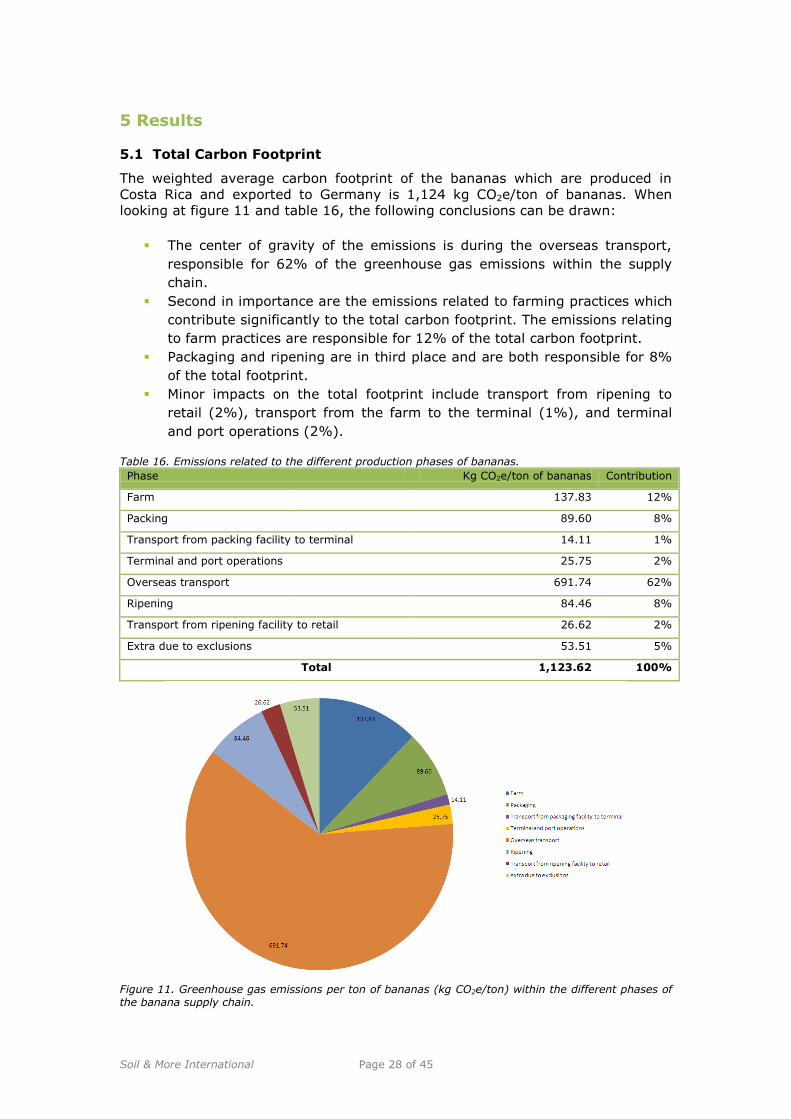
The weighted average carbon footprint of the bananas which are produced in
Costa Rica and exported to Germany is 1,124 kg CO2e/ton of bananas. When
looking at figure 11 and table 16, the following conclusions can be drawn:
The center of gravity of the emissions is during the overseas transport,
responsible for 62% of the greenhouse gas emissions within the supply
chain.
Second in importance are the emissions related to farming practices which
contribute significantly to the total carbon footprint. The emissions relating
to farm practices are responsible for 12% of the total carbon footprint.
Packaging and ripening are in third place and are both responsible for 8%
of the total footprint.
Minor impacts on the total footprint include transport from ripening to
retail (2%), transport from the farm to the terminal (1%), and terminal
and port operations (2%).
Table 16. Emissions related to the different production phases of bananas.
Phase Kg CO2e/ton of bananas Contribution
Farm 137.83 12%
Packing 89.60 8%
Transport from packing facility to terminal 14.11 1%
Terminal and port operations 25.75 2%
Overseas transport 691.74 62%
Ripening 84.46 8%
Transport from ripening facility to retail 26.62 2%
Extra due to exclusions 53.51 5%
Total 1,123.62 100%
Figure 11. Greenhouse gas emissions per ton of bananas (kg CO2e/ton) within the different phases of the banana supply chain.
Soil & More International Page 29 of 45
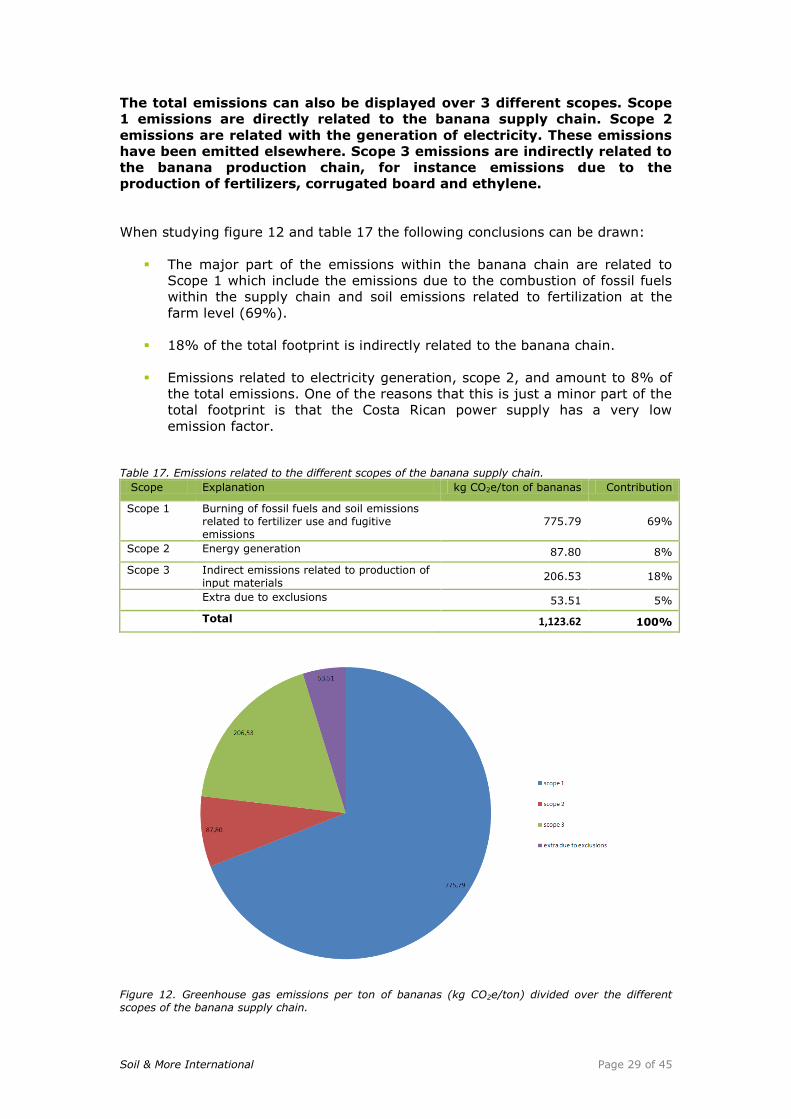
The total emissions can also be displayed over 3 different scopes. Scope
1 emissions are directly related to the banana supply chain. Scope 2
emissions are related with the generation of electricity. These emissions
have been emitted elsewhere. Scope 3 emissions are indirectly related to
the banana production chain, for instance emissions due to the
production of fertilizers, corrugated board and ethylene.
When studying figure 12 and table 17 the following conclusions can be drawn:
The major part of the emissions within the banana chain are related to
Scope 1 which include the emissions due to the combustion of fossil fuels
within the supply chain and soil emissions related to fertilization at the
farm level (69%).
18% of the total footprint is indirectly related to the banana chain.
Emissions related to electricity generation, scope 2, and amount to 8% of
the total emissions. One of the reasons that this is just a minor part of the
total footprint is that the Costa Rican power supply has a very low
emission factor.
Table 17. Emissions related to the different scopes of the banana supply chain.
Scope Explanation kg CO2e/ton of bananas Contribution
Scope 1 Burning of fossil fuels and soil emissions related to fertilizer use and fugitive emissions
775.79 69%
Scope 2 Energy generation 87.80 8%
Scope 3 Indirect emissions related to production of input materials
206.53 18%
Extra due to exclusions 53.51 5%
Total 1,123.62 100%
Figure 12. Greenhouse gas emissions per ton of bananas (kg CO2e/ton) divided over the different scopes of the banana supply chain.
Soil & More International Page 30 of 45
5.2 Results per processing phase
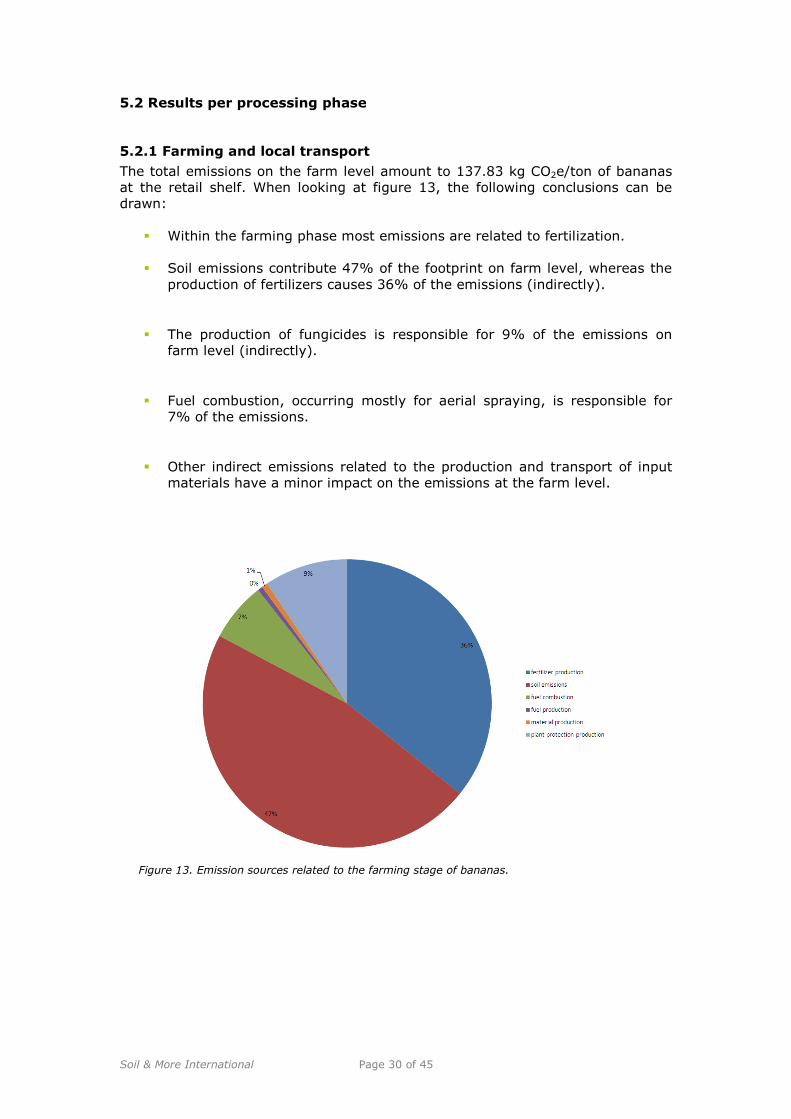
5.2.1 Farming and local transport
The total emissions on the farm level amount to 137.83 kg CO2e/ton of bananas
at the retail shelf. When looking at figure 13, the following conclusions can be
drawn:
Within the farming phase most emissions are related to fertilization.
Soil emissions contribute 47% of the footprint on farm level, whereas the
production of fertilizers causes 36% of the emissions (indirectly).
The production of fungicides is responsible for 9% of the emissions on
farm level (indirectly).
Fuel combustion, occurring mostly for aerial spraying, is responsible for
7% of the emissions.
Other indirect emissions related to the production and transport of input
materials have a minor impact on the emissions at the farm level.
Figure 13. Emission sources related to the farming stage of bananas.
Soil & More International Page 31 of 45
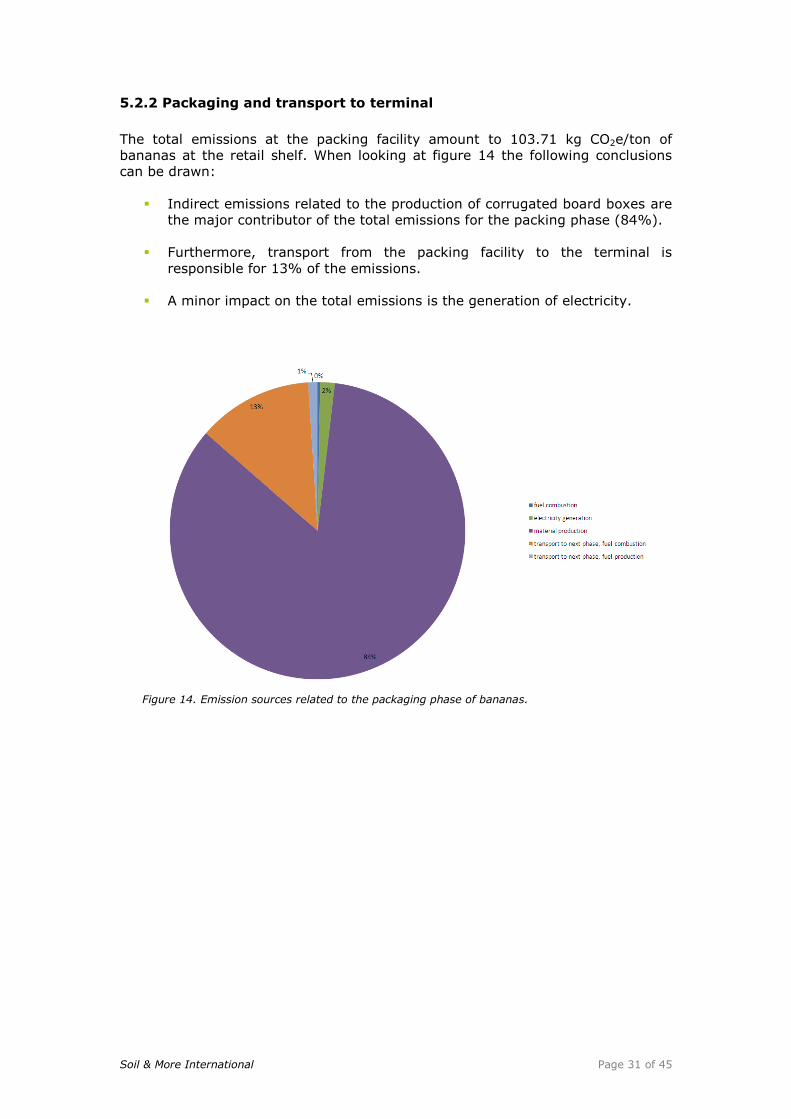
5.2.2 Packaging and transport to terminal
The total emissions at the packing facility amount to 103.71 kg CO2e/ton of
bananas at the retail shelf. When looking at figure 14 the following conclusions
can be drawn:
Indirect emissions related to the production of corrugated board boxes are
the major contributor of the total emissions for the packing phase (84%).
Furthermore, transport from the packing facility to the terminal is
responsible for 13% of the emissions.
A minor impact on the total emissions is the generation of electricity.
Figure 14. Emission sources related to the packaging phase of bananas.
Soil & More International Page 32 of 45
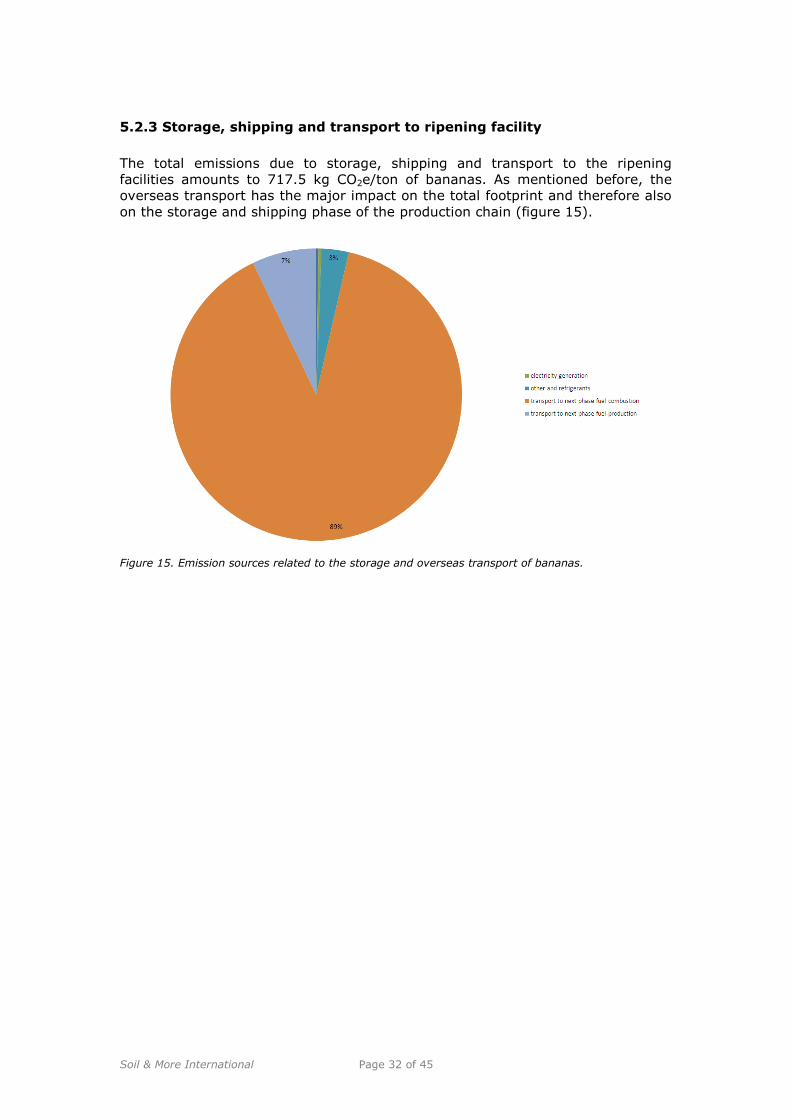
5.2.3 Storage, shipping and transport to ripening facility
The total emissions due to storage, shipping and transport to the ripening
facilities amounts to 717.5 kg CO2e/ton of bananas. As mentioned before, the
overseas transport has the major impact on the total footprint and therefore also
on the storage and shipping phase of the production chain (figure 15).
Figure 15. Emission sources related to the storage and overseas transport of bananas.
Soil & More International Page 33 of 45
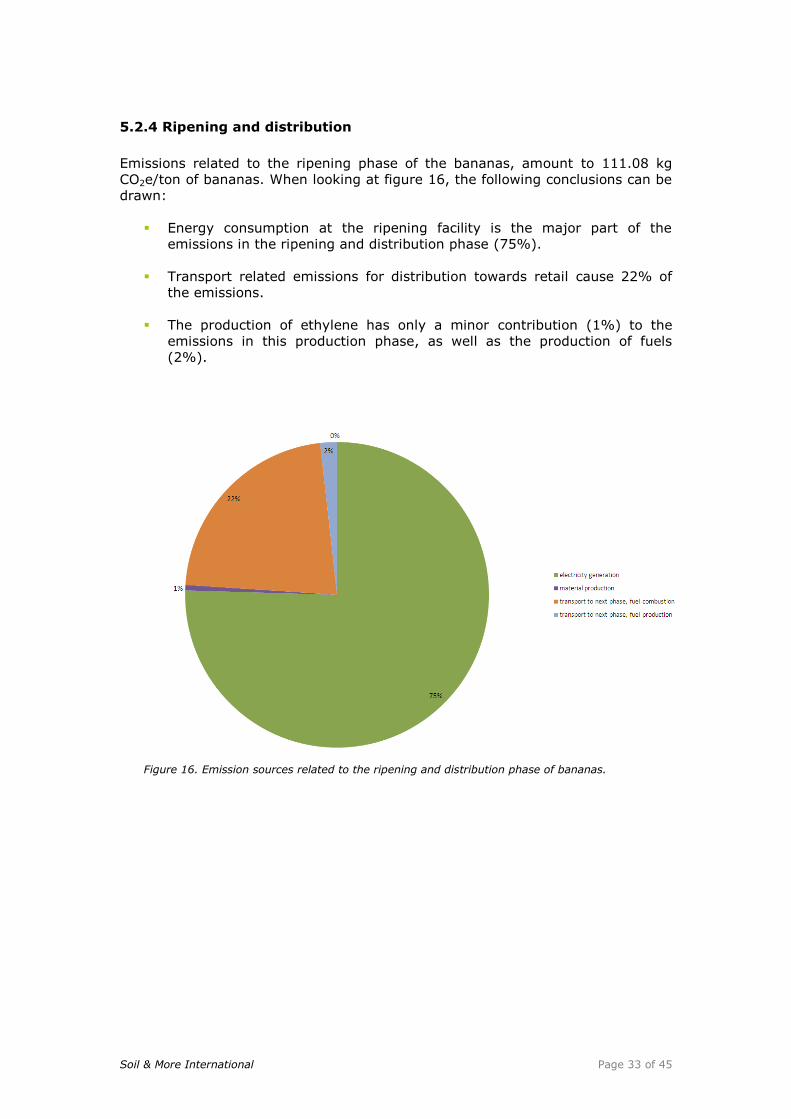
5.2.4 Ripening and distribution
Emissions related to the ripening phase of the bananas, amount to 111.08 kg
CO2e/ton of bananas. When looking at figure 16, the following conclusions can be
drawn:
Energy consumption at the ripening facility is the major part of the
emissions in the ripening and distribution phase (75%).
Transport related emissions for distribution towards retail cause 22% of
the emissions.
The production of ethylene has only a minor contribution (1%) to the
emissions in this production phase, as well as the production of fuels
(2%).
Figure 16. Emission sources related to the ripening and distribution phase of bananas.
Soil & More International Page 34 of 45
6 Emission Reduction Potential
6.1 Emission calculations
This study is part of an elaborate project where Dole calculates the Company’s
carbon footprint. While a corporate carbon footprint focuses on the total
company, a product carbon footprint focuses on the emissions of the whole
supply chain, allocating it to one functional unit.
It has to be mentioned that a carbon footprint is not an absolute number, but is
an estimate, because system boundaries have to be defined which automatically
means a simplification of reality. Apart from the system boundaries, there is the
issue of time effectiveness that should be taken into account during an
assessment. And a third inaccuracy for a system analyses in general is that
supply chains are dependent on market developments, which means they are
always subject to change.
However, the assessment shows clearly where the center of gravity of
greenhouse gas emissions lies within the supply chain of bananas. Once this is
known, Dole could determine where in the production chain emission reductions
could be reached. Furthermore, the Company may decide to compensate
emissions and market the bananas as carbon neutral.
6.2 Emission reduction within the supply chain
The results of this study clearly show that shipping contributes significantly to
greenhouse gas emissions per functional unit. Thus, it is recommended to explore
the options towards emission reduction at this part of the banana supply chain.
This study is specific in that it uses absolute figures on fuel use during shipment,
which usually are hard to reach. During the data collection in Costa Rica, the
differences with emission factors for shipping in databases were discussed, and it
became clear that fruit is often shipped with relatively small sized vessels. The
reason for this is time pressure. Loading and unloading takes longer for large size
container vessels than for small sized reefer vessels and this is a risk for fresh
produce. Another reason for the relatively small vessels is the size of the port in
Puerto Moin, which is also relatively small. Looking at the fuel use per functional
unit, smaller sized vessels are less efficient than large sized vessels. Shipping of
fruit is therefore in many cases less efficient than the overseas transport of
materials or bulk. Default values from emission databases also assume a high
cargo load per shipment. The primary activity data of this study showed however,
that on average 35% of the vessel’s cargo capacity is unused.
The second option for emission reduction is on the farm level and is related to
fertilization, especially for nitrogen fertilization. The production of these fertilizers
causes significant emissions, just like the biochemical reactions that take place in
the soil after fertilization. Alternative fertilization schemes, such as the use of
leguminous species, could be used to decrease the use of chemical fertilizers and
to improve soil fertility.
Soil & More International Page 35 of 45
Apart from emission reduction within the supply chain, Dole is already working on
several emission reduction projects, such as tree planting and reforestation
activities, forest conservation projects, renewal and replacement of old
containers, and the use of less harmful refrigerant types.
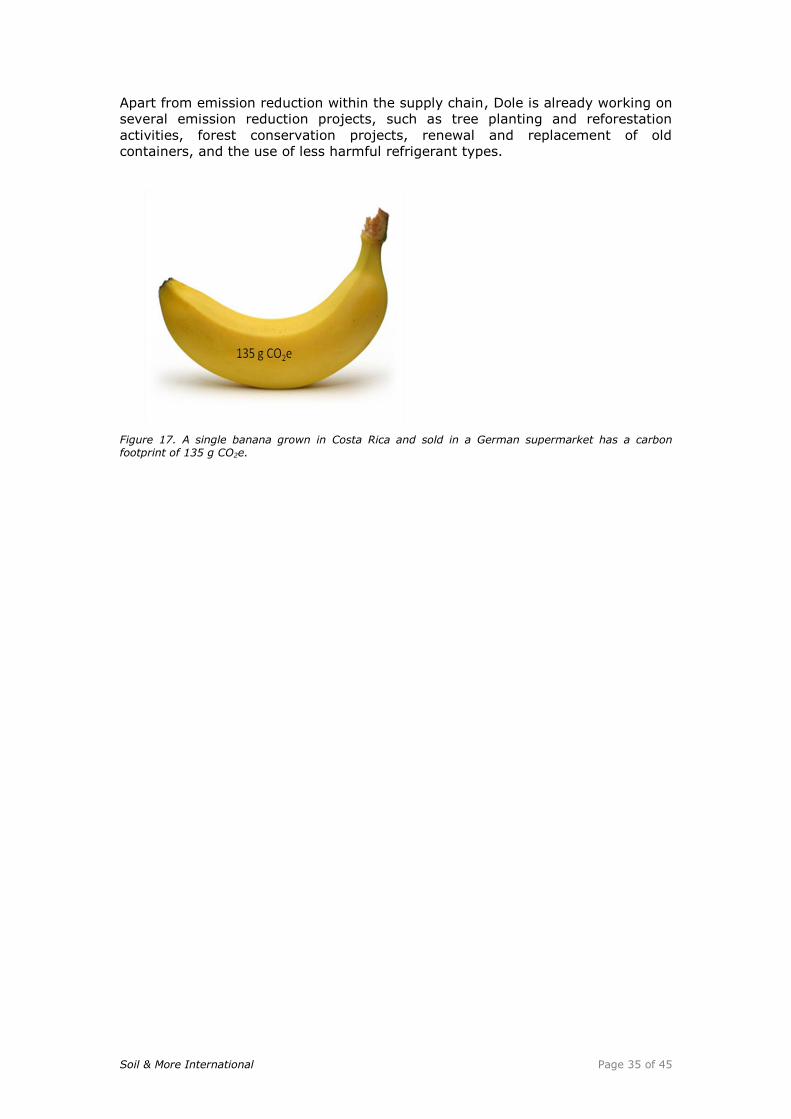
Figure 17. A single banana grown in Costa Rica and sold in a German supermarket has a carbon footprint of 135 g CO2e.
Soil & More International Page 36 of 45
7 References
Baldo, G. L., Marion, M., Montani, M., S-O, Ryding, 2008. Study for the EU
Ecolabel Carbon Footprint Measurement Toolkit. Final Activity Report. Studio
LCE, Italy & SEMC, Sweden
Clemens DR, Weise SF, Brown R, Stonehouse DP, Hume DJ, Swanton CJ (1995).
Energy analyses of tillage and herbicide inputs in alternative weed
management systems. Agriculture Ecosystems and Environment (52): 119-
128.
Davis, J. and Haglund, C. 1999. Life Cycle Inventory (LCI) of Fertiliser Production.
Fertiliser Products Used in Sweden and Western Europe. SIK-Report No.
654. Masters Thesis, Chalmers University of Technology.
FRoSTA, 2009. Fallstudie Tagliatelle Wildlachs. Fallstudie erstellt im Rahmen des
PCF Pilot Projektes Deutschland. http://www.pcf-
projekt.de/files/1257258154/pcf_frosta_tagliatelle_update.pdf
Green, MB (1987). Energy in pesticide manufacture, distribution and use. In:
Stout BA, Mudahar MS, editors. Energy in plant nutrition and pest control.
Amsterdam, Elsevier, p 165-177.
Green and McCulloh (1974). Energy considerations in the use of herbicides. UK,
Imperial Chemical Industries.
Guide to PAS 2050, How to assess the carbon footprint of goods and services,
Carbon Trust
Helsel ZR (1992). Energy and alternatives for fertilizer and pesticide use. In:
Fluck RC, editor. Energy in farm production. Amsterdam: Elsevier, p 3-14
IMO, 2008. Updated study on Greenhouse Gas Emissions from ships. Phase 1
report. Report nr. MEPC 58/INF.6.
Intergovernmental Panel on Climate Change (IPCC), 2006 IPCC Guidelines for
National Greenhouse Gas Inventories:
http://www.ipcc-nggip.iges.or.jp/public/2006gl/index.htm
International Energy Agency http://www.iea.org/Textbase/stats/index.asp
ISO , International Standard on Environmental Performance Evaluation, (ISO
14044), International Standard Organization, Geneva.
IPCC Guidelines for National Greenhouse Gas Inventories, 2006. Volume 4.
Agriculture, Forestry and other land use. Chapter 11: N2O emissions from
managed soils and CO2 emissions from lime and urea application.
Lal, R. 2004. Carbon emissions from farm operations. Environment International
30: 981-990.
LOHAS – Lifestyle of Health and Sustainability (2007), Ernst & Young
Ministerio de Ambiente y Energía, 2007. Estrategia Nacional de Cambio Climático.
Inventario e informe de gases con efecto invernadero (GEI). Programa
piloto para empresas y organizaciones. Version 2. Page 8.
PAS 2050:2008, Specification for the assessment of the life cycle greenhouse gas
emissions of goods and services, Carbon Trust
Protocol 9080 Landbouw bodem indirect t. b. v. NIR 2009, 4D: N20 landbouw
bodem: indirecte emissies, 2009. Ministerie van VROM, Den Haag. found on
www.broeikasgassen.nl
Protocol 9081 Landbouw bodem direct t. b. v. NIR 2009, 4D: N20 landbouw
bodem: directe emissies en beweidingsemissies, 2009. Ministerie van
VROM, Den Haag. found on www.broeikasgassen.nl
Soil & More International Page 37 of 45
Soh, K.G. 1997. Fertilizer use by crops. IFA Agro-economics Meeting, Beijing,
China. United Nations, 2005. The Millennium Development Goals Report
2005.
US Environmental Protection Agency (Appendix H of the instructions to Form EIA-
1605)
World Business Council for Sustainable Development (WBCSD)/World Resources
Institute (WRI), 2004, The Greenhouse Gas Protocol, Corporate Accounting
and Reporting Standard, revised Edition
Zimmermann, H. & R. Walzl, Linde AG, Hoellriegelskreuth, Federal Republic of
Germany.
http://media.wiley.com/product_data/excerpt/55/35273038/3527303855.p
df
Wood, S. & A. Cowie, 2004. A Review of Greenhouse Gas Emission Factors for
Fertiliser Production, Research and Development Division, State Forests of New
South Wales
Used websites:
www.faostat.fao.org
GfK Consumer Scope, 2008.
http://www.climatechangecorp.com/content.asp?ContentID=5828
www.unfccc.com
http://cameochemicals.noaa.gov/chemical/26023
http://lca.jrc.ec.europa.eu/
Gemis 4.2 database, 2004
Soil & More International Page 38 of 45
8 Annexes
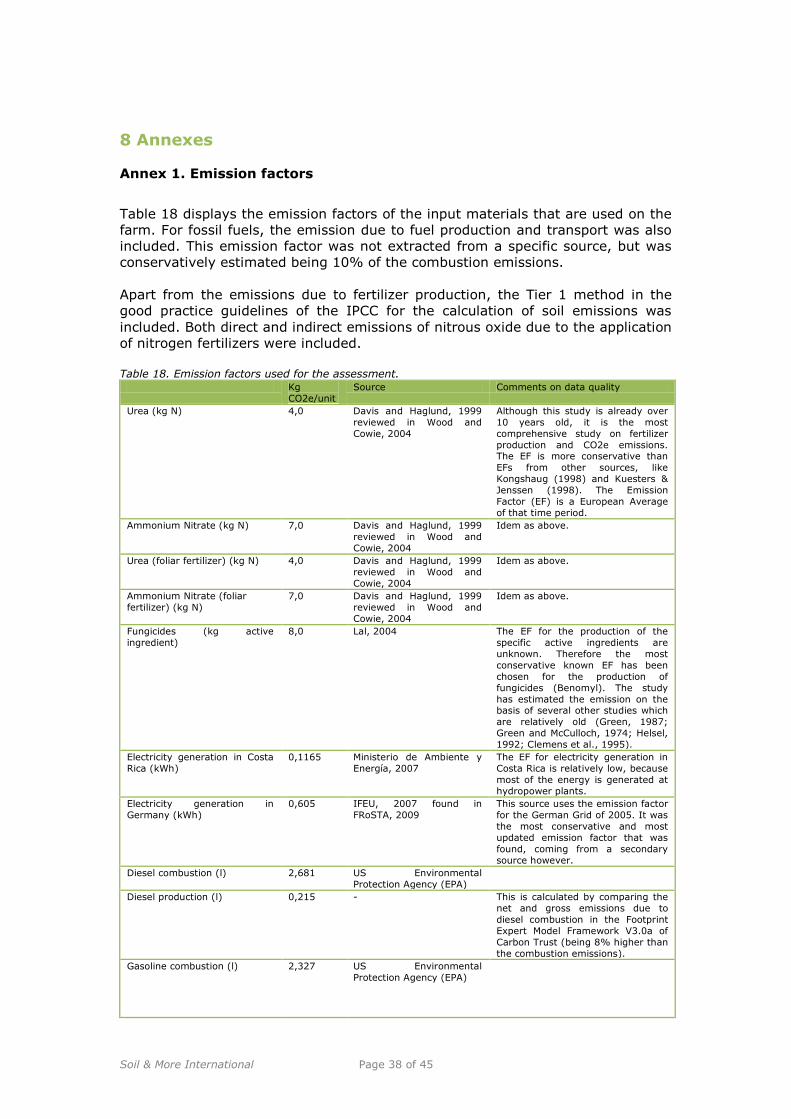
Annex 1. Emission factors
Table 18 displays the emission factors of the input materials that are used on the
farm. For fossil fuels, the emission due to fuel production and transport was also
included. This emission factor was not extracted from a specific source, but was
conservatively estimated being 10% of the combustion emissions.
Apart from the emissions due to fertilizer production, the Tier 1 method in the
good practice guidelines of the IPCC for the calculation of soil emissions was
included. Both direct and indirect emissions of nitrous oxide due to the application
of nitrogen fertilizers were included.
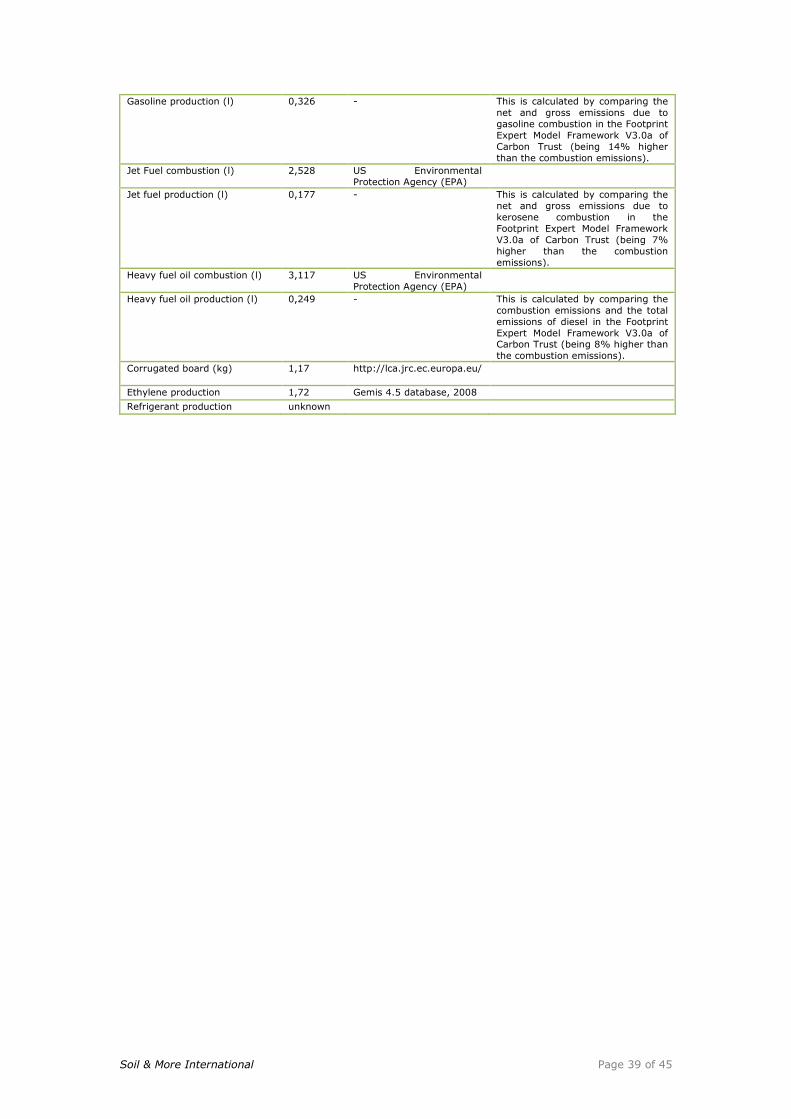
Table 18. Emission factors used for the assessment.
Kg
CO2e/unit
Source Comments on data quality
Urea (kg N) 4,0 Davis and Haglund, 1999
reviewed in Wood and
Cowie, 2004
Although this study is already over
10 years old, it is the most
comprehensive study on fertilizer
production and CO2e emissions. The EF is more conservative than
EFs from other sources, like
Kongshaug (1998) and Kuesters &
Jenssen (1998). The Emission
Factor (EF) is a European Average
of that time period.
Ammonium Nitrate (kg N) 7,0 Davis and Haglund, 1999
reviewed in Wood and
Cowie, 2004
Idem as above.
Urea (foliar fertilizer) (kg N) 4,0 Davis and Haglund, 1999
reviewed in Wood and
Cowie, 2004
Idem as above.
Ammonium Nitrate (foliar
fertilizer) (kg N)
7,0 Davis and Haglund, 1999
reviewed in Wood and
Cowie, 2004
Idem as above.
Fungicides (kg active
ingredient)
8,0 Lal, 2004 The EF for the production of the
specific active ingredients are
unknown. Therefore the most
conservative known EF has been
chosen for the production of
fungicides (Benomyl). The study
has estimated the emission on the basis of several other studies which
are relatively old (Green, 1987;
Green and McCulloch, 1974; Helsel,
1992; Clemens et al., 1995).
Electricity generation in Costa
Rica (kWh)
0,1165 Ministerio de Ambiente y
Energía, 2007
The EF for electricity generation in
Costa Rica is relatively low, because
most of the energy is generated at
hydropower plants.
Electricity generation in
Germany (kWh)
0,605 IFEU, 2007 found in
FRoSTA, 2009
This source uses the emission factor
for the German Grid of 2005. It was
the most conservative and most
updated emission factor that was
found, coming from a secondary
source however.
Diesel combustion (l) 2,681 US Environmental
Protection Agency (EPA)
Diesel production (l) 0,215 - This is calculated by comparing the
net and gross emissions due to
diesel combustion in the Footprint
Expert Model Framework V3.0a of
Carbon Trust (being 8% higher than
the combustion emissions).
Gasoline combustion (l) 2,327 US Environmental
Protection Agency (EPA)
Soil & More International Page 39 of 45
Gasoline production (l) 0,326 - This is calculated by comparing the
net and gross emissions due to
gasoline combustion in the Footprint
Expert Model Framework V3.0a of
Carbon Trust (being 14% higher
than the combustion emissions).
Jet Fuel combustion (l) 2,528 US Environmental
Protection Agency (EPA)
Jet fuel production (l) 0,177 - This is calculated by comparing the
net and gross emissions due to
kerosene combustion in the
Footprint Expert Model Framework
V3.0a of Carbon Trust (being 7%
higher than the combustion
emissions).
Heavy fuel oil combustion (l) 3,117 US Environmental
Protection Agency (EPA)
Heavy fuel oil production (l) 0,249 - This is calculated by comparing the
combustion emissions and the total
emissions of diesel in the Footprint
Expert Model Framework V3.0a of Carbon Trust (being 8% higher than
the combustion emissions).
Corrugated board (kg) 1,17 http://lca.jrc.ec.europa.eu/
Ethylene production 1,72 Gemis 4.5 database, 2008 Refrigerant production unknown
Soil & More International Page 40 of 45
Annex 2. Soil emissions
Nitrous oxide is emitted in soils due to microbial processes in the soil:
denitrification and nitrification. It is a combination of aerobic and anaerobic
processes by microorganisms that use nitrogen and organic matter to feed on.
Soil & More uses the calculation methodology of soil emissions, described in
chapter 11 of the IPCC guidelines on a Tier 1 approach (default methodology).
This methodology is specified by combining it with the Tier 2 approach of the
Netherlands, where different emission factors are defined for different soil types.
The IPCC guidelines define direct and indirect emissions. The emission factors are
dependent on the type of fertilizer, soil type, crop residues and the amount of
fertilizer that is used.
The following parameters are needed in order to calculate the soil emissions:
1. Fertilizer type used (nitrate or ammonia type)
2. Application of fertilizer (kg N/ha)
3. Manure application (kg N/ha)
4. Application method (above or below ground)
5. Crop residues that remain in the field (ton/ha and N content)
6. N binding by legumes (kg N/ha)
7. Soil type (mineral or organic)9
9 Soils are organic if they satisfy the requirements 1 and 2, or 1 and 3 below (FAO, 1998):
1. Thickness of 10 cm or more. A horizon less than 20 cm thick must have 12 percent or more organic carbon when
mixed to a depth of 20 cm;
2. If the soil is never saturated with water for more than a few days, and contains more than 20 percent (by weight) organic carbon (about 35 percent organic matter)
3. If the soil is subject to water saturation episodes and has either:
(i) at least 12 percent (by weight) organic carbon (about 20 percent organic matter) if it has no clay; or
(ii) at least 18 percent (by weight) organic carbon (about 30 percent organic matter) if it has 60 percent or
more clay; or (iii) an intermediate, proportional amount of organic carbon for intermediate amounts of clay
(FAO, 1998).
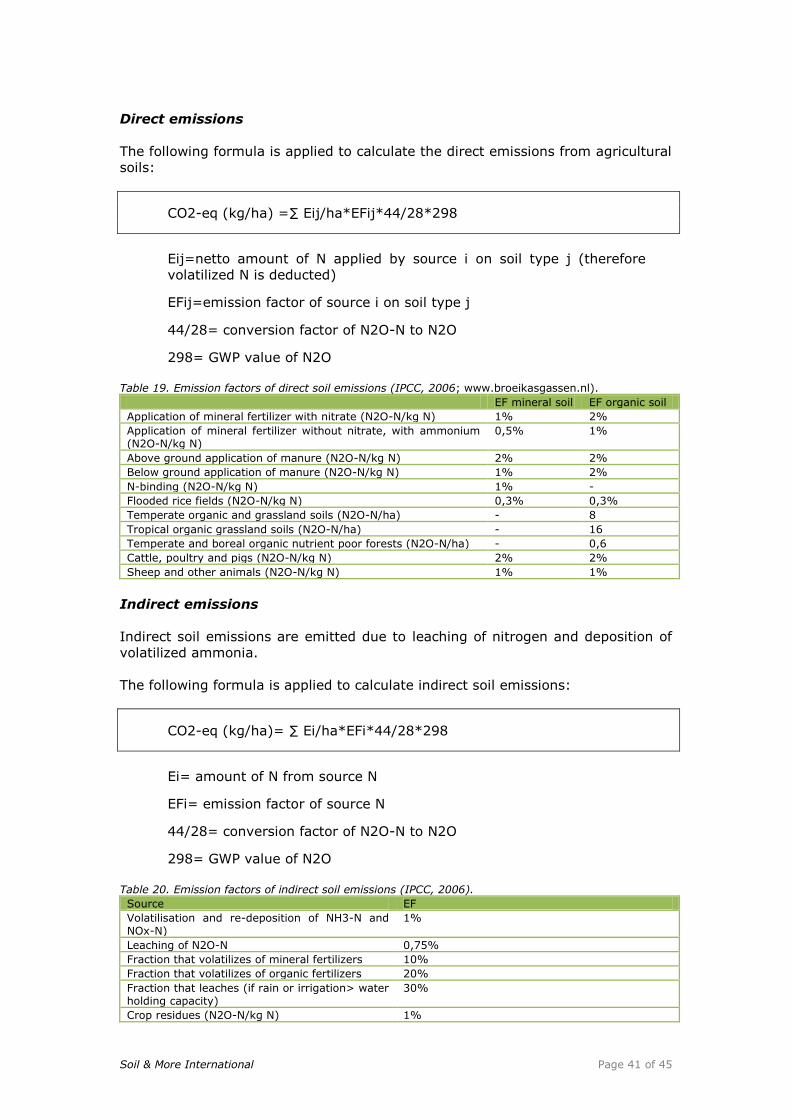
Soil & More International Page 41 of 45
Direct emissions
The following formula is applied to calculate the direct emissions from agricultural
soils:
CO2-eq (kg/ha) =∑ Eij/ha*EFij*44/28*298
Eij=netto amount of N applied by source i on soil type j (therefore
volatilized N is deducted)
EFij=emission factor of source i on soil type j
44/28= conversion factor of N2O-N to N2O
298= GWP value of N2O
Table 19. Emission factors of direct soil emissions (IPCC, 2006; www.broeikasgassen.nl).
EF mineral soil EF organic soil
Application of mineral fertilizer with nitrate (N2O-N/kg N) 1% 2%
Application of mineral fertilizer without nitrate, with ammonium (N2O-N/kg N)
0,5% 1%
Above ground application of manure (N2O-N/kg N) 2% 2%
Below ground application of manure (N2O-N/kg N) 1% 2%
N-binding (N2O-N/kg N) 1% -
Flooded rice fields (N2O-N/kg N) 0,3% 0,3%
Temperate organic and grassland soils (N2O-N/ha) - 8
Tropical organic grassland soils (N2O-N/ha) - 16
Temperate and boreal organic nutrient poor forests (N2O-N/ha) - 0,6
Cattle, poultry and pigs (N2O-N/kg N) 2% 2%
Sheep and other animals (N2O-N/kg N) 1% 1%
Indirect emissions
Indirect soil emissions are emitted due to leaching of nitrogen and deposition of
volatilized ammonia.
The following formula is applied to calculate indirect soil emissions:
CO2-eq (kg/ha)= ∑ Ei/ha*EFi*44/28*298
Ei= amount of N from source N
EFi= emission factor of source N
44/28= conversion factor of N2O-N to N2O
298= GWP value of N2O
Table 20. Emission factors of indirect soil emissions (IPCC, 2006).
Source EF
Volatilisation and re-deposition of NH3-N and NOx-N)
1%
Leaching of N2O-N 0,75%
Fraction that volatilizes of mineral fertilizers 10%
Fraction that volatilizes of organic fertilizers 20%
Fraction that leaches (if rain or irrigation> water holding capacity)
30%
Crop residues (N2O-N/kg N) 1%
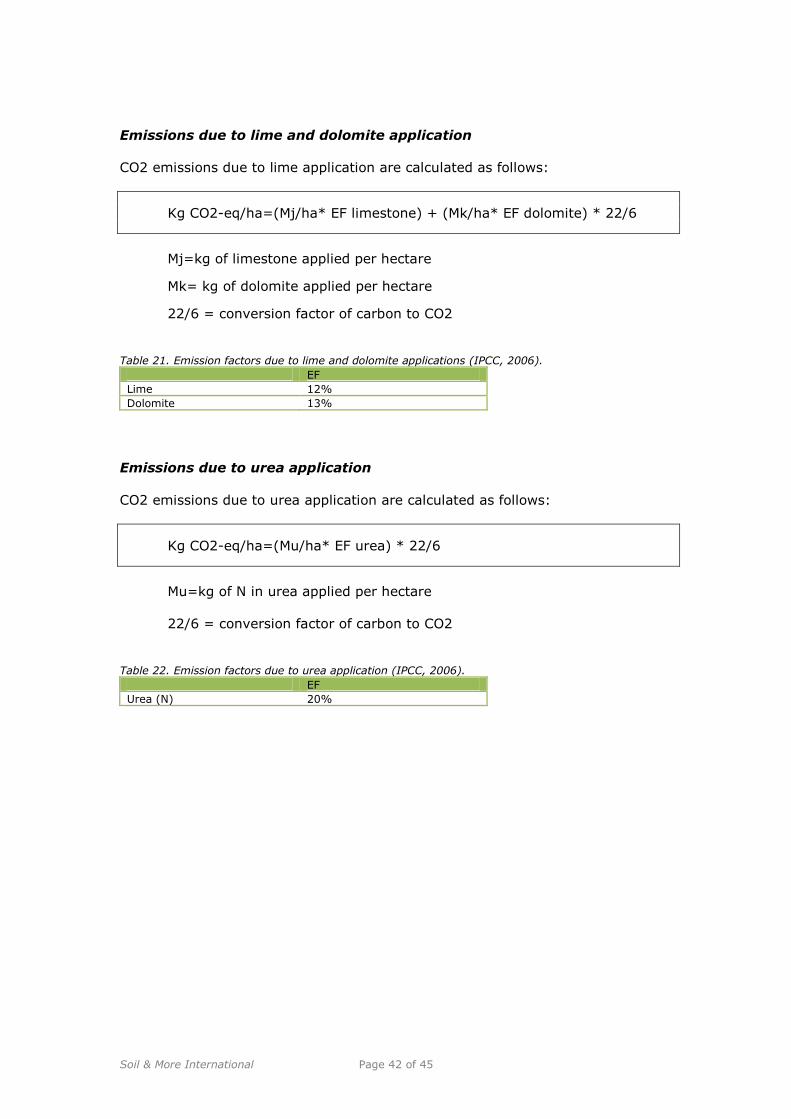
Soil & More International Page 42 of 45
Emissions due to lime and dolomite application
CO2 emissions due to lime application are calculated as follows:
Kg CO2-eq/ha=(Mj/ha* EF limestone) + (Mk/ha* EF dolomite) * 22/6
Mj=kg of limestone applied per hectare
Mk= kg of dolomite applied per hectare
22/6 = conversion factor of carbon to CO2
Table 21. Emission factors due to lime and dolomite applications (IPCC, 2006).
EF
Lime 12%
Dolomite 13%
Emissions due to urea application
CO2 emissions due to urea application are calculated as follows:
Kg CO2-eq/ha=(Mu/ha* EF urea) * 22/6
Mu=kg of N in urea applied per hectare
22/6 = conversion factor of carbon to CO2
Table 22. Emission factors due to urea application (IPCC, 2006).
EF
Urea (N) 20%
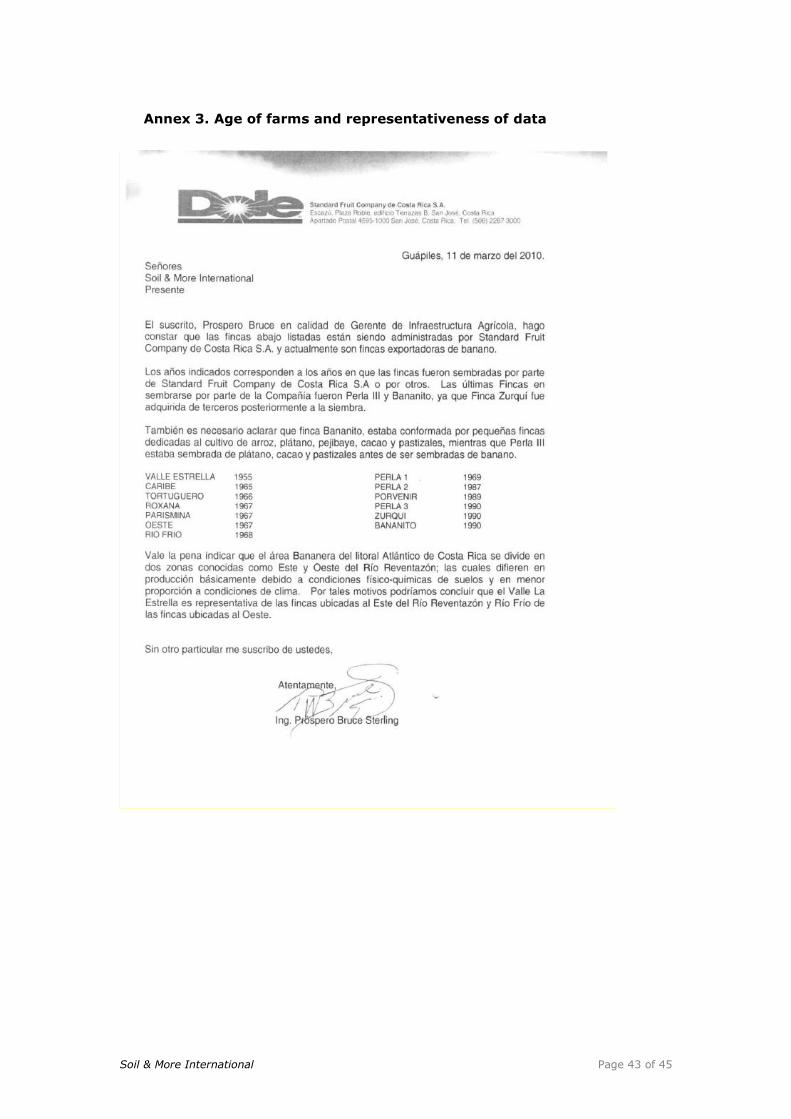
Soil & More International Page 43 of 45
Annex 3. Age of farms and representativeness of data
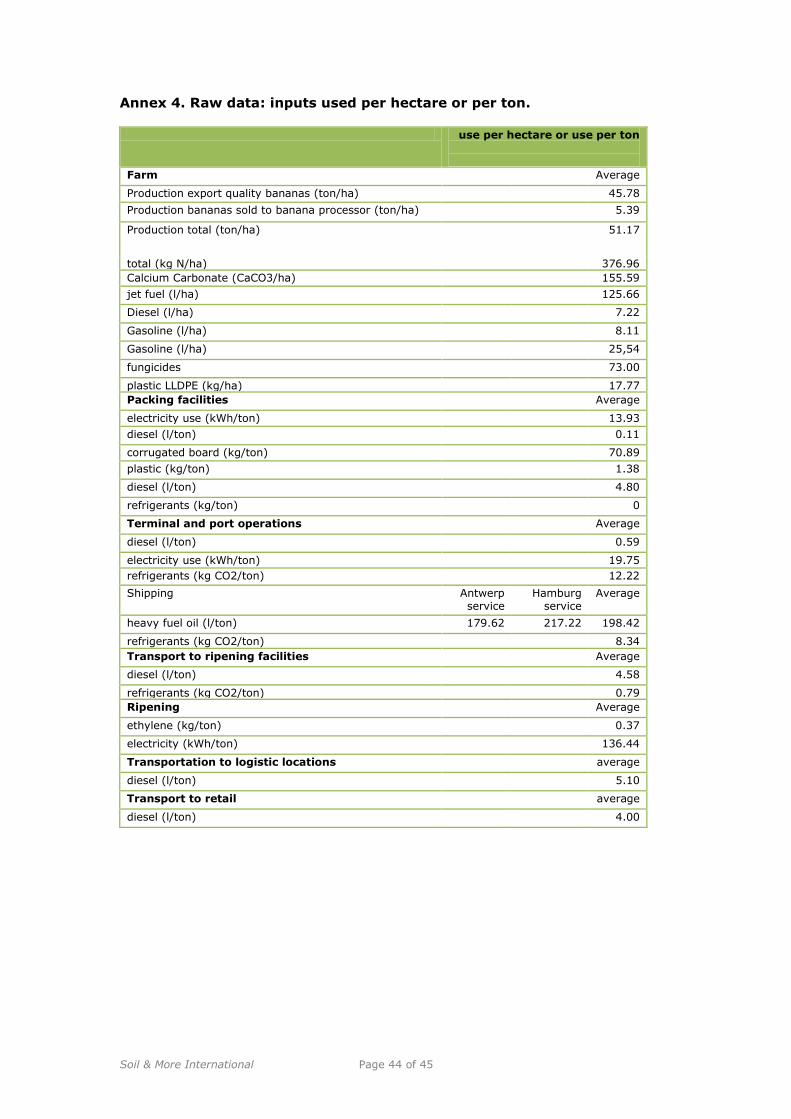
Soil & More International Page 44 of 45
Annex 4. Raw data: inputs used per hectare or per ton.
use per hectare or use per ton
Farm Average
Production export quality bananas (ton/ha) 45.78
Production bananas sold to banana processor (ton/ha) 5.39
Production total (ton/ha) 51.17
total (kg N/ha) 376.96
Calcium Carbonate (CaCO3/ha) 155.59
jet fuel (l/ha) 125.66
Diesel (l/ha) 7.22
Gasoline (l/ha) 8.11
Gasoline (l/ha) 25,54
fungicides 73.00
plastic LLDPE (kg/ha) 17.77
Packing facilities Average
electricity use (kWh/ton) 13.93
diesel (l/ton) 0.11
corrugated board (kg/ton) 70.89
plastic (kg/ton) 1.38
diesel (l/ton) 4.80
refrigerants (kg/ton) 0
Terminal and port operations Average
diesel (l/ton) 0.59
electricity use (kWh/ton) 19.75
refrigerants (kg CO2/ton) 12.22
Shipping Antwerp service
Hamburg service
Average
heavy fuel oil (l/ton) 179.62 217.22 198.42
refrigerants (kg CO2/ton) 8.34
Transport to ripening facilities Average
diesel (l/ton) 4.58
refrigerants (kg CO2/ton) 0.79
Ripening Average
ethylene (kg/ton) 0.37
electricity (kWh/ton) 136.44
Transportation to logistic locations average
diesel (l/ton) 5.10
Transport to retail average
diesel (l/ton) 4.00
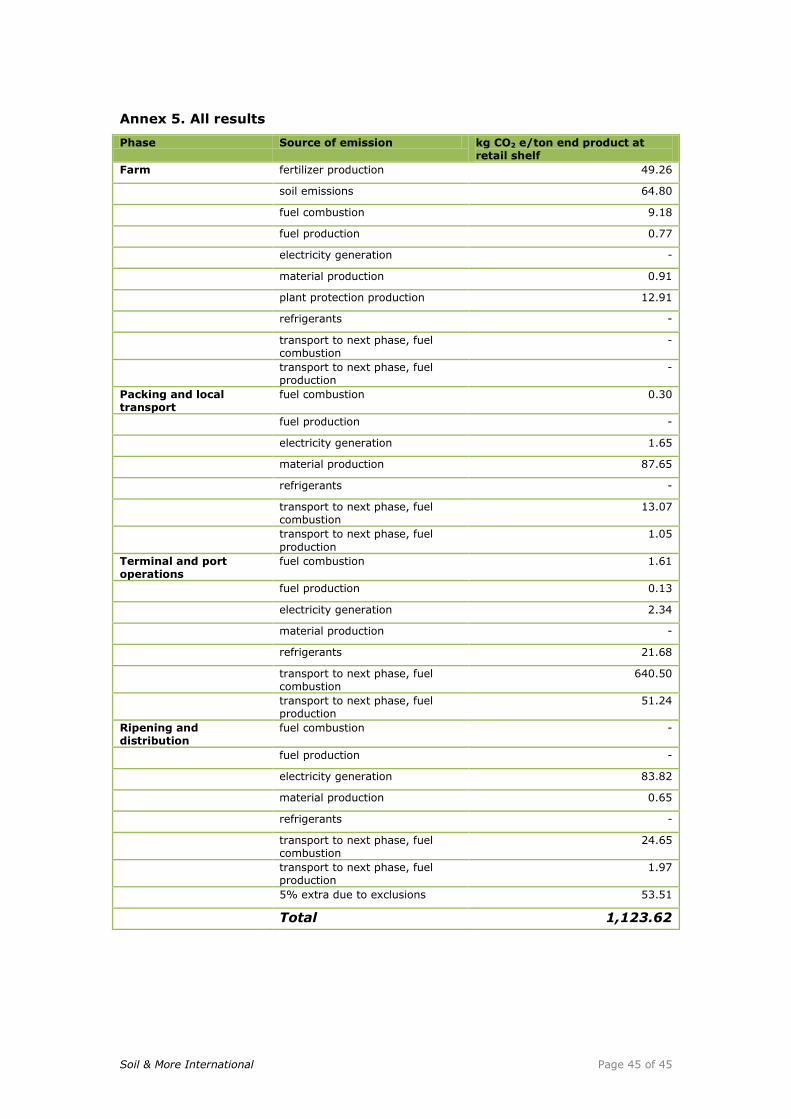
Soil & More International Page 45 of 45
Annex 5. All results
Phase Source of emission kg CO2 e/ton end product at retail shelf
Farm fertilizer production 49.26
soil emissions 64.80
fuel combustion 9.18
fuel production 0.77
electricity generation -
material production 0.91
plant protection production 12.91
refrigerants -
transport to next phase, fuel combustion
-
transport to next phase, fuel production
-
Packing and local transport
fuel combustion 0.30
fuel production -
electricity generation 1.65
material production 87.65
refrigerants -
transport to next phase, fuel combustion
13.07
transport to next phase, fuel
production
1.05
Terminal and port operations
fuel combustion 1.61
fuel production 0.13
electricity generation 2.34
material production -
refrigerants 21.68
transport to next phase, fuel combustion
640.50
transport to next phase, fuel production
51.24
Ripening and distribution
fuel combustion -
fuel production -
electricity generation 83.82
material production 0.65
refrigerants -
transport to next phase, fuel combustion
24.65
transport to next phase, fuel production
1.97
5% extra due to exclusions 53.51
Total 1,123.62