soil quality effects of compost and manure in arable cropping · preface 3 preface effects of...
TRANSCRIPT

Soil quality effects of compost and manure
in arable cropping
Results from using soil improvers
for 17 years in the MAC trial
Chris Koopmans Jaap Bloem

© 2018 Louis Bolk Institute
Soil quality effects of compost and manure in ara-
ble cropping - Results from using soil improvers for
17 years in the MAC trial
Chris J. Koopmans and Jaap Bloem
Publication number 2018-001 LbP
40 pages
This publication is available at
www.louisbolk.nl/publicaties
www.louisbolk.org
T +31 343 523 860
Kosterijland 3-5
3981 AJ Bunnik
The Netherlands
@LouisBolk
Louis Bolk Institute: Research and advice to advance
sustainable agriculture, nutrition and health

Preface 3
Preface
Effects of organic applications on soil fertility and yield stability were evaluated. The evaluation
provides knowledge of the different returns and yield stability strategies in relation to the soil qual-
ity parameters and ecosystem services.
In this research, long-term effects are evaluated of eight fertilization strategies based on compost,
organic manure and mineral fertilizer and their impact on soil chemical, physical and biological
parameters indicating overall soil fertility. The trial, started in 1999, is carried out at the arable
farm Arenosa in Lelystad, The Netherlands. The ‘Manure as a Chance’ trial as it is called, is unique
in its kind and, as far as known, there is no comparable experimental test in the world where the
medium term effect of soil fertility can be assessed with thirteen different manure and compost
types. This trial field has been set up and is managed by the Louis Bolk Institute.
We thank very much the farmer Jan van Geffen for his time and effort in managing the field.
Financial support through the Dutch public-private program on Improving Soil Management, fund-
ed by the Dutch Ministry of Economic Affairs.
This evaluation could not be performed without the contributions of former colleague and founder
of the trial Jan Bokhorst and the contribution of many colleagues and students in the course of the
experiment.
We also thank Monique Hospers, Riekje Bruinenberg en Hans Dullaert of the Louis Bolk Institute for
their contribution to the field and lab work, the laboratory of Wageningen Environmental Research
for analyzing soil biological parameters and Harm Keidel (LIOS) for determining nematode composi-
tions. Bart Timmermans contributed with inspiring discussions on the results.


Contents 5
Contents
Summary 7
Samenvatting 9
1 Introduction 11
2 Materials and methods 13
Study site and experimental design 13 Fertilization 14 Crop rotation 15 Crop yields 15 Soil sampling and chemical, physical and biological parameters determined 16 Chemical parameters 16 Physical parameters 17 Biological parameters 17 Statistical analysis 18
3 Results 19
Crop yield and development 19 Soil chemical parameters 20 Soil physical parameters 22 Soil biological parameters 22
4 Discussion and conclusion 25
Effects on soil organic matter 25 Effects on potential nitrogen mineralization and yield 26 Effects on soil life 28
References 30
Appendix 1 32
Appendix 2 33
Appendix 3 34
Appendix 4 35
Appendix 5 36
Appendix 6 37
Appendix 7 38
Appendix 8 39
Appendix 9 40

6 Soil quality effects of compost and manure in arable cropping

Introduction 7
Summary
There are many factors to consider when deciding how to maintain a sustainable soil fertility in
arable cropping. Multi-year research into the divergent effects of fertilizers can help considerably.
The hypothesis of this study is that the fertilizer strategy including the quantity and quality of the
organic substance applied, in the end determines soil quality as well as the yield capacity of the
soil.
In this study three fertilization strategies are compared: (i) fertilization mainly for the purpose of
feeding plants: mineral fertilizer or slurry treatments; (ii) Fertilization with the purpose of feeding
the soil: plant composts, household compost and nature compost treatments; (iii) Fertilization both
for plant and soil feeding: poultry manure, household compost&slurry and deep stable manure
treatments. North of the city of Lelystad, The Netherlands these eight fertilizer treatments are
compared in a completely randomized block design in an intensive rotation including crops like
potatoes, carrots, parsnip and salsify. Soil samples were taken after the growing season in 2016, 17
years after the start of the experiment.
Yields for the plant feeding, soil & plant feeding and soil feeding strategies diverged during this
period. The relative yield of the plant feeding strategy remained stable. For the soil feeding strate-
gies, yields declined over time, while the soil & plant feeding fertilization strategies resulted in in-
creasing yields during the course of the experiment.
After 17 years, significant effects were found for organic matter and labile organic matter levels in
the soil. Highest levels of organic matter (+41%) were found in the nature compost treatment. Also
deep stable manure (+31%) and household compost&slurry (+22%) increased soil organic matter
levels significantly. Mineral fertilizer and slurry remained at levels similar to the start of the exper-
iment (1.6%). Higher soil organic matter additions corresponded with higher soil organic matter
levels found after 17 years. Labile soil organic matter (determined as Hot Water extractable Car-
bon) was found to be highest in the stable manure, followed by household compost&slurry and
nature compost treatments.
Mineralization of nitrogen in the soil was affected by the fertilizer additions. It remained lowest in
the mineral fertilizer treatment. The deep stable manure resulted in a mineralization, which was
considerably higher if compared to mineral fertilizer (+ 70%) followed by nature compost (+ 58%),
and the household compost&slurry combination (+39%). The soil mineralizable C followed a pat-
tern similar to the level of soil organic matter.
Limited effects of fertilizer additions were found on soil organisms. Earthworms showed highest
numbers in the poultry manure treatment compared to all other treatments. Organic matter addi-
tions did not change overall bacterial biomass, but fungal biomass was significantly higher in the
mineral fertilizer treatment. The low mineralization in the mineral fertilizer treatment combined
with a high fungal biomass could be an indication of a low nutrient availability at the end of the
growing season.
Nematode abundance was highest in the deep stable manure and nature compost treatments,
followed by the mineral fertilizer and plant compost treatments. Herbivorous and bacterivorous
nematodes dominated, with highest numbers in the nature compost followed by mineral fertilizers
and plant compost treatments.
Overall, it might be concluded that best results are obtained with fertilizers used for both crop
nutrition and building soil quality: deep stable manure, household compost&slurry and poultry
manure. Although there are positive indications on total organic matter, total C and labile organic
matter, the build-up of the soil organisms is slow which might also be a result from the light soil
and the intensive rotation and soil cultivation.

8 Soil quality effects of compost and manure in arable cropping

Introduction 9
Samenvatting
Bij het inzetten op een duurzame bodemvruchtbaarheid voor de akkerbouw moet met meerdere
factoren rekening worden gehouden. Meerjarig onderzoek naar de uiteenlopende effecten van
meststoffen kan aanzienlijk helpen om inzicht te krijgen in de effecten van meststoffen voor gewas,
de bodem en het bodemleven. In deze studie is de hypothese dat de hoeveelheid en kwaliteit van
de toegepaste organische meststoffen op de lange termijn bepalend is voor de bodemkwaliteit en
de opbrengstcapaciteit van de bodem.
Drie bemestingsstrategieën zijn daarbij vergeleken: (i) bemesting voornamelijk gericht op het voe-
den van de planten: minerale meststof en drijfmest; (ii) Bemesting voornamelijk gericht op het
voeden van de bodem: groencompost, GFT-compost en natuurcompost; (iii) Bemesting gericht op
het voeden van zowel de planten- alsook de bodem: pluimveemest, een combinatie van
GFT&drijfmest en potstalmest. In een gewarde blokkenproef op het biologische bedrijf Arenosa ten
noorden van Lelystad zijn de effecten van bovenstaande acht bemestingsvarianten in een intensie-
ve rotatie met o.a. aardappel, peen, pastinaak en schorseneer na 17 jaar met elkaar vergeleken.
De opbrengsten van gewassen lopen voor de 3 strategieën uiteen. De relatieve opbrengst van de
op de voeding van planten gerichte strategie bleef stabiel. Bij de bodem voedende strategie daal-
den de opbrengsten over de jaren, terwijl de bodem- en planten voedende bemestingsstrategie
resulteerde in toenemende opbrengsten in de loop van het experiment.
De grootste toename aan bodemorganische stof werd in de natuurcompost gevonden (+ 41%). Ook
de potstalmest resulteerde in een toename (+31%) evenals de GFT&drijfmest variant (+ 22%). Bij de
minerale mest en drijfmest bleef het organische stofgehalte dicht bij de uitgangssituatie (1,6%). De
in de bodem aangetroffen organische stof correleerde sterk met de totale hoeveelheid organische
stof toegediend met de bemesting gedurende 17 jaar. De meeste labiele organische stof werd aan-
getroffen in de stalmest variant, gevolgd door GFT compost&drijfmest en natuurcompost.
De mineraliseerbare stikstof in de bodem werd sterk beïnvloed door de toegediende meststoffen.
Mineraliseerbare stikstof bleef het laagst in de minerale mest variant. De potstalmest resulteerde
in de hoogste mineralisatie (+ 70% ten opzichte van minerale mest) gevolgd door natuurcompost (+
58%) en GFT compost&drijfmest (+ 39%). De mineraliseerbare koolstof C volgde een patroon dat
vergelijkbaar is met het verloop van de organische stof in de bodem.
De effecten van de organische meststoffen op bodemleven bleven ook na 17 jaar relatief beperkt.
Regenwormen vertoonden hogere aantallen in de pluimveemest vergeleken met alle andere vari-
anten. De organische meststoffen hadden geen effect op de totale bacteriële biomassa, wel wer-
den verschillen in schimmelbiomassa gevonden met significant meer schimmels in de minerale
mest variant. De lage mineralisatie in deze variant in combinatie met de hoge schimmelbiomassa
kan een aanwijzing zijn voor een lage beschikbaarheid van voedingsstoffen ten tijde van de meting
in het najaar. Mogelijk is hierbij sprake van grotere hoeveelheden mycorrhiza schimmels.
Grootste aantallen nematoden werden in de potstalmest en natuurcompost gevonden gevolgd
door de minerale mest en groencompost varianten. Herbivore en bacterivore nematoden domi-
neerden bij de natuurcompost gevolgd door minerale mest en groencompost.
Al met al kan worden geconcludeerd dat de beste resultaten kunnen worden behaald met mest-
stoffen die zowel op voeding van het gewas alsook op de opbouw van de bodem zijn gericht: pot-
stalmest, GFT compost&drijfmest en pluimveemest. Zowel de organische stof alsook de labiele
organisch stof laten daarbij duidelijke effecten zien, maar veranderingen in bodemleven komen
minder naar voren en lijken traag te verlopen. De lichte zavelgrond maar ook het relatief intensieve
bouwplan met een intensieve grondbewerking tot gevolg zouden hieraan ten grondslag kunnen
liggen.

10 Soil quality effects of compost and manure in arable cropping

Introduction 11
1 Introduction
The Dutch Agri & Food Agenda aims to make agricultural production systems more circular. For in-
stance by reducing and recycling waste: ‘The growth of the world's population demands additional
efforts to improve productivity and resource efficiency. Robust plant production with a high soil quali-
ty is central for achieving this aim.
However, for farmers legislation is becoming more complex which results in fewer options for improv-
ing yields and at the same time maintaining soil fertility. There are different requirements to the use of
various natural inputs like manure or compost (levels of nitrogen, phosphate, etc.). Reduction of nutri-
ent losses like nitrate leaching is essential within the European nitrate directive. This often makes it
easier to meet requirements with mineral fertilizers because it is available in any desired composition.
Organic fertilizers however, contribute to a robust production through the unique combination of
nutrients with carbon rich materials. This means nutrition for soil life with biodiversity and nutrient
availability as a result. In addition, carbon storage and increased water regulation of soils are societal
issues that require more and more focus and attention of farmers when using inputs.
How to make the right choices between short-term yield and long-term production stability, between
business interests and societal requirements? Are the apparent contradictions bridgeable here? In
order to combine and optimize all requirements, knowledge about the fate of organic matter is re-
quired. The effect of organic matter inputs on soil quality is only partly visible in the medium to long
term.
There are many factors to consider when deciding how to fertilize agricultural crops. Each fertilizer has
its advantages and disadvantages, and they are not easy to weigh up. Multi-year research into the diver-
gent effects of fertilizers can help considerably. In the first instance, it is important to know how to
achieve good yields. The next question is whether the choice of fertilizer based on this premise will con-
tinue to give a good yield over the longer term. Think, for example, of the build-up of organic matter in
the soil. There may be a link between fertilizer use, soil biodiversity and disease suppression; and this in
turn affects production losses due to pests and diseases, and the use of crop protection products. In
respect of climate change it is important to maintain, or (based on the field trial) even increase the or-
ganic matter content of the soil. Finally, biodiversity is increasingly considered as an important product
in itself. With so many issues to consider, it is not easy to make the right choice. In this publication, we
discuss the work done in the field trial and the most significant results after seventeen years of following
different fertilization strategies.
The hypothesis of this study is that the fertilizer strategy including the quantity and quality of the
organic substance applied, in the long run determines soil quality as well as the yield capacity of
the soil. More specific questions are:
• What is the impact of the amount and composition of the manure or compost on soil quality in
the long run?
• Which type and composition of organic matter enhance the required services like stability of
production, soil biodiversity and carbon sequestration in the soil?
• Which fertilizer or combination of fertilizers performs best within legal requirements to serve
these multiple goals?

12 Soil quality effects of compost and manure in arable cropping
Materials and methods 13
2 Materials and methods
Study site and experimental design
The experiment is located north of the city of Lelystad in the province of Flevoland (52.32° N, 5.30° E).
Since 1999, thirteen fertilization treatments are compared in a completely randomized block design
with four replicates. Every field plot is 7x9 m.
The trial field has a calcium-rich loam soil with 9% clay and 4.4% lime. At the start of the experi-
ment, the soil organic matter content was 1.6% (Table 1). The top soil is around 30 cm deep and
deeper a stratified subsoil is found with alternating layers with low humus content.
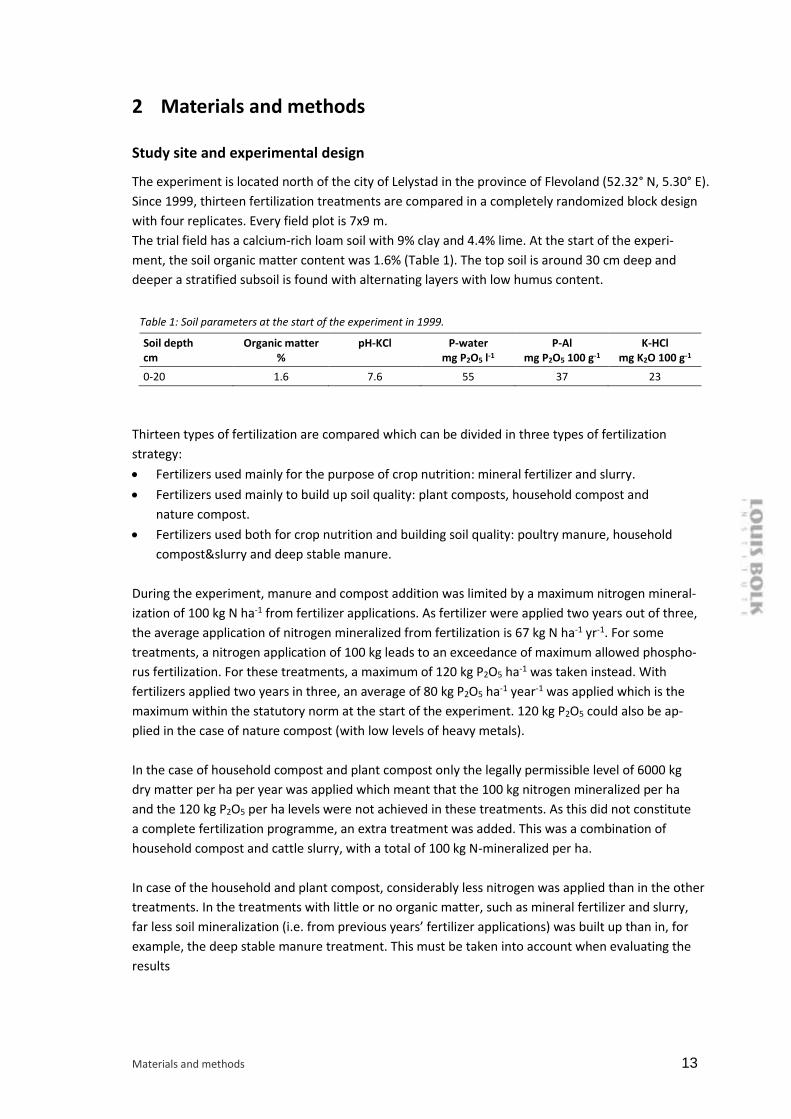
Table 1: Soil parameters at the start of the experiment in 1999.
Soil depth cm
Organic matter %
pH-KCl P-water mg P2O5 l-1
P-Al mg P2O5 100 g-1
K-HCl mg K2O 100 g-1
0-20 1.6 7.6 55 37 23
Thirteen types of fertilization are compared which can be divided in three types of fertilization
strategy:
• Fertilizers used mainly for the purpose of crop nutrition: mineral fertilizer and slurry.
• Fertilizers used mainly to build up soil quality: plant composts, household compost and
nature compost.
• Fertilizers used both for crop nutrition and building soil quality: poultry manure, household
compost&slurry and deep stable manure.
During the experiment, manure and compost addition was limited by a maximum nitrogen mineral-
ization of 100 kg N ha-1 from fertilizer applications. As fertilizer were applied two years out of three,
the average application of nitrogen mineralized from fertilization is 67 kg N ha-1 yr-1. For some
treatments, a nitrogen application of 100 kg leads to an exceedance of maximum allowed phospho-
rus fertilization. For these treatments, a maximum of 120 kg P2O5 ha-1 was taken instead. With
fertilizers applied two years in three, an average of 80 kg P2O5 ha-1 year-1 was applied which is the
maximum within the statutory norm at the start of the experiment. 120 kg P2O5 could also be ap-
plied in the case of nature compost (with low levels of heavy metals).
In the case of household compost and plant compost only the legally permissible level of 6000 kg
dry matter per ha per year was applied which meant that the 100 kg nitrogen mineralized per ha
and the 120 kg P2O5 per ha levels were not achieved in these treatments. As this did not constitute
a complete fertilization programme, an extra treatment was added. This was a combination of
household compost and cattle slurry, with a total of 100 kg N-mineralized per ha.
In case of the household and plant compost, considerably less nitrogen was applied than in the other
treatments. In the treatments with little or no organic matter, such as mineral fertilizer and slurry,
far less soil mineralization (i.e. from previous years’ fertilizer applications) was built up than in, for
example, the deep stable manure treatment. This must be taken into account when evaluating the
results

14 Soil quality effects of compost and manure in arable cropping
For this evaluation, more frequent and elaborate measurements were done in eight of the thirteen
treatments. In this study, the main focus is on these eight treatments; mineral fertilizer (M), slurry
(S), poultry manure (PM), household compost&slurry (HCS), deep stable manure (DSM), plant com-
post (PM; lightly composted), household compost (HC) and nature compost (NC).
\
Illustration 1: Fertilizer application in the field (from top left to bottom right) mineral fertilizer (M), slurry (S), poul-try manure (PM), household compost&slurry (HCS), deep stable manure (DSM), plant compost (PC), household compost (HC) and nature compost (NC).
Fertilization
Manure and compost addition was limited by a maximum nitrogen mineralization of 100 kg nitro-
gen per ha per year from the fertilizer applications. As fertilizer was applied two years in three, the
average nitrogen mineralized from fertilization was 67 kg N ha-1 mineralized or 80 kg P2O5 ha-1. In
order to do this, the amount of manure applied was based on measured N and P2O5 content of the
manure. If no measurements were available beforehand, the amount was based on the nutrient
contents of previous years. Because the nutrient content is not constant, applied nutrient applica-
tion varied somewhat over years. The manures were applied in May, regardless of the preceding
crops.
Table 2 summarizes the average nutrient and organic matter additions of the eight selected treat-
ments. Table 3 summarizes the years of application.
Materials and methods 15
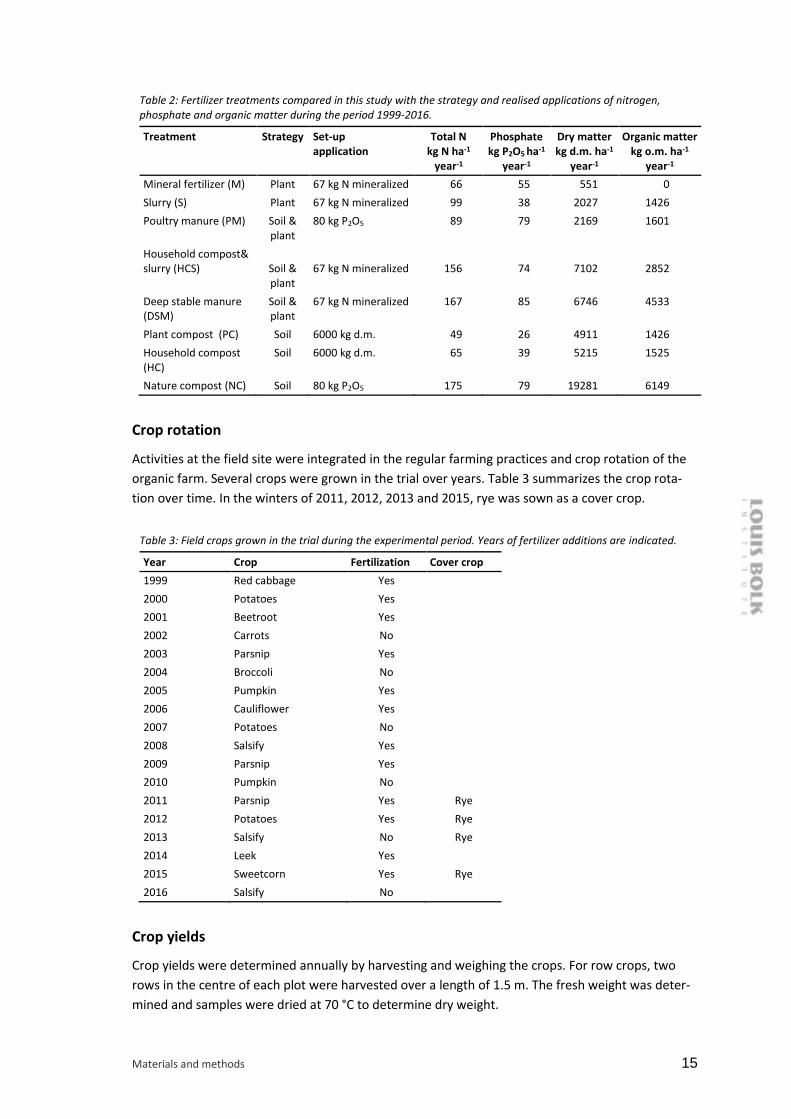
Table 2: Fertilizer treatments compared in this study with the strategy and realised applications of nitrogen, phosphate and organic matter during the period 1999-2016.
Treatment Strategy Set-up application
Total N kg N ha-1
year-1
Phosphate
kg P2O5 ha-1 year-1
Dry matter kg d.m. ha-1
year-1
Organic matter kg o.m. ha-1
year-1
Mineral fertilizer (M) Plant 67 kg N mineralized 66 55 551 0
Slurry (S) Plant 67 kg N mineralized 99 38 2027 1426
Poultry manure (PM) Soil & plant
80 kg P2O5 89 79 2169 1601
Household compost& slurry (HCS)
Soil & plant
67 kg N mineralized
156
74
7102
2852
Deep stable manure (DSM)
Soil & plant
67 kg N mineralized 167 85 6746 4533
Plant compost (PC) Soil 6000 kg d.m. 49 26 4911 1426
Household compost (HC)
Soil 6000 kg d.m. 65 39 5215 1525
Nature compost (NC) Soil 80 kg P2O5 175 79 19281 6149
Crop rotation
Activities at the field site were integrated in the regular farming practices and crop rotation of the
organic farm. Several crops were grown in the trial over years. Table 3 summarizes the crop rota-
tion over time. In the winters of 2011, 2012, 2013 and 2015, rye was sown as a cover crop.
Table 3: Field crops grown in the trial during the experimental period. Years of fertilizer additions are indicated.
Year Crop Fertilization Cover crop
1999 Red cabbage Yes
2000 Potatoes Yes
2001 Beetroot Yes
2002 Carrots No
2003 Parsnip Yes
2004 Broccoli No
2005 Pumpkin Yes
2006 Cauliflower Yes
2007 Potatoes No
2008 Salsify Yes
2009 Parsnip Yes
2010 Pumpkin No
2011 Parsnip Yes Rye
2012 Potatoes Yes Rye
2013 Salsify No Rye
2014 Leek Yes
2015 Sweetcorn Yes Rye
2016 Salsify No
Crop yields
Crop yields were determined annually by harvesting and weighing the crops. For row crops, two
rows in the centre of each plot were harvested over a length of 1.5 m. The fresh weight was deter-
mined and samples were dried at 70 °C to determine dry weight.

16 Soil quality effects of compost and manure in arable cropping
In order to make yields comparable over years with different crops, the relative yield was calculat-
ed for each treatment. The relative yield for a given year was calculated as the yield relative to the
average yield over all treatments in that year.
𝑅𝑒𝑙. 𝑦𝑖𝑒𝑙𝑑𝑖𝑡 = 𝑌𝑖𝑡
1𝑛
∑ 𝑌𝑖𝑡𝑛𝑖=1
∗ 100
Where 𝑡 is the year the average is calculated for and 𝑌𝑖 is the yield for treatment 𝑖.
Soil sampling and chemical, physical and biological parameters determined
Soil samples were collected for chemical, physical and biological parameters on 15th September 2016.
A bulk sample of 40 cores (0-10 cm, diameter of 2.3 cm) per plot was collected, sieved through a 1
cm mesh, homogenized and stored at field moisture content at 4 °C before analysis. Subsamples
were taken for chemical, microbiological and nematode analysis.
Table 4: Soil chemical, physical and biological parameters determined in this study
Parameter Depth (cm) Unit
pH-KCL 0-10 -log[H+]
Soil Organic Matter 0-10 %
Hot Water extractable C 0-10 µC g-1
C-total 0-10 g C kg dry soil -1
N-total 0-10 g N kg dry soil -1
P-total 0-10 mg P2O5 100 g-1
P-plant 0-10 mg P kg-1
K 0-10 mg K kg-1
Ca 0-10 mmol Ca L-1
Mg 0-10 mg Mg kg-1
Bulk density 2,5-7,5 g cm-3
Soil structure 0-10 % crumb, sub angular, angular
Soil structure 10-20 % crumb, sub angular, angular
Macro pores 0-10 n m-2
Macro pores 10-20 n m-2
Mineralizable N 0-10 mg N kg dry soil-1
Mineralizable C 0-10 mg CO2 kg dry soil-1
Number of earthworms 10-20 n m-2
Bacterial biomass 0-10 µg C g dry soil-1
Fungal biomass 0-10 µg C g dry soil-1
Active fungi 0-10 µg C g dry soil-1
Number of nematodes 0-10 n 100 g soil-1
Chemical parameters
For each site, soil from the bulk sample was oven-dried at 40 °C prior to analysis of soil acidity (pH-
KCl), soil organic matter (SOM), total carbon (C-total), total nitrogen (N-total), total phosphorous
(P-total) and CaCl2-extractable P (P-plant). All chemical analysis were determined at Eurofins Agro.
Soil pH-KCl was measured in 1 M KCl. Soil organic matter was calculated from determination of
organic C by near infrared spectroscopy (NIRS).
C-total was measured by incineration of dry material at 1150 °C, after which the CO2 produced was
determined by an infrared detector (LECO Corporation, St. Joseph, Mich., USA). Amount of non-
organic C was negligible. For determination of N-total, evolved gasses after incineration were re-

Materials and methods 17
duced to N2 and measured with a thermal-conductivity detector (LECO Corporation, St. Joseph,
Mich., USA).
Hot Water extractable Carbon (HWC) was determined as the amount of dissolved organic carbon
that is released during incubation of a soil sample in hot water during 16 hours at 80°C (Ghani et al,
2003). This is a measure of easily decomposable (labile) organic carbon. The HWC fraction of organ-
ic matter is rich in amorphous polysaccharides (mucigel) which originate mainly from microbial
exudates and to a lesser extent from plant exudates. This fraction is highly available to microorgan-
isms and is also regarded as one of the key labile components of organic matter responsible for soil
micro-aggregation which is an important soil physical parameter to consider in terms of soil quality
(Ghani et al., 2003; Haynes, 2005).
P-total was measured with Fleishmann acid (Houba et al., 1997) and plant available P, K, Ca and Mg
in a 0.01 M CaCL2 extract according to Houba et al. (1997).
Physical parameters
To determine soil bulk density, stainless steel rings were inserted at 2.5-7.5 cm soil depth. In each
of the four replicate plots, four density samples were taken of 100 cm3. After drying (24 h at 105⁰C)
the weight per volume was determined.
Soil structure was determined at each plot in 1 block (20 cm x 20 cm x 10 cm) in the soil layers 0-10
cm and 10-20 cm. Soil of this block was divided by visual observation into crumbs, sub-angular
blocky elements (sub-angular) and angular blocky elements (angular). These were expressed as a
percentage of total soil volume in the block according to Koopmans et al. (2009).
On the horizontal surfaces (20 cm x 20 cm) exposed at 10 cm and 20 cm depth, the total number of
macro pores or earthworm burrows with a diameter of > 2 mm were counted.
Biological parameters
Mineralizable N was determined by anaerobic incubation of 16 g of soil in 40 ml water for 1 week
at 40 °C (Keeney and Nelson 1982; Canali and Benedetti 2006). These incubation conditions are
optimal for quick mineralization of organic matter by anaerobic bacteria. The lack of oxygen pre-
vents conversion of released NH4+ to NO3- (nitrification) and uncontrolled N losses by denitrifica-
tion cannot occur. After 1 week, NH4+ contents were determined by Segmented Flow Analysis.
Mineralizable N is a measure of labile, potentially plant available, organic N.
Mineralizable carbon was measured as CO2 production in three replicates per plot. Forty grams of
rewetted soil at 70% WHC was placed in a 0.5 L jar along with 10ml of 1M KOH and incubated for
one week at 20oC (Anderson, 1982). After one week, unreacted alkali in the KOH traps was back-
titrated with a 1 N HCl solution to determine CO2-C. Mineralizable C was calculated for the 7-days
period and is a measure of labile C that can be decomposed in the short term.
Earthworms were sampled in two blocks (20 cm x 20 cm x 20 cm) per plot. The earthworms were
hand-sorted in the field, counted and fixed in alcohol prior to identification. Numbers are ex-
pressed per m2. Adults were identified according to species. A distinction was made between
epigeic species (pigmented, living superficially in the litter layer, little burrowing activity, (2) en-
dogeic species (living in burrows at approximately 10-15 cm depth) and (3) anecic species (relative-
ly large worms, living in vertical burrows) (Bouché, 1977). Since only endogeic species were found
in the trial field all results refer to endogeic species.

18 Soil quality effects of compost and manure in arable cropping
Bacteria and fungi were determined in soil samples of 0-10 cm depth. Bacteria were measured by
confocal laser scanning microscopy and automatic image analysis (Leica TCS SP2 and Qwin Pro),
after staining of soil smears with DTAF. This is a fluorescent dye which binds to proteins (Bloem et
al., 1995). From the number and cell volume, bacterial biomass was calculated and expressed as µg
C g-1 soil. Fungi in soil smears were stained with Differential Fluorescent Stain, a mixture of two
stains: fluorescent brightener (blue) which binds to cell walls (polysaccharides) and europium che-
late (red) which binds to nucleic acids (DNA and RNA) (Morris et al., 1997). Thus active and inactive
hyphae were distinguished. In addition unstained melanized hyphae were counted by switching to
transmitted light. The total hyphal length measured under the microscope was used to calculate
fungal biomass in terms of µg C g-1 soil (Bloem and Vos, 2004).
Nematodes were determined from a 100 ml sub-sample from which the free-living nematodes
were extracted using the Oostenbrink elutriator (Oostenbrink, 1960). Total numbers were counted
and expressed per 100 g fresh soil. Nematodes were fixed in hot formaldehyde 4% and at least 150
randomly selected nematodes from each sample were identified to genus and species whenever
possible. Nematode genus and species were assigned to trophic groups following Yeates et al.
(1993) and allocated to the colonizer-persister groups (cp-groups) following Bongers (1990) and
Bongers et al. (1995). The Maturity Index was calculated as the weighted mean of the individual cp-
values, in accordance with Bongers (1990). It is an ecological measure, which indicates the condi-
tion of an ecosystem based on nematode species composition.
Statistical analysis
The data were analysed with GENSTAT (13.3th edition, VSN International Ltd., Hemel Hempstead,
UK) using the General Linear Models procedure in Genstat. Treatment and replicates were used as
factors in the model. Significant differences were determined based on least significant differences
(LSD, p<0.05).

Results 19
3 Results
Crop yield and development
Crop yields were significantly influenced by fertilizer application (Figure 1). Comparing the average
yield of salsify in 2016 shows that the fertilization with mineral fertilizer or plant compost resulted
in lowest yields compared to the other fertilization treatments. Highest yields were found in the
poultry manure, household compost&slurry and deep stable manure treatments (Figure 1) all be-
longing to the soil & plant feeding strategy.
Over a timeframe of 17 years, yields for the plant feeding, soil & plant feeding and soil feeding
strategies diverged. The relative yield of the plant feeding strategy was almost stable over the peri-
od of 17 years, but yields varied between different years, crops and treatments. For the soil feeding
strategies, yields declined over time, while the soil & plant feeding fertilization strategies resulted
in increasing yields during the course of the experiment (Figure 2). All changes are relative to the
average yield of a given year, therefore absolute changes cannot be determined from these results.
Variability in yield between years was large, for example nature compost showed a yield 2% above
average in 2014 (leek) and 56% below average in 2015 (sweetcorn). Of the compost strategies
feeding the soil, plant compost showed the lowest yields overall years and household compost the
highest, though this difference was not significant. For the plant & soil feeding fertilizers the high-
est yield was found for the household compost&slurry treatment.
Figure 1: Effect of fertilization treatment on fresh crop yield of salsify in 2016 for mineral fertilizer (M), slurry (S), poultry manure (PM), household compost&slurry (HCS), deep stable manure (DSM), plant compost (PC), household compost (HC) and nature compost (NC).
20 Soil quality effects of compost and manure in arable cropping
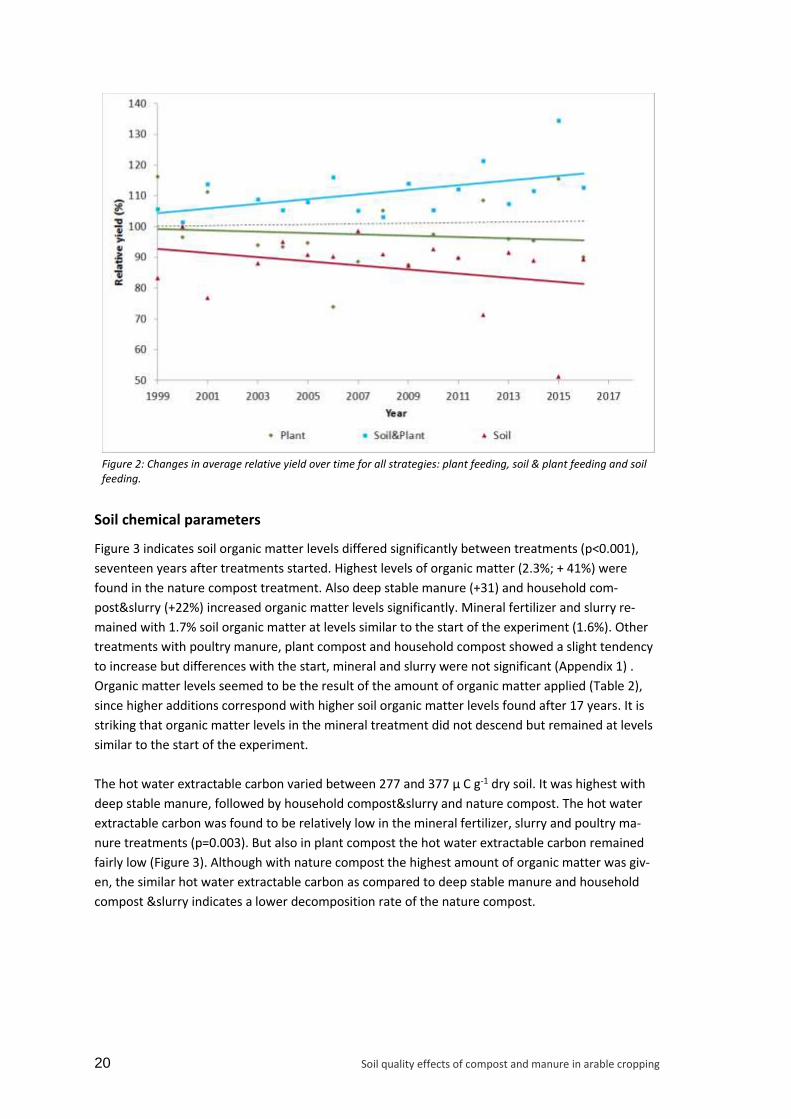
Figure 2: Changes in average relative yield over time for all strategies: plant feeding, soil & plant feeding and soil feeding.
Soil chemical parameters
Figure 3 indicates soil organic matter levels differed significantly between treatments (p<0.001),
seventeen years after treatments started. Highest levels of organic matter (2.3%; + 41%) were
found in the nature compost treatment. Also deep stable manure (+31) and household com-
post&slurry (+22%) increased organic matter levels significantly. Mineral fertilizer and slurry re-
mained with 1.7% soil organic matter at levels similar to the start of the experiment (1.6%). Other
treatments with poultry manure, plant compost and household compost showed a slight tendency
to increase but differences with the start, mineral and slurry were not significant (Appendix 1) .
Organic matter levels seemed to be the result of the amount of organic matter applied (Table 2),
since higher additions correspond with higher soil organic matter levels found after 17 years. It is
striking that organic matter levels in the mineral treatment did not descend but remained at levels
similar to the start of the experiment.
The hot water extractable carbon varied between 277 and 377 µ C g-1 dry soil. It was highest with
deep stable manure, followed by household compost&slurry and nature compost. The hot water
extractable carbon was found to be relatively low in the mineral fertilizer, slurry and poultry ma-
nure treatments (p=0.003). But also in plant compost the hot water extractable carbon remained
fairly low (Figure 3). Although with nature compost the highest amount of organic matter was giv-
en, the similar hot water extractable carbon as compared to deep stable manure and household
compost &slurry indicates a lower decomposition rate of the nature compost.

Results 21
Figure 3: Effect of fertilization treatment on organic matter in the soil (left) and hot water carbon (HWC, right) for mineral fertilizer (M), slurry (S), poultry manure (PM), household compost&slurry (HCS), deep stable manure (DSM), plant compost (PC), household compost (HC) and nature compost (NC) treatments.
Differences between treatments became more pronounced since 2006 but average levels re-
mained similar to 2006. In 2006, HWC with nature compost was higher than with plant compost
and mineral fertilizer, but no other significant differences were observed (Koopmans et al., 2006).
Other chemical soil parameters are presented in Appendix 1. A slightly significant effect of the ferti-
lizer additions on pH-KCL was found after 17 years of fertilizer additions with somewhat higher
levels in the plant and household compost treatments compared to the deep stable manure and
nature compost treatments. C-total and N-total also significantly differed between the fertilization
treatments. Highest levels for C- and N-total were found in the nature compost treatments fol-
lowed by deep stable manure and household compost&slurry. No differences were found in P-
total. Highest levels of plant available P were found in deep stable manure followed by household
compost&slurry and poultry manure. This corresponds with treatments receiving annual levels of
P2O5 of about 80 kg ha-1. An exception is the nature compost; here high P2O5 additions did not
result in higher availability. In addition, K and Mg showed highest availability in the deep stable
manure treatment followed by the household compost&slurry. No significant effect of treatments
on Ca availability was found.
Figure 4: Effect of fertilization treatment on angular soil structure (left) and macro pores at 20 cm soil depth (right) for mineral fertilizer (M), slurry (S), poultry manure (PM), household compost&slurry (HCS), deep stable manure (DSM), plant compost (PC), household compost (HC) and nature compost (NC) treatments.

22 Soil quality effects of compost and manure in arable cropping
Soil physical parameters
Fertilizer treatments did not significantly influence soil physical parameters in the upper 0-20 cm
soil layer. This may be partly due to the intensive soil cultivation at the site, which erases physical
changes easily. Bulk density was 1.25 g cm-3. Soil structure at 0-10 and 10-20 cm depth indicated no
differences between treatments and a very high within plot variability in angular soil structure.
Macro pores, mainly earthworm burrows, were found at numbers of 405 and 193 n m-2 at 10 and
20 cm soil depth respectively, indicating relatively high levels for an intensive vegetable rotation.
However, no statistical significant differences could be found as a result of, again, high variability.
Soil biological parameters
In the autumn of 2016, the nitrogen mineralization was on average 15.7 mg kg-1 dry soil. Minerali-
zation was affected by the fertilizer additions (p=0.001). It remained lowest in the mineral fertilizer
treatment. The deep stable manure resulted in a mineralization which was considerably higher
compared to mineral fertilizer (+70%) followed by nature compost (+58%) and the household com-
post&slurry combination (+39%). The deep stable manure resulted in the highest mineralization
followed by nature compost and the household compost&slurry combination.
The overall mineralizable nitrogen did not change between 2006 and 2016 but differences were
much more pronounced after 17 years. In 2006 no significant differences were observed between
the fertilizer treatments (Koopmans et al., 2006).
Figure 5: Effect of fertilization treatment on N mineralization (left) and soil mineralizable C (right) for mineral ferti-lizer (M), slurry (S), poultry manure (PM), household compost&slurry (HCS), deep stable manure (DSM), plant com-post (PC), household compost (HC) and nature compost (NC) treatments.
The mineralizable C was on average low at a level of 17.7 ± 3.5 mg CO2 100 g-1 wk-1. Mineralizable C
was lowest for poultry manure and highest for deep stable manure. The soil mineralizable C values
followed a similar pattern as the level of soil organic matter and were significantly different
(p=0.04).
The number of earthworms was on average 20 per m-2. Highest numbers were found in the poultry
manure treatment followed by the deep stable manure and nature compost treatment, respective-
ly. Lowest numbers were found in the mineral fertilizer treatment and the plant compost treat-
ment. All earthworms found belonged to the endogeic species Aporrectodea caliginosa (73%) and
A. chlorotica (27%).
Results 23
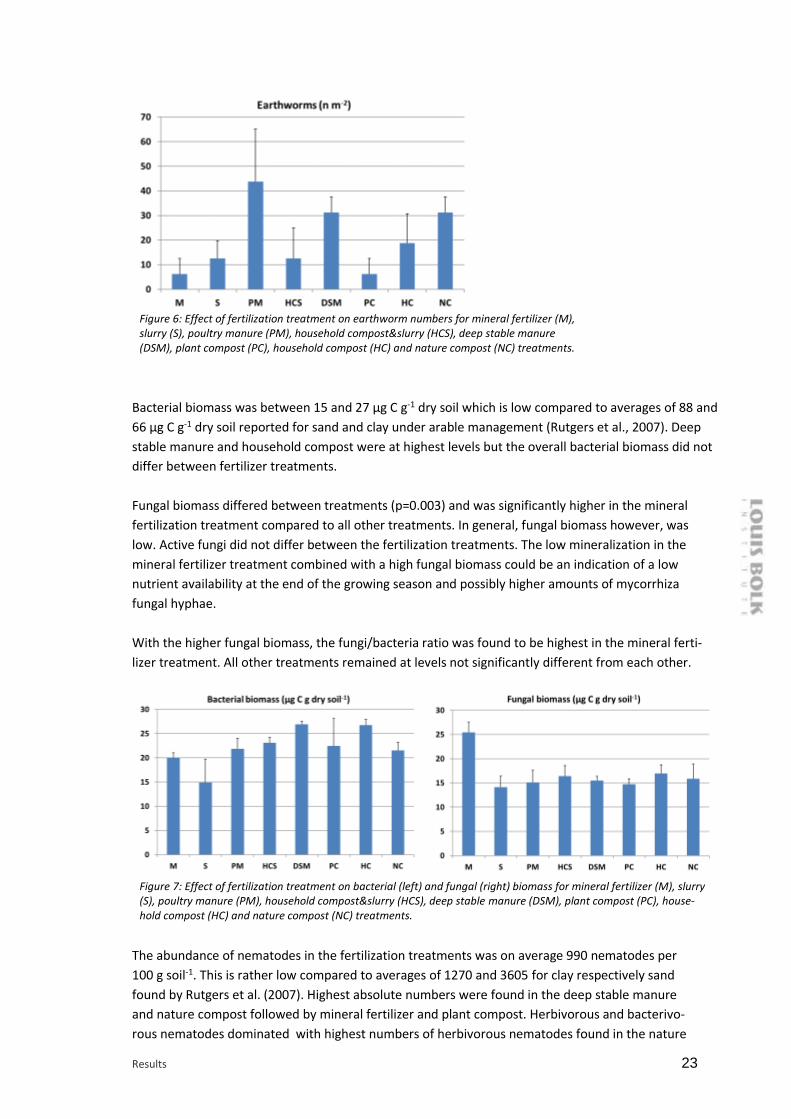
Figure 6: Effect of fertilization treatment on earthworm numbers for mineral fertilizer (M), slurry (S), poultry manure (PM), household compost&slurry (HCS), deep stable manure (DSM), plant compost (PC), household compost (HC) and nature compost (NC) treatments.
Bacterial biomass was between 15 and 27 µg C g-1 dry soil which is low compared to averages of 88 and
66 µg C g-1 dry soil reported for sand and clay under arable management (Rutgers et al., 2007). Deep
stable manure and household compost were at highest levels but the overall bacterial biomass did not
differ between fertilizer treatments.
Fungal biomass differed between treatments (p=0.003) and was significantly higher in the mineral
fertilization treatment compared to all other treatments. In general, fungal biomass however, was
low. Active fungi did not differ between the fertilization treatments. The low mineralization in the
mineral fertilizer treatment combined with a high fungal biomass could be an indication of a low
nutrient availability at the end of the growing season and possibly higher amounts of mycorrhiza
fungal hyphae.
With the higher fungal biomass, the fungi/bacteria ratio was found to be highest in the mineral ferti-
lizer treatment. All other treatments remained at levels not significantly different from each other.
Figure 7: Effect of fertilization treatment on bacterial (left) and fungal (right) biomass for mineral fertilizer (M), slurry (S), poultry manure (PM), household compost&slurry (HCS), deep stable manure (DSM), plant compost (PC), house-hold compost (HC) and nature compost (NC) treatments.
The abundance of nematodes in the fertilization treatments was on average 990 nematodes per
100 g soil-1. This is rather low compared to averages of 1270 and 3605 for clay respectively sand
found by Rutgers et al. (2007). Highest absolute numbers were found in the deep stable manure
and nature compost followed by mineral fertilizer and plant compost. Herbivorous and bacterivo-
rous nematodes dominated with highest numbers of herbivorous nematodes found in the nature

24 Soil quality effects of compost and manure in arable cropping
compost followed by mineral fertilizers and plant compost (p= 0.088). No significant differences
were found for the smaller numbers of fungivorous nematodes with highest numbers in the
household and nature compost (p=0.099).
The life-strategy group distribution showed high numbers of cp-1 (enrichment opportunists) in
deep stable manure and household compost&slurry. Highest numbers of cp-3 were found for na-
ture compost followed by deep stable manure and household compost with and without slurry.
The Maturity Index did not differ between fertilization treatments.
Figure 8: Effect of fertilization treatment on nematode abundance (left) and herbivorous nematodes (right) for mineral fertilizer (M), slurry (S), poultry manure (PM), household compost&slurry (HCS), deep stable manure (DSM), plant compost (PC), household compost (HC) and nature compost (NC) treatments.

Discussion and conclusion 25
4 Discussion and conclusion
In this study, we evaluated the effect of eight organic fertilization treatments on soil quality pa-
rameters after 17 years. The experiment was set up in 1999 with certain regulations on inputs. For
scientific reasons the fertilization treatments were kept constant during the time of the experiment
although regulation changed in the meantime, more in particular, on the P2O5 additions allowed in
arable rotations.
The treatments have multiple impacts on nutrient and organic matter levels applied in the different
strategies. Therefore, the comparison must be seen as ‘system comparisons’ rather than a one- or
multi factor fertilizer study.
Effects on soil organic matter
Different fertilizer treatments resulted in significant differences in soil organic matter levels (Figure
9). To what extend are the resulting organic matter levels due to the fresh organic matter inputs?
Figure 9: Correlation between amount of fresh organic matter applied in the treatments and organic matter in the soil after 17 years.
Figure 9 shows a high and significant correlation between organic matter levels found in the soil
and the amount of fresh organic matter applied to different treatments. The almost straight line
suggests that the amount applied is more important than its quality.
Of all treatments focusing on optimal crop nutrition (mineral fertilizer, slurry, poultry manure,
household compost&slurry and deep stable manure), the household compost&slurry and deep
stable manure treatments include high fresh organic matter additions. This correlates with a build-
up of organic matter in the soil.
Of the soil feeding strategies, nature compost, (due to its composition with low nutrient availability
not restricted in the amount to be applied to the soil), performed well in terms of fresh organic
matter addition and resulting organic matter levels in the soil. The high supply not only resulted in

26 Soil quality effects of compost and manure in arable cropping
high organic matter levels but seemed to effect also other soil chemical, physical and biological
parameters.
Of special interest are treatments that are well above or below the correlation line. Although more
organic matter is applied with the slurry as compared to the mineral fertilizer, after 17 years result-
ing soil organic matter levels are very similar. Apparently, the organic matter in the slurry did not
result in an additional build-up of organic matter. A similar effect was seen when slurry is applied to
the household compost. Although this increased the freshly added organic matter by 87% com-
pared to the household compost alone, the increase in soil organic matter in the soil was limited to
0.05%.
Correlation between the yield of the salsify in 2016 and fresh organic matter applied showed no
correlation (Appendix 4). Neither correlated the yield with the organic matter level in the soil
(Appendix 5).
Effects on potential nitrogen mineralization and yield
Different strategies are associated with different levels of N input. To what extent are resulting yield
differences correlated with the actual N application rate and resulting potential soil N mineralization?
Appendix 6 shows there is a very weak correlation between N application and yield. Especially
poultry manure resulted in a yield which is above the average expected from the average N appli-
cation. Results show that yield increased only very slightly due to a higher total N application.
Treatments were designed at similar nitrogen supply expected from mineral N content and miner-
alization of slurry, household compost&slurry, deep stable manure and mineral fertilizer. Treat-
ments received fertilizers in two out of three years at an intended mineralization potential of 100
kg N per ha per year for the first year resulting in an average of 67 kg N per ha per year (over 3
years) from freshly applied fertilizers. The resulting higher yields we find in slurry, household com-
post&slurry and deep stable manure as compared to mineral fertilizer alone, might be the result of
a build-up of the soil organic matter and especially a build-up of soil N mineralization over time.
Figure 10 indicates that this correlation between N application in organic additions and build-up of
soil N mineralization over time indeed exists. In fact, the difference between mineralizable N found
in the mineral treatment and the mineralizable N found in slurry or household compost&slurry or
deep stable manure can be attributed to residual and cumulative N mineralization from added
organic matter after the first year of application. This effect might be referred to as a build-up of
soil fertility.
Plant compost and household compost realize a similar build-up of organic matter from similar dry
matter additions of 6000 kg per year but slightly differed in N application rate. After 17 years of addi-
tions, both treatments did not reach a stage in which soil N mineralization was increased considerably.
Consequently, it may be concluded that these soil-building strategies are not increasing mineralization
and therefore, the potential for leaching losses due to mineralization, is not increased.
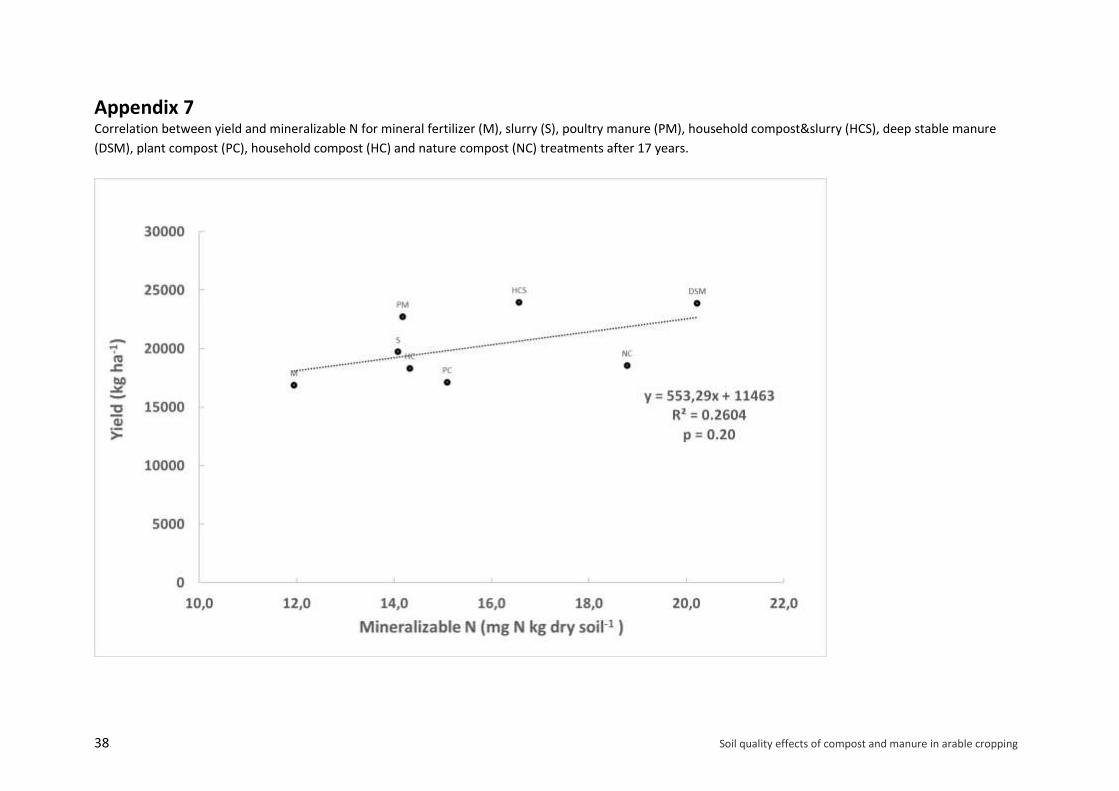
From a farmers perspective however, these soil-building fertilizers neither outperform very much
in terms of yield (Appendix 7). As indicated, there is no correlation between the potential soil N
mineralization and yield, suggesting there are other factors building-up soil fertility, which might

Discussion and conclusion 27
explain yield differences between treatments. Of interest is the effect on yield of the household
compost&slurry treatments with shows highest yields although mineralization is close to the aver-
age of all treatments.
Figure 10: Correlation between mineralizable N and N application.
Although total phosphate application differed considerably between treatments no measurable
differences in total phosphate of the soil occurred. A correlation was found between total P2O5
application and yield (Appendix 8). Mineral fertilizer and nature compost resulted in below average
yields. Poultry manure and nature compost, receiving both 80 kg P2O5 per ha per year resulted in
yield differences in favour of poultry manure.
Phosphate application also correlated with plant available P, with highest levels found in the deep
stable manure. Plant available P could explain 82% of yield differences found in the treatments indicat-
ing the system to be very sensitive to plant available P. The soil is likely to be phosphate fixing.
Figure 11: Correlation between plant available P (P-plant) and P application (left) and yield and plant available P (right).

28 Soil quality effects of compost and manure in arable cropping
Effects on soil life
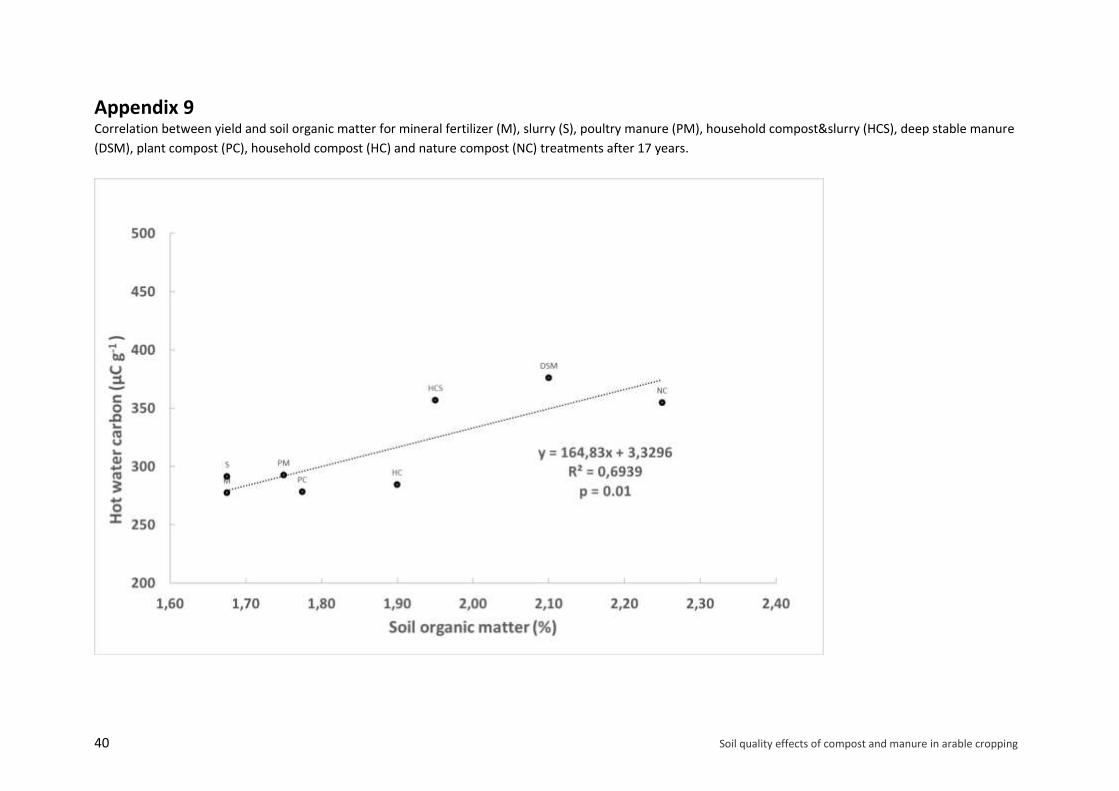
HWC shows a relatively strong correlation (p=0.01; R2=0.69) with organic matter levels in the soil
(Appendix 9). Nature compost resulted in the highest soil organic matter levels of all treatments
but HWC was lower as compared to household compost&slurry and deep stable manure. In addi-
tion, plant compost and household compost were below the average expected from the correla-
tion.
Higher HWC levels are known to be closely linked to microbial activity. Higher HWC values indicate
more soil life and increased soil fertility, although the compounds are less clear than those of min-
eralizable nitrogen. HWC consists largely of mucus secreted by bacteria and fungi and might cause
aggregation. HWC correlated well with total organic matter. From other trials, it is known that it
shows faster and greater differences from, for example, organic fertilization or reduced soil cultiva-
tion (Bloem et al., 2017). HWC levels neither correlated with number of earthworms (p=0.34;
R2=0.15 nor soil mineralizable C (p=0.10; R2=0.38).
The effect of fertilizers and composts did not result in measureable differences in soil physical pa-
rameters. This is not surprising since soil tillage may easily effect these parameters in the topsoil.
Poultry manure seemed to have highest numbers of earthworms per m-2 and about 7 times the
numbers found in the mineral fertilizer treatment. These earthworms might be important for the
root and air penetration of deeper soil layers and drainage.
Figure 12 shows the correlation between the number of earthworms and the amount of macro
pores found at 10 and 20 cm soil depth. The correlations seem to confirm that earthworms open
up these soil layers through an increased number of earthworm burrows or macro pores.
Figure 12: Correlation between number of earthworms and earthworm macro pores found in the soil at 0-10 cm depth (left) and 10-20 cm depth (right).
After 17 years, only limited effects from fertilizer additions were found on bacterial and fungal
parameters. Mineralizable C, tended to be highest in the deep stable manure but variability was
high. Bacterial biomass found in this soil was low but comparable to other findings for arable land
in the Netherlands and Belgium sampled in autumn (Bloem et al., 2006; Koopmans et al., 2006; Van
Eekeren et al., 2008). Measurements for the Dutch Soil Quality Monitoring Network (Rutgers et al.,
2007) were conducted in spring, shortly after a fertilizer addition and reported higher microbial
biomass levels. In our trial, fertilizers were applied in spring of 2015, resulting in a period of over 18
months between the last fertilizer addition and measurement of soil quality. It is likely that bacteri-
al biomass, but also nematode numbers, will be higher shortly after the addition of decomposing
fertilizers than at the end of the growing season. We expect our results therefore to be the more
long lasting effects of fertilizer additions on soil quality rather than the effect of fresh fertilizer ad-
Discussion and conclusion 29
ditions that may interfere with soil quality. It may explain why some soil life effects are less pro-
nounced.
It is striking that fungal biomass was found to be higher in the mineral fertilizer treatment. In 2006,
we found a similar effect, although at that time differences were not significant. In general, fungal
biomass is found to increase in lignin rich woody, compost like fertilizer additions. Our results may
suggest that low nutrient levels, found in the mineral fertilizer treatment, possibly resulted in high-
er mycorrhiza levels that may have increased the overall fungal biomass measured.
Nematode abundance was highest in the deep stable manure and nature compost treatments,
followed by the mineral fertilizer and plant compost treatment. Levels were about 50% higher if
compared to the poultry manure treatment, which showed lowest numbers of nematodes. Most
fungivorous nematodes were found in the nature compost and household compost treatments.
In the trophic group distribution herbivorous nematodes dominated in the mineral treatment, the
plant based compost and the nature compost (> 40% of total). In all other treatments bacterivorous
nematodes dominated at levels of 35-42%, which is common for arable, land (Van Eekeren, 2008).
The relatively low total numbers of nematodes relative to the Dutch Soil Quality Monitoring Net-
work (Rutgers et al., 2007) might again be related to the time of sampling in November. Especially
quick release fertilizers like mineral fertilizer and slurry may cause peaks shortly after addition in
spring, but the numbers may have decreased again in the course of the year and especially in au-
tumn if roots quickly decompose. Nature compost, with high additions of wood-like materials may
have caused higher numbers of fungivorous nematodes in this treatment.
In the life history groups (cp: colonizer-persister groups), higher levels of cp-1 were found in the
household compost&slurry and deep stable manure treatments. The high number of cp-1 indicates
a food rich habitat (enrichment opportunists). The typical colonizer family Rhabditidae dominates
this life history group. The genera of Tylenchidae and Eucephalobus dominate the cp-2 group of
nematodes, which indicate a disturbed habitat.
It may be concluded that effects on soil life are limited. Earthworms show significant differences
especially with poultry manure. Nematodes show differences for CP1 and CP3 but no significant
effects on bacterial biomass were found. Fungal biomass was found to be highest in mineral ferti-
lizer (applied 18 months before) but effects from organic inputs could not be detected.
After 17 years, significant effects were found for organic matter and labile organic matter levels in
the soil. Highest levels of organic matter (+41%) were found in the nature compost treatment fol-
lowed by deep stable manure (+31%) and household compost&slurry (+22%).
The deep stable manure resulted in an N mineralization, which was considerably higher if com-
pared to mineral fertilizer (+70%) followed by nature compost (+58%) and the household com-
post&slurry combination (+39%). The light soil and intensive soil preparation might give a rapid
breakdown and slow build-up of organic matter. Minimizing soil cultivation could still speed up the
process of building up organic matter levels in this soil with organic inputs.
Overall, it might be concluded that best results are obtained with fertilizers used for both crop
nutrition and building soil quality: poultry manure, household compost&slurry and deep stable
manure. Although there are positive indications on total C and labile organic matter, the build-
up of the soil and soil organisms is slow which might be the result from this light soil and the use
of intensive soil cultivation.

30 Soil quality effects of compost and manure in arable cropping
References
Anderson, J.P.E. (1982). Soil respiration. In Page, A.L., Miller, R.H., Keeney D.R. (eds). Methods of Soil Analysis, Part 2. 2nd ed. Agronomy Monogram No. 9, American Society of Agronomy and Soil Sci-ence Society America, Madison, WI. p. 837–871.
Ball, D.F. (1964). Loss-on-Ignition as an Estimate of Organic Matter and Organic Carbon in Non-Calcareous Soils. J Soil Sci 15:84–92. doi: 10.1111/j.1365-2389.1964.tb00247.x
Bloem, J., Veninga, M., Shepherd, J. (1995). Fully automatic determination of soil bacterium numbers, cell volumes and frequencies of dividing cells by confocal laser scanning microscopy and image analysis. Applied and Environmental Microbiology 61, 926-936.
Bloem, J., Vos, A. (2004). Fluorescent staining of microbes for total direct counts. In: Kowalchuk, G.A., De Bruijn, F.J., Head, I.M., Akkermans, A.D.L., Van Elsas, J.D. (eds.). Molecular Microbial Ecology Manual, 2nd edition. Kluwer Academic Publishers, Dordrecht, pp. 861-874.
Bloem, J., Koopmans, C.J., Schils, R. (2017). Effect van mest op de biologische bodemkwaliteit in de Zeeuwse akkerbouw. Wageningen Environmental Research en Louis Bolk Instituut, 55 pp.
Bloem, J., Schouten, J.A., Sorensen, S.J., Rutgers, M. van der Werf, A., Breure, A.M. (2006). Monitoring and evaluating soil quality. In: Bloem, J., Hopkins, D.W., Benedetti, A. (eds). Microbiological Methods for Assessing Soil Quality. pp. 23-49. CABI, Wallingford, UK.
Bokhorst, J.G., Berg, C. ter, Zanen, M., Koopmans, C.J. (2008). Th MAC trial: Results from long-term organic inputs trial. Louis Bolk Institute, Driebergen, report no. LD 10E, 24 pp.
Bongers, T. (1990). The maturity index: an ecological measure of environmental disturbance based on nematode species composition. Oecologia 83: 14-19.
Bongers, T., De Goede, R.G.M., Korthals, G.W., Yeates, G.W. (1995). Proposed changes of c-p classifica-tion for nematodes. Russ. J. Nematol. 3: 61-62.
Canali, S., Benedetti, A. (2006) Soil nitrogen mineralization. In: Bloem, J., Hopkins, D.W., Benedetti, A. (eds.). Microbiological Methods for Assessing Soil Quality. CABI, pp, 23–49.
Edwards, C. A., Lofty J.R. (1982). Nitrogenous fertilizers and earthworm populations in agricultural soils. In: Satchell, J.E. (ed.). Earthworm ecology: from Darwin to vermiculture. Chapman and Hall, London.
Ghani, A., Dexter, M, Perrott, K.W. (2003). Hot-water extractable carbon in soils: a sensitive measure-ment for determining impacts of fertilization, grazing and cultivation. Soil Biol. Biochem. 35: 1231–1243. doi: 10.1016/S0038-0717(03)00186-X
Haynes, R.J. (2005). Labile Organic Matter Fractions as Central Components of the Quality of Agricul-tural Soils: An Overview. Advances in Agronomy, 85, 221-268.
Houba, V.J.G., Van der Lee, J.J.G., Novozamsky, I. (1997). Soil and plant analysis. Part 1: Soil analysis procedures. Wageningen Univ., Wageningen, the Netherlands.
Keeney, D.R., Nelson, D.W. (1982). Nitrogen—Inorganic Forms. In: Methods of Soil Analysis. Part 2. Chemical and Microbiological Properties. American Society of Agronomy, Madison, USA, pp. 643–698.
Koopmans, C.J., Smeding, F.W., Rutgers, M., Bloem, J., Van Eekeren, N. (2006). Biodiversiteit en bo-dembeheer in de landbouw. Louis Bolk Instituut, RIVM, WUR-Alterra, Driebergen. 69 p.
Koopmans, C.J., Van Schie, T. (eds.) (2012). Soil Signals: A practical guide to a fertile soil. Roodbont Publishers, Zutphen, ISBN 978-90-8740-157-3. 96 p.
Morris, S.J., Zink, T., Conners, K., Allen, M.F. (1997). Comparison between fluorescein diacetate and differential fluorescent staining procedures for determining fungal biomass in soils. Applied Soil Ecology 6, 161-167.

References 31
Oostenbrink, M. (1960). Estimating nematode populations by some selected methods. In: Sasser J., Renkins W.R. (eds). Nematology. Chapel Hill, University of North Carolina Press, pp. 85-102.
Rutgers, M., Mulder, C., Schouten A.J. (2007). Typeringen van bodemecosystemen in Nederland met tien referenties voor biologische bodemkwaliteit. RIVM rapport 607604008/2007
Van Eekeren, N., Bommelé, L., Bloem, J., Schouten, T., Rutgers, M., De Goede, R., Reheul, D., Brus-saard, L. (2008). Soil biological quality after 36 years of ley-arable cropping, permanent grassland and permanent arable cropping. Applied Soil Ecology 40: 432-446.
Van Vliet, P.C.J., van der Stelt, B., Rietberg, P.I. De Goede, R.G.M. (2007). Effects of organic matter content on earthworms and nitrogen mineralization in grassland soils. European Journal of Soil Biology, 43, supplement 1, 8222-8229.
Yeates, G.W., Bongers, T., De Goede, R.G.M., Freckman, D.W., Georgieva, S.S. (1993). Feeding habits in soil nematode families and genera-and outline for soil ecologists. J. Nematol. 25: 315-331.
Zanen, M., Bokhorst, J.G., Ter Berg, C., Koopmans, C.J. (2008). Investeren tot in de bodem: Evaluatie van het proefveld Mest Als Kans. Louis Bolk Instituut rapport nr. LD 11, Driebergen, 38 p.

32 Soil quality effects of compost and manure in arable cropping
Appendix 1
Soil Chemical and physical characteristics in 2016 of mineral (M), slurry (S), poultry manure (PM), household compost&slurry (HCS), deep stable
manure (DSM), plant compost (PC), household compost (HC) and nature compost (NC).
Unit M S PM HCS DSM PC HC NC P-value
pH-KCL -log[H+] 7,80 ab 7,80 ab 7,80 ab 7,78 ab 7,75 a 7,83 b 7,80 b 7,75 a 0,082
SOM % 1,68 a 1,68 a 1,75 a 1,95 bc 2,10 cd 1,78 ab 1,90 ab 2,25 d < 0,001
HWC ug C g-1 277 a 291 a 293 a 357 b 376 b 278 a 284 a 355 b 0,003
C-total g C kg dry soil -1 14,5 abc 13,3 a 13,5 a 14,0 ab 15,5 bc 13,5 a 14,5 ab 16,0 c 0,005
N-total g N kg dry soil -1 1,11 a 1,09 a 1,13 ab 1,19 abc 1,28 bc 1,09 a 1,18 abc 1,29 c 0,018
P-total mg P2O5 100 g-1 116 108 118 111 109 108 107 108 NS
P-plant mg P kg-1 1,28 a 1,33 ab 1,60 cd 1,53 bc 1,83 d 1,13 a 1,18 a 1,25 a < 0,001
K mg K kg-1 65 bcd 63 aabc 56 ab 75 d 89 e 55 a 53 a 67 cd < 0,001
Ca mmol Ca L-1 0,53 0,65 0,73 0,58 0,78 0,65 0,50 0,45 NS
Mg mg Mg kg-1 29,75 a 32,5 a 36,75 b 38,25 b 38,5 b 32 a 32,5 a 39,25 b <0,001
Bulk density g cm-3 1,26 1,24 1,28 1,23 1,22 1,30 1,25 1,20 NS
Soil structure 0-10 cm
Crumb % 74 65 70 74 64 66 66 60 NS
Sub-angular % 24 31 23 26 33 31 29 34 NS
Angular % 3 4 8 0 4 3 5 6 NS
Soil structure 10-20 cm
Crumb % 50 46 56 34 51 38 33 54 NS
Sub-angular % 44 39 38 56 43 43 46 39 NS
Angular % 6 15 6 10 6 20 21 8 NS
Macro pores 0-10 # 383 433 442 383 438 317 400 442 NS
Macro pores 0-20 # 117 158 213 142 231 181 192 308 NS
Treatments

Appendix 33
Appendix 2
Soil biological characteristics in 2016 of mineral (M), slurry (S), poultry manure (PM), household compost&slurry (HCS), deep stable manure (DSM), plant
compost (PC), household compost (HC) and nature compost (NC).
Unit M S PM HCS DSM PC HC NC P-value
Mineralizable N mg N kg dry soil -1 11,9 a 14,1 ab 14,2 ab 16,6 bc 20,2 d 15,1 ab 14,3 ab 18,8 cd 0,001
Mineralizable C mg CO2 kg dry soil -1 16,7 ab 18,4 ab 14,4 ab 18,3 ab 19,5 b 16,7 ab 18,5 ab 19,0 b 0,039
Number of earthworms n m-2 6 a 13 ab 44 b 13 ab 31 ab 6 ab 19 ab 31 ab 0,021
Bacterial biomass µg C g dry soil -1 20,0 14,9 21,9 23,1 26,9 22,5 26,8 21,5 NS
Fungal biomass µg C g dry soil -1 25,4 b 14,2 a 15,1 a 16,4 a 15,5 a 14,7 a 17,0 a 15,9 a 0,033
Active fungi µg C g dry soil -1 1,09 2,40 1,87 1,10 0,75 0,86 1,29 2,37 NS
Fungi/Bacteria C C-1 1,27 b 1,49 a 0,73 a 0,72 a 0,58 a 0,83 a 0,64 a 0,73 a 0,033
Treatments

34 Soil quality effects of compost and manure in arable cropping
Appendix 3
Nematode abundance, trophic groups, l ife history groups (cp colonizer-persister groups) and cp: community structure indices in 2016 of mineral (M), slurry (S),
poultry manure (PM), household compost&slurry (HCS), deep stable manure (DSM), plant compost (PC), household compost (HC) and nature compost (NC).
Unit M S PM HCS DSM PC HC NC P-value
Number of nematodes n 100 g soil -1 1097 abc 812 ab 772 a 849 abc 1208 bc 1058 abc 908 abc 1214 c 0,088
Bacterivorous n 100 g soil -1 335 286 276 308 454 308 379 403 NS
Fungivorous n 100 g soil -1 72 abc 70 ab 69 a 82 ab 78 ab 74 abc 121 ab 126 b 0,099
Herbivorous n 100 g soil -1 488 250 218 275 416 442 243 502 NS
Carnivorous n 100 g soil -1 199 199 206 182 257 232 159 182 NS
General n 100 g soil -1 4 7 3 2 2 3 6 1 NS
cp-1 % 75,6 abc 81,9 abc 80,5 abc 119,3 bc 124,4 c 52,6 a 72,8 ab 68,8 ab 0,017
cp-2 % 646,7 347,1 301,1 290,8 546,4 528,3 394,3 605,8 NS
cp-3 % 137,5 a 138,3 a 145,9 ab 222,6 c 230,4 c 215,7 bc 225,4 bc 301,2 d 0,001
cp-4 % 137,8 157,4 179,8 152,6 220,1 186,5 148,5 179,1 NS
cp-5 % 94,8 80,5 61,4 62,1 83,9 72,0 61,4 57,7 NS
Maturity index (cp1-5) µg C g dry soil -1 3,00 3,07 2,97 2,85 2,89 3,22 2,88 2,98 NS
Maturity index (cp2-5) µg C g dry soil -1 3,24 3,44 3,31 3,35 3,24 3,39 3,11 3,19 NS
Treatments

Appendix 35
Appendix 4
Correlation between yield and organic matter applied for mineral fertilizer (M), slurry (S), poultry manure (PM), household compost&slurry (HCS), deep stable
manure (DSM), plant compost (PC), household compost (HC) and nature compost (NC) treatments after 17 years.

36 Soil quality effects of compost and manure in arable cropping
Appendix 5
Correlation between yield and soil organic matter for mineral fertilizer (M), slurry (S), poultry manure (PM), household compost&slurry (HCS), deep stable manure
(DSM), plant compost (PC), household compost (HC) and nature compost (NC) treatments after 17 years.

Appendix 37
Appendix 6
Correlation between yield and N application for mineral fertilizer (M), slurry (S), poultry manure (PM), household compost&slurry (HCS), deep stable manure (DSM),
plant compost (PC), household compost (HC) and nature compost (NC) treatments after 17 years.
38 Soil quality effects of compost and manure in arable cropping
Appendix 7
Correlation between yield and mineralizable N for mineral fertilizer (M), slurry (S), poultry manure (PM), household compost&slurry (HCS), deep stable manure
(DSM), plant compost (PC), household compost (HC) and nature compost (NC) treatments after 17 years.

Appendix 39
Appendix 8
Correlation between yield and P application for mineral fertilizer (M), slurry (S), poultry manure (PM), household compost&slurry (HCS), deep stable manure (DSM),
plant compost (PC), household compost (HC) and nature compost (NC) treatments after 17 years.
40 Soil quality effects of compost and manure in arable cropping
Appendix 9
Correlation between yield and soil organic matter for mineral fertilizer (M), slurry (S), poultry manure (PM), household compost&slurry (HCS), deep stable manure
(DSM), plant compost (PC), household compost (HC) and nature compost (NC) treatments after 17 years.