soil water characteristics of middle pleistocene paleosol
TRANSCRIPT

African Journal of Biotechnology Vol. 10(53), pp. 10856-10863, 14 September, 2011 Available online at http://www.academicjournals.org/AJB ���������� �����������ISSN 1684–5315 © 2011 Academic Journals Full Length Research Paper
Soil water characteristics of Middle Pleistocene paleosol layers on the loess Plateau
Tieniu Wu1,2,5, Yunqiang Wang1,3,5*, Junwei Lv4 and Bo Zhang4
1State Key Laboratory of Soil Erosion and Dryland Farming on the Loess Plateau, Institute of Soil and Water
Conservation, Chinese Academy of Sciences and Ministry of Water Resources, Yangling, Shaanxi Province, 712100, China.
2Urban Construction Department of Shaoyang University, Shaoyang Hunan Province, 422000, China. 3Institute of Geographic Sciences and Natural Resources Research, Chinese Academy of Sciences,
Beijing, 100101, China. 4College of Water Resources and Architectural Engineering, Northwest A&F University,
Yangling, Shaanxi Province, 712100, China. 5Graduate University of Chinese Academy of Sciences, Beijing, 100049, China.
Accepted 11 August, 2011
Soil water plays an important role in water quality monitoring, irrigation scheduling, solute migration, and plant growth. The soil water condition for a field site depends on soil type and related water movement parameters. Information about the soil hydraulic properties of Middle Pleistocene paleosol layers within the Yingpan section on the Loess Plateau of China is necessary since it may affect water cycle processes both in vertical and horizontal directions; however, little data is currently available. The saturated hydraulic conductivity (Ks), soil-water characteristic curve (SWCC), field capacity, particle size composition, and other indices of the paleosol layers were determined. Out of a potential eight models to be fitted to the SWCC data, the van Genuchten model was applicable to four layers (S1, S5-2, S5-3 and S6) while the dual porosity equation was applicable to the S2, S3, S4 and S5-1 layers. These models fitted the data well. Results show that paleosol layers differed from each other in their capacity to hold water and this was related to their soil structures and porosities. These differences could be due to the different conditions prevailing during their formation. Although, paleosols occur at various depths, certain deep-rooting plants can access the water they hold. Therefore, the SWCC of the individual layers has significance for ecological management in the region. Key words: Middle Pleistocene, paleosol, soil water characteristic curve, Loess Plateau.
INTRODUCTION A soil-water characteristic curve (SWCC) represents the relationship between suction and water content or the degree of saturation. Knowledge of soil-water charac-teristics is necessary in many soil-water related practices such as soil and water conservation, irrigation scheduling, solute migration and plant growth. Soil-water characteristics are vital to the computations of soil-water storage and soil-water flow. Vanapalli et al., (1999) *Corresponding author. E-mail: [email protected] or [email protected].
explained the different phase relationships from the saturated condition to the dry condition using soil-water characteristics. Laboratory measurements of soil-water characteristics have been used to study the effects of bulk density changes on soil hydraulic properties (Lu et al., 2004), and the effect of soil compaction on hydraulic properties of the soils on the Loess Plateau (Zhang et al., 2006). Since the measurement of soil-water characte-ristics is costly and difficult, Saxton et al. (1986) derived equations to estimate continuous relationships of soil-water moisture content to water potentials or hydraulic conductivity from the soil textures. More recently, Fredlund and Xing (1994) proposed a new equation that

can be used to fit laboratory data over the entire soil suction range.
The SWCC varies widely and nonlinearly with water content for different soil textures (Saxton et al., 1986). Ng and Pang (2000) studied the soil water characteristics of a volcanic soil from Hong Kong and found that the SWCC of a re-compacted soil sample was very different from that of a natural sample having the same initial soil bulk density and initial water content. Agus et al. (2001) found that the equations proposed by Fredlund and Xing (1994) gave a reasonably good estimate of the SWCC for Singapore residual soils. However, on the Chinese Loess Plateau, the most widely distributed soils are loessial soils and paleosols rather than residual or young or volcanic soils. Paleosols were formed under sub-tropical or semi-humid climates while the loessial soils or layers were formed from material deposited by the wind under semi-arid environments (Guo et al., 1998).
On the Loess Plateau, the physical and chemical properties of paleosols differ from those of the younger topsoils; for example, the clay content is higher in the paleosols. Magnetic susceptibility, particle size, CaCO3 content, chemical (major and trace elements) and isotopic (Sr and Nd) analyses of the loess-paleosol sequence have been performed in order to establish historical records of monsoon climate variations (Hovan et al., 1989; Ding et al., 2000; Bradák et al., 2009; Smith et al., 2011) but were not related to the soil water characteristics. The loess profile has often been considered to be homogeneous and consequently the SWCC parameters determined for the topsoil were used to represent the whole profile. Thus, little research has investigated the actual soil water characteristics of deep loess layers or of paleosols, particularly those of the Middle Pleistocene paleosols. Wang (2009) analyzed the adsorption and desorption characteristic curves of the L1, S1, L2 and S2 layers in Luochuan County. However, there is little information on the SWCC of other deeper Middle Pleistocene paleosol layers occurring on the Chinese Loess Plateau.
Therefore, the objective of this study was to ascertain the soil water characteristics (that is, field capacity, saturated hydraulic conductivity, etc.) of the Middle Pleistocene paleosols for a representative soil profile. Such studies are needed to obtain a database for soil water model parameters, especially those dealing with water movement at depth. MATERIALS AND METHODS Study area The study area, the Yingpan loess section (34°18.540N, 108°05.627E), is situated in the north Yangling district, Shaanxi Province, on the Loess Plateau of China. The climate is in the North Temperate Zone and is warm and semiarid. The Yingpan section is about 40 m thick, overlying quaternary fluvial and lacustrine facies deposits.
Wu et al. 10857
Profile characteristics In the Loess Plateau region, the standard stratigraphic nomenclature of the loess sequence assigns the letter L to loess units and S to paleosols (Porter, 2001). The Yingpan section is subdivided into 10 loess layers (L0, L1, L2, L3, L4, L5, S5L1, S5L2, L6 and L7) and 10 paleosol layers (S0, S1, S2-1, S2-2, S3, S4, S5-1, S5-2, S5-3 and S6), which correspond to the Middle Pleistocene series, Late Pleistocene series and Holocene stratum (Ding et al., 2002). Figure 1 shows the thickness of each layer and the location of sampling points within the layers. All the paleosol layers are thicker than 1 m; S5 is the thickest (> 5 m) while S3 is the thinnest (1.17 m). The S5 layer is a soil complex consisting of three pedons (S5-1, S5-2, and S5-3 occurring in sequence at increasing soil depths) separated by two thin, inter-bedded, loess layers (Figure 1). This soil complex is characterized by a greater thickness, darker brown coloration, and thicker clay coatings than other paleosol units in this section. In contrast, S2 consists of two pedons, S2-1 and S2-2. However, S2-1 was used to represent S2 in this study, since S2-2 was weakly developed making it difficult to distinguish between S2-2 and the loess layer. The S0 layer corresponds to the Holocene strata, which has been disturbed to a great extent by human activities. Sampling and measuring methods Soil samples were collected using a wooden shovel in order to reduce the impact of metal tools on magnetic susceptibility, after the weathered surface of the cliff profile was cleared away. Preliminary samples, weighing about 200 g, were collected from each paleosol layer. Field measurements of the magnetic susceptibility of the profile were made using a MS-30 portable magnetization meter (ZH Instruments, Czech Republic) in three replications. Table 1 shows some basic properties of the section.
Following the field survey, two undisturbed paleosol samples were removed from each of the eight paleosol layers using 50-mm diameter cutting rings. Each paleosol sample was considered as one replication; a total of 16 soil cores were collected. Saturated hydraulic conductivity (Ks) was measured using the constant head method (Klute and Dirksen, 1986). Paleosol samples were first saturated for 24 h and then were used to determine the saturated soil water content. The soil water retention properties were determined using the centrifugation method (Silva and Azevedo, 2002) (Hitachi CR21G centrifuge; 20°C). There is some risk that centrifugation may change a sample’s bulk density and thus will affect the SWCC (Lu et al., 2004), however, the method has been considered appropriate for determination of soil water retention properties (Khanzode, et al., 2002; Reatto et al., 2008). Soil porosity and saturation were calculated (Hu et al., 2005).
Soil particle sizes were measured by a Mastersizer2000 (Malvern Instruments Ltd. UK) over a measurement range of 0.02 to 2,000 µm. Equations for soil water characteristic curves and software For contemporary soils, mathematical functions have been used to express hθ in an analytical form (Brooks and Corey, 1964; Haverkamp et al., 1977; Simmons et al., 1979; van Genuchten, 1980), although, these methods have not been applied to paleosols. We used the Retention Curve Program (RETC) software, available in the public domain (from the USDA-ARS), to select the optimal model for the eight paleosol samples. Generally, the closer the value of the coefficient of determination, R2, was equal to 1, the better the model fit the data. The software analyzes the soil water retention and hydraulic conductivity functions of unsaturated soils.

10858 Afr. J. Biotechnol.
Figure 1. Location of sampling points within paleosol layers of the Yingpan Section.
Table 1. Some basic properties of the paleosol layer within the Yingpan section.
Layer Thickness (m) MS/10-7SIa Ageb (kaB.P)
S1 1.34 236.7 128~73 S2 1.32 218.3 190~219 S3 1.17 255.0 307~336 S4 1.20 225.7 360~412 S5-1 1.77 442.0 479~531 S5-2 1.70 199.7 549~579 S5-3 1.10 267.3 585~621 S6 1.80 259.3 684~710 a Magnetic susceptibility, MS; b Ages according to Ding et al., 2002.
The program uses the parametric models of Brooks-Corey and van Genuchten to represent the soil water retention curve, and the theoretical pore-size distribution models of Mualem and Burdine to
predict the unsaturated hydraulic conductivity function from observed soil water retention data (van Genuchten, et al., 1991). Pertinent equations include:
Wu et al. 10859
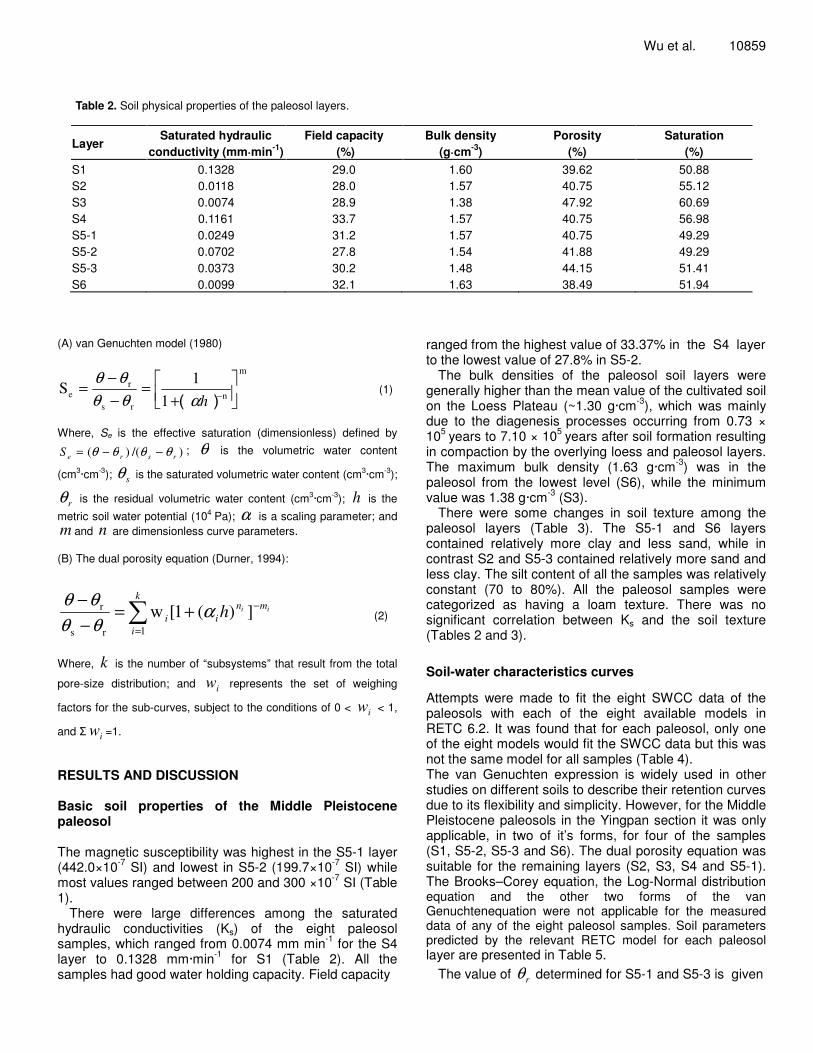
Table 2. Soil physical properties of the paleosol layers.
Layer Saturated hydraulic
conductivity (mm·min-1) Field capacity
(%) Bulk density
(g·cm-3) Porosity
(%) Saturation
(%) S1 0.1328 29.0 1.60 39.62 50.88 S2 0.0118 28.0 1.57 40.75 55.12 S3 0.0074 28.9 1.38 47.92 60.69 S4 0.1161 33.7 1.57 40.75 56.98 S5-1 0.0249 31.2 1.57 40.75 49.29 S5-2 0.0702 27.8 1.54 41.88 49.29 S5-3 0.0373 30.2 1.48 44.15 51.41 S6 0.0099 32.1 1.63 38.49 51.94
(A) van Genuchten model (1980)
m
nrs
re 1
1S ��
���
�
+=
−−= −hαθθ
θθ (1)
Where, Se is the effective saturation (dimensionless) defined by
)/()( rsreS θθθθ −−= ; θ is the volumetric water content
(cm3·cm-3); sθ is the saturated volumetric water content (cm3·cm-3);
rθ is the residual volumetric water content (cm3·cm-3); h is the
metric soil water potential (104 Pa); α is a scaling parameter; and m and n are dimensionless curve parameters. (B) The dual porosity equation (Durner, 1994):
�=
−+=−− k
i
mnii
iih1rs
r ])(1[w αθθθθ
(2)
Where, k is the number of “subsystems” that result from the total
pore-size distribution; and iw represents the set of weighing
factors for the sub-curves, subject to the conditions of 0 < iw < 1,
and � iw =1.
RESULTS AND DISCUSSION Basic soil properties of the Middle Pleistocene paleosol The magnetic susceptibility was highest in the S5-1 layer (442.0×10⁻⁷ SI) and lowest in S5-2 (199.7×10⁻⁷ SI) while most values ranged between 200 and 300 ×10-7 SI (Table 1).
There were large differences among the saturated hydraulic conductivities (Ks) of the eight paleosol samples, which ranged from 0.0074 mm min-1 for the S4 layer to 0.1328 mm·min-1 for S1 (Table 2). All the samples had good water holding capacity. Field capacity
ranged from the highest value of 33.37% in the S4 layer to the lowest value of 27.8% in S5-2.
The bulk densities of the paleosol soil layers were generally higher than the mean value of the cultivated soil on the Loess Plateau (~1.30 g·cm-3), which was mainly due to the diagenesis processes occurring from 0.73 × 10⁵ years to 7.10 × 10⁵ years after soil formation resulting in compaction by the overlying loess and paleosol layers. The maximum bulk density (1.63 g·cm-3) was in the paleosol from the lowest level (S6), while the minimum value was 1.38 g·cm-3 (S3).
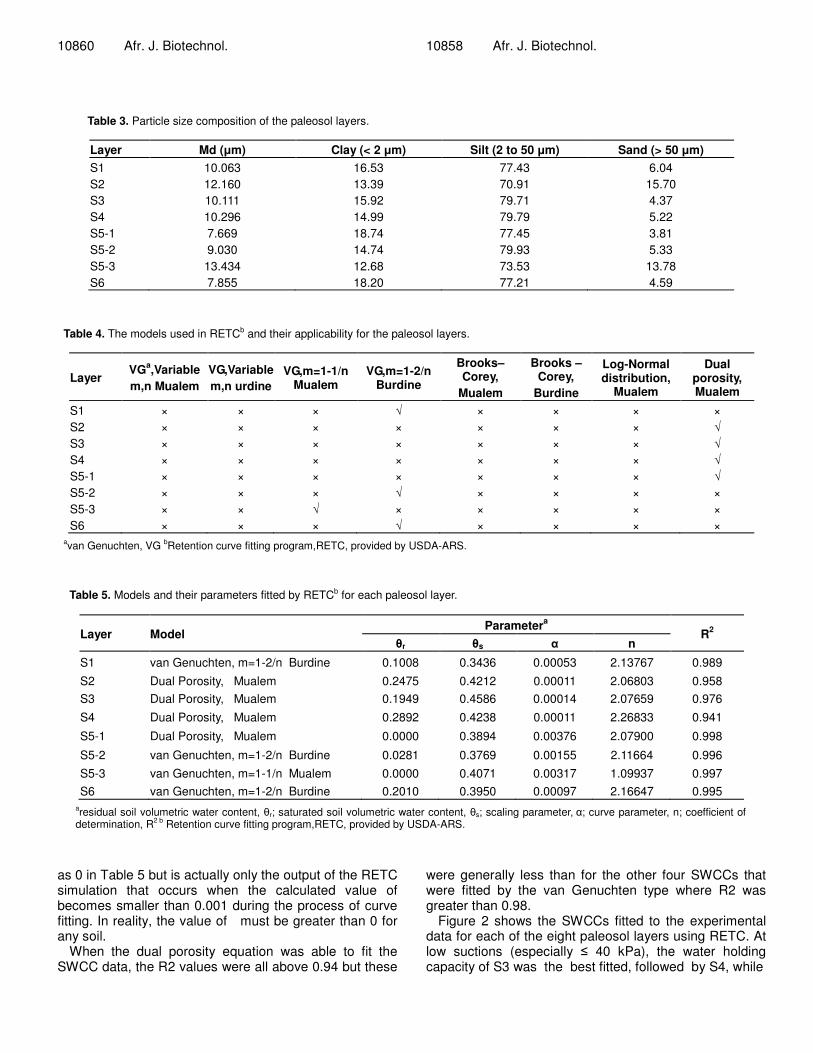
There were some changes in soil texture among the paleosol layers (Table 3). The S5-1 and S6 layers contained relatively more clay and less sand, while in contrast S2 and S5-3 contained relatively more sand and less clay. The silt content of all the samples was relatively constant (70 to 80%). All the paleosol samples were categorized as having a loam texture. There was no significant correlation between Ks and the soil texture (Tables 2 and 3). Soil-water characteristics curves
Attempts were made to fit the eight SWCC data of the paleosols with each of the eight available models in RETC 6.2. It was found that for each paleosol, only one of the eight models would fit the SWCC data but this was not the same model for all samples (Table 4). The van Genuchten expression is widely used in other studies on different soils to describe their retention curves due to its flexibility and simplicity. However, for the Middle Pleistocene paleosols in the Yingpan section it was only applicable, in two of it’s forms, for four of the samples (S1, S5-2, S5-3 and S6). The dual porosity equation was suitable for the remaining layers (S2, S3, S4 and S5-1). The Brooks–Corey equation, the Log-Normal distribution equation and the other two forms of the van Genuchtenequation were not applicable for the measured data of any of the eight paleosol samples. Soil parameters predicted by the relevant RETC model for each paleosol layer are presented in Table 5.
The value of rθ determined for S5-1 and S5-3 is given
10860 Afr. J. Biotechnol. 10858 Afr. J. Biotechnol.
Table 3. Particle size composition of the paleosol layers.
Layer Md (�m) Clay (< 2 �m) Silt (2 to 50 �m) Sand (> 50 �m) S1 10.063 16.53 77.43 6.04 S2 12.160 13.39 70.91 15.70 S3 10.111 15.92 79.71 4.37 S4 10.296 14.99 79.79 5.22 S5-1 7.669 18.74 77.45 3.81 S5-2 9.030 14.74 79.93 5.33 S5-3 13.434 12.68 73.53 13.78 S6 7.855 18.20 77.21 4.59
Table 4. The models used in RETCb and their applicability for the paleosol layers.
Layer VGa,Variable m,n Mualem
VG,Variable m,n urdine
VG,m=1-1/n Mualem
VG,m=1-2/n Burdine
Brooks–Corey,
Mualem
Brooks –Corey,
Burdine
Log-Normal distribution,
Mualem
Dual porosity, Mualem
S1 × × × � × × × × S2 × × × × × × × � S3 × × × × × × × � S4 × × × × × × × � S5-1 × × × × × × × � S5-2 × × × � × × × × S5-3 × × � × × × × × S6 × × × � × × × ×
avan Genuchten, VG bRetention curve fitting program,RETC, provided by USDA-ARS.
Table 5. Models and their parameters fitted by RETCb for each paleosol layer.
Layer Model Parametera
R2 �r �s � n
S1 van Genuchten, m=1-2/n Burdine 0.1008 0.3436 0.00053 2.13767 0.989 S2 Dual Porosity, Mualem 0.2475 0.4212 0.00011 2.06803 0.958 S3 Dual Porosity, Mualem 0.1949 0.4586 0.00014 2.07659 0.976 S4 Dual Porosity, Mualem 0.2892 0.4238 0.00011 2.26833 0.941
S5-1 Dual Porosity, Mualem 0.0000 0.3894 0.00376 2.07900 0.998
S5-2 van Genuchten, m=1-2/n Burdine 0.0281 0.3769 0.00155 2.11664 0.996 S5-3 van Genuchten, m=1-1/n Mualem 0.0000 0.4071 0.00317 1.09937 0.997 S6 van Genuchten, m=1-2/n Burdine 0.2010 0.3950 0.00097 2.16647 0.995
aresidual soil volumetric water content, �r; saturated soil volumetric water content, �s; scaling parameter, �; curve parameter, n; coefficient of determination, R2 b Retention curve fitting program,RETC, provided by USDA-ARS.
as 0 in Table 5 but is actually only the output of the RETC simulation that occurs when the calculated value of becomes smaller than 0.001 during the process of curve fitting. In reality, the value of must be greater than 0 for any soil.
When the dual porosity equation was able to fit the SWCC data, the R2 values were all above 0.94 but these
were generally less than for the other four SWCCs that were fitted by the van Genuchten type where R2 was greater than 0.98.
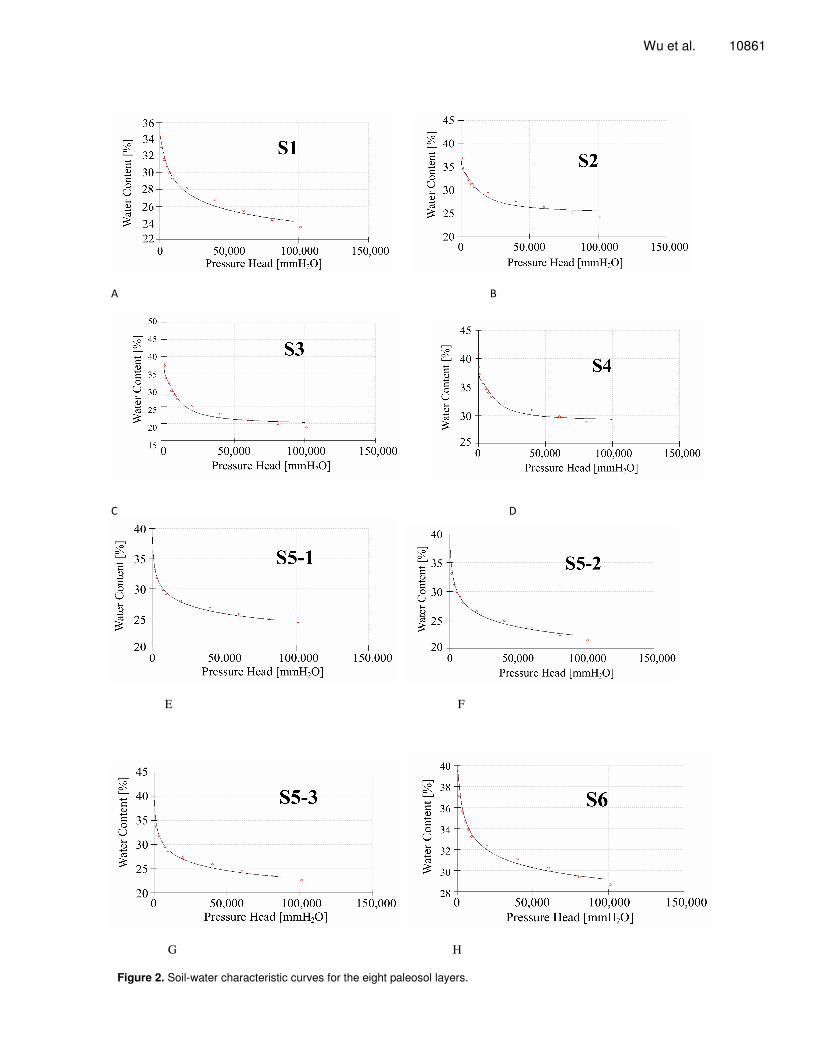
Figure 2 shows the SWCCs fitted to the experimental data for each of the eight paleosol layers using RETC. At low suctions (especially � 40 kPa), the water holding capacity of S3 was the best fitted, followed by S4, while
Wu et al. 10861
������������������������������������������������������������������������������������������������������������������������������������������
����������� �
�������������������������������������������������������������������������������������������������������������������������������������������������
E F
G H Figure 2. Soil-water characteristic curves for the eight paleosol layers.

10862 Afr. J. Biotechnol.
Table 6. Values of Ks and SWCC parametersa calculated by RETCb based on particle size composition.
Layer �r �s � n Ks (mm·min-1) S1 0.0635 0.3950 0.0065 1.5856 0.0602 S5-2 0.0659 0.4235 0.0059 1.6330 0.1117 S5-3 0.0589 0.4012 0.0054 1.6611 0.1581 S6 0.0668 0.4023 0.0065 1.5834 0.0536 aresidual soil volumetric water content, �r; saturated soil volumetric water content, �s; scaling parameter, �; curve parameter, n; saturated hydraulic conductivity, Ks.
S1 was worst fitted. With increasing suction, the water holding capacity of S3 decreased more slowly. When the suction was 60 kPa, the water holding capacity of S4 was the greatest among the paleosol layers and at 400 kPa the water holding capacity of S3 was the least.
Changes in the SWCCs of the S4, S5-1 and S6 layers were relatively stable (Figure 2), indicating that in the range of effective suctions, the water holding capacity of S4 was the greatest, followed by S5-1 and S6, which was in accordance with the field capacity data (Table 2). This is related to the differences in porosity, which for S1, S4, S5-1 and S6 were relatively low (39.6, 40.8, 40.8, and 38.6%, respectively). The porosity of S3 was the highest (47.9%). Within the soil, higher porosity values indicate a greater number of macropores or pores of greater diameter size, which are the first to be emptied of water at relatively low suctions; while the fine pores have relatively high suction forces and retain water, hence, with the application of increasing suction, finer pore systems with larger soil suctions lose less water. The gradients of the curve slopes in the de-saturation zone tended to become less for layers with smaller soil porosities.
Therefore, under lower suctions (� 40 kPa), the water holding capacity of soils with larger porosities is greater than those of soils with small porosities; while at higher suctions (especially � 100 kPa), the water holding capacity of soil with larger porosities is less than those of soils with smaller porosities.
The structures of the various paleosol layers that affect water retention were different because they were affected by the following: particle size contents were also used to calculate the SWCC parameters using the van Genuchten type equations (dual porosity equations do not have this capacity) (Table 6). These latter predicted values differed notably from the measured values and those predicted by the fitted models themselves (Tables 2, 5, and 6). Among the five parameters (�r, �s, �, n and Ks), only �s was well-predicted such that the differences between the values of �s shown in Table 5 and those from Table 6 for the layers S1 and S5-2 were both within 0.14% of each other while for S5-3 and S6 they were within 0.01%. The van Genuchten model performed poorly when predicting SWCC parameters based on soil texture alone. As mentioned earlier, soil structural changes are important and these are only partly
explained by soil texture. In contrast, Ks was poorly predicted when using soil particle size composition. Thus, for S1 the predicted Ks underestimated the measured value of 0.1328 mm·min-1 by 45%, while for S5-2 the predicted Ks overestimated the measured value of 0.0702 mm·min-1 by 59%.
These differences may be attributed to: (1)The Middle Pleistocene paleosol in the Yingpan section was formed with two concurrent processes occurring, that is, the soil was aging and developing while aeolian deposition was still occurring, which differs from the development of younger surface soils where addition of material is usually absent; thus the physical properties were different; (2) After the paleosol was formed and buried, it was compacted by the overlying loess and other paleosol layers, and possibly some internal soil material migrated; these processes occurred over tens of thousands of years; and (3) Perhaps most importantly, the environment in which each paleosol was formed was different, including the precipitation, temperature, and aeolian deposition rate; all of these factors might change the features of the paleosol layers. Paleoecological implications Predicted SWCC for the different paleosol layers showed that there were differences in both the magnitudes of their water holding capacities and the rates at which those capacities declined. This was attributed to changes in porosity, which reflected differences in soil structure. Knowledge of the SWCC relates soil moisture contents to soil matric potential and facilitates the calculation of available soil water between potentials. This is relevant to the capability of plants to extract soil water. Different plants are able to overcome different ranges of soil matric potentials. Some, for example Caragana korshinskii, can extract water held at potentials higher than that normally considered to be the wilting point. The layers comprising the Yingpan section in Yangling had high water holding capacities, especially those of the S4, S5-1 and S6 layers, which may have formed under environmental conditions that were more conducive to the development of good soil structure. Given that certain plants have root systems that can reach these ancient layers and extract the water, the information derived from the SWCCs has

important implications for current ecological management. Conclusions For the eight studied paleosol layers in the Yingpan section, the van Genuchten expression was found to be applicable for the S1, S5-2, S5-3 and S6 and layers. The dual porosity equation was applicable for the S2, S3, S4 and S5-1 layers. The predicted water holding capacities were related to the determined soil porosities. Under low suctions (especially � 40 kPa), the water holding capacity of soil layers with larger porosities were greater than those with smaller porosities; while under high suctions (especially � 100 kPa), the water holding capacity of soil layers with larger porosities was weaker than those of soil layers with smaller porosities. The soil structure, and hence the SWCCs, of the various paleosol layers were different and likely reflected the environ-mental conditions when they were forming. Information derived from the SWCC of these ancient layers can be used in current ecological management. Since differ-ences have been shown to exist in this study, further investigations should determine the Ks and SWCC parameters for the Middle Pleistocene loess layers and also of the Early Pleistocene loess and paleosol layers. ACKNOWLEDGEMENTS The study was supported by the State Key Laboratory of Soil Erosion and Dryland Farm on the loess plateau (No 10501-278) and China Postdoctoral Science Foundation. We thank senior technician Shi Zhuye, for her contribution to the laboratory analysis. We also thank Dr. Zhou Beibei, for her help on the writing on this paper and Mr. David Warrington for his editing and helpful suggestions. REFERENCES Agus SS, Leong EC, Rahardjo H (2001). Soil water characteristic
curves of Singapore residual Soils. Geotech. Geol. Eng. 19: 285-309. Bradák B, Márton E, Horváth E, Csillag G (2009). Pleistocene climate
and environment reconstruction by the paleomagnetic study of a loess-paleosol sequence. Central Eur. Geo. 52(1): 31–42.
Brooks RH, Corey AT (1964). Hydraulic properties of porous media. Hydrology Colorado State University, Fort Collins, Colorado. 3: 1-27.
Ding ZL, Rutter NW, Sun JM, Yang SL, Liu TS (2000). Re-arrangement of atmospheric circulation at about 2.6 Ma over northern China evidence from grain size records of loess-palaeosol and red clay sequences. Quaternary Sci. Rev., 19: 547-558.
Ding ZL, Derbyshire E, Yang SL, Yu ZW, Xiong SF, Liu TS (2002). Stacked 2.6 Ma grain size record from the Chinese loess based on five sections and correlation with the deep-sea �18O record. Paleoceanography. 1029/2001PA000725. 17(3): p. 10.
Durner W (1994). Hydraulic conductivity estimation for soils with heterogeneous pore structure. Water Resour. Res. 32(9): 211-223.
Fredlund DG, Xing A (1994). Equations for the soil water characteristic curve. Can. Geotech. J. 31: 521-532.
Wu et al. 10863 Guo ZT, Liu TS, Fedoroff N, Wei LY, Ding ZL, Wu NQ, Lu HY, Jiang
WY, An ZS (1998). Climate extremes in Loess of China coupled with the strength of deep water formation in the North Atlantic. Global Planet. Change, 18: 113–128.
Haverkamp R, Touma J, Vauclin M, Wierengaand PJ, Vachaud G (1977). A Comparison of Numerical Simulation Models for One-Dimensional Infiltration. Soil. Sci. Soc. Am. J. 41: 285-294.
Hovan SA, Rea DK, Pisias NG, Shackleton NJ (1989). A direct link between the China loess and marine �18O records: aeolian flux to the north Pacific. Nature, 340: 296-298.
Hu W, Shao MA, Wang QJ, Li Y (2005). Effects of sampling size on measurements of soil saturated hydraulic conductivity. Acta Pedol. Sin. 42(6): 1040-1043.
Khanzode RM, Vanapalli SK, Fredlund DG (2002). Measurement of soil water characteristic curves for fine grained soils using a small scale centrifuge. Can. Geotech. J. 39: 1209–1217.
Klute A, Dirksen C (1986). Hydraulic conductivity and diffusivity laboratory methods. In Klute A (eds.) Methods of soil analysis. Part I. 2nd edition. Agron. Monogr. ASA. SSSA. Madison. WI. 9: 687-734.
Lu DQ, Shao MA, Horton R, Liu CP (2004). Effect of changing bulk density during water desorption measurement on soil hydraulic properties. Soil Sci. 169(5): 319-329.
Ng CWW, Pang YW (2000). Experimental investigations of the soil water characteristics of a volcanic soil. Can. Geotech. J. 37: 1252–1264.
Porter SC (2001). Chinese loess record of monsoon climate during the last glacial interglacial cycle. Earth Sci. Rev. 54(1-3): 115-128.
Reatto A, Silva EM, Bruand A, Martins ES, Lima JE (2008). Validity of the centrifuge method for determining the water retention properties of tropical soils. Soil Sci. Soc. Am. J. 72(6): 1547-1553.
Saxton KE, Rawls WJ, Romberger JS, Papendick RI (1986). Estimating generalized soil water characteristics from texture. Soil Sci. Soc. Am. J. 50: 1031-1036.
Silva EM, Azevedo JA (2002). Influência do período de centrifugação na curva de retenção de água em solos de Cerrado. Pesq. Agropec. Bras. 37: 1487–1494.
Simons CS, Nielsen DR, Biggar JW (1979). Scaling of field measured soil water properties. Hilgardia, 50: 1-25.
Smith MJ, Stevens T, MacArthur A, Malthus TJ, Lu HY (2011). Characterising Chinese loess stratigraphy and past monsoon variation using field spectroscopy. Quatern. Int. 234(12): 146-158.
Van Genuchten MTH (1980). A closed form equation for predicting the hydraulic conductivity of unsaturated soils. Soil Sci. Soc. Am. J. 44: 892-898.
Van Genuchten MTh, Leij FJ, Yates SR, Williams JR (1991).The RETC Code for Quantifying the Hydraulic Functions of Unsaturated Soils. Ada, Oklahoma, U. S. Environ.l Protection Agency. pp. 4-41
Vanapalli SK, Fredlund DG, Pufahl DE (1999). The influence of soil structure and stress history on the soil water characteristics of a compacted till. Geotechnique. 49(2): 143-159.
Wang CY (2009). Study on the soil water Characteristics of the L1-S2 loess paleosol sequence in luochuan, Shaanxi province. In Symposium of Centennial Celebration Geo. Soc. China. Chinese. I: p. 113.
Zhang SL, Grip H, Lövdahl L (2006). Effect of soil compaction on hydraulic properties of two loess soils in China. Soil Till. Res. 90(12): 117-125.