solar cell nanotechnology (tiwari/solar) || dye-sensitized solar cells
TRANSCRIPT

Part 2
NOBLE APPROACHES
Atul Tiwari, Rabah Boukherroub, and Maheshwar Sharon (eds.) Solar Cell Nanotechnology, (159–160) 2014 © Scrivener Publishing LLC
161
Atul Tiwari, Rabah Boukherroub, and Maheshwar Sharon (eds.) Solar Cell Nanotechnology, (161–184) 2014 © Scrivener Publishing LLC
6
Dye-Sensitized Solar Cells
Lakshmi V. Munukutla, Aung Htun, Sailaja Radhakrishanan, Laura Main, and Arunachala M. Kannan*
Department of Engineering and Computing Systems, Arizona State University at the Polytechnic Campus, Mesa, Arizona, USA
AbstractDye-sensitized solar cells (DSSCs) are an inexpensive alternative to the common silicon (Si) solar cell technology. The DSSC technology is con-sidered as a third generation photovoltaic technology, which is dem-onstrating tremendous potential to become a revolutionary technology that has several indoor applications (window panels and doors) in low light environment. Additionally, the DSSC fabrication process is sim-ple and cost effective, and does not require clean-room facility and highly pure materials. The efficiency of the DSSCs is around 12% based on today’s technology, which is higher than the organic solar cells and lower than the traditional silicon-based solar cells. There are several challenges yet to be solved associated with DSSCs for commercializa-tion, and one of those challenges is related to its longevity and stability.
Keywords: Dye, semiconductor, titanium dioxide, polymer, solar cell
6.1 Introduction
The present dominance of photovoltaic fi eld by the inorganic solid-state junction is challenged by the DSSCs as Michäel Gretzel fi rst demonstrated in 1991 [1]. The key departure from the silicon junction devices is that the contact phase with the semiconductor
*Corresponding author: [email protected]

162 Solar Cell Nanotechnology
is replaced by an electrolyte (liquid, gel and quasi-solid) in DSSC, which makes it a photochemical cell. Advances in nanocrystalline materials fabrication and characterization made it conceivable to attain systems with interpenetrating networks of mesoscopic semi-conductors exhibiting higher conversion effi ciencies which is one of the critical features for development of the DSSC technology. Secondly, achieving optical absorption and charge separation pro-cesses using a combination of a sensitizer as a light-absorbing mate-rial with a nanocrystaline wide bandgap semiconducting material, is directed to DSSC fabrication.
The best research cell effi ciency between different solar cell tech-nologies is shown in Figure 6.1 [2]. Multi-junction concentration solar cell has achieved record high effi ciency of 40.7% in the year 2010, as compared to 20–27% effi ciency in crystalline solar cells. DSSCs, which possess a simple fabrication procedure and promis-ing applications on fl exible substrates, are considered as third gen-eration solar cells and their cost is predicted to be fi ve times less than that of the second generation solar cells (silicon solar cells) as depicted in Figure 6.2. The recorded effi ciency of 11.1% for the DSSCs has been reported by Y. Chiba et al. [3].
Figure 6.1 Evolution of the performances of different solar cells.

Dye-Sensitized Solar Cells 163
6.2 Background
The phenomenon of sensitizing a semiconductor with light hav-ing longer wavelength than its bandgap energy has been demon-strated earlier [4, 5]. This resembles convergence of photography and photoelectrochemisry based on the principle of photoinduced charge separation at a semiconductor-liquid interface. However, silver halides used in the photography had higher bandgap ener-gies and so they became insensitive to most of the visible range of the electromagnetic spectrum. But in DSSC fabrication metal oxide fi lms are used with much smaller bandgap energy to facilitate light absorption from the visible spectrum.
In 1839 Becquerel discovered the emergence of an electric poten-tial between two electrodes connected to a solid or liquid system upon light irradiation [6]. According to Michael Gratzel, the fi rst sensitization of a photoelectrode followed immediately after the rendering of a black and white image in the 1870s [7]. However, the realization that the two procedures work likewise through the injection of electrons from photoexcited dye molecules into the con-duction band of the n-type semiconductor substrate did not occur until the late 1960s [8]. In subsequent years, the idea that the dye could function most effi ciently if it is chemisorbed on the surface of the semiconductor was developed. The idea to use dispersed parti-cles to provide a suffi cient interface for chemisorption emerged [9],
0
20
40
60
80
100
100 200
Cost, US$/m2
US$0.10/W US$0.20/W
min BOS
US$0.50/W
US$1.00/W
Eff
icie
ncy
, %
300 400 500
Ultimatethermodynamiclimit at 1 sun
Shockley-Queisserlimit
III
III
Figure 6.2 Cost comparison of different generation solar cells.

164 Solar Cell Nanotechnology
and then photoelectrodes were developed based on this concept [10]. Titanium dioxide (TiO2) became the semiconductor of choice due to its many advantages for sensitized photochemistry and pho-toelectrochemistry. TiO2 is a low cost, non-toxic, widely available and biocompatible material.
6.2.1 DSCC Operation Principle
Energy conversion in a DSSC is based on the injection of an elec-tron from a photoexcited state of the sensitizer dye into the con-duction band of the nanocrystalline semiconductor TiO2. Titanium dioxide in antase phase is by far the most employed oxide semi-conductor, as depicted in Figure 6.3 [11]. The original state of the dye is subsequently restored by electron donation from the elec-trolyte, usually an organic solvent containing redox system, such as the iodide/triiodide couple. The regeneration of the sensitizer by iodide intercepts the recapture of the conduction band elec-tron by the oxidized dye. The iodide is regenerated in turn by the reduction of triiodide at the counter electrode, the circuit being completed via electron migration through the external load as shown in Figure 6.4.
The light-to-electron conversion process in DSSC differs funda-mentally from the one in the conventional solar cells. Figure 6.5 shows the energy band diagram of a pn-junction after thermal
Transparent electrodeElectrolyte
I3– 3I–
Light
TiO2
DyeCounter electrode
e–
e–
e–
e–
e–
e–
e–
e–e–e–
e–
e–
Figure 6.3 DSCC operating principle.

Dye-Sensitized Solar Cells 165
equilibration of charge carriers [12]. The uncompensated charge caused by the diffusion of holes into the n-region, and electrons to the p-region, forms an electric fi eld at the interface between the n and the p type semiconductors (space charge layer), which is characterized by the built in potential Vbi. Absorption of photons with an energy higher than the bandgap results in the generation of excitons, which interact via columbic forces. The excitons recom-bine after a certain time under emission of photons or heat, unless they are separated by an electric fi eld. Therefore, only excitons cre-ated in the space charge layer or close to it will contribute to the photocurrent.
Figure 6.4 Energy Band structure of DSSC.
Fermi level
BV
BCe–
Light Voltage
Redox coupleDyeS°/S+
S∗
Anode ElectrolyteTiO2 Cathode
3
2
1
54
p-type n-type
EV
EF
+
–
hνEC
Eg
eVbi
SPL
Figure 6.5 Energy band diagram of a conventional pn-junction solar cell under Short-circuit conditions [1].

166 Solar Cell Nanotechnology
The distinctive features between the traditional silicon-based solar cell and DSSC are as follows:
• Light adsorption and charge carrier transport are sep-arated in dye-sensitized solar cell, whereas the semi-conductor in the conventional cell establishes both of these processes.
• An electric fi eld is necessary for charge separation in the pn-junction cell. Nanoparticles in the dye- sensitized solar cell are too small to sustain a build-in fi eld; accordingly charge transport occurs mainly via diffusion.
• Inside a pn-junction minority and majority charge car-riers coexist in the same bulk volume. This makes con-ventional solar cells sensitive to bulk recombination and demands the absence of any recombination cen-ters such as trace impurities. Dye-sensitized solar cells are majority charge carrier devices in which the elec-tron transport occurs in the TiO2 and the hole trans-port in the electrolyte.
Important challenges of the dye-sensitized solar cell are the volatility of the electrolyte and the corrosive action of the iodide redox couple. Correspondingly, long-term application of dye-sensitized solar cell is limited by the electrolyte permeability of the encapsulation and its inertness towards the iodine. Therefore, a lot of effort has been invested in fi nding less volatile electro-lytes while maintaining suffi cient hole transport. Approaches to replace the liquid electrolyte include application of ionic conduct-ing polymer gels [13–15], electrolyte gellated with amino-acid derivatives [16] or room temperature molten salts [17]. Complete replacement of the liquid electrolyte system has been established using inorganic p-type semiconductors, such as CuI [18–21] or CuSCN [22, 23] as well as organic hole conductors, including low molecular weight charge transport materials [24] and semicon-ducting polymers [25, 26].
6.2.2 DSSC Structure
The DSSC comprises two electrochemical electrodes with a sandwiched iodide-based electrolyte. The working electrode of
Dye-Sensitized Solar Cells 167
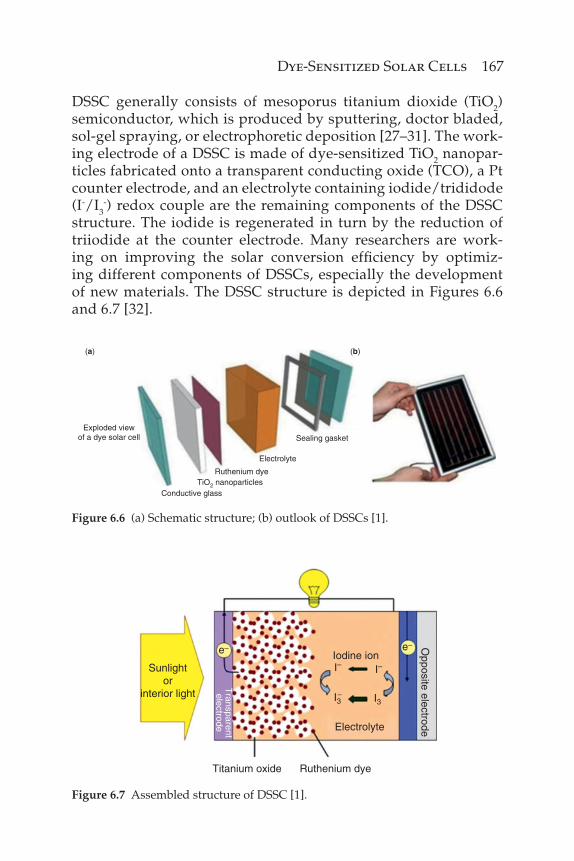
DSSC generally consists of mesoporus titanium dioxide (TiO2) semiconductor, which is produced by sputtering, doctor bladed, sol-gel spraying, or electrophoretic deposition [27–31]. The work-ing electrode of a DSSC is made of dye-sensitized TiO2 nanopar-ticles fabricated onto a transparent conducting oxide (TCO), a Pt counter electrode, and an electrolyte containing iodide/trididode (I-/I3
-) redox couple are the remaining components of the DSSC structure. The iodide is regenerated in turn by the reduction of triiodide at the counter electrode. Many researchers are work-ing on improving the solar conversion effi ciency by optimiz-ing different components of DSSCs, especially the development of new materials. The DSSC structure is depicted in Figures 6.6 and 6.7 [32].
Exploded viewof a dye solar cell
(a) (b)
Conductive glassTiO2 nanoparticles
Ruthenium dye
Electrolyte
Sealing gasket
Figure 6.6 (a) Schematic structure; (b) outlook of DSSCs [1].
Figure 6.7 Assembled structure of DSSC [1].
Sunlightor
interior light
Transparentelectrode
Titanium oxide Ruthenium dye
Iodine ion
Electrolyte
e–e–
I– I–
I3– I3
Opposite electrode

168 Solar Cell Nanotechnology
6.2.3 DSSC Challenges
The DSSC performance improvement paths for exploration are; develop dyes that absorb more photons, create new electrolytes that provide higher voltages with stability, and fi nally develop DSSCs that can last for 30 years to compete with the conventional silicon technology. There are several challenges to be addressed to enhance DSSC effi ciency beyond 12%. One path is increasing absorption light wavelength to 900 nm by designing near-infrared dyes. The second challenge is improving the DSSC performance and longev-ity which could be achieved by successfully replacing the liquid electrolyte with quasi-solid electrolyte and/or nanoclay-based electrolytes and exploring better sealing materials and techniques to improve the lifetime of the DSSCs to close to 30 years. Signifi cant research is going on in these specifi ed areas to reach theoretical effi -ciency range of 14–20% at the cell level and 6–9% at module level.
The aesthetic advantages of DSSCs over conventional solar cells are: dye selection to determine the device color and devices that can be transparent and also fl exible with simple fabrication proce-dures. Michael Gratzel and others documented the DSSC fabrica-tion details with complete instructions [33–35].
6.2.4 DSSC Components
6.2.4.1 Working Electrode
The need for dye-sensitized solar cells to absorb far more of the incident light was the driving force for the development of meso-scopic semiconductor materials [36], which have attracted great attention during recent years. The dye-sensitized, TiO2 fi lm is typi-cally deposited on a highly doped, transparent conducting oxide (TCO), which allows light transmission while providing suffi cient conductivity for current collection. The surface of TCO should make good mechanical and electrical contact with the porous TiO2 fi lm. The TiO2 semiconductor has three functions in the dye-sen-sitized solar cell: it provides the surface for the dye adsorption, functions as an electron acceptor for the excited dye and serves as an electron conductor. Therefore, preparation of the working elec-trode (in particular TiO2 fi lm preparation) is crucial for the DSSC performance. The most important process step for the performance of dye-sensitized solar cells is the development of a mesoporous semiconductor structure. TiO2
layer with mesoporous structures

Dye-Sensitized Solar Cells 169
allows superior surface areas of 1000 times larger than the appar-ent geometric one based on particle size (10–20 nm), fi lm thickness and porosity. Sintering the nanoparticles together enables the entire surface-absorbed molecular layer to be retrieved electronically to achieve the electronic contact between the nanoparticles. The inter-connection of the nanoparticles by the sintering process allows the deposition of a mechanically stable, transparent fi lm thickness of typically a few microns.
Semiconductors such as TiO2, ZnO, SnO2 and Nb2O5, or chalco-genides such as CdSe, are studied for photoelectrochemical appli-cations. Amongst them, TiO2 is by far the most commonly used, because of its energetic properties and its stability, which allows attachment of dyes. Figure 6.8 shows the SEM image of a nano-crystalline TiO2 fi lm with a grain size in the range of 10–80 nm [37], which is a low cost material and is widely available. TiO2 is used in its low-temperature stable form, anatase (pyramide-like crystals).
6.2.4.2 Dye Sensitizer
The dye is the photoactive element of the photovoltaic device, har-vesting the incident light for the photon-to-electron conversion. The ideal characteristic of the dye should cover a wide range of the solar spectrum. More than 50% of the solar energy is emitted in the region from 400 to 800 nm. Thus ruthenium dyes that adsorb throughout the visible spectrum (panchromatic) capture most of the sunlight. The extinction coeffi cient of the dye should be high throughout the entire absorption spectrum, in order to absorb most of the light with
50 nm
Figure 6.8 SEM image of nanocrystalline TiO2 fi lm.

170 Solar Cell Nanotechnology
a minimum quantity of dye material. Since the white light harvest-ing effi ciency is limited by the absorption in the weaker absorb-ing regions, a high extinction coeffi cient at wavelengths different from the maximum absorption peak is particularly important. The dye excited state lifetime must be long enough for effi cient electron injection. In general this requirement is not a limiting factor, as elec-tron injection occurs on the sub-nanosecond time scale and thus can compete effi ciently with other excited state decay processes.
The best photovoltaic performance has so far been achieved with polypyridyl complexes of ruthenium and osmium. Sensitizers hav-ing the general structure ML2(X)2, where L stands for 2,2_-bipyri-dyl-4,4_-dicarboxylic acid M is Ru or Os and X presents a halide, cyanide, thiocyanate, acetyl acetonate, thiacarbamate or water substituent, are particularly promising. The ruthenium complex cis-RuL2(NCS)2, as shown in Figure 6.9, known as N719 dye, has become widely used sensitizer for mesoporous solar cells. The fully protonated N719 has absorption maxima at 518 and 380 nm and the complex emits at 750 nm with the 60 ns lifetime.
6.2.4.3 Electrolyte
The electrolyte facilitates two important tasks in the DSSC process. It serves as the transport mechanism for the redox mediator from the TiO2 electrode to the counter electrode where electron transfer will occur and the triiodide ions will be reduced to iodide as shown by the following reaction:
I3– + 2e– 3I– (6.1)
At the TiO2 side, the electrolyte serves to regenerate the dye mol-ecule, which has been oxidized following the electron injection into
OH
OH
Bu4N
Bu4N
O
O O
OO
NN NCS
NCSNN
Ru
O
+ –
+ –
Figure 6.9 Chemical structure of ruthenium N719 dye.
Dye-Sensitized Solar Cells 171
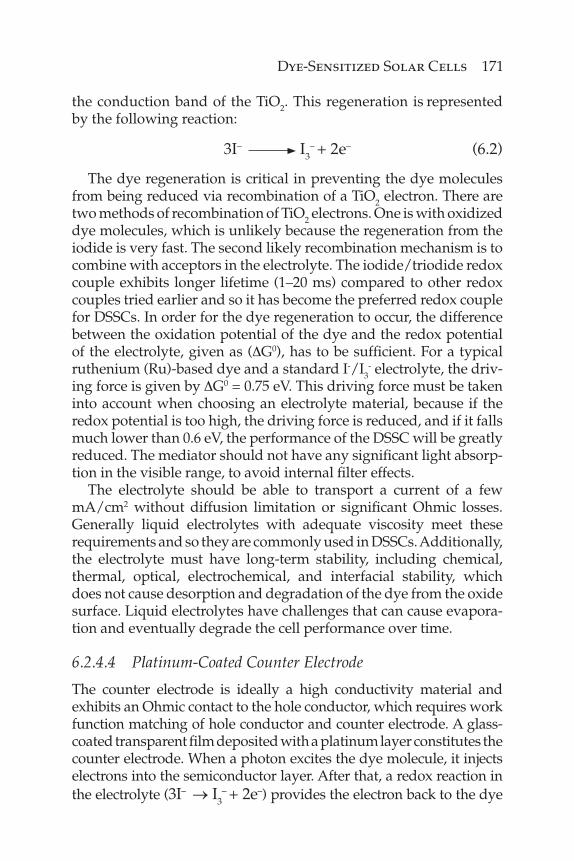
the conduction band of the TiO2. This regeneration is represented by the following reaction:
3I– I3– + 2e– (6.2)
The dye regeneration is critical in preventing the dye molecules from being reduced via recombination of a TiO2 electron. There are two methods of recombination of TiO2 electrons. One is with oxidized dye molecules, which is unlikely because the regeneration from the iodide is very fast. The second likely recombination mechanism is to combine with acceptors in the electrolyte. The iodide/triodide redox couple exhibits longer lifetime (1–20 ms) compared to other redox couples tried earlier and so it has become the preferred redox couple for DSSCs. In order for the dye regeneration to occur, the difference between the oxidation potential of the dye and the redox potential of the electrolyte, given as (ΔG0), has to be suffi cient. For a typical ruthenium (Ru)-based dye and a standard I-/I3
- electrolyte, the driv-ing force is given by ΔG0 = 0.75 eV. This driving force must be taken into account when choosing an electrolyte material, because if the redox potential is too high, the driving force is reduced, and if it falls much lower than 0.6 eV, the performance of the DSSC will be greatly reduced. The mediator should not have any signifi cant light absorp-tion in the visible range, to avoid internal fi lter effects.
The electrolyte should be able to transport a current of a few mA/cm2 without diffusion limitation or signifi cant Ohmic losses. Generally liquid electrolytes with adequate viscosity meet these requirements and so they are commonly used in DSSCs. Additionally, the electrolyte must have long-term stability, including chemical, thermal, optical, electrochemical, and interfacial stability, which does not cause desorption and degradation of the dye from the oxide surface. Liquid electrolytes have challenges that can cause evapora-tion and eventually degrade the cell performance over time.
6.2.4.4 Platinum-Coated Counter Electrode
The counter electrode is ideally a high conductivity material and exhibits an Ohmic contact to the hole conductor, which requires work function matching of hole conductor and counter electrode. A glass-coated transparent fi lm deposited with a platinum layer constitutes the counter electrode. When a photon excites the dye molecule, it injects electrons into the semiconductor layer. After that, a redox reaction in the electrolyte (3I– → I3
– + 2e–) provides the electron back to the dye

172 Solar Cell Nanotechnology
molecule. The triiodide in turn accepts electrons, and is reduced to iodine (I3
– + 2e– → 3I– ) to regenerate the redox couple. The effi ciency of a DSSC is based on different rate constants for iodine reduction between the working and counter electrodes. The iodine reduction at the counter electrode has to be several orders of magnitude faster than the recombination at the TiO2/electrolyte interface. The regeneration of the oxidized dye occurs in the nanosecond range, which is typically 100 times faster than any recombination reaction and about 108 times faster than the intrinsic lifetime of the oxidized dye.
6.2.4.5 Equivalent Circuit of DSSC
The equivalent circuit of conventional solar cells is well understood and employed to analyze cell devices and to improve cell perfor-mance. The same equivalent circuit worked well to analyze DSSC using the electrochemical impedance spectroscopy (EIS) method [38–40]. Figure 6.10(a) is an example of the Nyquist Plot, measured by the EIS method to interpret the internal resistance of DSSCs [41]. Three semicircles are observed in the measured frequency range from 100Hz to 1 MHz. The internal resistances of R1, R2, and R3 describe the real parts of Z1, Z2 and Z3, respectively. Because imped-ance over 1 MHz could not be measured due to instrument limita-tions, the resistance element in this frequency region is defi ned as Rh. Figure 6.10(b) depicts the equivalent circuit of DSSCs. Rsh is the shunt resistance inside DSSCs.
Rh, which locates high frequency range > 106 Hz area, represents the sheet resistance of the TCO substrate and is primarily infl uenced by the thickness of the conductive layer on the electrode. R1 is related to the carrier transport resistance at the surface of Pt counter electrode
00.0
–1.0
–2.0
–3.0
1 2 3 4
Z1
(a) (b)
Z1 Z3Rh
RshZ2
Z2V
Z3
5R3R2
z' (W)
z'' (
W)
R1Rh
Figure 6.10 (a) Nyquist plot and (b) equivalent circuit of DSSC.

Dye-Sensitized Solar Cells 173
and can be varied changing the roughness factor of counter electrode. Changing the distance between TCO and Pt counter electrode can optimize R3, which represents the diffusion of iodide and triiodide within the electrolyte. R2 shows the resistance of the diode element in DSSCs, and refl ects the properties of the photoinjected electrons within the TiO2. The series internal resistance, Rs, is defi ned as the sum of the resistance R1, R3, and Rh. The variation of each resistance pinpoints a different direction to optimize the effi ciency of DSSCs.
6.3 DSSC Key Performance Parameters
A DSSC, which performs a similar function as a silicon solar cell, provides electrical power to a load under illumination. The stan-dard characterization techniques of DSSC include the determina-tion of the DC current-voltage characteristic and analysis of the photocurrent-voltage (I-V) curves.
The following device parameters can be extracted from the I-V curves:
a. Short-circuit current (ISC): Cell current measured at an applied potential of zero volt. ISC is a function of the illumination intensity.
b. Open-circuit potential (VOC): Cell potential measured when current in the cell is zero, corresponding to almost fl at valence and conduction bands.
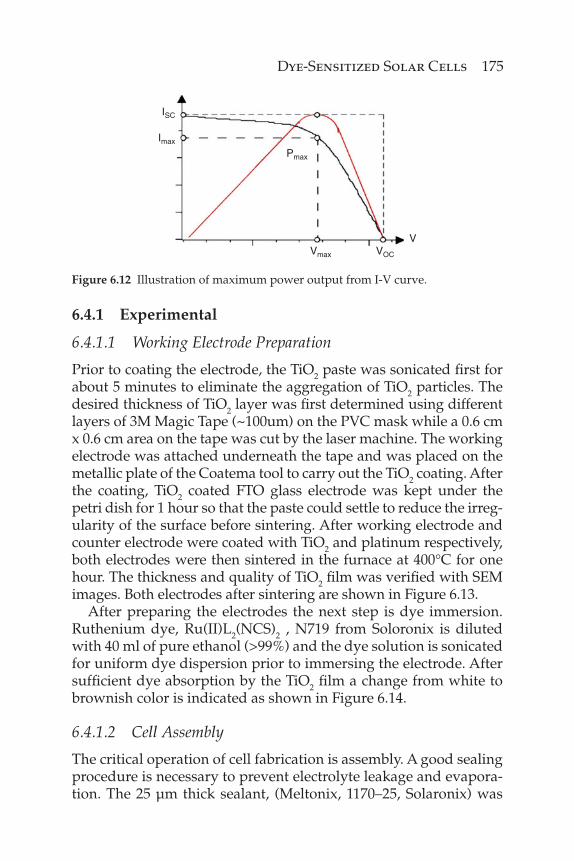
c. Maximum power output (Pmax): For a given bias volt-age the power output of the cell is the product of the measured cell current and the voltage P(V)=I*V. Imax and Vmax are the coordinates of the maximum in the P(V) curve (maximum power point). The maximum power corresponds visually to the area of the largest rectangle, which can fi t inside the current voltage curve.
d. The fi ll factor (FF) is the ratio of the maximum power to the external short and open circuit values:
.
.max max
sc oc
I VFF
I V=
(6.3)
This parameter indicates the defl ection of the current-volt-age characteristic from a square-like curve and is therefore

174 Solar Cell Nanotechnology
dependent on series and shunt resistance. Figure 6.11 illus-trates the infl uence of increasing series resistance, Rs and decreasing shunt resistance, Rsh on the current-voltage char-acteristic. To obtain high fi ll factors, Rs has to be as small as possible, while Rsh needs to be as high as possible.
e. The Effi ciency (η) describes the performance of DSSC and is defi ned as the ratio of the maximum electric power extracted to the radiation power incident on the solar cell surface:
sc ocmax
in in
I .V . FFPP P
η = =
(6.4)
The effi ciency is a function of the VOC, the ISC and the FF of the cell. Accordingly, improvement of the photo-voltaic yield is the result of the optimization of these three parameters.
6.4 Device Improvements
The research efforts our group has focused on are the following: preparation of the working electrode, counter electrode, cell size and experimentation with different electrolytes. Optimization of these parameters is covered in this section. The standard I-V char-acterization techniques are performed to evaluate the device per-formance using solar simulator (Figure 6.12). The solar simulator is calibrated with a standard cell prior to taking the data.
V V
Rs
Rsh
I I
Figure 6.11 Illustration of the infl uence of increasing series resistance Rs and decreasing shunt resistance Rsh on the I-V curve of DSSC.
Dye-Sensitized Solar Cells 175
6.4.1 Experimental
6.4.1.1 Working Electrode Preparation
Prior to coating the electrode, the TiO2 paste was sonicated fi rst for about 5 minutes to eliminate the aggregation of TiO2 particles. The desired thickness of TiO2 layer was fi rst determined using different layers of 3M Magic Tape (~100um) on the PVC mask while a 0.6 cm x 0.6 cm area on the tape was cut by the laser machine. The working electrode was attached underneath the tape and was placed on the metallic plate of the Coatema tool to carry out the TiO2 coating. After the coating, TiO2 coated FTO glass electrode was kept under the petri dish for 1 hour so that the paste could settle to reduce the irreg-ularity of the surface before sintering. After working electrode and counter electrode were coated with TiO2 and platinum respectively, both electrodes were then sintered in the furnace at 400°C for one hour. The thickness and quality of TiO2 fi lm was verifi ed with SEM images. Both electrodes after sintering are shown in Figure 6.13.
After preparing the electrodes the next step is dye immersion. Ruthenium dye, Ru(II)L2(NCS)2 , N719 from Soloronix is diluted with 40 ml of pure ethanol (>99%) and the dye solution is sonicated for uniform dye dispersion prior to immersing the electrode. After suffi cient dye absorption by the TiO2 fi lm a change from white to brownish color is indicated as shown in Figure 6.14.
6.4.1.2 Cell Assembly
The critical operation of cell fabrication is assembly. A good sealing procedure is necessary to prevent electrolyte leakage and evapora-tion. The 25 μm thick sealant, (Meltonix, 1170–25, Solaronix) was
ISC
Imax
Pmax
Vmax VOC
V
Figure 6.12 Illustration of maximum power output from I-V curve.

176 Solar Cell Nanotechnology
used for sealing the cell. An electrode area of 0.5 cm x 0.5 cm was defi ned on the sealant by using the laser machine. The sealant was sandwiched between the two electrodes and secured the electrode assembly using the binder clips at each end applying adequate pressure for sealing. The electrodes were placed in the furnace at 135°C for 12 minutes to seal the electrodes.
6.4.1.3 Electrolyte Injection
The electrolyte, (Iodolyte R-50, Solaronix) was injected through the hole from counter electrode by using a syringe. Additional precautions were taken to minimize the trapped air bubbles. Finally the hole used for electrolyte injection was sealed to prevent electrolyte evaporation.
6.4.2 DSSC Performance Results
6.4.2.1 TiO2 Film Thickness Optimization
TiO2 paste containing 13 nm particles (Ti-Nanoxide D Series, Solaro-nix) is used for determining the optimized fi lm thickness for the
(a) (b)
Figure 6.13 (a) Working electrode with sintered TiO2 layer; (b) counter electrode with sin-
tered Pt. layer.
(a) (b)
Figure 6.14 (a) Image of N719 dye solution; (b) TiO2 layer after dye absorption.

Dye-Sensitized Solar Cells 177
working electrode of DSSC. 3M Magic tape with different layers (2–6) are used for varying the fi lm thickness on different working elec-trodes. The electrode coating with TiO2 is done using screen print-ing technique. The quality and thicknesses of electrodes were studied using SEM images shown in Figure 6.15.
The working electrodes were fabricated only with 2–4 TiO2 mask layers based on the information extracted from the SEM images. The TiO2 layer thicknesses are verifi ed under SEM and the values of the working electrodes are shown in Table 6.1.
Due to microcracks, working electrodes with fi ve and six layers were discarded for DSSC assembly and the remaining electrodes were assembled for performance evaluation.
In order to optimize the TiO2 fi lm thickness for DSCC, several sam-ples with thickness ranging from 20–60 μm were prepared and the assembled cells were characterized to generate I-V curves and electro-chemical impedances (Nyquist Plot) using Parastat 2273 Advanced Electrochemical System; Newport Xe OF Arc Lamp, (Newport) was used for AM 1.5 solar simulator (100mWcm−2) as light source. The results of this part of the experiment are shown in Figure 6.16.
It is clearly evident from Figure 6.16 that both open circuit volt-age and short circuit current have indicated dependence on the TiO2 layer thickness. With an increase of the semiconductor layer thick-ness the short-circuit current increased due to the higher amount of dye absorption that might have contributed to higher electron injection rate to provide higher short-circuit current; however, the open circuit voltage showed an opposite trend. To understand this
(a)
(d) (e)
(b) (c)
Figure 6.15 SEM images of (a) 2, (b) 3, (c) 4, (d) 5, and (e) 6 mask layers of TiO2 fi lm.

178 Solar Cell Nanotechnology
Table 6.1 Thickness of TiO2 fi lm corresponding to the mask layers.
No. of mask layers TiO2 Film Thickness
2 layer ~20 μm
3 layer ~40 μm
4 layer ~66 μm
00
5
10
15
20
25
0.1 0.2 0.3 0.4
Voltage (V)
Cu
rren
t d
ensi
ty (
mA
/cm
2 )
0.5 0.6 0.7 0.8 0.9
20 μm Thk-Eff: 6.40%
20 μm TiO2 thickness film 40 μm TiO2 thickness film 60 μm TiO2 thickness film
40 μm Thk-Eff: 9.06%
60 μm Thk-Eff: 8.52%
I-V Curves of DSSCs with different TiO2 film thickness
Figure 6.16 Optimization of TiO2 fi lm thickness.
effect completely further experimentation is required. However, dependence of the cell effi ciency on the fi lm thickness is not that well-defi ned. The sample with 40 μm fi lm thickness showed higher effi ciency compared to other samples. Based on the Nyquist plots it was noted that the internal resistance of the samples increased with higher fi lm thickness, and this could have denied the benefi t of higher absorption dye in thicker fi lms.
6.4.2.2 Optimization of Nanoparticle Size in TiO2
For this study the cell with 40 μm fi lm thickness was selected because of its better effi ciency obtained in the earlier study. The study of nanoparticle size for enhancing the photo conversion effi ciency of the DSSC was carried out using the particle sizes of 13nm, 20nm

Dye-Sensitized Solar Cells 179
and 37nm (Ti-Nanoxide D Series, Solaronix) in the TiO2 layer. The I-V characterization results of this study are shown in Figure 6.17.
The performance data in Figure 6.17 clearly indicated cell with 20nm size particles performed better than the other two. The open circuit voltage and fi ll factor did not change but the short-circuit current showed variation with different particle sizes. Figure 6.18 shows the Nyquist plots to assess the cell internal resistance as a function of nanoparticle size.
00
5
10
15
20
25
30
0.1 0.2 0.3 0.4Voltage (V)
Cu
rren
t d
ensi
ty (
mA
/cm
2 )
0.5 0.6 0.7 0.8
Φ: 20 nm-Eff: 11.2%
Φ: 20 nm-Eff: 10.3% Φ: 37 nm-Eff: 9.52%
Φ: 13 nm-Eff: 9.06%
Φ: 13 nm Nanoparticles (R-50 electrolyte)
Φ: 37 nm Nanoparticles (R-50 electrolyte)
Φ: 20 nm Nanoparticles (R-50 electrolyte)
Φ: 20 nm Nanoparticles (R-150 electrolyte)
I-V Curves of DSSCs with different Nanoparticle sizes
Figure 6.17 DSCC performance study with different nanoparticles size of TiO2.
Figure 6.18 Nyquist plots of DSSCs with different nanoparticles sizes.
0–1.5
–1
–0.5
0
0.5
1
1.5
2Z’ (W)
Z’ (
W)
4 6 8 10 12
Nyquist plots of DSSCs with different Nanoparticle sizes
Φ: 13 nm Nanoparticles (R-50 electrolyte) Φ: 20 nm Nanoparticles (R-50 electrolyte)
Φ: 20 nm Nanoparticles (R-150 electrolyte)Φ: 37 nm Nanoparticles (R-50 electrolyte)

180 Solar Cell Nanotechnology
Extracting from the Nyquist plots the interface resistance, R2 between TiO2/dye/electrolyte interface somewhat correlated to the nanoparticle size. The interface resistance increased with big-ger particle size. The sheet resistance of the cell with 20nm par-ticles showed lowest compared to other cells. The Table 6.2 below gives the quantitative values of the internal resistance of the cell.
6.4.2.3 Scaling Down the DSS Cell Size
Several studies in the literature indicated improvement of DSSC effi -ciency provided the cell size is scaled down. Three different cell sizes were fabricated to study the impact of cell size on performance. Indeed, our results also confi rmed the fact that cell size has greater infl uence on the performance. Table 6.3 below shows the results of our study.
6.5 DSSC Performance with Different Electrolytes
6.5.1 Liquid Electrolyte
One of the key components of the DSSC system is electrolyte. The desired features of the electrolyte for improving device performance
Table 6.2 DSSC performance characteristics with different nanoparticle sizes.
40 nm Thickness
f : 13 nm R-50 Electrolyte
f : 20 nm R-50 Electrolyte
f : 20 nm R-150 Electrolyte
f : 37 nm R-50 Electrolyte
Rh 5.24 5.08 4.4 3.96
R1 1.7 1.44 0.72 2.2
R2 1.79 2 1.98 2.71
R3 1.84 1.49 1.86 1.67
Rs 8.78 8.01 6.98 7.83
Effi ciency (%) 9.06% 10.30% 11.20% 9.52%
Voc (V) 0.79 0.78 0.78 0.79
Isc (niA.cm-2) 20.57 24.1 26.21 20.92
FF 0.57 0.55 0.55 0.58

Dye-Sensitized Solar Cells 181
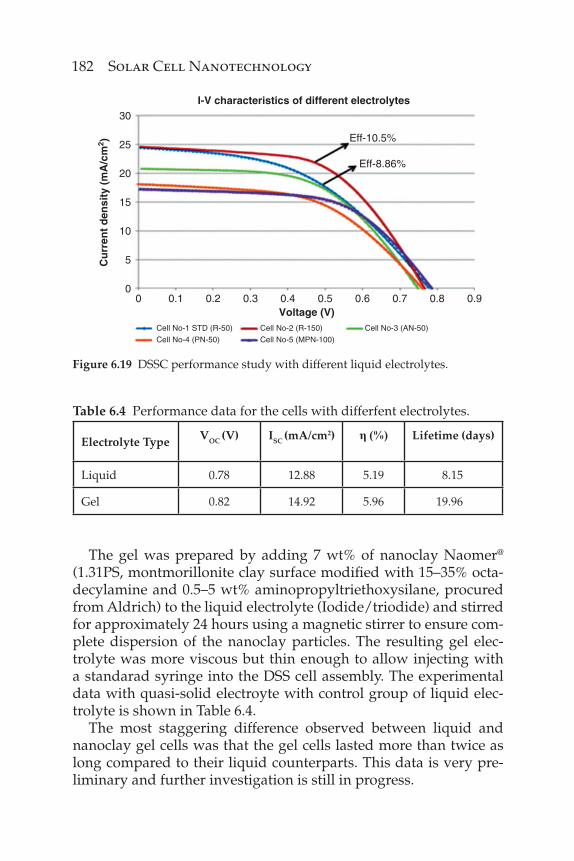
were previously mentioned in this article. Both liquid and semi-solid clay-based electrolytes are experimented on in this study. The diffi culty with liquid electrolyte is that it remains a challenge for both stability and longevity of the device. First several liquid elec-trolytes with higher concentration of iodolyte were used to study the infl uence of the electrolyte on device performance. The electro-lytes used for this study were R-150, AN-50, PN-50 and MPN-100, commercially available from Solaronix [42]. The results of this work are depicted in Figure 6.19. Both electrolyte injection and cell seal-ing were found to be very critical. However, manual sealing was done to assemble the cells with different electrolytes in the labora-tory environment. Based on the I-V curves data, R-150 electrolyte performed better compared to the standard electrolyte (Iodolyte R-50) and as well as other experimental electrolytes.
6.5.2 Quasi-Solid Electrolyte
An alternative to the liquid electrolyte is quasi-solid electrolyte, which is a gel-based material possessing redox couple similar to the liquid electrolyte. The advantage quasi-solid electrolyte offers is greater stability compared to liquid electrolytes. However, the higher viscosity associated with quasi-solid material causes deg-radation in cell effi ciency due to restricted ionic mobility. For this study high molecular weight polymethymethacrylate (PMMA) and montmorillonite (MMT) clay were used to create a polymer nanocomposite gel electrolyte that increased the conductivity from 7.6×10⁴ S/cm2 to 9.1×10⁻⁴ S/cm2.
Table 6.3 DSSC cell size scaling.
Cell Scaling 6 ¥ 6 cm2 2.5 ¥ 2.5 cm2 1.25 ¥ 1.25 cm2
Sample cell
Area 6 cm2 1 cm2 0.25 cm2
Effi ciency < 2.0 % 3.8 % 8.4 %
182 Solar Cell Nanotechnology
The gel was prepared by adding 7 wt% of nanoclay Naomer@
(1.31PS, montmorillonite clay surface modifi ed with 15–35% octa-decylamine and 0.5–5 wt% aminopropyltriethoxysilane, procured from Aldrich) to the liquid electrolyte (Iodide/triodide) and stirred for approximately 24 hours using a magnetic stirrer to ensure com-plete dispersion of the nanoclay particles. The resulting gel elec-trolyte was more viscous but thin enough to allow injecting with a standarad syringe into the DSS cell assembly. The experimental data with quasi-solid electroyte with control group of liquid elec-trolyte is shown in Table 6.4.
The most staggering difference observed between liquid and nanoclay gel cells was that the gel cells lasted more than twice as long compared to their liquid counterparts. This data is very pre-liminary and further investigation is still in progress.
00
5
10
15
20
25
30
0.1 0.2 0.3 0.4Voltage (V)
Cu
rren
t d
ensi
ty (
mA
/cm
2 )
0.5 0.6 0.7 0.8
Eff-10.5%
Eff-8.86%
0.9
Cell No-1 STD (R-50)
Cell No-4 (PN-50)
Cell No-2 (R-150) Cell No-3 (AN-50)
Cell No-5 (MPN-100)
I-V characteristics of different electrolytes
Figure 6.19 DSSC performance study with different liquid electrolytes.
Table 6.4 Performance data for the cells with differfent electrolytes.
Electrolyte Type VOC (V) ISC (mA/cm2) h (%) Lifetime (days)
Liquid 0.78 12.88 5.19 8.15
Gel 0.82 14.92 5.96 19.96
Dye-Sensitized Solar Cells 183
6.6 Conclusion and Outlook
Dye-sensitized solar cells are gaining importance as an alternate for silicon-based solar cells for indoor applications. Signifi cant global research efforts are being undertaken to commercialize this technology. However, several challenges are still being pursued to achieve the maturity equivalent to the existing silicon-based tech-nology. This article covers some background information related to the DSSC technology, the basic operation principle of DSSC, and challenges associated with improving the performance of the DSSC devices by optimizing several components of the DSSC system. The research results from our laboratory are included to address some of the challenges to improve the DSSC performance.
References
1. B. O’Regan and M. Grätzel, Nature Vol. 353, 737–740 (1991). 2. http://www.nrel.gov/ncpv/images/effi ciency_chart.jpg, accessed in July 2013. 3. Y. Chiba, A. Islam, Y. Watanabe, R. Komiya, N. Koide and L. Han, Dye-
sensitized solar cells with conversion effi ciency of 11.1%, Jpn. J. Appl. Phys. Vol. 45, 638–640, (2006).
4. A.J. McEvoy and M. Grätzel, Sensitization in photochemistry and photovolta-ics, Solar Energy Mat. Solar Cells Vol. 32, 221–227 (1994).
5. A. Hagfeldt and M. Grätzel, Molecular photovoltaics, ACC. Chem. Res. Vol. 33, 269–277 (2000).
6. E. Becquerel, Comptes Rendus Vol. 9, 561 (1839). 7. M. Grätzel, Review dye-sensitized solar cells, J. Photoch. Photobio. C - Photoch.
Rev. Vol. 4, 145–153 (2003). 8. H. Gerischer and H. Tributch, Ber. Bunsenges. Phys. Chem. Vol. 72, 437 (1968). 9. D.H. Dung, N. Serpone and M. Grätzel, Integrated systems for water cleavage
by visible-light sensitization of TiO2” particles by surface derivatization with ruthenium complexes, Helv. Chim. Acta Vol. 67, 1012–1018 (1984).
10. J. Desivestro, M. Grätzel, L. Kavan, J. Moser and J. Augustynski, Highly effi cient sensitization of titanium dioxide, J. Am. Chem. Soc. Vol. 107, 2988–2990 (1985).
11. M. Grätzel, Prog. Photovolt. Res. Appl. Vol. 8, 171 (2000).12. J. Krüger, Interface Engineering in Solid-State DSSC, University of Heidelberg,
(2003).13. F. Cao, G. Oskam and P. Searson. J. Phys. Chem. Vol. 99, 17071 (1995). 14. A.F. Nogueira, M.A. De Paoli, I. Montanari, et al., J. Phys. Chem. B Vol. 105,
7517–7524 (2001).15. W.A. Gazotti, A.F. Nogueira, E.M. Girotto, et al., Synth. Met. Vol. 108, 151–157 (2000).16. W. Kubo, K. Muakoshi, T. Kitamura, et al., Chem. Lett. 1998, 1241.17. N. Papageorgiou, Y. Athanassov, M. Armand, et al., J. Electrochem. Soc. Vol. 143,
3099–3108 (1996).

184 Solar Cell Nanotechnology
18. K. Tennakone, G. Kumara, I. Kottegoda, et al., J. Phys. D-Appl. Phys. Vol. 31, 1492–1496 (1998).
19. K. Tennakone, G.R.R.A. Kumara, A.R. Kumarasinghe, et al., Semicond. Sci. Tech. 1995, 10, 1689–1693.
20. K. Tennakone, A.R. Kumarasinghe and P.M. Sirimanne, Semicond. Sci. Tech. 1993, Vol 8, Iss 8, 1557–1560.
21. K. Tennakone, G.R.R.A. Kumara, K.G.U. Wijayantha, et al., Semicond. Sci. Tech. 1998, 13, 134–138.
22. B. O’Regan and D.T. Schwartz, J. Appl. Phys. 1996, 80, 4749.23. B. O‘Regan and D. Schwartz, Chem. Mater. 1998, 10, 1501–1509.24. J. Hagen, W. Schaffrath, P. Otschik, et al., Synth. Met. 1997, 89, 215–220.25. K. Murakoshi, G. Kano, Y. Wada, et al., J Electronanal. Chem. 1995, 396, 27.26. K. Murakoshi, R. Kogure and S. Yanagida, Chem. Lett. 1997, 5, 471–472.27. A.I. Kontosa, A.G. Kontosa, D.S. Tsouklerisa, M.C. Bernardc, N. Spyrellis,
P. Falarasa, Nanostructured TiO2 fi lms for DSSCS prepared by combining doctor-blade and sol–gel techniques, J. Mater. Process. Tech. 196 243–248 (2008).
28. L. Grinis, S. Dor, A. Ofi r, A. Zaban, Electrophoretic deposition and compres-sion of titania nanoparticle fi lms for dye-sensitized solar cells, J. Photoch. Photobio. A-Chemistry 198 52–59 (2008).
29. W. Tana, X. Yina, X. Zhoua, J. Zhanga, X. Xiaoa, Y. Lina, Electrophoretic depo-sition of nanocrystalline TiO2 fi lms on Ti substrates for use in fl exible dye-sensitized solar cells, Electrochim. Acta 54 4467–4472 (2009).
30. G.S. Kim, H.K. Seo, V.P. Godble, Y.S. Kim, O.B. Yang, H.S. Shin, Electrophoretic deposition of titanate nanotubes from commercial titania nanoparticles: Application to dye-sensitized solar cells, Electrochem. Commun. 8 961–966 (2006).
31. W. Jarernboon, S. Pimanpang, S. Maensiri, E. Swatsitang, V. Amornkitbamrung, Optimization of titanium dioxide fi lm prepared by electrophoretic deposition for dye-sensitized solar cell application, Thin Solid Films Vol. 517, 4663–4667, 2009, Elsevier.
32. www.Solaronix.com, accessed in July 2013.33. http://cnsi.ctrl.ucla.edu/nanoscience/pages/solarCells, accessed in July
2013.34. B. O’Regan and M. Grätzel. A low-cost, high effi ciency solar cell based on dye
sensitized colloidal TiO2 fi lms, Nature Vol. 353, 737–740 (199135. C.J. Barbé, et al., Nanocrystalline titanium oxide electrodes for photovoltaic
applications, J. Am. Ceram. Soc. Vol. 80, 3157–3171 (1997).36. B. O‘Regan and D. Schwartz, Chem. Mater. 10, 1501–1509 (1998).37. J. Hagen, W. Schaffrath, P. Otschik, et al., Synth. Met. 89, 215–220 (1997).38. K. Murakoshi, G. Kano, Y. Wada, et al., J. Electronanal. Chem. Vol. 396, 27 (1995).39. W.A. Gazotti, A.F. Nogueira, E.M. Girotto, et al., Synth. Met. Vol. 108, 151–157
(2000).40. C.J. Barbé, et al., Nanocrystalline titanium oxide electrodes for photovoltaic
applications, J Am. Ceram. Soc. Vol. 80, 3157–3171 (1997).41. A. Hagfeldt, G. Boschloo, L. Sun, L. Kloo and H. Pettersson, Dye-sensitized
solar cells, Chem. Rev. Vol. 110, pp. 6595–6663, 2010.42. http://www.solaronix.com/products/iodideelectrolytes/iodolytez50/,
accessed in July 2013.