solar energised transport solution and · pdf fileНА АЛЬТЕРНАТИВНОМ...
TRANSCRIPT
TRANSPORT PROBLEMS 2015
PROBLEMY TRANSPORTU Volume 10 Issue 3
sustainable transport; solar photovoltaic; low emission vehicles; electric vehicles; Slovenia
Matjaž KNEZ*, Marjan STERNAD
Faculty of logistics, University of Maribor
Mariborska c. 7, 3000 Celje, Slovenia
*Corresponding author. E-mail: [email protected]
SOLAR ENERGISED TRANSPORT SOLUTION AND CUSTOMER
PREFERENCES AND OPINIONS ABOUT ALTERNATIVE FUEL
VEHICLES – THE CASE OF SLOVENIA
Summary. Authorities in Slovenia and other EU member states are confronted with
problems of city transportation. Fossil-fuel based transport poses two chief problems –
local and global pollution, and dwindling supplies and ever increasing costs. An elegant
solution is to gradually replace the present automobile fleet with low emission vehicles.
This article first explores the economics and practical viability of the provision of solar
electricity for the charging of electric vehicles by installation of economical available PV
modules and secondly the customer preferences and opinions about alternative low
emission vehicles. Present estimates indicate that for the prevailing solar climate of Celje
– a medium-sized Slovenian town – the cost would be only 2.11€ cents/kWh of generated
solar electricity. Other results have also revealed that the most relevant factor for
purchasing low emission vehicle is total vehicle price.
ИСПОЛЬЗОВАНИЕ ТРАНСПОРТА НА СОЛНЕЧНОЙ ЭНЕРГИИ,
ПРЕДПОЧТЕНИЯ КЛИЕНТОВ И МНЕНИЯ О СРЕДСТВАХ ТРАНСПОРТА
НА АЛЬТЕРНАТИВНОМ ТОПЛИВЕ - ПРИМЕР СЛОВЕНИИ
Аннотация. Власти Словении и других стран-членов ЕС сталкиваются с
проблемами городского транспорта. Транспорт работающий на основе ископаемых
видов топлива представляет две главные проблемы - локальное и глобальное
загрязнение, сокращающиеся поставки и постоянно растущие расходы. Хорошим
решением является постепенная замена существующего автомобильного парка на
транспортные средства с низким уровнем выбросов. Эта статья впервые исследует
экономику и практическую жизнеспособность использования солнечной
электроэнергии для зарядки электрических транспортных средств путем установки
экономичных доступных PV модулей и, во-вторых, предпочтений заказчиков и
мнений об альтернативных транспортных средствах с низким уровнем выбросов.
Современные оценки показывают, что для имеющего в основном солнечный
климат, Целье - среднего размера города Словении - цена будет только 2.11
евроцентов / кВт-ч выработанной солнечной электроэнергии. Другие результаты
также показали, что наиболее важным фактором при покупке транспортного
средства со сниженным уровнем вредных выбросов является его полная стоимость.
1. INTRODUCTION
Global climate changes call for an immediate global action through international cooperation of all
countries. According to the European environment agency the transport sector is the fastest growing
user of energy and hence the fastest growing producer of greenhouse gases in all EU states. Today,
18 M. Knez, M. Sternad
city authorities in Slovenia and other EU member states are confronted with problems of city
transportation in order to introduce the concept of green cities. These problems include an
overpopulation of automobiles in city centres – leading to grid locks, pollution, smog, accidents etc. In
order to reduce the damage, inflicted on city environments, transport change and change in the attitude
of people and companies is needed. City authorities can influence the implementation of better
management of transport in three ways (Portal, 2003; [9]):
• Regulations and taxes,
• Co-funded infrastructure development and environmentally-friendly vehicles and
• Change of transport regime
Michaelis [13] asserts that the level of CO2 emissions in city transport can be reduced in three
different ways: (1) by using more efficient, environmentally friendly transport technologies, (2) by
altering peoples‟ travel habits and (3) to change transport policy of city authorities regarding city
centre transport management.
Traffic jam in city centres is continuously increasing despite various measures due to rapidly
increasing transport demands. The evolution and development of urban logistics in the past decade has
only decreased the situation, partly also due to increased use of motor vehicles. In order to reduce
negative impacts on the environment, different economic instruments have been implemented such as
environmental taxes whereby the polluter pays. An important instrument is also the implementation of
reducing payments or taxes or exemption from such taxes due to investments in environmental
protection. Environmental technology or green technology is the power of environmental science, to
protect nature and to reduce the impacts caused by mankind. In this article a clean energy solution has
been proposed by means of propulsion of electric automobiles utilising solar energy.
Early in 2002 Copenhagen started with the implementation of the so called City Goods Ordinance
scheme in the medieval city centre regarding the use and the capacity of motor vehicles (DGET,
2002). The aim of this endeavour was reduce due to the impact of transport of goods has on the
environment and to improve the accessibility of narrow medieval streets, by reducing the number of
vans and all vehicles, which are driving into towns. The first half of the year concentrated on
restricting the tours of vans and lorries to those with acquired certificates. The fine for those without
such a certificate amounted to €68. According to the survey, the residents mostly approved of the
scheme. Four larger Swedish cities introduced the so called environmental zones within city centres
with the objective to improve air quality and reduce noise pollution [3]. This program refers to buses
and lorries whose weight exceeds 3.5tonnes. The key requirement for entering the environmental zone
was that no diesel vehicle be older than eight years. Older vehicles may enter the zone provided they
have undergone emission tests or they can be entirely banned from entering the city centre. Following
the Swedish example, Great Britain (Transport for London, 2008) implemented improvements
regarding emission reduction by introducing the so called Low Emission Zone. It is a precisely defined
area which may only be accessed with specific vehicles that meet the set requirements or standards.
The main aim of this measure is to reduce traffic impact on the environment and hence increase air
quality and encourage the use of cleaner or greener vehicles in city centres or areas with high level of
pollution. Although it is not necessary that the number of vehicles in these areas will decrease as a
result, and the number of cleaner vehicles with fewer emissions will increase.
Three German cities (PR Newswire Europe, 2008) have implemented a law which forbids those
vehicles which pollute the environment, to enter certain parts of city centres. These areas are labelled
environmental zones. In Berlin, Hannover and Cologne drivers must equip their vehicles with special
stickers as proof that the vehicles comply with the new environmental standards.
The European Commission recently unveiled a "single European transport area" aimed at enforcing
"a profound shift in transport patterns for passengers" by 2050. Top of the EU's list to cut climate
change emissions is a target of "zero" for the number of petrol and diesel-driven cars and lorries in the
EU's future cities. Siim Kallas, the EU transport commission, insisted that Brussels directives and new
taxation of fuel would be used to force people out of their cars and onto "alternative" means of
transport. "That actually means no more conventionally fuelled cars in our city centres” [31].
Solar energised transport solution and… 19
1.1. Electric vehicles – sustainable solution for city centres
The increasing concentration of population and wealth to cities is likely to continue-especially in
the developing world [17]. With further global population increase and urbanisation on the horizon
congestion will exacerbate the negative impact of the manner in which the automobiles will be driven
and on the overall energy consumption. It will not be possible to tackle global automotive energy
consumption and green-house gas emissions effectively without a radical change in thinking with
respect to urban transport [15]. For over a century, the automobile has offered affordable freedom of
movement within urban areas. Currently, however, a typical automobile is larger and heavier than it
needs to be to provide personal urban transport. On an average it weighs 20 times as much as its
driver, can travel over 450 km without refuelling, and can attain speeds of over 160 kph. The average
vehicle occupies 10m2 of road space for parking and is parked about 90% of the time [15].
Furthermore, the typical daily commuting distance in most European cities is less than 40km.
Worldwide, 18 million barrels of oil is consumed each day by the automobile sector. Annually the
vehicles emit 2.7 billion tonnes of CO2 (IEA, 2010) and claim 1.2 million lives via accidents (WHO,
2004). Within city centres the average vehicular speeds hardly ever exceed 16 kph [8].
One solution to tackle the problem of congestion and pollution within city centres around the world
is to use electricity powered, two-wheelers or ultra-compact four-wheelers. The ultra-compact cars
weigh less than 450 kg and occupy less than two-third length of a conventional compact car [17].
The first electric car was built sometime between 1832 and 1839 by Robert Anderson in Scotland
(PBS, 2010). Breakthrough by Gaston Plante and Camille Faure increased battery energy storage
capacity, which led to the commercialization of battery-electric cars in France and Great Britain in the
1880s. Battery-electric vehicles were quiet, clean, and simple to operate, but their batteries took a long
time to recharge, were expensive to replace, and had limited range (US Department of Transport,
2010). Automobiles are quite inefficient with approximately 75% of the energy going into producing
heat [11]. Research and development is being carried out into manufacturing affordable electric
automobiles that offer an improved overall thermodynamic efficiency and in this respect the car
manufacturer Nissan has announced plans to produce 50,000 Nissan “Leaf” electric cars in the UK
starting in 2013 with a global production of 200,000 units per year. At the same time Chinese
manufactured electric scooters are also increasingly making their entry in European cities with a
typical scooter costing around €1,200. Such scooters emit around 33gCO2/km if charged with fossil
fuel electricity. The latter figure however drops to a significantly lower value of 1.3gCO2/km if solar
energy is deployed to charge the scooter‟s lead acid batteries [18]. Within the UK market the „Charge‟
scooter company has made available an „S1‟ electric scooter that uses lithium-ion batteries and costs €
2,800. The 48-V, 40 Ah battery requires 4h to add an 80% charge and can deliver a 55km trip.
The main goal of this work is to review the energetic and environmental impact of the
transportation sector in Slovenia, assess the propulsion energy requirement of automobiles for a small
town‟s fleet, determine the benefits of replacing a proportion of the conventional fleet with electric
vehicles and identify the measures that would increase the people‟s interest in purchasing LEVs.
1.2. The energy budget of Slovenia
According to energy statistics for 2010, the production of primary energy in Slovenia increased by
2% compared to the previous years. The increase was mostly influenced by an 8% increase in
renewable energy sources production out of which the production of biogas increased the most,
namely by 80%. Total energy primary supply, which besides primary energy production includes also
import and export of energy increased by 3%. The increase was influenced mostly by the increase in
supply of renewable energy sources by 10% and supply of natural gas by 4% (SURS, 2011a). Supply
with petroleum products also decreased in 2010, compared with the previous year by 2%. Energy
dependency of Slovenia in 2010 was 50%. In 2010 the gross production of electricity was
16,433GWh. Most electricity was produced in thermal power plants (37%), followed by the nuclear-
(34%) and hydro power plants (29%).

20 M. Knez, M. Sternad
Table 1
SWOT analysis for Electric Vehicles
STRENGTHS WEAKNESSES
Eco friendly
Silent
Low cost of Ownership
Cheaper to run
Energy savings – achievable from
regenerative braking system
Simpler mechanism
Needs time to recharge
Lack of recharging infrastructure
Batteries change is expensive
OPPORTUNITIES THREATS
Governments subsidy for
ownership
No congestion charge
Lower taxes
Increasing fossil fuel costs
Competition in form of electric
hybrids, alternative fuel, hydrogen-
powered cars
Rise in cost of electricity
2. RESEARCH METHODOLOGY
This study is divided into five sections. First we calculate the average mileage of Slovene cars and
energy consumption of EVs, and then the CO2 emissions of passenger cars in Celje are presented. The
third and fourth sections respectively present calculation of solar energy availability and the required
recharging capacities for proposed EV fleet. At the end, some results of the survey, which was carried
out in Slovenia in connection with the opinion of the customers regarding LEVs, are presented.
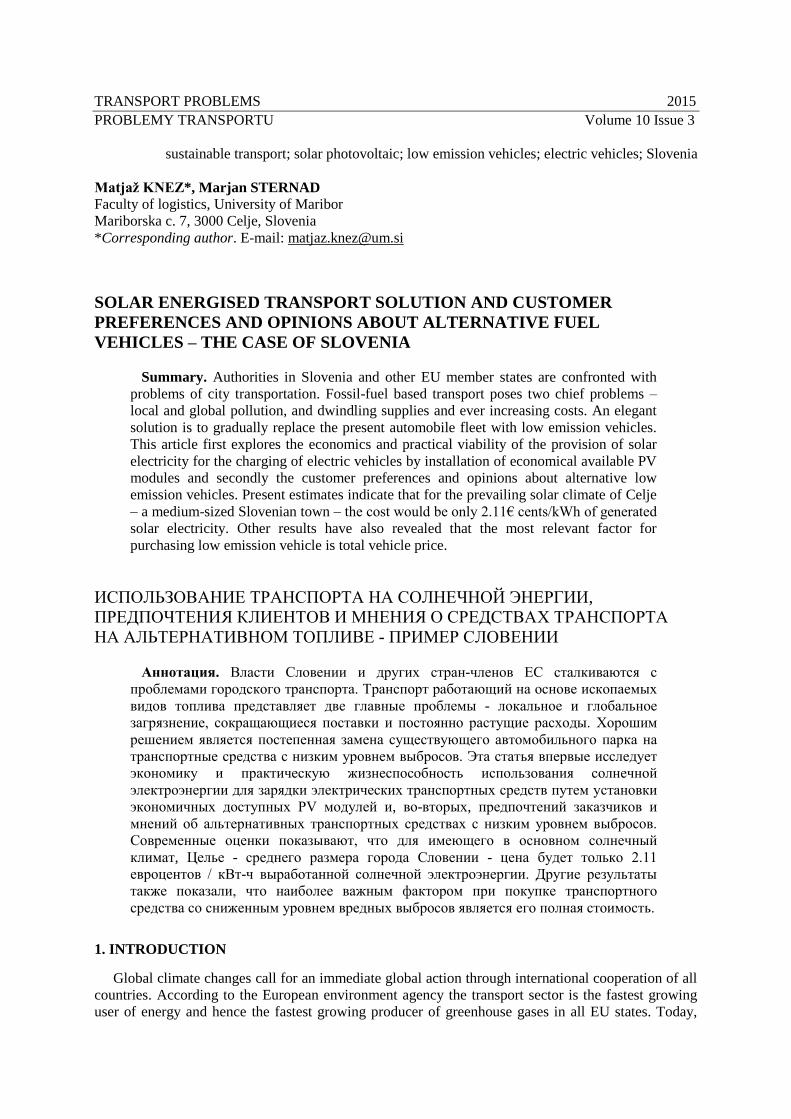
In 2010 Celje had registered 32,214 road vehicles (SURS, 2010b and SURS, 2011b). Fig. 1 shows
the very significant increase in the automobile population, primarily resulting from the membership of
Slovenia in EU.
2.1. Calculating the mileage and energy consumption of EVs in Slovenia
In the first step, we calculate the mileage of all vehicles. At the end of 2010, Slovenia had
1,061,646 registered passenger cars, or 518 vehicles per 1000 inhabitants (SURS, 2011b). The total
vehicle mileage (MGE) was thus obtained as,
MGE = N x D = 23,356,212,000 vehicle-km/year (1)
Q is the amount of gasoline consumption in liters and FC is average fuel consumption of European
cars, which is around 6.5l/100km (GCC, 2004). For the purposes of transport, Slovenia spent
651,690,000kg of gasoline in year 2008 (leaded and unleaded) (MOP, 2009). For calculation purposes
we have taken into account the petrol density of gasoline, which is 760g/m3 and thus get Q in liters,
which in our case is 857,486,842 liters of gasoline. We can also calculate the average mileage of each
car which comes out as 47km/day-vehicle.
According to the study prepared by MIT Electric Vehicle Team [14], electric vehicle (EV)
consume 200-300Wh for a mile on average. In this study a figure of 200Wh/km was used, i.e. if all of
the above cars in Slovenia were converted to EVs they would consume 3,654GWh/year. The energy
consumed by one electric car would approximately be 3.4MWh/year, or 9.3kWh/day.
2.2. CO2 emissions associated with passenger cars in Celje
CO2 emissions of new vehicles registered respectively in the years 2008, 2009 and 2010 have
shown a decreasing trend of 159, 156 and 145 g/km. For calculation purposes, we considered the
number of cars within Celje, amounting to 32,000 and the average value of CO2 emissions of cars as
153.3 g/km. This translated to a figure of 84,060 tonnes of CO2 per annum or 230 tonnes/day.
Solar energised transport solution and… 21
Fig. 1. Number of vehicles registered in Celje from 2001 to 2010
Рис. 1. Количество транспортных средств зарегистрированных в Целье с 2001 по 2010
2.3. Solar recharging
The two factors that will bring about a significant change in the present day unsustainable aspect of
transport sector are market inducements for the introduction of electric vehicles and a sustainable
supply of electricity for charging them. In this respect a brief review of the policy of the Slovenian
government is presented. Firstly, the introduction of electric vehicles is being encouraged by a subsidy
offer of €5,000.
Secondly, the relevant legislation affecting RES-E (Renewable Energy Sources) in Slovenia makes
it incumbent on the energy network operators to purchase electricity from “qualified producers” either
for fixed feed-in or premium feed-in tariffs. The network operator and the qualified producer sign a
Purchase Agreement covering the purchase of electricity from the qualified producer for a period of 10
years.
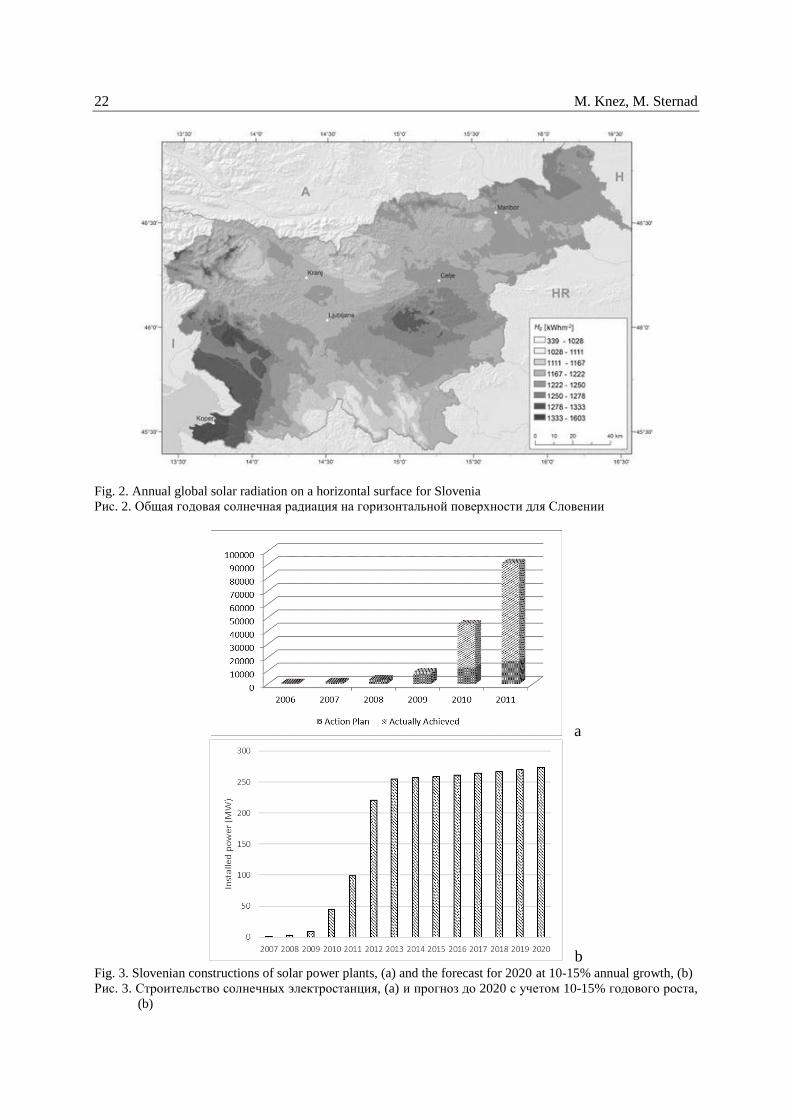
Slovenia measures only 20,256 square kilometres, but in spite of this we can divide its territory into
three climate types: sub Mediterranean, temperate-continental, and mountainous [19]. However, the
quantity of energy received due to solar radiation is influenced more by various relief positions than
by the different climate types. Average solar radiation in Slovenia is more than 1,000kWh/m2-annum.
The ten-year average of the measured (1993-2003) annual global radiation was between 1053 and
1389 kWh/m2 (Fig. 4). Half of Slovenia receives between 1153 and 1261 kWh/m2.
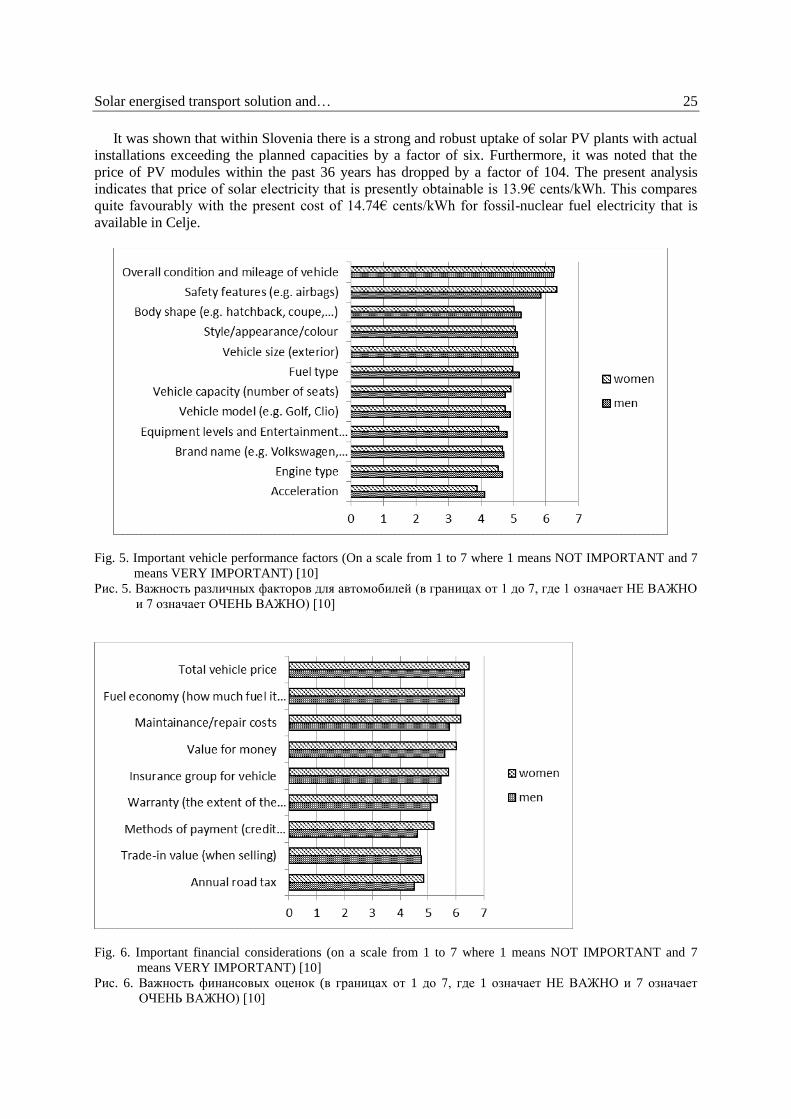
The construction of solar power plants in Slovenia has shown an extremely rapid growth. In a few
years Slovenia has installed more than 1,390 plants that were connected to the grid. Total power plants
at the end of 2011 were more than 90 MW. In 2012, Slovenia‟s electricity generation was more than
130MWh from solar energy.
The efficiency of solar modules that are available on the market ranges between 8 and 20%. In our
study, electric characteristics of monocrystalline silicon photovoltaic modules produced by Bisol
Company of Slovenia were used. An average module efficiency of 14% was used.
3. ECONOMICS OF SOLAR RECHARGING FOR EV'S IN CELJE
One of the options to reduce CO2 emissions is the integration of electric vehicles (EV) as far as
possible, but only if the EV‟s would be charged from environmentally friendly sources of energy.
Distribution of electricity in Celje is carried by Elektro Celje Company. Electricity production is
still dominated by conventional sources (63%) and 37% from renewable energy sources (Elektro
Celje, 2011). The present Carbon footprint for Slovenian electricity is 0.44-0.66 kgCO2/kWh [12].
22 M. Knez, M. Sternad
Fig. 2. Annual global solar radiation on a horizontal surface for Slovenia
Рис. 2. Общая годовая солнечная радиация на горизонтальной поверхности для Словении
a
b Fig. 3. Slovenian constructions of solar power plants, (a) and the forecast for 2020 at 10-15% annual growth, (b)
Рис. 3. Строительство солнечных электростанция, (a) и прогноз до 2020 с учетом 10-15% годового роста,
(b)

Solar energised transport solution and… 23
As alleged by a study conducted by Purgar [23], EVs can reach a market share of 10% by 2020.
The required electricity that needs to be produced from PV panels to empower the 3,200 EVs for
Celje's roads by 2020 is shown in Table 2.
Table 2
Electrical energy needed for propulsion of EVs
Energy demand, MWh
Per day Per month Per year
29.80 907 10,800
Figures 4 show the historical price drop of PV module costs and the total system cost. In Celje
there are about 9,000 residential buildings and if just one half of them could be suitable for PV
modules installations, it means that at least 3kW systems could be installed on 4,500 homes. This
could mean the sum of about 112,000 m2 of PV modules would generate 14MW peak power which
may be used for charging the battery bank for two- or four-wheel electric vehicles.
0 1 2 3 4 5 6
2006
2007
2008
2009
2010
2011
2012
Euro/kW-peak
Ye
ar
PV System Prices in Germany
(Installation and Hardware)
Fig. 4. The decreasing cost of (a) crystalline silicon photovoltaic cells [28], (b) complete PV electricity systems
Рис. 4. Снижение стоимости (a) фотоэлементов на кристаллическом кремнии [28], (b) в целом для PV
электрических систем

24 M. Knez, M. Sternad
The price of the electricity generated by a solar PV system (CPV, €/kWh) is the ratio between
annual payment to offset PV installation financing loan and the total annual amount of energy
produced (Ean). Capital costs can be decomposed in investment: panels (Ip), inverter (Ii), installation
(Il), and annual maintenance, M. Note that the replacement costs of the inverter, which has a shorter
lifetime than the panels, have to be taken into account. We thus have the basic set of equations that
lead to financing costs.
Annual payment to offset PV installation financing loan,
A= P. Fi (1+ Fi )n/[(1+ Fi )
n-1] (2)
P = Capital costs associated with erection and life-time maintenance of the PV plant and n is the
payback period, assumed to be 25 years for the present study (life of PV modules).
For a unit square metre of PV module area that has a nominal efficiency of expressed as a
fraction),
P, € = 1000 (Ip + Il + [Lp /Li].Ii+n.M) (3)
Note that Tables 3 and 4 respectively provide a further explanation for above-used symbols and the
present cost of fossil-nuclear powered electricity. The estimation of the annual-averaged energy
generated per square metre of PV module area, Ean ought to include the decline of cell efficiency with
time (d) and the energy generated per peak Watt installed capacity of the PV modules per year, i.e.
kWh/kWp-year. It may easily be shown that,
Ean = 0.5F0 +F25] G (4)
Gis the annual-averaged global irradiation (kWh/m2) in the plane of (inclined) PV modules. F0
and F25 in Eq. 3c are usually provided by module manufacturers and a typical set of values indicate a
97% performance (F0) for new modules that literally drops to a figure of 80.2% (F25) after a 25-year
use.
The cost equation thus becomes,
CPV, €/kWh = A/ Ean (5)
Using data of Table 3 and using above equations, 3a through to 3d, we thus obtain for one square
metre of PV module area: P = 364.8, A = 23.35, Ean = 168.34 and Cpv = 0.139. Note that in the above
calculations a value of solar irradiation of 1,250kWh/m2-year for Celje and an efficiency of 15.2% for
monocrystalline PV modules was used.
The above estimate of solar electricity (13.9€ cents/kWh) may be compared to the present cost of
14.74€ cents/kWh for fossil-nuclear fuel electricity that is available in Celje.
4. PREFERENCES AND OPINIONS ABOUT ALTERNATIVE FUEL VEHICLES
Our main goal of this part of the study was to identify the measures that would increase the
people‟s interest in purchasing LEVs. The results reveal new perspective of purchasers, and indicate
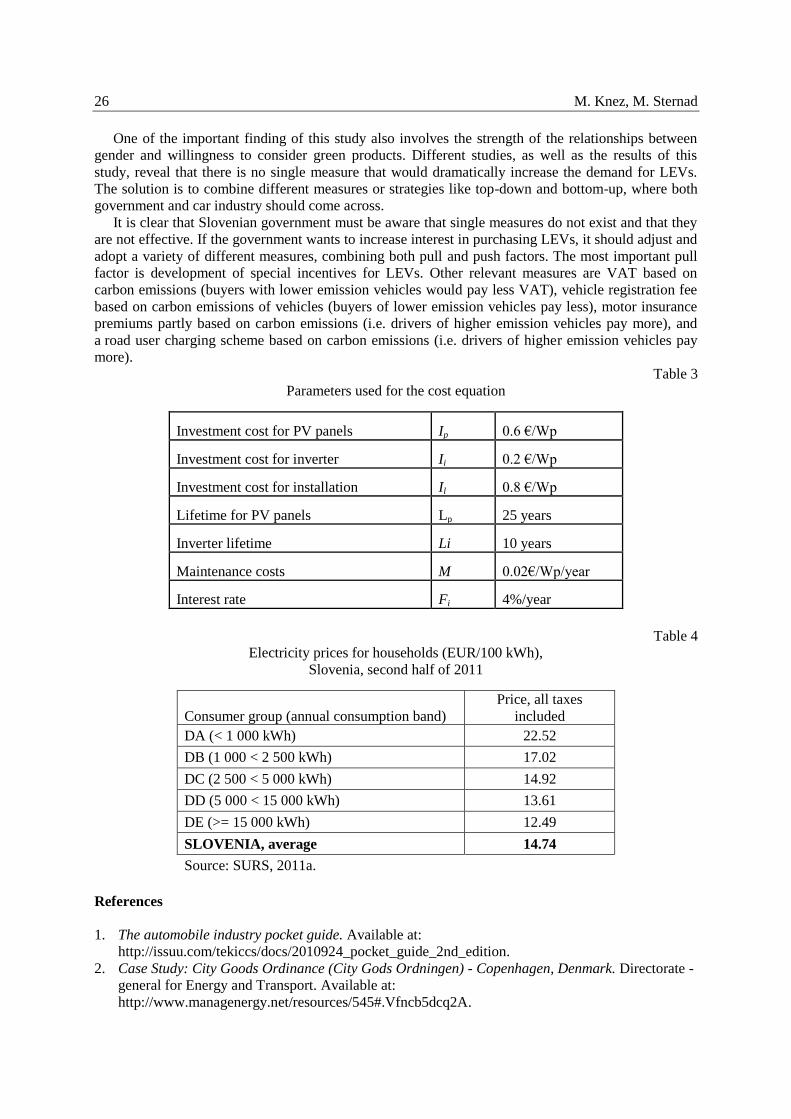
which factors are the most important for the purchase of a LEV.
Two non-financial factors are crucial when deciding on a car purchase – 1: “overall condition and
mileage of vehicle (when buying a used car)”, and – 2: “safety features”. Other very important factors
are: vehicle size (exterior), style/appearance/colour, body shape (e.g. hatchback, coupe …) and fuel
type. Divided results for men and women are presented on Figures below.
5. CONCLUSIONS
The present study encompassed the following five tasks:
• Estimate the average mileage of Slovene cars.
• Obtain the corresponding CO2 emissions of passenger cars in Celje, a medium-sized town.
• Compute the energy requirements of electric vehicles (EVs).
• Calculate the available solar energy and the required recharging economics for the proposed EVs.
• Present the factors that influence the purchase decision regarding LEV.
Solar energised transport solution and… 25
It was shown that within Slovenia there is a strong and robust uptake of solar PV plants with actual
installations exceeding the planned capacities by a factor of six. Furthermore, it was noted that the
price of PV modules within the past 36 years has dropped by a factor of 104. The present analysis
indicates that price of solar electricity that is presently obtainable is 13.9€ cents/kWh. This compares
quite favourably with the present cost of 14.74€ cents/kWh for fossil-nuclear fuel electricity that is
available in Celje.
Fig. 5. Important vehicle performance factors (On a scale from 1 to 7 where 1 means NOT IMPORTANT and 7
means VERY IMPORTANT) [10]
Рис. 5. Важность различных факторов для автомобилей (в границах от 1 до 7, где 1 означает НЕ ВАЖНО
и 7 означает ОЧЕНЬ ВАЖНО) [10]
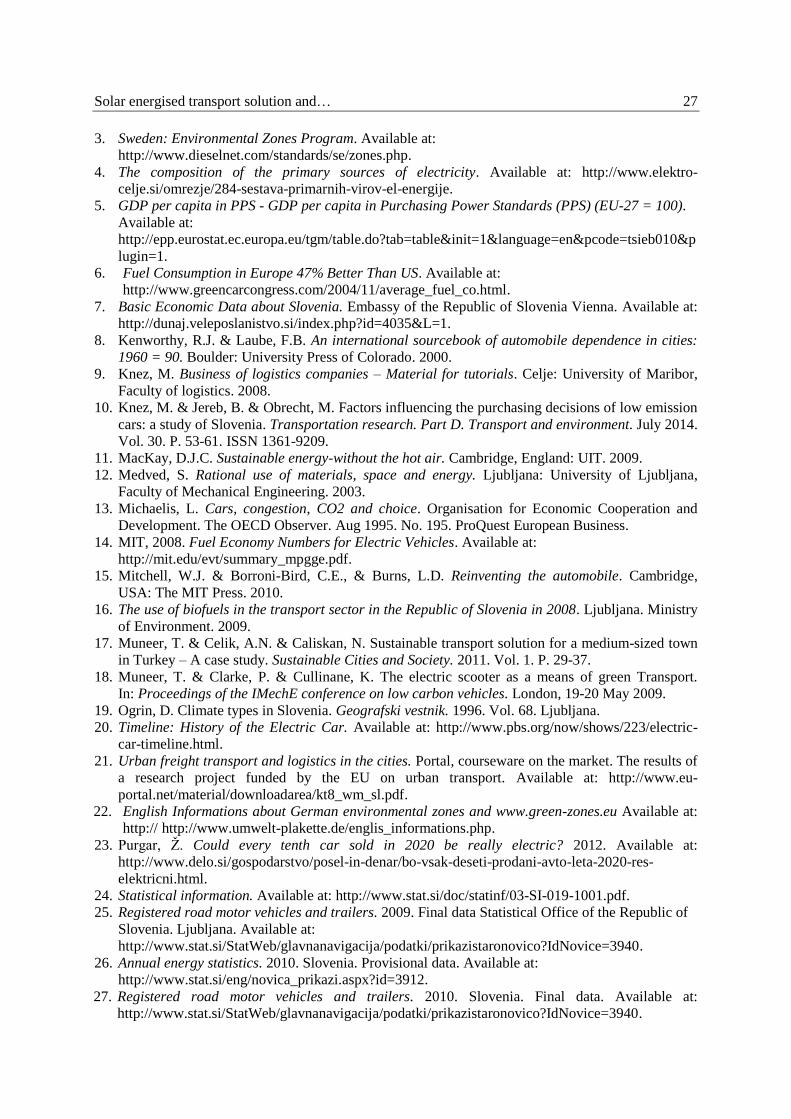
Fig. 6. Important financial considerations (on a scale from 1 to 7 where 1 means NOT IMPORTANT and 7
means VERY IMPORTANT) [10]
Рис. 6. Важность финансовых оценок (в границах от 1 до 7, где 1 означает НЕ ВАЖНО и 7 означает
ОЧЕНЬ ВАЖНО) [10]
26 M. Knez, M. Sternad
One of the important finding of this study also involves the strength of the relationships between
gender and willingness to consider green products. Different studies, as well as the results of this
study, reveal that there is no single measure that would dramatically increase the demand for LEVs.
The solution is to combine different measures or strategies like top-down and bottom-up, where both
government and car industry should come across.
It is clear that Slovenian government must be aware that single measures do not exist and that they
are not effective. If the government wants to increase interest in purchasing LEVs, it should adjust and
adopt a variety of different measures, combining both pull and push factors. The most important pull
factor is development of special incentives for LEVs. Other relevant measures are VAT based on
carbon emissions (buyers with lower emission vehicles would pay less VAT), vehicle registration fee
based on carbon emissions of vehicles (buyers of lower emission vehicles pay less), motor insurance
premiums partly based on carbon emissions (i.e. drivers of higher emission vehicles pay more), and
a road user charging scheme based on carbon emissions (i.e. drivers of higher emission vehicles pay
more).
Table 3
Parameters used for the cost equation
Investment cost for PV panels Ip 0.6 €/Wp
Investment cost for inverter Ii 0.2 €/Wp
Investment cost for installation Il 0.8 €/Wp
Lifetime for PV panels Lp 25 years
Inverter lifetime Li 10 years
Maintenance costs M 0.02€/Wp/year
Interest rate Fi 4%/year
Table 4
Electricity prices for households (EUR/100 kWh),
Slovenia, second half of 2011
Consumer group (annual consumption band)
Price, all taxes
included
DA (< 1 000 kWh) 22.52
DB (1 000 < 2 500 kWh) 17.02
DC (2 500 < 5 000 kWh) 14.92
DD (5 000 < 15 000 kWh) 13.61
DE (>= 15 000 kWh) 12.49
SLOVENIA, average 14.74
Source: SURS, 2011a.
References
1. The automobile industry pocket guide. Available at:
http://issuu.com/tekiccs/docs/2010924_pocket_guide_2nd_edition.
2. Case Study: City Goods Ordinance (City Gods Ordningen) - Copenhagen, Denmark. Directorate -
general for Energy and Transport. Available at:
http://www.managenergy.net/resources/545#.Vfncb5dcq2A.
Solar energised transport solution and… 27
3. Sweden: Environmental Zones Program. Available at:
http://www.dieselnet.com/standards/se/zones.php.
4. The composition of the primary sources of electricity. Available at: http://www.elektro-
celje.si/omrezje/284-sestava-primarnih-virov-el-energije.
5. GDP per capita in PPS - GDP per capita in Purchasing Power Standards (PPS) (EU-27 = 100).
Available at:
http://epp.eurostat.ec.europa.eu/tgm/table.do?tab=table&init=1&language=en&pcode=tsieb010&p
lugin=1.
6. Fuel Consumption in Europe 47% Better Than US. Available at:
http://www.greencarcongress.com/2004/11/average_fuel_co.html.
7. Basic Economic Data about Slovenia. Embassy of the Republic of Slovenia Vienna. Available at:
http://dunaj.veleposlanistvo.si/index.php?id=4035&L=1.
8. Kenworthy, R.J. & Laube, F.B. An international sourcebook of automobile dependence in cities:
1960 = 90. Boulder: University Press of Colorado. 2000.
9. Knez, M. Business of logistics companies – Material for tutorials. Celje: University of Maribor,
Faculty of logistics. 2008.
10. Knez, M. & Jereb, B. & Obrecht, M. Factors influencing the purchasing decisions of low emission
cars: a study of Slovenia. Transportation research. Part D. Transport and environment. July 2014.
Vol. 30. P. 53-61. ISSN 1361-9209.
11. MacKay, D.J.C. Sustainable energy-without the hot air. Cambridge, England: UIT. 2009.
12. Medved, S. Rational use of materials, space and energy. Ljubljana: University of Ljubljana,
Faculty of Mechanical Engineering. 2003.
13. Michaelis, L. Cars, congestion, CO2 and choice. Organisation for Economic Cooperation and
Development. The OECD Observer. Aug 1995. No. 195. ProQuest European Business.
14. MIT, 2008. Fuel Economy Numbers for Electric Vehicles. Available at:
http://mit.edu/evt/summary_mpgge.pdf.
15. Mitchell, W.J. & Borroni-Bird, C.E., & Burns, L.D. Reinventing the automobile. Cambridge,
USA: The MIT Press. 2010.
16. The use of biofuels in the transport sector in the Republic of Slovenia in 2008. Ljubljana. Ministry
of Environment. 2009.
17. Muneer, T. & Celik, A.N. & Caliskan, N. Sustainable transport solution for a medium-sized town
in Turkey – A case study. Sustainable Cities and Society. 2011. Vol. 1. P. 29-37.
18. Muneer, T. & Clarke, P. & Cullinane, K. The electric scooter as a means of green Transport.
In: Proceedings of the IMechE conference on low carbon vehicles. London, 19-20 May 2009.
19. Ogrin, D. Climate types in Slovenia. Geografski vestnik. 1996. Vol. 68. Ljubljana.
20. Timeline: History of the Electric Car. Available at: http://www.pbs.org/now/shows/223/electric-
car-timeline.html.
21. Urban freight transport and logistics in the cities. Portal, courseware on the market. The results of
a research project funded by the EU on urban transport. Available at: http://www.eu-
portal.net/material/downloadarea/kt8_wm_sl.pdf.
22. English Informations about German environmental zones and www.green-zones.eu Available at:
http:// http://www.umwelt-plakette.de/englis_informations.php.
23. Purgar, Ž. Could every tenth car sold in 2020 be really electric? 2012. Available at:
http://www.delo.si/gospodarstvo/posel-in-denar/bo-vsak-deseti-prodani-avto-leta-2020-res-
elektricni.html.
24. Statistical information. Available at: http://www.stat.si/doc/statinf/03-SI-019-1001.pdf.
25. Registered road motor vehicles and trailers. 2009. Final data Statistical Office of the Republic of
Slovenia. Ljubljana. Available at:
http://www.stat.si/StatWeb/glavnanavigacija/podatki/prikazistaronovico?IdNovice=3940.
26. Annual energy statistics. 2010. Slovenia. Provisional data. Available at:
http://www.stat.si/eng/novica_prikazi.aspx?id=3912.
27. Registered road motor vehicles and trailers. 2010. Slovenia. Final data. Available at:
http://www.stat.si/StatWeb/glavnanavigacija/podatki/prikazistaronovico?IdNovice=3940.

28 M. Knez, M. Sternad
28. The Economist. Pricing sunshine. Available at:
http://www.economist.com/blogs/graphicdetail/2012/12/daily-chart-19.
29. Transport for London. Low Emission Zone. Available at:
http://www.tfl.gov.uk/roadusers/lez/2021.aspx.
30. Bureau of transportation statistics. National transport statistics. 2008. Available at:
http://www.rita.dot.gov/bts/sites/rita.dot.gov.bts/files/publications/national_transportation_statistic
s/2008/index.html.
31. Waterfield, B. EU to ban cars from cities by 2050. The Telegraph. 2011. Available at:
http://www.telegraph.co.uk/motoring/news/8411336/EU-to-ban-cars-from-cities-by-2050.html.
32. WHO/World Bank. The world report on road transport injury prevention. Geneva. 2004.
Received 11.04.2014; accepted in revised form 02.09.2015