solar final presentation
TRANSCRIPT

Bates College Solar Initiative
Mac McReynolds, Matt Marcus, Jack Martell
Table of ContentsI. Contextual Framing and Project Goals
II. Power Purchase AgreementIII. Locations
A. Rooftop B. Off-Campus Site
IV. Savings Projections and Payback PeriodsV. Recommendations and Next Steps

Inspiration
- Environmental and Global Stewardship: A Goal of Bates College
- Climate Change
- Net Carbon Neutrality: Savings in Not Buying RECS

Bates College Context- Bates Current Use → ~ 12.741GWh/yr
in 2016
- Cost of Electricity → ~ $1.3 million/yr for campus loop
- Solar benefits- Clean energy- Economics- Leadership

Project Aims- Feasibility study of the
potential for a photovoltaic solar project for Bates College
- Zero net cost
- On and off campus
Power Purchase Agreement
On Campus Off Campus
Buy Back after 7 Years
Buy Back after 7 Years
No Buy Back No Buy Back
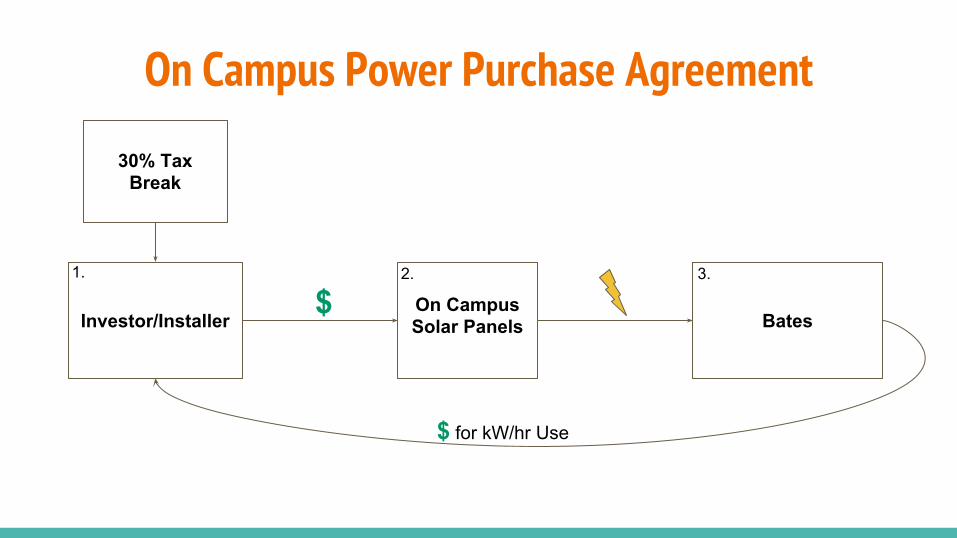
On Campus Power Purchase Agreement
BatesInvestor/InstallerOn Campus Solar Panels
$
30% Tax Break
$ for kW/hr Use
1. 2. 3.

Off Campus Power Purchase Agreement
Investor/Installer Off Campus Installation Grid
$
BatesNet Metering Credits
Net Metering Credits Equivalent
30% Tax Break
1. 2. 3.
4.
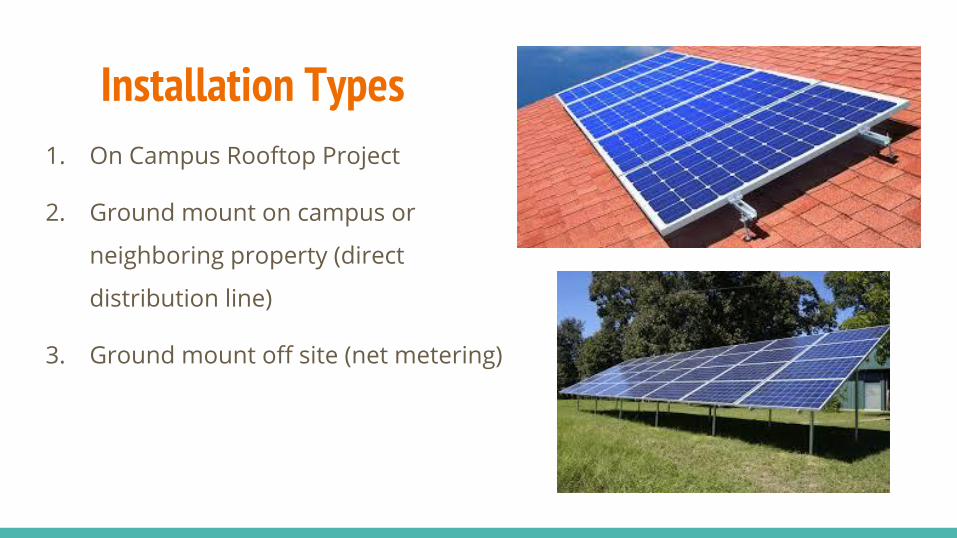
Installation Types1. On Campus Rooftop Project
2. Ground mount on campus or
neighboring property (direct
distribution line)
3. Ground mount off site (net metering)

On Campus Rooftop Criteria1. Rooftop oriented within 55
degrees east or west of true south (55 +/- 180°)
2. Adequate rooftop area
3. Lack of exterior shading
4. Electricity Demand Curve

Hourly Energy Load Curves
https://mysolarcity.com/Share/c5e1bfa0-19af-4bde-b597-2e51eac5cd4b#/monitoring/historical/day
*11/3/16
Bowdoin Hourly Solar Generation (kWh)Public vs. Residential Building
Hourly Energy Consumption (kW)

Buildings Suited for SolarMerrill Gymnasium Commons Gray Cage
Pettengill Hall 280 College Street Olin Arts Center

Monthly Variability in Production

On-Campus Capacity and Initial Costs
*Pending second assessment of Merrill Gym rooftop load capacity.
Building Orientation (degrees)
Estimated Pitch (degrees)
Estimated System Size
Estimated Annual Production
Estimated Annual CO2 Reduction (lbs/yr)
Estimated System and Installation Cost ($)*
Merrill Gym* 180 True 25 394 kW 480,564 kWh/year
363,090 922,534
Olin Arts Center 215 True 25 110 kW 134,167 kWh/year
101,370 257,400
Commons 215 True 20 65 kW 71,500 kWh/year 66,667 152,100
Gray Cage 125 and 215 True 25 225 kW 247,500 kWh/year
242,978 526,500
Pettengill Hall 125 and 215 True 25 130 kW 143,200 kWh/year
140,283 304,200
280 College St. 25 25 65 kW 68,500 kWh/year 63,774 152,100
Totals w/ Merrill Gym
n/a n/a 989 kW 1,145 MWh/year 978,162 2,314,834
Totals w/out Merrill Gym
n/a n/a 595 kW 664,867 kWh/year
615,072 1,392,300
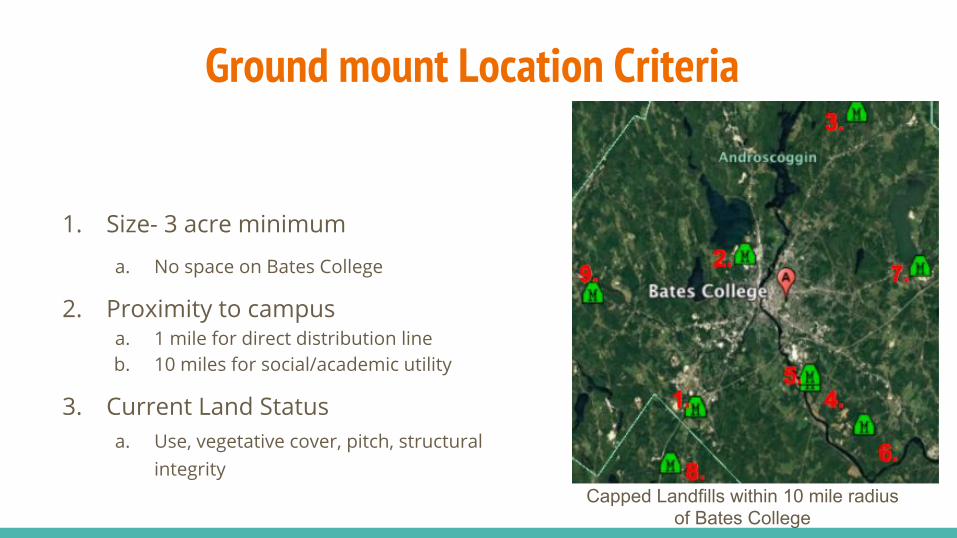
Ground mount Location Criteria
1. Size- 3 acre minimum
a. No space on Bates College
2. Proximity to campusa. 1 mile for direct distribution lineb. 10 miles for social/academic utility
3. Current Land Statusa. Use, vegetative cover, pitch, structural
integrityCapped Landfills within 10 mile radius
of Bates College
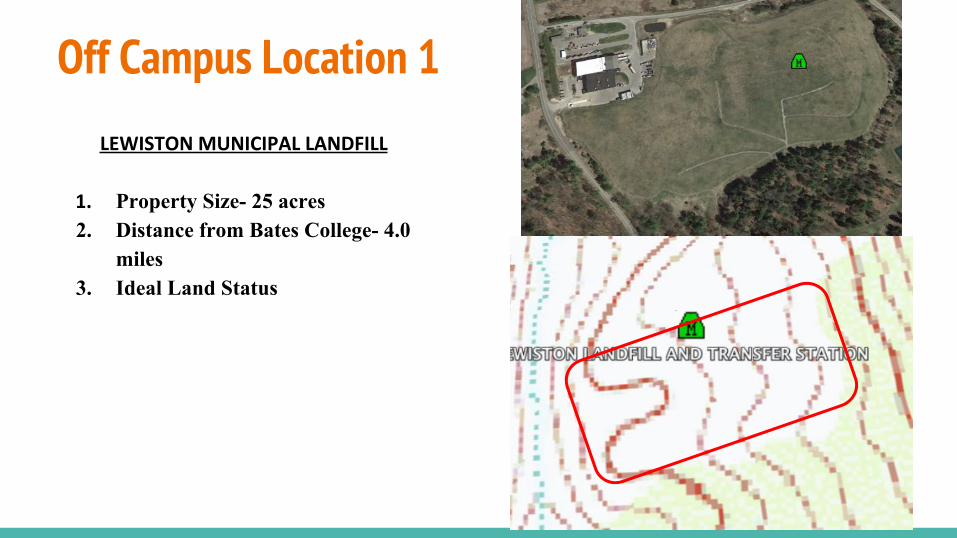
Off Campus Location 1
LEWISTON MUNICIPAL LANDFILL
1. Property Size- 25 acres2. Distance from Bates College- 4.0
miles3. Ideal Land Status
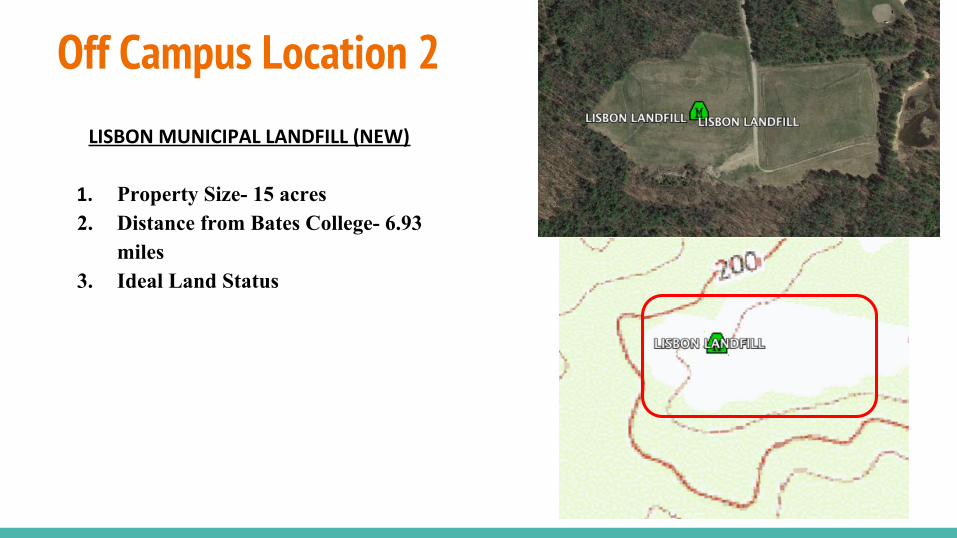
Off Campus Location 2LISBON MUNICIPAL LANDFILL (NEW)
1. Property Size- 15 acres2. Distance from Bates College- 6.93
miles3. Ideal Land Status
On vs. Off Campus Conclusions
-Prioritize on campus installation to avoid net metering instability.
-On Campus allows for adherence to zero cost goal.
-Reconsider off campus installation once net metering future is determined.

PPA Payback OptionsOption 1: Discounted Purchase After Year 6
Benefits:
- Own system outright with potential for increased savings
- No longer purchasing kWh from solar investor
Risks:
- Potentially large investment to purchase panels (typically 40-60% of original price)
- Responsible for system maintenance following purchase
- Solar production fluctuations
Option 2: PPA Extension (up to 30 years)
Benefits:
- No responsibility for system maintenance
- Fixed photovoltaic electricity rate for extent of PPA
- Decreased demand charge, fewer kWh purchased from the grid
Risks:
- Lower long-term savings
- Solar production fluctuations

Solar Savings Equation without Buyout-Guaranteed savings originate from fewer kWh purchased from grid and lower demand charge
● Total cost: (supply $/kWh)(kWhT) + ($ delivery service/kwh)(kWhT) + ($ demand/kW)(kWT)
● Total cost with solar: (supply $/kWh)(kWhT) + ($ delivery service/kwh)(kWhGrid) + ($ demand/kW)(lower kWGRID)
● Total cost - New total cost w/ solar = Savings
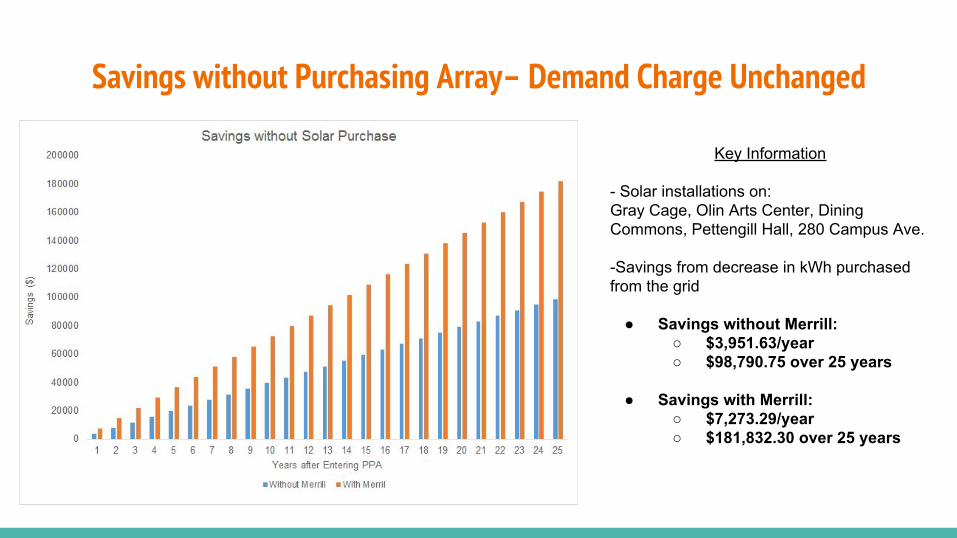
Savings without Purchasing Array– Demand Charge Unchanged
Key Information
- Solar installations on: Gray Cage, Olin Arts Center, Dining Commons, Pettengill Hall, 280 Campus Ave.
-Savings from decrease in kWh purchased from the grid
● Savings without Merrill:○ $3,951.63/year○ $98,790.75 over 25 years
● Savings with Merrill:○ $7,273.29/year○ $181,832.30 over 25 years

Savings without Purchasing Array– Demand Charge Changed
Key Information
- Solar installations on: Gray Cage, Olin Arts Center, Dining Commons, Pettengill Hall, 280 Campus Ave.
-Savings from decrease in kWh purchased from the grid
- Assumes solar array produces–on average–25% of energy potential during times of monthly peak demand
● Savings without Merrill:○ $26,665.63/year○ $666,640.80 over 25 years
● Savings with Merrill:○ $44,691.37/year○ $1,018,494 over 25 years
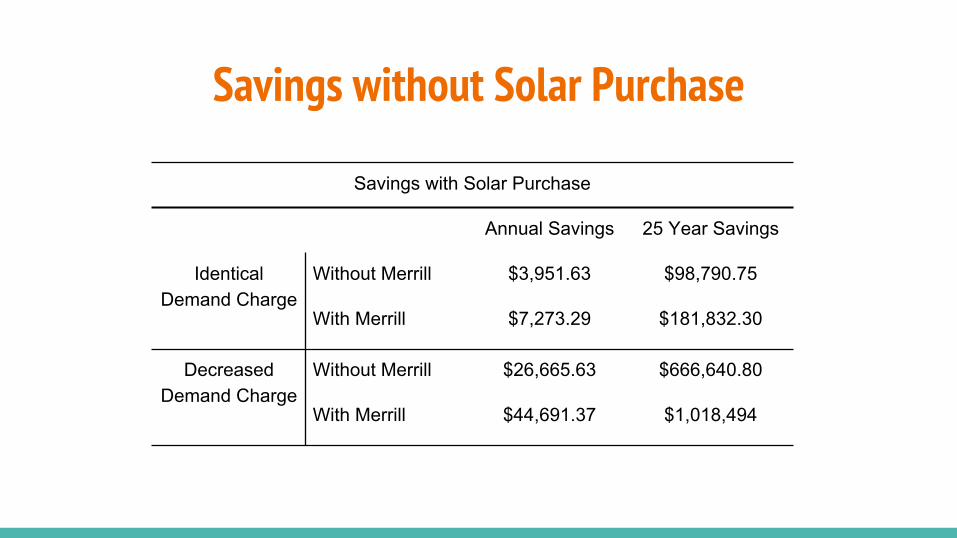
Savings without Solar Purchase
Savings with Solar Purchase
Annual Savings 25 Year Savings
Identical Demand Charge
Without Merrill $3,951.63 $98,790.75
With Merrill $7,273.29 $181,832.30
Decreased Demand Charge
Without Merrill $26,665.63 $666,640.80
With Merrill $44,691.37 $1,018,494
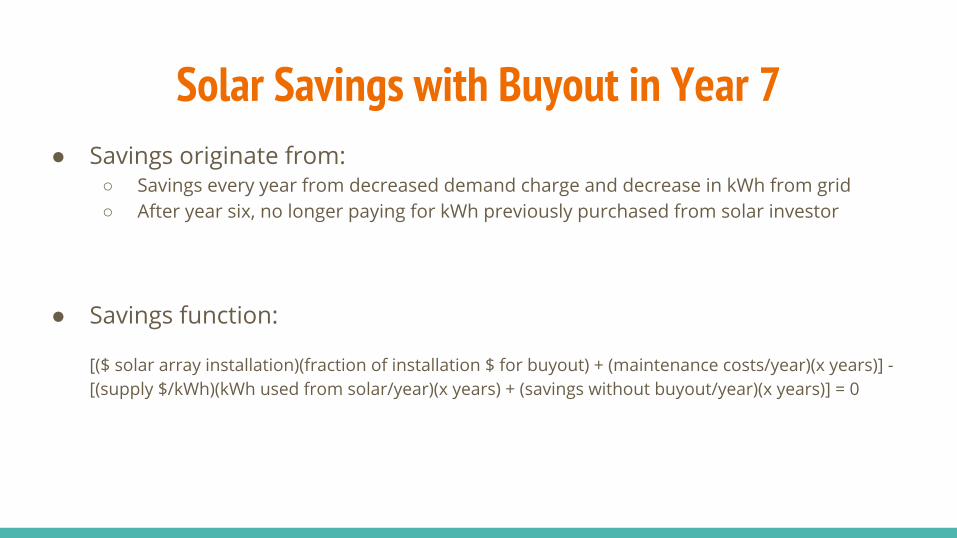
Solar Savings with Buyout in Year 7● Savings originate from:
○ Savings every year from decreased demand charge and decrease in kWh from grid○ After year six, no longer paying for kWh previously purchased from solar investor
● Savings function:
[($ solar array installation)(fraction of installation $ for buyout) + (maintenance costs/year)(x years)] - [(supply $/kWh)(kWh used from solar/year)(x years) + (savings without buyout/year)(x years)] = 0

Savings from Solar Purchase– Low Fixed CostKey Information
- Assumes solar produces 25% of energy potential during time of peak demand
- Assumes annual maintenance cost of 0.5% of installation cost
● Without Merrill:○ $556,920 fixed cost
● With Merrill:○ $925,933.60 fixed cost
● Savings without Merrill:○ $66,244.80/year○ $1,099,201 over 25 years
● Savings with Merrill:○ $109,315.50/year○ $1,766,216 over 25 years

Savings from Solar Purchase– High Fixed CostKey Information
- Assumes solar produces 25% of energy potential during time of peak demand
- Maintenance cost of 0.5% of installation cost
● Without Merrill:○ $835,380 fixed cost
● With Merrill:○ $1,388,900.40 fixed cost
● Savings without Merrill:○ $66,244.80/year○ $820,740.50 over 25 years
● Savings with Merrill:○ $109,315.50/year○ $1,343,989 over 25 years

Savings with Solar Purchase
Savings with Solar Purchase
Annual Savings 25 Year Savings
Low Fixed Cost Without Merrill $66,244.80 $1,099,201
With Merrill $109,315.50 $1,766,216
High Fixed Cost Without Merrill $66,244.80 $820,740.50
With Merrill $109,315.50 $1,343,989

Off Campus Savings: Calculations and Scenarios
● 500 kW system○ $2.15/Watt→ $1,075,000 upfront cost
■ Maintenance cost→ .5% of initial cost○ High-Expected-Low kWH production
● Purchase at Year 7 or Not○ Buyback Cost-40%-60%
● Annual Lease Cost-$20,000/MW
1. Solar Buyback after 7 Years
60% Buyback 40% Buyback
High kWh Production
Expected kWh Production
Low kWh Production
2. No Solar Buyback
High kWh Production
Expected kWh Production
Low kWh Production

Low Productivity-High Buyback Cost Scenario● Annual Generation: 617,173 kWh
● Annual Savings: $30,003
● 60% Buyback Cost: $645,000
● Buyback Period: 21.5 years
● Net Savings: $355,083.50
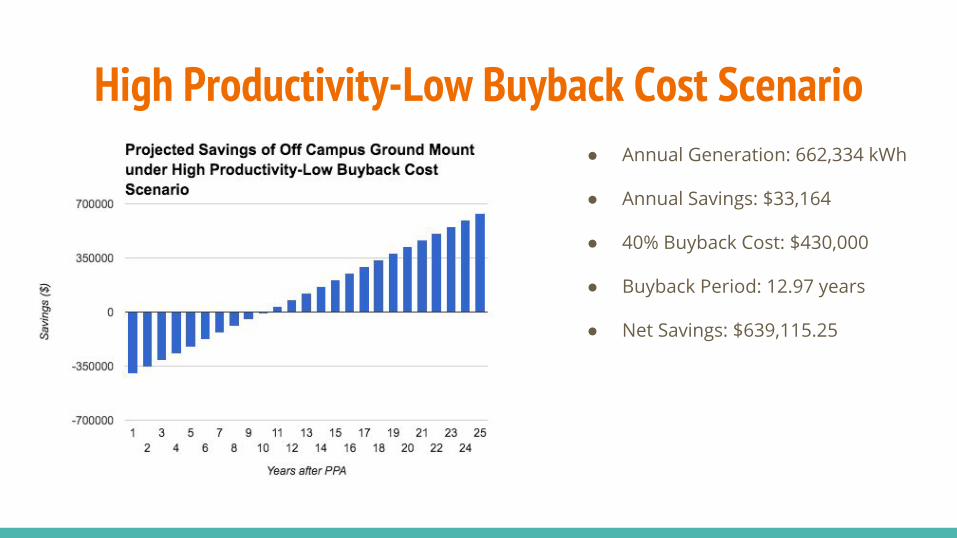
High Productivity-Low Buyback Cost Scenario● Annual Generation: 662,334 kWh
● Annual Savings: $33,164
● 40% Buyback Cost: $430,000
● Buyback Period: 12.97 years
● Net Savings: $639,115.25
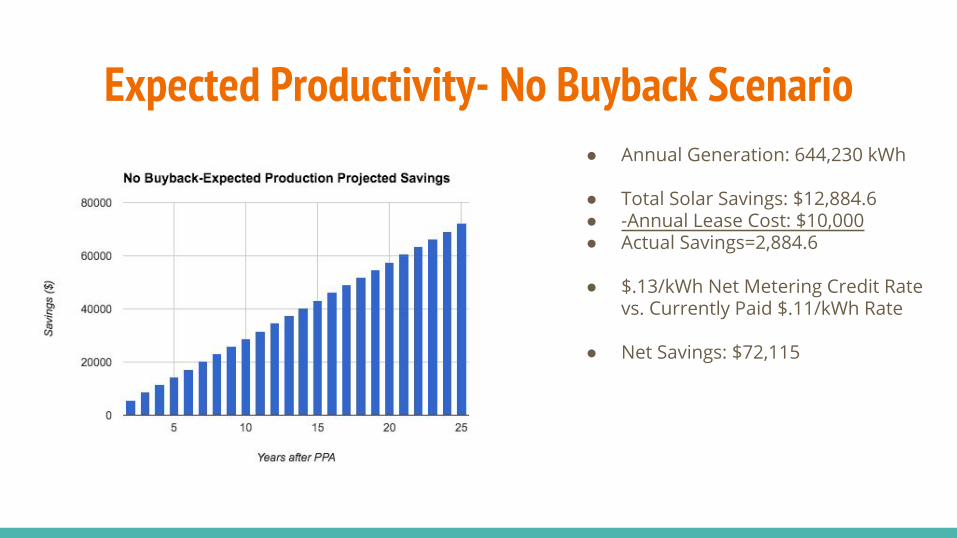
Expected Productivity- No Buyback Scenario● Annual Generation: 644,230 kWh
● Total Solar Savings: $12,884.6● -Annual Lease Cost: $10,000● Actual Savings=2,884.6
● $.13/kWh Net Metering Credit Rate vs. Currently Paid $.11/kWh Rate
● Net Savings: $72,115

System Purchase vs PPA Extension Conclusions- Extended PPA (25 Years)
- Stability on returns- No high fixed cost- No maintenance responsibility
Conclusions and Next Steps1. Extended Power Purchase Agreement2. Prioritize on-campus installation
a. Projected annual/lifetime savingsb. Net Metering
3. Future large off-campus project
Next Steps:1. Secondary Merrill assessment2. Work with Office of Advancement to
facilitate bidding process3. Legal counsel