solar rooftop in india & its financial viability
TRANSCRIPT

1 | P a g e
DECLARATION
I, K. Naveen Kumar, ROLL NO -------------, student of MBA (POWER
MANAGEMENT) at National Power Training Institute, Faridabad hereby
declare that the Training Report entitled “project tittle” is an original work and
the same has not been submitted to any other institute for the award of any degree.
A seminar presentation of the training report was made
on_______________________________ and the suggestions as approved by the
faculty were duly incorporated.
Mr K.P Singh Parmar K. Naveen Kumar
Project In charge MBA (Power Mgmt.)
NPTI NPTI Faridabad
Counter Signed
Director/Principal of the Institute

2 | P a g e
ACKNOWLEDGEMENT
Learning experience is like no other, but to learn one seeks a teacher, a guide, a
mentor and I found all of these in Mr. Rajat Malhan, (AGM-Business
Development) who was my project guide during my intern at Moser Baer Project
Pvt Ltd . His guidance and support made the learning easy and enjoyable. Thank
you for all things.
I also express gratitude toward Mr. Subodh singh, Head HR and HR team of
Moser Baer project pvt ltd. for coordinating administrative activities and other
efforts.
I thank Mrs. Manju Mam, Dy. Director-CAMPS NPTI for giving me an
opportunity to learn at Moser Baer project pvt ltd and for always being there when
I needed her.
I thank Mr. K.P Singh Parmar, (Asst. Director)-NPTI, my internal project
guide, for imparting useful knowledge and helping me refine this report. The help
and support given by you has made my understanding better and can never be
repaid.
The guidance given by entire team of Moser Baer project pvt ltd , especially
Mr.Ghei,CEO and by Mr. Sumit Pandey, General Manager–Business
Development, was instrumental and I thank them for providing the necessary
guidance and support.
I thank Mr. J.S.S Rao, Principal Director–NPTI and Mr. S.K. Chaudhry,
Principal Director–NPTI for all the administrative support provided by them to
make this internship programme successful.
K. Naveen Kumar

3 | P a g e
LIST OF FIGURES
Fig No Particular Pg.No I Off Grid Rooftop solar PV system 15
Ii Grid Interacted Rooftop solar PV system 16
Iii Sewa Bhawan rooftop system 20
Iv Regen power Australia rooftop system 23
V Shahwat Greenfuels & Technology (L) Pvt. 24
Vi BSNL, Shimla Rooftop system 25
vii Azure power, Ghandinagar Rooftop system 26
viii Bar-graph of Future installations 38
Ix Different types of solar PV 42
X Solar PV market share 43
Xi Bangalore, BIPV technology rooftop system 45

4 | P a g e
LIST OF TABLES
Table
No
Particular Pg No
1 Area required in Sq.Mts 27
2 Annual Electricity generation in KWh 28
3 Incentives provided by JNNSM 30
4 Present status of RPSSGP 30
5 EPC Cost for 100KW with subsidy 35
6 Net Metring Tariff of different states 36
7 FiT of different states 37
8 Future installations in Rooftop 39
9 Comparison on rooftop schemes of states 40
10 RPSSGP target under JNNSM Phase2 41
11 Conversion efficiencies of different solar PV
technologies
44
12 P&L sheet of subsidised solar rooftop system 46
13 Cash flows of subsidised solar rooftop system 49
14 IRR sensitivity of Cap Ex with Tariff after subsidy 50
15 IRR sensitivity of Cap Ex with interest rate after
subsidy
51
16 P&L sheet of FiT rooftop solar system 52
17 Cash flows of FiT rooftop solar system 56
18 IRR sensitivity of Cap Ex with Tariff 58
19 IRR sensitivity of Cap Ex with interest rate 58

5 | P a g e
ABBREVIATIONS
AC Alternate Current
APPC Average Pooling Purchase Cost
BAPV Building Applied Photovoltaic
BIPV Building Integrated Photovoltaic
Cap Ex Capital Expenditure
CERC Central Electricity Regulatory Commission
CUF Capacity Utilisation Factor
Cum P&L Cumulative P&L
Cum Cash Cumulative Cash
DC Direct Current
DISCOM Distribution Company
EBT Earnings Before Tax
EBTID Earnings Before Tax Interest and Depreciation
EMC Electromagnetic Compatibility
EPC Engineering Procurement Construction
FiT Feed in Tariff
GBI Generation Based Incentive
GERC Gujarat Electricity Regulatory Commission
HT High Tension
IREDA Indian Renewable Energy Development Agency
IRR Internal Rate of Return
JNNSM Jawaharlal Nehru National Solar Mission
Km Kilometre
KW Kilo Watt
KWh Kilo Watt Hour
KWp Kilo Watt Peak
m2 Metre square
MNRE Ministry of New and Renewable Energy
MW Mega Watt
MWh Mega Watt Hour
O&M Operations & Maintains
PAT Profit After Tax
PCU Power Conditioning Unit
P&L Profit & Loss
PV Photovoltaic
RAPS Remote Area Power Supply System
Rs Rupees
RTPV Rooftop Photovoltaic
RPSSGP Rooftop PV & Small Solar Generation
Programme
SAPS Stand Alone Power System
SECI Solar energy Corporation of India
SPV Solar Photovoltaic

6 | P a g e
Sq.Mts Square Metres

7 | P a g e
Table of Contents
S.No Particulars Pg No Declaration 1
Acknowledgement 2
List of Figures 3
List of Tables 4
Abbreviations 5
Table of Contents 7
Executive Summary 09
1 Organisation Details 10
2 Introduction to the Project 13
3 Introduction to Rooftop Solar 14
3.1 what is Rooftop Solar 14
3.2 Types of rooftop solar 14
3.3 Off Grid Rooftop Solar 14
3.4 Grid Interacted Rooftop solar 16
3.5 Net Metering System 17
3.6 Feed in Tariff System 17
4 Case Studies 18
4.1 Sewa Bhawan 19
4.2 Sri Nripendranath Girls High School 21
4.3 Regen Power 22
4.4 Shahwat Green Fuel & Technology Pvt 24
4.5 BSNL, Shimla 25
4.6 Azure Power 26
5 Generation 27
6 Policies & Incentives 29
6.1 Central Policies 29
6.1.1 RPSSGP 29
6.1.2 JNNSM Phase II 31
6.2 State Policies 32
6.2.1 West Bengal 32
6.2.2 Gujarat 32
6.2.3 Karnataka 32
6.2.4 Andhra Pradesh 33
6.2.5 Tamil Nadu 33
6.2.6 Chhattisgarh 33
6.2.7 Kerala 34
7 Business Models 35
7.1 Pure Play EPC Model 35
7.2 Net Metering Model 36
7.3 Feed in Tariff Model 37
8 Target 38
8.1 Current Installation 38
8 | P a g e
8.2 Future Installations 39
9 Technology 42
9.1 Conversion efficiencies 44
9.2 BIPV 44
9.3 Case studies 45
10 Financial Viability of Rooftop Solar with Subsidy
and FiT
46
10.1 Financial Viability of Rooftop Solar
with Subsidy
46
10.1.1 P&L Sheet 46
10.1.2 Cash Flows 49
10.1.3 IRR Sensitivity 50
10.2 Financial Viability of Rooftop Solar
with FiT
52
10.2.1 P&L Sheet 52
10.2.2 Cash Flows 55
10.2.3 IRR Sensitivity 58
11 Challenges 59
11.1 Availability of Rooftop 59
11.2 Financial 59
11.3 Regulatory/Policy 59
11.4 Infrastructural 59
11.5 Other Challenges 60
12 Conclusion & Recommendations 62
13 Bibliography 63

9 | P a g e
Executive Summary
Energy plays a considerable role in the Socio-Economic development of a
country. This century‘s global challenge is energy: how to increase the generation,
how to make it equitable and affordable, and also how to keep the environment
pristine without warming the planet or polluting the atmosphere. Among the
renewable, sustainable and carbon-free energy generation options, solar stands
out. One hour of sunshine on our planet, if stored adequately, can meet the global
needs for an entire year. Regrettably, however, it remains largely unviable
because of low collection efficiency and the large area required receiving
sunshine.
India is endowed with rich solar energy resource. With a geographical area of
3.287 million square km, India accounts for 657.4 million MW. However, only
12.5% of the land area amounting to 0.413 million km square can, in theory, be
used for solar energy installations. Even if 10% of this area can be used, the
available solar energy would be 8 million MW per year at least on paper.
This report highlights the details of types of solar rooftop PV systems in India,
different metering systems which are used in the country, generation capacity of
rooftop with respect to area required, different business models used in the
country, economic viability of the subsidised rooftop and FiT (Feed in Tariff),
incentives given by the state government as well as central government, current
and future size of the market size in India and technologies & technological
developments in rooftop system.
This report has briefly explained about the grid interactive and off grid solar
rooftop system along with the Net-metring and Feed in Tariff systems.
This report also contains six different case studies of rooftop systems along with
their interaction with grid and metering system in India as well as abroad.
Also this report gives the area required for the generation of electricity for
different capacity of rooftop solar PV system.

10 | P a g e
Report also explains the different types of business models which are success-
fully existing in the current market scenario along with the target market and
future market according to present situation in the country.
This report gives all the financial incentives, schemes given by the different states
and along with the central government in rooftop solar PV system.
This report also shows the different technologies used in the rooftop solar PV
system and their future developments for increasing efficiency as well as to
reduce cost of solar system.
The financial viability of the rooftop solar PV system with subsidy as well as Feed
in Tariff is been included in this report.

11 | P a g e
1.ORGANISATION DETAILS
Established in 1983 in New Delhi, Moser Baer is one of India’s leading
technology companies. Moser Baer's flagship company, Moser Baer India
Limited (MBIL) has successfully developed cutting edge technologies to
become the world’s leader in optical storage media and successful
manufacturer of Solar PV cells & modules.
Moser Baer is an Indian Multinational Company with more than 25 years of
experience in delivering high technology products and services, over 7,000
employees, revenues of over USD 500 million and asset base of over USD 1
billion. Our products are manufactured at its state-of-the-art manufacturing
facilities in the suburbs of New Delhi
Moser Baer Clean Energy (MBCEL) has rapidly progressed to become India’s
largest solar power development company with a presence in Indian and key
strategic international markets, viz., Germany and Italy. MBCEL has
commissioned solar PV projects aggregating to more than 300 MWp across
India and in International Markets. Moser Baer has the distinction of
developing and implementing India’s first 5 MW solar farm in Sivagangai in
Tamil Nadu in December 2010. The Company has also commissioned Asia’s
first 30 MW solar farm at Banaskhantha, Gujarat in October 2011.
Moser Baer is an integrated player having presence across all segments of the
solar value chain – manufacturing of panels, developing of rooftop and ground
mount projects, financing, project implementation and O&M. This cross
presence gives us a unique insight in to the technical and operational aspects of
solar PV farms.
Moser Baer Solar limited (MBSL), our solar panel manufacturing facility at
Greater Noida, has a capacity of 215 MW and is the largest cell and module

12 | P a g e
manufacturing facility in India. We have been a front runner in introducing
state-of-art solar PV cells and modules manufacturing technologies in the
country.
Strategic Rationale:
To build portfolio across multiple fuel typed and regions to serve both base load
and peaking demand.
Solar/wind – 800MW (~ 325 MW commissioned & 500MW in pipeline)
Building low cost solar and wind power plants in India and
globally with an objective of meeting peaking power demand.
Thermal 4000mw in construction and advance deployment
Close to coal source and owned merchant coal mines
Low delivered cost of energy to key load centers.
Hydel – 1000MW
Key run of river hydel assets with large storage to meet seasonal
and evening peaking requirements.
Moser Baer has manufacturing facilities for high grade solar PV modules across
various technologies. Present manufacturing capacity of 170MW crystalline cell,
150 MW of Crystalline silicon modules, 50MW of thin film modules.

13 | P a g e
2. INTRODUCTION TO THE PROJECT
The goal of the report explores the opportunity of Solar Roof Top in India. This
report analyses
1. Generation potential
2. Policies or framework by Government of India
3. Economic viability of rooftop solar
4. Current status and future market size of rooftop solar
5. Technological developments

14 | P a g e
3. INTRODUCTION TO ROOFTOP SOLAR
3.1 WHAT IS ROOFTOP SOLAR
Rooftop solar power plants are those power plants which are present on the outer
surface of a building's roof and generate electricity using natural energy produced
by the sun.
The sub-segments in the Rooftop Solar Category can be defined into Medium and
small based on the capacity:
Medium Capacity: Rooftop Solar PV projects to be connected at HT
level (below 33 kW level) of distribution network with installed capacity
of 100 kW and up to 2 MW.
Small Capacity: Rooftop Solar PV projects connected at LT level of
distribution network with installed capacity lower than 100 kW.
3.2 TYPES OF ROOFTOP SOLAR
There are two types of Rooftop solar systems globally
1. Off grid rooftop solar
2. Grid interacted rooftop solar
3.3 Off grid Rooftop solar system
In the off grid type of solar system; the system is not interacted to the grid and
continuous reliable power supply is maintained through batteries.
The Energy produced by the solar module is used to charge the Lead Acid
Battery. The Load is powered using the energy stored in the battery through
Electronic circuitry.
15 | P a g e
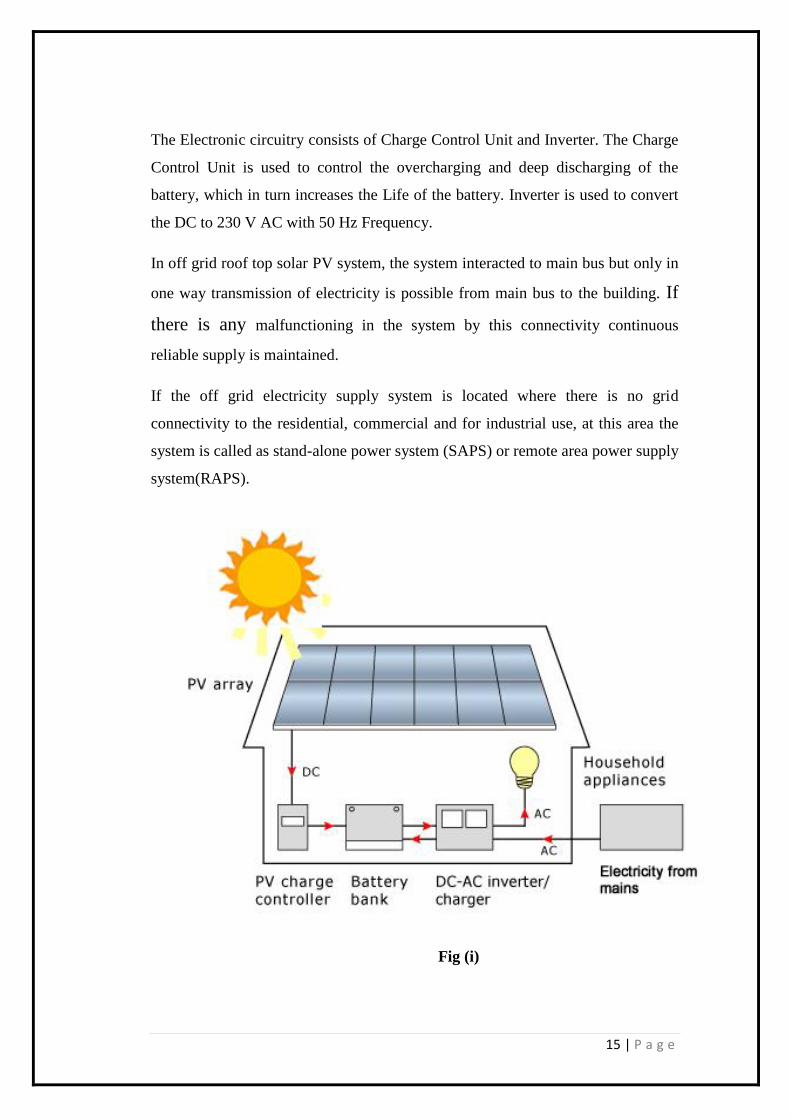
The Electronic circuitry consists of Charge Control Unit and Inverter. The Charge
Control Unit is used to control the overcharging and deep discharging of the
battery, which in turn increases the Life of the battery. Inverter is used to convert
the DC to 230 V AC with 50 Hz Frequency.
In off grid roof top solar PV system, the system interacted to main bus but only in
one way transmission of electricity is possible from main bus to the building. If
there is any malfunctioning in the system by this connectivity continuous
reliable supply is maintained.
If the off grid electricity supply system is located where there is no grid
connectivity to the residential, commercial and for industrial use, at this area the
system is called as stand-alone power system (SAPS) or remote area power supply
system(RAPS).
Fig (i)

16 | P a g e
3.4. Grid Interacted Roof top solar system
In grid connected or interacted Rooftop solar PV system, solar modules will
convert solar energy into electricity in the form of direct current (DC).
The direct current produced in the system is converted to alternating current (AC)
by an inverter or by power conditioning unit.
From this the system is interacted to grid through AC distribution board. Output is
measured by a meter which is present at the grid.
Fig (ii)
There are two types metering system in Roof Top solar Grids interacted system.
They are
1. Net metering system
2. Feed in Tariff metering
17 | P a g e
3.5. Net metering system
Net metering is the one which allows two-way flow of electricity, where
consumer is billed only for the net electricity he has consumed from the
DISCOM.
3.6. Feed in Tariff metering
Feed-in-Tariff which is minimum guaranteed price per unit of produced electricity
as approved by the regulator, to be paid to the producer. In feed in Tariff metering
system they have two uni-directional meters one records the electricity drawn
from the grid and other records the excess energy generated and fed into the grid.
The source pays retail rate for the energy they used and the power provider
purchases their excess generation at its Feed in Tariff.
For example Maharashtra Electricity Regulatory Commission (MERC) has fixed a
price of Rs. 11.66/kWh and Gujarat Electricity Regulatory Commission (GERC)
has fixed it at Rs. 12.44/kWh as FiT.

18 | P a g e
4. Case studies
In India we have a total installed capacity of 18811.11MW under Solar PV. Out of
which 1686.44MW is grid interacted solar PV system and 124.67MW is off grid
solar PV system. Under Rooftop PV &Small Solar Generation Programme
(RPSSGP) we have achieved 88.25MW rooftop solar out of 98MW signed PPAs.
Below are list of 6 different case studies of net metering and FiT of both Grid
connected and Off Grid system.

19 | P a g e
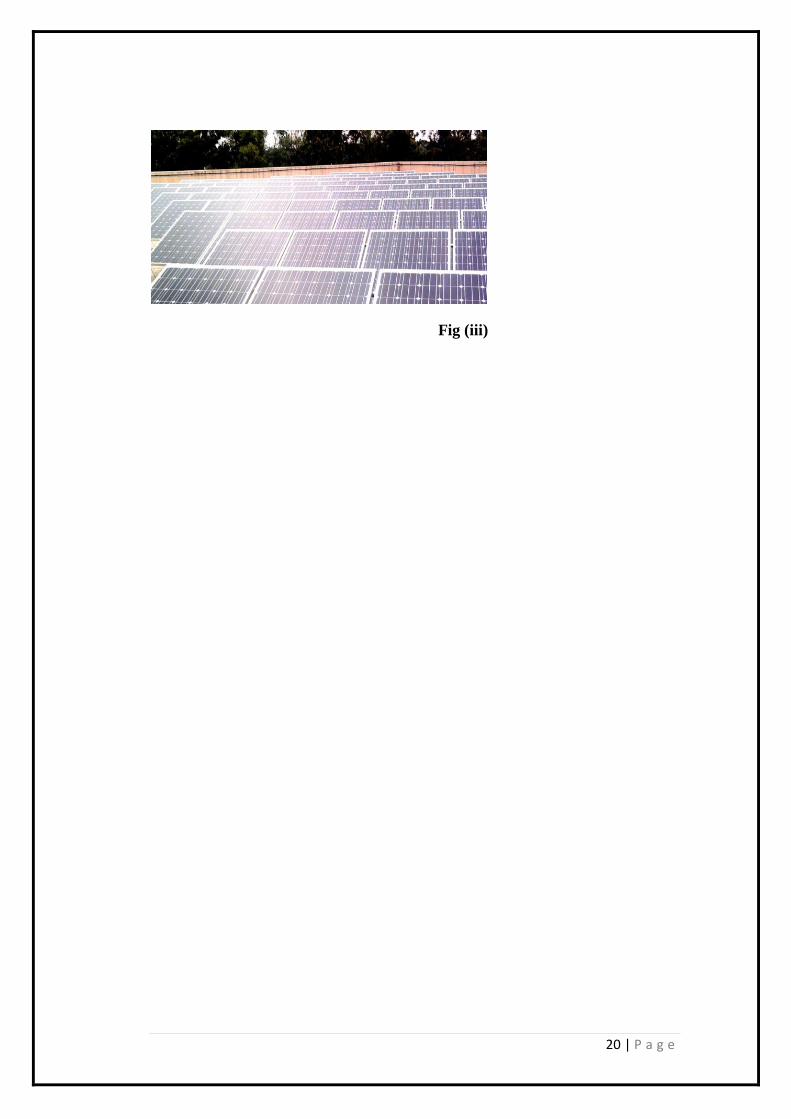
4.1. Sewa Bhawan
Location : West block Area, R.K Puram, New Delhi
Client : Central Electricity Authority (CEA)
Type : Grid-interacted rooftop solar system
Metering system : FiT
Area covered : 331.5 Sq.Mts
System size : 25KW
Modules : 150
Technology : poly crystalline
Rooftop angle : 28.32 degrees south
Inverters : 1*27KWp
Output : 440 V, 50HZ, 3ph
Annual generation : 42000KWh
CUF : 19.2%
Cost of generation per kwh : RS 10.54
Installation cost : Rs42.5 lakhs
Levelised tariff per kWh : Rs18.45
EPC Cost per KW : 1.7 lakhs
20 | P a g e
Fig (iii)

21 | P a g e
4.2. Sri Nripendranath Girls High School
Client : Sri Nripendranath Girls High School
Location : Kudghat, kolkatta
Type : Grid interacted system
Metering system : Net metering system
Used for : lights, fans, computers
Project cost : Rs8 lakhs
Rooms : 26
System size : 12KW
Expected Generation : 19970KWh

22 | P a g e
4.3. Regen Power (Australia)
Location : New South Wales, Australia
Client : Smithfield
Type : Grid interacted system
Metering system : Net metering
EPC : Regen Power
Module : 400*250watts
Inverters : 6*SMA Tri power
CUF : 18%
System size : 100KW
Technology : polycrystalline
Rooftop angle : 30 degrees north
Annual electricity generation : 157000KWh
Carbon dioxide savings : 122 Metric Tons
Units Generated Annually (in Kwh) = System Size in Kw * CUF * 365 * 24
157000=100*CUF*365*24
CUF (Capacity Utilisation Factor) = 18%

23 | P a g e
Fig(iv)

24 | P a g e
4.4. Shashwat Green Fuels & Technologies (I) Pvt.
Location : Kapadvanj, Gujarat
EPC : Shashwat Green Fuels & Technologies (I)
Pvt.
Type : Off grid system
Batteries : 21series*2parllel
Rooftop angle : 33 degrees toward south
No of modules : 84*240W
System size : 20kWp
Annual Generation : 30,000 units
CUF : 19%
Inverters : one
Output : 3ph 415V 50Hz
Fig(v)

25 | P a g e
4.5. BSNL
Location : Shmila, Himachal pradesh
Client : Bharat Sanchar Nigam Ltd.
EPC : Gensol Consultants Pvt Ltd.
Type : Off-Grid system
Solar Potential : 5.05 kWh/ m2/ day
System size : 10KW
CUF : 19%
Annual Generation : 16,600 units
Rooftop angle : 30 degrees toward south
Total project cost : Rs21.5 lakhs
Fig(vi)

26 | P a g e
4.6. Azure Power
Location : Ghandinagar, Gujarat
Client : Households (Rooftop Owners)
EPC : Azure Power
Type : Grid Connected system
Solar Potential : 6.0 kWh/ m2/ day
System size : 2.5MW
CUF : 19%
Annual Generation : 4.61MU
FiT : Rs11.21/Kwh
Rent to Rooftop area : Rs3/KWh
Fig(vii)

27 | P a g e
5. Generation
The proposed Solar Photovoltaic Power plant operates on the principle of the
photoelectric phenomenon - direct conversion of light to electricity. The solar
radiation incident upon a silicon-based semiconductor photovoltaic cell produces
direct electric current. Photovoltaic cells are integrated into modules with a
voltage of 6 - 12 V; the electrically interconnected modules form solar systems
with an output voltage of 230 V. The 100 KWp Grid Feeding Power Plant is
designed to export 167 MWh/year, 415 V, 3-phase power to the local load,
considering efficiency of the solar module as 16%, Inverter/ Power Conditioning
Unit (PCU) as 94% and losses as 3% in the DC and AC system. The Plant would
operate at an annual capacity utilization factor of 19%.
The amount of energy generated by a Rooftop solar is mainly depending on
capacity utilisation factor and capacity of the system. The annual generation of a
rooftop system is calculated by
Units Generated Annually (in Kwh) = System Size in Kw * CUF * 365 * 24
Table1: Area required in sq.mts
PV Module Efficiency
(%)
PV Capacity Rating(Kilo Watts)
10 50 100 200 300 500 1000
4 278.
7
1393.
5
2787 5574 8361 1393
5
2787
0
8 139.
4
697 1394 2788 4182 6970 1394
0
12 92.9 464.5 929 1858 2787 4645 9290
16 74.3
2
371.6 743.
2
1486.
4
2229.
6
3716 7432
For example, a 12% efficient solar module of capacity 100000watts or 100KW
will require a area of 929 Sq.Mts.

28 | P a g e
Table2: Annual Electricity generation in KWh
For example, 100KW capacity solar module will produce 166440KWh of
electricity per annum at 19% CUF (Capacity Utilisation Factor).
Units Generated Annually (in Kwh) = System Size in Kw * CUF * 365 * 24
Units Generated=100*0.19*365*24=166440KWh
Pv rating
capacity in KW CUF
16 17 18 19 20
10 14016 14892 15768 16644 17520
50 70080 74460 78840 83220 87600
100 140160 148920 157680 166440 175200
200 280320 297840 315360 332880 350400
300 420480 446760 473040 499320 525600
500 700800 744600 788400 832200 876000
1000 1401600 1489200 1576800 1664400 1752000

29 | P a g e
6. Policies and Incentives
6.1. Central Policies
6.1.1. Rooftop PV & Small Solar Power Generation
Programme (RPSSGP)
Programme : Jawaharlal Nehru National Solar Mission, Phase 1
Voltage level : below 33KV
Determination of tariff : Respective SERC
Incentive : Generation Based Incentive or Accelerated
Depreciation
GBI paid by : Distribution utility for 25 years
Capacity : 100MW
HT capacity : 90MW (0.1 to 2MW)
LT capacity : 10MW (<100KW)
Administrator : IREDA
IREDA has selected 12 states namely Rajasthan, Madhya Pradesh, Andhra
Pradesh, Tamil Nadu, Maharashtra, Odisha, Uttar Pradesh, Punjab, Haryana,
Uttarakhand, Chhattisgarh and Jharkhand for 78 Rooftop projects to install of
98MW.
Financial incentives for Off-grid projects:
There is subsidy of 30% on capital expenditure in Off-grid projects of grid
connected areas till capacity of 100KW.
Where grid connection is not available it is applicable till 250KW.
Low interest rate loans were also provided to projects at 5% interest on 50%
capital expenditure for 5 years is available for off grid projects.

30 | P a g e
For non-commercial entity both of the incentives are applicable.
For commercial entities any one of the financial incentive either capital subsidy or
soft loan is applicable.
Table 3: Financial Incentives
S.No Particulars Capacity Subsidy
1 Individuals
A All applications except 1B 1KWp Capital
subsidy &
Soft loan B Pumps for irrigation & community drinking water 5KWp
2 Non Commercial Entities
A All applications except 2B 100KWp Capital
subsidy &
Soft loan B Mini grid for rural electrification 250KWp
3 Industrial/commercial entities
A All applications except 3B 100KWp Capital
subsidy or
soft loan B Mini grid for rural electrification 250KWp
Table 4: Present status for Rooftop PV& Small Solar Generation
Programme:
Present status of the Rooftop PV & Small Solar Generation Programme under
JNNSM Phase 1
STATE PP
A
Sig
ned
M
W
Commissi
oned MW
Bala
nce
MW
Industrial
Tariff(Rs/
Kwh)
Andhra
Pradesh
10.5 9.5 1.0 8.00
Chhattisg
arh
4.0 4.0 0 5.00

31 | P a g e
Haryana 8.8 7.8 1.0 5.70
Maharas
htra
5.0 5.0 0 8.50
Odisha 8.0 7.0 1.0 6.00
Punjab 8.5 6.0 2.5 6.91
Rajastha
n
12 10.0 2.0 7.00
Tamil
Nadu
7.0 5.0 2.0 7.00
Uttarakha
nd
5.0 5.0 0 5.00
Uttar
Pradesh
8.0 7.0 1.0 7.50
Jharkhan
d
16.0 16.0 0 4.50
Madhya
Pradesh
5.25 5.25 0 6.00
Total 98.0
5
87.80 10.25
6.1.2. JNNSM, Phase II:
Initiatives for Off-grid projects
Capacity : 25-100KW
Capital subsidy : 30% on capital expenditure
Bench mark cost : Rs81/W with battery backup and Rs57/W
for without battery
Debt: Equity ratio : 80:20
Low interest :5% for 5 years on 50% of capital
expenditure
Target Capacity : 200MW
Time period : 2013-1015

32 | P a g e
6.2 STATE POLICIES
6.2.1. West Bengal:
The state has initiated a net metering solar rooftop model promoting self-
consumption. The grid-integrated rooftop PV is allowed only for institutional
consumers like government departments, academic institutions, etc. The system
size limited to 2-100 kW. Connectivity is allowed at Low Voltage or Medium
Voltage, or 6 KV or 11 KV. Solar injection is permitted only up to 90% of the
annual electricity consumption, and the net energy supplied by the utility would
be billed as per existing slab tariffs. West Bengal Renewable Energy Policy,
buildings with a certain minimum load will have to 20 meet some electricity
needs through RTPV. The policy targets 16MWof rooftop and small PV
installations by 2017. These rooftop projects are getting 30% capital subsidy from
MNRE.
6.2.2. Gujarat:
The state has initiated a 5 MW rooftop PV programme based on a FiT /sale to
utility model. 4MWs of this would come up on government buildings, while 1
MW would be installed on private homes. Two projects each have been selected
through the process of reverse competitive bidding. The local utility, Torrent
Power, will purchase the entire solar power at the discovered price. Torrent
Power, a private utility, will buy power from Azure at 11.21 rupees per kilowatt-
hour for 25 years. Azure, in turn, will pass on 3 rupees per kilowatt-hour to
rooftop owners'. Thus, the effective price of solar without the rooftop rent is only
Rs8.21/kWh.
6.2.3. Karnataka:
The new Karnataka Renewable Energy Policy 2009-14, promotes rooftop PV with
net-metering. The system size range is 5-100 kWp, and interconnection at 415 V,
3phase or 11 kV. Maximum energy injection is allowed only up to 70% of the

33 | P a g e
customer’s energy usage from the DISCOM. The policy encourages rooftop PV
with a net-metering facility to feed surplus power to the grid. The policy is
targeted for 25000 Solar Roof Tops of 5 to 10 kWp with Net-Metering during the
next 5 years with net metering tariff value of Rs3.40/- with 30% capital subsidy
from MNRE.
6.2.4. Andhra Pradesh:
The state has initiated a net metering solar rooftop model for promoting self-
consumption. The state government is providing 50% capital subsidy on capital
expenditure (with combing 30% central subsidy). The system size is limited to
1KW. Special Purpose Vehicle Generators will pay cost of the excess power from
the rooftop at a fixed tariff of Rs3.50/-.
6.2.5. Tamil Nadu:
The state has recently released solar policy 2012, a target of 350 MWs of RTPV
to be installed in three years from 2013-15 has been approved. 50 MW of RTPV
would be supported through a generation based incentive (GBI) of Rs2/kWh for
the first two years, Re.1/kWh for the next two and Rs0.5/kWh for the subsequent
two years will be provided for all. State government is providing Rs20, 000/kw as
subsidy along with 30% capital subsidy from MNRE.
6.2.6. Chhattisgarh:
The state has initiated the Off-grid rooftop PV system with a target of 15MW on
private and public buildings. The tariff period for these systems is 25 years. These
projects are going to get 30% capital subsidy from MNRE. This has to be
achieved by 2017.

34 | P a g e
6.2.7. Kerala:
The state has initiated the 10000 rooftops with each capacity of 1KW. The state
has providing a subsidy of Rs39, 000/- per KW along with 30% capital subsidy
from MNRE for these projects. The state has a target of 10MW under this
programme. This policy is mainly applicable for Households and Cottage
industries.

35 | P a g e
7. Business Models
As we can see currently there are three types of business models that exists
1. Pure play EPC Model
2. Developer builds Rooftop solar with Net Metering
3. Feed in Tariff
This section explains above business models and its economics
7.1. Pure play EPC Model
This is basic model, where in an EPC player develops solar Rooftop. The key
players in the market are
1. L&T
2. Tata Solar
3. Moser Baer
4. Lanco
EPC Cost for 100KW
This table shows the cost involved while developing a rooftop solar PV system.
The capital subsidies taken by the owner or EPC depending on the contract or
negotiation.
Table5: EPC Cost for 100KW with subsidy
Particulars Cost in Lakhs Cost after subsidy in
Lakhs
Photovoltaic Module 36 25.2
Inverters 8 5.6
Module Mounting Cost 5.2 3.4
Building and Civil works 5.2 3.4
Isolation Transformer 4.6 3.0
Wires and Electricals 1 0.7
Engineering and Procurement
Management
1 0.7
Contingency 6 4
Total 67 46

36 | P a g e
7.2. Net Metering Tariffs:
This is a system where the developer develops the rooftop solar system and takes
net metering benefit.
We have already given the EPC cost with subsidies. Below are the Net Metering
Tariff in various states.
Table 6: Net metering tariff values of different states
State Consumer Tariff in
Rs/KWh
Industrial Tariff in
Rs/Kwh
Andhra Pradesh 4.15 8.00
Arunachal Pradesh 3.8 4.00
Assam 4.66 4.50
Bihar 3.85 7.00
Chhattisgarh 2.95 5.00
Delhi 4.92 8.50
Goa 2.00 4.00
Gujarat 4.75 5.00
Haryana 4.00 5.70
Himachal Pradesh 2.4 5.50
Jammu & Kashmir 2.60 3.60
Jharkhand 2.50 4.40
Karnataka 4.30 5.50
Kerala 4.00 4.60
Madhya Pradesh 6.60 6.30
Maharashtra 5.00 8.50
Manipur 3.40 4.00
Mizoram 3.70 3.20
Meghalaya 3.00 4.10
Nagaland 4.20 4.50
Odisha 3.60 6.00
Punjab 5.20 6.91
Rajasthan 4.80 7.00
Sikkim 2.60 4.50
Tamil Nadu 3.70 7.00
Tripura 3.70
Uttar Pradesh 4.40 7.50
Uttarakhand 2.80 4.70
West Bengal 5.70 7.32
37 | P a g e
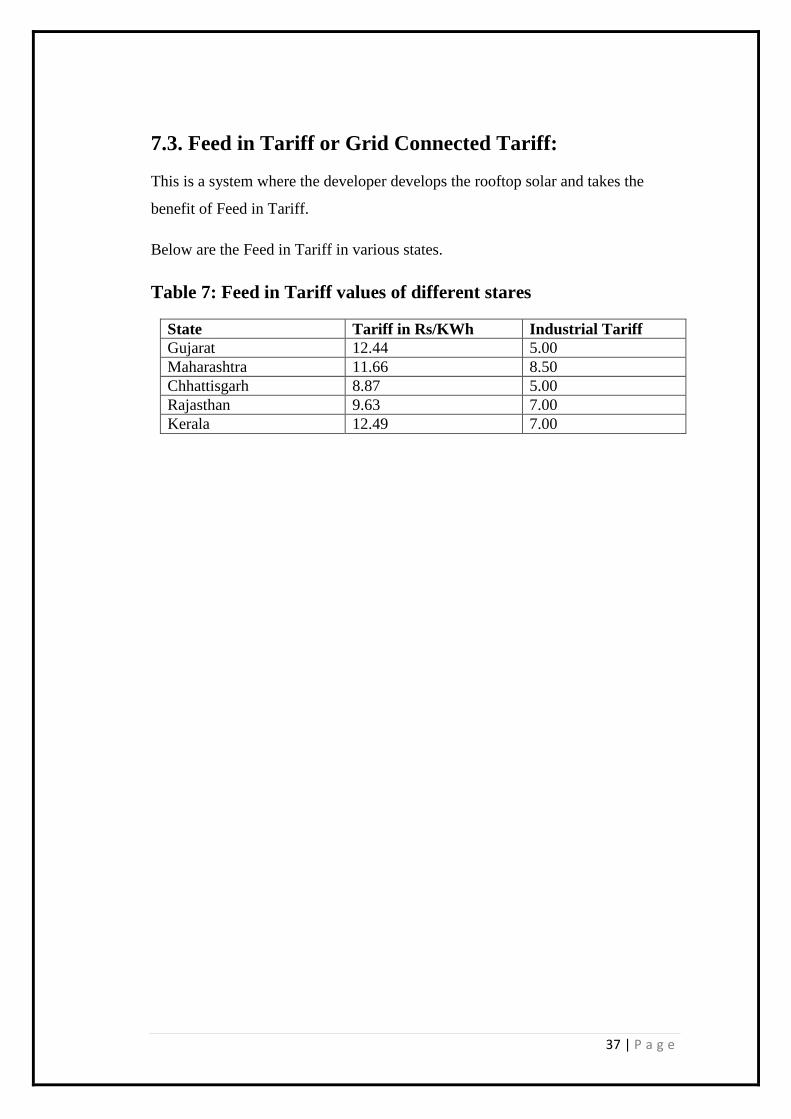
7.3. Feed in Tariff or Grid Connected Tariff:
This is a system where the developer develops the rooftop solar and takes the
benefit of Feed in Tariff.
Below are the Feed in Tariff in various states.
Table 7: Feed in Tariff values of different stares
State Tariff in Rs/KWh Industrial Tariff
Gujarat 12.44 5.00
Maharashtra 11.66 8.50
Chhattisgarh 8.87 5.00
Rajasthan 9.63 7.00
Kerala 12.49 7.00

38 | P a g e
8. Target Market
8.1. Current installations:
At present we have total installed capacity of 88MW in solar Rooftop system.
This table and graph gives the year wise target installations in Rooftop solar
systems.
Year
Target Capacity in
MW
2010-2012 100
2012-2013 200
2013-2014 350
2014-2015 525
2015-2016 750
2016-2017 1000
Fig (viii)
X-axis in MW
Y-axis years
0
200
400
600
800
1000
1200

39 | P a g e
8.2. Future Installations for Roof Top Solar
This table shows the policies of central and state, their excepted capacity addition
and timeline along with subsidies provided by their governments.
Table 8: Future Installations in Rooftop
S.No Policies Expected
Capacity
addition in
MW
Timeline Subsidies
1 SECI 16.6 2017 30% capital subsidy from
MNRE
2 JNNSM phase
2
200
1000
2015
2017
30% capital subsidy from
MNRE
3 Gujarat 30 2017 Feed in Tariff of Rs12.44/KWh
4 Karnataka 25,000
Rooftops
2017 30% capital subsidy from
MNRE
5 Kerala 85,000
Rooftops
2017 30% capital subsidy from
MNRE.
Rs39000/system from state
government
6 Tamil Nadu 350 2015 30% capital subsidy from
MNRE.
Rs20, 000/KW from state
government.
GBI of Rs2/KWh for first 2
years
Rs1/KWh for next 2 tears
Rs0.50/KWh for next 2 years
7 Chhattisgarh 15 2017 30% capital subsidy from
MNRE
8 West Bengal 16 2017 30% capital subsidy from
MNRE
9 Andhra Pradesh 30% capital subsidy from
MNRE.
20% capital subsidy from state.
government
Rs3.50/KWh as Net Metering
Tariff.
10 Maharashtra Feed in Tariff of Rs11.66/KWh
11 Rajasthan Feed in Tariff of Rs9.63/KWh
40 | P a g e
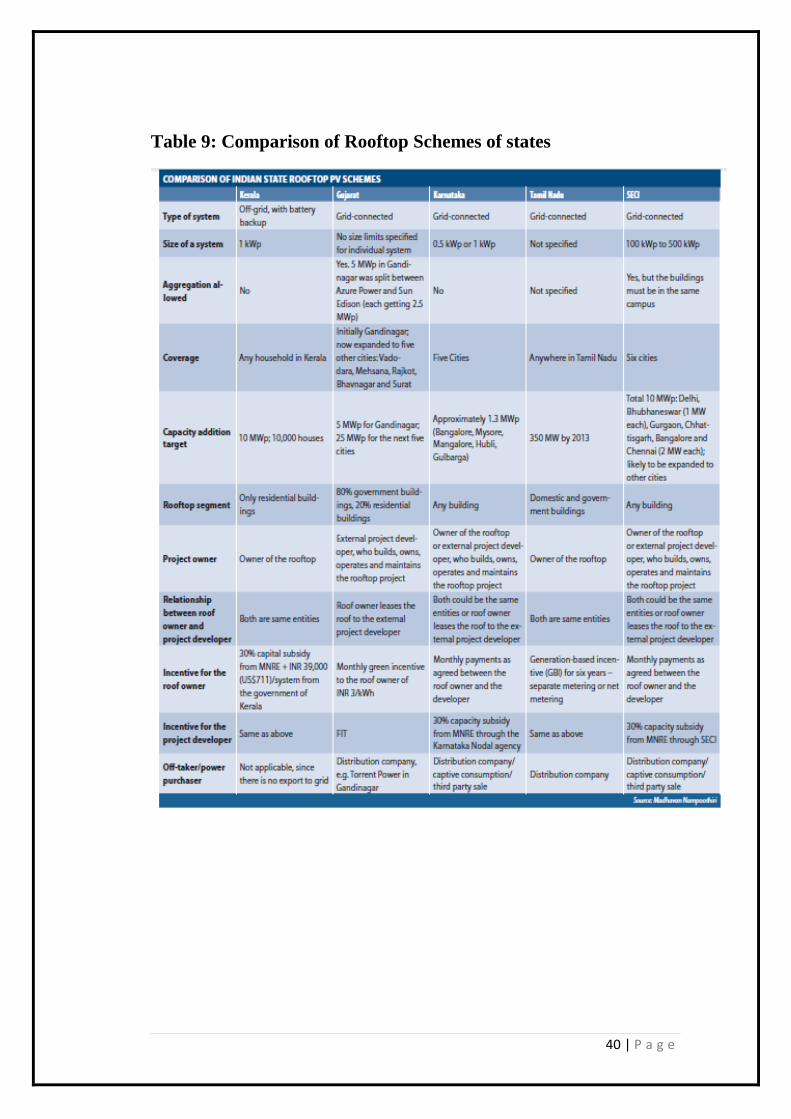
Table 9: Comparison of Rooftop Schemes of states
41 | P a g e
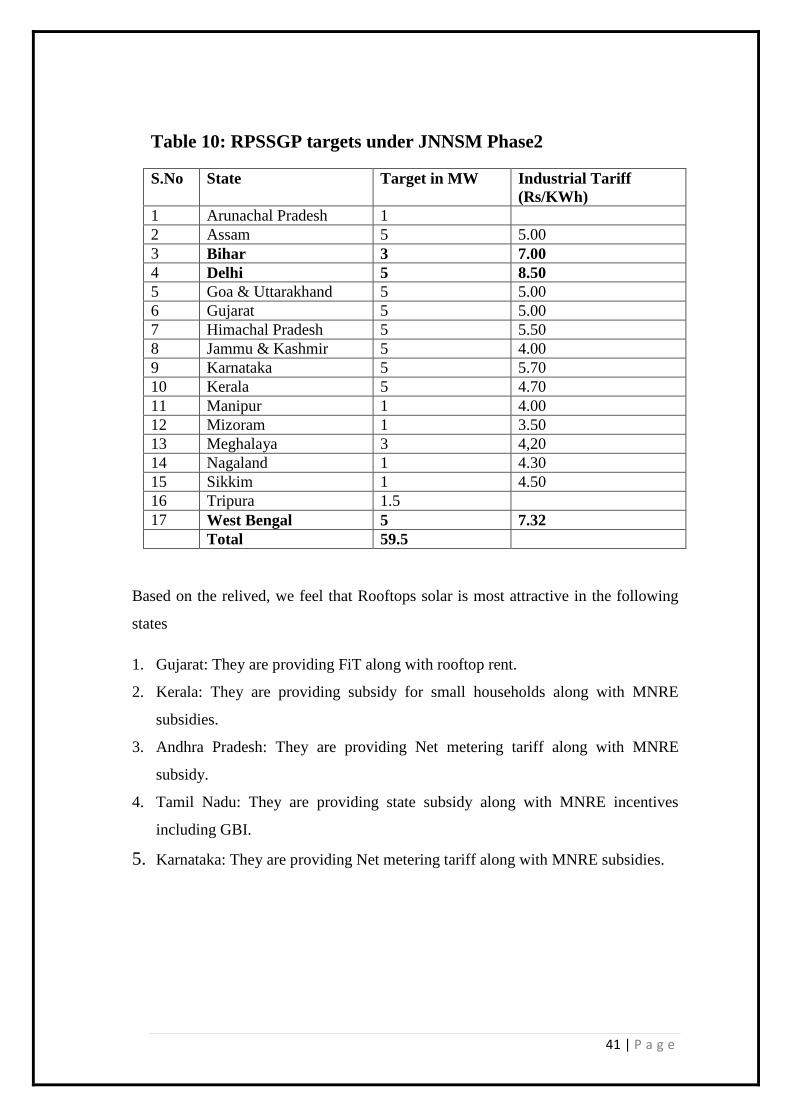
Table 10: RPSSGP targets under JNNSM Phase2
S.No State Target in MW Industrial Tariff
(Rs/KWh)
1 Arunachal Pradesh 1
2 Assam 5 5.00
3 Bihar 3 7.00
4 Delhi 5 8.50
5 Goa & Uttarakhand 5 5.00
6 Gujarat 5 5.00
7 Himachal Pradesh 5 5.50
8 Jammu & Kashmir 5 4.00
9 Karnataka 5 5.70
10 Kerala 5 4.70
11 Manipur 1 4.00
12 Mizoram 1 3.50
13 Meghalaya 3 4,20
14 Nagaland 1 4.30
15 Sikkim 1 4.50
16 Tripura 1.5
17 West Bengal 5 7.32
Total 59.5
Based on the relived, we feel that Rooftops solar is most attractive in the following
states
1. Gujarat: They are providing FiT along with rooftop rent.
2. Kerala: They are providing subsidy for small households along with MNRE
subsidies.
3. Andhra Pradesh: They are providing Net metering tariff along with MNRE
subsidy.
4. Tamil Nadu: They are providing state subsidy along with MNRE incentives
including GBI.
5. Karnataka: They are providing Net metering tariff along with MNRE subsidies.
42 | P a g e
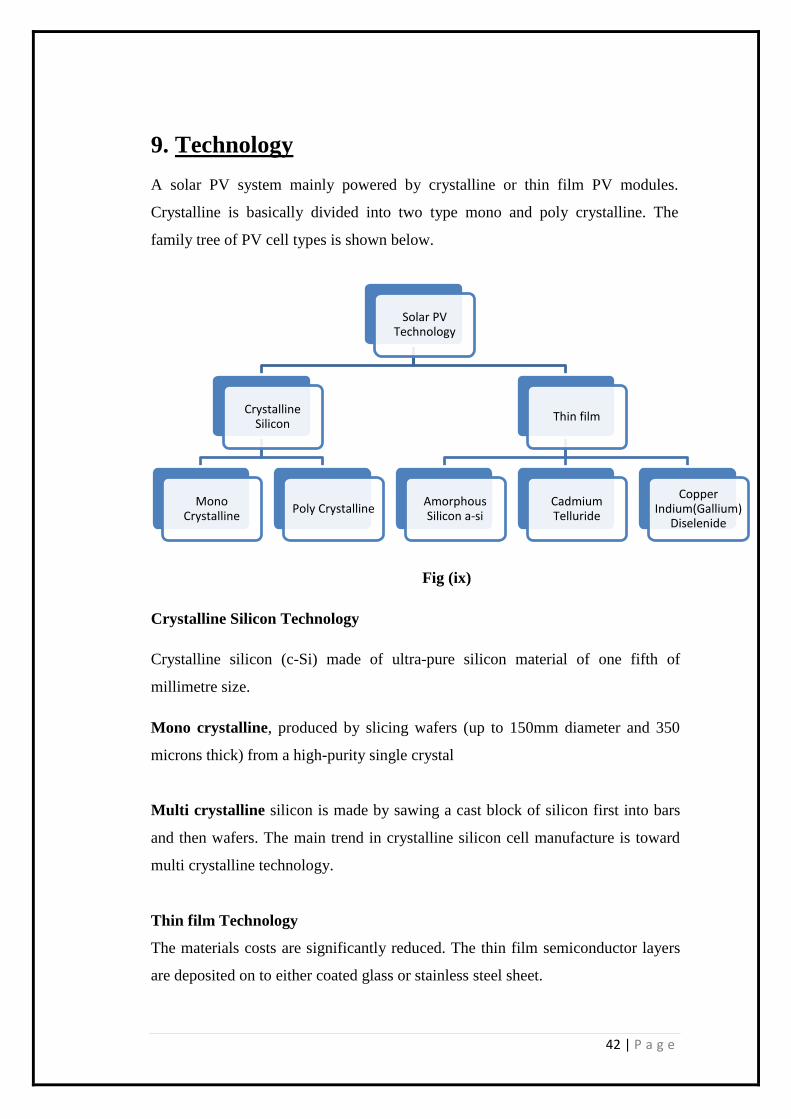
9. Technology
A solar PV system mainly powered by crystalline or thin film PV modules.
Crystalline is basically divided into two type mono and poly crystalline. The
family tree of PV cell types is shown below.
Fig (ix)
Crystalline Silicon Technology
Crystalline silicon (c-Si) made of ultra-pure silicon material of one fifth of
millimetre size.
Mono crystalline, produced by slicing wafers (up to 150mm diameter and 350
microns thick) from a high-purity single crystal
Multi crystalline silicon is made by sawing a cast block of silicon first into bars
and then wafers. The main trend in crystalline silicon cell manufacture is toward
multi crystalline technology.
Thin film Technology
The materials costs are significantly reduced. The thin film semiconductor layers
are deposited on to either coated glass or stainless steel sheet.
Solar PV Technology
Crystalline Silicon
Mono Crystalline
Poly Crystalline
Thin film
Amorphous Silicon a-si
Cadmium Telluride
Copper Indium(Gallium)
Diselenide

43 | P a g e
Amorphous silicon
It is the well-developed of the thin film technologies. Thin film cells are laminated
to produce a weather resistant and environmentally robust module. They can
reduce the cost by as much as 60% of C-Si. Amorphous silicon has an interesting
avenue of further development through the use of "microcrystalline" silicon
which seeks to combine the stable high efficiencies of crystalline Si technology
with the simpler and cheaper large area deposition technology of amorphous
silicon.
However, conventional C-Si manufacturing technology has continued its steady
improvement year by year and its production costs are still falling too. Thin films
have long held a niche position in low power (<50W) and consumer electronics
applications, and may offer particular design options for building integrated
applications.
Fig (x)

44 | P a g e
9.1. Conversation efficiencies
Table 11: Conversion efficiencies of different solar PV
technologies
Technology
type
Conversation
efficiency
Market
share
A Crystalline
silicon
87%
1 Mono
Crystalline
17-23%
2 Poly
crystalline
15-18%
B Thin film 13%
3 Amorphous
silicon
5-7%
4 CIGS 12%
5 Cadmium
Telluride
11%
9.2. BIPV (Building Integrated Photovoltaic)
BIPV (Building Integrated Photovoltaic) is upcoming new and one of the fastest
growing technology in Rooftop Solar PV system. In BIPV technology, the
photovoltaic materials that are used will replace the conventional building
materials on the outer surface of building such as roof, skylights, or facades. They
are incorporated into the building construction as a principal or ancillary source or
electric power. The main advantage of integrated photovoltaic over non-integrated
system is that the initial cost can be offset by reducing the amount on spent on
labour. The BIPV system is done while constructing the building, for already
building we use BAPV (Building Applied Photovoltaic).

45 | P a g e
9.3. CASE STUDY
Client : Glass manufacturing plant
Location : Bengaluru
Solar potential : 259KWp
Technology : poly and mono-crystalline
EPC : Emmvee Photovoltaic Power Pvt Ltd.
Module angle : 65 degrees to south
No of modules : 169*230Wp
Fig (xi)

46 | P a g e
10. Financial Viability of Rooftop solar with
subsidy and FiT
10.1 Financial viability of Rooftop Solar with Subsidy
In this financial viability of solar rooftop, we have taken the subsidy into account
along with APPC. All the assumptions we have taken from the CERC and from
MNRE.
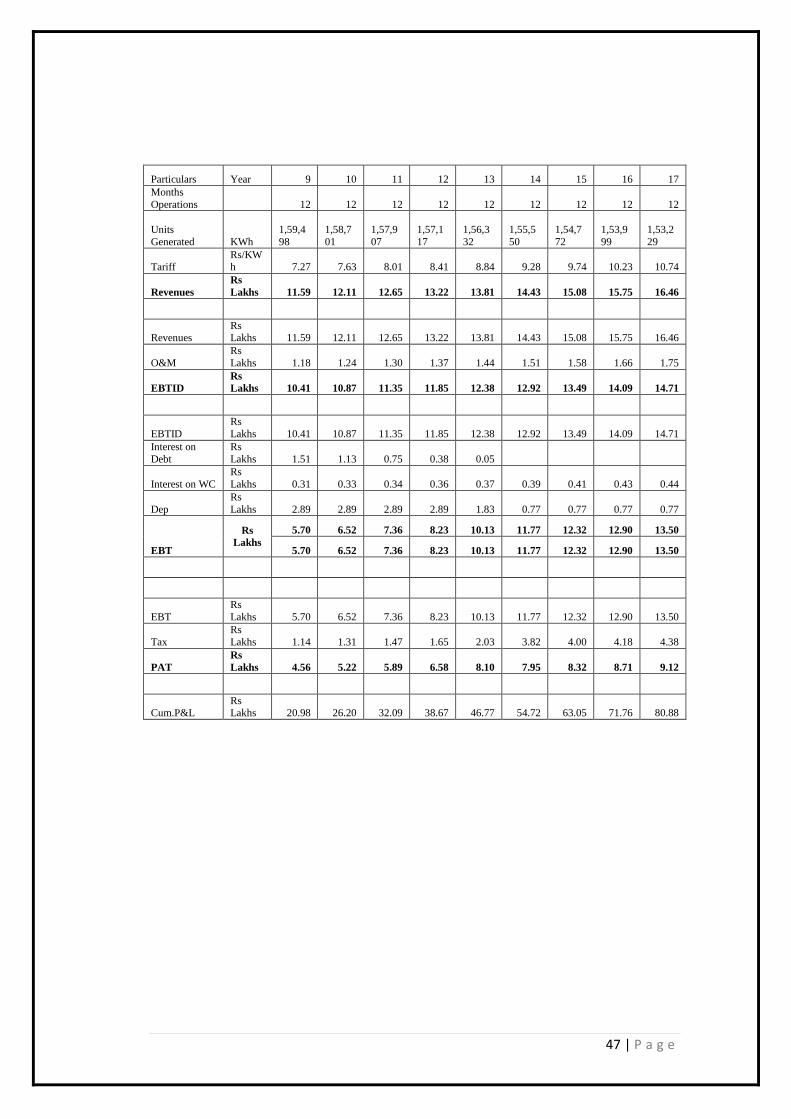
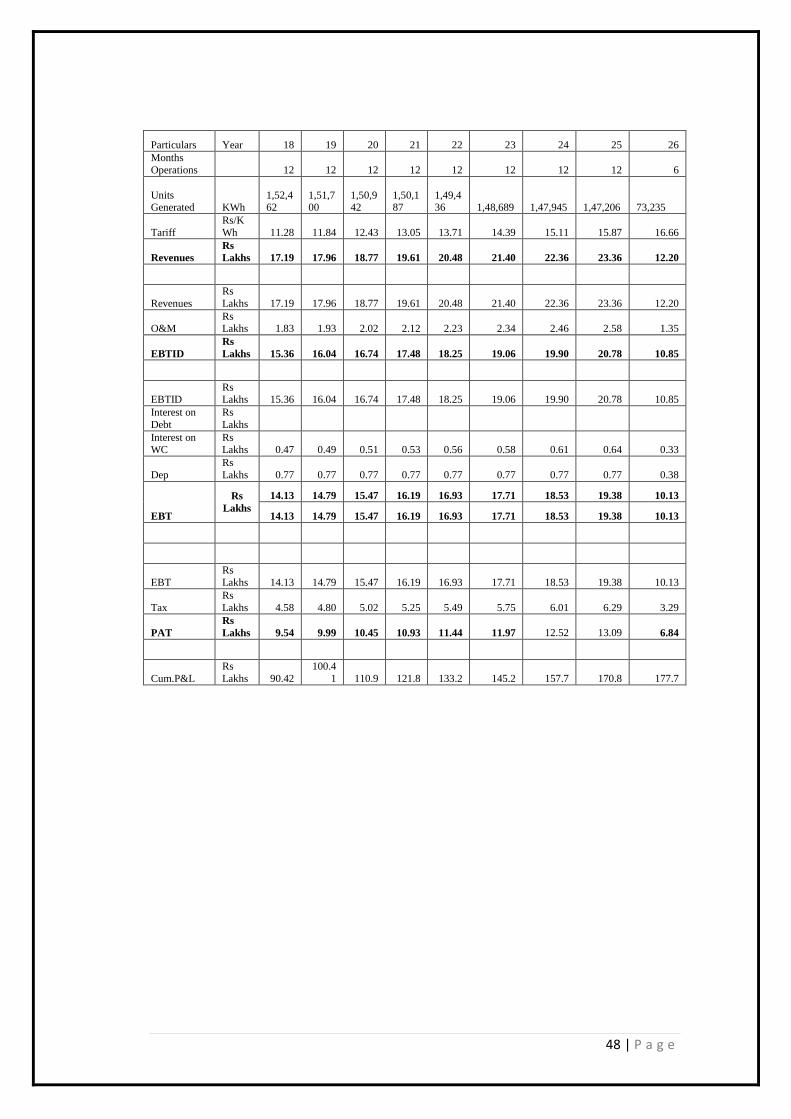
10.1.1. P&L sheet of subsidised solar rooftop system
Table 12: P&L sheet of subsidised rooftop
Particulars Year 1 2 3 4 5 6 7 8
Months Operations 6 12 12 12 12 12 12 12
Units Generated KWh
83,012
1,65,19
4
1,64,36
8
1,63,54
6
1,62,72
8
1,61,91
5
1,61,10
5
1,60,30
0
Tariff Rs/KWh 4.92 5.17 5.42 5.70 5.98 6.28 6.59 6.92
Revenues
Rs
Lakhs 4.08 8.53 8.92 9.31 9.73 10.17 10.62 11.10
Revenues
Rs
Lakhs 4.08 8.53 8.92 9.31 9.73 10.17 10.62 11.10
O&M Rs Lakhs 0.40 0.84 0.88 0.93 0.97 1.02 1.07 1.13
EBTID
Rs
Lakhs 3.68 7.69 8.03 8.39 8.76 9.15 9.55 9.97
EBTID Rs Lakhs 3.68 7.69 8.03 8.39 8.76 9.15 9.55 9.97
Interest on Debt
Rs
Lakhs 4.47 4.14 3.76 3.39 3.01 2.63 2.26 1.88
Interest on WC Rs Lakhs 0.20 0.23 0.24 0.25 0.26 0.27 0.28 0.30
Dep
Rs
Lakhs 1.45 2.89 2.89 2.89 2.89 2.89 2.89 2.89
EBT
Rs
Lakhs
-2.43 0.43 1.14 1.86 2.59 3.35 4.11 4.90
-2.43 -2.00 -0.86 0.99 3.59 6.93 4.11 4.90
EBT
Rs
Lakhs 0.00 0.00 0.00 0.99 3.59 6.93 4.11 4.90
Tax
Rs
Lakhs 0.00 0.00 0.00 0.20 0.72 1.39 0.82 0.98
PAT
Rs
Lakhs 0.00 0.00 0.00 0.80 2.87 5.55 3.29 3.92
Cum.P&L
Rs
Lakhs 0.00 0.00 0.00 0.80 3.67 9.21 12.50 16.42
47 | P a g e
Particulars Year 9 10 11 12 13 14 15 16 17
Months
Operations 12 12 12 12 12 12 12 12 12
Units
Generated KWh
1,59,4
98
1,58,7
01
1,57,9
07
1,57,1
17
1,56,3
32
1,55,5
50
1,54,7
72
1,53,9
99
1,53,2
29
Tariff Rs/KWh 7.27 7.63 8.01 8.41 8.84 9.28 9.74 10.23 10.74
Revenues
Rs
Lakhs 11.59 12.11 12.65 13.22 13.81 14.43 15.08 15.75 16.46
Revenues Rs Lakhs 11.59 12.11 12.65 13.22 13.81 14.43 15.08 15.75 16.46
O&M
Rs
Lakhs 1.18 1.24 1.30 1.37 1.44 1.51 1.58 1.66 1.75
EBTID
Rs
Lakhs 10.41 10.87 11.35 11.85 12.38 12.92 13.49 14.09 14.71
EBTID
Rs
Lakhs 10.41 10.87 11.35 11.85 12.38 12.92 13.49 14.09 14.71
Interest on
Debt
Rs
Lakhs 1.51 1.13 0.75 0.38 0.05
Interest on WC
Rs
Lakhs 0.31 0.33 0.34 0.36 0.37 0.39 0.41 0.43 0.44
Dep
Rs
Lakhs 2.89 2.89 2.89 2.89 1.83 0.77 0.77 0.77 0.77
EBT
Rs
Lakhs
5.70 6.52 7.36 8.23 10.13 11.77 12.32 12.90 13.50
5.70 6.52 7.36 8.23 10.13 11.77 12.32 12.90 13.50
EBT
Rs
Lakhs 5.70 6.52 7.36 8.23 10.13 11.77 12.32 12.90 13.50
Tax
Rs
Lakhs 1.14 1.31 1.47 1.65 2.03 3.82 4.00 4.18 4.38
PAT
Rs
Lakhs 4.56 5.22 5.89 6.58 8.10 7.95 8.32 8.71 9.12
Cum.P&L Rs Lakhs 20.98 26.20 32.09 38.67 46.77 54.72 63.05 71.76 80.88
48 | P a g e
Particulars Year 18 19 20 21 22 23 24 25 26
Months
Operations 12 12 12 12 12 12 12 12 6
Units Generated KWh
1,52,462
1,51,700
1,50,942
1,50,187
1,49,436
1,48,689
1,47,945
1,47,206
73,235
Tariff
Rs/K
Wh 11.28 11.84 12.43 13.05 13.71 14.39 15.11 15.87 16.66
Revenues
Rs
Lakhs 17.19 17.96 18.77 19.61 20.48 21.40 22.36 23.36 12.20
Revenues
Rs
Lakhs 17.19 17.96 18.77 19.61 20.48 21.40 22.36 23.36 12.20
O&M Rs Lakhs 1.83 1.93 2.02 2.12 2.23 2.34 2.46 2.58 1.35
EBTID
Rs
Lakhs 15.36 16.04 16.74 17.48 18.25 19.06 19.90 20.78 10.85
EBTID Rs Lakhs 15.36 16.04 16.74 17.48 18.25 19.06 19.90 20.78 10.85
Interest on
Debt
Rs
Lakhs
Interest on WC
Rs Lakhs 0.47 0.49 0.51 0.53 0.56 0.58 0.61 0.64 0.33
Dep
Rs
Lakhs 0.77 0.77 0.77 0.77 0.77 0.77 0.77 0.77 0.38
EBT
Rs
Lakhs
14.13 14.79 15.47 16.19 16.93 17.71 18.53 19.38 10.13
14.13 14.79 15.47 16.19 16.93 17.71 18.53 19.38 10.13
EBT
Rs
Lakhs 14.13 14.79 15.47 16.19 16.93 17.71 18.53 19.38 10.13
Tax
Rs
Lakhs 4.58 4.80 5.02 5.25 5.49 5.75 6.01 6.29 3.29
PAT
Rs
Lakhs 9.54 9.99 10.45 10.93 11.44 11.97 12.52 13.09 6.84
Cum.P&L
Rs
Lakhs 90.42
100.4
1 110.9 121.8 133.2 145.2 157.7 170.8 177.7

49 | P a g e
10.1.2. Cash flows of subsidised solar rooftop
Table 13: Cash flows of subsidised rooftop system
Particulars Year
Dec-
13
Dec-
14
Dec-
15
Dec-
16
Dec-
17
Dec-
18
Dec-
19
Dec-
20
Dec-
21
EBTID
Rs
Lakhs 3.68 7.69 8.03 8.39 8.76 9.15 9.55 9.97 10.41
Interest on Debt
Rs
Lakhs 4.47 4.14 3.76 3.39 3.01 2.63 2.26 1.88 1.51
Interest on Wc
Rs
Lakhs 0.20 0.23 0.24 0.25 0.26 0.27 0.28 0.30 0.31
Loan Repayment
Rs
Lakhs 1.45 2.90 2.90 2.90 2.90 2.90 2.90 2.90 2.90
Net Cash Flows before
Tax
Rs
Lakhs -2.43 0.43 1.14 1.86 2.59 3.34 4.11 4.90 5.70
Net Cash Flows Before Tax
Rs Lakhs -2.43 0.43 1.14 1.86 2.59 3.34 4.11 4.90 5.70
Tax
Rs
Lakhs 0.00 0.00 0.00 0.20 0.72 1.39 0.82 0.98 1.14
Net Cash Flows After
Tax -14.89
-
17.32 0.43 1.14 1.66 1.87 1.96 3.29 3.92 4.56
Cash
Rs
Lakhs -2.43 0.43 1.14 1.66 1.87 1.96 3.29 3.92 4.56
Cash in Bank Rs Lakhs -2.43 -2.00 -0.87 0.79 2.66 4.62 7.91 11.83 16.38
Cumm Cash
Rs
Lakhs 0 0 0 0.79 2.66 4.62 7.91 11.83 16.38
Particulars Year
Dec-
22
Dec-
23
Dec-
24
Dec-
25
Dec-
26
Dec-
27
Dec-
28
Dec-
29
EBTID
Rs
Lakhs 10.87 11.35 11.85 12.38 12.92 13.49 14.09 14.71
Interest on Debt Rs Lakhs 1.13 0.75 0.38 0.05 0.00 0.00 0.00 0.00
Interest on Wc Rs Lakhs 0.33 0.34 0.36 0.37 0.39 0.41 0.43 0.44
Loan Repayment Rs Lakhs 2.90 2.90 2.90 1.45 0.00 0.00 0.00 0.00
Net Cash Flows before
Tax
Rs
Lakhs 6.52 7.36 8.23 10.51 12.53 13.09 13.66 14.27
Net Cash Flows Before
Tax Rs Lakhs 6.52 7.36 8.23 10.51 12.53 13.09 13.66 14.27
Tax Rs Lakhs 1.31 1.47 1.65 2.03 3.82 4.00 4.18 4.38
Net Cash Flows After
Tax
5.22 5.89 6.58 8.48 8.72 9.09 9.48 9.89
Cash
Rs
Lakhs 5.22 5.89 6.58 8.48 8.72 9.09 9.48 9.89
Cash in Bank Rs Lakhs 21.60 27.49 34.07 42.55 51.27 60.36 69.83 79.72
Cumm Cash Rs Lakhs 21.60 27.49 34.07 42.55 51.27 60.36 69.83 79.72

50 | P a g e
Particulars Year
Dec-
30
Dec-
31
Dec-
32
Dec-
33
Dec-
34
Dec-
35
Dec-
36
Dec-
37
Dec-
38
EBTID
Rs
Lakhs 15.36 16.04 16.74 17.48 18.25 19.06 19.90 20.78 10.85
Interest on Debt
Rs
Lakhs 0.00 0.00 0.00 0.00 0.00 0.00 0.00 0.00 0.00
Interest on Wc Rs Lakhs 0.47 0.49 0.51 0.53 0.56 0.58 0.61 0.64 0.33
Loan Repayment
Rs
Lakhs 0.00 0.00 0.00 0.00 0.00 0.00 0.00 0.00 0.00
Net Cash Flows before
Tax
Rs
Lakhs 14.89 15.55 16.24 16.95 17.70 18.48 19.29 20.14 10.51
Net Cash Flows Before
Tax
Rs
Lakhs 14.89 15.55 16.24 16.95 17.70 18.48 19.29 20.14 10.51
Tax Rs Lakhs 4.58 4.80 5.02 5.25 5.49 5.75 6.01 6.29 3.29
Net Cash Flows After
Tax
10.31 10.75 11.22 11.70 12.20 12.73 13.28 13.86 7.23
Cash
Rs
Lakhs 10.31 10.75 11.22 11.70 12.20 12.73 13.28 13.86 7.23
Cash in Bank
Rs
Lakhs 90.03
100.7
8
112.0
0
123.7
0
135.9
0
148.6
3
161.9
1
175.7
7
183.0
0
Cumm Cash Rs Lakhs 90.03
100.78
112.00
123.70
135.90
148.63
161.91
175.77
183.00
IRR-19%
10.1.3. IRR sensitivity
Table 14: IRR sensitivity of Cap Ex with Tariff
Cap Ex excluding Subsidy
Ta
riff
42 44 46 48 50 52
3.00 11.2% 10.5% 9.9% 9.3% 8.7% 8.2%
3.50 14.3% 13.5% 12.7% 12.0% 11.4% 10.8%
4.00 17.4% 16.4% 15.5% 14.7% 14.0% 13.3%
4.50 20.7% 19.5% 18.4% 17.5% 16.6% 15.8%
5.00 24.1% 22.7% 21.4% 20.3% 19.3% 18.3%
5.50 27.8% 26.1% 24.6% 23.2% 22.0% 21.0%
6.00 31.8% 29.7% 28.0% 26.4% 25.0% 23.7%

51 | P a g e
Table 15: IRR sensitivity of Cap Ex with interest rate
Cap Ex Excluding Subsidy
Inte
rest
Ra
te
42 44 46 48 50 52
10% 26% 24% 23% 22% 21% 20%
11% 25% 24% 22% 21% 20% 19%
12% 24% 23% 22% 20% 19% 18%
13% 24% 22% 21% 20% 19% 18%
14% 23% 21% 20% 19% 18% 17%
15% 22% 21% 20% 19% 18% 17%
16% 21% 20% 19% 18% 17% 16%
52 | P a g e
10.2 Financial viability of rooftop solar with FiT
These viability sheets we have taken into consider the feed in tariff system where
the value of FiT is 12.44Rs/KWh out of which 3Rs/KWh is paid to rooftop owner.
The remaining amount is taken by the developer
10.2.1. P&L sheet of rooftop solar of FiT
Table 16: P&L sheet of rooftop solar of FiT

53 | P a g e
Particulars Year 1 2 3 4 5 6 7 8 9
Months
Operations 6 12 12 12 12 12 12 12 12
Units Generated KWh
83,012
1,65,194
1,64,368
1,63,546
1,62,728
1,61,915
1,61,105
1,60,300
1,59,498
Tariff
Rs/KW
h 9.44 9.72 10.01 10.32 10.62 10.94 11.27 11.61 11.96
Revenues
Rs
Lakhs 7.84 16.06 16.46 16.87 17.29 17.72 18.16 18.61 19.07
Revenues
Rs
Lakhs 7.84 16.06 16.46 16.87 17.29 17.72 18.16 18.61 19.07
O&M Rs Lakhs 0.40 0.84 0.88 0.93 0.97 1.02 1.07 1.13 1.18
EBTID
Rs
Lakhs 7.44 15.22 15.58 15.94 16.32 16.70 17.09 17.49 17.89
EBTID Rs Lakhs 7.44 15.22 15.58 15.94 16.32 16.70 17.09 17.49 17.89
Interest on
Debt
Rs
Lakhs 7.21 6.67 6.07 5.46 4.85 4.25 3.64 3.03 2.43
Interest on WC
Rs Lakhs 0.37 0.40 0.41 0.42 0.43 0.44 0.45 0.47 0.48
Dep
Rs
Lakhs 2.33 4.66 4.66 4.66 4.66 4.66 4.66 4.66 4.66
EBT
Rs
Lakhs
-2.47 3.49 4.44 5.40 6.37 7.34 8.33 9.32 10.32
-2.47 1.02 5.45 10.85 17.22 24.57 8.33 9.32 10.32
EBT
Rs
Lakhs 0.00 1.02 5.45 10.85 17.22 24.57 8.33 9.32 10.32
Tax
Rs
Lakhs 0.00 0.20 1.09 2.17 3.45 4.92 1.67 1.86 2.06
PAT
Rs
Lakhs 0.00 0.81 4.36 8.68 13.78 19.65 6.66 7.46 8.26
Cum.P&L 0.00 0.81 5.18 13.86 27.63 47.29 53.95 61.40 69.66

54 | P a g e
Particulars year 10 11 12 13 14 15 16 17
Months
Operations 12 12 12 12 12 12 12 12
Units Generated KWh
1,58,701
1,57,907
1,57,117
1,56,332
1,55,550
1,54,772
1,53,999
1,53,229
Tariff
Rs/KW
h 12.32 12.69 13.07 13.46 13.86 14.28 14.71 15.15
Revenues
Rs
Lakhs 19.55 20.03 20.53 21.04 21.56 22.10 22.65 23.21
Revenues
Rs
Lakhs 19.55 20.03 20.53 21.04 21.56 22.10 22.65 23.21
O&M Rs Lakhs 1.24 1.30 1.37 1.44 1.51 1.58 1.66 1.75
EBTID
Rs
Lakhs 18.31 18.73 19.16 19.60 20.06 20.52 20.99 21.47
EBTID Rs Lakhs 18.31 18.73 19.16 19.60 20.06 20.52 20.99 21.47
Interest on Debt
Rs
Lakhs 1.82 1.21 0.61 0.08
Interest on WC Rs Lakhs 0.49 0.51 0.52 0.53 0.55 0.56 0.58 0.60
Dep
Rs
Lakhs 4.66 4.66 4.66 2.95 1.23 1.23 1.23 1.23
EBT
Rs
Lakhs
11.33 12.35 13.37 16.04 18.27 18.72 19.17 19.64
11.33 12.35 13.37 16.04 18.27 18.72 19.17 19.64
EBT
Rs
Lakhs 11.33 12.35 13.37 16.04 18.27 18.72 19.17 19.64
Tax
Rs
Lakhs 2.27 2.47 4.34 5.21 5.93 6.07 6.22 6.37
PAT
Rs
Lakhs 9.06 9.88 9.03 10.84 12.34 12.64 12.95 13.26
Cum.P&L 78.72 88.59 97.63 108.47 120.81 133.45 146.41 159.67

55 | P a g e
Particulars year 18 19 20 21 22 23 24 25 26
Months
Operations 12 12 12 12 12 12 12 12 6
Units Generated KWh
1,52,462
1,51,700
1,50,942
1,50,187
1,49,436
1,48,689
1,47,945
1,47,206
73,235
Tariff
Rs/KW
h 15.60 16.07 16.55 17.05 17.56 18.09 18.63 19.19 19.77
Revenues
Rs
Lakhs 23.79 24.38 24.99 25.61 26.24 26.89 27.56 28.25 14.48
Revenues
Rs
Lakhs 23.79 24.38 24.99 25.61 26.24 26.89 27.56 28.25 14.48
O&M Rs Lakhs 1.83 1.93 2.02 2.12 2.23 2.34 2.46 2.58 1.35
EBTID
Rs
Lakhs 21.95 22.45 22.96 23.48 24.01 24.55 25.11 25.67 13.12
EBTID Rs Lakhs 21.95 22.45 22.96 23.48 24.01 24.55 25.11 25.67 13.12
Interest on
Debt
Rs
Lakhs
Interest on WC
Rs Lakhs 0.61 0.63 0.65 0.67 0.69 0.71 0.73 0.75 0.38
Dep
Rs
Lakhs 1.23 1.23 1.23 1.23 1.23 1.23 1.23 1.23 0.62
EBT
Rs
Lakhs
20.11 20.59 21.08 21.58 22.09 22.62 23.15 23.69 12.12
20.11 20.59 21.08 21.58 22.09 22.62 23.15 23.69 12.12
EBT
Rs
Lakhs 20.11 20.59 21.08 21.58 22.09 22.62 23.15 23.69 12.12
Tax
Rs
Lakhs 6.52 6.68 6.84 7.00 7.17 7.34 7.51 7.69 3.93
PAT
Rs
Lakhs 13.58 13.91 14.24 14.58 14.93 15.28 15.64 16.00 8.19
Cum.P&L 173.25 187.16 201.41 215.99 230.91 246.19 261.83 277.83 286.02

56 | P a g e
10.2.2. Cash flows of FiT viable sheet
Table 17: Cash flows of FiT viable sheet
Particulars Year
Dec-
13
Dec-
14
Dec-
15
Dec-
16
Dec-
17
Dec-
18
Dec-
19
Dec-
20
Dec-
21
EBTID
Rs
Lakhs 7.44 15.22 15.58 15.94 16.32 16.70 17.09 17.49 17.89
Interest on Debt
Rs
Lakhs 7.21 6.67 6.07 5.46 4.85 4.25 3.64 3.03 2.43
Interest on Wc Rs Lakhs 0.37 0.40 0.41 0.42 0.43 0.44 0.45 0.47 0.48
Loan Repayment
Rs
Lakhs 2.33 4.67 4.67 4.67 4.67 4.67 4.67 4.67 4.67
Net Cash Flows before
Tax
Rs
Lakhs -2.47 3.48 4.44 5.40 6.37 7.34 8.33 9.32 10.32
Net Cash Flows Before
Tax
Rs
Lakhs -2.47 3.48 4.44 5.40 6.37 7.34 8.33 9.32 10.32
Tax Rs Lakhs 0.00 0.20 1.09 2.17 3.45 4.92 1.67 1.86 2.06
Net Cash Flows After
Tax -24.00
-
26.48 3.28 3.35 3.23 2.92 2.43 6.66 7.45 8.25
Cash
Rs
Lakhs -2.47 3.28 3.35 3.23 2.92 2.43 6.66 7.45 8.25
Cash in Bank
Rs
Lakhs -2.47 0.81 4.15 7.38 10.30 12.72 19.38 26.84 35.09
Particulars Year
Dec-
22
Dec-
23
Dec-
24
Dec-
25
Dec-
26
Dec-
27
Dec-
28
Dec-
29
EBTID
Rs
Lakhs 18.31 18.73 19.16 19.60 20.06 20.52 20.99 21.47
Interest on Debt Rs Lakhs 1.82 1.21 0.61 0.08 0.00 0.00 0.00 0.00
Interest on Wc Rs Lakhs 0.49 0.51 0.52 0.53 0.55 0.56 0.58 0.60
Loan Repayment Rs Lakhs 4.67 4.67 4.67 2.33 0.00 0.00 0.00 0.00
Net Cash Flows before
Tax
Rs
Lakhs 11.33 12.34 13.37 16.66 19.51 19.95 20.41 20.87
Net Cash Flows Before Tax Rs Lakhs 11.33 12.34 13.37 16.66 19.51 19.95 20.41 20.87
Tax Rs Lakhs 2.27 2.47 4.34 5.21 5.93 6.07 6.22 6.37
Net Cash Flows After
Tax
9.06 9.87 9.03 11.45 13.58 13.88 14.18 14.50
Cash
Rs
Lakhs 9.06 9.87 9.03 11.45 13.58 13.88 14.18 14.50
Cash in Bank Rs Lakhs 44.15 54.02 63.05 74.50 88.08 101.96 116.14 130.64

57 | P a g e
Particulars Year
Dec-
30
Dec-
31
Dec-
32
Dec-
33
Dec-
34
Dec-
35
Dec-
36
Dec-
37
Dec-
38
EBTID
Rs
Lakhs 21.95 22.45 22.96 23.48 24.01 24.55 25.11 25.67 13.12
Interest on Debt
Rs
Lakhs 0.00 0.00 0.00 0.00 0.00 0.00 0.00 0.00 0.00
Interest on Wc Rs Lakhs 0.61 0.63 0.65 0.67 0.69 0.71 0.73 0.75 0.38
Loan Repayment
Rs
Lakhs 0.00 0.00 0.00 0.00 0.00 0.00 0.00 0.00 0.00
Net Cash Flows before
Tax
Rs
Lakhs 21.34 21.82 22.32 22.82 23.33 23.85 24.38 24.92 12.74
Net Cash Flows Before
Tax
Rs
Lakhs 21.34 21.82 22.32 22.82 23.33 23.85 24.38 24.92 12.74
Tax Rs Lakhs 6.52 6.68 6.84 7.00 7.17 7.34 7.51 7.69 3.93
Net Cash Flows After
Tax
14.82 15.14 15.48 15.81 16.16 16.51 16.87 17.24 8.80
Cash
Rs
Lakhs 14.82 15.14 15.48 15.81 16.16 16.51 16.87 17.24 8.80
Cash in Bank
Rs
Lakhs
145.4
6
160.6
0
176.0
8
191.8
9
208.0
5
224.5
6
241.4
3
258.6
7
267.4
8
IRR-21%
58 | P a g e
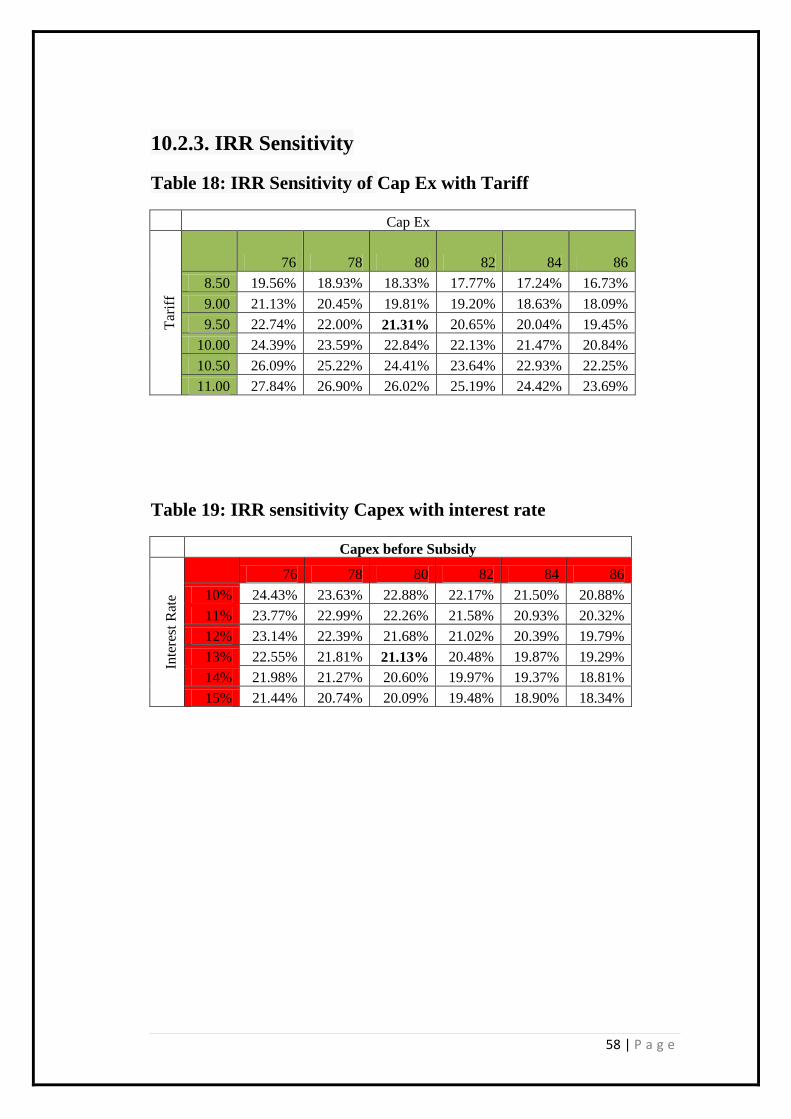
10.2.3. IRR Sensitivity
Table 18: IRR Sensitivity of Cap Ex with Tariff
Cap Ex
Tar
iff
76 78 80 82 84 86
8.50 19.56% 18.93% 18.33% 17.77% 17.24% 16.73%
9.00 21.13% 20.45% 19.81% 19.20% 18.63% 18.09%
9.50 22.74% 22.00% 21.31% 20.65% 20.04% 19.45%
10.00 24.39% 23.59% 22.84% 22.13% 21.47% 20.84%
10.50 26.09% 25.22% 24.41% 23.64% 22.93% 22.25%
11.00 27.84% 26.90% 26.02% 25.19% 24.42% 23.69%
Table 19: IRR sensitivity Capex with interest rate
Capex before Subsidy
Inte
rest
Rat
e
76 78 80 82 84 86
10% 24.43% 23.63% 22.88% 22.17% 21.50% 20.88%
11% 23.77% 22.99% 22.26% 21.58% 20.93% 20.32%
12% 23.14% 22.39% 21.68% 21.02% 20.39% 19.79%
13% 22.55% 21.81% 21.13% 20.48% 19.87% 19.29%
14% 21.98% 21.27% 20.60% 19.97% 19.37% 18.81%
15% 21.44% 20.74% 20.09% 19.48% 18.90% 18.34%

59 | P a g e
11. Challenges
11.1. Availability of rooftop – While the number of rooftops in the country is
very high, a big part of them are not suitable for installing PV systems.
11.2. Financial - The high upfront investment is often a major deterrent in rooftop
PV deployment.
11.3. Regulatory/policy
At present, only capital subsidies and tax benefits in the form of accelerated
depreciation are provided for PV systems (up to 500kWp).
The process of getting approval for the projects and getting the capital subsidy
disbursed takes long time. The slow turn-around times and some uncertainty about
getting the payments is a challenge in adoption of the rooftop PV.
11.4. Infrastructural
Implementing a Feed-in-Tariff system for rooftop PV, along the lines of major
European countries, is a powerful mechanism to stimulate growth in this segment.
However, challenges like prevention of abuse of the mechanism like feeding in
power to the grid from cheaper source of power (perhaps subsidized kerosene)
and getting higher feed-in-tariff needs to be addressed in order to make this model
successful. In fact, the Government of Delhi had to scrap its rooftop policy
because of the perceived challenge in this area.
In addition to these issues, Pune based Think-tank Prayas group has come up with
a study that highlights the challenges in implementing a Feed-in-Tariff approach
which include:
Higher burden on utility – due to the smaller sizes of rooftop PV (RTPV),
the unit cost of electricity from these systems tend to be higher, making

60 | P a g e
power purchase from them uncompetitive in comparison to power
purchase from utility scale projects.
Difficulty in estimating FiT – With the rapid fall in PV system prices,
arriving at a FiT has been a challenge not only for utility scale projects,
but also for RTPV.
The study argues that due to these challenges in the FiT based approach, a net-
metering based approach, as adapted by the Tamil Nadu Solar policy should be
promoted. In order to promote net-metering, the study recommends the following
steps.
Progressively increase the tariff for high-end consumption in residential
and commercial sectors, thereby bringing RTPV power generation cost
close to the price of grid-electricity.
Provide interconnection to the grid and banking facility for rooftop PV
systems.
Instead of providing payouts for the net electricity exported to the grid, the
credit can be rolled over to the next billing cycle and upto a year.
11.5. Other Challenges
Structural Constraints: Roofs of a certain age or construction may be
less desirable for a solar installation and may require a significant
refurbishment before such an installation is possible. Ideal conditions
include roofs with 10-20 years remaining before significant maintenance
or overhaul is required.
Limit on single phase generation: If there are many such micro
generators (as we can call small solar PV panel installations) and their
supply is not balanced among the phases, the network can become
imbalanced.
Quality of electricity: There are strict criteria so that having multiple
generation sources does not impact the quality of electricity available in

61 | P a g e
the grid. This includes the issue of harmonics (distortion of the Sine wave
AC signal) and EMC (Electromagnetic Compatibility) requirements.

62 | P a g e
12. Conclusion & Recommendations:
Rooftop solar under subsidy scheme
APPC tariff to industries is at Rs7/- in states Andhra Pradesh, Delhi,
Maharashtra, Tamil Nadu, and Rajasthan. Considering a project cost of
Rs7cr/MW will get an attractive IRR of 19%-22%, hence would
recommend Moser Baer to target industries under Rooftop subsidy in these
states Andhra Pradesh, Delhi, Tamil Nadu, Maharashtra and Rajasthan.
Feed in Tariff
Under FiT only Gujarat has come out with a tariff of Rs12.44/KWh which
gives a healthy return on investment of 22%
Project levers
For every 10% decrease in project cost we can see IRR increase of 2.5%
For every 1% change in interest rate we can see IRR jump of 0.5%.
I believe rooftop solar is currently is an immediate opportunity in the
Indian solar space and would recommend Moser Bare to invest in this
sector in big way. Considering attractive returns of 20% plus.

63 | P a g e
13. BIBILOGRAPHY
http://wberc.org
http://www.gercin.org
http://aperc.gov.in
http://www.kerc.org
http://cserc.gov.in
http://www.cercind.gov.in
http://www.cea.nic.in
http://www.mnre.gov.in
http://www.re-solve.in
http://seci.gov.in/content/
http://tnerc.tn.nic.in
http://www.eai.in
http://www.mercindia.org.in
http://rerc.rajasthan.gov.in
http://www.azurepower.com
http://www.regenpower.com
Prayas Group Pune, India