solar securitization: an innovation in renewable … securitization: an innovation in renewable...
TRANSCRIPT
Solar Securitization:
An MIT Energy Initiative Working Paper
July 2016
Dr. Francis M. O’Sullivan1
Charles H. Warren2
1Director of Research and Analysis, MIT Energy Initiative; Senior Lecturer, MIT Sloan School of Management.
2Alumnus of the MIT Sloan School of Management (MBA 2016) and the Harvard Kennedy School of Government (MPA 2016).
MIT Energy Initiative, 77 Massachusetts Ave., Cambridge, MA 02139, USAMITEI-WP-2016-05
An Innovation in Renewable Energy Finance

Solar Securitization: An Innovation in Renewable Energy
Finance
Abstract
Recent developments have cast a pall over financial innovation in renewable energy.
Journalists, analysts, and investors alike have raised specific concerns over yieldcos, publicly
listed vehicles that own renewable energy assets such as wind and solar projects. However, too
little attention has been paid to recent, equally novel activities in fixed income markets: the
securitization of residential solar. We parse the excitement surrounding solar asset backed
securities (ABS), on the one hand, with the realities of the underlying business models, federal
policies, and electricity market regulations, on the other. After reviewing the U.S. residential
solar market, we examine the mechanics of solar securitization, explore the potential tradeoffs,
and discuss the asset class’ future. Debt markets should in theory generate lower cost capital
for solar providers and spur greater deployment of renewable energy. Yet securitization has not
unleashed residential solar in the manner that some have predicted. We demonstrate that
business model challenges and regulatory uncertainty remain barriers to the sector’s growth,
and by extension, its nascent ABS market. Securitization has still shown early signs of success
and could help scale solar in an effort to decarbonize the U.S. electricity grid. However, for solar
securitization to be successful in the long term, sustainable business models and true
technological innovation must accompany it.
Keywords: solar, securitization, asset backed securities (ABS), financial engineering, renewable
energy, climate change, innovation
Authors:
Dr. Francis M. O’Sullivan1 | [email protected] Charles H. Warren2 | [email protected]
July 2016
1 Director of Research and Analysis, MIT Energy Initiative; Senior Lecturer, MIT Sloan School of Management. 2 Alumnus of the MIT Sloan School of Management (MBA 2016) and the Harvard Kennedy School of Government (MPA 2016).

2
Table of Contents
Introduction ................................................................................................................................ 3
Background on the U.S. Residential Solar Market ...................................................................... 4
Residential Solar-as-a-Service and the “No Money Down” Business Model ........................... 5
Customer Contracts ................................................................................................................ 7
The Solar Provider: Managing the Value Streams of Solar-as-a-Service ................................ 8
Solar Securitization: Market Overview and Mechanics ..............................................................12
The U.S. Asset Backed Security (ABS) Market ......................................................................12
How Solar Securitization Works.............................................................................................12
Residential Solar Asset Backed Securities (ABS) to Date......................................................15
Sizing the Solar Securitization Market ...................................................................................17
The Opportunities and Challenges of Solar Securitization .........................................................18
Opportunities .........................................................................................................................18
Challenges ............................................................................................................................19
Advance Rates ......................................................................................................................28
The Future of Solar Securitization: Salient Change or Passing Fad? ........................................29
Is Pooling Next? ....................................................................................................................30
Conclusion ................................................................................................................................31
Acknowledgements ...................................................................................................................32
Bibliography ..............................................................................................................................32

3
Introduction
The December 2015 international climate accord in Paris made history. Delegates agreed to a
framework for global emission reductions, generating legitimate optimism. The summit also
focused on financing the renewable energy of the future. Twenty nations pledged to increase
R&D investments through Mission Innovation, while Bill Gates introduced a private sector
initiative—the Breakthrough Energy Coalition—to pool billionaires’ capital and invest it in early
stage ventures. With traditional venture capitalists souring on cleantech investments, Paris’
emphasis on early-stage energy finance represented a welcome turn of events.3
However, the financing of existing renewable energy technologies reached its nadir during the
latter half of 2015, just three months after diplomats departed Charles de Gaulle airport.
SunEdison filed for Chapter 11 bankruptcy on April 21, 2016. The company had set its sights on
becoming the ExxonMobil of renewable energy by 2020 and boasted a market capitalization of
over $9 billion in July 2015.4 SunEdison’s restructuring had many causes. However, journalists,
Wall Street analysts, and investors alike complained about the company’s complex financial
structure. SunEdison also had a propensity for financial engineering: the company embraced
yieldcos, a new class of public equities that own contracted energy assets and in theory deliver
steady returns to investors. The reliance on tax-efficient but growth-dependent public vehicles
made markets wary and helped drive down the company’s stock price during the summer of
2015.
Due in part to SunEdison’s restructuring, investor and media attention has cast a pall over
yieldcos and the broader trend of financial engineering in renewable energy.5 However, too little
attention has been paid to recent, equally novel advances using fixed income markets. We thus
explore a promising recent development in renewable energy finance: the securitization of U.S.
residential solar assets.
We parse the excitement surrounding the financial innovation of solar asset backed securities
(ABS), on the one hand, with realities of the underlying residential solar business models,
federal policies, and electricity market regulations, on the other. 6 The ultimate goal of solar ABS
mirrors that of yieldcos: match new investors with renewable energy assets in order to generate
returns for the former and lower the cost of capital for the latter. We examine the mechanics of
solar securitization, explore the tradeoffs of the structure, and discuss what may be next for
financing solar in the United States.
Any discussion of increasing the deployment of residential solar must address its relative
climate benefits. In short, the devil is in the details. The installed costs for residential
installations run approximately twice that of utility scale projects on a per Watt basis.7 In an ideal
3 Sivaram and Norris, “The Clean Energy Revolution: Fighting Climate Change with Innovation.” 4 Foley and Crooks, “SunEdison: Death of a Solar Star”; Hoffman, “Inside the Fall of SunEdison, Once a Darling of the Clean-Energy World.” 5 It remains unclear if analysts’ initial judgments of the new asset class were misplaced. Some yieldcos continue to perform well. 6 For earlier academic work, see Joshi, “Solar Securitization: Understanding the Risks of Residential Solar Energy-Backed Securities from an Investor Perspective”; Alafita and Pearce, “Securitization of Residential Solar Photovoltaic Assets: Costs, Risks and Uncertainty.” 7 SEIA / GTM Research, “U.S. SOLAR MARKET INSIGHT Q2 2016: Executive Summary,” 13–14.

4
state of the world, decarbonizing the electric grid in order to meet emissions targets would occur
via the lowest cost options. However, this is not the world—or the U.S. electricity market—that
currently exists.8 The rise of residential solar should not be ignored ex post as inefficient. Many
of the solar providers are now publicly listed, and households have demonstrated a willingness
to pay for the rooftop systems. As a result, this working paper does not seek to prove that
residential solar and its financing mechanisms are, or are not, capable of addressing climate
change in a cost effective way.
We do, however, reflect on the current challenges and future opportunities of solar
securitization. Debt markets should in theory supply lower cost capital for solar providers and
spur greater deployment of renewable energy. The structure of the transactions, size of the
markets, and recent uptick in investors’ interest all align to make solar ABS promising. Yet
securitization has not unleashed the residential solar market in the manner that some have
predicted. Only one percent of U.S. households lease or own rooftop solar installations today.9
We demonstrate that business model challenges and regulatory uncertainty remain barriers to
the growth of the sector, and by extension, its nascent securitization market. We view solar
securitization as a worthwhile experiment that is already showing promising results. However,
for securitization to be truly successful in the long term, sustainable business models and true
technological innovation must accompany it.
Background on the U.S. Residential Solar Market
U.S. residential solar has demonstrated impressive growth rates over the last ten years, albeit
off a small base. Total solar generation has increased over fifty times since 2005, and
residential solar installed capacity has grown seventy seven times.10 From 2014 to 2015, the
sector witnessed capacity growth over 60 percent.11 Publicly listed companies SolarCity,
Sunrun, and Vivint controlled approximately half of the market by the fourth quarter of 2015, with
estimated cumulative deployments of 1,945 MWs, 596 MWs, and 459 MWs, respectively.12
8 Distributed energy resources (DERs), which are not limited to residential solar, may or may not add value to the grid
depending on a variety of specific factors. As a result, valuing DERs is a topic of ongoing academic research and
open regulatory debate. For one forthcoming analysis, see Jenkins and Pérez-Arriaga, “Improved Regulatory
Approaches for the Remuneration of Electricity Distribution Utilities with High Penetrations of Distributed Energy
Resources.” 9 Feldman, Boff, and Margolis, “SunShot Initiative Q4 2015/Q1 2016 Solar Industry Update,” 25. 10 Ibid., 22; 25. 11 SEIA / GTM Research, “Solar Market Insights 2015 Q4.” 12 All installed capacity figures are MW-DC. Feldman, Boff, and Margolis, “SunShot Initiative Q4 2015/Q1 2016 Solar Industry Update,” 26; SolarCity, “SolarCity Corporation Form 10-K 2015,” 47; Vivint, “Vivint Form 10-K 2015.”

5
13
When SolarCity incorporated in 2006, utility scale projects dominated the market. By 2015,
residential solar accounted for almost a third of total installed capacity.14 The entire sector now
employs over 200,000 people.15 Compared to falling year-on-year growth rates for utility scale
projects, residential installations have also exhibited a steady growth trajectory since 2010-11.16
Falling hardware costs have helped drive the general increase in solar installations. Panel and
inverter prices have declined over 60 percent on a per Watt basis since 2010. 17 Other “balance
of system” costs have declined, too. For instance, more efficient racking of PV panels reduces
the amount of aluminum needed for the entire system.18 As module efficiency improves, these
costs will likely continue to fall.19
Residential Solar-as-a-Service and the “No Money Down” Business Model
While cheaper inputs have facilitated the deployment of utility-scale solar, the residential
market’s major advancement has been its business model to address the inherent challenges of
rooftop installations. After all, residential solar is a capital and labor intensive business. System
prices vary state-by-state and according to size, but they average approximately $25,000 per 10
13 Feldman, Boff, and Margolis, “SunShot Initiative Q4 2015/Q1 2016 Solar Industry Update,” 23. 14 SEIA / GTM Research, “Solar Market Insights 2015 Q4.” 15 Feldman, Boff, and Margolis, “SunShot Initiative Q4 2015/Q1 2016 Solar Industry Update,” 25. 16 Ibid., 23. 17 Ibid., 55–56. 18 Woodhouse et al., “The Role of Advancements in Solar Photovoltaic Efficiency, Reliability, and Costs,” 15–16. 19 Falling input costs have driven down the $/Watt cost for utility scale solar. However, the average $/Watt prices for residential solar have remained fairly constant since 2013. Feldman, Boff, and Margolis, “SunShot Initiative Q4 2015/Q1 2016 Solar Industry Update,” 31.
300800
1,800
2,900
3,900 4,100
300
800
1,100
1,100
1,100 1,000
200
300
500
800
1,300
2,100
0
1,000
2,000
3,000
4,000
5,000
6,000
7,000
8,000
2010 2011 2012 2013 2014 2015
An
nu
al P
V I
nsta
lled
(M
W-D
C)
U.S. Solar Installations, 2010-2015
Utility Non-Residential Residential

6
kW rooftop installation.20 Operational and maintenance costs also accompany the system during
its useful life. On a per Watt basis, the national average residential solar prices hovered around
$3.70 during 2014-2015, with large regional variations.21 Approximately two-thirds of the per
Watt costs are installation, with the remaining third split among sales as well as general and
administrative costs.22 Unlike utility-scale projects, customer acquisition costs also matter;
companies need to generate and close new leads before installing a single panel.
Given the cost, few Americans can afford rooftop installations outright. The 2014 median U.S.
household income was $53,657, placing solar well beyond the reach of most.23 From a purely
rational economic perspective, it may make sound financial sense for wealthier households to
switch to rooftop solar. The utility bill savings provided by generating solar power may create a
positive net present value for the project. However, few households take the time to analyze
their monthly electric bill, let alone calculate the return on a hypothetical solar installation.24
Even if they did the analysis, liquidity would present a problem to most households. The amount
of upfront cash required to purchase the system outright dissuades all but the super wealthy
from buying a solar system.
As a result, residential solar bears some resemblance to another expensive yet ubiquitous U.S.
household purchase: the automobile. In 2015, the average MSRP for a sedan in the United
States was about $33,500, but only approximately 14 percent of consumers bought cars with
cash.25 Instead, leases and loans dominated with 31 and 55 percent of the market,
respectively.26 Vehicle leasing has soared in recent years due to low rates, with the current total
now more than double 2009 levels.27
Similar to the auto market, residential solar providers have created third-party owned financing
models to attract customers. With “no money down” contracts and low initial rates, households
face fewer barriers to accessing what companies believe to be residential solar’s long term
value proposition.28 The leading companies do more than install the panels, too. They have
become providers of “solar-as-a-service”: they sell, install, finance, and maintain the solar
system for customers.29
The new residential solar business model impacts households as well. Solar leasing and loan
products have allowed increasing numbers of Americans to become “prosumers” of electricity—
producing, consuming, and re-selling electricity to the grid.30 The third-party ownership model
20 Feldman, Boff, and Margolis, “SunShot Initiative Q3/Q4 2015 Solar Industry Update,” 41. 21 Ibid. 22 SolarCity, “Investor Presentation,” 20; Feldman, Boff, and Margolis, “SunShot Initiative Q3/Q4 2015 Solar Industry Update,” 41. 23 US. Bureau of the Census, “Real Median Household Income in the United States.” 24 Knittel, “Guest Lecture in MIT Course 15.366: Energy Ventures.” 25 Kelley Blue Book, “New-Car Transaction Prices Jump More Than 3 Percent in August 2015.” 26 Zabritski, “Experian State of the Automotive Finance Market: A Look at Loans and Leases in Q1 2016,” 11. 27 Manheim, “2016 Used Car Market Report”; Zabritski, “Experian State of the Automotive Finance Market: A Look at Loans and Leases in Q1 2016,” 11. 28 There are of course important differences between cars and residential solar; namely, the length of leases (three
vs. twenty years), recourse in the event of default (repossession of the vehicle vs. no such option with solar panels)
and the secondary market size (the robust used car market vs. no residual value for panels). Zabritski, “Experian
State of the Automotive Finance Market: A Look at Loans and Leases in Q1 2016,” 13. 29 SolarCity has gone further and focused on vertical integration. 30 Reneses, Rodríguez, and Pérez-Arriaga, “Chapter 8: Electricity Tariffs,” 438.

7
has been particularly successful in California, Arizona, and Nevada. California alone accounts
for about half of the installed capacity in the U.S. residential solar market.31
Customer Contracts
The residential solar industry has quickly become a consumer credit and lending business
focused on customer acquisition. Solar providers have developed four primary financial
contracts: leases, power purchase agreements, property-assessed clean energy (PACE) bonds,
and loans.
Leases & Power Purchase Agreements (PPAs): Under a standard 20-year lease agreement, the
solar company provides the panels and enters into a contract with the customer. The household
then makes a monthly fixed $/kWh payment below their previous utility bill, creating a delta in
prices that translates to value. While the lease payment typically escalates at 1 to 3 percent per
year, the household pays no upfront cost for the panel installation or the operations and
maintenance; the company owns the system.32 Power Purchase Agreements (PPAs) are similar
to leases, but differ in that PPA holders enter into a contract to buy the system’s power at a
predetermined $/kWh rate.
Loans: Loans are the newest financial arrangement in the residential solar market. Rather than
offer leases, solar provider grant loans to homeowners, allowing them to purchase the system
and then make interest payments until the maturity of the loan.33 The debt product can still
involve an annual escalator.34 In 2014-15, SolarCity introduced but ultimately disbanded a solar
loan product, MyPower.35 The company debuted a new loan product in May 2016 that will be
available in 14 states.36
Property Assessed Clean Energy (PACE): PACE finance takes a different approach than
leases/PPA or loans. More akin to a home equity loan, PACE customers receive solar or, more
commonly, energy efficiency installations. Companies and municipalities structure municipal
bonds to repay the capex on the installations, so that the “no money down” proposition is still
attractive to potential customers. PACE households then repay the bonds, which are secured by
the home, via annual tax assessments over approximately 15 years. Regulatory hurdles have
existed in the residential PACE market since its inception. However, the Federal Housing and
Finance Agency (FHFA) recently ruled that PACE bonds have a primary lien on the home,
resolving uncertainty around residential PACE’s seniority to U.S. government-backed home
equity loans.37 Unlike the other forms of financing, PACE has an important constraint: it is
limited to municipalities with programs in place. Estimates of the residential PACE market
range, but industry sources point toward $1.7 billion and over 82,000 home installations to
date.38 Over 80 percent of installations are in energy efficiency rather than solar, and the sector
31 Feldman, Boff, and Margolis, “SunShot Initiative Q3/Q4 2015 Solar Industry Update,” 24. 32 For example, see “Solar City 2015 Analyst Day Report.” 33 Tweed, “SolarCity Kills Its MyPower Loan Product.” 34 Ibid. 35 Ibid.; Trabish, “SolarCity Moves Away from Its MyPower Solar Loan Product.” 36 “SolarCity Launches Solar Loan Program in 14 States.” 37 Golding, “Guidance for Use of FHA Financing on Homes with Existing PACE Liens and Flexible Underwriting through Energy Department’s Home Energy Score.” 38 PACENation, “Residential PACE.”

8
is growing.39 Major PACE providers include Renovate America, Renew Financial, and Ygrene.
These companies have completed at least seven public securitizations.40
From 2007 to 2015, third-party owned solar grew to reach almost 70 percent of total residential
installations. The compound annual growth rates for California, Massachusetts, Maryland, and
Arizona are 22, 31, 36, and 36 percent, respectively.
41
The Solar Provider: Managing the Value Streams of Solar-as-a-Service
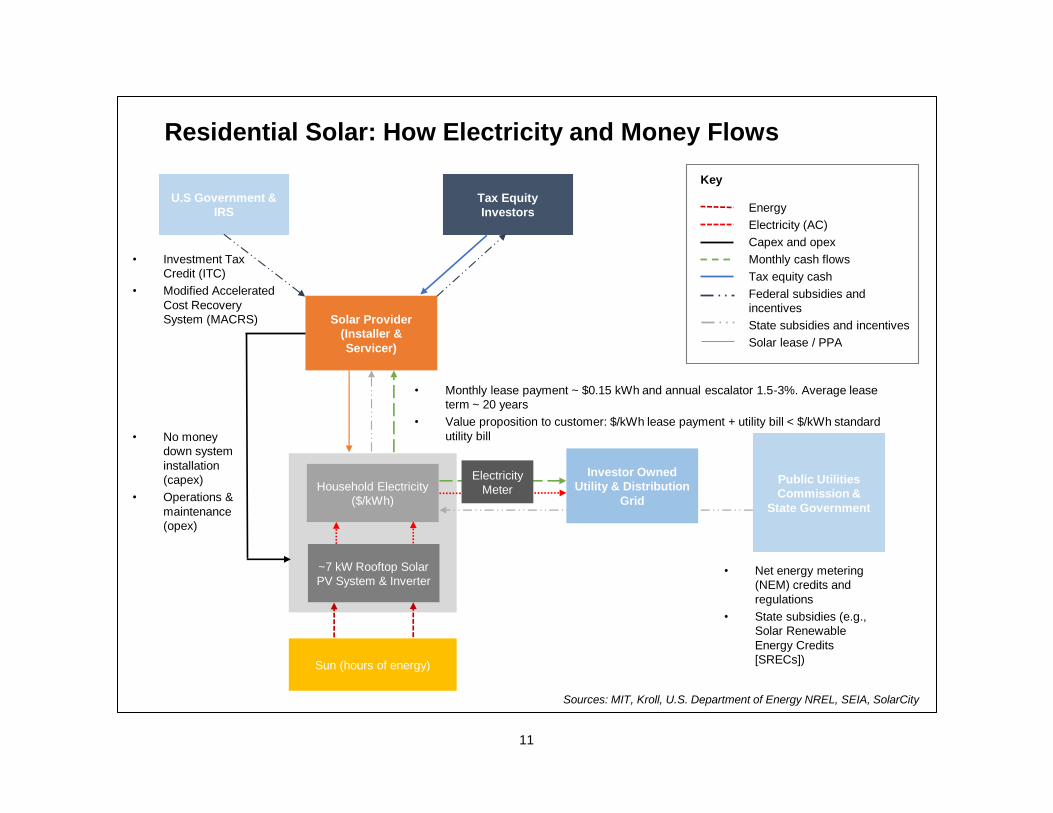
In the lease/PPA model, solar providers must constantly manage three primary flows of cash
and incentives to create value: (i) contracted payments with households (ii) state credits for the
electricity produced, and (iii) federal government tax credits and the investors in them.
Examining the three value streams of residential solar further elucidates the ingenuity of the
business model but also demonstrates the risks that solar providers must manage.
First, households sign leases/PPAs with solar providers for the “no money down” rooftop
systems and begin to make monthly payments. The lease rates range, but average around
$0.15/kWh over twenty years, with an annual increase, or “escalator,” of 1 to 3 percent to
address rising electricity prices.42 The roof-mounted photovoltaic panels and inverters convert
hours of energy from the sun into electricity (kWh), which is priced according to the prevailing
39 Ibid. 40 The PACE market has witnessed a number of successful securitizations to date and rapid growth in general. This article, however, focuses specifically on solar lease/PPA and loan securitizations. 41 Feldman, Boff, and Margolis, “SunShot Initiative Q3/Q4 2015 Solar Industry Update,” 26. 42 “Solar City 2015 Analyst Day Report.”
0%
10%
20%
30%
40%
50%
60%
70%
80%
90%
100%
2007 2008 2009 2010 2011 2012 2013 2014 2015
Pe
rce
nt o
f In
sta
lled
Ca
pa
city
Solar Third-Party Owernship Model by State
Average CA AZ MA MD NJ NY
9
utility rate ($/kWh). Well-sited solar installations in turn ought to provide contracted, long-term
cash flows to solar providers.
Second, households still pay monthly electricity bills to their local utility, but do so at a lower rate
than without the system. In fact, this delta between the utility rate for electricity without solar and
the rate with solar provides the primary value proposition for households. Electricity use is
metered at the household level according to volumetric tariffs ($/kWh), meaning that rooftop
solar installations can become both load (i.e., demand) and generation.43 If the household
produces more energy than it consumes, particularly common during peak hours of sunlight that
do not correspond to peak load, then it will only be charged for the “net” energy use i.e., the total
consumed less the total produced. (We discuss this controversial policy below.) State public
utilities commissions determine the credits that ratepayers can claim, so the rates vary state-by-
state. Solar Renewable Energy Credits (SRECs) provide another incentive and also differ
across the country. SCECs are credits for MWhs of solar energy produced that can be bought
and sold on exchanges, allowing utilities to comply with state-level Renewable Portfolio
Standards.44
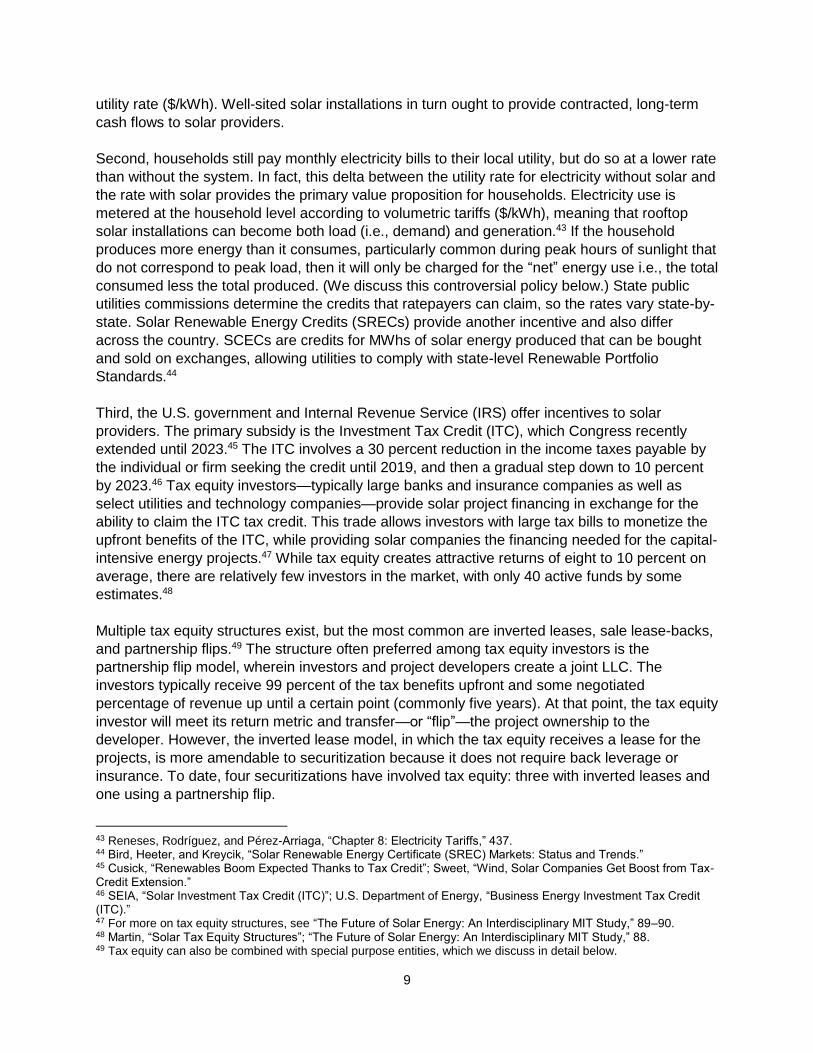
Third, the U.S. government and Internal Revenue Service (IRS) offer incentives to solar
providers. The primary subsidy is the Investment Tax Credit (ITC), which Congress recently
extended until 2023.45 The ITC involves a 30 percent reduction in the income taxes payable by
the individual or firm seeking the credit until 2019, and then a gradual step down to 10 percent
by 2023.46 Tax equity investors—typically large banks and insurance companies as well as
select utilities and technology companies—provide solar project financing in exchange for the
ability to claim the ITC tax credit. This trade allows investors with large tax bills to monetize the
upfront benefits of the ITC, while providing solar companies the financing needed for the capital-
intensive energy projects.47 While tax equity creates attractive returns of eight to 10 percent on
average, there are relatively few investors in the market, with only 40 active funds by some
estimates.48
Multiple tax equity structures exist, but the most common are inverted leases, sale lease-backs,
and partnership flips.49 The structure often preferred among tax equity investors is the
partnership flip model, wherein investors and project developers create a joint LLC. The
investors typically receive 99 percent of the tax benefits upfront and some negotiated
percentage of revenue up until a certain point (commonly five years). At that point, the tax equity
investor will meet its return metric and transfer—or “flip”—the project ownership to the
developer. However, the inverted lease model, in which the tax equity receives a lease for the
projects, is more amendable to securitization because it does not require back leverage or
insurance. To date, four securitizations have involved tax equity: three with inverted leases and
one using a partnership flip.
43 Reneses, Rodríguez, and Pérez-Arriaga, “Chapter 8: Electricity Tariffs,” 437. 44 Bird, Heeter, and Kreycik, “Solar Renewable Energy Certificate (SREC) Markets: Status and Trends.” 45 Cusick, “Renewables Boom Expected Thanks to Tax Credit”; Sweet, “Wind, Solar Companies Get Boost from Tax-Credit Extension.” 46 SEIA, “Solar Investment Tax Credit (ITC)”; U.S. Department of Energy, “Business Energy Investment Tax Credit (ITC).” 47 For more on tax equity structures, see “The Future of Solar Energy: An Interdisciplinary MIT Study,” 89–90. 48 Martin, “Solar Tax Equity Structures”; “The Future of Solar Energy: An Interdisciplinary MIT Study,” 88. 49 Tax equity can also be combined with special purpose entities, which we discuss in detail below.

10
The other form of federal subsidy provided to solar providers is the Modified Accelerated Cost
Recovery System (MACRS). Compared to straight-line depreciation, MACRS allows companies
to depreciate solar rooftop assets over five years and deduct up to 85 percent of the cost.50 By
reducing the useful life assumption of the assets, MACRS materially increases the value of the
tax shield from depreciation.51
The flows of incentives and customer payments combine to make the third-party owned
business model an attractive value proposition to households. However, they also introduce
complexity and risk: the solar provider has to manage all three value streams simultaneously,
each of which presents a unique set of challenges and time horizons. Federal policies and state
regulations are difficult to predict let alone influence. The business model can be particularly
susceptible to exogenous shocks in the form of policy and regulation. In addition, managing the
customer relationship, including the associated credit and technology risks, presents other
challenges.
Residential solar providers also face nearer-term financing issues. Existing sources of capital—
primarily tax equity investors and bank loans—are limited. Further, a high cost of capital
presents a material concern for solar providers seeking not only growth but also cash flow
positive operations.
50 Mendelsohn, “Will Solar Projects Need Tax Equity in the Future? Yes, but Baby Steps toward Securitization Improve the Situation”; Martin, “Solar Tax Equity Structures”; “The Future of Solar Energy: An Interdisciplinary MIT Study.” 51 Mendelsohn, “Will Solar Projects Need Tax Equity in the Future? Yes, but Baby Steps toward Securitization Improve the Situation.”
11
Residential Solar: How Electricity and Money Flows
Solar Provider
(Installer &
Servicer)
Household Electricity
($/kWh)
• Energy
• Electricity (AC)
• Capex and opex
• Monthly cash flows
• Tax equity cash
• Federal subsidies and
incentives
• State subsidies and incentives
• Solar lease / PPA
~7 kW Rooftop Solar
PV System & Inverter
• No money
down system
installation
(capex)
• Operations &
maintenance
(opex)
• Monthly lease payment ~ $0.15 kWh and annual escalator 1.5-3%. Average lease
term ~ 20 years
• Value proposition to customer: $/kWh lease payment + utility bill < $/kWh standard
utility bill
• Net energy metering
(NEM) credits and
regulations
• State subsidies (e.g.,
Solar Renewable
Energy Credits
[SRECs])
Public Utilities
Commission &
State Government
Investor Owned
Utility & Distribution
Grid
Electricity
Meter
U.S Government &
IRS
• Investment Tax
Credit (ITC)
• Modified Accelerated
Cost Recovery
System (MACRS)
Sun (hours of energy)
Tax Equity
Investors
Key
Sources: MIT, Kroll, U.S. Department of Energy NREL, SEIA, SolarCity

12
Solar Securitization: Market Overview and Mechanics
The U.S. Asset Backed Security (ABS) Market
The U.S. mortgage market is perhaps the most well-known ABS segment. The subset of it
focused on lower rated sub-prime borrowers is even more familiar: it was a primary driver of the
2007-8 financial crisis. The total U.S. ABS market is much larger and diverse, however. In 2015,
outstanding ABS totaled $1.4 trillion.52 Securitizations extend beyond home equity loans, too.
Student debt, auto loans, and credit cards accounted for $200, $190, and $129 billion in
outstanding securities in 2015. 53 “Esoteric” securitizations also abound, including everything
from the franchise royalties of Domino’s Pizza to T Mobile’s iPhone contract receivables.54 If
assets have steady cash flows and reasonable credit risks, securitization is not uncommon.
How Solar Securitization Works
Securitization is a form of off-balance sheet debt financing. An originator of ABS bundles its
cash-producing assets into a special purpose entity that is protected from potential bankruptcy
claims. Rating agencies assess the pooled assets according to the probability of default (e.g.,
AAA, BBB+, etc.) and may provide guidelines to multiple tranches with different risk/reward
profiles. The issuer, which is owned by the originator, then offers securities to fixed income
investors seeking yield.55 The ABS investors receive the interest payments, benefitting from the
fact that the securities are pooled, tranched, and rated. The larger the pool, the more risk
diversification in theory.56 These credit enhancements also reduce the concentration of default
risk and performance issues.57 The originator in turn receives the ABS principal at theoretically
lower yields than would be possible in corporate debt markets or via bank loans.
The concept of securitizing residential solar assets is not new. Since 2010 and even before,
researchers and esoteric ABS investors have examined ways to pool solar installations and sell
the securities on the secondary market. In 2012, the U.S. Department of Energy and the
National Renewable Energy Laboratory (NREL) created the Solar Access to Public Capital
project to analyze securitization.58 The working group brought together attorneys, ratings
agencies, developers, tax consultants and others to develop a mock securitization, complete
with cash flow scenarios under different stress tests.59
52 “Securities Industry and Financial Markets Association (SIFMA) Statistics - U.S. ABS Issuance and Outstanding.” 53 Ibid. 54 “Domino’s Pizza Completes Recapitalization; Declares $3 Per Share Special Dividend”; Scully and Moritz, “IPhones Go From T-Mobile Loss Leader to New Source of Cash.” 55 Feldman and Lowder, “Banking on Solar: An Analysis of Banking Opportunities in the U.S. Distributed Photovoltaic Market”; Mendelsohn and Feldman, “Financing U.S. Renewable Energy Projects Through Public Capital Vehicles: Qualitative and Quantitative Benefits.” 56 DeMarzo, “The Pooling and Tranching of Securities: A Model of Informed Intermediation,” 3. 57 Mendelsohn and Joshi, “Credit Enhancements and Capital Markets to Fund Solar Deployment: Leveraging Public Funds to Open Private Sector Investment,” 6; DeMarzo, “The Pooling and Tranching of Securities: A Model of Informed Intermediation.” 58 Mendelsohn et al., “The Solar Access to Public Capital (SAPC) Mock Securitization Project.” 59 Ibid.

13
The solar ABS transactions to date adhere to the general framework of most securitizations,
with some important exceptions. Solar ABS use a standard legal structure—the special purpose
entity—to combine thousands of rooftop solar systems generating monthly cash flows.60
Importantly, the special purpose entity is a limited liability company, which is designed to
mitigate bankruptcy risk between the solar provider (the originator) and the issuer of the solar
ABS.61 The special purpose entity then issues new debt securities based on the cash flows from
the solar leases/PPAs or loan payments.62 Fixed income investors buy the solar ABS and
receive the interest payments. The solar providers in turn receive debt financing at relatively low
costs. The low yield is particularly important given the capital intensity of the residential solar
business. With cheaper financing from securitizations, solar providers hope to generate better
cash flows and deploy more systems than would otherwise be the case.
While solar securitization shares many similarities with other ABS, the structures have two
specific nuances.63 First, tax equity investors are crucial because solar providers need to
monetize the ITC. However, tax equity’s role in, and capital structure position among other
investors, becomes more complicated during solar securitizations. Whereas tax equity investors
are usually the senior claimants on the cash flows from the projects, securitization involves
another class of investor seeking equally predictable returns: fixed income. Below we discuss
the complications of tax equity investors and securitization, including what it may mean for the
asset class and solar deployment writ large.
60 Gorton and Souleles, “Special Purpose Vehicles and Securitization.” 61 Mendelsohn et al., “The Solar Access to Public Capital (SAPC) Mock Securitization Project,” 40. 62 Tax equity structures make this more complicated, which we discuss below. 63 Actual solar securitization legal structures are more complex, owing to the need for additional, transaction-specific credit enhancements and risk mitigation strategies via legal structures. For instance, solar securitizations typically involve other entities (servicers), additional contracts (operations and maintenance agreements), and payments held in escrow. The below representation of a solar securitization is for illustrative purposes only. Inverted lease structures and partnership flips are more complex. For more information on past and future solar ABS structures, see Mendelsohn et al., “The Solar Access to Public Capital (SAPC) Mock Securitization Project,” 7-9.

14
Key
• Energy
• Electricity (AC)
• ABS securities
• ABS proceeds
• Solar lease/PPA cash flows
• Tax equity cash
• Tax benefits
Legal firewall
Solar ABS – Basic Structure
Household
Electricity ($/kWh)
~7 kW Rooftop
Solar PV System &
Inverter
Sun (hours of energy)
Household
Electricity ($/kWh)
~7 kW Rooftop
Solar PV System &
Inverter
Sun (hours of energy)
Household
Electricity ($/kWh)
~7 kW Rooftop
Solar PV System &
Inverter
Sun (hours of energy)
Household
Electricity ($/kWh)
~7 kW Rooftop
Solar PV System &
Inverter
Sun (hours of energy)
Household
Electricity ($/kWh)
~7 kW Rooftop
Solar PV System &
Inverter
Sun (hours of energy)
Household
Electricity ($/kWh)
~7 kW Rooftop
Solar PV System &
Inverter
Sun (hours of energy)
…
~ 7,000 –
17,000
PV
systems
in
pool
Special Purpose Entity
(Issuer, 100% owned by
Originator)
Fixed Income
Investors
(A&B Tranches)
Pooling & Tranching of Monthly Lease/PPA Cash Flows
Tax Equity
Investors
Off-Balance Sheet Financing
Solar Provider
(Originator)
Sources: Kroll, U.S. Department of Energy NREL, SEIA, SolarCity, Marathon Capital, MIT

15
Another feature of solar securitizations is their liquidity, or lack thereof. There is little trading of existing solar ABS, indicating a “buy and hold” strategy from institutional investors.64 The exact number of existing solar ABS investors is not public, but the available data point to relatively small numbers. For instance, Sunrun’s only securitization involved 19 investors according to company presentations.65 Solar ABS are, after all, esoteric and relatively small, with no issuances above $202 million to date. Understanding the residential solar asset class takes time, and that opportunity cost may dissuade new entrants from buying the securities.
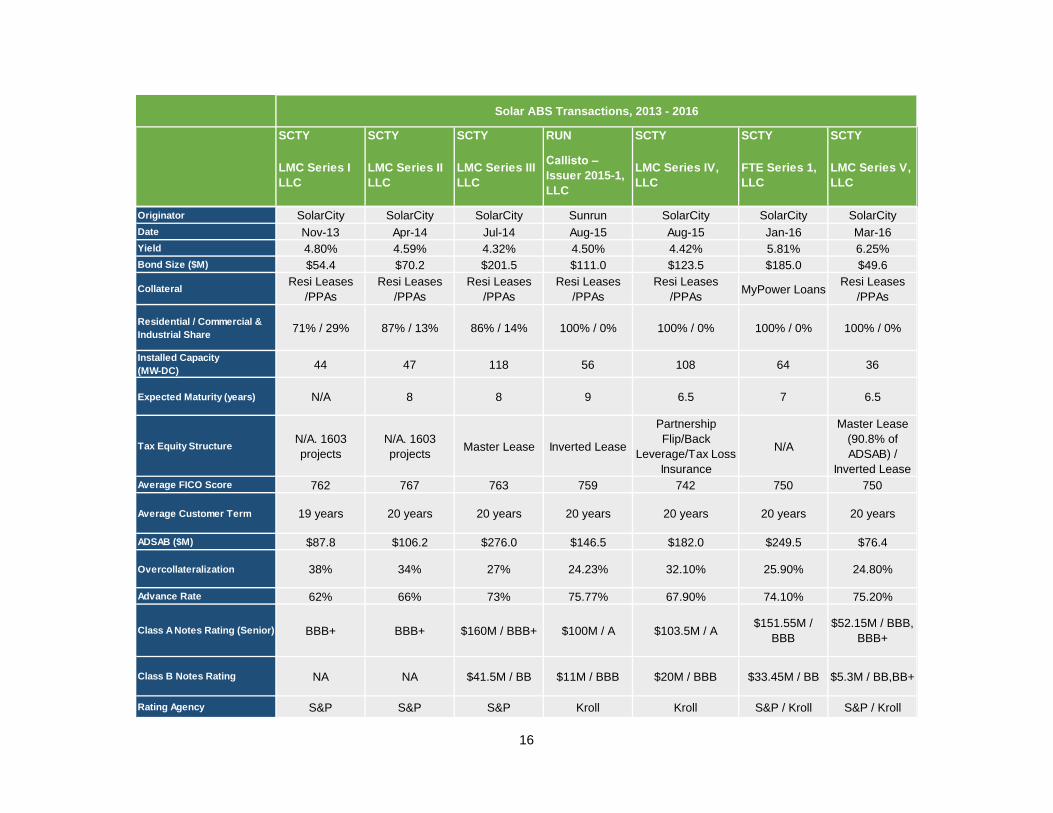
Residential Solar Asset Backed Securities (ABS) to Date
There have been seven securitizations to date, excluding those in the PACE market. The table
below outlines the main features of each transaction.66
64 For instance, SolarCity LMC Series I and both tranches of SolarCity LMC Series V have no history of trading. Investors have not executed additional trades on the A tranches of Sunrun Callisto nor the B tranches of SolarCity LMC Series IV. FINRA, “Bond Detail: SOLARCITY LMC SERIES I LLC (CUSIP 83417BAA6)”; FINRA, “Bond Detail: Sunrun Callisto, A Tranche (CUSIP 86771YAA9)”; FINRA, “Bond Detail: SOLARCITY LMC SER IV LLC, B Tranche (CUSIP 83417PAB3)”; FINRA, “Bond Detail: SOLARCITY LMC SER V LLC, A Tranche (CUSIP 83417WAA0)”; FINRA, “Bond Detail: SOLARCITY LMC SER V LLC, B Tranche (CUSIP 83417WAA0).” 65 Sunrun, “28th Annual ROTH Conference.” 66 Sources include: Borod, “The A -> Z of Solar Deals Done to Date”; Standard & Poor’s, “SolarCity LMC Series I LLC (Series 2013-1) Presale Report”; Brandt, Grant, and Cornfeld, “The Solar Securitization Opportunity”; Kroll Bond Rating Agency (KBRA), “SolarCity FTE Series 1, LLC, Series 2016-A ABS New Issue Report”; Kroll Bond Rating Agency (KBRA), “SolarCity LMC Series IV, LLC, Series 2015-1 ABS New Issue Report”; Kroll Bond Rating Agency (KBRA), “SolarCity LMC Series V, LLC, Series 2016-1 ABS New Issue Report”; Kroll Bond Rating Agency (KBRA), “Sunrun Callisto Issuer 2015-1, LLC, Series 2015-1 -.” When applicable, “Yield” refers to the weighted average yield between both tranches. Regarding tax equity structures, SCTY LMC Series I and Series II used the U.S. Treasury’s 1603 grant program, which began as part of the 2009 Recovery Act and expired in 2011. (Projects constructed before that date were still eligible for funding.) Instead of using the ITC, 1603 awarded project grants for up to 30 percent of the installation’s cost. See U.S. Treasury Department, “1603 Program: Payments for Specified Energy Property in Lieu of Tax Credits”; SEIA, “1603 Treasury Program.” Advance rates are the net present value of the contracted solar cash flows, or aggregate solar discount asset balance (ADSAB), as a percentage of the total debt raised. Put another way, the advance rate is the inverse of overcollaterization. We discuss both metrics below. Expected maturity is the date representing a reasonable projection of future cash flows according to the sponsor and its representatives. This date differs from the longer “legal final maturity” determined by the rating agencies.
16
SCTY SCTY SCTY RUN SCTY SCTY SCTY
LMC Series I
LLC
LMC Series II
LLC
LMC Series III
LLC
Callisto –
Issuer 2015-1,
LLC
LMC Series IV,
LLC
FTE Series 1,
LLC
LMC Series V,
LLC
Originator SolarCity SolarCity SolarCity Sunrun SolarCity SolarCity SolarCity
Date Nov-13 Apr-14 Jul-14 Aug-15 Aug-15 Jan-16 Mar-16
Yield 4.80% 4.59% 4.32% 4.50% 4.42% 5.81% 6.25%
Bond Size ($M) $54.4 $70.2 $201.5 $111.0 $123.5 $185.0 $49.6
CollateralResi Leases
/PPAs
Resi Leases
/PPAs
Resi Leases
/PPAs
Resi Leases
/PPAs
Resi Leases
/PPAsMyPower Loans
Resi Leases
/PPAs
Residential / Commercial &
Industrial Share71% / 29% 87% / 13% 86% / 14% 100% / 0% 100% / 0% 100% / 0% 100% / 0%
Installed Capacity
(MW-DC)44 47 118 56 108 64 36
Expected Maturity (years) N/A 8 8 9 6.5 7 6.5
Tax Equity StructureN/A. 1603
projects
N/A. 1603
projectsMaster Lease Inverted Lease
Partnership
Flip/Back
Leverage/Tax Loss
Insurance
N/A
Master Lease
(90.8% of
ADSAB) /
Inverted Lease
Average FICO Score 762 767 763 759 742 750 750
Average Customer Term 19 years 20 years 20 years 20 years 20 years 20 years 20 years
ADSAB ($M) $87.8 $106.2 $276.0 $146.5 $182.0 $249.5 $76.4
Overcollateralization 38% 34% 27% 24.23% 32.10% 25.90% 24.80%
Advance Rate 62% 66% 73% 75.77% 67.90% 74.10% 75.20%
Rating Agency S&P S&P S&P Kroll Kroll S&P / Kroll S&P / Kroll
$52.15M / BBB,
BBB+
Solar ABS Transactions, 2013 - 2016
$33.45M / BB $5.3M / BB,BB+
Class A Notes Rating (Senior) BBB+ BBB+
Class B Notes Rating NA NA $41.5M / BB $11M / BBB $20M / BBB
$160M / BBB+ $100M / A $103.5M / A$151.55M /
BBB

17
Sizing the Solar Securitization Market
No analyses to date examine solar ABS vis-à-vis the total installed capacity of the U.S.
residential solar market. However, doing so provides an important view of the market’s scale. As
of the last securitization in March 2016, we estimate the residential installed capacity of
securitized assets to be 438 MWs.67 SolarCity has securitized approximately 382 MWs and
Sunrun 56 MWs, or approximately 87 and 13 percent of the existing residential securitization
market by installed capacity, respectively. (SolarCity has the largest number of assets deployed
in U.S. residential solar, with an estimated 44 percent of market share in 2015.68) Whereas
SolarCity has securitized 330 MWs of residential assets, Sunrun and Vivint installed 596 MWs
and 459 MWs of total capacity, respectively, by the fourth quarter of 2015.69
GTM Research and the Solar Energy Industries Association (SEIA) estimated the total installed
capacity for residential solar was 5,605 MWs at the end of calendar year 2015.70 We can also
approximate the total installations through a bottom up analysis of SEC filings from SolarCity
(1,945 MWs), Sunrun (596 MWs), and Vivint (459 MWs) coupled with some general market
share data, which yields approximately 5,300 MWs.71 If we conservatively assume 5,605 MWs
of total installed capacity in the U.S. residential solar market by March 2016 (the date of the last
transaction), we estimate approximately 7 percent of existing installations have been
securitized. Further, annual installations have far outpaced securitizations of the assets.
Sizing the Solar Securitization Market, 2013-2016E 2013 2014 2015 2016E Annual Residential Solar Installations
(MW-DC)
800
1,300
2,100
2,750
Total Residential Solar Installations
(MW-DC) 1,800 3,100 5,200 7,950
Total Residential Assets Securitized
(MW-DC)
31
142
164
-
Securitized Assets, % of
Total Installations
1.74%
4.59%
3.15%
-
Solar Securitizations, % of Total U.S. ABS New Issuances
0.03% 0.13% 0.12% -
72
67 MIT analysis using company filings and industry reports. 68 Feldman, Boff, and Margolis, “SunShot Initiative Q4 2015/Q1 2016 Solar Industry Update,” 26. 69 SolarCity, “SolarCity Corporation Form 10-K 2015,” 47; Vivint, “Vivint Form 10-K 2015,” 4; Sunrun, “2015 Q4 Review,” 17. 70 GTM Research / SEIA, “U.S. Solar Market Insight 2015: Year in Review.” 71 “SolarCity Corp - Form 10-K 2015,” 47; Vivint, “Vivint Form 10-K 2015,” 4; Sunrun, “2015 Q4 Review,” 17; Feldman, Boff, and Margolis, “SunShot Initiative Q4 2015/Q1 2016 Solar Industry Update,” 26. 72 2016 securitizations total approximately 100 MWs to date. No projection is made for the remainder of the year, however. Feldman, Boff, and Margolis, “SunShot Initiative Q4 2015/Q1 2016 Solar Industry Update,” 23; Borod, “The A -> Z of Solar Deals Done to Date.” “Securities Industry and Financial Markets Association (SIFMA) Statistics - U.S. ABS Issuance and Outstanding”

18
Compared to the entire U.S. ABS market, solar securitizations are also minor. The amount of
money issued during solar ABS transactions in each year from 2013 to 2015 has barely surpassed
a tenth of one percent of total annual new ABS issuances.73
The residential solar industry also operates in a handful of core states. As a result, existing
securitizations have little geographic diversity. Approximately 75 percent of the total assets
across all securitizations are located in California. The top three states—California, Colorado,
and Arizona—account for 75 to 95 percent of total assets in the last three transactions alone. 74
We can attribute the geographic focus to the high installed capacities of residential solar in
those regions, creating a larger pool of assets to securitize than in other markets.
The Opportunities and Challenges of Solar Securitization The excitement around solar securitization is well placed in certain respects. The off-balance sheet financing option has distinct advantages for both sides of the market.
Opportunities
Capital for Solar Providers Securitizations present at least three main benefits for solar providers. First, increasing the investor base for solar allows the companies to diversify their sources of capital. A new means to raise debt is particularly important given the asset intensity of the rooftop solar business. Until the business model shifts, solar providers will need to tap all available sources of financing. Second, securitization allows the solar providers to use legal structures to create vehicles that do not, in principle, impact their balance sheets.75 This bankruptcy protection is important for companies’ real and perceived leverage. Lastly, creating longer term financing structures with lower costs of capital allows solar providers to generate greater value, all things being equal. The debt ratings and yields are also important market signals about the quality and risk of the underlying solar assets. Given that the major solar providers have yet to achieve consistent profitability, finding attractive financing rates is important for the bankability of projects and for broader market perceptions. Returns for ABS Investors & Shareholders Fixed income investors who buy the securities also benefit from solar securitization. The bonds
have yields and maturities that match the profiles of many institutional investors’ portfolios.
Further, the assets’ cash flows are at least partially determined by a source that has virtually no
risk of failing: the sun. (Probabilistic models and satellite data determine the expected solar
73 “Securities Industry and Financial Markets Association (SIFMA) Statistics - U.S. ABS Issuance and Outstanding”; Borod, “The A -> Z of Solar Deals Done to Date”; Brandt, Grant, and Cornfeld, “The Solar Securitization Opportunity.” 74 Kroll Bond Rating Agency (KBRA), “The Credit Implications of Changes to Net Metering Rules.” 75 Stone and Zissu, The Securitization Markets Handbook: Structures and Dynamics of Mortgage- and Asset-Backed Securities, Second Edition; Mendelsohn et al., “The Solar Access to Public Capital (SAPC) Mock Securitization
Project”; Mendelsohn and Feldman, “Financing U.S. Renewable Energy Projects Through Public Capital Vehicles: Qualitative and Quantitative Benefits”; Lowder and Mendelsohn, “The Potential Securitization of Solar PV Finance.”

19
energy production of the asset pool.76) The degree to which solar energy, and by extension
solar ABS, provides portfolio diversification is a topic beyond the scope of this paper. However,
it is worth noting a common perception: the ability of the underlying assets to generate electricity
(i.e., the primary driver of the cash flows) has no correlation with broader equity and debt
markets, which makes the asset class uniquely appealing. In addition, since the underlying
assets are renewable energy, solar securitization aligns with the recent focus on environmental,
social, and governance (ESG) investing.
Securitization can also unlock value for solar providers’ public shareholders, albeit in ways that are difficult to quantify in aggregate. Because the financing may provide a better chance for companies to reach profitability, securitization should improve overall performance, which in turn should lead to appreciating share prices and/or dividends, all else equal. As leading solar providers face pressure from Wall Street analysts to generate earnings, solar securitization presents a novel form of financing that could increase shareholder value in the long term, too.
Challenges
Despite the attractiveness of solar ABS, challenges remain. These include the impact on market
dynamics and known macro risks. In addition, existing technological and regulatory hurdles to
the underlying solar business models could pose problems.
Limited Impact on Existing Market Dynamics
One could assume that a lower cost of capital and greater access to institutional investors would
spur growth of solar providers and perhaps introduce more competition among them. However,
solar securitization is unlikely to encourage new entrants or alter market share among existing
players. Three companies control approximately half of the U.S. residential market.77 Further,
prices for lease installations do not yet approximate the installed costs of the systems.78
Advantageous financing does not directly impact prices that consumers pay for systems. Thus,
the primary benefit of solar ABS has been, and will be, profitability for major solar providers
rather than increasing competition in the market.
Macro Risks to Issuers and Investors While securitization allows solar providers access to new debt markets, it also exposes them to
new types of risks as issuers. General market conditions and underlying interest rates pose two
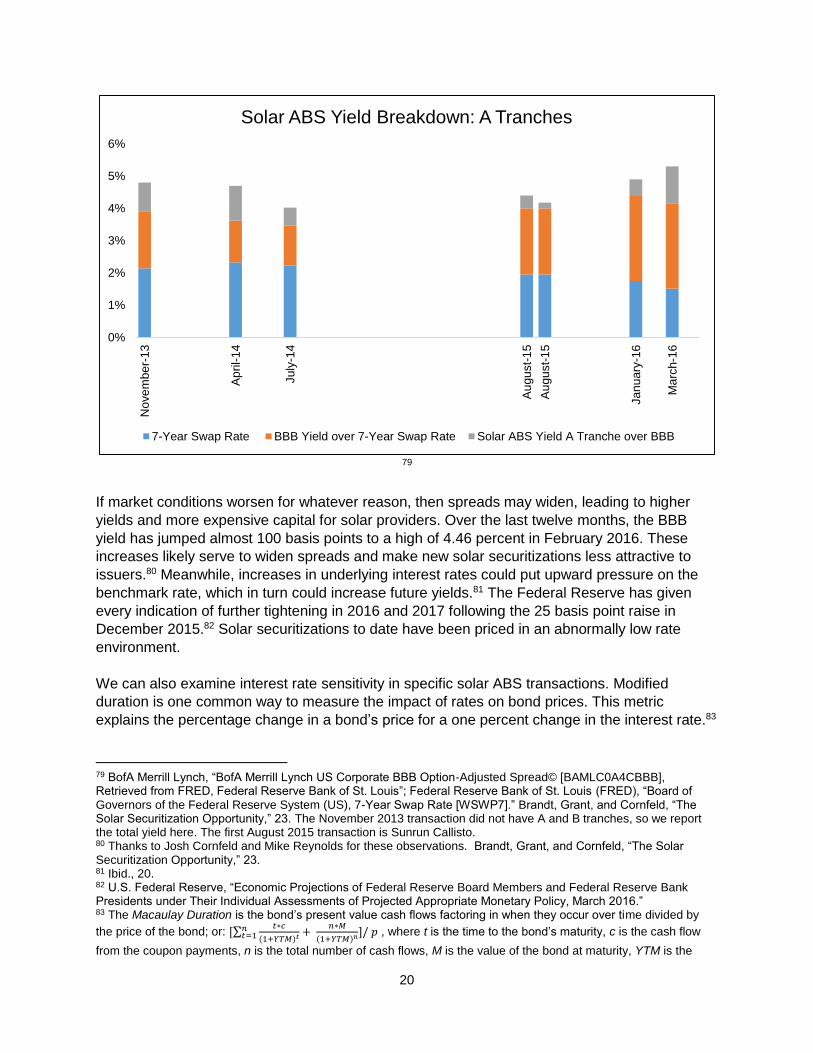
such challenges to every transaction. The yield for each solar ABS tranche is priced relative to a
benchmark rate, in this case 7-year swaps, and an appropriate credit spread based on
corporate debt ratings (i.e., BB for B tranches and BBB for A tranches).
76 For more on production modelling, see Kroll Bond Rating Agency (KBRA), “Sunrun Callisto Issuer 2015-1, LLC, Series 2015-1 -”; Kroll Bond Rating Agency (KBRA), “SolarCity LMC Series V, LLC, Series 2016-1 ABS New Issue Report.” 77 Feldman, Boff, and Margolis, “SunShot Initiative Q4 2015/Q1 2016 Solar Industry Update,” 26. 78 “The Future of Solar Energy: An Interdisciplinary MIT Study,” 86; 95-96.
20
79
If market conditions worsen for whatever reason, then spreads may widen, leading to higher
yields and more expensive capital for solar providers. Over the last twelve months, the BBB
yield has jumped almost 100 basis points to a high of 4.46 percent in February 2016. These
increases likely serve to widen spreads and make new solar securitizations less attractive to
issuers.80 Meanwhile, increases in underlying interest rates could put upward pressure on the
benchmark rate, which in turn could increase future yields.81 The Federal Reserve has given
every indication of further tightening in 2016 and 2017 following the 25 basis point raise in
December 2015.82 Solar securitizations to date have been priced in an abnormally low rate
environment.
We can also examine interest rate sensitivity in specific solar ABS transactions. Modified
duration is one common way to measure the impact of rates on bond prices. This metric
explains the percentage change in a bond’s price for a one percent change in the interest rate.83
79 BofA Merrill Lynch, “BofA Merrill Lynch US Corporate BBB Option-Adjusted Spread© [BAMLC0A4CBBB], Retrieved from FRED, Federal Reserve Bank of St. Louis”; Federal Reserve Bank of St. Louis (FRED), “Board of Governors of the Federal Reserve System (US), 7-Year Swap Rate [WSWP7].” Brandt, Grant, and Cornfeld, “The Solar Securitization Opportunity,” 23. The November 2013 transaction did not have A and B tranches, so we report the total yield here. The first August 2015 transaction is Sunrun Callisto. 80 Thanks to Josh Cornfeld and Mike Reynolds for these observations. Brandt, Grant, and Cornfeld, “The Solar Securitization Opportunity,” 23. 81 Ibid., 20. 82 U.S. Federal Reserve, “Economic Projections of Federal Reserve Board Members and Federal Reserve Bank Presidents under Their Individual Assessments of Projected Appropriate Monetary Policy, March 2016.” 83 The Macaulay Duration is the bond’s present value cash flows factoring in when they occur over time divided by
the price of the bond; or: [∑𝑡∗𝑐
(1+𝑌𝑇𝑀)𝑡 + 𝑛∗𝑀
(1+𝑌𝑇𝑀)𝑛]/ 𝑝𝑛𝑡=1 , where t is the time to the bond’s maturity, c is the cash flow
from the coupon payments, n is the total number of cash flows, M is the value of the bond at maturity, YTM is the
0%
1%
2%
3%
4%
5%
6%N
ove
mbe
r-1
3
Ap
ril-
14
July
-14
Au
gu
st-
15
Au
gu
st-
15
Jan
uary
-16
Ma
rch-1
6
Solar ABS Yield Breakdown: A Tranches
7-Year Swap Rate BBB Yield over 7-Year Swap Rate Solar ABS Yield A Tranche over BBB
21
For instance, since yield and price are inversely related, a bond with a modified duration of five
indicates that a one percent increase (100 basis points) in rates would be associated with a five
percentage decrease in the bond’s price.
Institutional investors can hedge duration through different strategies in their portfolios, so
interest rate risk should not pose a problem in general. However, the modified durations of
recent solar ABS help explain the interest rate sensitives unique to this new, complex asset
class. In particular, examining two similarly timed securitizations from different solar providers in
August 2015—Callisto and LMC Series IV—helps elucidate how duration can differ across solar
ABS.
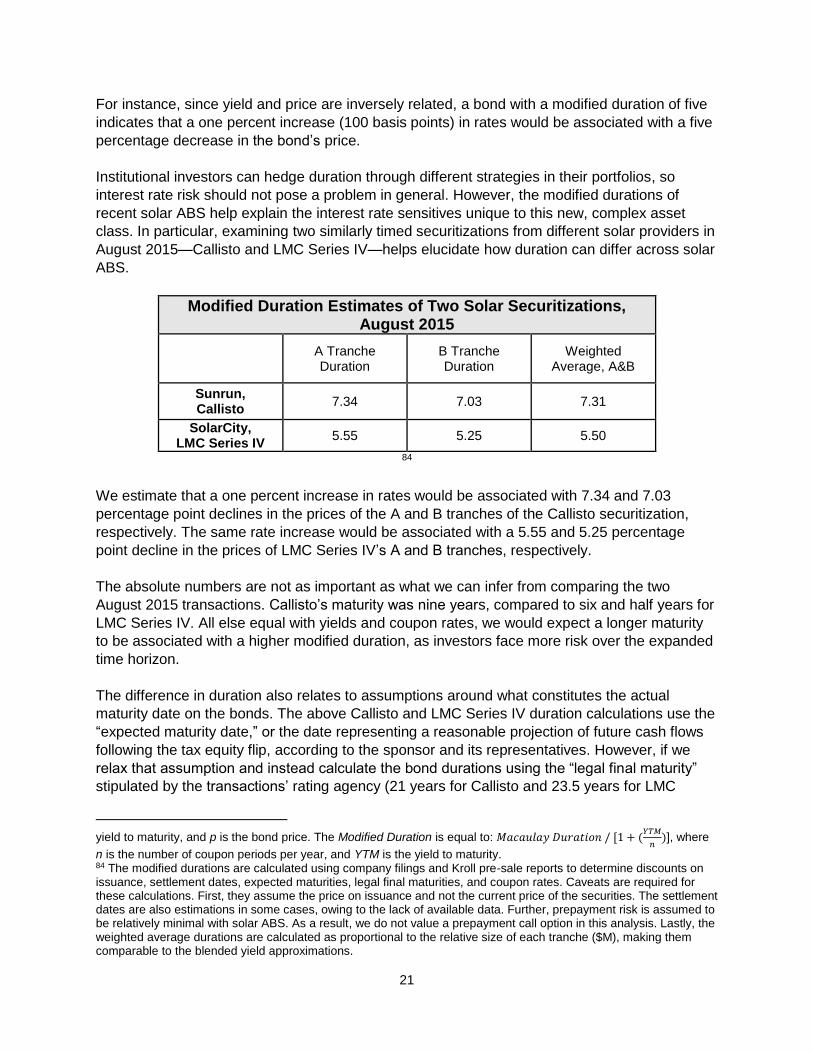
Modified Duration Estimates of Two Solar Securitizations, August 2015
A Tranche Duration
B Tranche Duration
Weighted Average, A&B
Sunrun, Callisto
7.34 7.03 7.31
SolarCity, LMC Series IV
5.55 5.25 5.50
84
We estimate that a one percent increase in rates would be associated with 7.34 and 7.03
percentage point declines in the prices of the A and B tranches of the Callisto securitization,
respectively. The same rate increase would be associated with a 5.55 and 5.25 percentage
point decline in the prices of LMC Series IV’s A and B tranches, respectively.
The absolute numbers are not as important as what we can infer from comparing the two
August 2015 transactions. Callisto’s maturity was nine years, compared to six and half years for
LMC Series IV. All else equal with yields and coupon rates, we would expect a longer maturity
to be associated with a higher modified duration, as investors face more risk over the expanded
time horizon.
The difference in duration also relates to assumptions around what constitutes the actual
maturity date on the bonds. The above Callisto and LMC Series IV duration calculations use the
“expected maturity date,” or the date representing a reasonable projection of future cash flows
following the tax equity flip, according to the sponsor and its representatives. However, if we
relax that assumption and instead calculate the bond durations using the “legal final maturity”
stipulated by the transactions’ rating agency (21 years for Callisto and 23.5 years for LMC
yield to maturity, and p is the bond price. The Modified Duration is equal to: 𝑀𝑎𝑐𝑎𝑢𝑙𝑎𝑦 𝐷𝑢𝑟𝑎𝑡𝑖𝑜𝑛 / [1 + (
𝑌𝑇𝑀
𝑛)], where
n is the number of coupon periods per year, and YTM is the yield to maturity. 84 The modified durations are calculated using company filings and Kroll pre-sale reports to determine discounts on issuance, settlement dates, expected maturities, legal final maturities, and coupon rates. Caveats are required for these calculations. First, they assume the price on issuance and not the current price of the securities. The settlement dates are also estimations in some cases, owing to the lack of available data. Further, prepayment risk is assumed to be relatively minimal with solar ABS. As a result, we do not value a prepayment call option in this analysis. Lastly, the weighted average durations are calculated as proportional to the relative size of each tranche ($M), making them comparable to the blended yield approximations.

22
Series IV), the durations increase to 16.35 and 16.21, respectively. Under that alternative
scenario, a one percent increase in rates is associated with an over 16 percentage point
decrease in price, or two to three times the previous decline in value. While there is no reason a
priori to doubt the expected maturity and assign a later date, this analysis shows that
assumptions around future tax equity transactions and cash flows directly influence interest rate
risk. The data also suggest that not all securitizations are the same; issuers and transaction
structures matter.
Modified Duration Estimates with Different Maturities, August 2015
Weighted Average Expected Maturity
Weighted Average Legal Final Maturity
Sunrun Callisto
7.31 16.35
SolarCity LMC Series IV
5.50 16.21
85
Technology Risks
Solar securitizations’ cash flows depend principally on the production of electricity from the
rooftop solar panels. PV panels and inverter technologies improve on an annual basis, but the
residential business model assumes twenty-year contracted cash flows from the systems. Over
that time horizon, major gains in technology could occur. The subsequent “obsolesce”
concern—that the solar installations will be worthless during some point in the lease—is real but
difficult to quantify.86 Few if any other forms of securitization have the same fundamental
technology risks as solar ABS. Automobile leases, for instance, average 36 months, and there
is an active used car market.87 Appraisals of vehicles and homes are also common. However, in
the event of default, solar providers cannot easily repossess the panels, which have little to no
value after installation. This concern is also born out in the “transfer risk” underlying the third-
party ownership business model.88 When a customer leaves the home, she needs to transfer
the solar contract to the next owner. The process can be complicated, particularly in the event of
death or divorce.89 This risk may be further amplified in the future if, at the time of transfer, new
panel technology in the market will be more efficient and far cheaper than the existing rooftop
assets under the lease.90
85 MIT analysis. 86 Mendelsohn et al., “The Solar Access to Public Capital (SAPC) Mock Securitization Project,” 20; Joshi, “Solar Securitization: Understanding the Risks of Residential Solar Energy-Backed Securities from an Investor Perspective,” 67–69. 87 Manheim, “2016 Used Car Market Report,” 57. 88 Kroll Bond Rating Agency (KBRA), “Evaluating Credit Risks in Solar Securitizations.” 89 For example, see the contract reassignment data from Kroll Bond Rating Agency (KBRA), “SolarCity LMC Series V, LLC, Series 2016-1 ABS New Issue Report,” 17–18. 90 The impact of residential solar on home values and sales is an important topic for further longitudinal, quantitative research. For a recent qualitative perspective, see Arreola, Treadwell, and Hoen, “Survey of Buyers, Sellers and Realtors Involved In San Diego Third-Party Owned Solar Home Transactions – A Qualitative Assessment.”

23
Regulatory Risks and Potential Business Model Impacts State and federal policies have allowed U.S. residential solar to flourish. However, these same incentives and subsidies, if removed or altered, could pose challenges to existing and future securitizations.91 This section examines three primary areas of regulation: changes in utility prices; net metering; and the accounting methods solar providers can use to claim the investment tax credit, or “basis risk”.92
Utility Rates
Assumptions about future utility tariffs underpin the long term value proposition of residential
solar. First, a core expectation of solar providers is that electricity prices ($/kWh) will increase
over the twenty-year period of the lease. As prices continue to rise, lease and loan payments
remain attractive, even with the addition of escalators. However, what if utility rates fall to a level
equal to or perhaps below the contracted payments? How will households respond if the solar
value proposition erodes? The timescale to estimate electricity prices—twenty years, or the
average lease term—introduces added uncertainty into estimating the probability of rate
declines.
Second and more broadly, electricity tariffs may look entirely different in the coming decade and
beyond. A major area of research and regulatory debate centers on residential pricing
structures.93 Real-time pricing—in which consumers face actual price signals for their energy
usage—has proven to be economically sound but politically sensitive.94 A number of behavioral
studies also demonstrate that better price signals may induce demand side management.95
Retail pricing is not just a topic for academia, either. New York State’s ongoing Reforming the
Energy Vision initiative focuses in part on tariff structures, including the potential unbundling of
services to address the value of distributed energy resources like residential solar.96 While we
cannot predict the future of rates or their design, it is fair to assume the likelihood of major
changes over the coming decades is non-zero. The impacts on residential solar and its
subsequent securitization could be material.
91 Rating agencies conduct numerous scenario analyses to forecast cash flows for securitizations under adverse
operating conditions. However, few public analyses model regulatory changes on a specific transaction’s cash flows.
See Kroll Bond Rating Agency (KBRA), “SolarCity FTE Series 1, LLC, Series 2016-A ABS New Issue Report”; Kroll
Bond Rating Agency (KBRA), “SolarCity LMC Series IV, LLC, Series 2015-1 ABS New Issue Report”; Kroll Bond
Rating Agency (KBRA), “SolarCity LMC Series V, LLC, Series 2016-1 ABS New Issue Report”; Kroll Bond Rating
Agency (KBRA), “Sunrun Callisto Issuer 2015-1, LLC, Series 2015-1 -”; ibid.; Mendelsohn et al., “The Solar Access to
Public Capital (SAPC) Mock Securitization Project.” 92 Martin, “Solar Tax Equity Structures.” 93 This is not in fact a new area of research. Interest in dynamic pricing predates the utility restructuring of the 1980s. For example, see Kahn, The Economics of Regulation: Principles and Institutions, Volumes 1-2; Schweppe, Tabors, and Kirtley, “Homeostatic Control: The Utility/Customer Marketplace for Electric Power.” 94 Borenstein, “Effective and Equitable Adoption of Opt-In Residential Dynamic Electricity Pricing”; Borenstein, “The Redistributional Impact of Nonlinear Electricity Pricing”; Borenstein, “Customer Risk from Real-Time Retail Electricity Pricing: Bill Volatility and Hedgability”; Hogan, “Time-of-Use Rates and Real-Time Prices”; Joskow and Wolfram, “Dynamic Pricing of Electricity”; Joskow and Tirole, “Retail Electricity Competition.” 95 Alcott, “Rethinking Real-Time Electricity Pricing”; Wolak, “Do Residential Customers Respond to Hourly Prices? Evidence from a Dynamic Pricing Experiment”; Jessoe and Rapson, “Knowledge Is (Less) Power: Experimental Evidence from Residential Energy Use.” 96 New York State, “14-M-0101: Reforming the Energy Vision (REV),” 58–63.
24
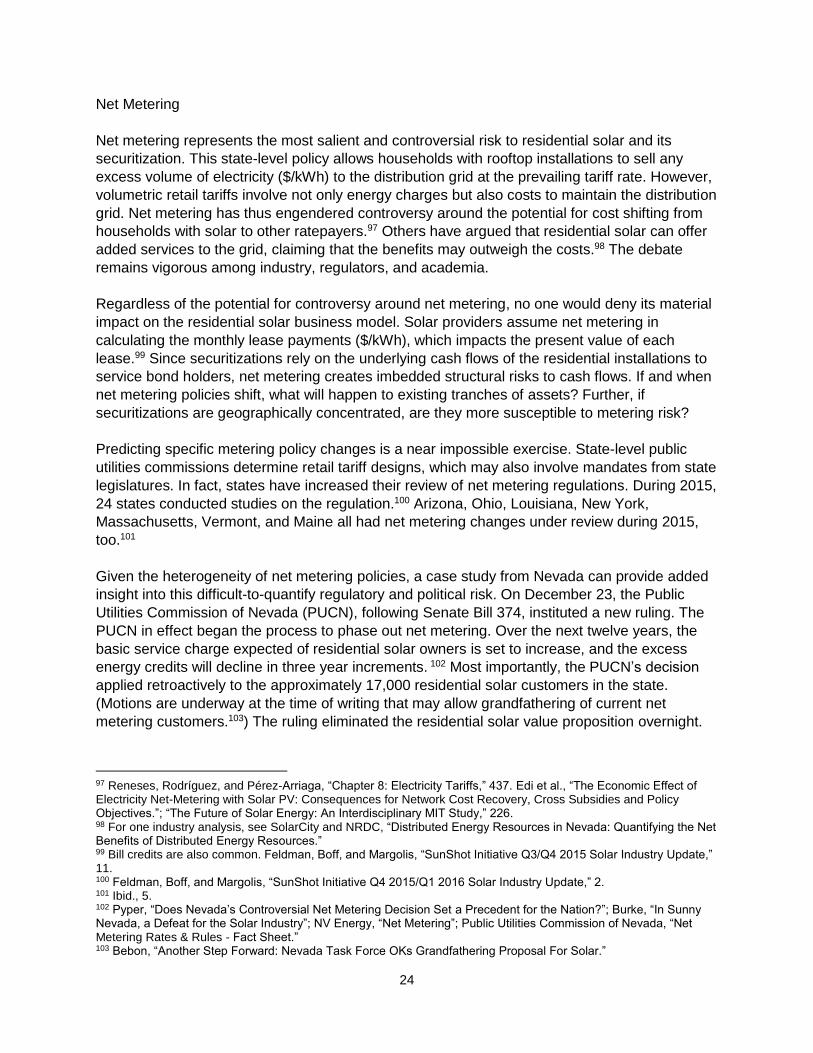
Net Metering
Net metering represents the most salient and controversial risk to residential solar and its
securitization. This state-level policy allows households with rooftop installations to sell any
excess volume of electricity ($/kWh) to the distribution grid at the prevailing tariff rate. However,
volumetric retail tariffs involve not only energy charges but also costs to maintain the distribution
grid. Net metering has thus engendered controversy around the potential for cost shifting from
households with solar to other ratepayers.97 Others have argued that residential solar can offer
added services to the grid, claiming that the benefits may outweigh the costs.98 The debate
remains vigorous among industry, regulators, and academia.
Regardless of the potential for controversy around net metering, no one would deny its material
impact on the residential solar business model. Solar providers assume net metering in
calculating the monthly lease payments ($/kWh), which impacts the present value of each
lease.99 Since securitizations rely on the underlying cash flows of the residential installations to
service bond holders, net metering creates imbedded structural risks to cash flows. If and when
net metering policies shift, what will happen to existing tranches of assets? Further, if
securitizations are geographically concentrated, are they more susceptible to metering risk?
Predicting specific metering policy changes is a near impossible exercise. State-level public
utilities commissions determine retail tariff designs, which may also involve mandates from state
legislatures. In fact, states have increased their review of net metering regulations. During 2015,
24 states conducted studies on the regulation.100 Arizona, Ohio, Louisiana, New York,
Massachusetts, Vermont, and Maine all had net metering changes under review during 2015,
too.101
Given the heterogeneity of net metering policies, a case study from Nevada can provide added
insight into this difficult-to-quantify regulatory and political risk. On December 23, the Public
Utilities Commission of Nevada (PUCN), following Senate Bill 374, instituted a new ruling. The
PUCN in effect began the process to phase out net metering. Over the next twelve years, the
basic service charge expected of residential solar owners is set to increase, and the excess
energy credits will decline in three year increments. 102 Most importantly, the PUCN’s decision
applied retroactively to the approximately 17,000 residential solar customers in the state.
(Motions are underway at the time of writing that may allow grandfathering of current net
metering customers.103) The ruling eliminated the residential solar value proposition overnight.
97 Reneses, Rodríguez, and Pérez-Arriaga, “Chapter 8: Electricity Tariffs,” 437. Edi et al., “The Economic Effect of Electricity Net-Metering with Solar PV: Consequences for Network Cost Recovery, Cross Subsidies and Policy Objectives.”; “The Future of Solar Energy: An Interdisciplinary MIT Study,” 226. 98 For one industry analysis, see SolarCity and NRDC, “Distributed Energy Resources in Nevada: Quantifying the Net Benefits of Distributed Energy Resources.” 99 Bill credits are also common. Feldman, Boff, and Margolis, “SunShot Initiative Q3/Q4 2015 Solar Industry Update,” 11. 100 Feldman, Boff, and Margolis, “SunShot Initiative Q4 2015/Q1 2016 Solar Industry Update,” 2. 101 Ibid., 5. 102 Pyper, “Does Nevada’s Controversial Net Metering Decision Set a Precedent for the Nation?”; Burke, “In Sunny Nevada, a Defeat for the Solar Industry”; NV Energy, “Net Metering”; Public Utilities Commission of Nevada, “Net Metering Rates & Rules - Fact Sheet.” 103 Bebon, “Another Step Forward: Nevada Task Force OKs Grandfathering Proposal For Solar.”

25
Major residential solar providers promptly exited the market. Class action lawsuits from
customers followed.104
Nevada assets account for less than one percent of existing securitizations, making the impact
of the regulatory shift immaterial to existing solar ABS. S&P did not downgrade its ratings of
securitizations containing assets in Nevada.105 However, investor perception can lag reality.
Such an abrupt shift in net metering policy—and, importantly, the inability to forecast it—may
have widened spreads on the most recent securitizations. The yields on SolarCity’s January
2016 and March 2016 securitizations were 5.81 percent and 6.25 percent, respectively. That is
a change of almost 200 basis points above the July 2014 securitization. The B tranche of the
March 2016 securitization had a yield of 7.50 percent.106 While a weakened macro environment
also widened spreads, the PUCN decision likely increased the perceived risk of the underlying
assets and thus may have impacted the risk/reward profile measured by the yield.
Investment Tax Credit (ITC) Accounting & Tax Equity Complexities
Unlike utility rates and net metering, one regulatory concern for solar ABS transcends state
boundaries. The way in which residential solar providers account for the Investment Tax Credit
(ITC) has a materially positive impact on residential solar economics. Because companies have
been able to assess the subsidy off the “fair market value” of the installations rather than off the
systems’ direct cost, the subsidy benefits can be elevated by at least 50 percent.107
If the IRS decides that companies need to claim the ITC credits using an alternative method, the
$/Watt subsidy gains could be erased. The hypothetical shift would reduce the cash flows
required for solar securitization.108 This regulatory concern known as “basis risk” affects existing
assets pooled into securities and those in the future. (It represents a more acute concern for
partnership flip tax equity structures than for inverted leases.)109 Further, if the investor cannot
put the tax credit to use in the partnership flip model (i.e., if the projects fail), there is “recapture
risk.”110
The ITC concern is particularly amplified by combining tax equity and securitization. On a
fundamental level, there is a tension between tax equity investors in the solar assets and the
solar ABS investors. Tax equity investors are typically the most senior in the capital stack of
every transaction, but fixed income investors also expect seniority as debt holders. In the event
that the IRS challenges the tax treatment of the assets, the tax equity investors will require
indemnification via a “cash sweep” to meet the originally specified rate of return—meaning the
ABS investor would become junior to the tax equity claims and could face diminished returns.111
One way to mitigate this potential cash flow disruption in partnership flips is via insurance
104 Walton, “Nevada Regulators Deny ‘Grandfathering’ Provision for Existing Rooftop Solar Users.” 105 Standard & Poor’s, “Nev.’s New Net Meter Rts Won’t Affect S&P US Solar Deals Rtgs.” 106 FINRA, “Bond Detail: SOLARCITY LMC SER V LLC, B Tranche (CUSIP 83417WAA0).” 107 “The Future of Solar Energy: An Interdisciplinary MIT Study,” 95. 108 Martin, “Solar Tax Equity Structures.” 109 Brandt, Grant, and Cornfeld, “The Solar Securitization Opportunity,” 22. 110 Martin, “Solar Tax Equity Structures”; Brandt, Grant, and Cornfeld, “The Solar Securitization Opportunity,” 27; Borod, “The A -> Z of Solar Deals Done to Date.” 111 Brandt, Grant, and Cornfeld, “The Solar Securitization Opportunity,” 27.

26
products. However, these add-ons are costly and not clearly reflected in the risk/reward profile
of the securities.112 Insurance has also yet to be proven out in the actual event of default.
112 Ibid., 22.

27
Residential Solar: Risks to the Business Model
Solar Provider
(Installer &
Servicer)
Household Electricity
($/kWh)
~7 kW Rooftop Solar
PV System & Inverter
Public Utilities
Commission &
State Government
Investor Owned
Utility & Distribution
Grid
Electricity
Meter
U.S Government &
IRS
Sun (hours of energy)
Tax Equity
Investors
Key
• Energy
• Electricity (AC)
• Capex and opex
• Monthly cash flows
• Tax equity cash for projects
• Federal subsidies and
incentives
• State subsidies and incentives
• Solar lease / PPA
• Federal Policy Risk
• Technology Risk
• State Regulatory Risk
Sources: MIT, Kroll, U.S. Department of Energy NREL, SEIA, SolarCity
28
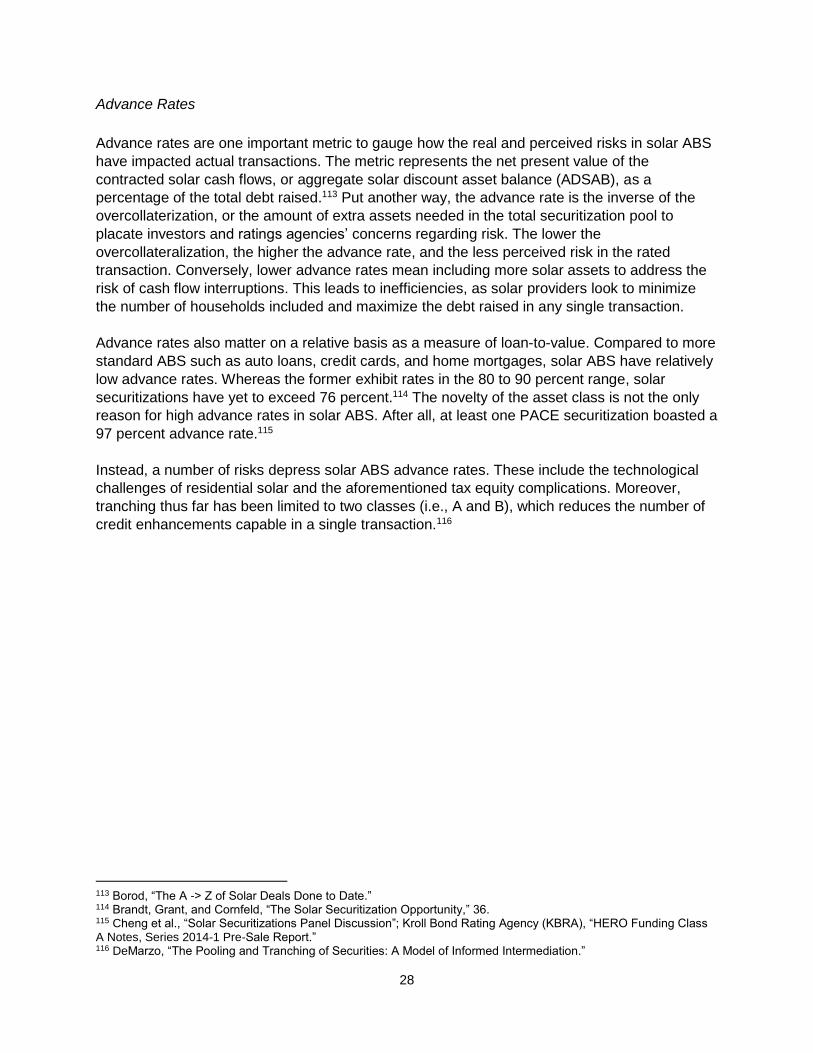
Advance Rates
Advance rates are one important metric to gauge how the real and perceived risks in solar ABS
have impacted actual transactions. The metric represents the net present value of the
contracted solar cash flows, or aggregate solar discount asset balance (ADSAB), as a
percentage of the total debt raised.113 Put another way, the advance rate is the inverse of the
overcollaterization, or the amount of extra assets needed in the total securitization pool to
placate investors and ratings agencies’ concerns regarding risk. The lower the
overcollateralization, the higher the advance rate, and the less perceived risk in the rated
transaction. Conversely, lower advance rates mean including more solar assets to address the
risk of cash flow interruptions. This leads to inefficiencies, as solar providers look to minimize
the number of households included and maximize the debt raised in any single transaction.
Advance rates also matter on a relative basis as a measure of loan-to-value. Compared to more
standard ABS such as auto loans, credit cards, and home mortgages, solar ABS have relatively
low advance rates. Whereas the former exhibit rates in the 80 to 90 percent range, solar
securitizations have yet to exceed 76 percent.114 The novelty of the asset class is not the only
reason for high advance rates in solar ABS. After all, at least one PACE securitization boasted a
97 percent advance rate.115
Instead, a number of risks depress solar ABS advance rates. These include the technological
challenges of residential solar and the aforementioned tax equity complications. Moreover,
tranching thus far has been limited to two classes (i.e., A and B), which reduces the number of
credit enhancements capable in a single transaction.116
113 Borod, “The A -> Z of Solar Deals Done to Date.” 114 Brandt, Grant, and Cornfeld, “The Solar Securitization Opportunity,” 36. 115 Cheng et al., “Solar Securitizations Panel Discussion”; Kroll Bond Rating Agency (KBRA), “HERO Funding Class A Notes, Series 2014-1 Pre-Sale Report.” 116 DeMarzo, “The Pooling and Tranching of Securities: A Model of Informed Intermediation.”

29
117
Advance rates have not improved steadily, either. During the first four transactions, advance
rates climbed from 62 percent to 75.77 percent. Beginning in August 2015, however, rates
reversed course, falling to 67.90 percent and only recovering to 75.20 percent.
The Future of Solar Securitization: Salient Change or Passing Fad? At the time of writing, the solar securitization market has slowed. The exact cause is difficult to
determine, but it relates at least in part to recent market volatility. In fact, one transaction
involving the global power company AES failed to come to market, though solar providers may
have shelved other deals as well.118 The blended yields on the securities have also increased
from a low of 4.32 percent in LMC Series III to a high of 6.25 percent with LMC Series V.
The experimentation in solar ABS over the last few years has reached a point where reflection
would be worthwhile. Is the attempt to securitize solar assets an important development for the
renewable energy sector, or simply a short-term experiment in financial engineering? Put
another way, will securitization make a lasting impact on U.S. solar deployment, or will it be
limited to a select number of providers? Is this another SunEdison moment in the making?
To be sure, some of the excitement around solar ABS runs counter to the known risks and the
still nascent third-party ownership business model. The policy and regulatory environments are
unpredictable.119 December 2015 witnessed the PUCN ruling shrink a residential solar market
117 MIT analysis. 118 Borod, “The A -> Z of Solar Deals Done to Date.” 119 For more on estimative probability in practice, see Tetlock and Gardner, Superforecasting: The Art and Science of Prediction.
0%
10%
20%
30%
40%
50%
60%
70%
80%
0%
1%
2%
3%
4%
5%
6%
7%
LMC Series ILLC ,
November2013
LMC Series IILLC, April
2014
LMC Series IIILLC, July
2014
Callisto –Issuer 2015-
1, LLC , August 2015
LMC SeriesIV, LLC ,
August 2015
FTE Series 1,LLC, January
2016
LMC SeriesV, LLC ,
March 2016
Ava
nce
Ra
tes
Yie
ldSolar ABS Yields and Advance Rates
Blended Yield Advance Rate

30
overnight, but also the last-minute extension of the ITC, which will be a long term benefit for
solar providers. Most in the industry would agree generating cash flows that do not depend on
subsidies will be an important milestone for residential solar. To the extent that shift makes the
cash flows steadier and more predictable, securitizations could become even more widespread
and increase solar deployment with lower cost capital.
The residential solar business models underpinning securitization are also developing—often in
fits and starts. In fact, the types of solar home contracts offered to consumers have begun to
change. Leases and PPAs will likely continue to lose market share to simpler products: loans
and PACE.120 According to GTM Research, loans may account for over 50 percent of
installations by 2020, up from 28 percent in 2014.121 As solar providers experiment with new
customer contracts, there may be renewed opportunities for growth, and unforeseen challenges.
More traditional mortgage lenders are also entering the fray. Fannie Mae announced a new
program, HomeStyle Energy, designed to link solar installations to mortgages.122 The new
financing option allows homeowners to use up to 15 percent of the appraised value of the home
toward energy efficiency and distributed electricity generation, including solar.
Is Pooling Next?
Securitization promises to bring scale to residential solar. However, one company has
dominated the ABS market to date, with only a single additional solar provider entering the
market. That trend is partly a function of company strategy, financing needs, and the increasing
ease of repeat transactions in the market. However, with investor demand for solar ABS
remaining strong, finding new ways to increase supply could unlock funding for mid-sized
developers and, ultimately, increase solar deployment. One such option would be to combine
transactions from multiple solar providers into a single structure, commonly known as “pooling.”
Pooling securitizations across solar providers offers two opportunities in theory. First, smaller
and medium-sized developers account for approximately 40 to 50 percent of the existing
residential market by installed capacity.123 There are cash-producing, long-term contracted, and
credit-worthy assets already deployed across the United States. Solving the supply problem on
solar ABS could be accomplished not only through more securitizations from existing players,
but also by expanding the range of originators. Second, other players in the solar ABS market
would benefit from its expansion, including banks and rating agencies conducting additional
transactions and applying best practices to date. If incentives are well aligned, expanding solar
ABS to a new installer base could also have the added effect of increasing solar deployments
writ large.
The securitization market share data also implies that the number of assets for pooling is large:
approximately 2,700 MWs of installed capacity exists beyond the top three solar providers.124 If
one assumes an average securitization size of 50 MWs and that the remaining market is only 50
120 Munsell, “72% of US Residential Solar Installed in 2014 Was Third-Party Owned.” 121 Ibid. 122 Curry, “Fannie Mae Improves Energy-Efficient Mortgage Program”; Denning, “The Not-So-Simple Life for Solar.” 123 SEIA / GTM Research, “Solar Market Insights 2015 Q4.” MIT Analysis 124 Feldman, Boff, and Margolis, “SunShot Initiative Q4 2015/Q1 2016 Solar Industry Update,” 26.

31
percent third-party owned, then there is room for over 25 further securitizations of existing
assets, all else being equal. Even given credit risks and the current operational constraints to
pooling, there could be enough existing assets available to conduct at least five additional
securitizations.
Despite the promise of pooling and the size of the asset base, the challenges are not
insignificant.125 The general information asymmetries involved in pooling likely increases the
associated transaction costs. That is, since there are multiple solar installers involved in any
given deal, credit risk assessments and enhancements need to cover multiple entities. Rating
agencies may be wary to conduct such complex transactions, too. Investors may also be
concerned about the quality of the underlying assets—and the resulting cash flows—given the
multiple owners, servicers, and panel/inverter technologies. The complexity, already high with
solar ABS, would be bound to increase with pooling.
Conclusion
The rise of residential solar has led to an unprecedented growth in renewable energy capacity.
The securitization of those solar assets represents an exciting development in renewable
energy finance. Matching debt market investors’ large pools of capital with solar providers’
assets augurs well for the future. It should generate legitimate optimism about the ability of
capital markets to finance solar and its positive externalities.
However, solar securitization’s future ultimately rests on the business models and technologies
that spurred the residential market in the first place. The growth in the sector to date, while
impressive, does not obviate the need to address major regulatory and policy hurdles. A more
sustainable, less regulation-dependent business model will be required.
Technology cannot be ignored, either. Financial engineering must accompany actual
breakthroughs in the lab. More innovation is needed to drive down costs and spur deployment
of residential (and utility scale) solar.126 Without those fundamental developments in parallel, the
future success of residential solar—and its novel financing—will remain uncertain.
125 Clouse, “Pooled Solar Securitizations Are in ‘It’s Complicated’ Mode”; Ossa, “Bundling Assets May Unlock Solar ABS Potential.” 126 Sivaram and Kann, “Solar Power Needs a More Ambitious Cost Target.”

32
Acknowledgements
We would like to thank Jonathan Parker, Nathaniel Gregory, and Henrik Wibe of MIT; Michael
Levi, Varun Sivaram, Josh Cornfeld, Ronald Borod, Mike Reynolds, Conrad Caplin, Nathan
Gabig, Stephen Henne, and Michael Mendelsohn; and the organizers of and participants at the
4th Annual Sunshine Backed Bonds Conference in April 2016, including Andrew Giudici, Keith
Martin, Andrew Coronios, Tracy Rice, and Caitlin Fitzpatrick.
Bibliography Alafita, T, and J.M. Pearce. “Securitization of Residential Solar Photovoltaic Assets: Costs,
Risks and Uncertainty.” Energy Policy 67 (2014): 488–98. Alcott, Hunt. “Rethinking Real-Time Electricity Pricing.” Resource and Energy Economics 33
(2011): 820–42. Arreola, Georgina, Timothy Treadwell, and Ben Hoen. “Survey of Buyers, Sellers and Realtors
Involved In San Diego Third-Party Owned Solar Home Transactions – A Qualitative Assessment.” Lawrence Berkeley National Laboratory, 2015. https://emp.lbl.gov/sites/all/files/lbnl-1003917.pdf.
Bebon, Joseph. “Another Step Forward: Nevada Task Force OKs Grandfathering Proposal For Solar.” Solar Industry Magazine, May 27, 2016. http://solarindustrymag.com/another-step-forward-nevada-task-force-oks-grandfathering-proposal-for-solar-nem.
Bird, Lori, Jenny Heeter, and Claire Kreycik. “Solar Renewable Energy Certificate (SREC) Markets: Status and Trends,” November 2011. http://www.nrel.gov/docs/fy12osti/52868.pdf.
BofA Merrill Lynch. “BofA Merrill Lynch US Corporate BBB Option-Adjusted Spread© [BAMLC0A4CBBB], Retrieved from FRED, Federal Reserve Bank of St. Louis,” 2016. https://research.stlouisfed.org/fred2/series/BAMLC0A4CBBB.
Borenstein, Severin. “Customer Risk from Real-Time Retail Electricity Pricing: Bill Volatility and Hedgability.” The Energy Journal 28, no. 2 (2007): 111–30.
———. “Effective and Equitable Adoption of Opt-In Residential Dynamic Electricity Pricing.” Working Paper. Energy Institute at Haas, April 2012. https://ei.haas.berkeley.edu/research/papers/WP229.pdf.
———. “The Redistributional Impact of Nonlinear Electricity Pricing.” American Economic Journal: Economic Policy 3, no. 3 (2012): 56–90.
Borod, Ronald. “The A -> Z of Solar Deals Done to Date.” 2016 Sunshine Backed Bonds Conference, April 21, 2016.
Brandt, Ted, Terry Grant, and Josh Cornfeld. “The Solar Securitization Opportunity.” Marathon Capital, March 2016. http://www.marathon-cap.com/resources/recent-news/news-item/2016/03/14/the-solar-securitization-opportunity.
Burke, Adam. “In Sunny Nevada, a Defeat for the Solar Industry,” February 23, 2016. http://www.marketplace.org/2016/02/23/world/nevada-solar.
Cheng, Michael, Andrew Coronios, Xilun Chen, and Eli Katz. “Solar Securitizations Panel Discussion.” June 2014. http://www.chadbourne.com/solar_securitizations_0914_projectfinance.
Clouse, Carol J. “Pooled Solar Securitizations Are in ‘It’s Complicated’ Mode,” June 5, 2015. http://www.institutionalinvestor.com/article/3460167/asset-management-fixed-income/pooled-solar-securitizations-are-in-its-complicated-mode.html#/.V17J5DUXa4E.
Curry, Kerry. “Fannie Mae Improves Energy-Efficient Mortgage Program,” April 14, 2016. http://www.fanniemae.com/portal/funding-the-market/hif/2016/energy-efficient-041416.html.

33
Cusick, Daniel. “Renewables Boom Expected Thanks to Tax Credit.” ClimateWire, December 21, 2015. http://www.scientificamerican.com/article/renewables-boom-expected-thanks-to-tax-credit/.
DeMarzo, Peter M. “The Pooling and Tranching of Securities: A Model of Informed Intermediation.” The Review of Financial Studies 18, no. 1 (2005): 1–35.
Denning, Liam. “The Not-So-Simple Life for Solar,” June 8, 2016. http://www.bloomberg.com/gadfly/articles/2016-06-08/solarcity-loan-program-no-simple-fix.
“Domino’s Pizza Completes Recapitalization; Declares $3 Per Share Special Dividend,” March 2012. http://phx.corporate-ir.net/phoenix.zhtml?c=135383&p=irol-newsArticle&ID=1673692.
Edi, Cherrelle, Javier Reneses Guillen, Pablo Frias Marin, and Rudi Hakvoort. “The Economic Effect of Electricity Net-Metering with Solar PV: Consequences for Network Cost Recovery, Cross Subsidies and Policy Objectives.” Energy Policy 75 (20): 244–54.
Federal Reserve Bank of St. Louis (FRED). “Board of Governors of the Federal Reserve System (US), 7-Year Swap Rate [WSWP7],” 2016. https://research.stlouisfed.org/fred2/series/WSWP7.
Feldman, David, Daniel Boff, and Robert Margolis. “SunShot Initiative Q3/Q4 2015 Solar Industry Update.” U.S. Department of Energy, January 19, 2016.
———. “SunShot Initiative Q4 2015/Q1 2016 Solar Industry Update.” U.S. Department of Energy, April 29, 2016.
FINRA. “Bond Detail: SOLARCITY LMC SER V LLC, A Tranche (CUSIP 83417WAA0),” July 2, 2016. http://finra-markets.morningstar.com/BondCenter/BondDetail.jsp?ticker=SPSCTY4339568DS&symbol=SCTY4339568&source=SP.
———. “Bond Detail: SOLARCITY LMC SER V LLC, B Tranche (CUSIP 83417WAA0),” July 2, 2016. http://finra-markets.morningstar.com/BondCenter/BondDetail.jsp?ticker=SPSCTY4339568DS&symbol=SCTY4339568&source=SP.
———. “Bond Detail: SOLARCITY LMC SER IV LLC, B Tranche (CUSIP 83417PAB3),” July 2, 2016. http://finra-markets.morningstar.com/BondCenter/BondDetail.jsp?ticker=SPSCTY4277277DS&symbol=SCTY4277277&source=SP.
———. “Bond Detail: SOLARCITY LMC SERIES I LLC (CUSIP 83417BAA6),” July 2, 2016. http://finra-markets.morningstar.com/BondCenter/BondDetail.jsp?ticker=SPSCTY4071027DS&symbol=SCTY4071027&source=SP.
———. “Bond Detail: Sunrun Callisto, A Tranche (CUSIP 86771YAA9),” July 2, 2016. http://finra-markets.morningstar.com/BondCenter/BondDetail.jsp?ticker=SPSSOE4265326DS&symbol=SSOE4265326&source=SP.
Foley, Stephen, and Ed Crooks. “SunEdison: Death of a Solar Star.” The Financial Times, April 21, 2016. http://www.ft.com/intl/cms/s/0/04fca062-07a3-11e6-a70d-4e39ac32c284.html#axzz47dbBL36V.
Golding, Ed. “Guidance for Use of FHA Financing on Homes with Existing PACE Liens and Flexible Underwriting through Energy Department’s Home Energy Score.” U.S. Department of Housing and Urban Development, August 24, 2015. http://portal.hud.gov/hudportal/documents/huddoc?id=FTDO.pdf.
Gorton, Gary, and Nicholas S. Souleles. “Special Purpose Vehicles and Securitization.” NBER Working Paper 11190, March 2005. http://www.nber.org/papers/w11190.

34
GTM Research / SEIA. “U.S. Solar Market Insight 2015: Year in Review,” 2015. http://www.seia.org/research-resources/us-solar-market-insight.
Hoffman, Liz. “Inside the Fall of SunEdison, Once a Darling of the Clean-Energy World,” April 14, 2016. http://www.wsj.com/articles/inside-the-fall-of-sunedison-once-a-darling-of-the-clean-energy-world-1460656000.
Hogan, William W. “Time-of-Use Rates and Real-Time Prices.” Working Paper, August 23, 2014. http://www.hks.harvard.edu/fs/whogan/Hogan_TOU_RTP_Newark_082314.pdf.
Jenkins, Jesse D., and Ignacio J. Pérez-Arriaga. “Improved Regulatory Approaches for the Remuneration of Electricity Distribution Utilities with High Penetrations of Distributed Energy Resources.” The Energy Journal 38, no. 1 (in press) (2017).
Jessoe, Katrina, and David Rapson. “Knowledge Is (Less) Power: Experimental Evidence from Residential Energy Use.” American Economic Review 104, no. 4 (2014): 1417–38.
Joshi, John. “Solar Securitization: Understanding the Risks of Residential Solar Energy-Backed Securities from an Investor Perspective.” Journal of Structured Finance 19, no. 2 (Summer 2013): 64–70.
Joskow, Paul, and Jean Tirole. “Retail Electricity Competition.” RAND Journal of Economics 37, no. 4 (Winter 2006): 799–815.
Joskow, Paul, and Catherine Wolfram. “Dynamic Pricing of Electricity.” American Economic Review: Papers & Proceedings 102, no. 3 (2012): 381–85.
Kahn, Alfred Edward. The Economics of Regulation: Principles and Institutions, Volumes 1-2. Cambridge, MA: MIT Press, 1988.
Kelley Blue Book. “New-Car Transaction Prices Jump More Than 3 Percent in August 2015,” September 1, 2015. http://mediaroom.kbb.com/new-car-transaction-prices-jump-august-2015.
Knittel, Christopher. “Guest Lecture in MIT Course 15.366: Energy Ventures.” Cambridge, MA, Fall 2015.
Kroll Bond Rating Agency (KBRA). “Evaluating Credit Risks in Solar Securitizations,” October 12, 2012. https://www.krollbondratings.com/announcements/108.
———. “HERO Funding Class A Notes, Series 2014-1 Pre-Sale Report,” February 27, 2014. https://www.krollbondratings.com/show_report/1097.
———. “SolarCity FTE Series 1, LLC, Series 2016-A ABS New Issue Report,” January 22, 2016. https://www.krollbondratings.com/show_report/3487.
———. “SolarCity LMC Series IV, LLC, Series 2015-1 ABS New Issue Report,” August 14, 2015. https://www.krollbondratings.com/show_report/2680.
———. “SolarCity LMC Series V, LLC, Series 2016-1 ABS New Issue Report,” March 1, 2016. https://www.krollbondratings.com/show_report/3733.
———. “Sunrun Callisto Issuer 2015-1, LLC, Series 2015-1 -,” June 23, 2015. https://www.krollbondratings.com/show_report/2453.
———. “The Credit Implications of Changes to Net Metering Rules,” June 28, 2016. https://www.krollbondratings.com/show_report/4600.
Lowder, Travis, and Michael Mendelsohn. “The Potential Securitization of Solar PV Finance,” December 2013. www.nrel.gov/docs/fy14osti/60230.pdf.
Manheim. “2016 Used Car Market Report,” n.d. http://www.manheim.com/content_pdfs/products/UCMR-2016.pdf?WT.svl=m_prod_consulting_latestupdates_graphic_2016.
Martin, Keith. “Solar Tax Equity Structures.” Chadbourne, September 2015. http://www.chadbourne.com/Solar_Tax_Equity_Structures_projectfinance.
Mendelsohn, Michael. “Will Solar Projects Need Tax Equity in the Future? Yes, but Baby Steps toward Securitization Improve the Situation.” NREL, U.S. Department of Energy, April 18, 2012. https://financere.nrel.gov/finance/content/solar-PV-photovoltaics-value-tax-credits-equity-accelerated-depreciation-securitization.

35
Mendelsohn, Michael, and David Feldman. “Financing U.S. Renewable Energy Projects Through Public Capital Vehicles: Qualitative and Quantitative Benefits,” April 2013. www.nrel.gov/docs/fy13osti/58315.pdf.
Mendelsohn, Michael, and John Joshi. “Credit Enhancements and Capital Markets to Fund Solar Deployment: Leveraging Public Funds to Open Private Sector Investment,” February 2015. http://www.nrel.gov/docs/fy15osti/62618.pdf.
Mendelsohn, Michael, Travis Lowder, Mary Rottman, Ronald Borod, Nathan Gabig, Stephen Henne, Conrad Caplin, and Quentin Notte. “The Solar Access to Public Capital (SAPC) Mock Securitization Project,” December 2015.
Munsell, Mike. “72% of US Residential Solar Installed in 2014 Was Third-Party Owned.” Greentech Media, July 29, 2015. http://www.greentechmedia.com/articles/read/72-of-us-residential-solar-installed-in-2014-was-third-party-owned.
New York State. “14-M-0101: Reforming the Energy Vision (REV).” Accessed May 9, 2015. http://www3.dps.ny.gov/W/PSCWeb.nsf/All/26BE8A93967E604785257CC40066B91A?OpenDocument.
NV Energy. “Net Metering,” 2016. https://www.nvenergy.com/renewablesenvironment/renewablegenerations/NetMetering.cfm.
Ossa, Felipe. “Bundling Assets May Unlock Solar ABS Potential.” Asset Securitization Report, April 30, 2015. http://www.asreport.com/news/abs/bundling-assets-may-unlock-solar-abs-potential-256068-1.html.
PACENation. “Residential PACE,” 2016. http://www.pacenation.us/residential-pace/. Public Utilities Commission of Nevada. “Net Metering Rates & Rules - Fact Sheet,” March 2016.
http://puc.nv.gov/uploadedFiles/pucnvgov/Content/Consumers/Be_Informed/Fact_Sheet_Net_Metering.pdf.
Pyper, Julia. “Does Nevada’s Controversial Net Metering Decision Set a Precedent for the Nation?” Greentech Media, February 4, 2016. http://www.greentechmedia.com/articles/read/nevada-net-metering-decision.
Reneses, Javier, María Pía Rodríguez, and Ignacio J. Pérez-Arriaga. “Chapter 8: Electricity Tariffs.” In Regulation of the Power Sector Edited by Ignacio J. Pérez-Arriaga, 402–41, 2013.
Schweppe, Fred C., Richard D. Tabors, and James L. Kirtley. “Homeostatic Control: The Utility/Customer Marketplace for Electric Power.” MIT Energy Laboratory, September 1981.
Scully, Matt, and Scott Moritz. “IPhones Go From T-Mobile Loss Leader to New Source of Cash,” April 30, 2015. http://www.bloomberg.com/news/articles/2015-04-30/t-mobile-changes-iphones-from-loss-leaders-to-source-of-finance.
“Securities Industry and Financial Markets Association (SIFMA) Statistics - U.S. ABS Issuance and Outstanding,” 2016. http://www.sifma.org/research/statistics.aspx.
SEIA. “1603 Treasury Program,” 2016. http://www.seia.org/policy/finance-tax/1603-treasury-program.
———. “Solar Investment Tax Credit (ITC),” 2016. http://www.seia.org/policy/finance-tax/solar-investment-tax-credit%20/.
SEIA / GTM Research. “Solar Market Insights 2015 Q4,” n.d. http://www.seia.org/research-resources/solar-market-insight-2015-q4.
———. “U.S. SOLAR MARKET INSIGHT Q2 2016: Executive Summary,” June 2016. http://www.seia.org/sites/default/files/k7bZk7JSHC2016Q2SMI.pdf.
Sivaram, Varun, and Shayle Kann. “Solar Power Needs a More Ambitious Cost Target.” Nature Energy 1 (April 2016): 1–3.

36
Sivaram, Varun, and Teryn Norris. “The Clean Energy Revolution: Fighting Climate Change with Innovation.” Foreign Affairs, no. May/June (2016). https://www.foreignaffairs.com/articles/united-states/2016-04-18/clean-energy-revolution.
“Solar City 2015 Analyst Day Report.” Fremont, California, December 15, 2015. http://investors.solarcity.com/events.cfm.
SolarCity. “Investor Presentation,” February 2016. http://investors.solarcity.com/events.cfm. ———. “SolarCity Corporation Form 10-K 2015,” February 10, 2016.
http://investors.solarcity.com/sec.cfm?view=all. SolarCity and NRDC. “Distributed Energy Resources in Nevada: Quantifying the Net Benefits of
Distributed Energy Resources,” May 2016. http://www.solarcity.com/sites/default/files/SolarCity-Distributed_Energy_Resources_in_Nevada.pdf.
“SolarCity Corp - Form 10-K 2015.” San Mateo, CA, February 10, 2016. http://investors.solarcity.com/annuals-proxies.cfm.
“SolarCity Launches Solar Loan Program in 14 States.” SolarCity Press Release, June 2, 2016. http://www.solarcity.com/newsroom/press/solarcity-launches-solar-loan-program-14-states.
Standard & Poor’s. “Nev.’s New Net Meter Rts Won’t Affect S&P US Solar Deals Rtgs,” January 7, 2016. http://www.commoditiescontrol.com/commodity-market/dowjonescommoditiesnews/press-release-nevaposs-new-net-meter-rts-wonapost-affect-sampp-us-solar-deals-rtgs-20160107DN007148.html.
———. “SolarCity LMC Series I LLC (Series 2013-1) Presale Report,” November 11, 2013. Stone, Charles Austin, and Anne Zissu. The Securitization Markets Handbook: Structures and
Dynamics of Mortgage- and Asset-Backed Securities, Second Edition. John Wiley & Sons, 2012.
Sunrun. “28th Annual ROTH Conference,” March 14, 2016. http://investors.sunrun.com/phoenix.zhtml?c=254007&p=irol-calendar.
———. “2015 Q4 Review,” March 10, 2016. http://investors.sunrun.com/phoenix.zhtml?c=254007&p=irol-irhome.
Sweet, Cassandra. “Wind, Solar Companies Get Boost from Tax-Credit Extension.” The Wall Street Journal, December 16, 2015. http://www.wsj.com/articles/wind-solar-companies-get-boost-from-tax-credit-extension-1450311501.
Tetlock, Phillip, and Dan Gardner. Superforecasting: The Art and Science of Prediction. Crown, 2015.
“The Future of Solar Energy: An Interdisciplinary MIT Study.” MIT Energy Initiative, May 2015. http://mitei.mit.edu/futureofsolar.
Trabish, Herman. “SolarCity Moves Away from Its MyPower Solar Loan Product.” Utility Dive, February 19, 2016. http://www.utilitydive.com/news/solarcity-moves-away-from-its-mypower-solar-loan-product/414161/.
Tweed, Katherine. “SolarCity Kills Its MyPower Loan Product,” February 18, 2016. http://www.greentechmedia.com/articles/read/SolarCity-Kills-Its-MyPower-Loan-Product.
US. Bureau of the Census,. “Real Median Household Income in the United States.” retrieved from FRED, Federal Reserve Bank of St. Louis, July 2, 2016. https://fred.stlouisfed.org/series/MEHOINUSA672N.
U.S. Department of Energy. “Business Energy Investment Tax Credit (ITC),” 2016. http://energy.gov/savings/business-energy-investment-tax-credit-itc.
U.S. Federal Reserve. “Economic Projections of Federal Reserve Board Members and Federal Reserve Bank Presidents under Their Individual Assessments of Projected Appropriate Monetary Policy, March 2016,” March 16, 2016. https://www.federalreserve.gov/monetarypolicy/files/fomcprojtabl20160316.pdf.

37
U.S. Treasury Department. “1603 Program: Payments for Specified Energy Property in Lieu of Tax Credits,” October 5, 2015. https://www.treasury.gov/initiatives/recovery/Pages/1603.aspx.
Vivint. “Vivint Form 10-K 2015,” March 11, 2016. http://investors.vivint.com/financial-information/sec-filings/sec-filings-details/default.aspx?FilingId=11251313.
Walton, Robert. “Nevada Regulators Deny ‘Grandfathering’ Provision for Existing Rooftop Solar Users,” February 17, 2016. http://www.utilitydive.com/news/nevada-regulators-deny-grandfathering-provision-for-existing-rooftop-sola/413980/.
Wolak, Frank A. “Do Residential Customers Respond to Hourly Prices? Evidence from a Dynamic Pricing Experiment.” American Economic Review: Papers & Proceedings 101, no. 3 (2011): 83–87.
Woodhouse, Michael, Rebecca Jones-Albertus, David Feldman, Ran Fu, Kelsey Horowitz, Donald Chung, Dirk Jordan, and Sarah Kurtz. “The Role of Advancements in Solar Photovoltaic Efficiency, Reliability, and Costs,” May 2016. http://www.nrel.gov/docs/fy16osti/65872.pdf.
Zabritski, Melinda. “Experian State of the Automotive Finance Market: A Look at Loans and Leases in Q1 2016.” Experian, 2016. http://www.experian.com/assets/automotive/quarterly-webinars/2016-q1-safm.pdf.