solar simulator
DESCRIPTION
Non conventional Energy Resources. this is one of the modern application of NCES.One of the topic which is rare to find in Many books.TRANSCRIPT
Stratford, CT • Toll Free 800.714.5393 Fax 203.378.2457 • www.newport.com/oriel • [email protected]
O R I E L
ORIEL PRODUCT TRAINING
Solar Simulation
SECTION TWO FEATURES
• Glossary of Terms and Units
• Introduction to Solar Radiation
• Solar UV and Ozone Layer
• Photochemistry and Photodiology
• Energy Conversion
• Weathering
• Sample Calulations
• Spectral Irradiance Data
• Curve Normalization
2
GLOSSARY OF TERMS AND UNITS
Actinic dose: Quantity obtained by weighing spectrally theradiation dose using the action spectrum.
Actinic (radiation): The radiation that produces a specifiedeffect.
Action spectrum (actinic): Efficiency of monochromaticradiations for producing a specified actinic phenomenon in aspecified system.
Air mass (relative optical): Ratio of the slant opticalthickness, to the vertical optical thickness of the standardatmosphere.
Albedo: (Definition limited to solar radiation) Reflectance ofsolar radiation by the surroundings. This applies to the fullintegrated spectrum; the reflectance may depend strongly onthe spectral region.
Blackbody: A body that absorbs all radiant energy incidenton it.
Collimation and angle of terrestrial solar irradiation: Theterrestrial irradiance from the sun is composed of a directbeam with a collimation angle of approximately 0.5° and adiffuse component. The spectra and magnitude of eachcomponent changes through the day. Measurement of directradiation requires limiting the field of view (FOV). (Therecommended aperturing system limits the input to a slopehalf angle of 0.5°, an opening half angle of 2.65°, and a limithalf angle of 4.65°. Measuring the total radiation requires aninstrument with a 180° FOV.)
Daylight: Visible part of global solar radiation.
Diffuse sky radiation: The part of solar radiation whichreaches the earth as a result of being scattered by the airmolecules, aerosol particles, cloud particles, or otherparticles.
Direct solar radiation: The part of extraterrestrial solarradiation which, as a collimated beam, reaches the earth'ssurface after selective attenuation by the atmosphere.
Dobson unit (D.U.): Measure of columnar density of ozone. 1D.U. is one milliatmosphere centimeter of ozone at STP.Typical values range from 200 - 600 D.U. with values of 110in the Antarctic "ozone hole."
Dose: (Of optical radiation of a specified spectraldistribution) Term used in photochemistry, phototherapy, andphotobiology for the quantity radiant exposure. Unit, J m-2.
Dose Rate: Term used in photochemistry, phototherapy, andphotobiology for the quantity irradiance. Unit, W m-2.
Effective dose: That part of the dose that actually producesthe actinic effect considered.
Effective exposure rate: The integrated product of thespectral irradiance and action spectra.
Erythema (actinic): Reddening of the skin, with or withoutinflammation, caused by the actinic effect of solar radiationor artificial optical radiation.
Erythemal radiation: Optical radiation effective in causingactinic erythema.
Extraterrestrial solar radiation: Solar radiation incident onthe outer limit of the earth's atmosphere.
Global illuminance (Eg): Illuminance produced by daylighton a horizontal surface of the earth.
Global solar radiation: Combined direct solar radiation anddiffuse sky radiation.
Infrared radiat ion: Optical radiation for which thewavelengths are longer than those for visible radiation, 700nm to 1000 µm.
These two pages briefly define the terms and units most frequently used in the following Technical Discussion. Thesedefinitions are limited to the context in which the terms are used in this catalog.
3
GLOSSARY OF TERMS AND UNITS
Irradiance: Describes the flux, radiative power density, andincidence on a surface. Units, W m-2 or W cm-2. The surfacemust be specified for the irradiance to have meaning.(Laboratory surfaces are not usually as large as a squaremeter; this happens to be the appropriate SI unit of area).
Langley: 1 calorie cm-2 = 2.39 x 10⁵ J m-2
Minimum Erythema Dose (MED): The actinic dose thatproduces a just noticeable erythema on normal, non-exposed, "white" skin. This quantity corresponds to a radiantexposure of monochromatic radiation at the maximumspectral efficiency (λ = 295 nm) of roughly 100 J m-2.
Ozone (O3): What is produced when molecular oxygen inthe stratosphere absorbs shortwave (up to 242.2 nm)ultraviolet, and photodissociates. Ozone can be a healthhazard in concentrated amounts. (Our solar simulators useozone free lamps.)
Solar constant (ISC): Irradiance produced by theextraterrestrial solar radiation on a surface perpendicular tothe sun's rays at a mean sun-earth distance (ISC = (1367 ±7 Wm-2).
Spectral irradiance E(λ): The irradiance per unit wavelengthinterval at a specified wavelength.
Spectral irradiance units, W m-2 nm-1
To convert into W m-2 µm-1, multiply by 1000 (1000 E)To convert into W cm-2 nm-1, multiply by 10-4 (10-4 E)To convert into W cm-2 µm-1, multiply by 0.1 (0.1 E)
Standard solar radiation: Spectra that have been developedto provide a basis for theoretical evaluation of the effects ofsolar radiation, and as a basis for simulator design. In thiscatalog, we refer to the ASTM E490, E891 and E892standards, which define AM 0, AM 1.5 D and 1.5 G,respectively. We also refer to the CIE Pub. 85 and 904-3standards which define AM 1 and AM 1.5 G, respectively.
Sunlight: Visible part of direct solar radiation.
Sunshine duration: Sum of time intervals within a given timeperiod during which the irradiance from direct solar radiationon a plane normal to the sun direction is equal to or greaterthan 200 W m-2.
Terrestrial spectra: The spectrum of the solar radiation at theearth's surface.
Ultraviolet radiation: Optical radiation for which thewavelengths are shorter than those for visible radiation, <400nm. Note: For ultraviolet radiation, the range below 400 nm is
commonly suddivided into:UVA 320 - 400 nmUVB 280 - 320 nmUVC <280 nm
Uniformity: A measure of how the irradiance varies over aselected (or defined) area. Usually expressed as non-uniformity, the maximum and minimum % differences fromthe mean irradiance.
Visible radiation: Any optical radiation capable of causing avisual sensation directly, 400 - 700 nm.
( )Emax - Emin±100 Emax + Emin
4
INTRODUCTION TO SOLAR RADIATION
BASICS OF SOLAR RADIATIONRadiation from the sun sustains life on earth and
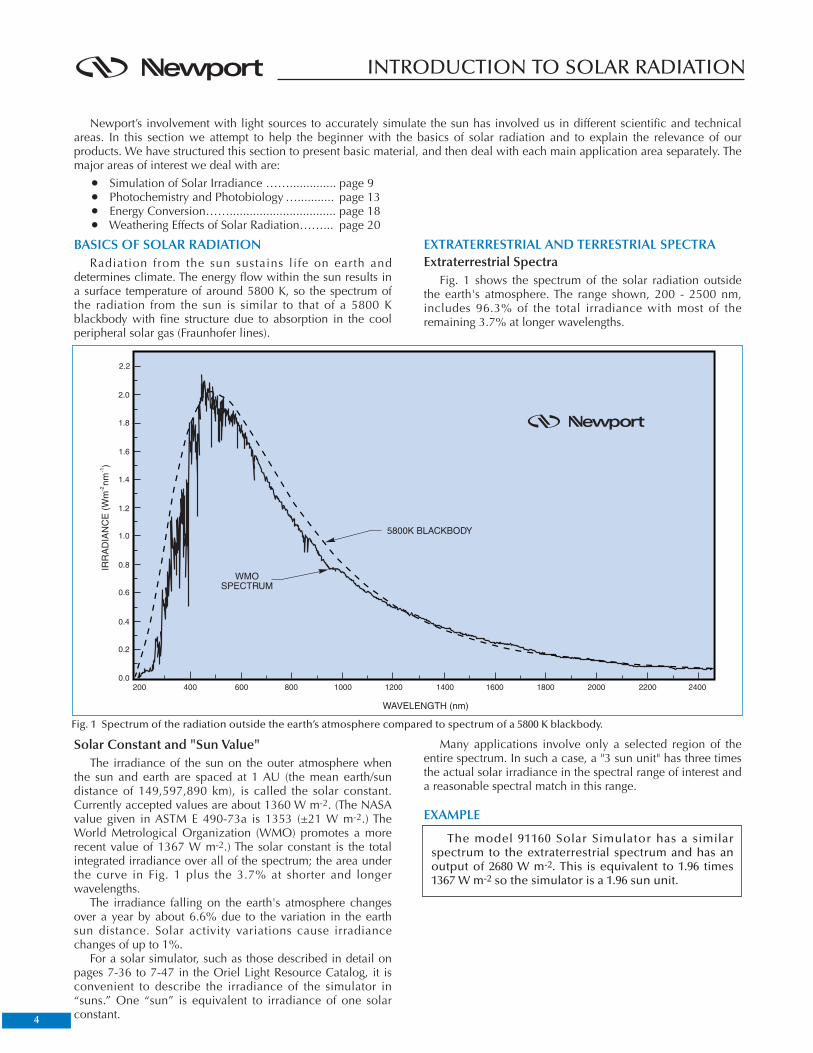
determines climate. The energy flow within the sun results ina surface temperature of around 5800 K, so the spectrum ofthe radiation from the sun is similar to that of a 5800 Kblackbody with fine structure due to absorption in the coolperipheral solar gas (Fraunhofer lines).
EXTRATERRESTRIAL AND TERRESTRIAL SPECTRAExtraterrestrial Spectra
Fig. 1 shows the spectrum of the solar radiation outsidethe earth's atmosphere. The range shown, 200 - 2500 nm,includes 96.3% of the total irradiance with most of theremaining 3.7% at longer wavelengths.
Fig. 1 Spectrum of the radiation outside the earth’s atmosphere compared to spectrum of a 5800 K blackbody.
Newport’s involvement with light sources to accurately simulate the sun has involved us in different scientific and technicalareas. In this section we attempt to help the beginner with the basics of solar radiation and to explain the relevance of ourproducts. We have structured this section to present basic material, and then deal with each main application area separately. Themajor areas of interest we deal with are:
• Simulation of Solar Irradiance …….............. page 9• Photochemistry and Photobiology …........... page 13• Energy Conversion……................................ page 18• Weathering Effects of Solar Radiation……... page 20
Solar Constant and "Sun Value"The irradiance of the sun on the outer atmosphere when
the sun and earth are spaced at 1 AU (the mean earth/sundistance of 149,597,890 km), is called the solar constant.Currently accepted values are about 1360 W m-2. (The NASAvalue given in ASTM E 490-73a is 1353 (±21 W m-2.) TheWorld Metrological Organization (WMO) promotes a morerecent value of 1367 W m-2.) The solar constant is the totalintegrated irradiance over all of the spectrum; the area underthe curve in Fig. 1 plus the 3.7% at shorter and longerwavelengths.
The irradiance falling on the earth's atmosphere changesover a year by about 6.6% due to the variation in the earthsun distance. Solar activity variations cause irradiancechanges of up to 1%.
For a solar simulator, such as those described in detail onpages 7-36 to 7-47 in the Oriel Light Resource Catalog, it isconvenient to describe the irradiance of the simulator in“suns.” One “sun” is equivalent to irradiance of one solarconstant.
Many applications involve only a selected region of theentire spectrum. In such a case, a "3 sun unit" has three timesthe actual solar irradiance in the spectral range of interest anda reasonable spectral match in this range.
EXAMPLE
The model 91160 Solar Simulator has a similarspectrum to the extraterrestrial spectrum and has anoutput of 2680 W m-2. This is equivalent to 1.96 times1367 W m-2 so the simulator is a 1.96 sun unit.
5
INTRODUCTION TO SOLAR RADIATION
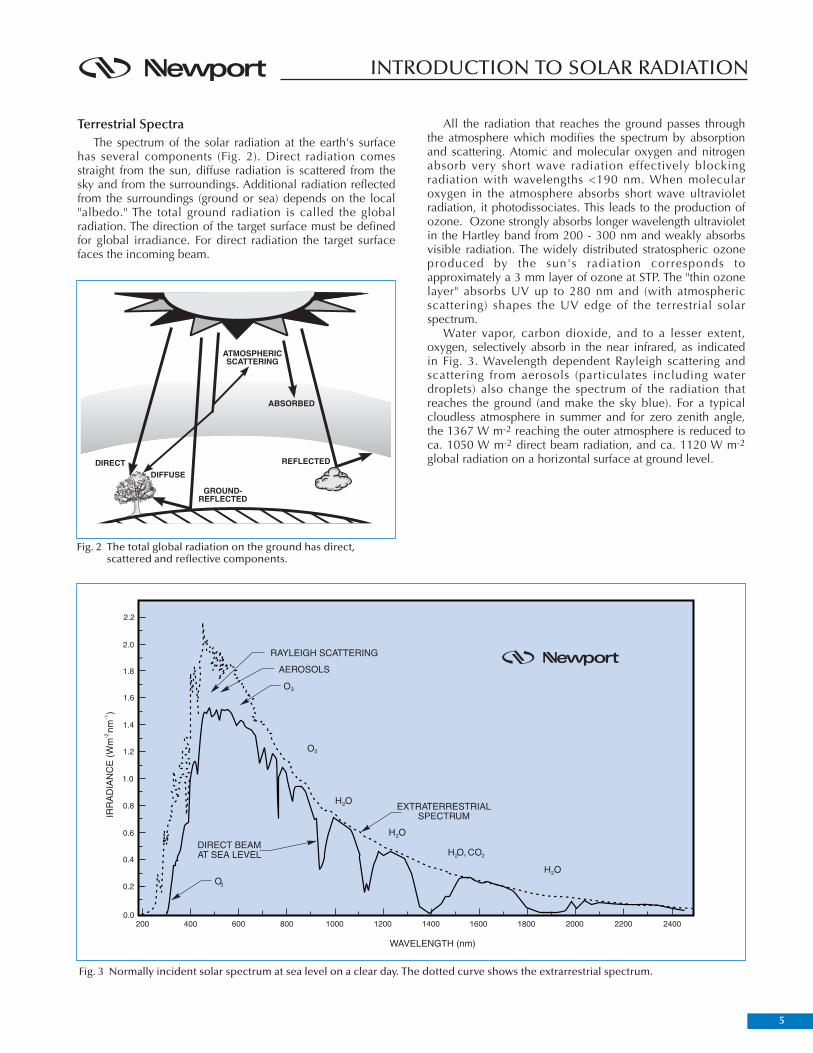
Terrestrial SpectraThe spectrum of the solar radiation at the earth's surface
has several components (Fig. 2). Direct radiation comesstraight from the sun, diffuse radiation is scattered from thesky and from the surroundings. Additional radiation reflectedfrom the surroundings (ground or sea) depends on the local"albedo." The total ground radiation is called the globalradiation. The direction of the target surface must be definedfor global irradiance. For direct radiation the target surfacefaces the incoming beam.
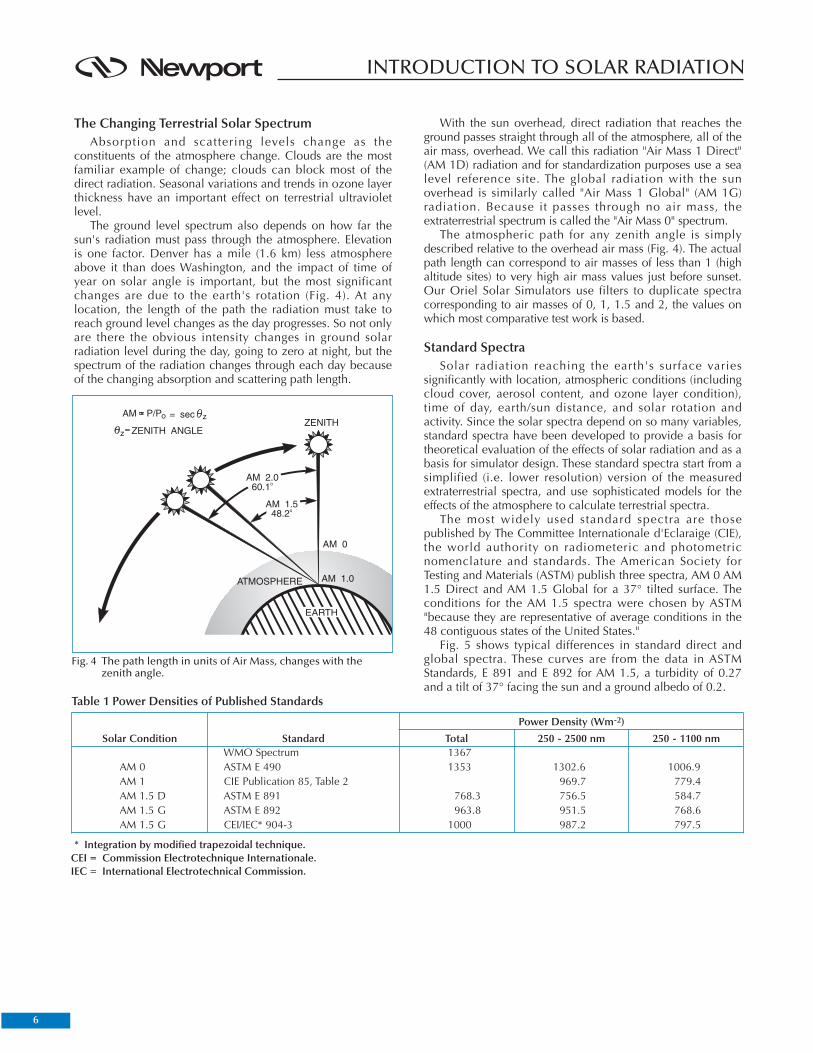
All the radiation that reaches the ground passes throughthe atmosphere which modifies the spectrum by absorptionand scattering. Atomic and molecular oxygen and nitrogenabsorb very short wave radiation effectively blockingradiation with wavelengths <190 nm. When molecularoxygen in the atmosphere absorbs short wave ultravioletradiation, it photodissociates. This leads to the production ofozone. Ozone strongly absorbs longer wavelength ultravioletin the Hartley band from 200 - 300 nm and weakly absorbsvisible radiation. The widely distributed stratospheric ozoneproduced by the sun's radiation corresponds toapproximately a 3 mm layer of ozone at STP. The "thin ozonelayer" absorbs UV up to 280 nm and (with atmosphericscattering) shapes the UV edge of the terrestrial solarspectrum.
Water vapor, carbon dioxide, and to a lesser extent,oxygen, selectively absorb in the near infrared, as indicatedin Fig. 3. Wavelength dependent Rayleigh scattering andscattering from aerosols (particulates including waterdroplets) also change the spectrum of the radiation thatreaches the ground (and make the sky blue). For a typicalcloudless atmosphere in summer and for zero zenith angle,the 1367 W m-2 reaching the outer atmosphere is reduced toca. 1050 W m-2 direct beam radiation, and ca. 1120 W m-2
global radiation on a horizontal surface at ground level.
Fig. 2 The total global radiation on the ground has direct,scattered and reflective components.
Fig. 3 Normally incident solar spectrum at sea level on a clear day. The dotted curve shows the extrarrestrial spectrum.
6
INTRODUCTION TO SOLAR RADIATION
The Changing Terrestrial Solar SpectrumAbsorption and scattering levels change as the
constituents of the atmosphere change. Clouds are the mostfamiliar example of change; clouds can block most of thedirect radiation. Seasonal variations and trends in ozone layerthickness have an important effect on terrestrial ultravioletlevel.
The ground level spectrum also depends on how far thesun's radiation must pass through the atmosphere. Elevationis one factor. Denver has a mile (1.6 km) less atmosphereabove it than does Washington, and the impact of time ofyear on solar angle is important, but the most significantchanges are due to the earth's rotation (Fig. 4). At anylocation, the length of the path the radiation must take toreach ground level changes as the day progresses. So not onlyare there the obvious intensity changes in ground solarradiation level during the day, going to zero at night, but thespectrum of the radiation changes through each day becauseof the changing absorption and scattering path length.
With the sun overhead, direct radiation that reaches theground passes straight through all of the atmosphere, all of theair mass, overhead. We call this radiation "Air Mass 1 Direct"(AM 1D) radiation and for standardization purposes use a sealevel reference site. The global radiation with the sunoverhead is similarly called "Air Mass 1 Global" (AM 1G)radiation. Because it passes through no air mass, theextraterrestrial spectrum is called the "Air Mass 0" spectrum.
The atmospheric path for any zenith angle is simplydescribed relative to the overhead air mass (Fig. 4). The actualpath length can correspond to air masses of less than 1 (highaltitude sites) to very high air mass values just before sunset.Our Oriel Solar Simulators use filters to duplicate spectracorresponding to air masses of 0, 1, 1.5 and 2, the values onwhich most comparative test work is based.
Standard SpectraSolar radiation reaching the earth's surface varies
significantly with location, atmospheric conditions (includingcloud cover, aerosol content, and ozone layer condition),time of day, earth/sun distance, and solar rotation andactivity. Since the solar spectra depend on so many variables,standard spectra have been developed to provide a basis fortheoretical evaluation of the effects of solar radiation and as abasis for simulator design. These standard spectra start from asimplified (i.e. lower resolution) version of the measuredextraterrestrial spectra, and use sophisticated models for theeffects of the atmosphere to calculate terrestrial spectra.
The most widely used standard spectra are thosepublished by The Committee Internationale d'Eclaraige (CIE),the world authority on radiometeric and photometricnomenclature and standards. The American Society forTesting and Materials (ASTM) publish three spectra, AM 0 AM1.5 Direct and AM 1.5 Global for a 37° tilted surface. Theconditions for the AM 1.5 spectra were chosen by ASTM"because they are representative of average conditions in the48 contiguous states of the United States."
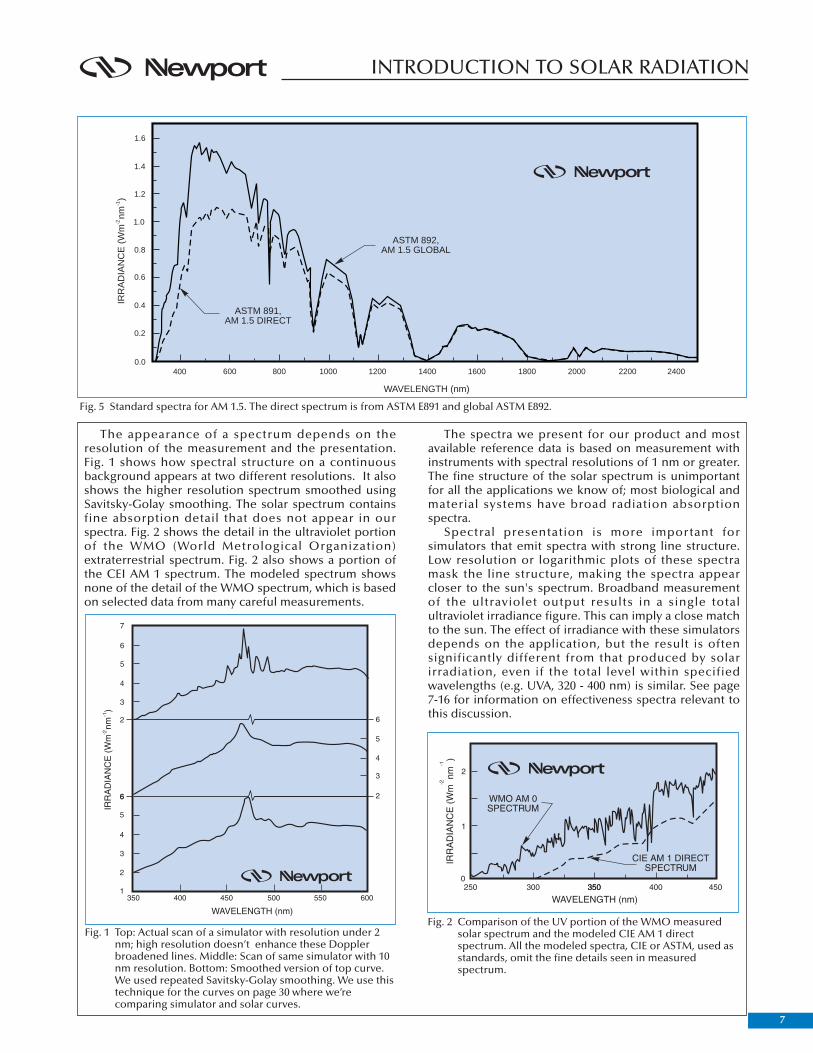
Fig. 5 shows typical differences in standard direct andglobal spectra. These curves are from the data in ASTMStandards, E 891 and E 892 for AM 1.5, a turbidity of 0.27and a tilt of 37° facing the sun and a ground albedo of 0.2.
Fig. 4 The path length in units of Air Mass, changes with thezenith angle.
Table 1 Power Densities of Published Standards
* Integration by modified trapezoidal technique.CEI = Commission Electrotechnique Internationale.IEC = International Electrotechnical Commission.
Solar Condition Standard Total 250 - 2500 nm
Power Density (Wm-2)
250 - 1100 nm
AM 1.5 G
AM 1
AM 1.5 G
AM 0
AM 1.5 D
CEI/IEC* 904-3
CIE Publication 85, Table 2
ASTM E 892
ASTM E 490
ASTM E 891
WMO Spectrum
1000963.8
1353
768.3
1367
987.2
969.7
951.5
1302.6
756.5
797.5
779.4
768.6
1006.9
584.7
7
INTRODUCTION TO SOLAR RADIATION
The appearance of a spectrum depends on theresolution of the measurement and the presentation.Fig. 1 shows how spectral structure on a continuousbackground appears at two different resolutions. It alsoshows the higher resolution spectrum smoothed usingSavitsky-Golay smoothing. The solar spectrum containsfine absorption detail that does not appear in ourspectra. Fig. 2 shows the detail in the ultraviolet portionof the WMO (World Metrological Organization)extraterrestrial spectrum. Fig. 2 also shows a portion ofthe CEI AM 1 spectrum. The modeled spectrum showsnone of the detail of the WMO spectrum, which is basedon selected data from many careful measurements.
The spectra we present for our product and mostavailable reference data is based on measurement withinstruments with spectral resolutions of 1 nm or greater.The fine structure of the solar spectrum is unimportantfor all the applications we know of; most biological andmaterial systems have broad radiation absorptionspectra.
Spectral presentation is more important forsimulators that emit spectra with strong line structure.Low resolution or logarithmic plots of these spectramask the line structure, making the spectra appearcloser to the sun's spectrum. Broadband measurementof the ultraviolet output results in a single totalultraviolet irradiance figure. This can imply a close matchto the sun. The effect of irradiance with these simulatorsdepends on the application, but the result is oftensignificantly different from that produced by solarirradiation, even if the total level within specifiedwavelengths (e.g. UVA, 320 - 400 nm) is similar. See page7-16 for information on effectiveness spectra relevant tothis discussion.
Fig. 1 Top: Actual scan of a simulator with resolution under 2nm; high resolution doesn’t enhance these Dopplerbroadened lines. Middle: Scan of same simulator with 10nm resolution. Bottom: Smoothed version of top curve.We used repeated Savitsky-Golay smoothing. We use thistechnique for the curves on page 30 where we’recomparing simulator and solar curves.
IRR
AD
IAN
CE
(W
m n
m )
1.6
1.4
1.2
1.0
0.8
0.6
0.4
0.2
0.0800600400 1000 160014001200 1800 240022002000
-2-1
WAVELENGTH (nm)
ASTM 891,AM 1.5 DIRECT
ASTM 892,AM 1.5 GLOBAL
Fig. 5 Standard spectra for AM 1.5. The direct spectrum is from ASTM E891 and global ASTM E892.
Fig. 2 Comparison of the UV portion of the WMO measuredsolar spectrum and the modeled CIE AM 1 directspectrum. All the modeled spectra, CIE or ASTM, used asstandards, omit the fine details seen in measuredspectrum.
8
INTRODUCTION TO SOLAR RADIATION
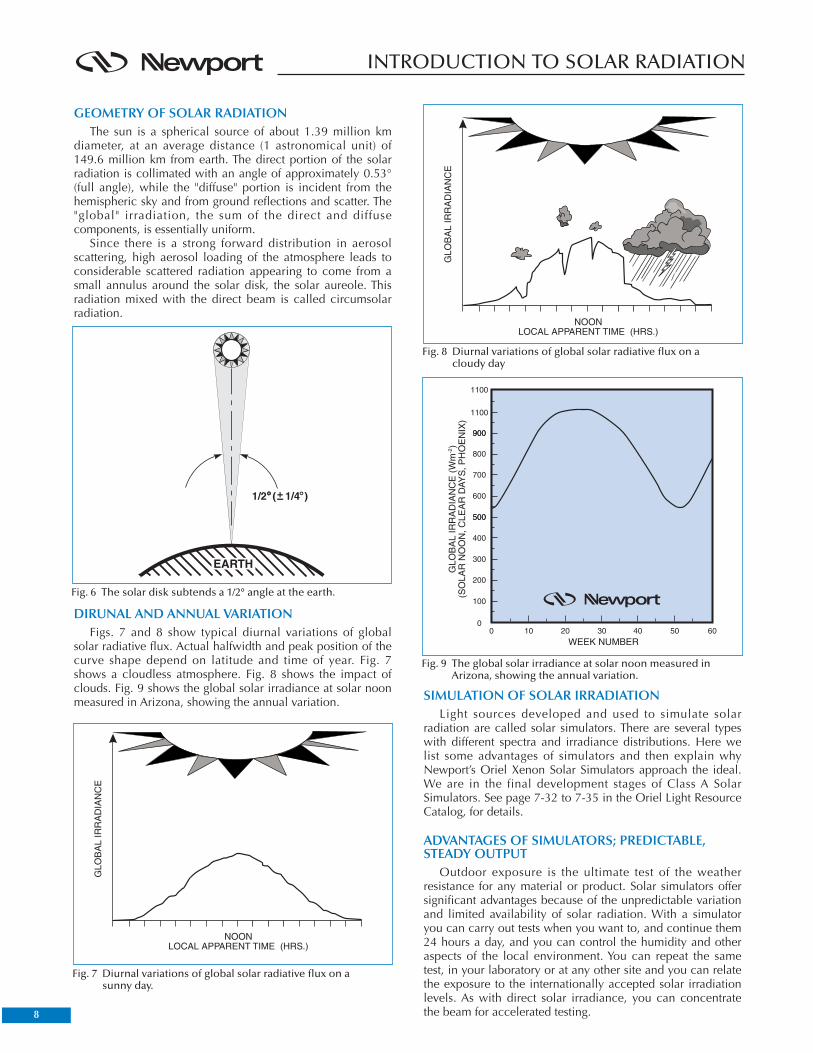
GEOMETRY OF SOLAR RADIATIONThe sun is a spherical source of about 1.39 million km
diameter, at an average distance (1 astronomical unit) of149.6 million km from earth. The direct portion of the solarradiation is collimated with an angle of approximately 0.53°(full angle), while the "diffuse" portion is incident from thehemispheric sky and from ground reflections and scatter. The"global" irradiation, the sum of the direct and diffusecomponents, is essentially uniform.
Since there is a strong forward distribution in aerosolscattering, high aerosol loading of the atmosphere leads toconsiderable scattered radiation appearing to come from asmall annulus around the solar disk, the solar aureole. Thisradiation mixed with the direct beam is called circumsolarradiation.
DIRUNAL AND ANNUAL VARIATIONFigs. 7 and 8 show typical diurnal variations of global
solar radiative flux. Actual halfwidth and peak position of thecurve shape depend on latitude and time of year. Fig. 7shows a cloudless atmosphere. Fig. 8 shows the impact ofclouds. Fig. 9 shows the global solar irradiance at solar noonmeasured in Arizona, showing the annual variation. SIMULATION OF SOLAR IRRADIATION
Light sources developed and used to simulate solarradiation are called solar simulators. There are several typeswith different spectra and irradiance distributions. Here welist some advantages of simulators and then explain whyNewport’s Oriel Xenon Solar Simulators approach the ideal.We are in the final development stages of Class A SolarSimulators. See page 7-32 to 7-35 in the Oriel Light ResourceCatalog, for details.
ADVANTAGES OF SIMULATORS; PREDICTABLE,STEADY OUTPUT
Outdoor exposure is the ultimate test of the weatherresistance for any material or product. Solar simulators offersignificant advantages because of the unpredictable variationand limited availability of solar radiation. With a simulatoryou can carry out tests when you want to, and continue them24 hours a day, and you can control the humidity and otheraspects of the local environment. You can repeat the sametest, in your laboratory or at any other site and you can relatethe exposure to the internationally accepted solar irradiationlevels. As with direct solar irradiance, you can concentratethe beam for accelerated testing.
Fig. 6 The solar disk subtends a 1/2° angle at the earth.
Fig. 8 Diurnal variations of global solar radiative flux on acloudy day
Fig. 7 Diurnal variations of global solar radiative flux on asunny day.
Fig. 9 The global solar irradiance at solar noon measured inArizona, showing the annual variation.
9
SIMULATION OF SOLAR RADIATION
TYPES OF SIMULATORSThere are several types of solar simulators, differing in
spectral power distribution and irradiance geometry. The typeof lamp determines the spectral power distribution, althoughthe spectrum may be modified by optical filters. The beamoptics determine efficiency and irradiance geometry.
ORIEL XENON ARC LAMP SOLAR SIMULATORSOur Oriel Solar Simulators provide the closest spectral
match to solar spectra available from any artificial source. Thematch is not exact but better than needed for manyapplications. Our curves (see pages 30 to 32) clearly showthe differences for the various solar Air Mass spectra. (We canproduce more exact matches over limited spectral ranges.)
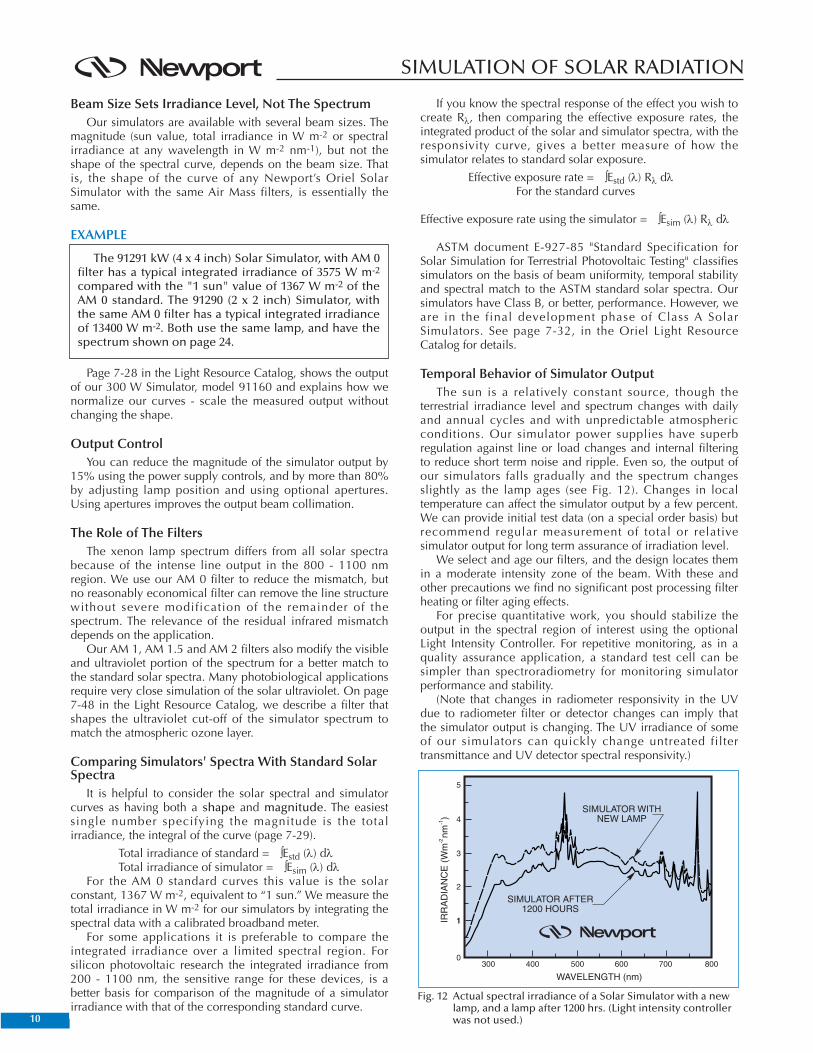
Fig. 11 shows the optics of the Oriel Simulators. Thexenon arc lamp at the heart of the device emits a 5800Kblackbody-like spectrum with occasional line structure. Thesmall high radiance arc allows efficient beam collimation.The system design features low F/# collection, optical beamhomogenization and filtering and finally, collimation. Theresult is a continuous output with a solar-like spectrum in auniform collimated beam. Beam collimation simulates thedirect terrestrial beam and allows characterization ofradiation induced phenomena.
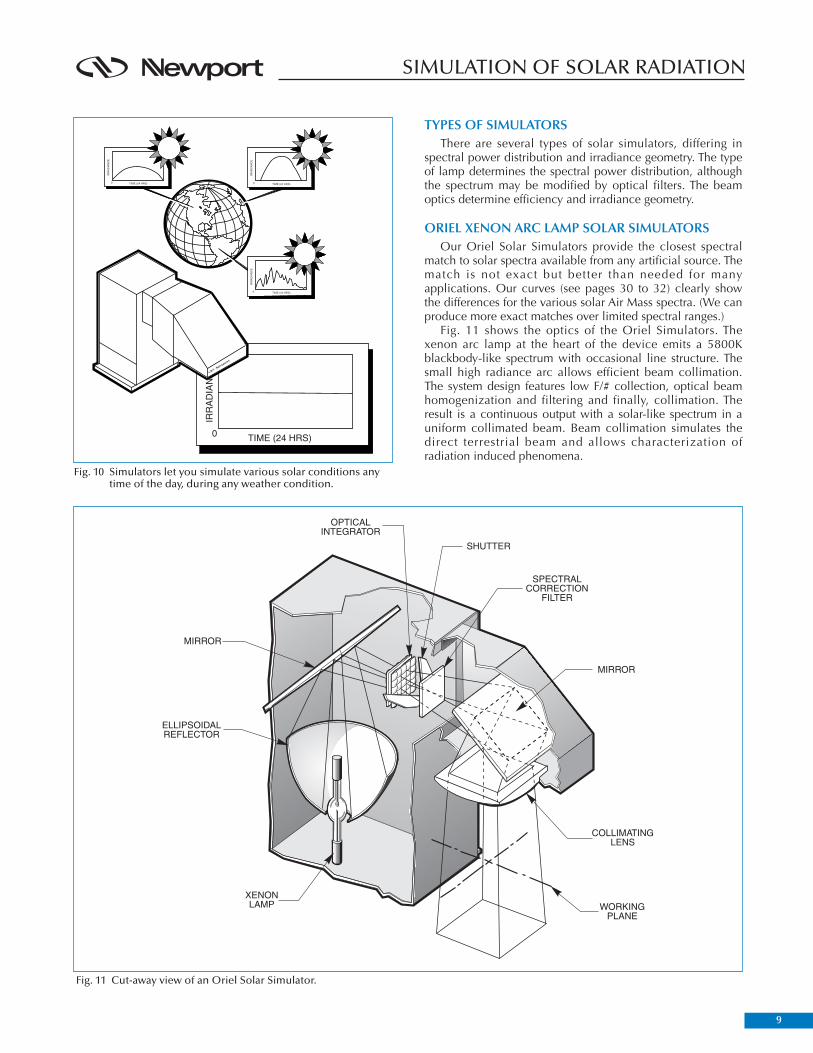
Fig. 10 Simulators let you simulate various solar conditions anytime of the day, during any weather condition.
Fig. 11 Cut-away view of an Oriel Solar Simulator.
10
SIMULATION OF SOLAR RADIATION
Beam Size Sets Irradiance Level, Not The SpectrumOur simulators are available with several beam sizes. The
magnitude (sun value, total irradiance in W m-2 or spectralirradiance at any wavelength in W m-2 nm-1), but not theshape of the spectral curve, depends on the beam size. Thatis, the shape of the curve of any Newport’s Oriel SolarSimulator with the same Air Mass filters, is essentially thesame.
EXAMPLE
Page 7-28 in the Light Resource Catalog, shows the outputof our 300 W Simulator, model 91160 and explains how wenormalize our curves - scale the measured output withoutchanging the shape.
Output ControlYou can reduce the magnitude of the simulator output by
15% using the power supply controls, and by more than 80%by adjusting lamp position and using optional apertures.Using apertures improves the output beam collimation.
The Role of The FiltersThe xenon lamp spectrum differs from all solar spectra
because of the intense line output in the 800 - 1100 nmregion. We use our AM 0 filter to reduce the mismatch, butno reasonably economical filter can remove the line structurewithout severe modification of the remainder of thespectrum. The relevance of the residual infrared mismatchdepends on the application.
Our AM 1, AM 1.5 and AM 2 filters also modify the visibleand ultraviolet portion of the spectrum for a better match tothe standard solar spectra. Many photobiological applicationsrequire very close simulation of the solar ultraviolet. On page7-48 in the Light Resource Catalog, we describe a filter thatshapes the ultraviolet cut-off of the simulator spectrum tomatch the atmospheric ozone layer.
Comparing Simulators' Spectra With Standard SolarSpectra
It is helpful to consider the solar spectral and simulatorcurves as having both a shape and magnitude. The easiestsingle number specifying the magnitude is the totalirradiance, the integral of the curve (page 7-29).
Total irradiance of standard = ∫Estd (λ) dλTotal irradiance of simulator = ∫Esim (λ) dλ
For the AM 0 standard curves this value is the solarconstant, 1367 W m-2, equivalent to “1 sun.” We measure thetotal irradiance in W m-2 for our simulators by integrating thespectral data with a calibrated broadband meter.
For some applications it is preferable to compare theintegrated irradiance over a limited spectral region. Forsilicon photovoltaic research the integrated irradiance from200 - 1100 nm, the sensitive range for these devices, is abetter basis for comparison of the magnitude of a simulatorirradiance with that of the corresponding standard curve.
If you know the spectral response of the effect you wish tocreate Rλ, then comparing the effective exposure rates, theintegrated product of the solar and simulator spectra, with theresponsivity curve, gives a better measure of how thesimulator relates to standard solar exposure.
Effective exposure rate = ∫Estd (λ) Rλ dλFor the standard curves
Effective exposure rate using the simulator = ∫Esim (λ) Rλ dλ
ASTM document E-927-85 "Standard Specification forSolar Simulation for Terrestrial Photovoltaic Testing" classifiessimulators on the basis of beam uniformity, temporal stabilityand spectral match to the ASTM standard solar spectra. Oursimulators have Class B, or better, performance. However, weare in the final development phase of Class A SolarSimulators. See page 7-32, in the Oriel Light ResourceCatalog for details.
Temporal Behavior of Simulator OutputThe sun is a relatively constant source, though the
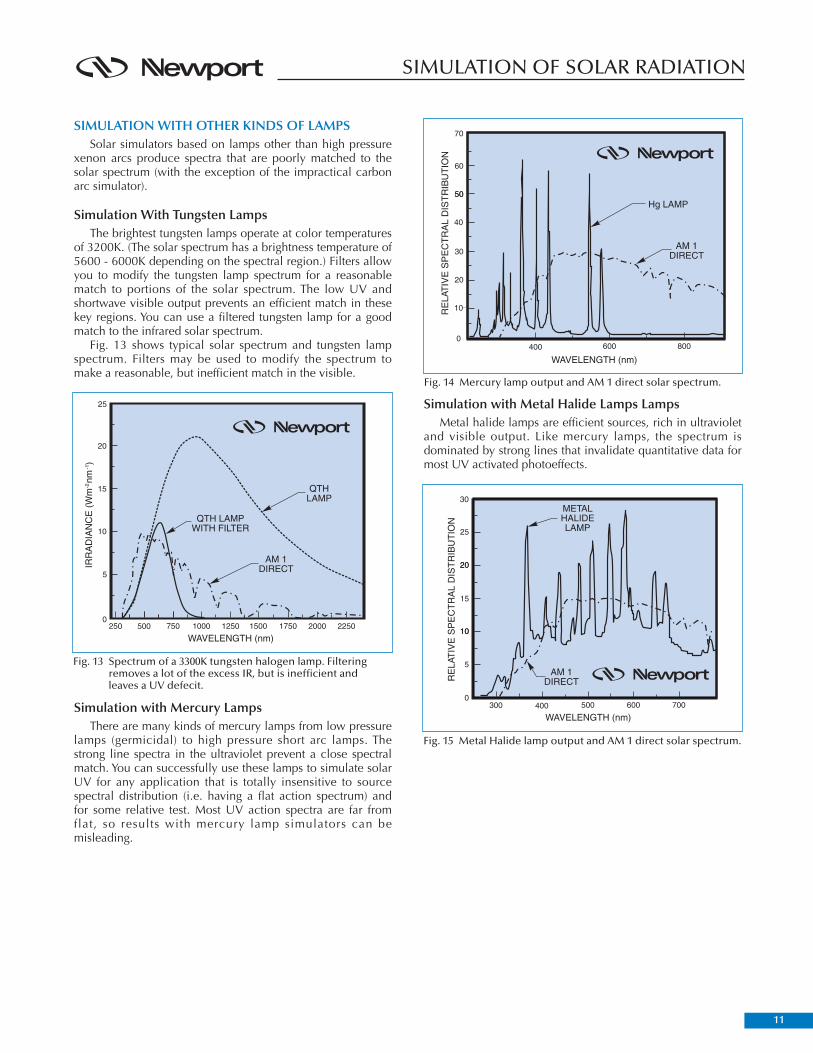
terrestrial irradiance level and spectrum changes with dailyand annual cycles and with unpredictable atmosphericconditions. Our simulator power supplies have superbregulation against line or load changes and internal filteringto reduce short term noise and ripple. Even so, the output ofour simulators falls gradually and the spectrum changesslightly as the lamp ages (see Fig. 12). Changes in localtemperature can affect the simulator output by a few percent.We can provide initial test data (on a special order basis) butrecommend regular measurement of total or relativesimulator output for long term assurance of irradiation level.
We select and age our filters, and the design locates themin a moderate intensity zone of the beam. With these andother precautions we find no significant post processing filterheating or filter aging effects.
For precise quantitative work, you should stabilize theoutput in the spectral region of interest using the optionalLight Intensity Controller. For repetitive monitoring, as in aquality assurance application, a standard test cell can besimpler than spectroradiometry for monitoring simulatorperformance and stability.
(Note that changes in radiometer responsivity in the UVdue to radiometer filter or detector changes can imply thatthe simulator output is changing. The UV irradiance of someof our simulators can quickly change untreated filtertransmittance and UV detector spectral responsivity.)
Fig. 12 Actual spectral irradiance of a Solar Simulator with a newlamp, and a lamp after 1200 hrs. (Light intensity controllerwas not used.)
The 91291 kW (4 x 4 inch) Solar Simulator, with AM 0filter has a typical integrated irradiance of 3575 W m-2
compared with the "1 sun" value of 1367 W m-2 of theAM 0 standard. The 91290 (2 x 2 inch) Simulator, withthe same AM 0 filter has a typical integrated irradianceof 13400 W m-2. Both use the same lamp, and have thespectrum shown on page 24.
11
SIMULATION OF SOLAR RADIATION
SIMULATION WITH OTHER KINDS OF LAMPSSolar simulators based on lamps other than high pressure
xenon arcs produce spectra that are poorly matched to thesolar spectrum (with the exception of the impractical carbonarc simulator).
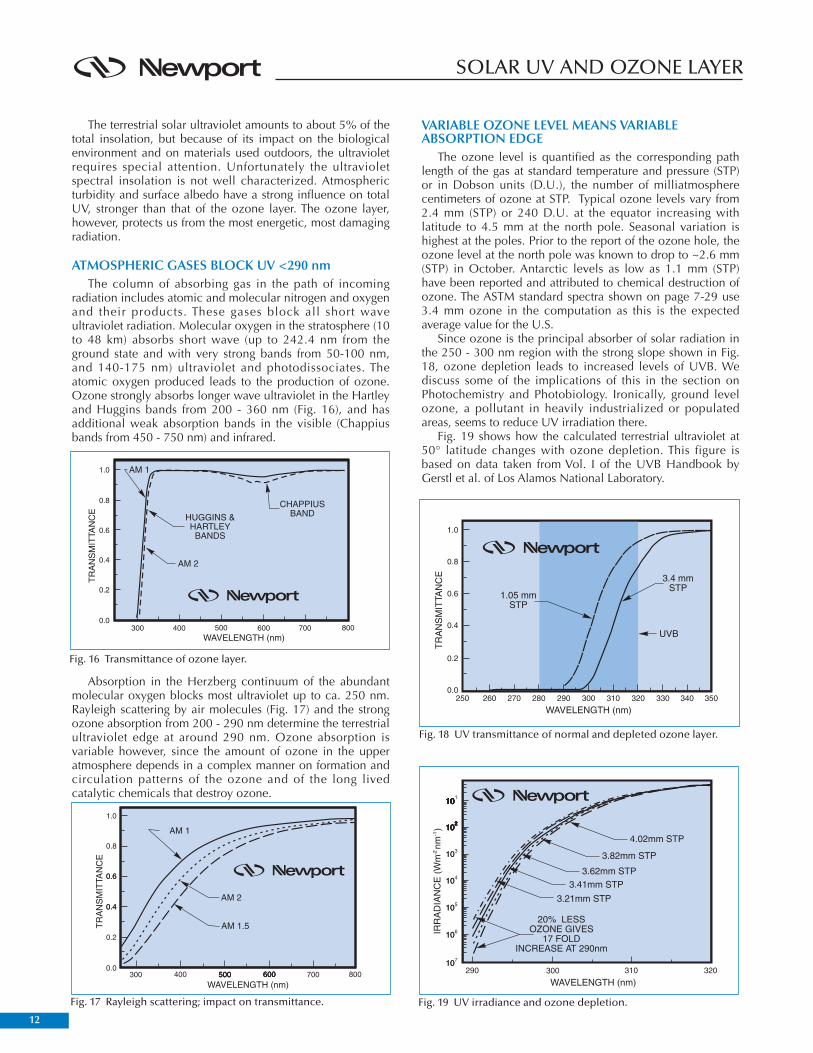
Simulation With Tungsten LampsThe brightest tungsten lamps operate at color temperatures
of 3200K. (The solar spectrum has a brightness temperature of5600 - 6000K depending on the spectral region.) Filters allowyou to modify the tungsten lamp spectrum for a reasonablematch to portions of the solar spectrum. The low UV andshortwave visible output prevents an efficient match in thesekey regions. You can use a filtered tungsten lamp for a goodmatch to the infrared solar spectrum.
Fig. 13 shows typical solar spectrum and tungsten lampspectrum. Filters may be used to modify the spectrum tomake a reasonable, but inefficient match in the visible.
Simulation with Mercury LampsThere are many kinds of mercury lamps from low pressure
lamps (germicidal) to high pressure short arc lamps. Thestrong line spectra in the ultraviolet prevent a close spectralmatch. You can successfully use these lamps to simulate solarUV for any application that is totally insensitive to sourcespectral distribution (i.e. having a flat action spectrum) andfor some relative test. Most UV action spectra are far fromflat, so results with mercury lamp simulators can bemisleading.
Simulation with Metal Halide Lamps LampsMetal halide lamps are efficient sources, rich in ultraviolet
and visible output. Like mercury lamps, the spectrum isdominated by strong lines that invalidate quantitative data formost UV activated photoeffects.
Fig. 13 Spectrum of a 3300K tungsten halogen lamp. Filteringremoves a lot of the excess IR, but is inefficient andleaves a UV defecit.
Fig. 14 Mercury lamp output and AM 1 direct solar spectrum.
Fig. 15 Metal Halide lamp output and AM 1 direct solar spectrum.
12
SOLAR UV AND OZONE LAYER
The terrestrial solar ultraviolet amounts to about 5% of thetotal insolation, but because of its impact on the biologicalenvironment and on materials used outdoors, the ultravioletrequires special attention. Unfortunately the ultravioletspectral insolation is not well characterized. Atmosphericturbidity and surface albedo have a strong influence on totalUV, stronger than that of the ozone layer. The ozone layer,however, protects us from the most energetic, most damagingradiation.
ATMOSPHERIC GASES BLOCK UV <290 nm The column of absorbing gas in the path of incoming
radiation includes atomic and molecular nitrogen and oxygenand their products. These gases block all short waveultraviolet radiation. Molecular oxygen in the stratosphere (10to 48 km) absorbs short wave (up to 242.4 nm from theground state and with very strong bands from 50-100 nm,and 140-175 nm) ultraviolet and photodissociates. Theatomic oxygen produced leads to the production of ozone.Ozone strongly absorbs longer wave ultraviolet in the Hartleyand Huggins bands from 200 - 360 nm (Fig. 16), and hasadditional weak absorption bands in the visible (Chappiusbands from 450 - 750 nm) and infrared.
Absorption in the Herzberg continuum of the abundantmolecular oxygen blocks most ultraviolet up to ca. 250 nm.Rayleigh scattering by air molecules (Fig. 17) and the strongozone absorption from 200 - 290 nm determine the terrestrialultraviolet edge at around 290 nm. Ozone absorption isvariable however, since the amount of ozone in the upperatmosphere depends in a complex manner on formation andcirculation patterns of the ozone and of the long livedcatalytic chemicals that destroy ozone.
VARIABLE OZONE LEVEL MEANS VARIABLEABSORPTION EDGE
The ozone level is quantified as the corresponding pathlength of the gas at standard temperature and pressure (STP)or in Dobson units (D.U.), the number of milliatmospherecentimeters of ozone at STP. Typical ozone levels vary from2.4 mm (STP) or 240 D.U. at the equator increasing withlatitude to 4.5 mm at the north pole. Seasonal variation ishighest at the poles. Prior to the report of the ozone hole, theozone level at the north pole was known to drop to ~2.6 mm(STP) in October. Antarctic levels as low as 1.1 mm (STP)have been reported and attributed to chemical destruction ofozone. The ASTM standard spectra shown on page 7-29 use3.4 mm ozone in the computation as this is the expectedaverage value for the U.S.
Since ozone is the principal absorber of solar radiation inthe 250 - 300 nm region with the strong slope shown in Fig.18, ozone depletion leads to increased levels of UVB. Wediscuss some of the implications of this in the section onPhotochemistry and Photobiology. Ironically, ground levelozone, a pollutant in heavily industrialized or populatedareas, seems to reduce UV irradiation there.
Fig. 19 shows how the calculated terrestrial ultraviolet at50° latitude changes with ozone depletion. This figure isbased on data taken from Vol. I of the UVB Handbook byGerstl et al. of Los Alamos National Laboratory.
Fig. 16 Transmittance of ozone layer.
Fig. 18 UV transmittance of normal and depleted ozone layer.
Fig. 17 Rayleigh scattering; impact on transmittance. Fig. 19 UV irradiance and ozone depletion.
13
PHOTOCHEMISTRY AND PHOTOBIOLOGY
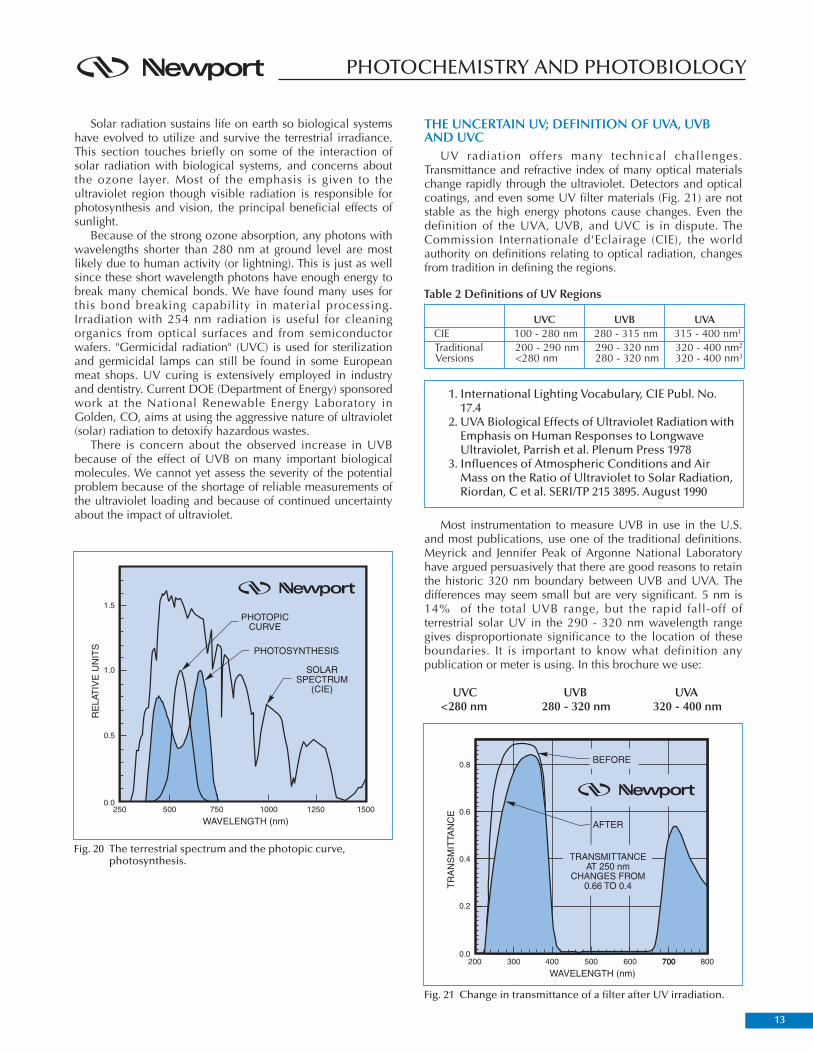
Solar radiation sustains life on earth so biological systemshave evolved to utilize and survive the terrestrial irradiance.This section touches briefly on some of the interaction ofsolar radiation with biological systems, and concerns aboutthe ozone layer. Most of the emphasis is given to theultraviolet region though visible radiation is responsible forphotosynthesis and vision, the principal beneficial effects ofsunlight.
Because of the strong ozone absorption, any photons withwavelengths shorter than 280 nm at ground level are mostlikely due to human activity (or lightning). This is just as wellsince these short wavelength photons have enough energy tobreak many chemical bonds. We have found many uses forthis bond breaking capability in material processing.Irradiation with 254 nm radiation is useful for cleaningorganics from optical surfaces and from semiconductorwafers. "Germicidal radiation" (UVC) is used for sterilizationand germicidal lamps can still be found in some Europeanmeat shops. UV curing is extensively employed in industryand dentistry. Current DOE (Department of Energy) sponsoredwork at the National Renewable Energy Laboratory inGolden, CO, aims at using the aggressive nature of ultraviolet(solar) radiation to detoxify hazardous wastes.
There is concern about the observed increase in UVBbecause of the effect of UVB on many important biologicalmolecules. We cannot yet assess the severity of the potentialproblem because of the shortage of reliable measurements ofthe ultraviolet loading and because of continued uncertaintyabout the impact of ultraviolet.
THE UNCERTAIN UV; DEFINITION OF UVA, UVBAND UVC
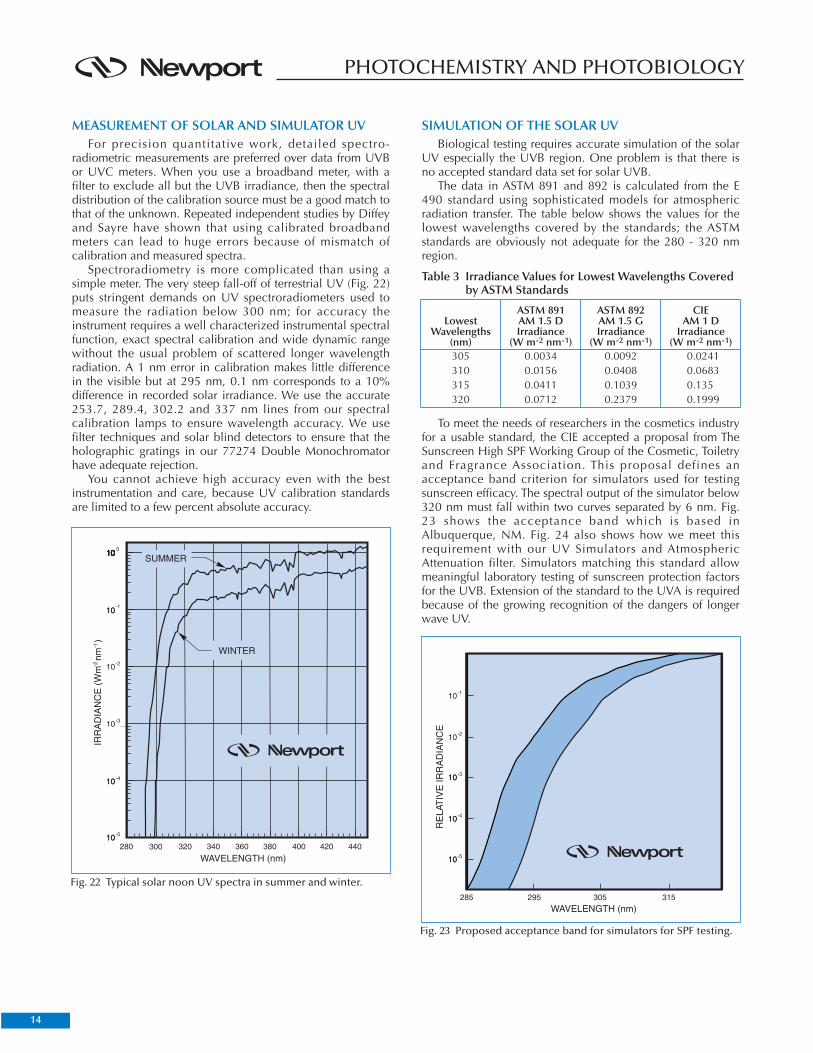
UV radiation offers many technical challenges.Transmittance and refractive index of many optical materialschange rapidly through the ultraviolet. Detectors and opticalcoatings, and even some UV filter materials (Fig. 21) are notstable as the high energy photons cause changes. Even thedefinition of the UVA, UVB, and UVC is in dispute. TheCommission Internationale d'Eclairage (CIE), the worldauthority on definitions relating to optical radiation, changesfrom tradition in defining the regions.
Most instrumentation to measure UVB in use in the U.S.and most publications, use one of the traditional definitions.Meyrick and Jennifer Peak of Argonne National Laboratoryhave argued persuasively that there are good reasons to retainthe historic 320 nm boundary between UVB and UVA. Thedifferences may seem small but are very significant. 5 nm is14% of the total UVB range, but the rapid fall-off ofterrestrial solar UV in the 290 - 320 nm wavelength rangegives disproportionate significance to the location of theseboundaries. It is important to know what definition anypublication or meter is using. In this brochure we use:
UVC UVB UVA<280 nm 280 - 320 nm 320 - 400 nm
Fig. 20 The terrestrial spectrum and the photopic curve,photosynthesis.
Fig. 21 Change in transmittance of a filter after UV irradiation.
1. International Lighting Vocabulary, CIE Publ. No.17.4
2. UVA Biological Effects of Ultraviolet Radiation withEmphasis on Human Responses to LongwaveUltraviolet, Parrish et al. Plenum Press 1978
3. Influences of Atmospheric Conditions and AirMass on the Ratio of Ultraviolet to Solar Radiation,Riordan, C et al. SERI/TP 215 3895. August 1990
UVC UVB UVA
TraditionalVersions
CIE200 - 290 nm<280 nm
100 - 280 nm290 - 320 nm280 - 320 nm
280 - 315 nm320 - 400 nm2
320 - 400 nm3
315 - 400 nm1
Table 2 Definitions of UV Regions
14
PHOTOCHEMISTRY AND PHOTOBIOLOGY
MEASUREMENT OF SOLAR AND SIMULATOR UVFor precision quantitative work, detailed spectro-
radiometric measurements are preferred over data from UVBor UVC meters. When you use a broadband meter, with afilter to exclude all but the UVB irradiance, then the spectraldistribution of the calibration source must be a good match tothat of the unknown. Repeated independent studies by Diffeyand Sayre have shown that using calibrated broadbandmeters can lead to huge errors because of mismatch ofcalibration and measured spectra.
Spectroradiometry is more complicated than using asimple meter. The very steep fall-off of terrestrial UV (Fig. 22)puts stringent demands on UV spectroradiometers used tomeasure the radiation below 300 nm; for accuracy theinstrument requires a well characterized instrumental spectralfunction, exact spectral calibration and wide dynamic rangewithout the usual problem of scattered longer wavelengthradiation. A 1 nm error in calibration makes little differencein the visible but at 295 nm, 0.1 nm corresponds to a 10%difference in recorded solar irradiance. We use the accurate253.7, 289.4, 302.2 and 337 nm lines from our spectralcalibration lamps to ensure wavelength accuracy. We usefilter techniques and solar blind detectors to ensure that theholographic gratings in our 77274 Double Monochromatorhave adequate rejection.
You cannot achieve high accuracy even with the bestinstrumentation and care, because UV calibration standardsare limited to a few percent absolute accuracy.
SIMULATION OF THE SOLAR UVBiological testing requires accurate simulation of the solar
UV especially the UVB region. One problem is that there isno accepted standard data set for solar UVB.
The data in ASTM 891 and 892 is calculated from the E490 standard using sophisticated models for atmosphericradiation transfer. The table below shows the values for thelowest wavelengths covered by the standards; the ASTMstandards are obviously not adequate for the 280 - 320 nmregion.
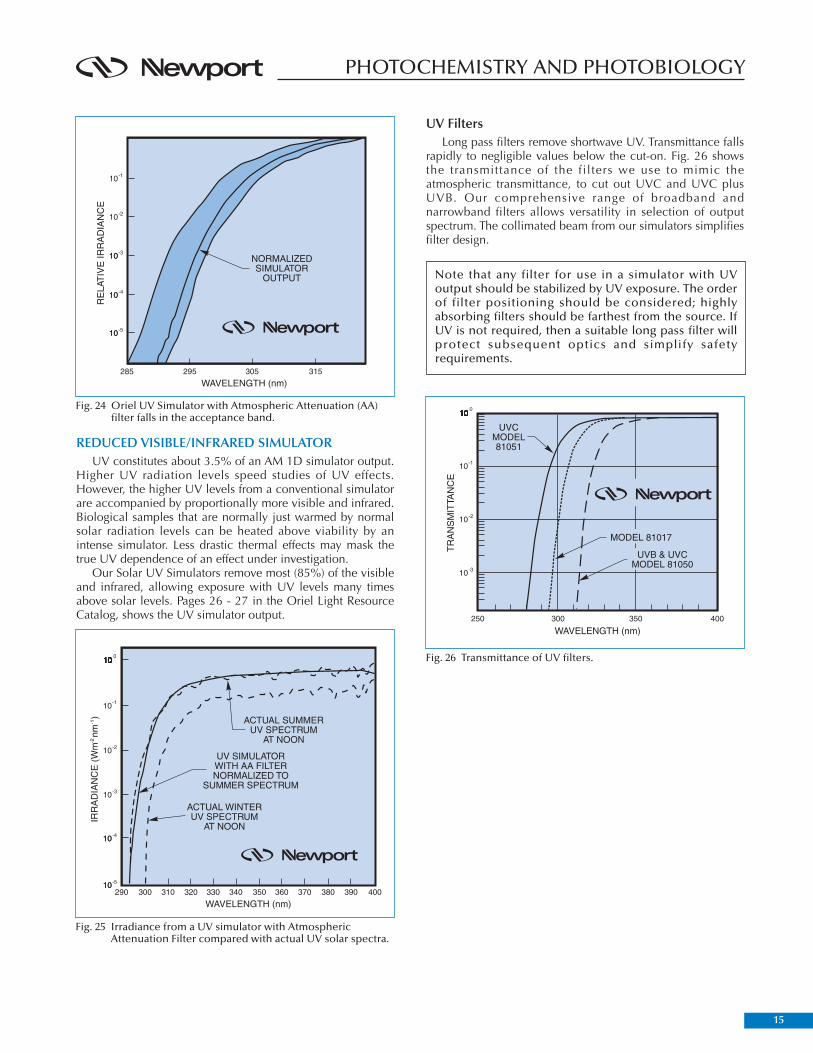
To meet the needs of researchers in the cosmetics industryfor a usable standard, the CIE accepted a proposal from TheSunscreen High SPF Working Group of the Cosmetic, Toiletryand Fragrance Association. This proposal defines anacceptance band criterion for simulators used for testingsunscreen efficacy. The spectral output of the simulator below320 nm must fall within two curves separated by 6 nm. Fig.23 shows the acceptance band which is based inAlbuquerque, NM. Fig. 24 also shows how we meet thisrequirement with our UV Simulators and AtmosphericAttenuation filter. Simulators matching this standard allowmeaningful laboratory testing of sunscreen protection factorsfor the UVB. Extension of the standard to the UVA is requiredbecause of the growing recognition of the dangers of longerwave UV.
Fig. 23 Proposed acceptance band for simulators for SPF testing.
Fig. 22 Typical solar noon UV spectra in summer and winter.
Table 3 Irradiance Values for Lowest Wavelengths Coveredby ASTM Standards
LowestWavelengths
(nm)
ASTM 891AM 1.5 DIrradiance
(W m-2 nm-1)
ASTM 892AM 1.5 GIrradiance
(W m-2 nm-1)
CIEAM 1 D
Irradiance(W m-2 nm-1)
320
310315
305
0.0712
0.01560.0411
0.0034
0.2379
0.04080.1039
0.0092
0.1999
0.06830.135
0.0241
15
PHOTOCHEMISTRY AND PHOTOBIOLOGY
REDUCED VISIBLE/INFRARED SIMULATORUV constitutes about 3.5% of an AM 1D simulator output.
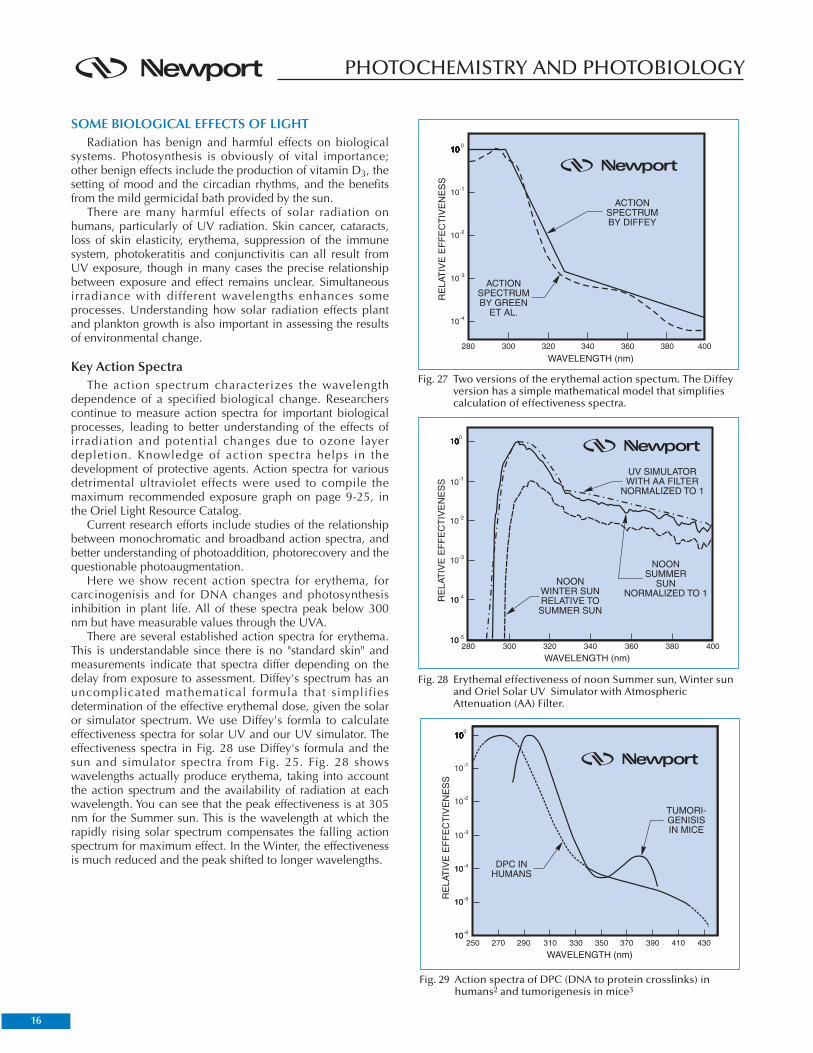
Higher UV radiation levels speed studies of UV effects.However, the higher UV levels from a conventional simulatorare accompanied by proportionally more visible and infrared.Biological samples that are normally just warmed by normalsolar radiation levels can be heated above viability by anintense simulator. Less drastic thermal effects may mask thetrue UV dependence of an effect under investigation.
Our Solar UV Simulators remove most (85%) of the visibleand infrared, allowing exposure with UV levels many timesabove solar levels. Pages 26 - 27 in the Oriel Light ResourceCatalog, shows the UV simulator output.
UV FiltersLong pass filters remove shortwave UV. Transmittance falls
rapidly to negligible values below the cut-on. Fig. 26 showsthe transmittance of the filters we use to mimic theatmospheric transmittance, to cut out UVC and UVC plusUVB. Our comprehensive range of broadband andnarrowband filters allows versatility in selection of outputspectrum. The collimated beam from our simulators simplifiesfilter design.
Fig. 25 Irradiance from a UV simulator with AtmosphericAttenuation Filter compared with actual UV solar spectra.
Fig. 26 Transmittance of UV filters.
Note that any filter for use in a simulator with UVoutput should be stabilized by UV exposure. The orderof filter positioning should be considered; highlyabsorbing filters should be farthest from the source. IfUV is not required, then a suitable long pass filter willprotect subsequent optics and simplify safetyrequirements.
Fig. 24 Oriel UV Simulator with Atmospheric Attenuation (AA)filter falls in the acceptance band.
16
PHOTOCHEMISTRY AND PHOTOBIOLOGY
SOME BIOLOGICAL EFFECTS OF LIGHTRadiation has benign and harmful effects on biological
systems. Photosynthesis is obviously of vital importance;other benign effects include the production of vitamin D3, thesetting of mood and the circadian rhythms, and the benefitsfrom the mild germicidal bath provided by the sun.
There are many harmful effects of solar radiation onhumans, particularly of UV radiation. Skin cancer, cataracts,loss of skin elasticity, erythema, suppression of the immunesystem, photokeratitis and conjunctivitis can all result fromUV exposure, though in many cases the precise relationshipbetween exposure and effect remains unclear. Simultaneousirradiance with different wavelengths enhances someprocesses. Understanding how solar radiation effects plantand plankton growth is also important in assessing the resultsof environmental change.
Key Action SpectraThe action spectrum characterizes the wavelength
dependence of a specified biological change. Researcherscontinue to measure action spectra for important biologicalprocesses, leading to better understanding of the effects ofirradiation and potential changes due to ozone layerdepletion. Knowledge of action spectra helps in thedevelopment of protective agents. Action spectra for variousdetrimental ultraviolet effects were used to compile themaximum recommended exposure graph on page 9-25, inthe Oriel Light Resource Catalog.
Current research efforts include studies of the relationshipbetween monochromatic and broadband action spectra, andbetter understanding of photoaddition, photorecovery and thequestionable photoaugmentation.
Here we show recent action spectra for erythema, forcarcinogenisis and for DNA changes and photosynthesisinhibition in plant life. All of these spectra peak below 300nm but have measurable values through the UVA.
There are several established action spectra for erythema.This is understandable since there is no "standard skin" andmeasurements indicate that spectra differ depending on thedelay from exposure to assessment. Diffey's spectrum has anuncomplicated mathematical formula that simplifiesdetermination of the effective erythemal dose, given the solaror simulator spectrum. We use Diffey's formla to calculateeffectiveness spectra for solar UV and our UV simulator. Theeffectiveness spectra in Fig. 28 use Diffey's formula and thesun and simulator spectra from Fig. 25. Fig. 28 showswavelengths actually produce erythema, taking into accountthe action spectrum and the availability of radiation at eachwavelength. You can see that the peak effectiveness is at 305nm for the Summer sun. This is the wavelength at which therapidly rising solar spectrum compensates the falling actionspectrum for maximum effect. In the Winter, the effectivenessis much reduced and the peak shifted to longer wavelengths.
Fig. 28 Erythemal effectiveness of noon Summer sun, Winter sunand Oriel Solar UV Simulator with AtmosphericAttenuation (AA) Filter.
Fig. 27 Two versions of the erythemal action spectum. The Diffeyversion has a simple mathematical model that simplifiescalculation of effectiveness spectra.
Fig. 29 Action spectra of DPC (DNA to protein crosslinks) inhumans2 and tumorigenesis in mice3
17
PHOTOCHEMISTRY AND PHOTOBIOLOGY
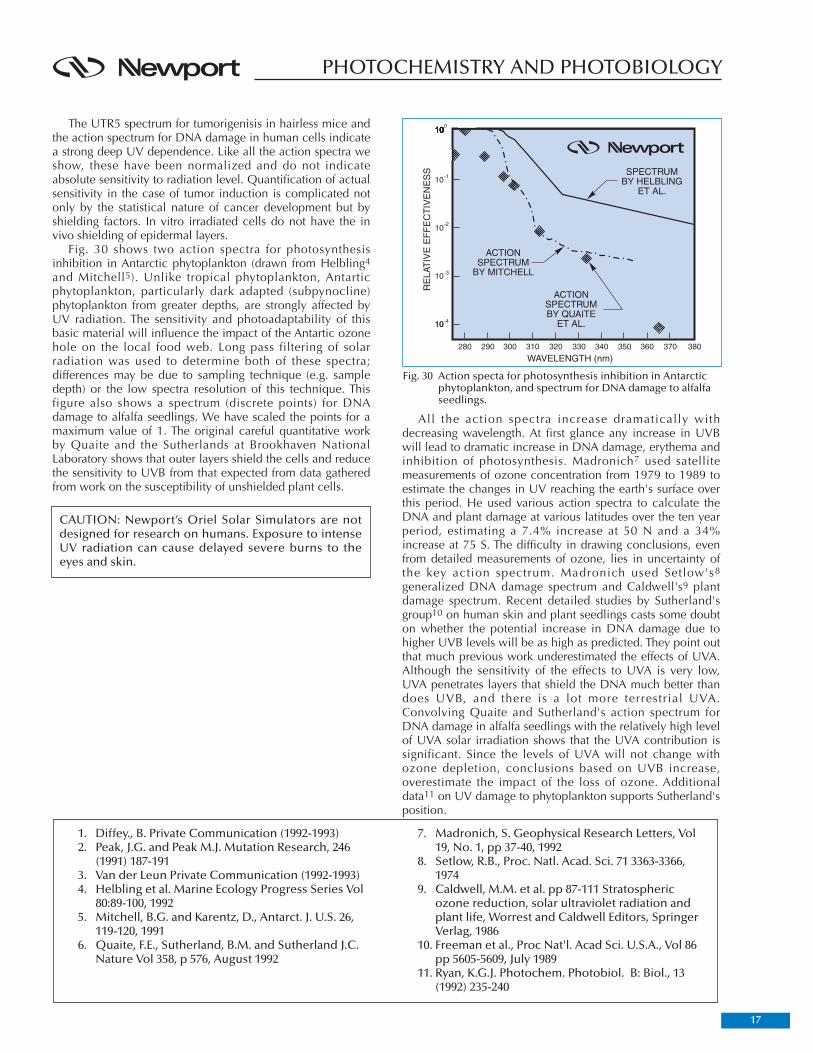
The UTR5 spectrum for tumorigenisis in hairless mice andthe action spectrum for DNA damage in human cells indicatea strong deep UV dependence. Like all the action spectra weshow, these have been normalized and do not indicateabsolute sensitivity to radiation level. Quantification of actualsensitivity in the case of tumor induction is complicated notonly by the statistical nature of cancer development but byshielding factors. In vitro irradiated cells do not have the invivo shielding of epidermal layers.
Fig. 30 shows two action spectra for photosynthesisinhibition in Antarctic phytoplankton (drawn from Helbling4
and Mitchell5). Unlike tropical phytoplankton, Antarticphytoplankton, particularly dark adapted (subpynocline)phytoplankton from greater depths, are strongly affected byUV radiation. The sensitivity and photoadaptability of thisbasic material will influence the impact of the Antartic ozonehole on the local food web. Long pass filtering of solarradiation was used to determine both of these spectra;differences may be due to sampling technique (e.g. sampledepth) or the low spectra resolution of this technique. Thisfigure also shows a spectrum (discrete points) for DNAdamage to alfalfa seedlings. We have scaled the points for amaximum value of 1. The original careful quantitative workby Quaite and the Sutherlands at Brookhaven NationalLaboratory shows that outer layers shield the cells and reducethe sensitivity to UVB from that expected from data gatheredfrom work on the susceptibility of unshielded plant cells.
All the action spectra increase dramatically withdecreasing wavelength. At first glance any increase in UVBwill lead to dramatic increase in DNA damage, erythema andinhibition of photosynthesis. Madronich7 used satellitemeasurements of ozone concentration from 1979 to 1989 toestimate the changes in UV reaching the earth's surface overthis period. He used various action spectra to calculate theDNA and plant damage at various latitudes over the ten yearperiod, estimating a 7.4% increase at 50 N and a 34%increase at 75 S. The difficulty in drawing conclusions, evenfrom detailed measurements of ozone, lies in uncertainty ofthe key action spectrum. Madronich used Setlow's8
generalized DNA damage spectrum and Caldwell's9 plantdamage spectrum. Recent detailed studies by Sutherland'sgroup10 on human skin and plant seedlings casts some doubton whether the potential increase in DNA damage due tohigher UVB levels will be as high as predicted. They point outthat much previous work underestimated the effects of UVA.Although the sensitivity of the effects to UVA is very low,UVA penetrates layers that shield the DNA much better thandoes UVB, and there is a lot more terrestrial UVA.Convolving Quaite and Sutherland's action spectrum forDNA damage in alfalfa seedlings with the relatively high levelof UVA solar irradiation shows that the UVA contribution issignificant. Since the levels of UVA will not change withozone depletion, conclusions based on UVB increase,overestimate the impact of the loss of ozone. Additionaldata11 on UV damage to phytoplankton supports Sutherland'sposition.
Fig. 30 Action specta for photosynthesis inhibition in Antarcticphytoplankton, and spectrum for DNA damage to alfalfaseedlings.
CAUTION: Newport’s Oriel Solar Simulators are notdesigned for research on humans. Exposure to intenseUV radiation can cause delayed severe burns to theeyes and skin.
1. Diffey., B. Private Communication (1992-1993)2. Peak, J.G. and Peak M.J. Mutation Research, 246
(1991) 187-1913. Van der Leun Private Communication (1992-1993)4. Helbling et al. Marine Ecology Progress Series Vol
80:89-100, 19925. Mitchell, B.G. and Karentz, D., Antarct. J. U.S. 26,
119-120, 19916. Quaite, F.E., Sutherland, B.M. and Sutherland J.C.
Nature Vol 358, p 576, August 1992
7. Madronich, S. Geophysical Research Letters, Vol19, No. 1, pp 37-40, 1992
8. Setlow, R.B., Proc. Natl. Acad. Sci. 71 3363-3366,1974
9. Caldwell, M.M. et al. pp 87-111 Stratosphericozone reduction, solar ultraviolet radiation andplant life, Worrest and Caldwell Editors, SpringerVerlag, 1986
10. Freeman et al., Proc Nat'l. Acad Sci. U.S.A., Vol 86pp 5605-5609, July 1989
11. Ryan, K.G.J. Photochem. Photobiol. B: Biol., 13(1992) 235-240
18
ENERGY CONVERSION
The sun provides 1 kW m-2 of free, non polluting, powerfor several hours every day. Thermal and photovoltaic systemstake advantage of this as does the biomass. Coal, oil, plantethanol, and wood are all forms of stored solar energy.
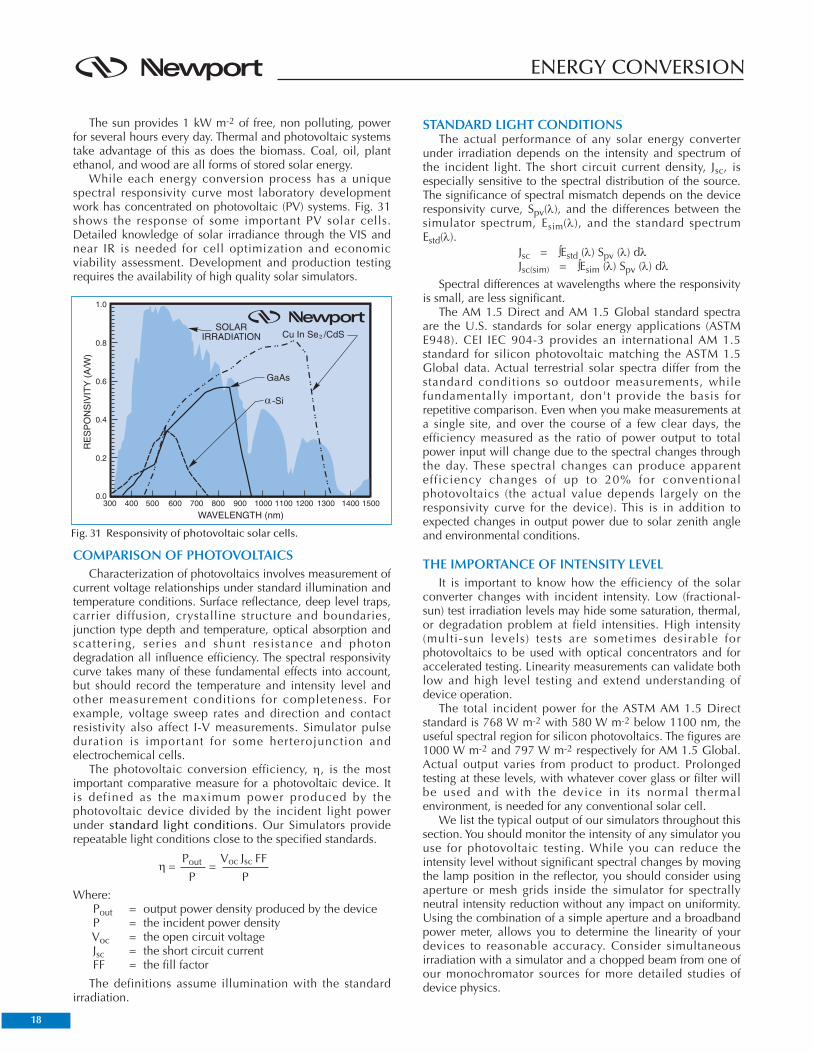
While each energy conversion process has a uniquespectral responsivity curve most laboratory developmentwork has concentrated on photovoltaic (PV) systems. Fig. 31shows the response of some important PV solar cells.Detailed knowledge of solar irradiance through the VIS andnear IR is needed for cell optimization and economicviability assessment. Development and production testingrequires the availability of high quality solar simulators.
COMPARISON OF PHOTOVOLTAICSCharacterization of photovoltaics involves measurement of
current voltage relationships under standard illumination andtemperature conditions. Surface reflectance, deep level traps,carrier diffusion, crystalline structure and boundaries,junction type depth and temperature, optical absorption andscattering, series and shunt resistance and photondegradation all influence efficiency. The spectral responsivitycurve takes many of these fundamental effects into account,but should record the temperature and intensity level andother measurement conditions for completeness. Forexample, voltage sweep rates and direction and contactresistivity also affect I-V measurements. Simulator pulseduration is important for some herterojunction andelectrochemical cells.
The photovoltaic conversion efficiency, η, is the mostimportant comparative measure for a photovoltaic device. Itis defined as the maximum power produced by thephotovoltaic device divided by the incident light powerunder standard light conditions. Our Simulators providerepeatable light conditions close to the specified standards.
Where:Pout = output power density produced by the deviceP = the incident power densityVoc = the open circuit voltageJsc = the short circuit currentFF = the fill factor
The definitions assume illumination with the standardirradiation.
STANDARD LIGHT CONDITIONSThe actual performance of any solar energy converter
under irradiation depends on the intensity and spectrum ofthe incident light. The short circuit current density, Jsc, isespecially sensitive to the spectral distribution of the source.The significance of spectral mismatch depends on the deviceresponsivity curve, Spv(λ), and the differences between thesimulator spectrum, Esim(λ), and the standard spectrumEstd(λ).
Jsc = ∫Estd (λ) Spv (λ) dλJsc(sim) = ∫Esim (λ) Spv (λ) dλ
Spectral differences at wavelengths where the responsivityis small, are less significant.
The AM 1.5 Direct and AM 1.5 Global standard spectraare the U.S. standards for solar energy applications (ASTME948). CEI IEC 904-3 provides an international AM 1.5standard for silicon photovoltaic matching the ASTM 1.5Global data. Actual terrestrial solar spectra differ from thestandard conditions so outdoor measurements, whilefundamentally important, don't provide the basis forrepetitive comparison. Even when you make measurements ata single site, and over the course of a few clear days, theefficiency measured as the ratio of power output to totalpower input will change due to the spectral changes throughthe day. These spectral changes can produce apparentefficiency changes of up to 20% for conventionalphotovoltaics (the actual value depends largely on theresponsivity curve for the device). This is in addition toexpected changes in output power due to solar zenith angleand environmental conditions.
THE IMPORTANCE OF INTENSITY LEVELIt is important to know how the efficiency of the solar
converter changes with incident intensity. Low (fractional-sun) test irradiation levels may hide some saturation, thermal,or degradation problem at field intensities. High intensity(multi-sun levels) tests are sometimes desirable forphotovoltaics to be used with optical concentrators and foraccelerated testing. Linearity measurements can validate bothlow and high level testing and extend understanding ofdevice operation.
The total incident power for the ASTM AM 1.5 Directstandard is 768 W m-2 with 580 W m-2 below 1100 nm, theuseful spectral region for silicon photovoltaics. The figures are1000 W m-2 and 797 W m-2 respectively for AM 1.5 Global.Actual output varies from product to product. Prolongedtesting at these levels, with whatever cover glass or filter willbe used and with the device in its normal thermalenvironment, is needed for any conventional solar cell.
We list the typical output of our simulators throughout thissection. You should monitor the intensity of any simulator youuse for photovoltaic testing. While you can reduce theintensity level without significant spectral changes by movingthe lamp position in the reflector, you should consider usingaperture or mesh grids inside the simulator for spectrallyneutral intensity reduction without any impact on uniformity.Using the combination of a simple aperture and a broadbandpower meter, allows you to determine the linearity of yourdevices to reasonable accuracy. Consider simultaneousirradiation with a simulator and a chopped beam from one ofour monochromator sources for more detailed studies ofdevice physics.
Fig. 31 Responsivity of photovoltaic solar cells.
Pout Voc Jsc FFη = =
P P
19
ENERGY CONVERSION
WHY ORIEL SOLAR SIMULATORS ARE PREFERREDFOR PHOTOVOLTAIC TESTING
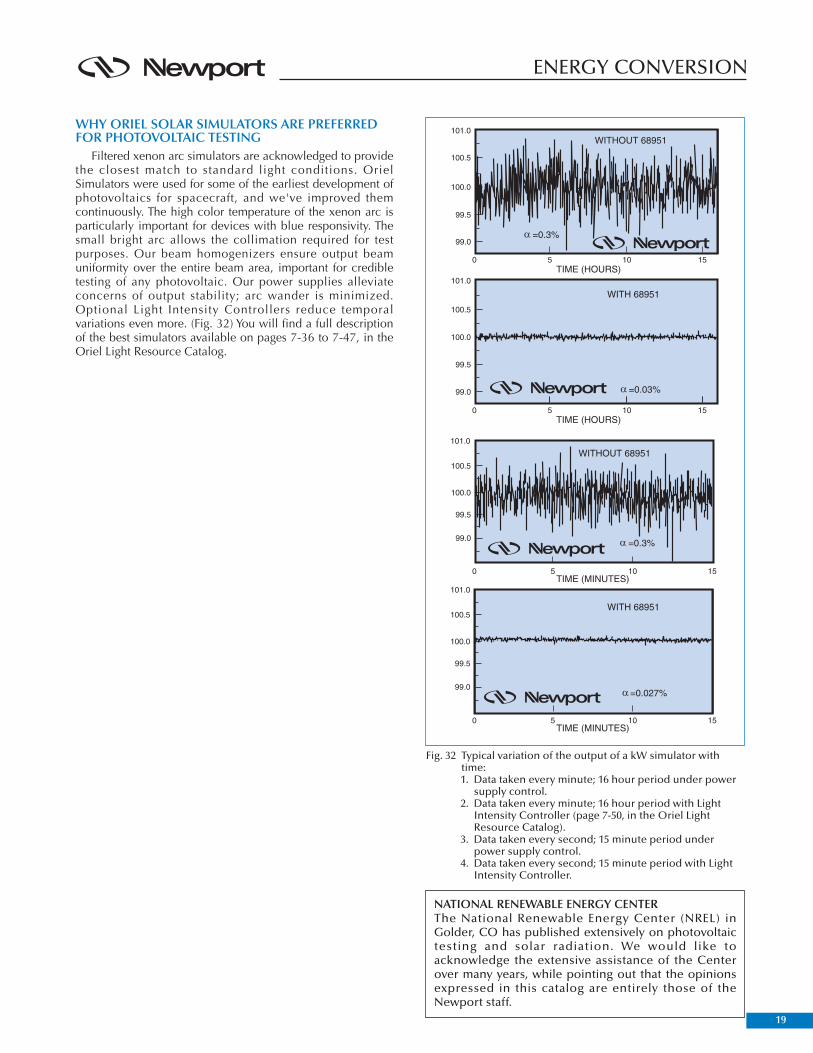
Filtered xenon arc simulators are acknowledged to providethe closest match to standard light conditions. OrielSimulators were used for some of the earliest development ofphotovoltaics for spacecraft, and we've improved themcontinuously. The high color temperature of the xenon arc isparticularly important for devices with blue responsivity. Thesmall bright arc allows the collimation required for testpurposes. Our beam homogenizers ensure output beamuniformity over the entire beam area, important for credibletesting of any photovoltaic. Our power supplies alleviateconcerns of output stability; arc wander is minimized.Optional Light Intensity Controllers reduce temporalvariations even more. (Fig. 32) You will find a full descriptionof the best simulators available on pages 7-36 to 7-47, in theOriel Light Resource Catalog.
Fig. 32 Typical variation of the output of a kW simulator withtime:1. Data taken every minute; 16 hour period under power
supply control.2. Data taken every minute; 16 hour period with Light
Intensity Controller (page 7-50, in the Oriel LightResource Catalog).
3. Data taken every second; 15 minute period underpower supply control.
4. Data taken every second; 15 minute period with LightIntensity Controller.
NATIONAL RENEWABLE ENERGY CENTERThe National Renewable Energy Center (NREL) inGolder, CO has published extensively on photovoltaictesting and solar radiation. We would like toacknowledge the extensive assistance of the Centerover many years, while pointing out that the opinionsexpressed in this catalog are entirely those of theNewport staff.
20
WEATHERING
Simulators offer the possibility of projecting how solarradiation will affect materials and finishes intended foroutdoor use. Assessment of long term environmental effects isimportant for plastics, paints, and fabrics. Changes due tooutdoor exposure are collectively described as "weathering."
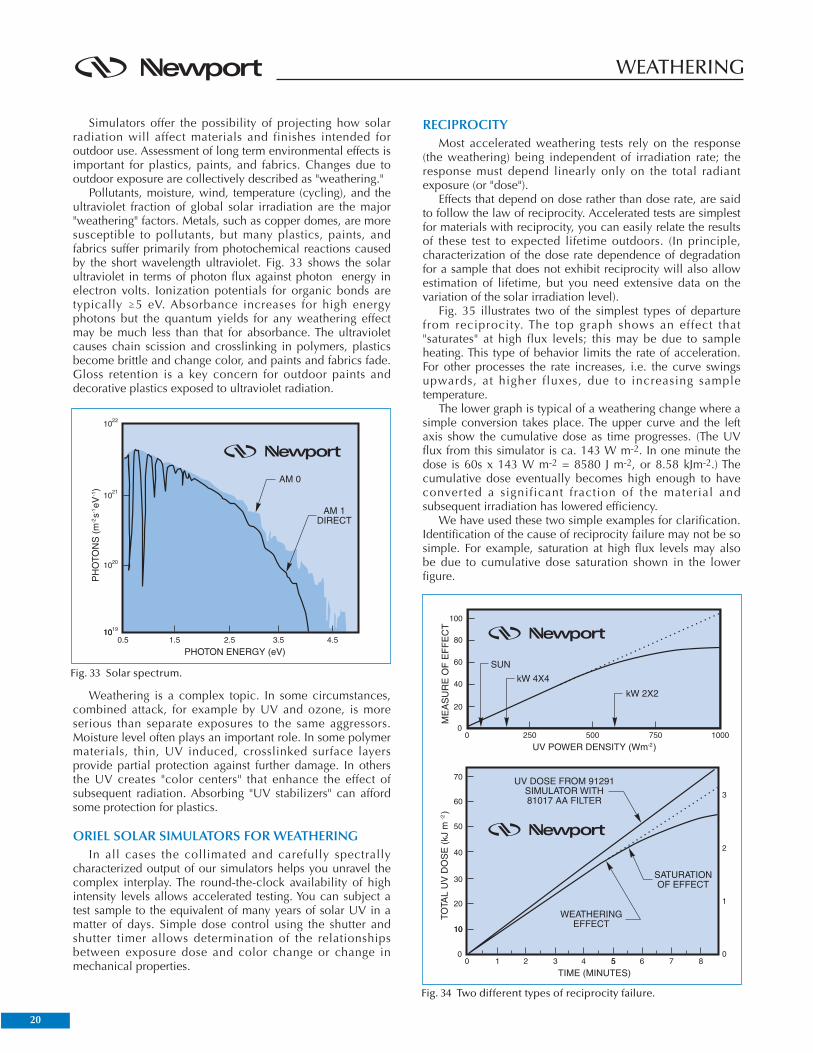
Pollutants, moisture, wind, temperature (cycling), and theultraviolet fraction of global solar irradiation are the major"weathering" factors. Metals, such as copper domes, are moresusceptible to pollutants, but many plastics, paints, andfabrics suffer primarily from photochemical reactions causedby the short wavelength ultraviolet. Fig. 33 shows the solarultraviolet in terms of photon flux against photon energy inelectron volts. Ionization potentials for organic bonds aretypically /5 eV. Absorbance increases for high energyphotons but the quantum yields for any weathering effectmay be much less than that for absorbance. The ultravioletcauses chain scission and crosslinking in polymers, plasticsbecome brittle and change color, and paints and fabrics fade.Gloss retention is a key concern for outdoor paints anddecorative plastics exposed to ultraviolet radiation.
Weathering is a complex topic. In some circumstances,combined attack, for example by UV and ozone, is moreserious than separate exposures to the same aggressors.Moisture level often plays an important role. In some polymermaterials, thin, UV induced, crosslinked surface layersprovide partial protection against further damage. In othersthe UV creates "color centers" that enhance the effect ofsubsequent radiation. Absorbing "UV stabilizers" can affordsome protection for plastics.
ORIEL SOLAR SIMULATORS FOR WEATHERINGIn all cases the collimated and carefully spectrally
characterized output of our simulators helps you unravel thecomplex interplay. The round-the-clock availability of highintensity levels allows accelerated testing. You can subject atest sample to the equivalent of many years of solar UV in amatter of days. Simple dose control using the shutter andshutter timer allows determination of the relationshipsbetween exposure dose and color change or change inmechanical properties.
RECIPROCITYMost accelerated weathering tests rely on the response
(the weathering) being independent of irradiation rate; theresponse must depend linearly only on the total radiantexposure (or "dose").
Effects that depend on dose rather than dose rate, are saidto follow the law of reciprocity. Accelerated tests are simplestfor materials with reciprocity, you can easily relate the resultsof these test to expected lifetime outdoors. (In principle,characterization of the dose rate dependence of degradationfor a sample that does not exhibit reciprocity will also allowestimation of lifetime, but you need extensive data on thevariation of the solar irradiation level).
Fig. 35 illustrates two of the simplest types of departurefrom reciprocity. The top graph shows an effect that"saturates" at high flux levels; this may be due to sampleheating. This type of behavior limits the rate of acceleration.For other processes the rate increases, i.e. the curve swingsupwards, at higher fluxes, due to increasing sampletemperature.
The lower graph is typical of a weathering change where asimple conversion takes place. The upper curve and the leftaxis show the cumulative dose as time progresses. (The UVflux from this simulator is ca. 143 W m-2. In one minute thedose is 60s x 143 W m-2 = 8580 J m-2, or 8.58 kJm-2.) Thecumulative dose eventually becomes high enough to haveconverted a significant fraction of the material andsubsequent irradiation has lowered efficiency.
We have used these two simple examples for clarification.Identification of the cause of reciprocity failure may not be sosimple. For example, saturation at high flux levels may alsobe due to cumulative dose saturation shown in the lowerfigure.
Fig. 33 Solar spectrum.
Fig. 34 Two different types of reciprocity failure.
21
WEATHERING
BE CAREFUL OF OTHER EFFECTSEffects other than the one under study may set a limit on
accelerated testing. The maximum irradiation rate must notdamage the sample (or cause non-linear response, Fig. 34).Absorbed visible and infrared radiation in intense solarradiation or simulator beams can quickly char dark fabrics,even though the ultraviolet induced weathering effects is stillfollowing the law of reciprocity. We offer simulators whichhave greatly reduced visible and infrared output. This allowsrealization of high ultraviolet intensities withoutcomplications from visible and infrared heating.
THE IMPORTANCE OF SPECTRAL MATCHINGWhen the action spectrum for the weathering effect is not
precisely known, as is often the case, it is important that thetest spectrum closely simulates the expected spectrum fordeployment. Using a total ultraviolet level for tests can bemisleading if the simulator spectrum isn't a reasonableapproximation to a time weighted outdoor spectrum. This isparticularly true for highly variable action spectra.
We describe the concept of effectiveness spectrum onpage 17. Any weathering effect following reciprocity will beproportional to the total effective dose; the wavelengthintegrated product of the action spectrum and the dosespectrum. The appropriate dose spectrum should take intoaccount the diurnal and annual dependence of the outdoorspectrum and may be expressed as "worst case" annualirradiance, or for materials like those making up patiofurniture, the local spectrum for total summertime dose.Reliable information is gradually becoming more available onUV dose spectra for various sites throughout the world.
The integrated effectiveness spectrum indicates howeffective each source is in producing weathering. In theexample we are able to compare the sources because weused a known action spectrum. The simulator based on themetal halide lamp produces 10% more weathering thanexpected from power measurement.
BROADBAND POWER OR ENERGY METERSWhen the action spectrum is not known, the closer the
spectral match between the simulator and the average solarirradiance, the easer it is to extrapolate simulator results tooutdoor reality. This is particularly important when comparingnew product formulations with possible differences in actionspectra.
Broadband power or energy meters are sensitive to abroadband of wavelengths. The meter described on page7-49 in the Oriel Light Resource Catalog, is sensitive to allwavelengths from 190 - >3µm; typical UV meters aresensitive from 250 - 400 nm, but unlike our meter, have aresponse that depends on wavelength.
Broadband UV meters are useful when working with asingle source or two sources with similar spectral content.Using a meter to measure solar UV and then comparing thisvalue with simulator output can lead to serious errors. Inbiological applications, Sayre1 showed errors of factors oftwenty!
For valid comparison of sources with different spectraloutputs using a broadband meter either:
The sources must have similar spectral contentor
The meter spectral response must have the sameshape as the action spectrum
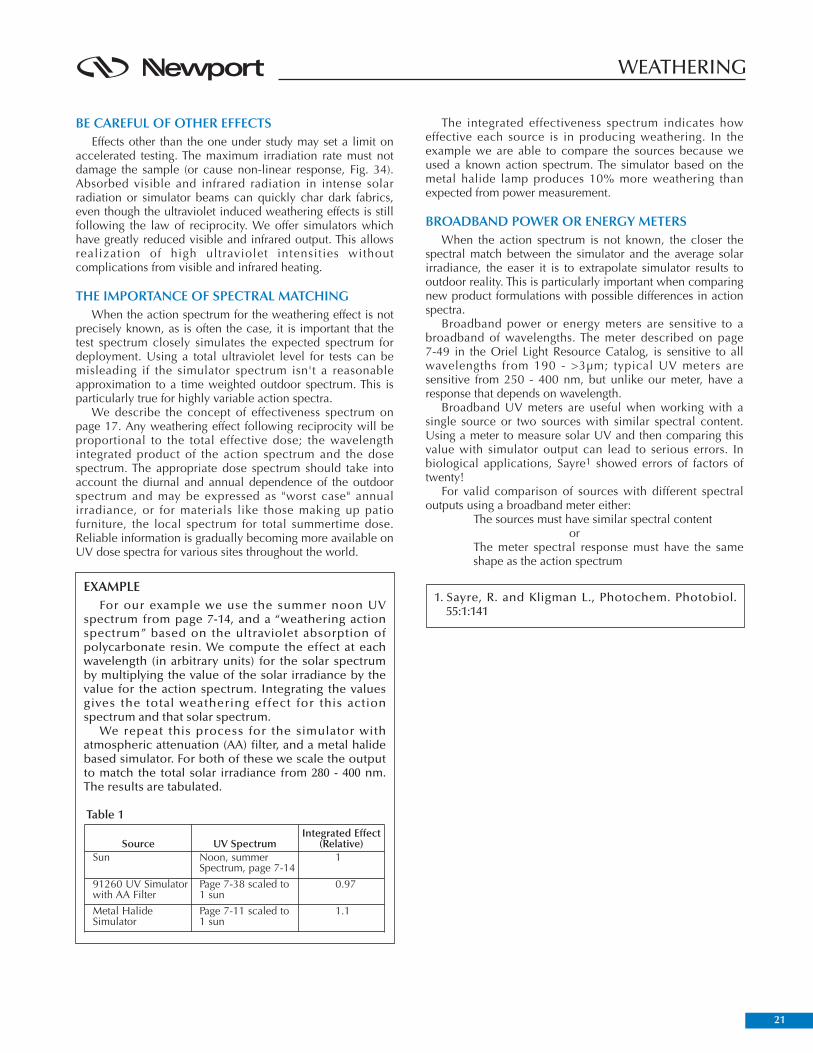
EXAMPLEFor our example we use the summer noon UV
spectrum from page 7-14, and a “weathering actionspectrum” based on the ultraviolet absorption ofpolycarbonate resin. We compute the effect at eachwavelength (in arbitrary units) for the solar spectrumby multiplying the value of the solar irradiance by thevalue for the action spectrum. Integrating the valuesgives the total weathering effect for this actionspectrum and that solar spectrum.
We repeat this process for the simulator withatmospheric attenuation (AA) filter, and a metal halidebased simulator. For both of these we scale the outputto match the total solar irradiance from 280 - 400 nm.The results are tabulated.
1. Sayre, R. and Kligman L., Photochem. Photobiol.55:1:141
Source UV SpectrumIntegrated Effect
(Relative)
Metal HalideSimulator
91260 UV Simulatorwith AA Filter
Sun
Page 7-11 scaled to 1 sun
Page 7-38 scaled to1 sun
Noon, summerSpectrum, page 7-14
1.1
0.97
1
Table 1
22
SAMPLE CALCULATIONS
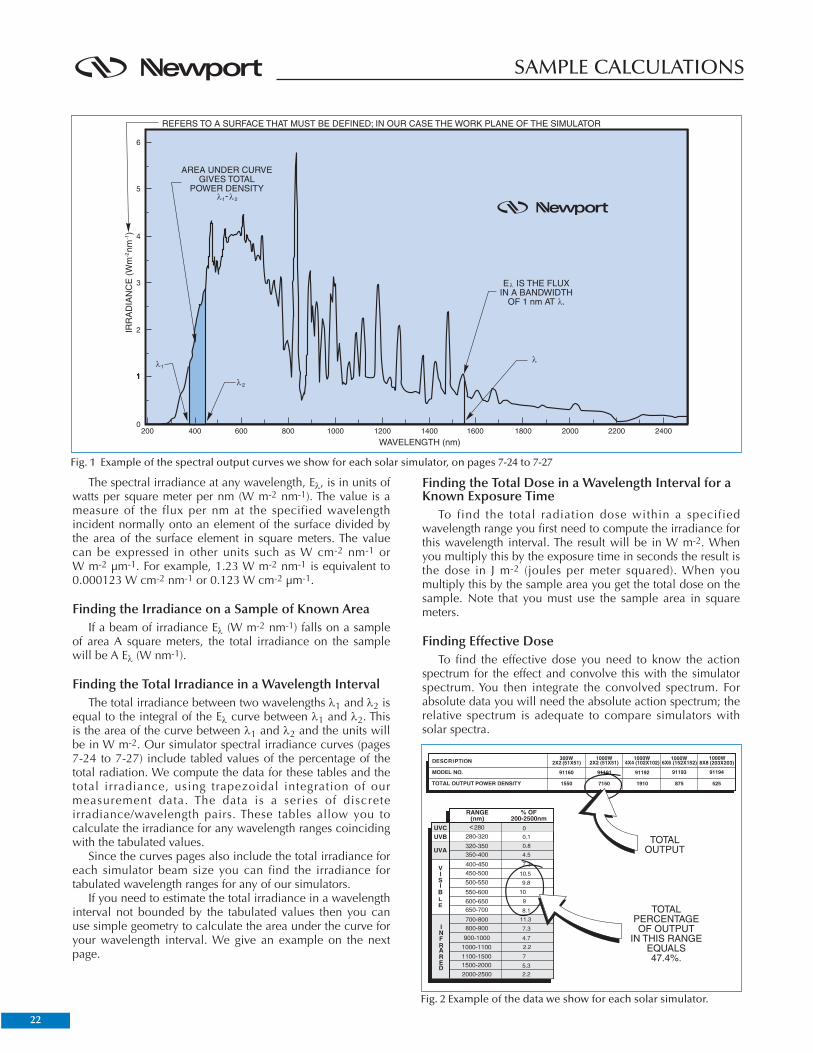
The spectral irradiance at any wavelength, Eλ, is in units ofwatts per square meter per nm (W m-2 nm-1). The value is ameasure of the flux per nm at the specified wavelengthincident normally onto an element of the surface divided bythe area of the surface element in square meters. The valuecan be expressed in other units such as W cm-2 nm-1 orW m-2 µm-1. For example, 1.23 W m-2 nm-1 is equivalent to0.000123 W cm-2 nm-1 or 0.123 W cm-2 µm-1.
Finding the Irradiance on a Sample of Known AreaIf a beam of irradiance Eλ (W m-2 nm-1) falls on a sample
of area A square meters, the total irradiance on the samplewill be A Eλ (W nm-1).
Finding the Total Irradiance in a Wavelength IntervalThe total irradiance between two wavelengths λ1 and λ2 is
equal to the integral of the Eλ curve between λ1 and λ2. Thisis the area of the curve between λ1 and λ2 and the units willbe in W m-2. Our simulator spectral irradiance curves (pages7-24 to 7-27) include tabled values of the percentage of thetotal radiation. We compute the data for these tables and thetotal irradiance, using trapezoidal integration of ourmeasurement data. The data is a series of discreteirradiance/wavelength pairs. These tables allow you tocalculate the irradiance for any wavelength ranges coincidingwith the tabulated values.
Since the curves pages also include the total irradiance foreach simulator beam size you can find the irradiance fortabulated wavelength ranges for any of our simulators.
If you need to estimate the total irradiance in a wavelengthinterval not bounded by the tabulated values then you canuse simple geometry to calculate the area under the curve foryour wavelength interval. We give an example on the nextpage.
Finding the Total Dose in a Wavelength Interval for aKnown Exposure Time
To find the total radiation dose within a specifiedwavelength range you first need to compute the irradiance forthis wavelength interval. The result will be in W m-2. Whenyou multiply this by the exposure time in seconds the result isthe dose in J m-2 (joules per meter squared). When youmultiply this by the sample area you get the total dose on thesample. Note that you must use the sample area in squaremeters.
Finding Effective DoseTo find the effective dose you need to know the action
spectrum for the effect and convolve this with the simulatorspectrum. You then integrate the convolved spectrum. Forabsolute data you will need the absolute action spectrum; therelative spectrum is adequate to compare simulators withsolar spectra.
Fig. 2 Example of the data we show for each solar simulator.
Fig. 1 Example of the spectral output curves we show for each solar simulator, on pages 7-24 to 7-27
23
SAMPLE CALCULATIONS
Logarithmic Plots of IrradianceMost of the plots in this catalog are linear plots. Log-lin
plots are useful to illustrate the fall-off of the irradiance at theatmospheric edge because the log scale enhances the lowvalue data and compresses the high value data. Plotting Fig. 1as a log-lin plot makes the entire spectrum look flatter as thepeaks are reduced. When two plots, such as solar andsimulator irradiance are both plotted on the same log-lin grid,differences appear less.
Convenient definitions of spectral regions include UVA,UVB, UVC, visible and infrared (also sometimes divided intoIR-A and IR-B). The exact boundaries of these regions remainthe subject of debate. See page 2 - 3 for the definitions weuse.
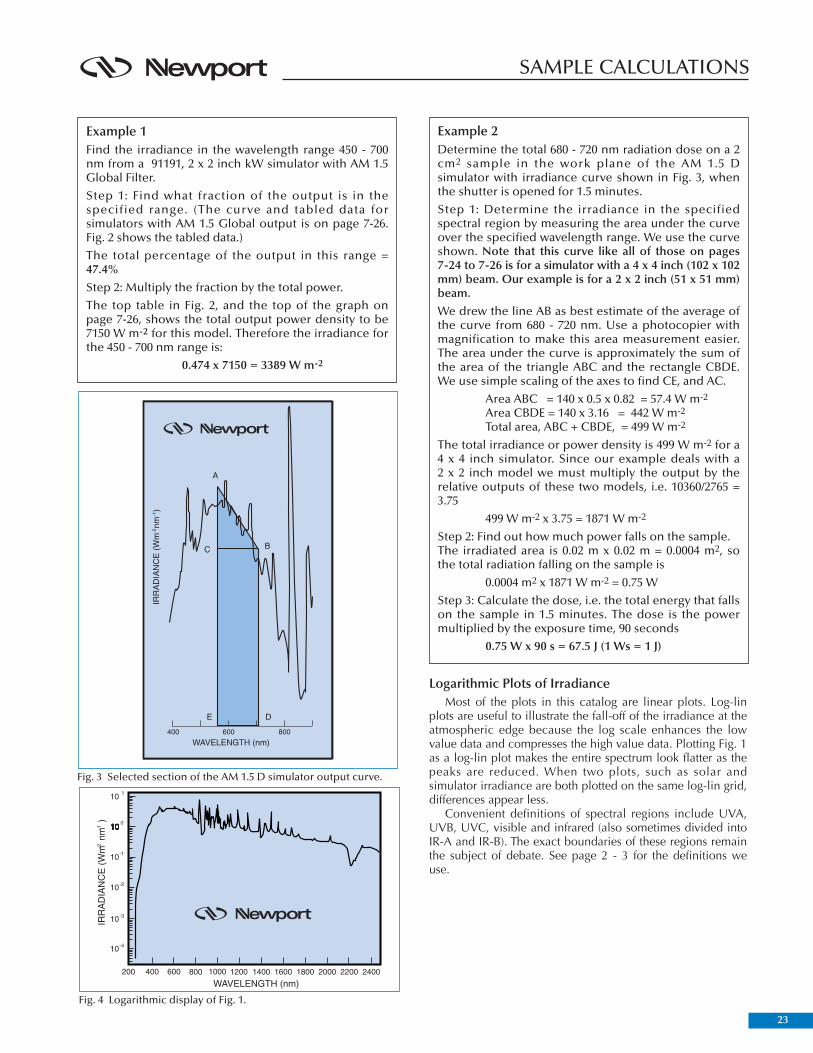
Example 1Find the irradiance in the wavelength range 450 - 700nm from a 91191, 2 x 2 inch kW simulator with AM 1.5Global Filter.
Step 1: Find what fraction of the output is in thespecified range. (The curve and tabled data forsimulators with AM 1.5 Global output is on page 7-26.Fig. 2 shows the tabled data.)
The total percentage of the output in this range =47.4%
Step 2: Multiply the fraction by the total power.
The top table in Fig. 2, and the top of the graph onpage 7-26, shows the total output power density to be7150 W m-2 for this model. Therefore the irradiance forthe 450 - 700 nm range is:
0.474 x 7150 = 3389 W m-2
Fig. 3 Selected section of the AM 1.5 D simulator output curve.
Example 2Determine the total 680 - 720 nm radiation dose on a 2cm2 sample in the work plane of the AM 1.5 Dsimulator with irradiance curve shown in Fig. 3, whenthe shutter is opened for 1.5 minutes.
Step 1: Determine the irradiance in the specifiedspectral region by measuring the area under the curveover the specified wavelength range. We use the curveshown. Note that this curve like all of those on pages7-24 to 7-26 is for a simulator with a 4 x 4 inch (102 x 102mm) beam. Our example is for a 2 x 2 inch (51 x 51 mm)beam.
We drew the line AB as best estimate of the average ofthe curve from 680 - 720 nm. Use a photocopier withmagnification to make this area measurement easier.The area under the curve is approximately the sum ofthe area of the triangle ABC and the rectangle CBDE.We use simple scaling of the axes to find CE, and AC.
Area ABC = 140 x 0.5 x 0.82 = 57.4 W m-2
Area CBDE = 140 x 3.16 = 442 W m-2
Total area, ABC + CBDE, = 499 W m-2
The total irradiance or power density is 499 W m-2 for a4 x 4 inch simulator. Since our example deals with a2 x 2 inch model we must multiply the output by therelative outputs of these two models, i.e. 10360/2765 =3.75
499 W m-2 x 3.75 = 1871 W m-2
Step 2: Find out how much power falls on the sample.The irradiated area is 0.02 m x 0.02 m = 0.0004 m2, sothe total radiation falling on the sample is
0.0004 m2 x 1871 W m-2 = 0.75 W
Step 3: Calculate the dose, i.e. the total energy that fallson the sample in 1.5 minutes. The dose is the powermultiplied by the exposure time, 90 seconds
0.75 W x 90 s = 67.5 J (1 Ws = 1 J)
Fig. 4 Logarithmic display of Fig. 1.
24
SPECTRAL IRRADIANCE DATA
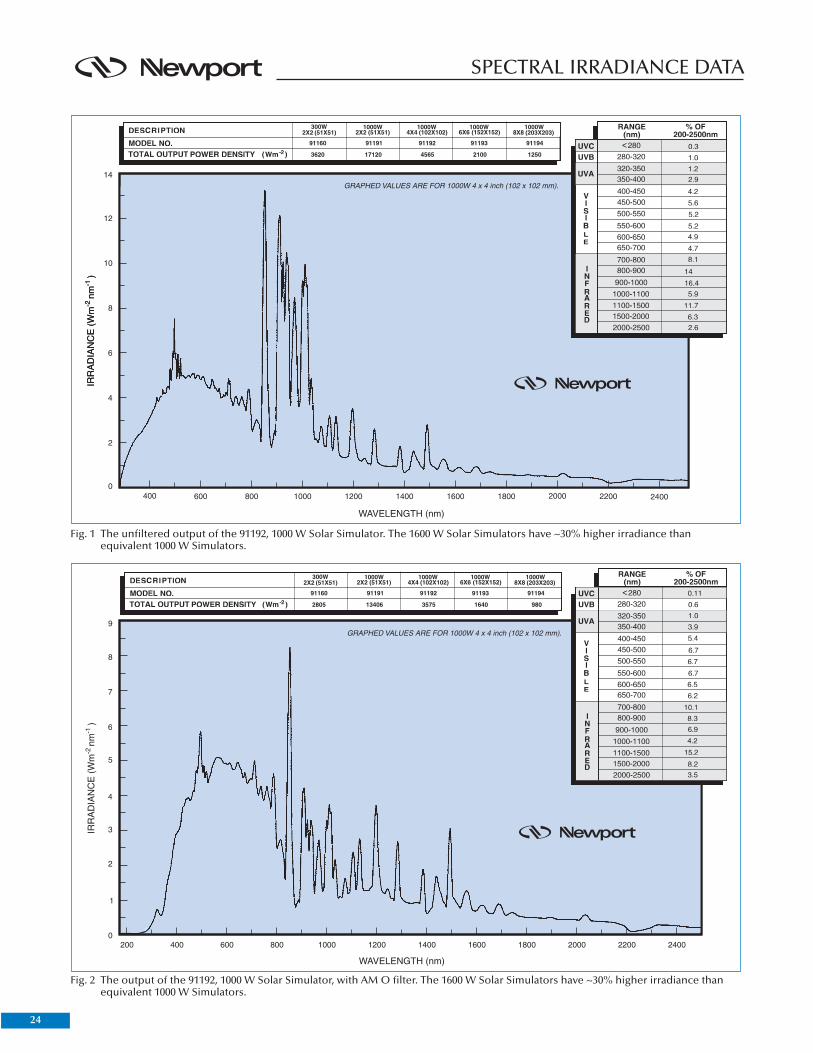
Fig. 1 The unfiltered output of the 91192, 1000 W Solar Simulator. The 1600 W Solar Simulators have ~30% higher irradiance thanequivalent 1000 W Simulators.
Fig. 2 The output of the 91192, 1000 W Solar Simulator, with AM O filter. The 1600 W Solar Simulators have ~30% higher irradiance thanequivalent 1000 W Simulators.
25
SPECTRAL IRRADIANCE DATA
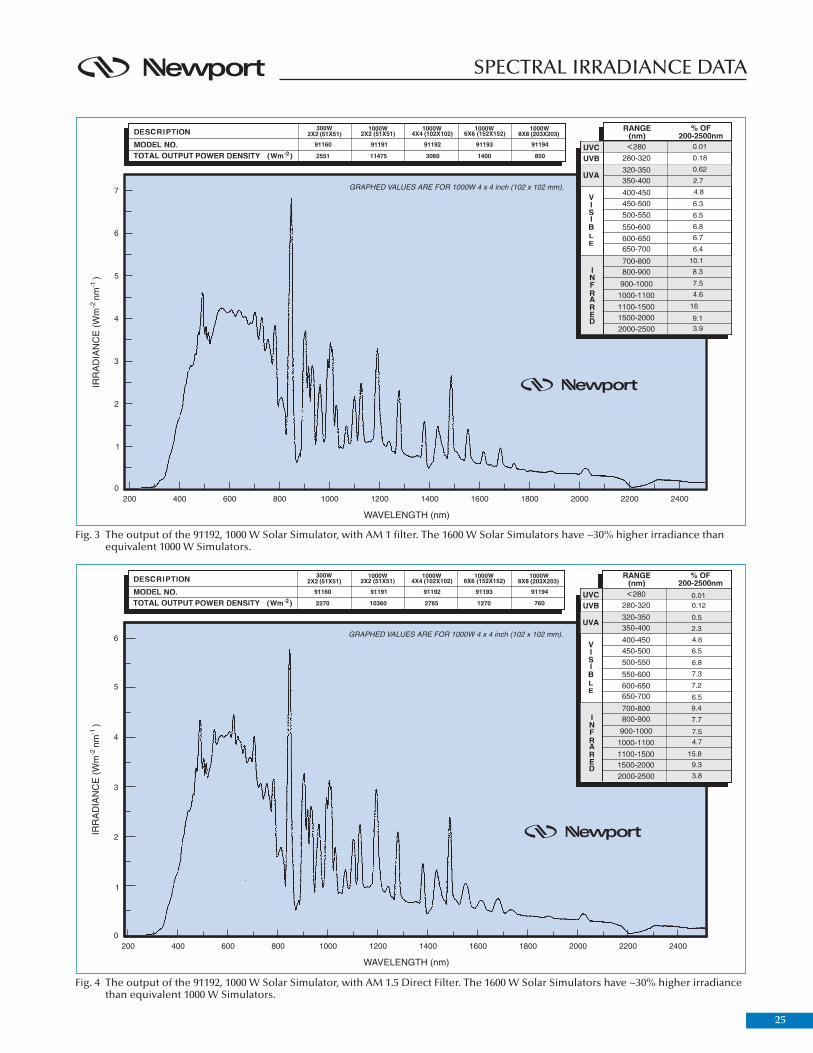
Fig. 3 The output of the 91192, 1000 W Solar Simulator, with AM 1 filter. The 1600 W Solar Simulators have ~30% higher irradiance thanequivalent 1000 W Simulators.
Fig. 4 The output of the 91192, 1000 W Solar Simulator, with AM 1.5 Direct Filter. The 1600 W Solar Simulators have ~30% higher irradiancethan equivalent 1000 W Simulators.
26
SPECTRAL IRRADIANCE DATA
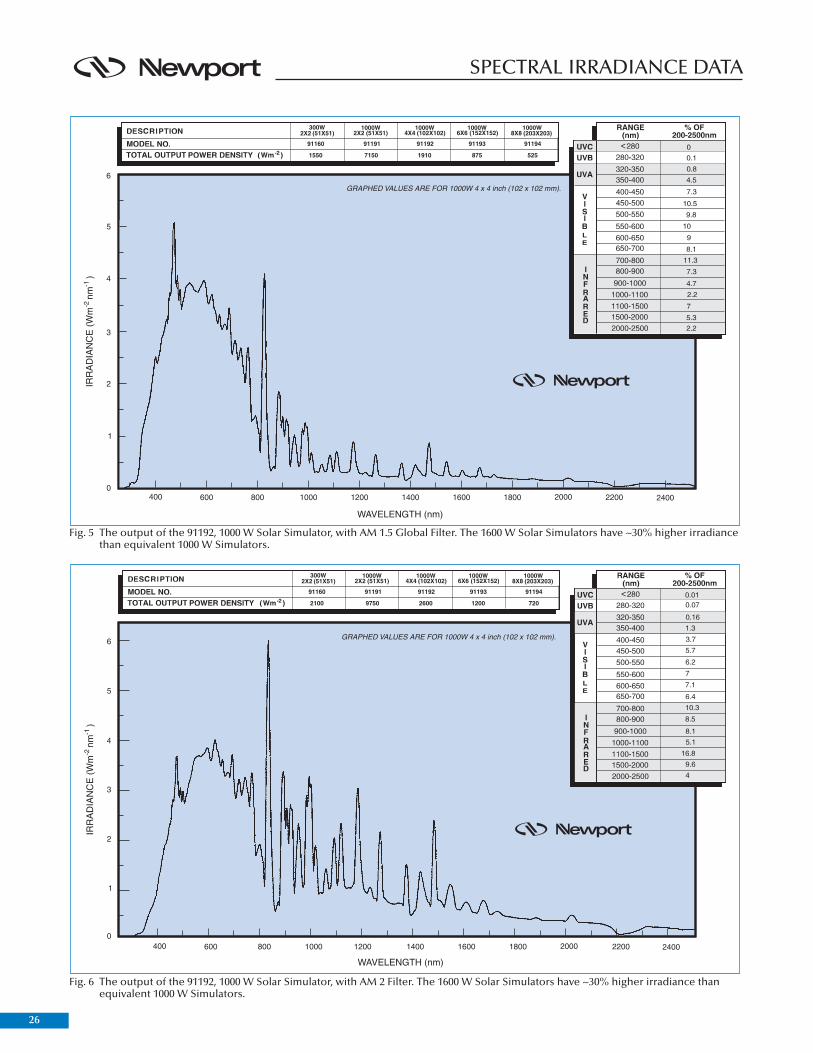
Fig. 5 The output of the 91192, 1000 W Solar Simulator, with AM 1.5 Global Filter. The 1600 W Solar Simulators have ~30% higher irradiancethan equivalent 1000 W Simulators.
Fig. 6 The output of the 91192, 1000 W Solar Simulator, with AM 2 Filter. The 1600 W Solar Simulators have ~30% higher irradiance thanequivalent 1000 W Simulators.
27
SPECTRAL IRRADIANCE DATA
300W2X2 (51X51)
3400 915 490 290730
1000W2X2 (51X51)
1000W4X4 (102X102)
1000W6X6 (152X152)
1000W8X8 (203X203)
400200 1800 2000 2200 24001600140012001000800600
1
0
2
3
4
IRR
AD
IAN
CE
(W
m
nm
)-2
-1
WAVELENGTH (nm)
GRAPHED VALUES ARE FOR 1000W 4 x 4 inch (102 x 102 mm).
91291 91292 91293 9129491260
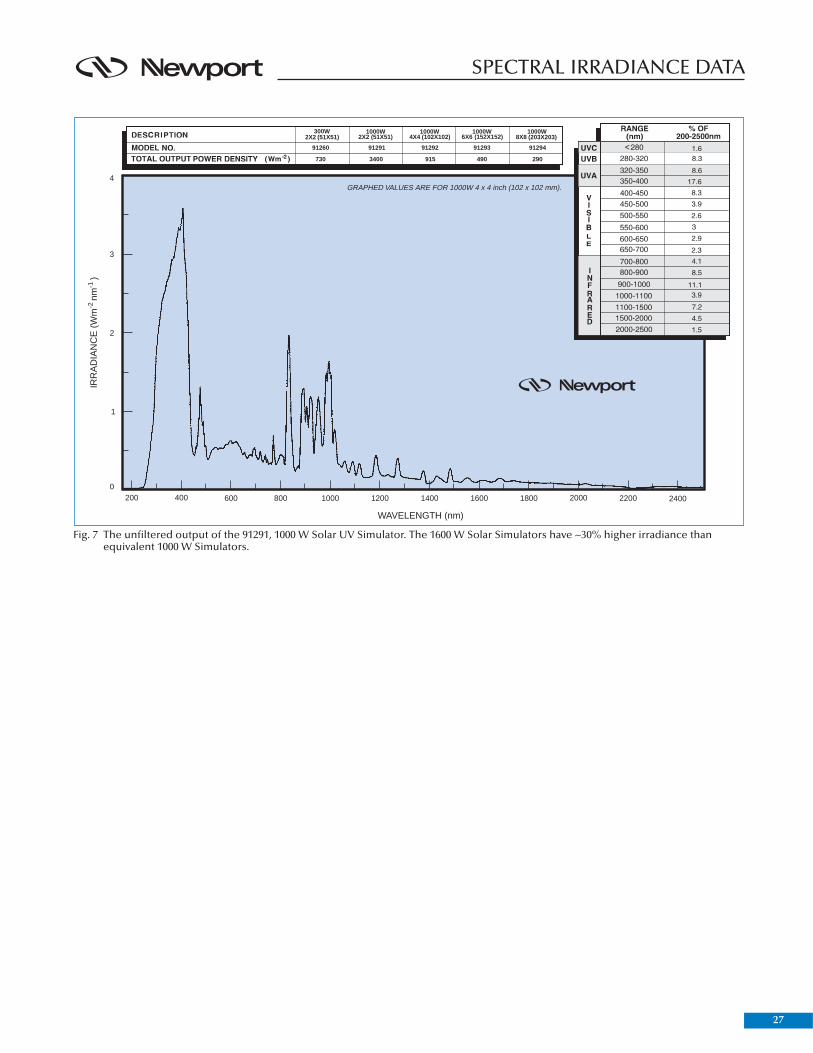
Fig. 7 The unfiltered output of the 91291, 1000 W Solar UV Simulator. The 1600 W Solar Simulators have ~30% higher irradiance thanequivalent 1000 W Simulators.
28
SPECTRAL IRRADIANCE DATA
300W2X2 (51X51)
1000W2X2 (51X51)
1000W4X4 (102X102)
1000W6X6 (152X152)
1000W8X8 (203X203)
1
0
2
3
4
IRR
AD
IAN
CE
(W
m
nm
)-2
-1
WAVELENGTH (nm)
200 300 500 600 700400
GRAPHED VALUES ARE FOR 1000W 4 x 4 inch (102 x 102 mm).
3400 915 490 290730
91291 91292 91293 9129491260
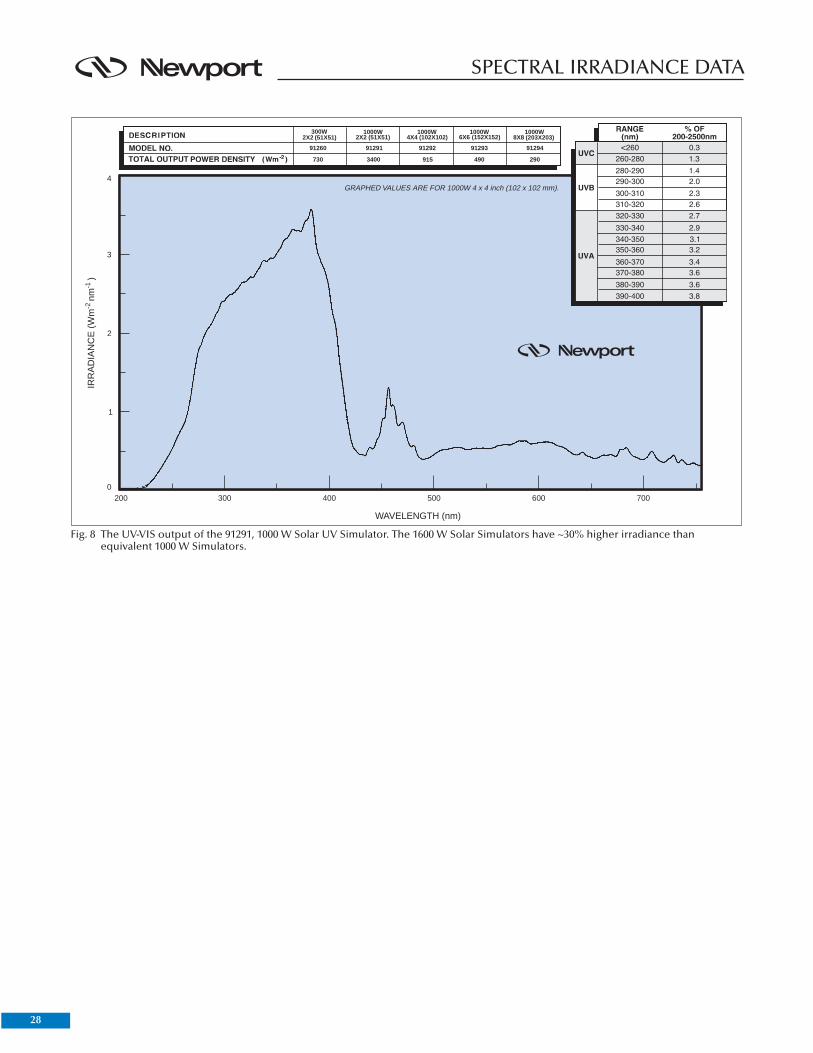
Fig. 8 The UV-VIS output of the 91291, 1000 W Solar UV Simulator. The 1600 W Solar Simulators have ~30% higher irradiance thanequivalent 1000 W Simulators.
29
CURVE NORMALIZATION
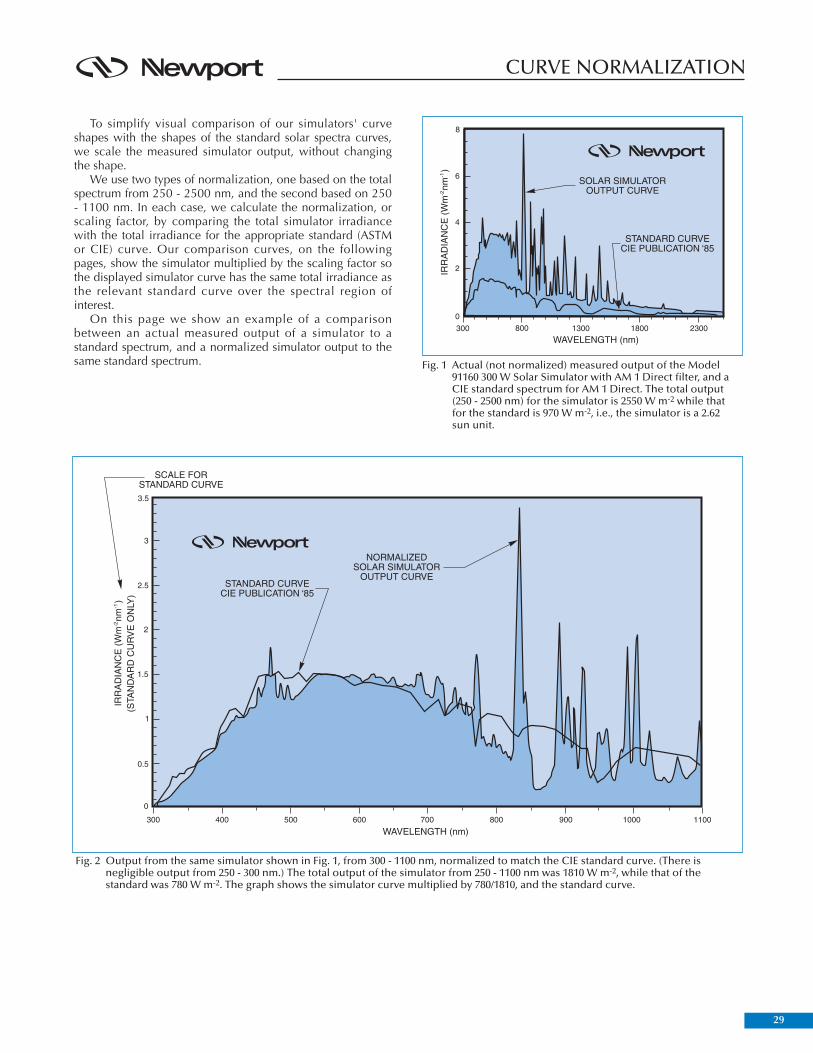
To simplify visual comparison of our simulators' curveshapes with the shapes of the standard solar spectra curves,we scale the measured simulator output, without changingthe shape.
We use two types of normalization, one based on the totalspectrum from 250 - 2500 nm, and the second based on 250- 1100 nm. In each case, we calculate the normalization, orscaling factor, by comparing the total simulator irradiancewith the total irradiance for the appropriate standard (ASTMor CIE) curve. Our comparison curves, on the followingpages, show the simulator multiplied by the scaling factor sothe displayed simulator curve has the same total irradiance asthe relevant standard curve over the spectral region ofinterest.
On this page we show an example of a comparisonbetween an actual measured output of a simulator to astandard spectrum, and a normalized simulator output to thesame standard spectrum. Fig. 1 Actual (not normalized) measured output of the Model
91160 300 W Solar Simulator with AM 1 Direct filter, and aCIE standard spectrum for AM 1 Direct. The total output(250 - 2500 nm) for the simulator is 2550 W m-2 while thatfor the standard is 970 W m-2, i.e., the simulator is a 2.62sun unit.
Fig. 2 Output from the same simulator shown in Fig. 1, from 300 - 1100 nm, normalized to match the CIE standard curve. (There isnegligible output from 250 - 300 nm.) The total output of the simulator from 250 - 1100 nm was 1810 W m-2, while that of thestandard was 780 W m-2. The graph shows the simulator curve multiplied by 780/1810, and the standard curve.
30
CURVE NORMALIZATION
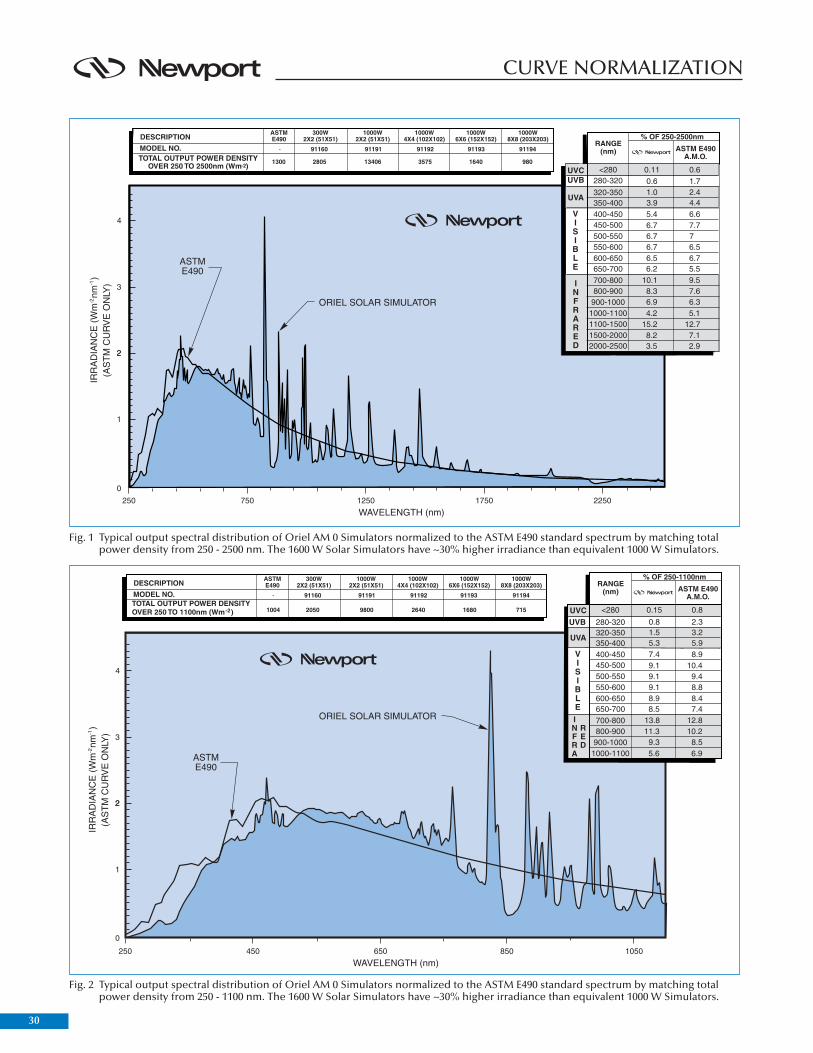
Fig. 1 Typical output spectral distribution of Oriel AM 0 Simulators normalized to the ASTM E490 standard spectrum by matching totalpower density from 250 - 2500 nm. The 1600 W Solar Simulators have ~30% higher irradiance than equivalent 1000 W Simulators.
Fig. 2 Typical output spectral distribution of Oriel AM 0 Simulators normalized to the ASTM E490 standard spectrum by matching totalpower density from 250 - 1100 nm. The 1600 W Solar Simulators have ~30% higher irradiance than equivalent 1000 W Simulators.
31
CURVE NORMALIZATION
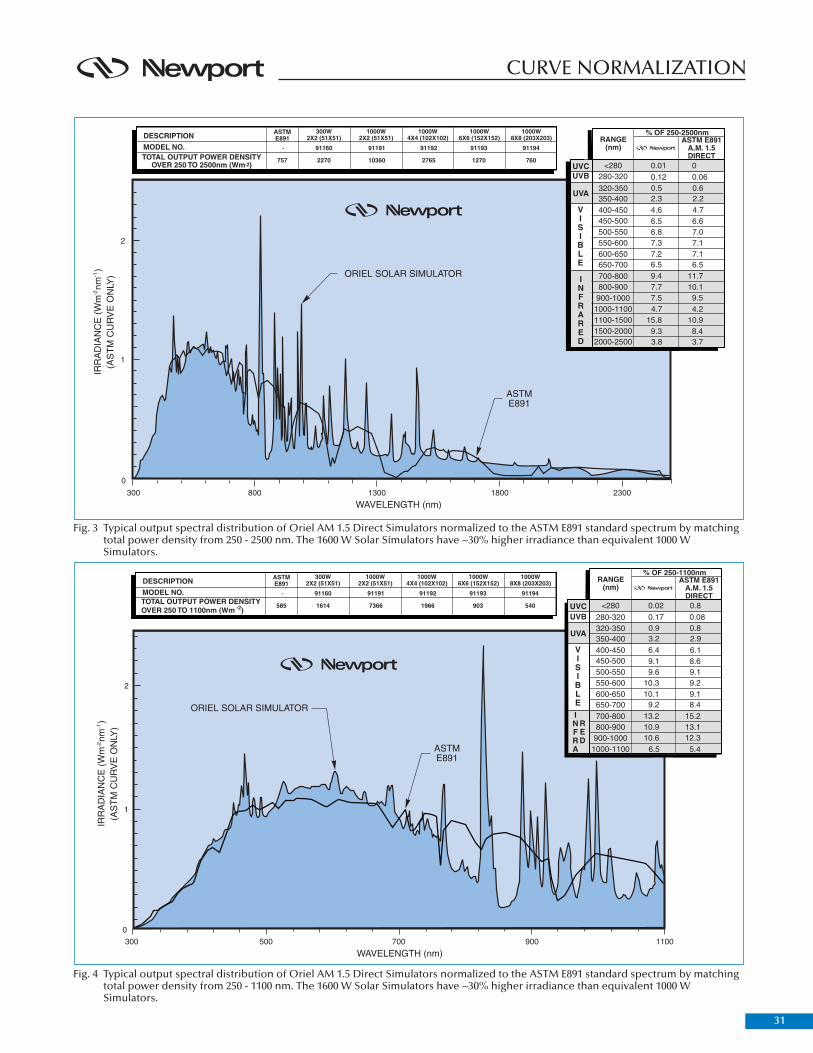
Fig. 3 Typical output spectral distribution of Oriel AM 1.5 Direct Simulators normalized to the ASTM E891 standard spectrum by matchingtotal power density from 250 - 2500 nm. The 1600 W Solar Simulators have ~30% higher irradiance than equivalent 1000 WSimulators.
Fig. 4 Typical output spectral distribution of Oriel AM 1.5 Direct Simulators normalized to the ASTM E891 standard spectrum by matchingtotal power density from 250 - 1100 nm. The 1600 W Solar Simulators have ~30% higher irradiance than equivalent 1000 WSimulators.
CURVE NORMALIZATION
32
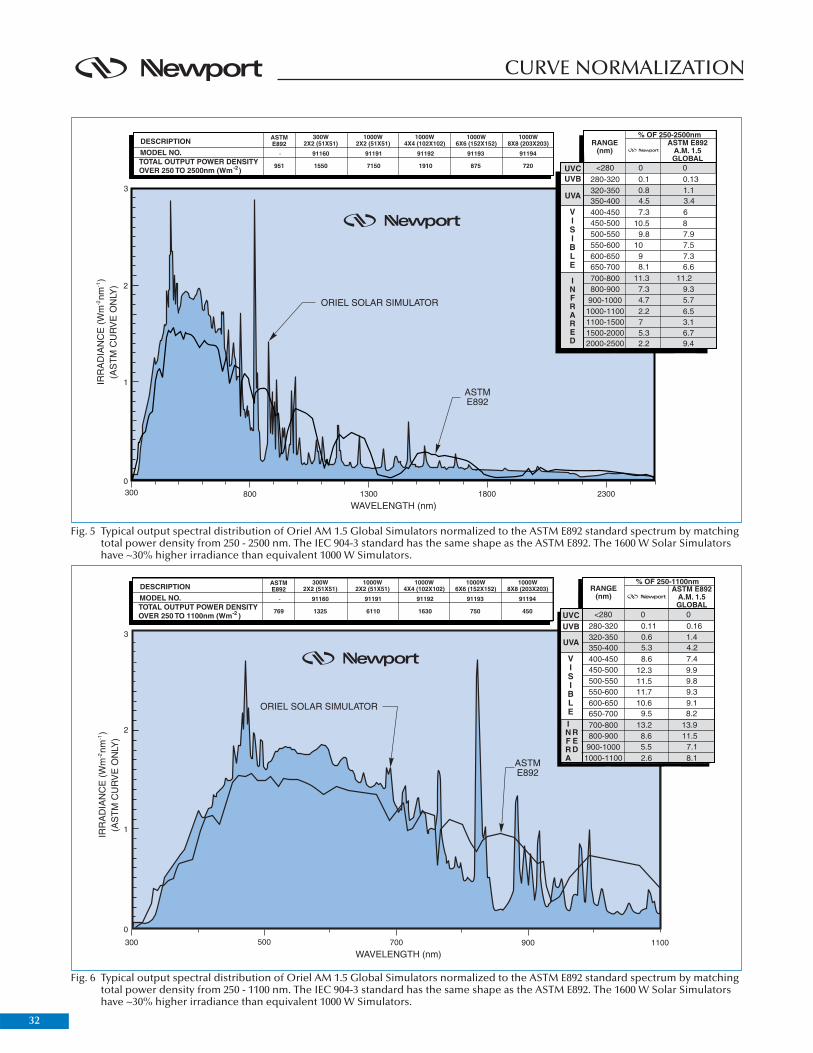
Fig. 5 Typical output spectral distribution of Oriel AM 1.5 Global Simulators normalized to the ASTM E892 standard spectrum by matchingtotal power density from 250 - 2500 nm. The IEC 904-3 standard has the same shape as the ASTM E892. The 1600 W Solar Simulatorshave ~30% higher irradiance than equivalent 1000 W Simulators.
Fig. 6 Typical output spectral distribution of Oriel AM 1.5 Global Simulators normalized to the ASTM E892 standard spectrum by matchingtotal power density from 250 - 1100 nm. The IEC 904-3 standard has the same shape as the ASTM E892. The 1600 W Solar Simulatorshave ~30% higher irradiance than equivalent 1000 W Simulators.