solar water heating systems for different buildings under
TRANSCRIPT

Sust. Build. 3, 3 (2018)© K. Tabet Aoul et al., published by EDP Sciences, 2018https://doi.org/10.1051/sbuild/2018002
Available online at:
Topical issue on: Zero Energy Mass Custom HomesRESEARCH ARTICLE
www.sustainable-buildings-journal.org
Solar water heating systems for different buildings under a hotclimate; parametric optimization and economic analysisKheira Tabet Aoul*, Ahmad Hasan, and Hassan Riaz
Architectural Engineering Department, College of Engineering, United Arab Emirates University, P.O. Box 15551 Al Ain, UAE
* e-mail: k
This is an O
Received: 16 December 2017 / Accepted: 14 May 2018
Abstract. Building applied solar thermal systems are considered by different stakeholders an attractivealternative to traditional space and water heating systems. However, their performance depends largely onclimatic conditions, water heating needs and operational parameters which, in turn, offer opportunities forperformance optimization. The present research attempts to provide architects with a design decision tool thatintegrates solar thermal collectors efficiently to meet hot water demand for various building types inclusive ofresidential, commercial and industrial in a hot climate. The analysis is conducted numerically through a thermalmodel developed and executed in TRNSYS and validated experimentally. The parameters investigated includethe collector tilt angle, azimuth angle and collector inlet fluid flow rate. Finally, the collector aperture arearequired per building foot print area is determined. The research revealed that for a 1000m2 footprint buildingarea of schools, offices, residential, factories and hospitals would require respectively 8m2, 10m2, 14m2, 24m2
and 38m2 of the static collector installed at 24° tilt angle with optimal water flow rate. Additional operationalaspects of collector tracking, and solar radiation concentration were investigated and further reduce the requiredcollector area. A simple payback period analysis reveals a return on investment of 2 years applying subsidizedtariff rates under the climatic conditions of, or similar to Dubai, in the United Arab Emirates.
Keywords: solar water heating systems / building applied / parametric optimization / hot climate /performance assessment
1 Introduction
Dubai, in the United Arab Emirates (UAE) increased itsenergy demand from 33 742 to 43 093GWh between 2010and 2016, while adding 2639MW electrical power capacityin the same period from 7361 to 10 000MW (Fig. 1)indicating a sharp surge in its energy demand [1]. Thecapacity addition presented here is solely from gas, oil firedpower plants, and does not include renewables. The curveshows that until 2015, the traditional power plants weremerely meeting the demand. Afterwards, the demandsurpassed the supply. In terms of energy consumption, thecommercial sector leads with 47.5% followed by residentialbuildings at 28.5% as illustrated in Figure 2 as of 2016 [1].This substantial energy needed in buildings contributes tocarbon dioxide emissions, heightening the global warmingeffect [2] that can merely be addressed by integratingsustainable means of energy supply. Out of the total energyconsumed in buildings, space and water heating needsrange from 81% in cold climates [3] to 30% in hot climates[4] which justifies investing into alternative heating
pen Access article distributed under the terms of the Creative Comwhich permits unrestricted use, distribution, and reproduction
solutions to reduce the environmental footprint. Theimmense solar radiation potential reported in the UAEwith measured average daily insolation of 4.98 kWh/m2
and peak intensity ranging between 900 and 1100W/m2 indifferent seasons [5,6,7]. These statistics offer a promisingsource of heat supply through solar systems to meet hotwater demand in UAE with the appropriate system sizingand configurations.
The performance of solar-assisted heating and cooling(SHC) systems was compared to the conventional coolingsystem for two building configurations in the UAE todetermine optimal share of solar thermal in the buildingenergy mix. The findings suggest a maximum solarpenetration of 20% that results in an energy and CO2savings of 176 kWh/year and 140 ton/year with a paybackperiod of 4 years [8]. In another study, the solar thermalcollector area and hot water tank volume were optimizedfor a solar powered absorption cycle under UAE’s weatherconditions. The findings reveal that a specific collector areaof 6m2/kWc and a specific tank volume of 0.1m3/kWc offeran optimal design that reduced energy consumption by47% and CO2 emissions by 12 tons/year compared to aconventional vapor-compression cooling system [9]. Theselimited experimental studies conducted in the UAE
mons Attribution License (http://creativecommons.org/licenses/by/4.0),in any medium, provided the original work is properly cited.

Fig. 1. Growth of electricity consumption and generation in Dubai, United Arab Emirates (UAE) [1].
Fig. 2. Electricity consumption in different sectors of Dubai, United Arab Emirates (UAE) [1].
2 K. Tabet Aoul et al.: Sust. Build. 3, 3 (2018)
revealed that Solar Water Heating Systems (SWHS) areefficient and form an economically viable option to meetthe hot water demand in buildings.
However, little is reported about optimal parametersthat affect SHW performance inclusive of determining anoptimal tilt angle (F) for the main UAE cities (Abu Dhabiand Dubai) [10,11]. This study considered the capital city,Abu Dhabi which lies at a latitude of ’=24°. A detailedparametric optimization investigation is highly neededwhile considering various hot water demand patterns ofdifferent building typology. The current study attempts tonumerically investigate collector parameters comprehen-sively to optimize the collector performance with regard tobuilding types and hot water demands employing aTRNSYS thermal model [12]. The parameters considered
include collector tilt angle, azimuth angle and collectorinlet fluid flow rate. Additionally, the effect of inlet watertemperature, collector tracking and solar radiation con-centration were investigated. The objective of this study isto determine design parameters represented by the ratio ofcollector aperture area to building area for each of thestudied building types while assessing its economicviability and system performance.
2 Methodology
The transient thermal model developed in TRNSYS iscomposed of a solar thermal collector and an auxiliaryheating source. Simulations were carried out to assess the

Table 1. Hot water demand and water temperature per building type of a set area of 1000m2.
Parameters Residential Hospital School Office Factories
Floor area allowance peroccupant (square meter perperson) [13]
19 Patient room: 11Other spaces: 22
Classroom: 2Vocational spaces: 5
9 9
Occupant load (Number ofpeople)
53 68 350 111 111
Hot water demand (gallon perperson per day) [14,15]
35 35 3 5 10
Total hot water demand perbuilding use (gallon per day)
1855 2380 1050 555 1110
Water temperature Tr (°C) [13] 45 65 45 45 70–110
K. Tabet Aoul et al.: Sust. Build. 3, 3 (2018) 3
contribution and effectiveness of SWHS in meeting specifichot water demands in various building types. The buildingtypes considered include residential, schools, hospitals,offices and factories. For this investigation and comparison,all building types are considered to be 1000m2 in size.Buildings with spatially different occupant loads, such ashospitals and schools, have been considered accordingly,with half of the building area dedicated to each. Theoccupant load, water demand and required water temper-ature are calculated from relevant codes [13,14]. Table 1summarizes the input data parameters.
2.1 Simulation model set up
The flat-plate solar collector is simulated using Hottel-–Whillier steady-state model [16] which predicts the heatgain as a function of collector aperture area (Ac), number ofidentical collectors (nc) and weather conditions aspresented in equation (1);
Qc ¼Ac
nc
Xnc
k¼1fr;k½ItiðtaÞ � Uc;kðTi;k � TaÞ�: ð1Þ
The model employs overall energy gain efficiency factor(fr,k), total incident solar radiation (Iti), collective losses(Uc,k), temperature of fluid entering the collector (Ti) andambient temperature (Ta) to calculate collector heat gain(Qc). The fr,k is an exponential function of the collectoraperture area and thermal capacity (Cpc) as given inequation (2);
fr;k ¼ncmccpcAcUc;k
1� e�fcUc;kAc
ncmccpc
� �: ð2Þ
The product of transmittance and absorptance of thecollector absorber plate for beam radiation (ta)b, diffused-radiation (ta)d, and ground reflectance (ta)g are calculatedby the trigonometric co-relation considering collectorrelative position to the incoming solar radiation given inequation (3);
ta ¼ IbðtaÞb þ Id1þcosb
2
� �ðtaÞd þ rgIt1�cosb
2
� �ðtaÞgIT
: ð3Þ
(Uc,k) is overall loss-coefficient by Klein composed ofradiation and convection from top and bottom collectorsurfaces [16]. These losses are a function of number of glasscovers (ng), collector fin efficiency (fc), number of collectors(nc), Stefan Boltzmann’s constant (s), emissivity of glasscover (�g), absorber plate emittance (�p) and losscoefficients for edges and bottom (Ube) as depicted inequation (4).
Uc;k ¼ 3:6
ng
c
Tp;k
Tav;k�Ta
ng þ f
� �� �0:33þ 1
hw
( )
þ 3:6sðT 2av;k þ T 2
aÞðTav;k þ TaÞ1
epþ0:05ngð1�epÞ þ2ngþf�1
egng
þ Ube: ð4Þ
The stratified thermal storage tank with variable inletsconditions is employed having an immersed coiled heatexchanger, with five segments for thermal lamination. Thetemperatures of hot water tank at the outer side (Thw2) andaverage temperature at inner side (Thwa) were calculatedby using equations (5) and (6) [17].
dT tank
dt¼ Qin;tank �Qout;tank
ctank; ð5Þ
dTHX
dt¼ Qin;HX �Qout;HX
cHX; ð6Þ
where Qin,tank and Qout,tank depend on heat exchangertemperature, ambient temperature and solar irradiation.The Qin,HX and Qout,HX depend on inlet fluid temperatureand tank temperature. The temperaturesThw2 andThwa arecalculated by opting equations (7) and (8).
Thw2 ¼ Thw1 þ bavea
� �eaDt � bave
a; ð7Þ
Thwa ¼ 1
aDtThw1 þ bave
a
� �ðeaDt � 1Þ � bave
a; ð8Þ
where a and b are the coefficients of the differentialequation in the form dT/dt= aT+ b and bave= bTave.

Fig. 3. Information flow diagram of micro-simulation for SWHS [19].
4 K. Tabet Aoul et al.: Sust. Build. 3, 3 (2018)
Figure 3 shows the information flow diagram for themicro-simulation of solar water heating and Figure 4 showsthe flow diagram of TRNSYS for SWHS. The components ofthe SWHS considered are flat plate solar collector, waterpump, storage tank and auxiliary electric heater. The systemcomprises of a 2m2
flat-plate collector with 1HPwater pumpand 325 gallons of water tank. A simulation model predictedthe long-term thermal performance of the FPC.
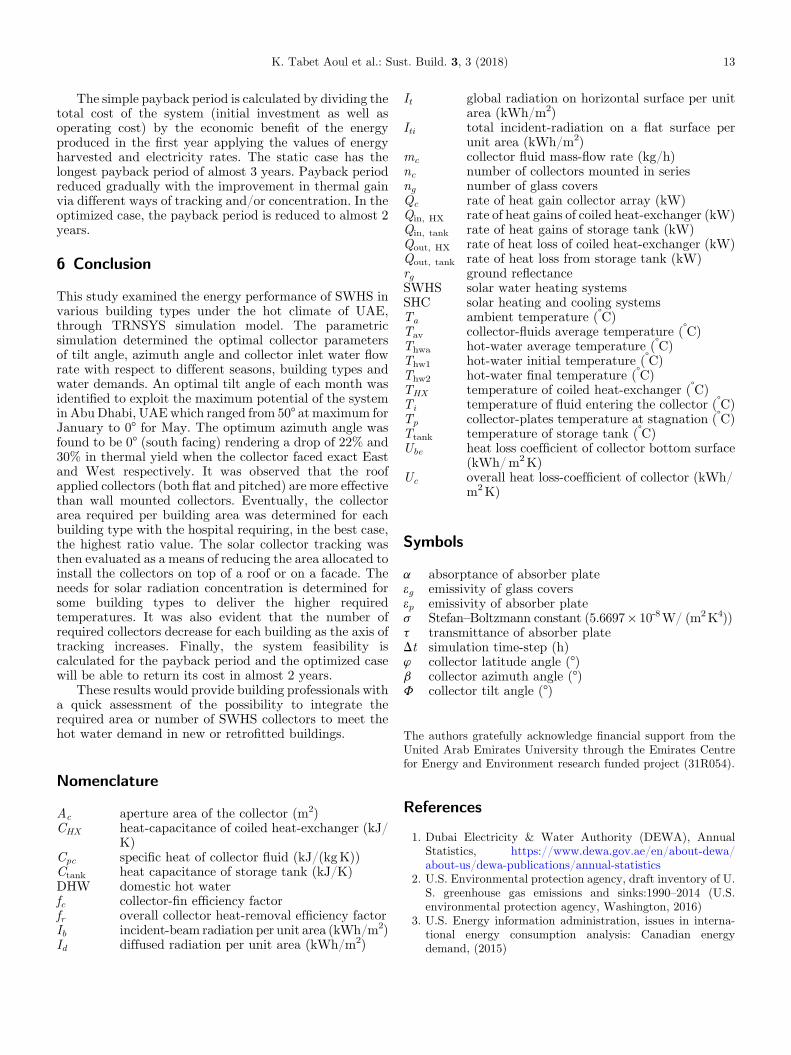
The literature findings show that solar collectorefficiency varies from 40 to 60% [18] as a function of inletand ambient conditions as shown in Figure 5 [19]. Theinputs for simulation include hot water usage pattern,system specifications and weather data. The time resolvedweather data of interest is processed in “weather” block tofeed into the thermal model represented by “collector”. Afeedback ON-OFF control loop is in place between thecollector outlet and demand side temperature (Ttank)shown by the “controller” block to trigger water throughcollector by sensing tank temperature and availability ofresource (solar radiation).
2.2 Building typology
The building typology is defined by hot water use patternand set point temperatures in the present study. Inliterature, several standard hot water usage patterns arereported for the US and Europe [20,21], while very little isavailable on the subject for hot weather as of UAE. Thepattern shown in Figure 6 is used to estimate a standarddemand for residential, hospital and office buildings [22–24]in the UAE. In the current simulations, the end usetemperature is set at 45 °C for residential, school and officebuildings and 65 °C for hospital buildings.
3 Results and discussion
The thermalmodel developed in TRNSYS is validated withexperimental data measured from a flat plate collectorinstalled at the same site. Simulations are conductedemploying typical means year (TMY-2) weather data forAbu Dhabi. The collector operational parameters of tiltangle, heat transfer fluid flow rate and heat loss coefficientsare set in the TRNSYS model representing the experimen-tal set up and ambient conditions. Temperatures weremeasured at front surface and leaving water from thecollector and compared with themodel prediction as shownin Figure 7. The results show a reasonable agreementbetween experimental and simulated temperatures withdeviation of less than 5% at the most. The validated modelis used to predict effects of collector operational parameterson the energy produced from the collector presented in thefollowing sections.
3.1 Collector tilt angle
The performance of solar collector depends on itsinclination angle [25,26]. Designers generally locatecollectors on the building roof (pitched or flat) or on thefaçade (vertical wall). The same is simulated by varyingmonthly collector tilt angle (F) from 0° (representing flatroof) to 90° (representing south facing façade) with anincrement of 5° representing various roof pitch angles whilekeeping at 0° azimuth representative of a south facingcollector in the northern hemisphere. The average thermalgain (Qc) is plotted against F as shown in Figure 8 todetermine the optimal F for each month. The Qc forJanuary (winter) was 1.95 (kWh/m2) at F of 0° which
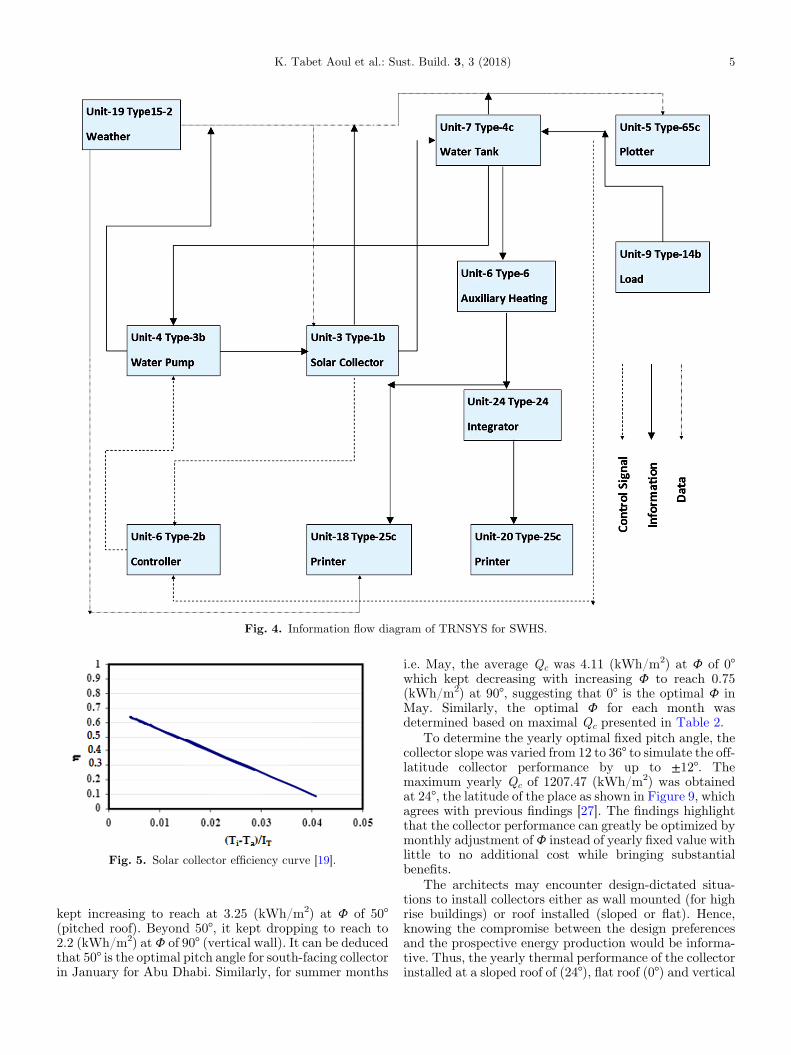
Fig. 4. Information flow diagram of TRNSYS for SWHS.
Fig. 5. Solar collector efficiency curve [19].
K. Tabet Aoul et al.: Sust. Build. 3, 3 (2018) 5
kept increasing to reach at 3.25 (kWh/m2) at F of 50°(pitched roof). Beyond 50°, it kept dropping to reach to2.2 (kWh/m2) atF of 90° (vertical wall). It can be deducedthat 50° is the optimal pitch angle for south-facing collectorin January for Abu Dhabi. Similarly, for summer months
i.e. May, the average Qc was 4.11 (kWh/m2) at F of 0°which kept decreasing with increasing F to reach 0.75(kWh/m2) at 90°, suggesting that 0° is the optimal F inMay. Similarly, the optimal F for each month wasdetermined based on maximal Qc presented in Table 2.
To determine the yearly optimal fixed pitch angle, thecollector slope was varied from 12 to 36° to simulate the off-latitude collector performance by up to ±12°. Themaximum yearly Qc of 1207.47 (kWh/m2) was obtainedat 24°, the latitude of the place as shown in Figure 9, whichagrees with previous findings [27]. The findings highlightthat the collector performance can greatly be optimized bymonthly adjustment ofF instead of yearly fixed value withlittle to no additional cost while bringing substantialbenefits.
The architects may encounter design-dictated situa-tions to install collectors either as wall mounted (for highrise buildings) or roof installed (sloped or flat). Hence,knowing the compromise between the design preferencesand the prospective energy production would be informa-tive. Thus, the yearly thermal performance of the collectorinstalled at a sloped roof of (24°), flat roof (0°) and vertical

Fig. 6. Hot water usage pattern for (a) residential (b) hospital (c) office [22–24] under the hot weather conditions as of UAE.
Fig. 7. The experimental and simulated temperatures of the absorber surface and water leaving the collector.
6 K. Tabet Aoul et al.: Sust. Build. 3, 3 (2018)
wall (90°) are compared in Figure 10. The results show thatthe collector installed on a sloped roof (latitude angle)performed the best, followed closely by the flat roof. Thecollector performance varied slightly with building typemainly due to effect of water flow rate.
3.2 Azimuth angle
The optimal orientation is determined as south facing atzero azimuth (b). However, at times, designers are requiredto apply collectors deviating from south that may affectQc

Fig. 8. Monthly average thermal energy (Qc) produced by solar collector at various tilt angles (F).
Table 2. Optimum monthly collector tilt angles forenhanced thermal energy gain.
Month Fopt Thermal gain (Qc)
Jan 50 3.23Feb 40 2.97Mar 25 3.58Apr 10 3.59May 0 4.11Jun 0 3.93Jul 0 3.57Aug 5 3.87Sep 20 3.81Oct 35 3.86Nov 50 3.72Dec 50 3.18Average 23.75 3.62
K. Tabet Aoul et al.: Sust. Build. 3, 3 (2018) 7
[28]. The impact of varying b from 90° (east) to�90° (west)with an increment of 30° was, therefore, determined on Qcon a monthly and yearly basis as shown in Figure 11A andB. The results indicate that Qc peaked at b=0° for allmonths. An interesting observation noted that in summermonths (April to August) the collector performanceremained unaffected by azimuth changes while duringthe rest of the year (September to March) the performancedecreased sharply when moving away from the southorientation. Hence, yearlyQc of the south facing collector is30% and 22% higher than that of west and east facingcollector respectively.
3.3 Inlet flow rate
Daily water consumption for each building type iscalculated per code requirements to size the collector tankand is kept fixed for the whole year. Since the collector only
recovers thermal energy during the daytime, the varyingdaylight intensity and hours affect the amount of thermalenergy available at the collector. The variable energyavailable at the absorber requires variable water flow ratefor optimal energy recovery. The water flow rate inlet tothe collector will in turn need to be optimized for differentmonths. The total daily water demand is circulatedthrough the collector during daytime (represented bydaylight hours) at various flow rates to determine optimalflow rate for each month and building type. The summermonths of May and June had the highest number ofdaylight hours with an average of 13 h, while the wintermonths of January and December had the lowest with anaverage of 10 h [29]. On the other hand, the heating demandnaturally peaked in winter months compared to that ofsummer months. Additionally, each building type hasdifferent occupant loads and temperature set points whichimpact the optimal water flow rate for maximum thermalenergy recovery. The inlet water flow rate for each of thebuilding sector considered (residential, hospital, school,office, factories) is optimized for each month considering allthe above-mentioned factors. Inlet water flow rate wasfound to be higher in winter months and lower in summermonths yielding maximal thermal energy extraction asshown in Figure 12 while the hospital building required thehighest and the most variable water flow rate.
3.4 Inlet water temperature
Since temperature of municipality supply water enteringthe collector is an uncontrolled parameter, its influences onthe collector’s performance is of interest specifically in UAEas it varies substantially among different seasons. The inletwater is assumed to be 3 to 4 °C higher than averagedaytime ambient temperature (Tavg-amb-day) consideringthe effect of ambient temperature and solar flux on theexposed storage tanks [30]. The Tavg-amb-day in UAE wasthe highest in May (42 °C) and the lowest in January(26 °C) [7]. Qc for each building type is plotted (left axis)with Tavg-amb-day (red line on right axis) as presented inFigure 13. At the lowest Tavg-water-inlet,Qc, is the highest

Fig. 9. Yearly thermal energy gain (Qc) of the collector at various tilt angles (F) to determine energy losses at the off optimal latitudescenarios.
Fig. 10. Thermal energy gain (Qc) of the collector installed at the pitched roof (24°), flat roof (0°) and vertical wall (90°).
8 K. Tabet Aoul et al.: Sust. Build. 3, 3 (2018)
and the vice versa which is in agreement with the collectorefficiency curve shown in Figure 5. The results shown inFigure 13 confirm that the collector delivered higherthermal energy from September to April which coincideswith the peakmonths of hot water demand. The occurrenceof demand and supply peaks in the same season enablingthe stakeholder to utilize maximum collector capacity.
3.5 Solar tracking
The regular building applied collectors for office, residen-tial and commercial sectors were not tracked while trackingwas considered for hospitals. However, the strong andstable radiation spanning over several daylight hours inUAE and similar contexts offers an opportunity todetermine the potential enhancement in collector yield
through solar tracking. The effect of solar tracking isinvestigated employing three tracking modes i.e., thesurface rotates about a vertical axis (single-axis) to trackthe sun (track-1), the surface rotates about horizontal axis(single-axis) to track the latitude changes (track-2), thesurface tracks in horizontal and vertical axis (double-axis)such that the beam radiation is always normal to thesurface (track-3). The Qc of tracked collector is comparedwith that of a static collector facing south at optimal tiltangle (24°). The net Qc produced by collector in eachtracking mode is calculated after subtracting the energyrequired for tracking of the collector and is presented inFigure 14. The net Qc for track-1, track-2, and track-3 washigher than that of static collector by 5.6%, 10.3% and13.4% respectively indicating a potential to introducetracking option. The simulation studies are pure energy

Fig. 11. (A) The impact of azimuth angle (b) on the average energy produced from the solar collector (Qc) on average monthly basis.(B) The impact of azimuth angle (b) on the energy produced from the solar collector (Qc) on yearly basis.
K. Tabet Aoul et al.: Sust. Build. 3, 3 (2018) 9
comparisons and does not include the special and structuralrequirements of tracking systems which needs furtheranalysis and is out of the scope of this paper.
3.6 Solar concentration
The solar radiation as it reaches the collector surface (socalled single sung) yields lower temperatures suitable forbuilding applications that require water at 45 °C. However,for hospitals and industrial processes, the required temper-atures range from 75 to 110 °C and is unlikely to be achievedby the conventional single sun collectors. To achieve such ahigher temperature, modifications are required such asadding mirrors or lenses to concentrate solar radiation. Theeffect of solar concentration by employing geo-metricalconcentration ratio (ratio of lenses or mirror area to thecollector area) ranging from 1 to 5x are investigated in
winter months (Dec. and Jan.) to determine theireffectiveness in the worst-case scenario i.e., season of higherwater demand with lower solar gains. An almost linearincrease in collector outlet temperature was observed withincreasing solar radiation concentration as shown inFigure 15. It was observed that without solar concentration(1x), the water temperature remained below 60 °C whichcan only serve domestic buildings with demand sidetemperature of 45 °C. The temperature required for hospitalbuildings (65 °C) is achieved with the concentration ratio of2x and that required for industrial buildings (70 °C–110 °C)is achieved by concentration ratio of 3–5x. To achieve suchtemperatures, the collector needs modifications such asoptical elements, tracking systems and structural supportwhich involves additional space and cost which are notconsidered at this stage. The study therefore, is intended todetermine achievable temperatures at certain concentra-

Fig. 12. Monthly average inlet water flow rate for different building type.
Fig. 13. Average energy contribution from the solar collector with varying inlet water temperature.
10 K. Tabet Aoul et al.: Sust. Build. 3, 3 (2018)
tion ratios only leaving the detailed resource input-outputcomparison for future studies.
4 Overall system performance
Finally, the collector is simulated using optimal collectorparameters of tilt angle, azimuth angle and water flow ratediscussed in previous sections to determine its effectivenessin delivering the required amount of hot water [14] and atthe desired temperature [15]. The thermal energy producedby the collector is compared to the thermal energy requiredby each building type for the required amount of hot waterproduction. Finally, the ratio of collector area to buildingfoot print area is calculated to deliver the required hot
water demand for each building type as shown in Table 3.The results show that the hospital building required thehighest collector area per building area associated to higheroccupants’ density as well as hot water demand for specificactivities such as equipment sterilization.
The calculated ratios should help building professionalsand owners to size an optimal solar thermal collector fortheir respective buildings with minimal effort and yet beaccurate. In design terms, however, opportunities may besometimes limited, knowing that SWHS are traditionallyinstalled on rooftops, the space availability may be limiteddue to building design (for example, in tall buildings) or theexistence of other building equipment such as HVACsystems. The reported higher temperatures achieved bysolar tracking and solar concentration can widen the

Fig. 14. Monthly average energy contribution from the solar collector with varying solar tracking modes.
Fig. 15. Temperature variation versus solar radiation concentration.
K. Tabet Aoul et al.: Sust. Build. 3, 3 (2018) 11
integration of solar energy in novel areas like industries,nevertheless it comes at the expense of additional space byconcentrators and tracking systems.
5 Economic analysis of the system
The economic analysis is conducted by calculating simplepayback period considering the benefit of energy producedand the cost of the systems installed. The energy isconverted into monetary cost and benefit by applying UAEbased electricity tariff of AED 0.32/kWh [31]. To apply theelectrical energy tariffs, the thermal energy is convertedinto equivalent electrical energy by considering a 70%
depreciation in energy quality. Additional tracking,inclusive of tracking system and energy, cost is countedas $0.36 per watt installed [32] considering thermal systemsequivalent of PV systems in terms of tracking. Energyconsumed by the pump to circulate water through collectoris calculated by assuming 10m additional water head witha flow rate of 0.18L/. It resulted in the additional shaftpower of 30W for pumping. The equivalent electricalenergy gain for static, single axis tracked (vertical), singleaxis tracked (horizontal), double axis tracked, andconcentrated case is 35.3MWh/lifetime, 37.5MWh/life-time, 39.2MWh/lifetime, 40.6MWh/lifetime and50.6MWh/lifetime respectively. The considered costsand benefits are compiled in Table 4.

Table 3. Energy performance of the optimized solar thermal collector for various building types under different trackingoptions.
Sector Parameters Static Single axistracking (vertical)
Single axistracking (horizontal)
Double axistracking
Residential Energy demand (MJ/day) 558 – – –
Energy produced (MJ/day) 157 165 172 178No of collector required 7 7 6 6Collector area per building area 0.0142 0.0135 0.0129 0.0125
Hospital Energy demand (MJ/day) 1470 – – –
Energy produced (MJ/day) 152 161 168 173No of collector required 19 18 17 17Collector area per building area 0.0385 0.0365 0.0349 0.0340
School Energy demand (MJ/day) 315 – – –
Energy produced (MJ/day) 151 160 167 172No of collector required 4 4 4 3Collector area per building area 0.0083 0.0079 0.0075 0.0073
Office Energy demand (MJ/day) 166 – – –
Energy produced (MJ/day) 68 72 75 77No of collector required 5 5 4 4Collector area per building area 0.0098 0.0093 0.0089 0.0086
Factories Energy demand (MJ/day) 949 – – –
Energy produced (MJ/day) 154 163 170 175No of collector required 12 12 11 11Collector area per building area 0.0245 0.0232 0.0222 0.0216
Table 4. Cost estimation of the set-ups and their monetary benefits.
Cost ($) Static FPC Tracked FPC Concentrated FPC
Collector cost 756 756 756Pump cost 50 50 50Tracking cost 0 36 36Concentrator cost 0 0 125Pumping energy cost 108 108 108Tracking energy cost 0 36 0Total cost ($) 914 950 1039
Thermal energy(kWh/day)
Equivalent electricalenergy (kWh/day)
Yearly electricalenergy (MWh/year)
Yearlysaving ($)
Static 39.2 11.76 3.5 304Single axis tracking (vertical) 41.7 12.51 3.7 322Single axis tracking (horizontal) 43.6 13.08 3.9 340Double axis tracking 45.1 13.51 4.1 357Concentrator 56.2 16.86 5.1 444
12 K. Tabet Aoul et al.: Sust. Build. 3, 3 (2018)
K. Tabet Aoul et al.: Sust. Build. 3, 3 (2018) 13
The simple payback period is calculated by dividing thetotal cost of the system (initial investment as well asoperating cost) by the economic benefit of the energyproduced in the first year applying the values of energyharvested and electricity rates. The static case has thelongest payback period of almost 3 years. Payback periodreduced gradually with the improvement in thermal gainvia different ways of tracking and/or concentration. In theoptimized case, the payback period is reduced to almost 2years.
6 Conclusion
This study examined the energy performance of SWHS invarious building types under the hot climate of UAE,through TRNSYS simulation model. The parametricsimulation determined the optimal collector parametersof tilt angle, azimuth angle and collector inlet water flowrate with respect to different seasons, building types andwater demands. An optimal tilt angle of each month wasidentified to exploit the maximum potential of the systemin AbuDhabi, UAEwhich ranged from 50° at maximum forJanuary to 0° for May. The optimum azimuth angle wasfound to be 0° (south facing) rendering a drop of 22% and30% in thermal yield when the collector faced exact Eastand West respectively. It was observed that the roofapplied collectors (both flat and pitched) are more effectivethan wall mounted collectors. Eventually, the collectorarea required per building area was determined for eachbuilding type with the hospital requiring, in the best case,the highest ratio value. The solar collector tracking wasthen evaluated as a means of reducing the area allocated toinstall the collectors on top of a roof or on a facade. Theneeds for solar radiation concentration is determined forsome building types to deliver the higher requiredtemperatures. It was also evident that the number ofrequired collectors decrease for each building as the axis oftracking increases. Finally, the system feasibility iscalculated for the payback period and the optimized casewill be able to return its cost in almost 2 years.
These results would provide building professionals witha quick assessment of the possibility to integrate therequired area or number of SWHS collectors to meet thehot water demand in new or retrofitted buildings.
Nomenclature
Ac
aperture area of the collector (m2) CHX heat-capacitance of coiled heat-exchanger (kJ/K)
Cpc specific heat of collector fluid (kJ/(kgK)) Ctank heat capacitance of storage tank (kJ/K) DHW domestic hot water fc collector-fin efficiency factor fr overall collector heat-removal efficiency factor Ib incident-beam radiation per unit area (kWh/m2) Id diffused radiation per unit area (kWh/m2)It
global radiation on horizontal surface per unitarea (kWh/m2)Iti
total incident-radiation on a flat surface perunit area (kWh/m2)mc
collector fluid mass-flow rate (kg/h) nc number of collectors mounted in series ng number of glass covers Qc rate of heat gain collector array (kW) Qin, HX rate of heat gains of coiled heat-exchanger (kW) Qin, tank rate of heat gains of storage tank (kW) Qout, HX rate of heat loss of coiled heat-exchanger (kW) Qout, tank rate of heat loss from storage tank (kW) rg ground reflectance SWHS solar water heating systems SHC solar heating and cooling systems Ta ambient temperature (°C) Tav collector-fluids average temperature (°C) Thwa hot-water average temperature (°C) Thw1 hot-water initial temperature (°C) Thw2 hot-water final temperature (°C) THX temperature of coiled heat-exchanger (°C) Ti temperature of fluid entering the collector (°C) Tp collector-plates temperature at stagnation (°C) Ttank temperature of storage tank (°C) Ube heat loss coefficient of collector bottom surface(kWh/m2K)
Uc overall heat loss-coefficient of collector (kWh/m2K)
Symbols
a
absorptance of absorber plate eg emissivity of glass covers ep emissivity of absorber plate s Stefan–Boltzmann constant (5.6697� 10-8W/ (m2K4)) t transmittance of absorber plate Dt simulation time-step (h) ’ collector latitude angle (°) b collector azimuth angle (°) F collector tilt angle (°)The authors gratefully acknowledge financial support from theUnited Arab Emirates University through the Emirates Centrefor Energy and Environment research funded project (31R054).
References
1. Dubai Electricity & Water Authority (DEWA), AnnualStatistics, https://www.dewa.gov.ae/en/about-dewa/about-us/dewa-publications/annual-statistics
2. U.S. Environmental protection agency, draft inventory of U.S. greenhouse gas emissions and sinks:1990–2014 (U.S.environmental protection agency, Washington, 2016)
3. U.S. Energy information administration, issues in interna-tional energy consumption analysis: Canadian energydemand, (2015)

14 K. Tabet Aoul et al.: Sust. Build. 3, 3 (2018)
4. R. Kempener, G. Simbolotti, G. Tosato, Solar Heating andCooling for Residential Applications (International renew-able energy agency, 2015)
5. M.D. Islam, I. Kubo, M. Ohadi, A.A. Alili, Measurement ofsolar energy radiation in Abu Dhabi, UAE, Appl. Energy 86,511–515 (2009)
6. A. Hasan, H. Alnoman, Y. Rashid, Impact of integratedphotovoltaic-phase change material system on buildingenergy efficiency in hot climate, Energy Build. 130, 495–505(2016)
7. A. Hasan, K.A. Al-Sallal, H. Alnoman, Y. Rashid, S.Abdelbaqi, Effect of Phase Change Materials (PCMs)Integrated into a Concrete Block on Heat Gain Preventionin a Hot Climate, Sustainability 8, 1009 (2016)
8. F.A. Ghaith, R. Abusitta, Energy analyses of an integratedsolar powered heating and cooling systems in UAE, EnergyBuild. 70, 117–126 (2014)
9. A. Al-Alili, M.D. Islam, I. Kubo, Y. Hwang, R. Radermacher,Modeling of a solar powered absorption cycle for Abu Dhabi,Appl. Energy 93, 160–167 (2012)
10. F. Jafarkazemi, S.A. Saadabadi, Optimum tilt angle andorientation of solar surfaces in Abu Dhabi, UAE, Renew.Energy 56, 44–49 (2013)
11. A. Khalil, A. Alnajjar, Experimental and theoreticalinvestigation of global and diffuse solar radiation in theUnited Arab Emirates, Renew. Energy 6, 537–543 (1995)
12. A transient system simulation program-program manual,University of Wisconsin-Madison, USA: Solar energylaboratory, TRNSYS 17 (2004)
13. International Building Code 2009, https://law.resource.org/pub/us/code/ibr/icc.ibc.2009.html
14. ASHRAEHANDBOOK2011HVACApplications SI Edition15. The engineering toolbox (2016), http://www.engineeringtool
box.com/design-hot-water-system-d_92.html16. S.A. Klein, Calculation of flat-plate collector loss coefficients,
Sol. Energy 17, 79–80 (1975)17. Solar-energy laboratory, IIsibat version 3.0.0.26, TRNSYS
15.3., Solar-energy laboratory university of WisconsinMadison
18. M.R. Islam, K. Sumathy, S.U. Khan, Solar water heatingsystems and their market trends, Renew. Sustain. EnergyRev. 17, 1–25 (2013)
19. I.R. Pillai, R. Banerjee, Impact of hot water usage patternand location on economics of solar water heating systems,Water Energy Abstr. 14, (2004)
20. A. Lowenstein, C. C. Hiller, Disaggregating residential hotwater use�Part II’, ASHRAETrans. 104, 1852–1863 (1998)
21. NAHB Research Center, Inc (2002), Performance compari-son of residential hot water systems, Report prepared forNational Renewable Energy Laboratory, Colorado
22. A. Gadgil, Economic, materials and performance constraintson the design of a solar DHW system for use in India, SESI J.1, 31–36 (1987)
23. I.R. Pillai, R. Banerjee, Methodology for estimation ofpotential for solar water heating in a target area, Sol. Energy81, 162–172 (2007)
24. K. L. Narkhede, Solar water heater as a demand sidemanagement option, M. Tech. Dissertation, Energy SystemsEngineering, (Indian Institute of Technology, Bombay,India, 2001)
25. A. Shariah, M.A. Al-Akhras, I.A. Al-Omari, Optimizing thetilt angle of solar collectors, Renew. Energy 26, 587–598(2002)
26. H. Moghadam, F.F. Tabrizi, A.Z. Sharak, Optimization ofsolar flat collector inclination, Desalination 265, 107–111(2011)
27. M.D. Islam, A.A. Alili, I. Kubo, M. Ohadi, Measurement ofsolar-energy (direct beam radiation) in Abu Dhabi, UAE,Renew. Energy 35, 515–519 (2010)
28. M. Kacira, M. Simsek, Y. Babur, S. Demirkol, Determiningoptimum tilt angles and orientations of photovoltaic panels inSanliurfa, Turkey, Renew. Energy 29, 1265–1275 (2004)
29. L. El Chaar, L.A. Lamont, Global solar radiation: multipleon-site assessments in Abu Dhabi, UAE, Renew. Energy 35,1596–1601 (2010)
30. A. Hasan, H. Alnoman, A.H. Shah, Energy efficiencyenhancement of photovoltaics by phase change materialsthrough thermal energy recovery, Energies 9, 782 (2016)
31. Dubai Electricity & Water Authority � tariff, https://www.dewa.gov.ae/en/customer/services/consumption-services/tariff
32. Solar Balance-of-System: To Track or Not to Track, Part I,https://www.greentechmedia.com/articles/read/solar-balance-of-system-to-track-or-not-to-track-part-i
Cite this article as: K. Tabet Aoul, A. Hasan and H. Riaz: Solar water heating systems for different buildings under a hot climate;parametric optimization and economic analysis. Sust. Build. 3, 3 (2018).