solarenergie-förderverein deutschland e.v. p.1 100% renewable energies for germany e. waffenschmidt...
TRANSCRIPT
Solarenergie-Förderverein Deutschland e.V.Solarenergie-Förderverein Deutschland e.V.
p.1
100%Renewable Energies for Germany
E. Waffenschmidt
Solarenergie-Förderverein Deutschland e.V.(Solar Energy Promoting Society of Germany)
Aachen, 19. August 2007
Solarenergie-Förderverein Deutschland e.V.Solarenergie-Förderverein Deutschland e.V.
p.2
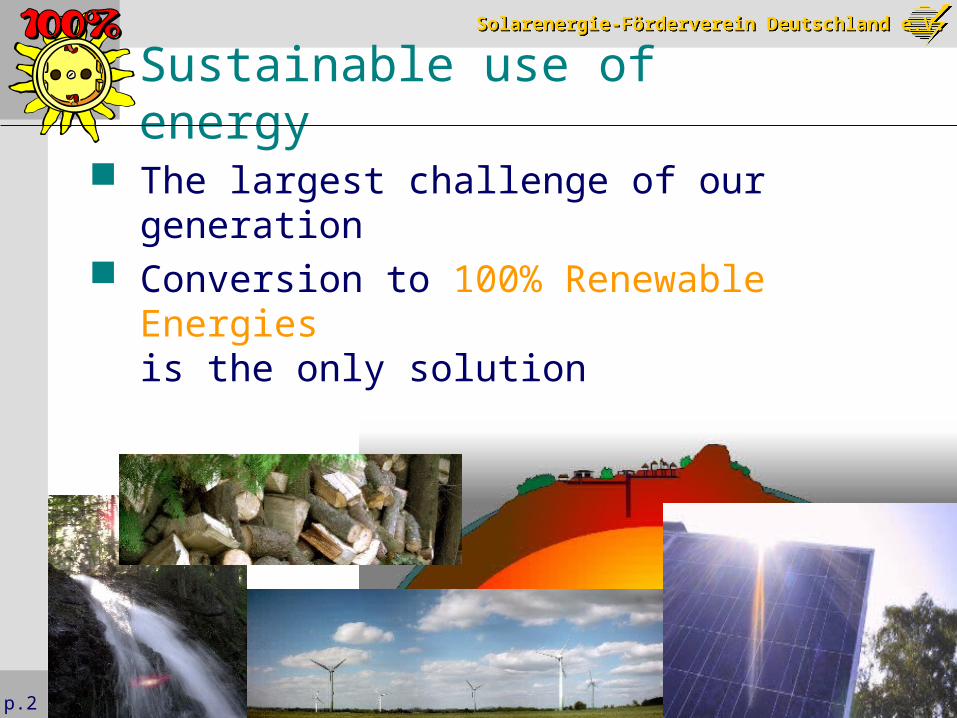
Sustainable use of energy
The largest challenge of our generation Conversion to 100% Renewable Energies
is the only solution
Solarenergie-Förderverein Deutschland e.V.Solarenergie-Förderverein Deutschland e.V.
p.3
Is „100% Renewables“ possible?
Studies, e.g.: Enquete-Commission of the Deutsche
Bundestag (German parliament) 2002 LTI-Research Team, 1998 V. Quaschning, 2000 (100% Electricity) Our example for Germany
Yes!Yes!
Solarenergie-Förderverein Deutschland e.V.Solarenergie-Förderverein Deutschland e.V.
p.4
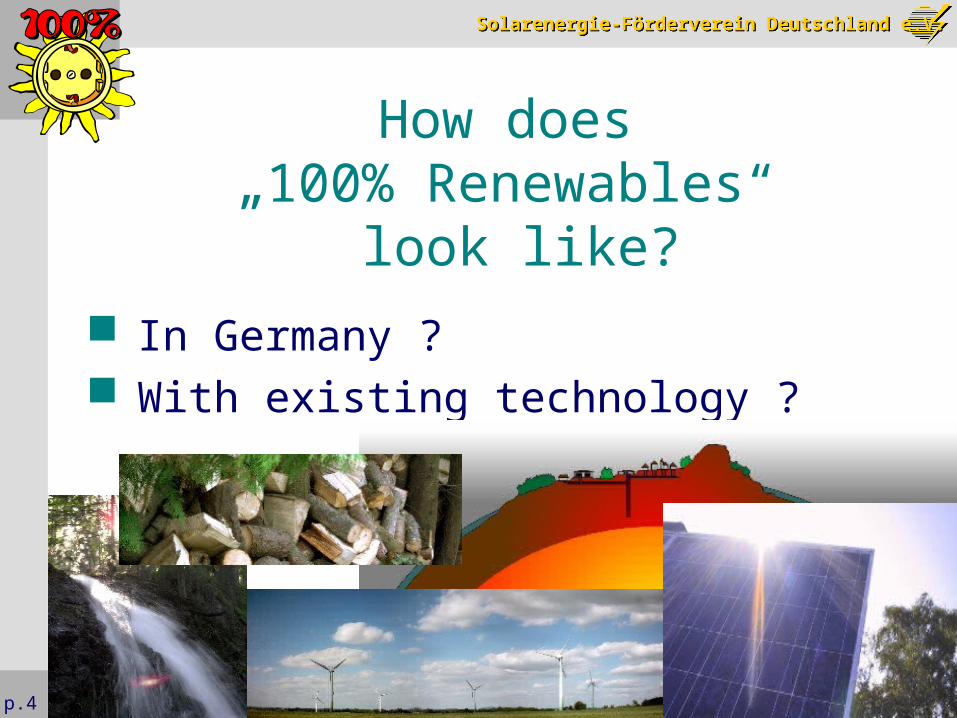
How does „100% Renewables“
look like?
In Germany ? With existing technology ?
Solarenergie-Förderverein Deutschland e.V.Solarenergie-Förderverein Deutschland e.V.
p.5
Overview
Today‘s consumption
Energy savings
Renewable Energies
Today‘s consumption
Energy savings
Renewable Energies
Solarenergie-Förderverein Deutschland e.V.Solarenergie-Förderverein Deutschland e.V.
p.6
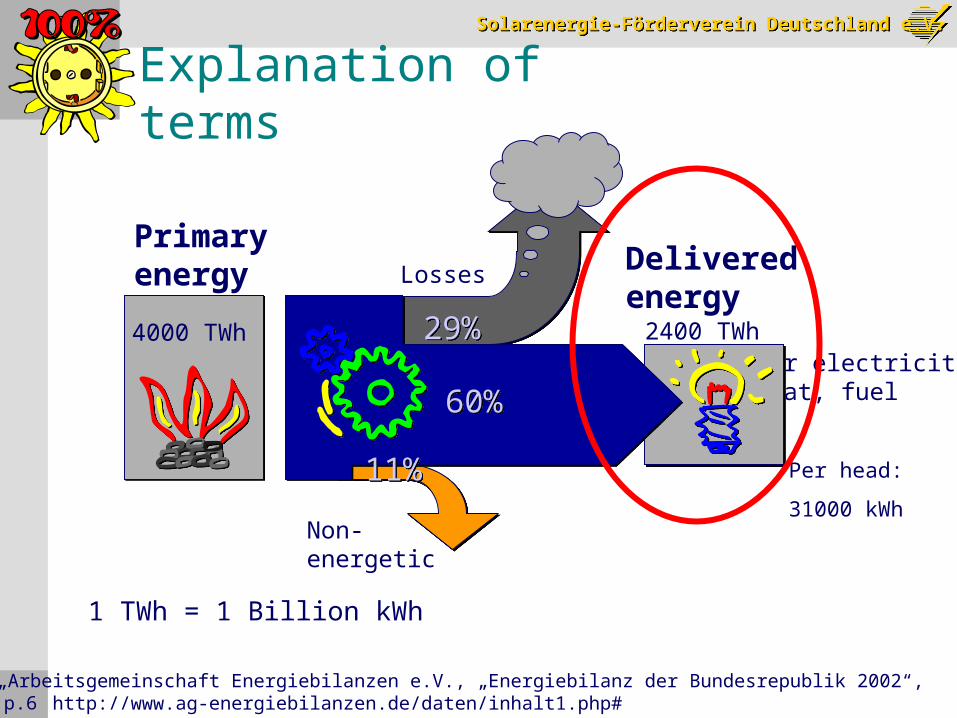
Explanation of terms
From: „Arbeitsgemeinschaft Energiebilanzen e.V., „Energiebilanz der Bundesrepublik 2002“, http://www.ag-energiebilanzen.de/daten/inhalt1.php#
For electricity,heat, fuel
Primaryenergy Delivered
energyLosses
Non-energetic
4000 TWh 2400 TWh
60%60%
29%29%
11%11% Per head:
31000 kWh
1 TWh = 1 Billion kWh

Solarenergie-Förderverein Deutschland e.V.Solarenergie-Förderverein Deutschland e.V.
p.7
„Consumption“ of Energy
0 500 1000 1500 2000 2500
Energy / TWh
Today’s demand
Elektrical applications Light Machines Information
Traffic Cars Trucks Railway Airplanes Ships
Process heat Temperatures > 200°C Mainly in industry Example: Glas manufacturing,
metal melting, bakingHeat
House heating Warm water Low temperature processes,
e.g. drying
El.Applications
Savings
TrafficProcess-HeatHeat
Solarenergie-Förderverein Deutschland e.V.Solarenergie-Förderverein Deutschland e.V.
p.8
Overview
Today‘s consumption
Energy savings
Electricity
Efficient traffic
House isolation
Renewable Energies
Solarenergie-Förderverein Deutschland e.V.Solarenergie-Förderverein Deutschland e.V.
p.9
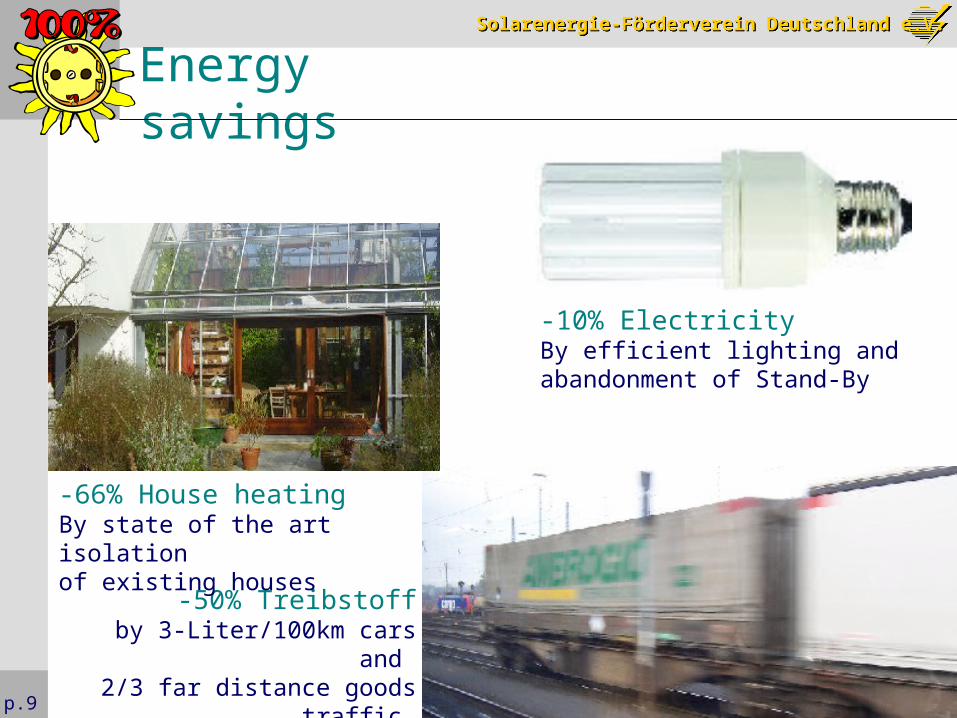
Energy savings
-50% Treibstoffby 3-Liter/100km cars and
2/3 far distance goods traffic by train
-10% ElectricityBy efficient lighting and abandonment of Stand-By
-66% House heatingBy state of the art isolation of existing houses
Solarenergie-Förderverein Deutschland e.V.Solarenergie-Förderverein Deutschland e.V.
p.10
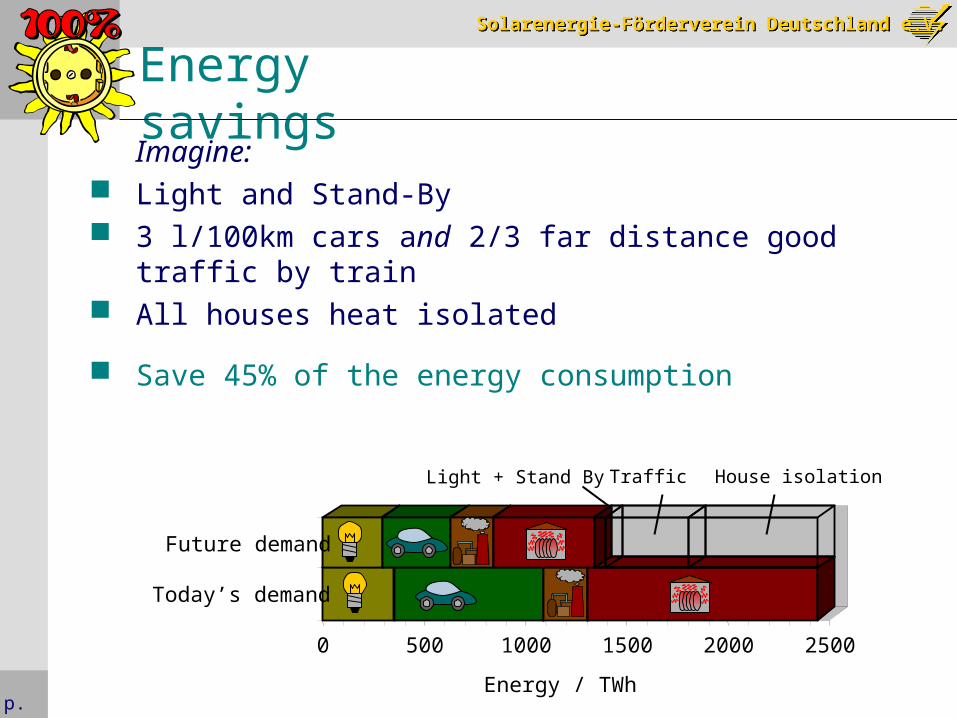
Energy savingsImagine:
Light and Stand-By 3 l/100km cars and 2/3 far distance good traffic by train All houses heat isolated
Save 45% of the energy consumption
0 500 1000 1500 2000 2500
Energy / TWh
Today’s demand
Future demand
Light + Stand By Traffic House isolation
Solarenergie-Förderverein Deutschland e.V.Solarenergie-Förderverein Deutschland e.V.
p.11
Overview
Today‘s consumption
Energy savings
Renewable Energies
Solar energy Wind power Hydro power Geothermal energy Bio mass
Solarenergie-Förderverein Deutschland e.V.Solarenergie-Förderverein Deutschland e.V.
p.12
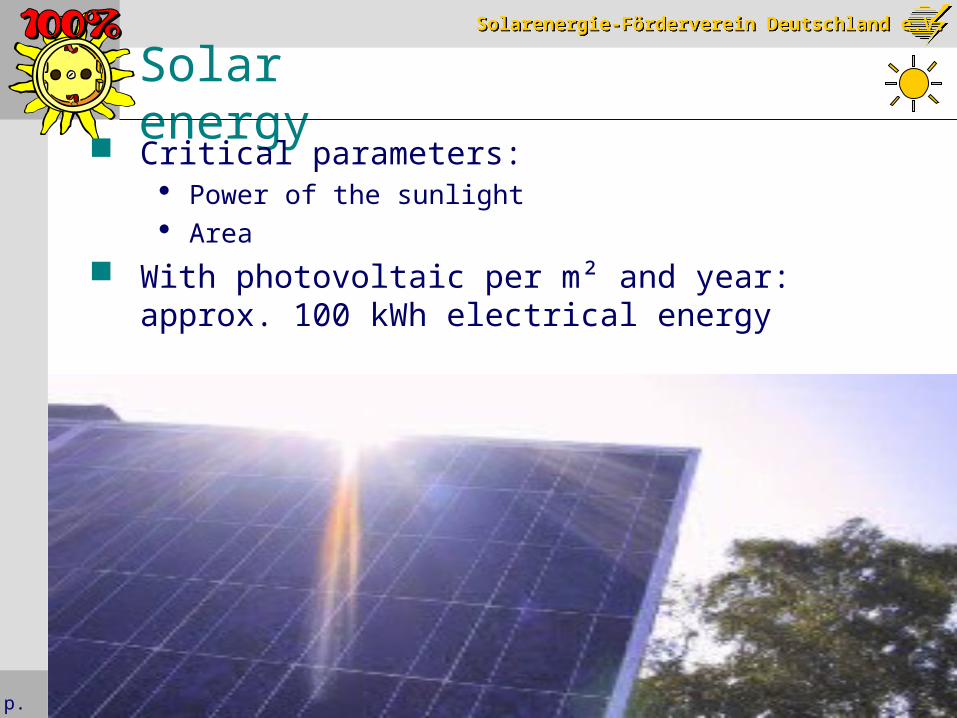
Solar energy
Critical parameters: Power of the sunlight Area
With photovoltaic per m² and year: approx. 100 kWh electrical energy
Solarenergie-Förderverein Deutschland e.V.Solarenergie-Förderverein Deutschland e.V.
p.13
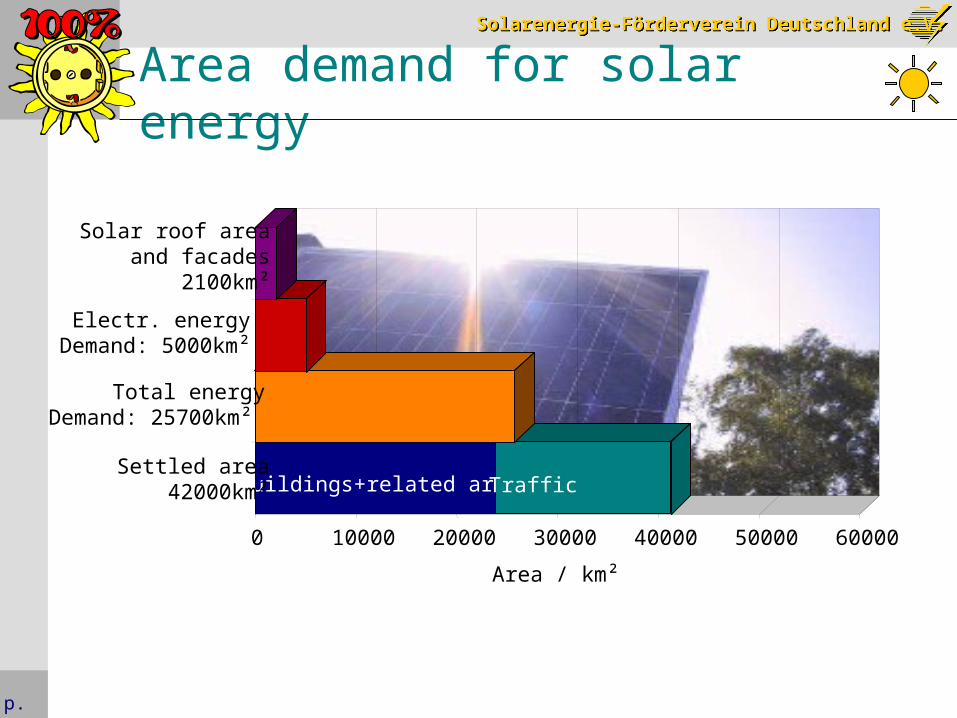
Area demand for solar energy
0 10000 20000 30000 40000 50000 60000
Area / km²
Buildings+related area TrafficSettled area
42000km²
Total energyDemand: 25700km²
Electr. energyDemand: 5000km²
Solar roof areaand facades
2100km²

Solarenergie-Förderverein Deutschland e.V.Solarenergie-Förderverein Deutschland e.V.
p.14
Solar energyImagine:
Solar systems on every suitable roof and facade
Generate nearly halve of today’s electricity demand
0 500 1000 1500 2000 2500
Energy / TWh
Future demand
Future generation
El. energy Thermal
Savings
Solarenergie-Förderverein Deutschland e.V.Solarenergie-Förderverein Deutschland e.V.
p.15
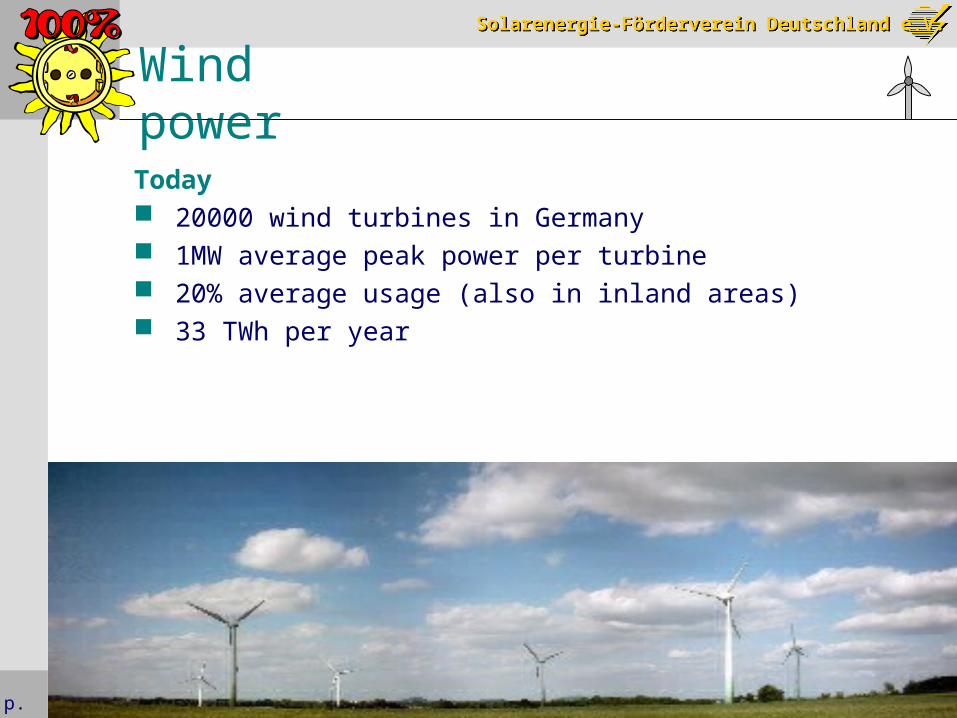
Wind powerToday 20000 wind turbines in Germany 1MW average peak power per turbine 20% average usage (also in inland areas) 33 TWh per year
Solarenergie-Förderverein Deutschland e.V.Solarenergie-Förderverein Deutschland e.V.
p.16
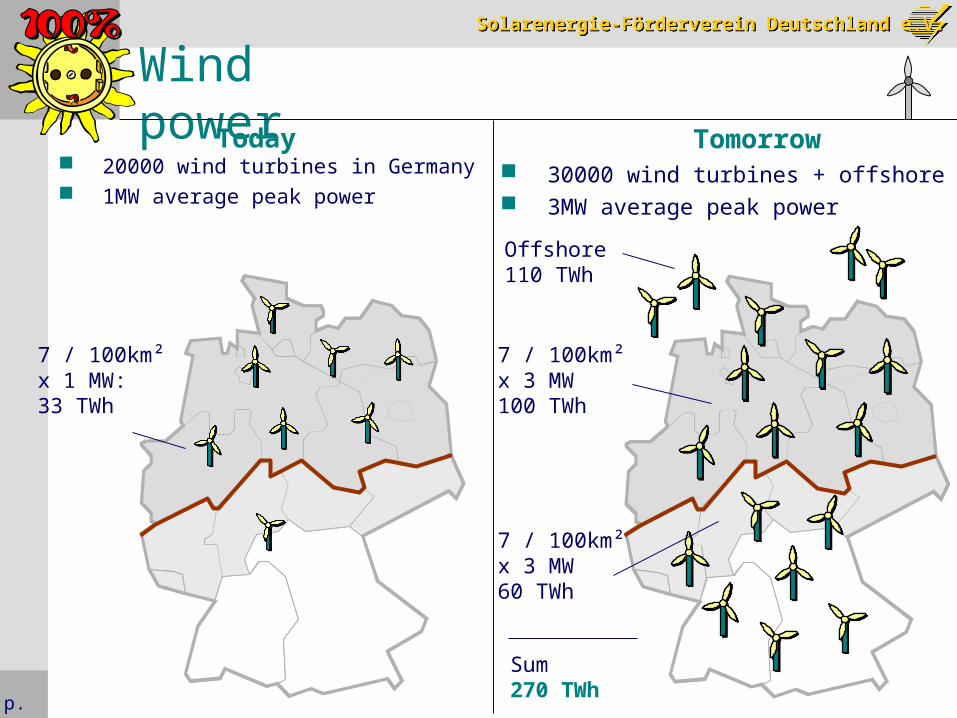
Wind powerToday
Offshore110 TWh
Sum270 TWh
7 / 100km²x 1 MW:33 TWh
Tomorrow
7 / 100km²x 3 MW100 TWh
7 / 100km²x 3 MW60 TWh
20000 wind turbines in Germany 1MW average peak power
30000 wind turbines + offshore 3MW average peak power
Solarenergie-Förderverein Deutschland e.V.Solarenergie-Förderverein Deutschland e.V.
p.17
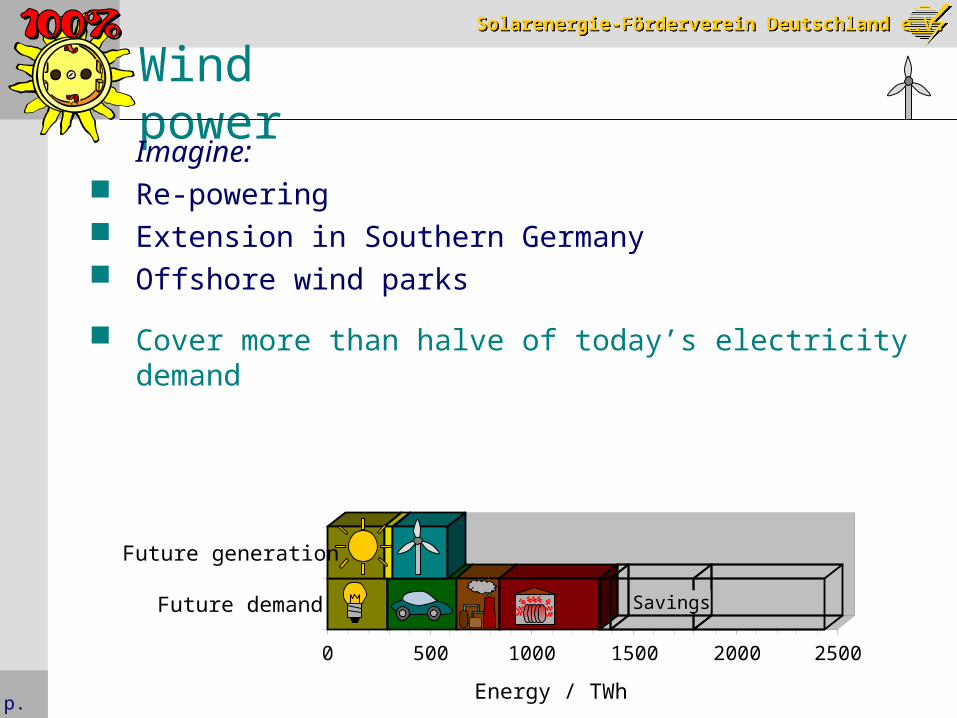
Wind powerImagine:
Re-powering Extension in Southern Germany Offshore wind parks
Cover more than halve of today’s electricity demand
0 500 1000 1500 2000 2500
Energy / TWh
Future demand
Future generation
Savings
Solarenergie-Förderverein Deutschland e.V.Solarenergie-Förderverein Deutschland e.V.
p.18
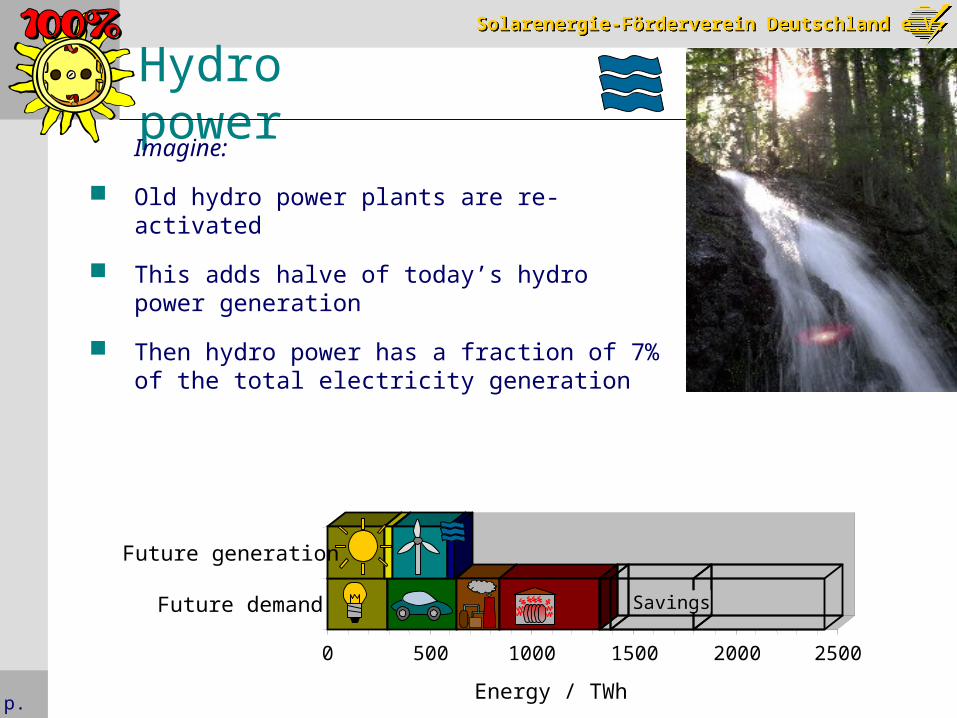
Hydro powerImagine:
Old hydro power plants are re-activated
This adds halve of today’s hydro power generation
Then hydro power has a fraction of 7% of the total electricity generation
0 500 1000 1500 2000 2500
Energy / TWh
Future demand
Future generation
Savings
Solarenergie-Förderverein Deutschland e.V.Solarenergie-Förderverein Deutschland e.V.
p.19
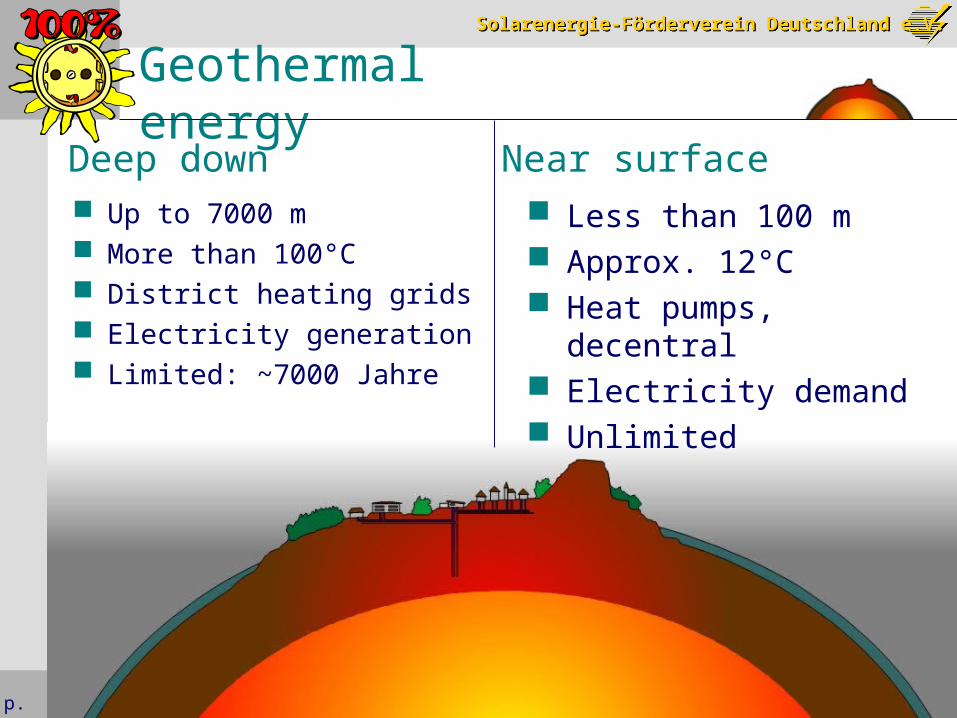
Geothermal energy
Up to 7000 m More than 100°C District heating grids Electricity generation Limited: ~7000 Jahre
Deep down Near surface Less than 100 m Approx. 12°C Heat pumps, decentral Electricity demand Unlimited

Solarenergie-Förderverein Deutschland e.V.Solarenergie-Förderverein Deutschland e.V.
p.20
Geothermal EnergyImagine:
District heating with deep geothermal energy Decentralised heat with heat pumps Satisfy the major demand for heating
0 500 1000 1500 2000 2500
Energy / TWh
Future demand
Future generation
Savings

Solarenergie-Förderverein Deutschland e.V.Solarenergie-Förderverein Deutschland e.V.
p.21
Bio mass Forrest wood
Fire wood Waste wood
Waste material Garbage (but: Recycling is preferred!) Excrements (e.g. liquid manure, sludge) Bio waste (e.g. straw, garden waste)
Agricultures 20% of the agricultural area

Solarenergie-Förderverein Deutschland e.V.Solarenergie-Förderverein Deutschland e.V.
p.22
Bio mass as fuel
Rape oil Approx. 1700l fuel per hectare and year ( 1.7 kWh/m²) Only approx. 10% of the fuel demand on 20% of the agricultural area High energy effort for production Sustainable land cultivation difficult
BTL Approx. 2000-4000l fuel per hectare and year ( 2…4 kWh/m²) Medium energy efficiency (10…40%), no combined-heat-and-power Centralized large scale plants -> high transport effort No sustainable land cultivation
Biogas Approx. 5500l fuel equivalent per hectare and year ( 5.5 kWh/m²) Acceptable energy efficiency (50%), combined-heat-and-power possible Decentralized plants -> low transport effort Sustainable land cultivation imaginable
Solarenergie-Förderverein Deutschland e.V.Solarenergie-Förderverein Deutschland e.V.
p.23
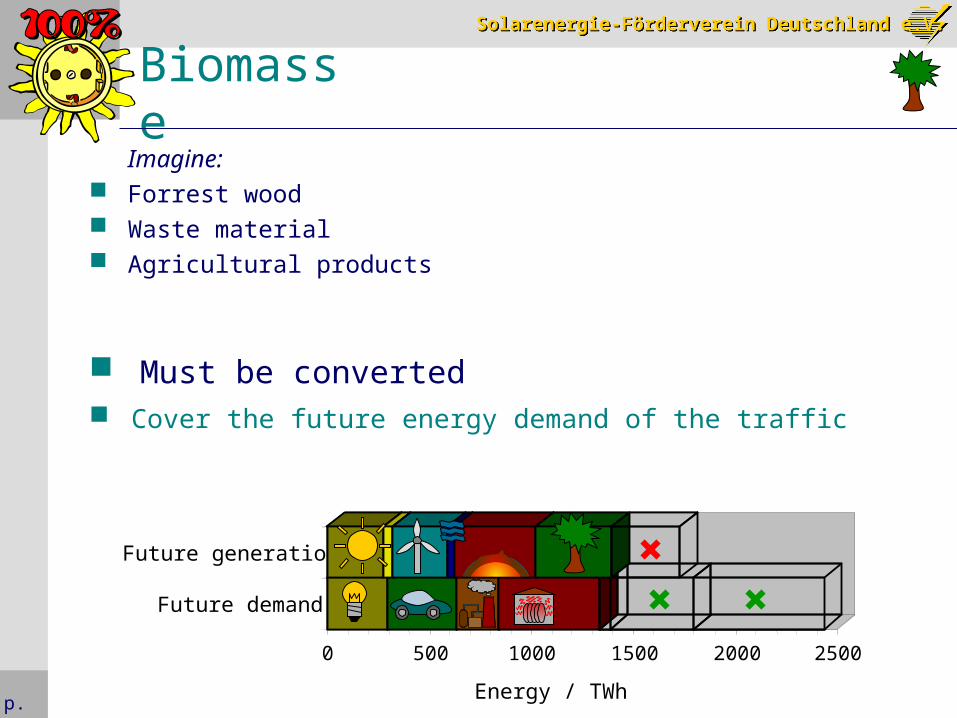
Biomasse
Imagine: Forrest wood Waste material Agricultural products
0 500 1000 1500 2000 2500
Energy / TWh
Future demand
Future generation
Must be converted
Cover the future energy demand of the traffic

Solarenergie-Förderverein Deutschland e.V.Solarenergie-Förderverein Deutschland e.V.
p.24
UsageConclusion:
More than 100% available as sum How to use the energies?
0 500 1000 1500 2000 2500
Energy / TWh
Future demand
Future generation
El. applicationsTrafficProcess heatHeatSavings
Solar electricSolar thermalWind powerHydro powerGeothermalBio massLosses

Solarenergie-Förderverein Deutschland e.V.Solarenergie-Förderverein Deutschland e.V.
p.25
0 500 1000 1500 2000 2500
Energy / TWh
Demand
Energy sources
Electr. applications
Traffic
Savings
Energy supply
Solar electricSolar thermalWind powerHydro powerGeothermal Bio mass
Usage
El. applicationsTrafficProcess heatHeat
ElectricityFuelWaste heat
Process heat
Heat
Solarenergie-Förderverein Deutschland e.V.Solarenergie-Förderverein Deutschland e.V.
p.26
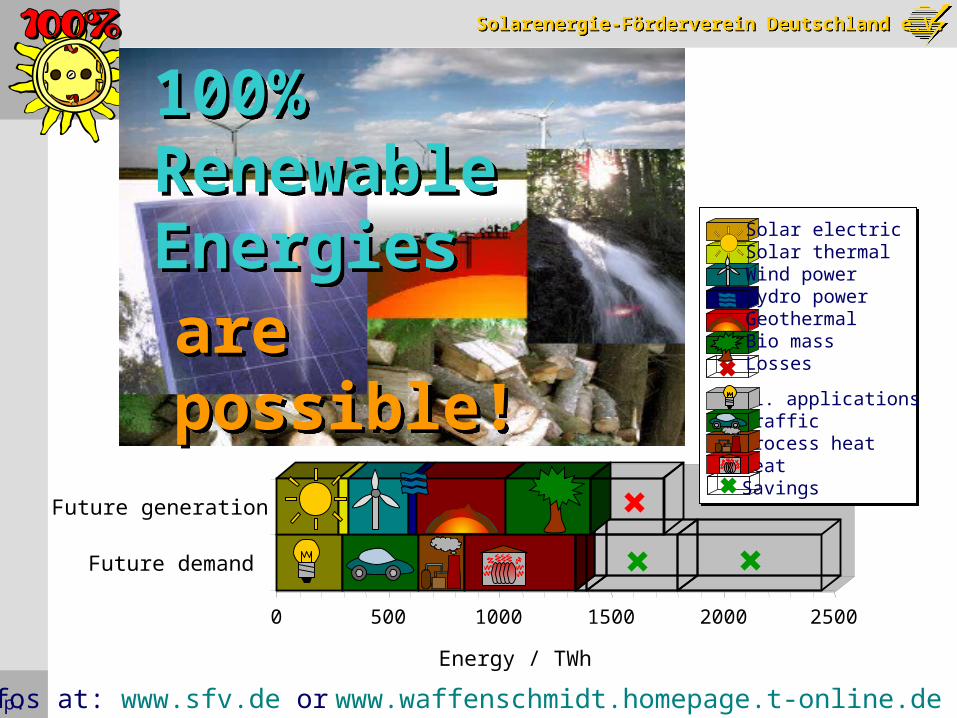
100%Renewable Energies
100%Renewable Energiesarepossible!arepossible!
Infos at: www.sfv.de or www.waffenschmidt.homepage.t-online.de
0 500 1000 1500 2000 2500
Energy / TWh
Future demand
Future generation
El. applicationsTrafficProcess heatHeatSavings
Solar electricSolar thermalWind powerHydro powerGeothermalBio massLosses
Solarenergie-Förderverein Deutschland e.V.Solarenergie-Förderverein Deutschland e.V.
p.27
Appendix

Solarenergie-Förderverein Deutschland e.V.Solarenergie-Förderverein Deutschland e.V.
p.28
What has to be done?
Possibilities of single persons are limited
Relying on comprehension is naive
General conditions must change:
Laws, directives Cost distribution
Guide and requirements by organisations
Associations Trusts
Since I switch off the engine at the traffic light, it consumes
only 13.5 Litres per 100 km
Climate saving is so easy!

Solarenergie-Förderverein Deutschland e.V.Solarenergie-Förderverein Deutschland e.V.
p.29
Why Renewable Energies?
Limit the climate change Save limited resources Reduce import dependence Avoid conflict potential Cheaper in the long run Un-dangerous and non-toxic
The more, the better

Solarenergie-Förderverein Deutschland e.V.Solarenergie-Förderverein Deutschland e.V.
p.30
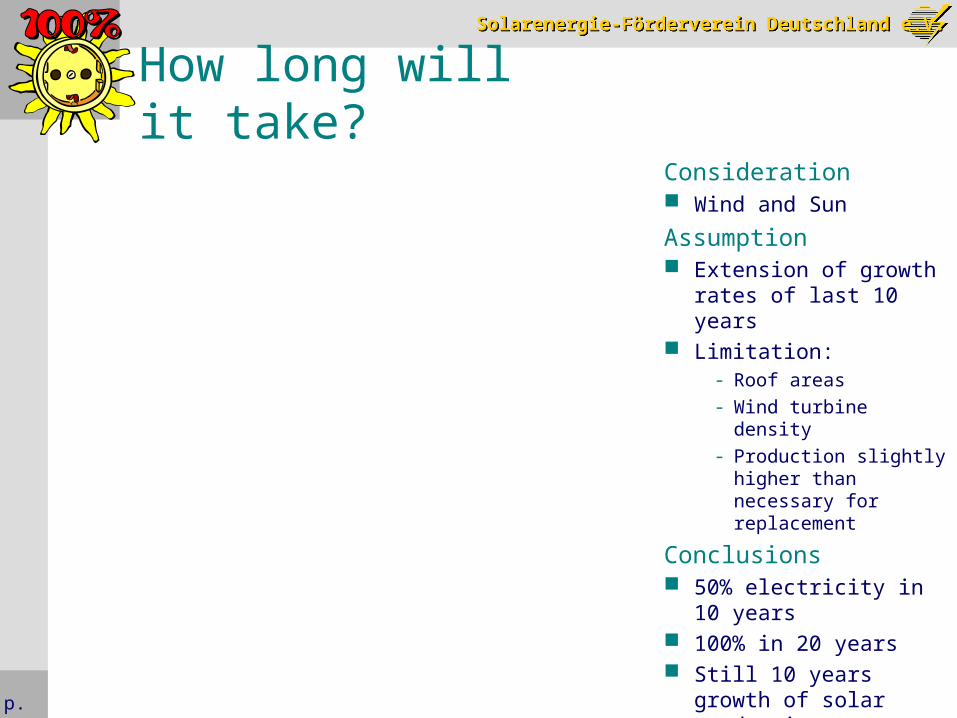
How long will it take?
Consideration Wind and Sun
Assumption Extension of growth rates
of last 10 years Limitation:
- Roof areas- Wind turbine density- Production slightly higher
than necessary for replacement
Conclusions 50% electricity in 10 years 100% in 20 years Still 10 years growth of
solar production
Development of renewable energies
0.001
0.01
0.1
1
10
100
1000
1990 1995 2000 2005 2010 2015 2020 2025 2030 2035
Time t / Years
En
erg
y p
er
yea
r/ T
Wh
DemandSumGenerated windFuture windInstalled windFuture installed windGenerated solarFuture solarInstalled solarFuture installed solar
Solarenergie-Förderverein Deutschland e.V.Solarenergie-Förderverein Deutschland e.V.
p.31
How long will it take?
Consideration Wind and Sun
Assumption Extension of growth rates
of last 10 years Limitation:
- Roof areas- Wind turbine density- Production slightly higher
than necessary for replacement
Conclusions 50% electricity in 10 years 100% in 20 years Still 10 years growth of
solar production
Development of renewable energies
0
100
200
300
400
500
600
1990 1995 2000 2005 2010 2015 2020 2025 2030 2035Time t / Years
Ene
rgy
per
year
/ T
Wh
DemandSolarWind

Solarenergie-Förderverein Deutschland e.V.Solarenergie-Förderverein Deutschland e.V.
p.32
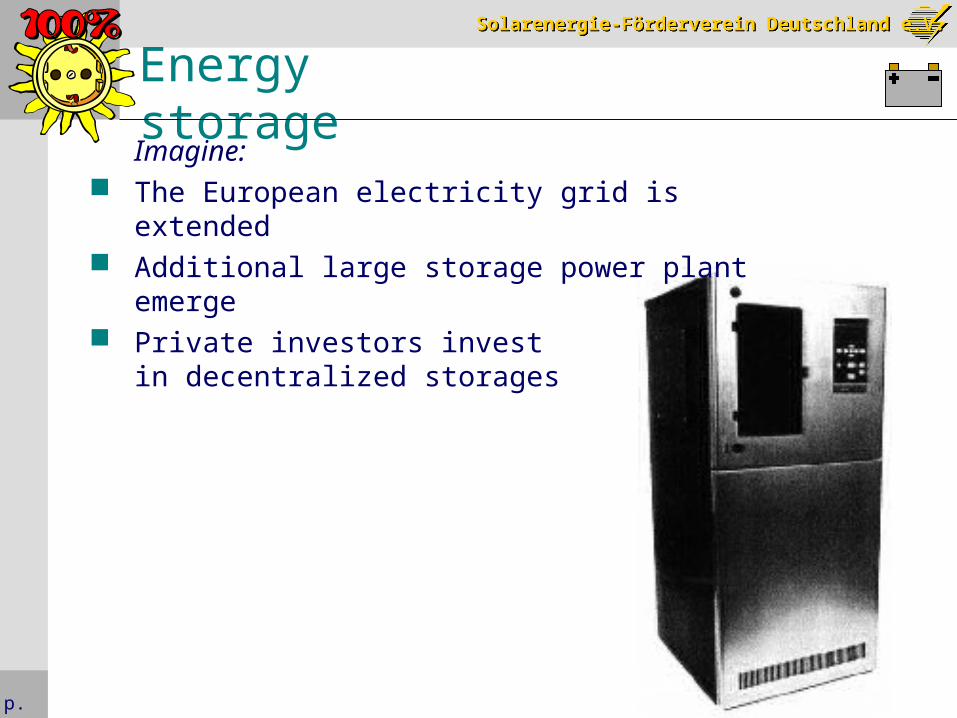
Energy storage
Relevant for electricity European grid reduces storage size Demand shift in time Needed storage (without grid and shift)*:
3% of the yearly generated energy as storage size 16% of installed power as momentary storage power 18 % of the yearly generated energy is intermediately stored
* Acc. to: Volker Quaschning, „Systemtechnik einer klimaverträglichen Elektrizitätsversorgung [...]“, VDI Verlag, 2000, ISBN 3-18-343706-6, http://www.quaschning.de/volker/publis/klima2000/index.html
Solarenergie-Förderverein Deutschland e.V.Solarenergie-Förderverein Deutschland e.V.
p.33
Energy storageImagine:
The European electricity grid is extended Additional large storage power plant emerge Private investors invest
in decentralized storages

Solarenergie-Förderverein Deutschland e.V.Solarenergie-Förderverein Deutschland e.V.
p.34
Energy flowsIn TWh321 271
33
705 400
279
271
33
25 306
316
608-61 181
120
100
294
299
162
8.4 34
19
20
43
150
214
250
193
0
935
0
15
-294-338
-210 -537
680
39
Solarenergie-Förderverein Deutschland e.V.Solarenergie-Förderverein Deutschland e.V.
p.35
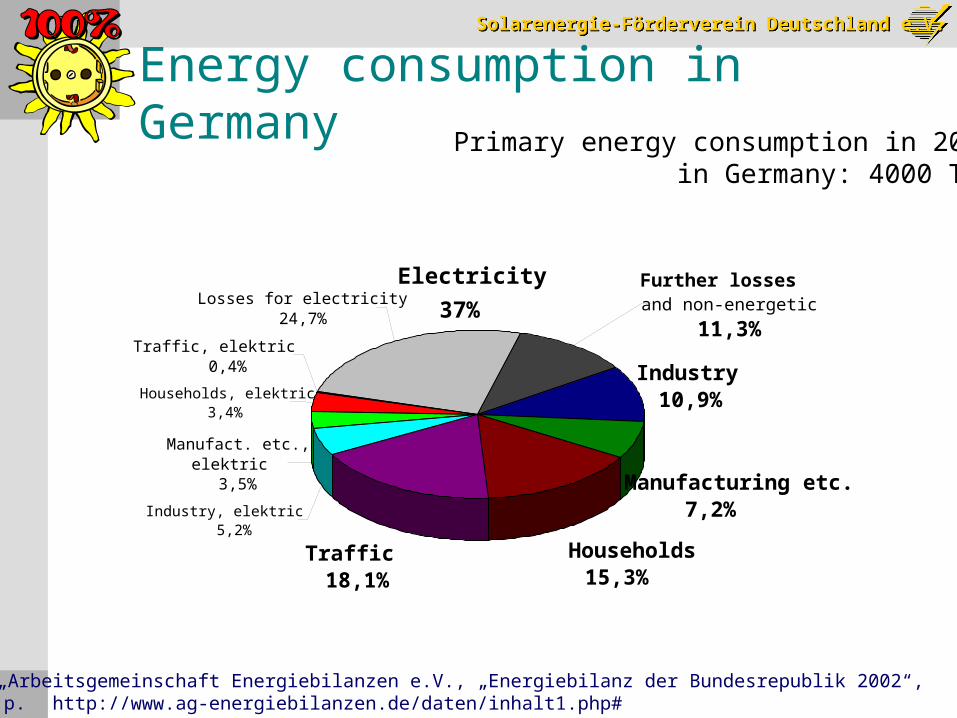
Energy consumption in Germany Primary energy consumption in 2002
in Germany: 4000 TWh
Households, elektric3,4%
Manufact. etc., elektric
3,5%
Traffic18,1%
Industry, elektric5,2%
Households15,3%
Manufacturing etc.7,2%
Industry10,9%
Losses for electricity24,7%
Traffic, elektric0,4%
Further lossesand non-energetic
11,3%
Electricity
37%
From: „Arbeitsgemeinschaft Energiebilanzen e.V., „Energiebilanz der Bundesrepublik 2002“, http://www.ag-energiebilanzen.de/daten/inhalt1.php#
Solarenergie-Förderverein Deutschland e.V.Solarenergie-Förderverein Deutschland e.V.
p.36
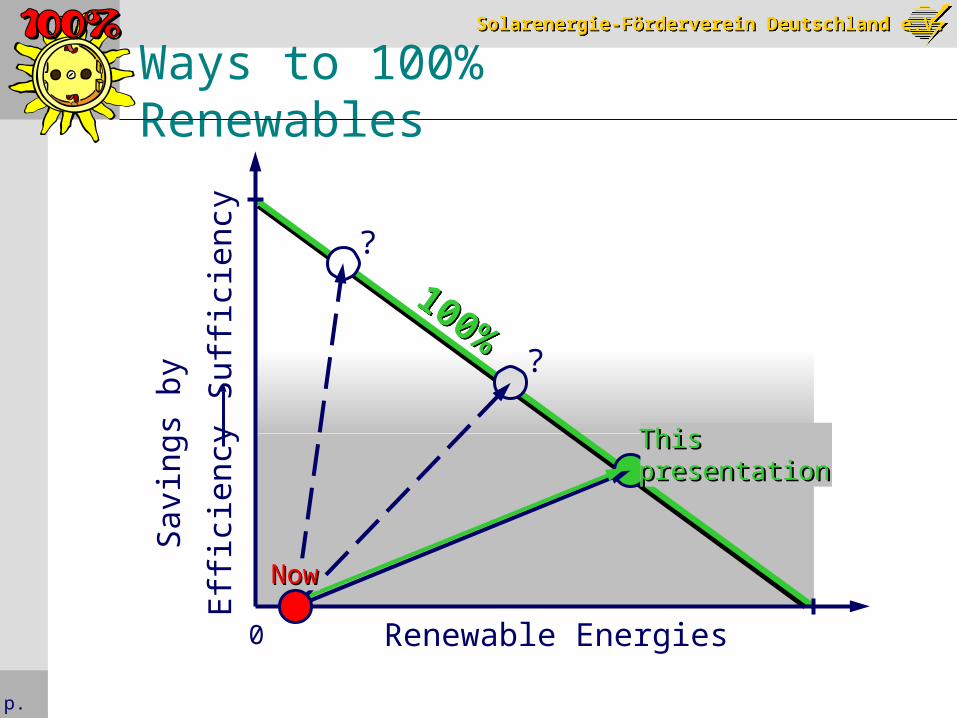
Ways to 100% Renewables
Renewable Energies
Suf
ficie
ncy
Eff
icie
ncy
0
This presentationThispresentation
NowNow
?
?
100%100%
Sav
ings
by