solid particle emissions of hdv euro 3 – dpf euro 4 – pm ... · 10.eth-conference on combustion...
TRANSCRIPT

10.ETH-Conference on Combustion Generated Nanoparticles 2006
Solid Particle Emissions of HDV Euro 3 – DPFEuro 4 – PM-KatEuro 5 – SCR
M. Kasper / ME and A. Mayer / TTMT. Mosimann / ME, L. Emmenegger / EMPA,
J. Mohn / EMPA, A. Ulrich / EMPA, P. Kirchen / ETH, F. Legerer / AKPF
Dr. Ulrich Matter22nd Feb 1939 – 6th Dec 2005

Questions • EURO 4 – PM-Kat
- Nanoparticle Emissions compared to Euro3/DPF- Nanoparticle Reduction = f (Particle Size and Engine Load)- Influence of Soot Load, Regeneration, Temperature, Transients- Secondary Emissions: NO2, Catalyst Metals
• EURO 5 – SCR- Nanoparticle Emissions compared to Euro3/DPF and Euro4/PM-Kat- SCR-Influence on Nanoparticle Reduction/Formation- NOx-Reductions at light load (bus city-driving)- Secondary Emissions: NO2, N2O, NH3, Catalyst Metals

PM : E5/4 w.DPF/3 – CONCAWE 2005

PN : E5/4 w.DPF/3 – CONCAWE 2005

MAN-published Data of Nanoparticle Emissions with PM-Kat-System

Experimental Setup

Vehicles andExhaust Aftertreatment Concepts
Mercedes Benz 1846-LS (49’051 km)- 355 kW / 1695 rpm
MAN TGA 18.430(31'196 km)- 316 kW / 1900 rpm
Mercedes Benz 1846-LS (2'863 km)- 348 kW / 1796
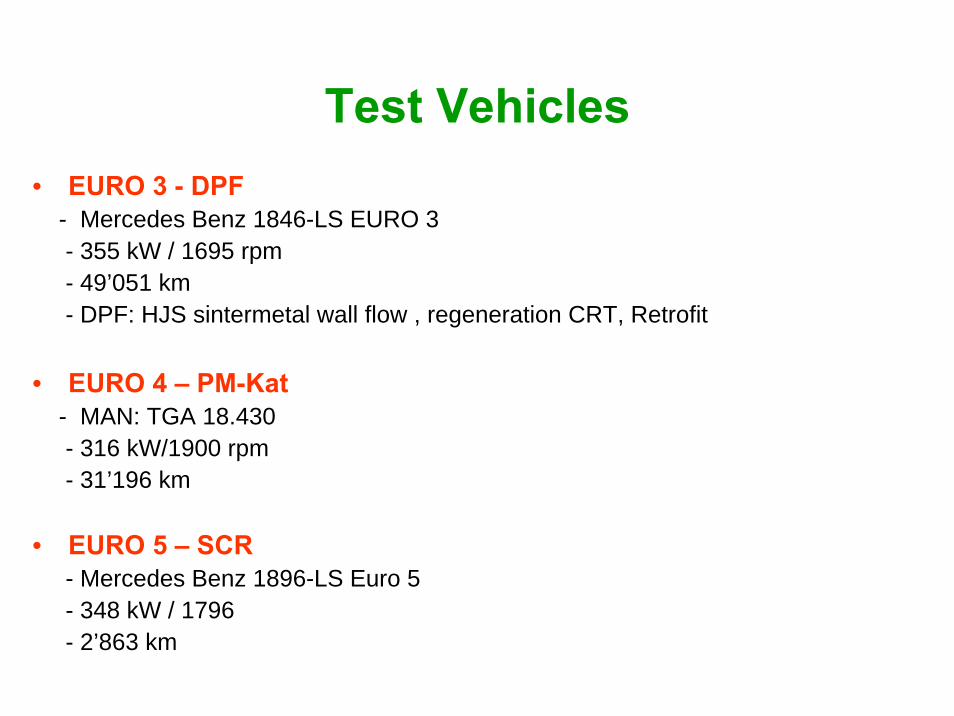
Test Vehicles • EURO 3 - DPF
- Mercedes Benz 1846-LS EURO 3- 355 kW / 1695 rpm- 49’051 km- DPF: HJS sintermetal wall flow , regeneration CRT, Retrofit
• EURO 4 – PM-Kat- MAN: TGA 18.430- 316 kW/1900 rpm- 31’196 km
• EURO 5 – SCR- Mercedes Benz 1896-LS Euro 5- 348 kW / 1796- 2’863 km

Exhaust Aftertreatment Concepts


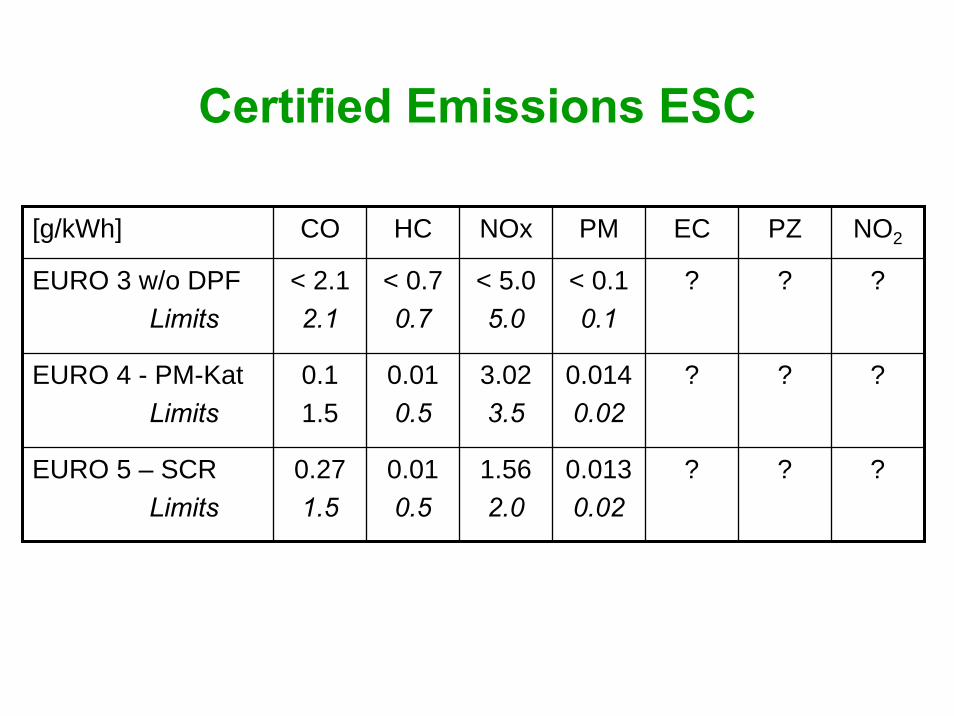
Certified Emissions ESC
[g/kWh] CO HC NOx PM EC PZ NO2
EURO 3 w/o DPFLimits
< 2.12.1
< 0.70.7
< 5.05.0
< 0.10.1
? ? ?
EURO 4 - PM-KatLimits
0.1 1.5
0.010.5
3.023.5
0.0140.02
? ? ?
EURO 5 – SCRLimits
0.271.5
0.010.5
1.562.0
0.0130.02
? ? ?

Selected Operating Points

Instruments for Particle Analysis
Product MeasurementPrinciple
SizeRange
Result
SMPS TSI ........
electric mobily sizingand CNC-counting
10-400 nm60 classes
count per classvolume, mass
PAS MEPAS 2000
photoelectric chargingcomb.aerosol surface
< 1000 nm electric chargeEC-mass
DC ME LQ1-DC
diffusion chargingFuchs-surface-meas.
< 1000 nm electric chargeFuchs-surface
PASS AVL .........
Photoacusticmeasurement of EC
< 10‘000 nm Pressure signalEC-mass
ELPI DEKATI..........
Aerodynamic sizingonline counting
< 10‘000 nm12 classes
counts per classvolume, mass

Sampling and Instrumentation
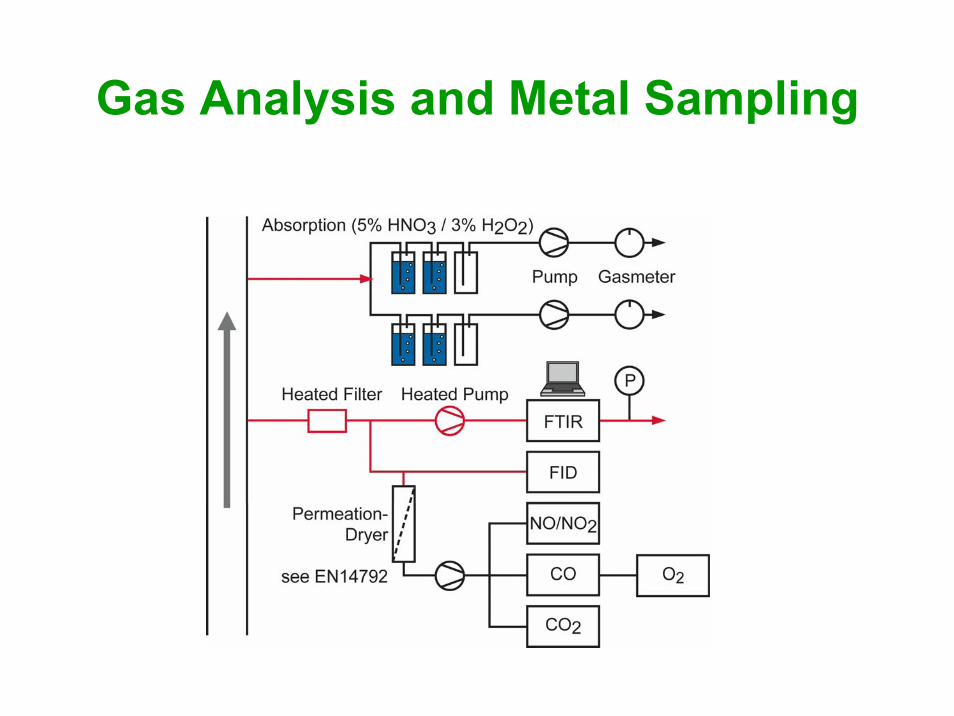
Gas Analysis and Metal Sampling

Test Set-Up
• Chassis-Dynamometer
- Stationary Test Conditions ( no dynamic cycle)- Transient Tests (free acceleration etc)
• Measurements - Nanoparticle Analysis: SMPS, PAS, DC, PASS, ELPI- Gaseous Compounds: NO, NO2, CO, HC, N2O, NH3,
- Catalyst Metals: Pt, V- Temperatures, Pressures, - no PM-measurement - CVS-Tunnel not available
• Fuel: SN 181160 -1, S < 10 ppm

Particle and Gas Emissions - General

Size Distribution (SMPS) at Low Idle

Size Distribution at 1400 rpm 25% Load

Size Distribution at 1400 rpm 50% Load

Size Distribution at 1400 rpm Full Load

Size Distributions at 1400 rpm

Free Accelerations, DC-SensorFull Load E3: 1.6 x 10⁴
Full Load E4: 2.2 x 10⁴
Full Load E5: 2.6 x 10⁴

Gas Emissions Euro 5 [ppm]

Gas Emissions Euro 4 [ppm]

Particles:SCR vs PM-Kat vs DPF

Nanoparticle Emissions with SCR

PM-Kat Regenerated and Soot Charged

PM-Kat : Penetration-Instabilities

PM-Kat: Thermogramms at 2 Loads
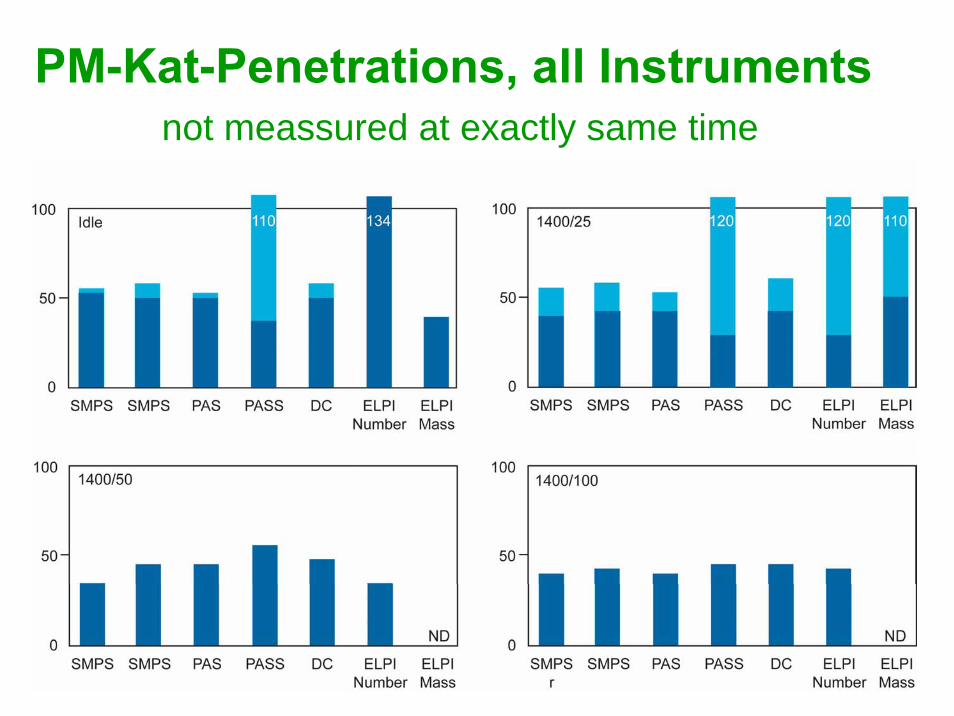
PM-Kat-Penetrations, all Instrumentsnot meassured at exactly same time
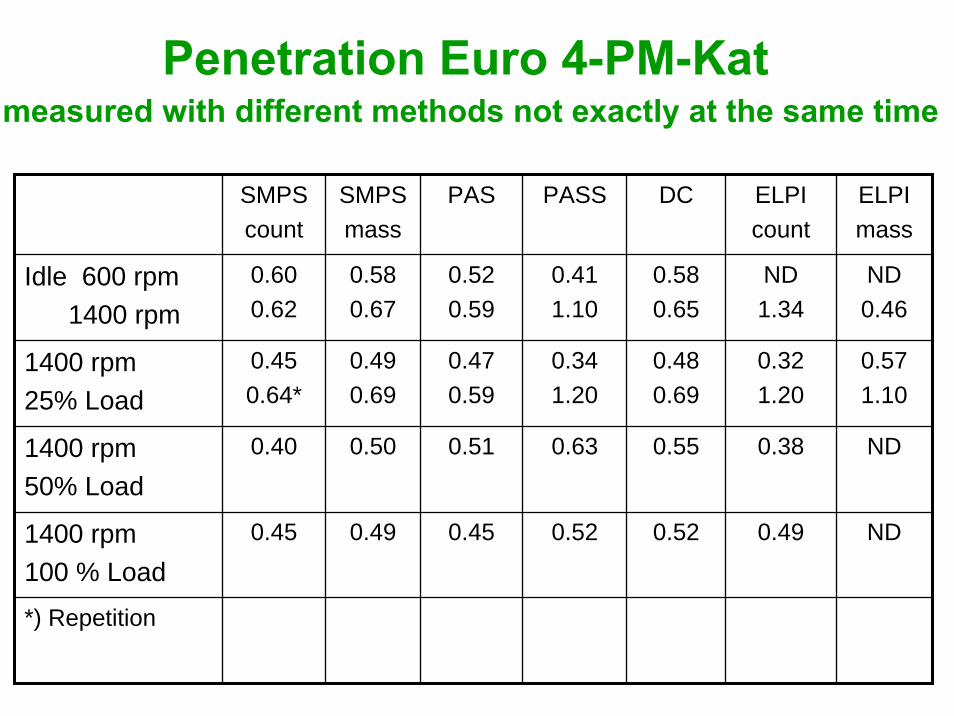
Penetration Euro 4-PM-Kat measured with different methods not exactly at the same time
SMPS count
SMPSmass
PAS PASS DC ELPIcount
ELPImass
Idle 600 rpm1400 rpm
0.600.62
0.580.67
0.520.59
0.411.10
0.580.65
ND1.34
ND0.46
1400 rpm25% Load
0.450.64*
0.490.69
0.470.59
0.341.20
0.480.69
0.321.20
0.571.10
1400 rpm50% Load
0.40 0.50 0.51 0.63 0.55 0.38 ND
1400 rpm100 % Load
0.45 0.49 0.45 0.52 0.52 0.49 ND
*) Repetition
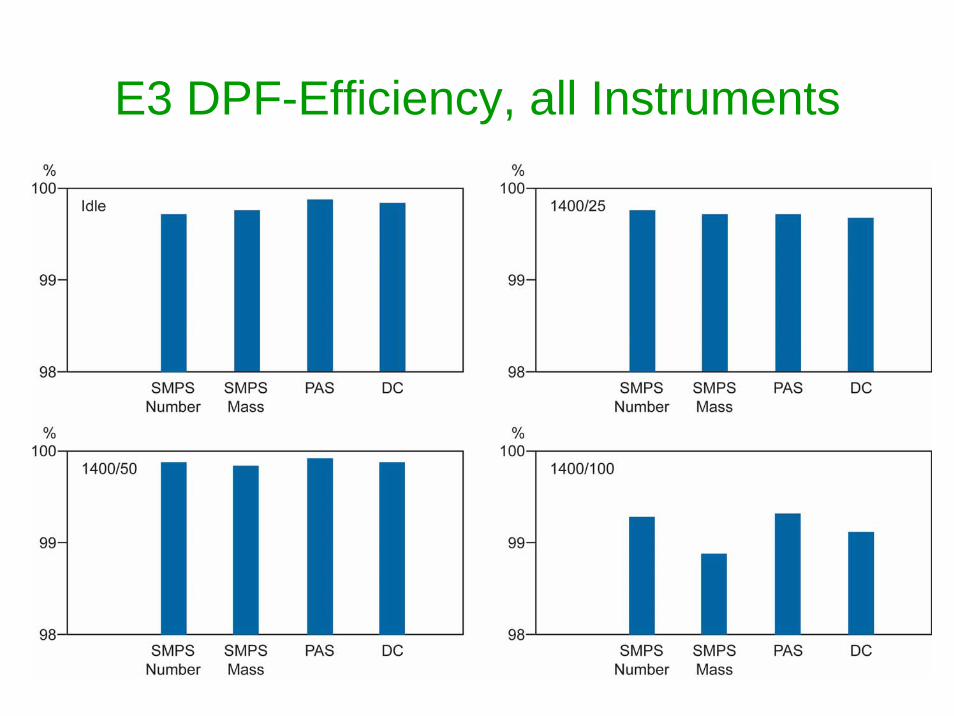
E3 DPF-Efficiency, all Instruments

Filtration Efficiency Euro 3 – DPFmeasured with different methods
SMPS count
SMPSmass
PAS PASS DC ELPIcount
ELPImass
Idle 600 rpm1400 rpm
99.70 99.75 99.88 ND 99.85 ND ND
1400 rpm25% Load
99.76 99.72 99.70 ND 99.68 ND ND
1400 rpm50% Load
99.87 99.82 99.90 ND 99.86 ND ND
1400 rpm100 % load
99.27 99.86 99.32 ND 99.12 ND ND

E4-PM-Kat, Mass Emission versus certified PM

Particle Mass Emission EURO - 4 PM-Kat aerosol measurements compared to certified PM
[mg/m3]SMPS
massPASEC
PASSEC
ELPImass
PM certified 0.014 mg/kWh
converted to mg/m3
Idle 600 rpm1400 rpm
1.54.6
4.318.4
14.67.7
ND20.2
0,6 (λ = 7)
1400 rpm25% Load
5.3 18.1 7.5 232 1.8 (λ = 3)
1400 rpm50% Load
2.5 7.7 5.3 ND 3.2 (λ = 2)
1400 rpm100 % load
1.8 5.1 4.1 ND 5.4 (λ = 1.5)

Certified PM is given in mg/kWh per cycleTo convert into mg/m3 needs assumptions for
λ and Be per operation point
fuel consumption
g/kWh
air mass consumption
mg/kWh
air volume consumtion
m3/kWh
Idle
7
400
40
34
25 % load
3
300
12.9
11
50 % load
2
250
7.2
6.1
100 % load
1.5
200
4.3
3.7
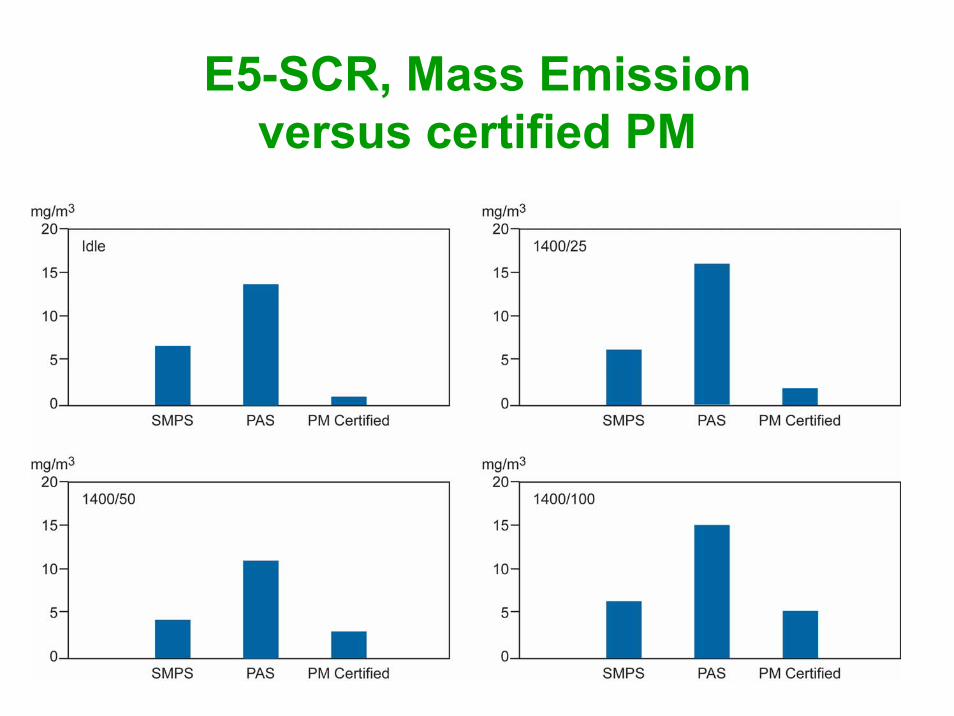
E5-SCR, Mass Emission versus certified PM

E5-SCR, Mass Emission versus certified PM

Particle Mass Emission EURO 5 - SCR aerosol measurements compared to certified PM
[mg/m3]SMPS
massPASEC
PASSEC
ELPImass
PM certified 0.013 mg/kWh
converted to mg/m3
Idle 600 rpm1400 rpm
6.6 14.3.6 ND ND 0,6 (λ = 7)
1400 rpm25% Load
6.7 16.4 ND ND 1.8 (λ = 3)
1400 rpm50% Load
4.5 10.8 ND ND 3.2 (λ = 2)
1400 rpm100 % load
6.7 14.6 ND ND 5.4 (λ = 1.5)

E3 w/o DPF, Mass Emission versus certified PM

Particle Mass Emission EURO 3 w/o DPF aerosol measurements compared to certified PM
[mg/m3]SMPS
massPASEC
PASSEC
ELPImass
PM certified 0.014 mg/kWh
converted to mg/m3
Idle 600 rpm1400 rpm
11.9 27 ND Nd 3.0 (λ = 7)
1400 rpm25% Load
28.8 70.4 ND ND 9.0 (λ = 3)
1400 rpm50% Load
22.5 51.0 ND ND 16 (λ = 2)
1400 rpm100 % load
37 86.5 ND ND 27 (λ = 1.5)

Aerosol Analysis compared to gravimetric CVS-PM-Measurement

Wrap Up

Summary• Particle Measurement Technology
– high consistency of various measurement methods
• Euro5 - SCR: The NOx Eater– NOx reduction up to 95% - very efficient– may increase engine-out nanoparticle emissions– no detectable slip of NH3, NO2 or N2O
• Euro4 - PM-Kat: Big Effort, Little Effect– unstable particle bypass system– episodes of zero efficiency; blow-off phenomena– creates high NO2 concentrations– no detectable metal emissions from catalyst
• Euro3 - DPF: The Particle Benchmark– PN downstream of DPF is < 0.2 % of upstream– PN at Euro4 and Euro5 is > 50 % of Euro3 (engine out)
Conclusions = Outlook
• Combine Advantages of DPF and SCR:
• => SCRT
• commercially available from Jan 2007– for limited fleets, e.g. buses– IVECO, DaimlerChrysler

Summary and Conclusions
• PN downstream DPF is < 0.2 % of upstream• PN downstream E4 and E5 is > 50 % of E3
DPF for E4 and E5 required • SCR reduces NOx up to 95 % - very efficient• SCR does not reduce NOx below ca 225 °C• SCR tends to increase nanoparticle emissions• SCR - slip of NH3, NO2 or N2O were below DL• PM-Kat is an unstable bypass system with zero efficiency
episodes and blow-off-phenomena• PM-Kat creates high NO2-concentrations • Catalyst metal emissions were below DL