solid waste and business management opportunities · solid waste and business management...
TRANSCRIPT

Solid Waste and Business Management Opportunities Talking Points Prepared for:
KSU Renewable Energy, Food and Sustainability Seminar
Prepared by: Paul Ligon, [email protected]
Solid Waste and Business Management OpportunitiesTalking Points Prepared for:
KSU Renewable Energy, Food and Sustainability Seminar
Prepared by: Paul Ligon, [email protected]
Personal Profile• 1986-1990, University of Vermont
– Vermont Student Environmental Program
• 1990-2001, Tellus Institute – Business and Sustainability & Sustainable Community Groups– Select clients: EPA, United Nations, Global Reporting Initiative, various
businesses and municipalities
• 2001-2003, Tuck School of Business at Dartmouth– Tuck Biz and Sustainability Initiative
• 2003-Present, WMI Upstream– Director, Biz Dev and Strategy– Select customers: diversified manufacturers, food & beverage companies,
cruise lines, pipelines, petrochemical, automotive companies.
Talking Points
• WMI at a Glance
• From Waste to Resource Management: Business Sustainability Trends
• Upstream Business Sustainability Services, Solutions, and Case Studies
WM at a Glance
• Fortune 200 company
• Nearly 50,000 employees
• Over 22 million residential and commercial customers
• Most Extensive Environmental Asset Base in North America:
– Largest recycler in North America with nearly 120 facilities
– 25,000 collection and transfer vehicles
– 285 landfills
– 17 waste-to-energy plants
– Upstream Services

WM Sustainability Highlights• Recycling assets and commitments
– Largest recycler in North America ~ over 6MM tons recycled annually– Preventing the release of more than 3.4 million metric tons of greenhouse gas
emissions– Triple current recycle rates by 2020
• Renewable energy assets and commitments– Largest national network of resource recovery facilities– Over 100 renewable energy projects throughout North America– Enough to power over 1MM homes– Double renewable power generation by 2020
• Other initiatives and commitments– Largest fleet of alternative fuel trucks in the nation (415 vehicles); increasing fleet
wide fuel efficiency and decreasing emissions 15% by 2020. – Provide protected land for wildlife habitats; quadruple - from 24 to 100 - Wildlife
Habitat Council certification sites and set asides.– Upstream and organic growth green innovations and investments
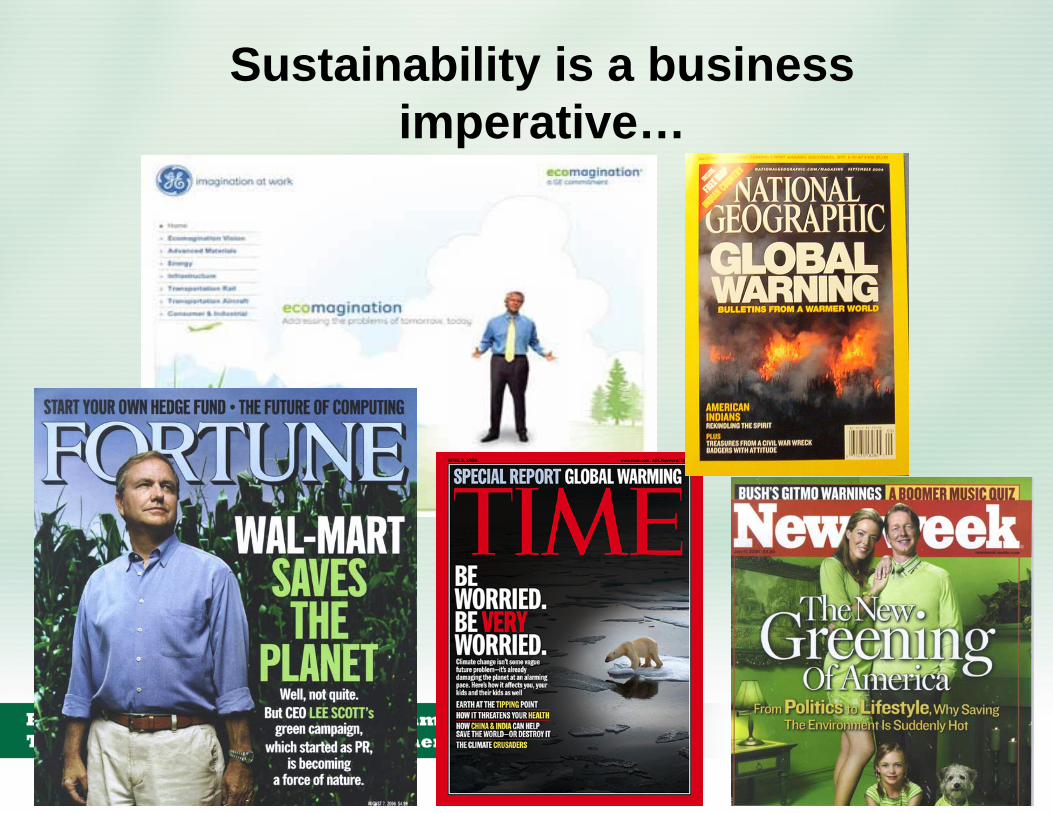
Sustainability is a business imperative…
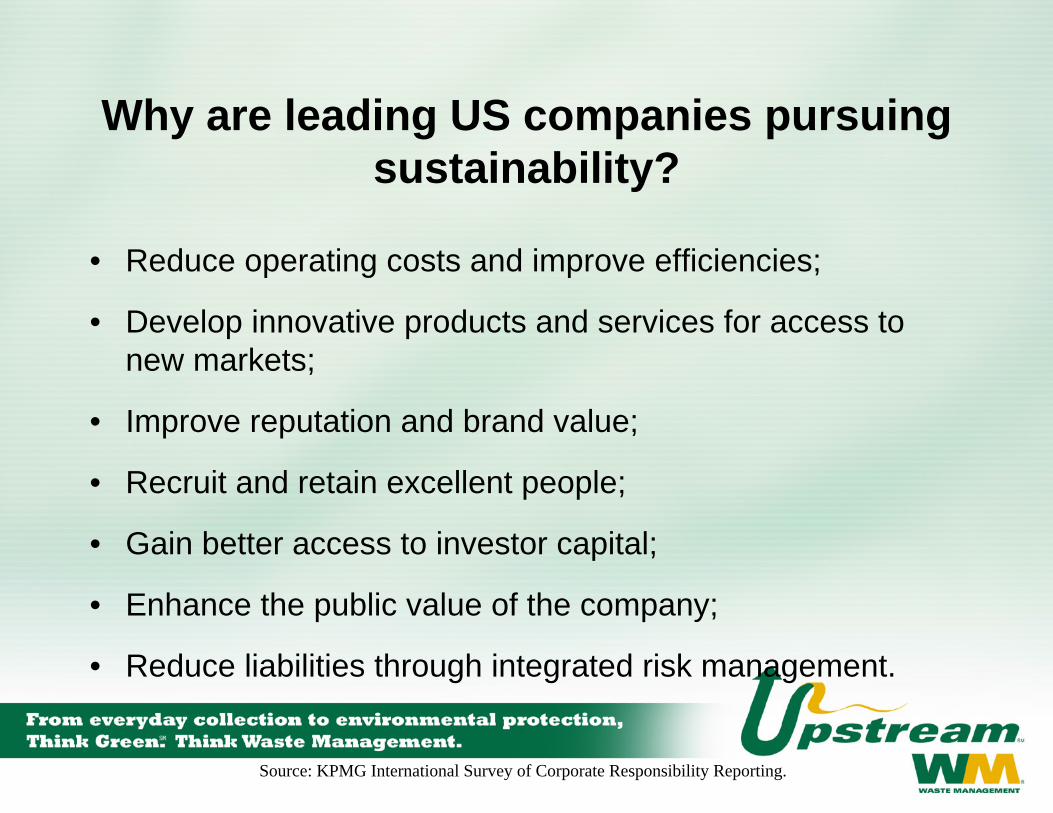
Why are leading US companies pursuing sustainability?
• Reduce operating costs and improve efficiencies;
• Develop innovative products and services for access to new markets;
• Improve reputation and brand value;
• Recruit and retain excellent people;
• Gain better access to investor capital;
• Enhance the public value of the company;
• Reduce liabilities through integrated risk management.
Source: KPMG International Survey of Corporate Responsibility Reporting.

Business Trends Affecting Waste …
• Zero Waste
• Extended product responsibility
• Closed loop recycling – cradle to cradle
• Carbon reduction
• LEEDs certification
• Resource management
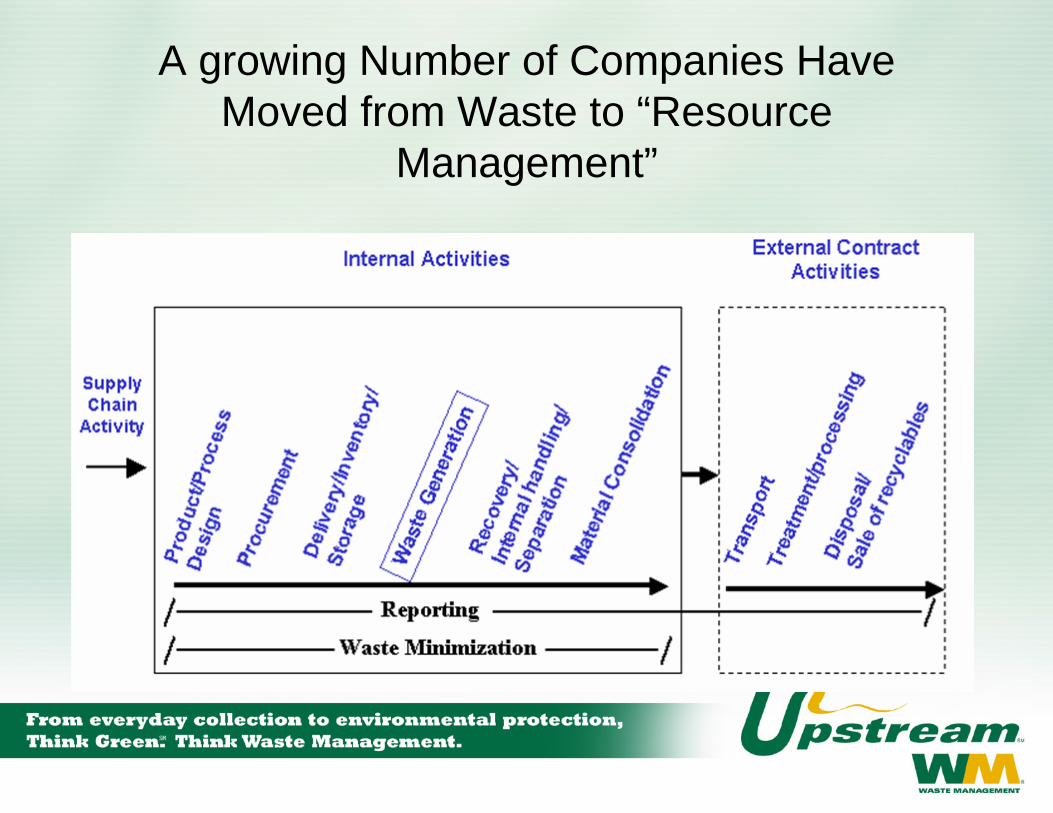
A growing Number of Companies Have Moved from Waste to “Resource
Management”

WM Upstream Overview
Upstream providesresource management services to leading businesses that maximize
economic, environmental, and regulatory efficiency.
Environmental Engineers / Project Managers / EH&S Staff / Business
Development / Finance
AutomotiveChemical
Cruise LinesFood and Beverage
MallsPharmaceutical/R&D
RefiningMetalsEnergy
280 + Employees
Market Leader~135 Sites
Cutting EdgeServices
• Managed solutions • ISO 14001
• World Class Safety • Best practice• Continuous
improvements • Access to the largest enviro
network in the US
Customized Services
Fully integrated offering that revolves around customer needs.

WM-Upstream Capabilities Help Businesses Achieve Sustainability Goals
FinancialStability
EnvironmentalManagement
Systems
EnvironmentalAssets
CustomizedServices &Expertise
Indemnification
IT =Web Ordering,
Tracking &Metrics
Strategic Sourcing
Logistics
SustainabilityStrategy
ManagedSolutions
CustomizedPrograms
Achievement ofGreen Goals
Total CostReduction
Long TermValue
UpstreamCapabilities

Waste Flow from Industry Value Chains
• Service providers: internal staff; brokers; consultants; logistics; maintenance and janitorial contractors; industrial cleaning, T&D companies
• Fragmented offering – many players, duplicative processes and procedures, high transaction costs
R&D,Purchasing,
SG&AInbound Logistics
ProductFormulation/Production
OutboundLogistics
WholesaleDistribution
RetailChannels
IT, Reporting, Internal Material Handling, Storage, Training, Transport/Logistics, Compliance
Waste
Environmental Assets: T&D, Recycle, Composting, Incineration, Treatment, etc
Waste Waste Waste
Waste
Waste

Aligned Incentives Drive Resource Management Success
Commodity Offer: Conflicting Incentives
UPSTREAM
Service:Disposal
Fee Driver:Volume
Wants serviceincrease
CUSTOMER
Wants servicedecrease
Resource Management: Aligned Incentives
Wants serviceincrease
Wants serviceincrease
SERVICEPROVIDER
CUSTOMER
Service:Resource Mgmt
Fee Driver:Value
Based on: Ligon and Votta, Tellus Institute. From Waste to Resource Management, 2003.
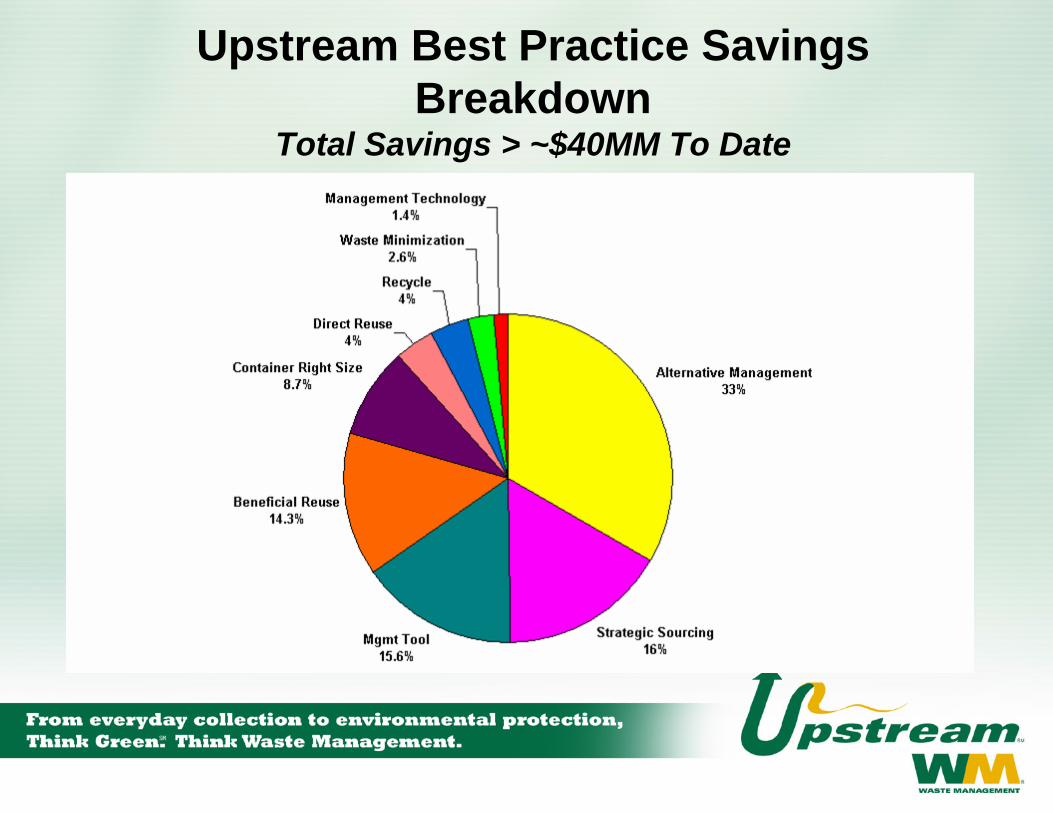
Upstream Best Practice Savings Breakdown
Total Savings > ~$40MM To Date
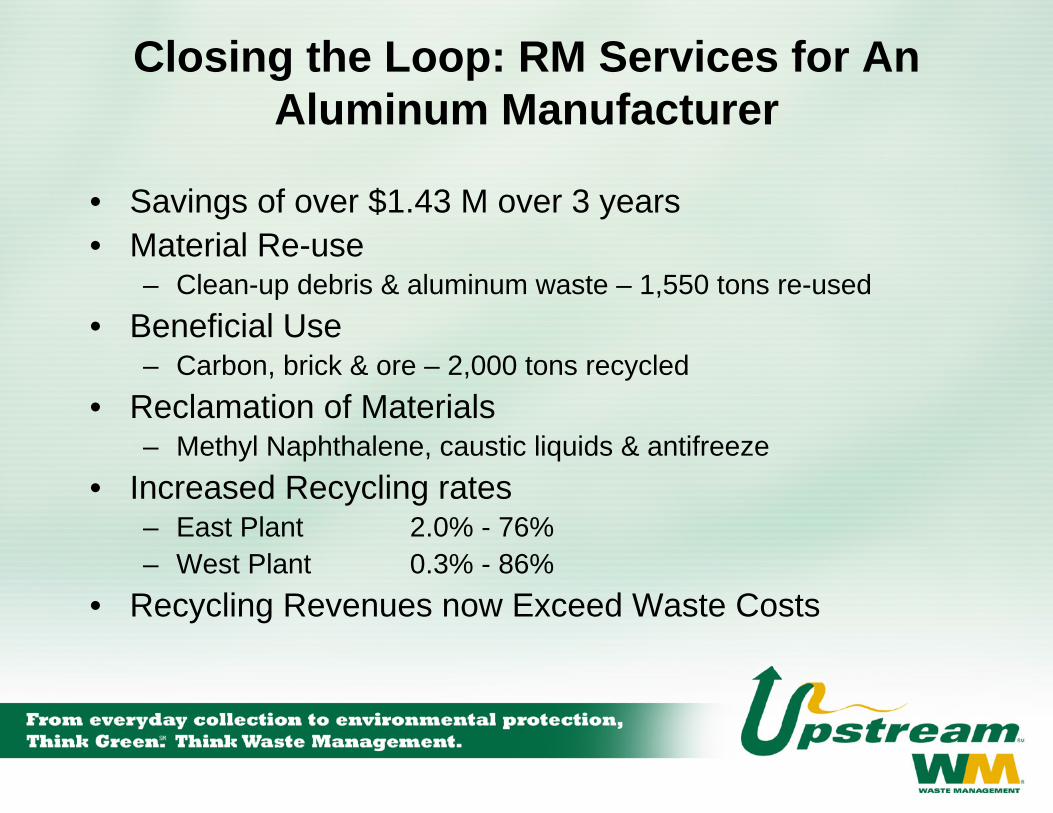
Closing the Loop: RM Services for An Aluminum Manufacturer
• Savings of over $1.43 M over 3 years• Material Re-use
– Clean-up debris & aluminum waste – 1,550 tons re-used• Beneficial Use
– Carbon, brick & ore – 2,000 tons recycled• Reclamation of Materials
– Methyl Naphthalene, caustic liquids & antifreeze• Increased Recycling rates
– East Plant 2.0% - 76%– West Plant 0.3% - 86%
• Recycling Revenues now Exceed Waste Costs
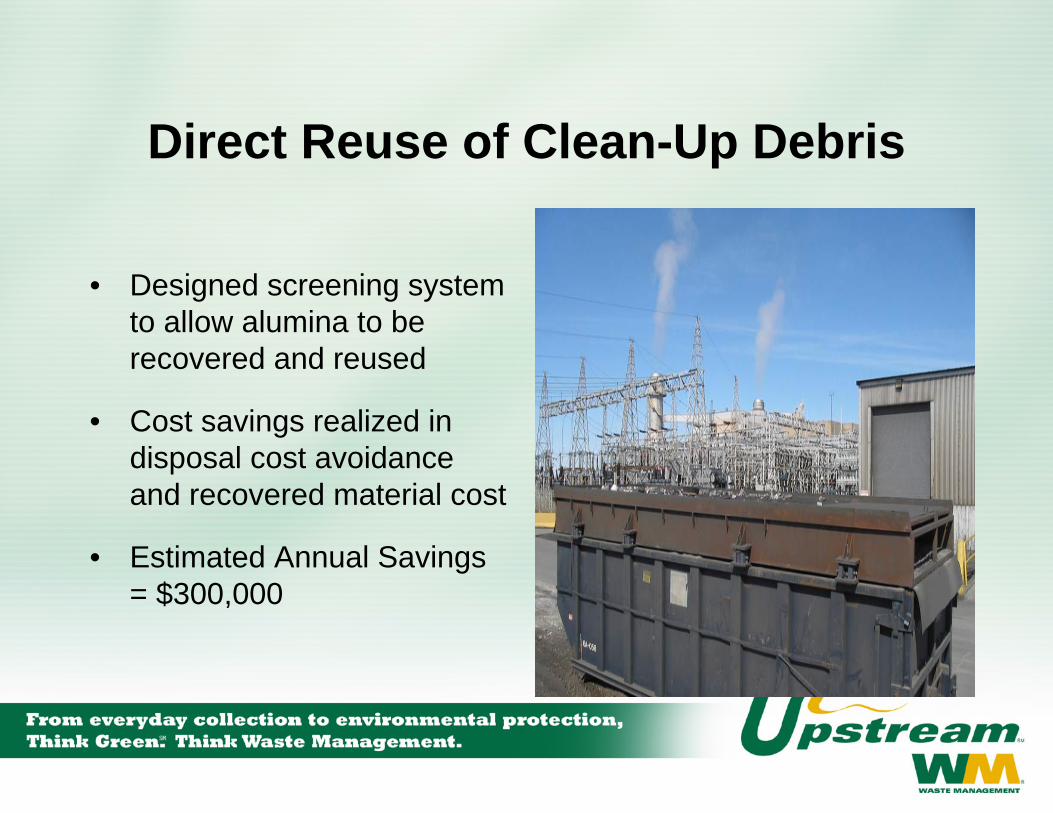
Direct Reuse of Clean-Up Debris
• Designed screening system to allow alumina to be recovered and reused
• Cost savings realized in disposal cost avoidance and recovered material cost
• Estimated Annual Savings = $300,000
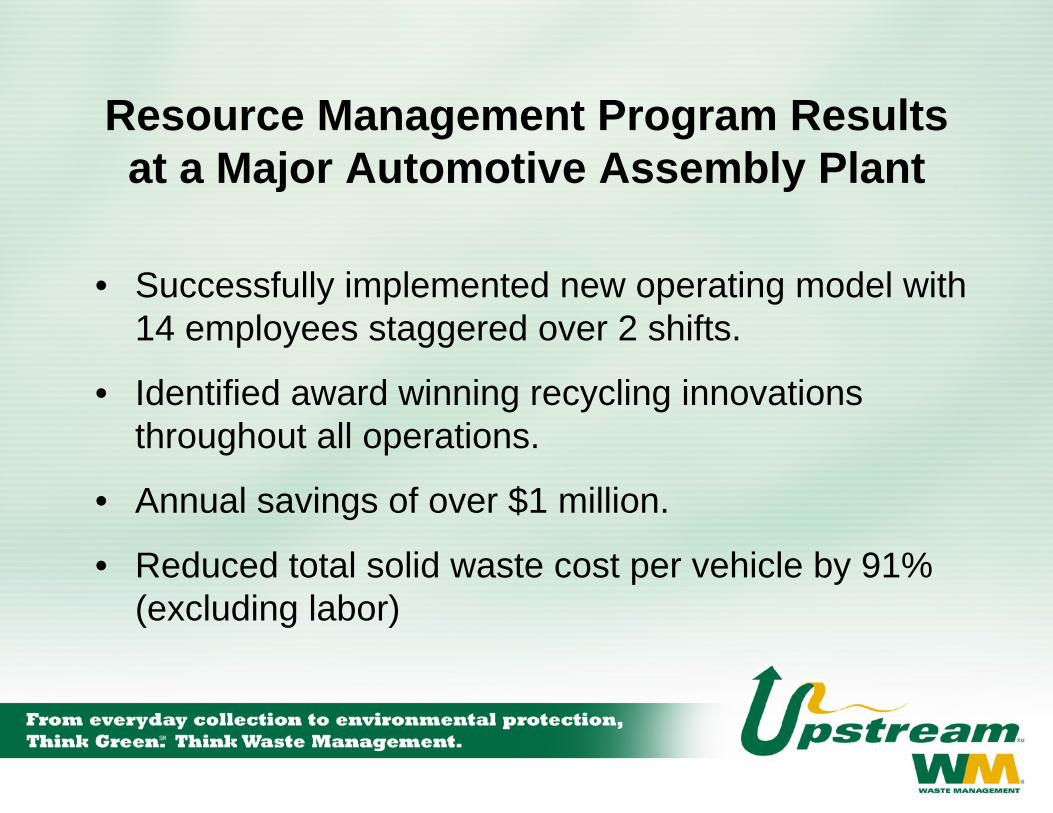
Resource Management Program Results at a Major Automotive Assembly Plant
• Successfully implemented new operating model with 14 employees staggered over 2 shifts.
• Identified award winning recycling innovations throughout all operations.
• Annual savings of over $1 million.
• Reduced total solid waste cost per vehicle by 91% (excluding labor)
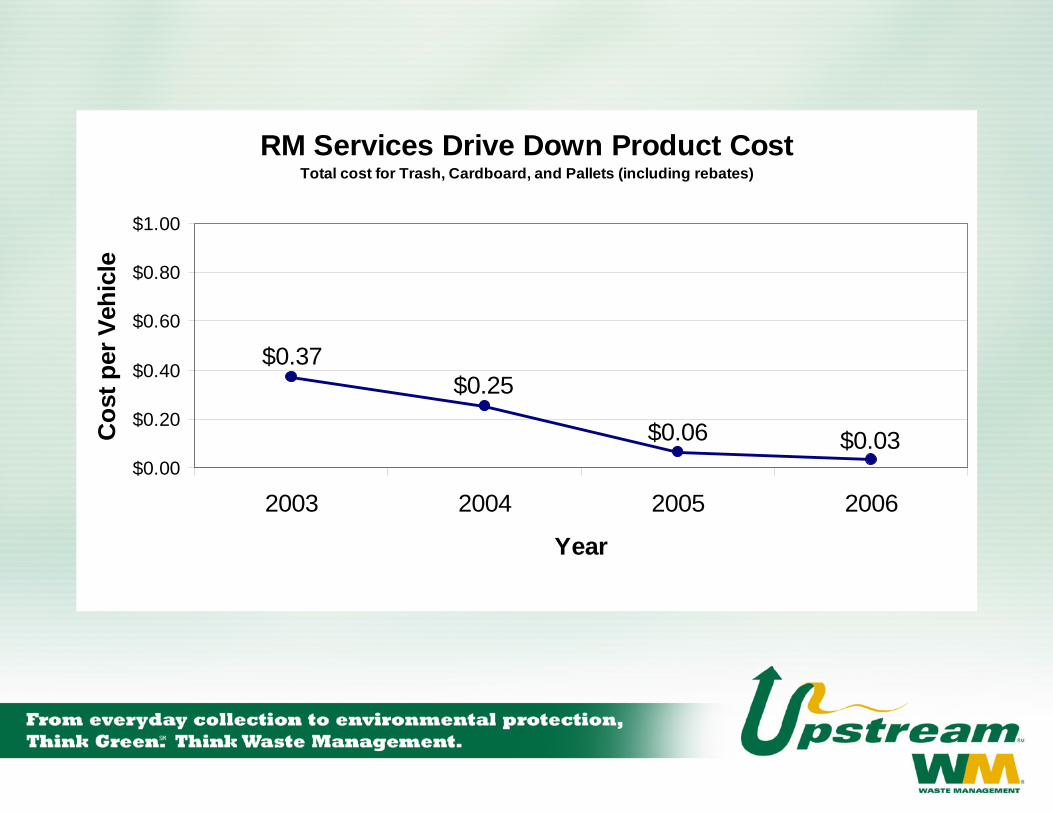
RM Services Drive Down Product Cost Total cost for Trash, Cardboard, and Pallets (including rebates)
$0.37$0.25
$0.06 $0.03$0.00
$0.20
$0.40
$0.60
$0.80
$1.00
2003 2004 2005 2006
Year
Cos
t per
Veh
icle
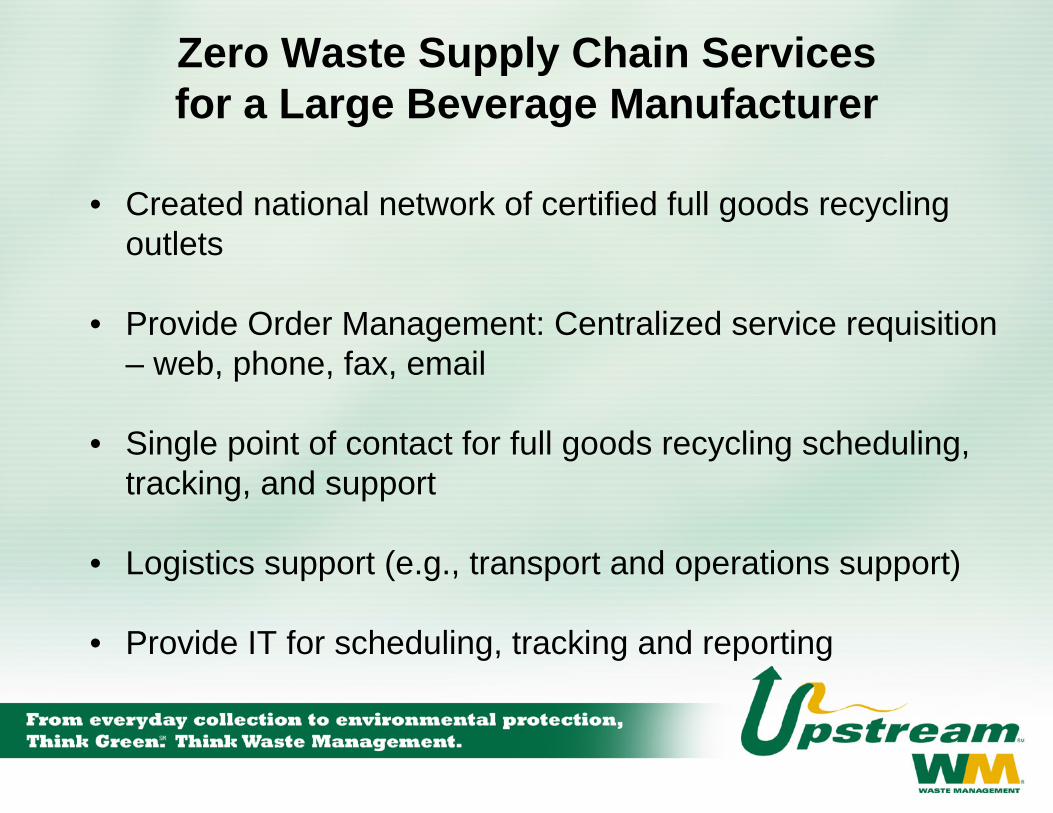
Zero Waste Supply Chain Services for a Large Beverage Manufacturer
• Created national network of certified full goods recycling outlets
• Provide Order Management: Centralized service requisition – web, phone, fax, email
• Single point of contact for full goods recycling scheduling, tracking, and support
• Logistics support (e.g., transport and operations support)
• Provide IT for scheduling, tracking and reporting
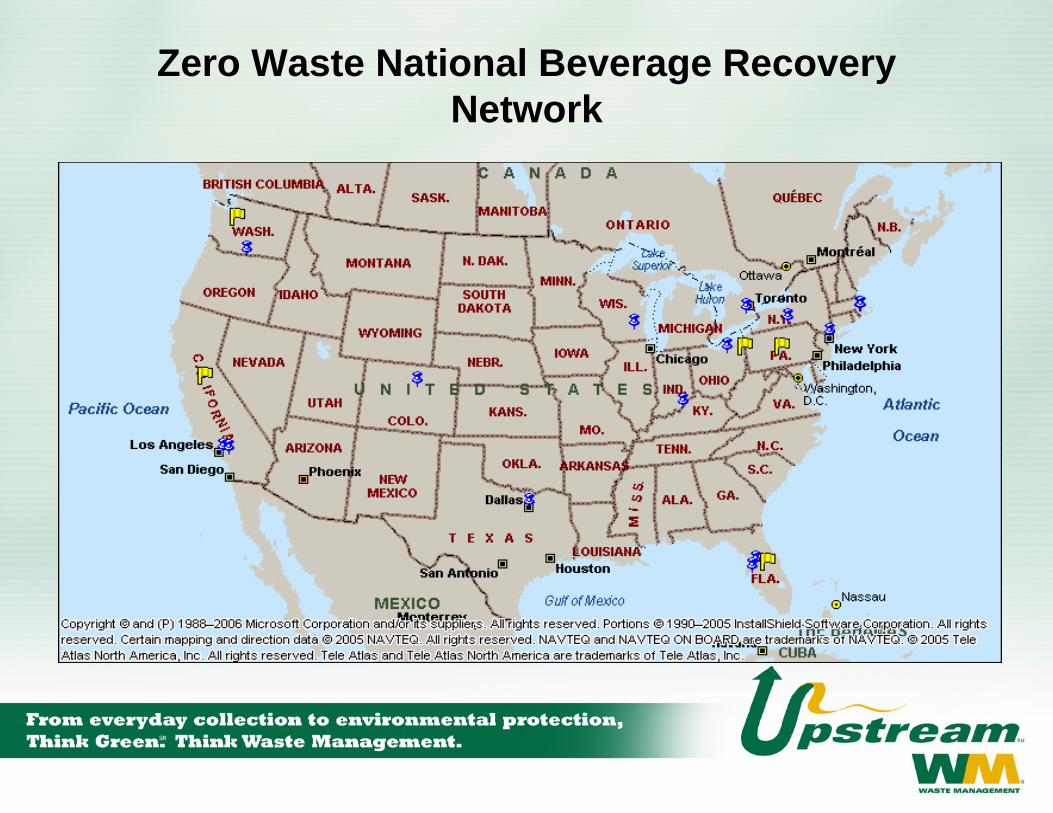
Zero Waste National Beverage Recovery Network

Zero Waste Supply Chain Results
• Cost-effective recovery of all off-spec product– Includes liquid and packaging recycling
• Enhanced management and logistics control– Reduces tracking and transactions costs– Reduced product liability
• Enhanced value and reduced cost of service– 10% savings ’07 vs ’06
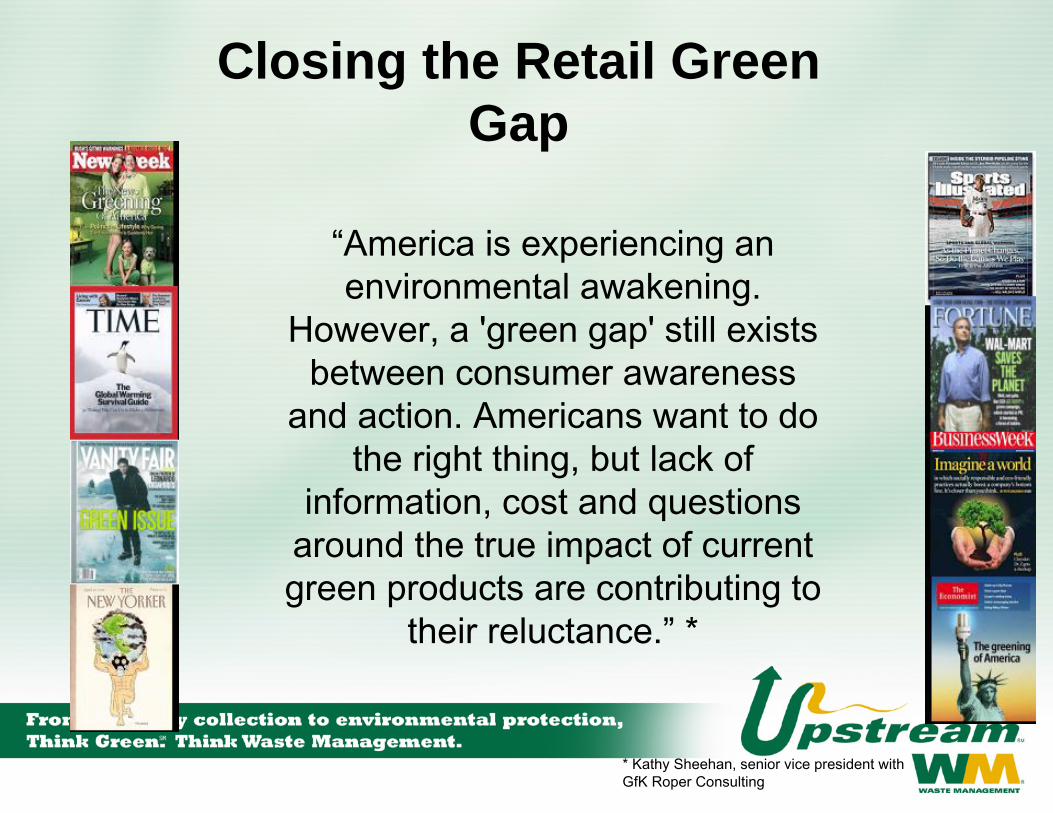
Closing the Retail Green Gap
“America is experiencing an environmental awakening.
However, a 'green gap' still exists between consumer awareness
and action. Americans want to do the right thing, but lack of
information, cost and questions around the true impact of current green products are contributing to
their reluctance.” *
* Kathy Sheehan, senior vice president with GfK Roper Consulting

Green SquadSM
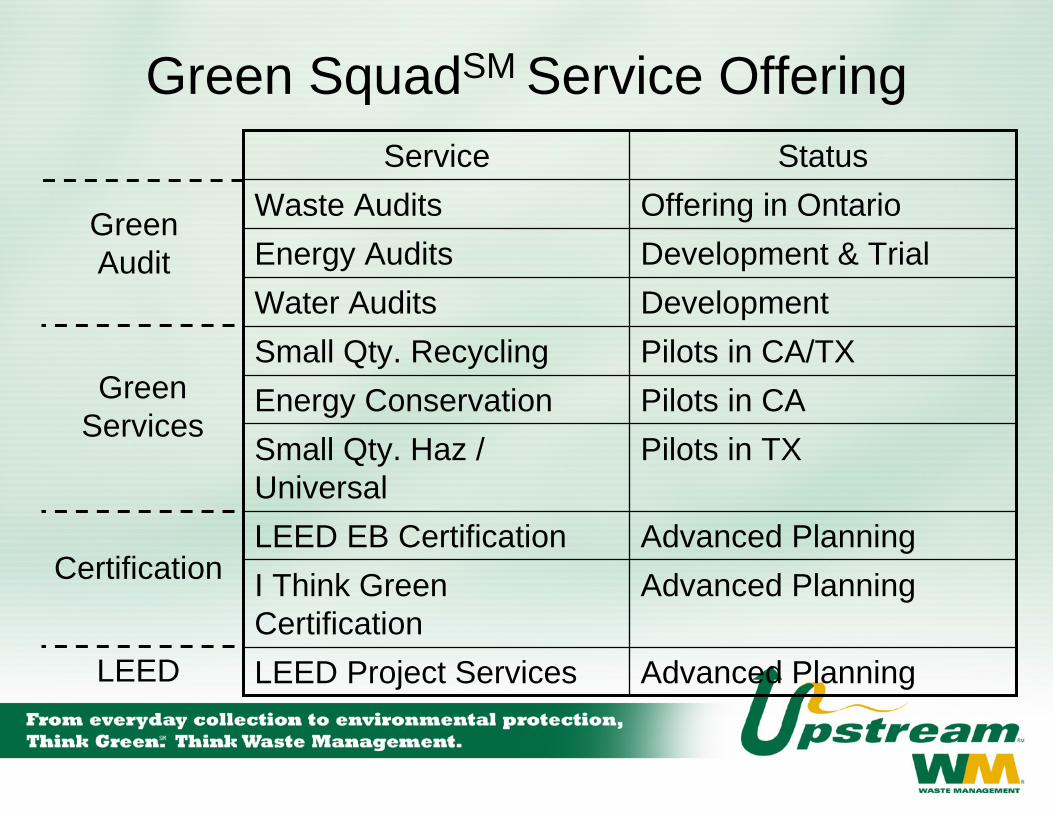
Green SquadSM Service OfferingService Status
Waste Audits Offering in OntarioEnergy Audits Development & TrialWater Audits DevelopmentSmall Qty. Recycling Pilots in CA/TXEnergy Conservation Pilots in CASmall Qty. Haz / Universal
Pilots in TX
LEED EB Certification Advanced PlanningI Think Green Certification
Advanced Planning
LEED Project Services Advanced Planning
Green Audit
8-07
Green Services
Certification
LEED
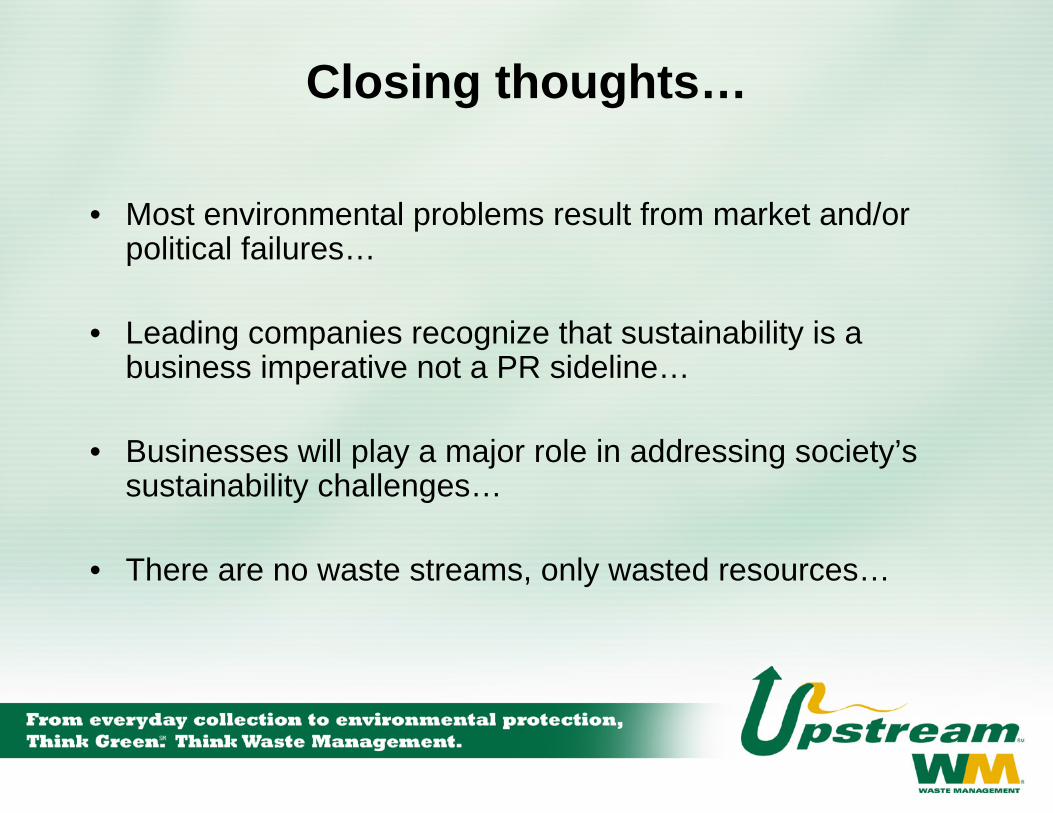
Closing thoughts…
• Most environmental problems result from market and/or political failures…
• Leading companies recognize that sustainability is a business imperative not a PR sideline…
• Businesses will play a major role in addressing society’s sustainability challenges…
• There are no waste streams, only wasted resources…
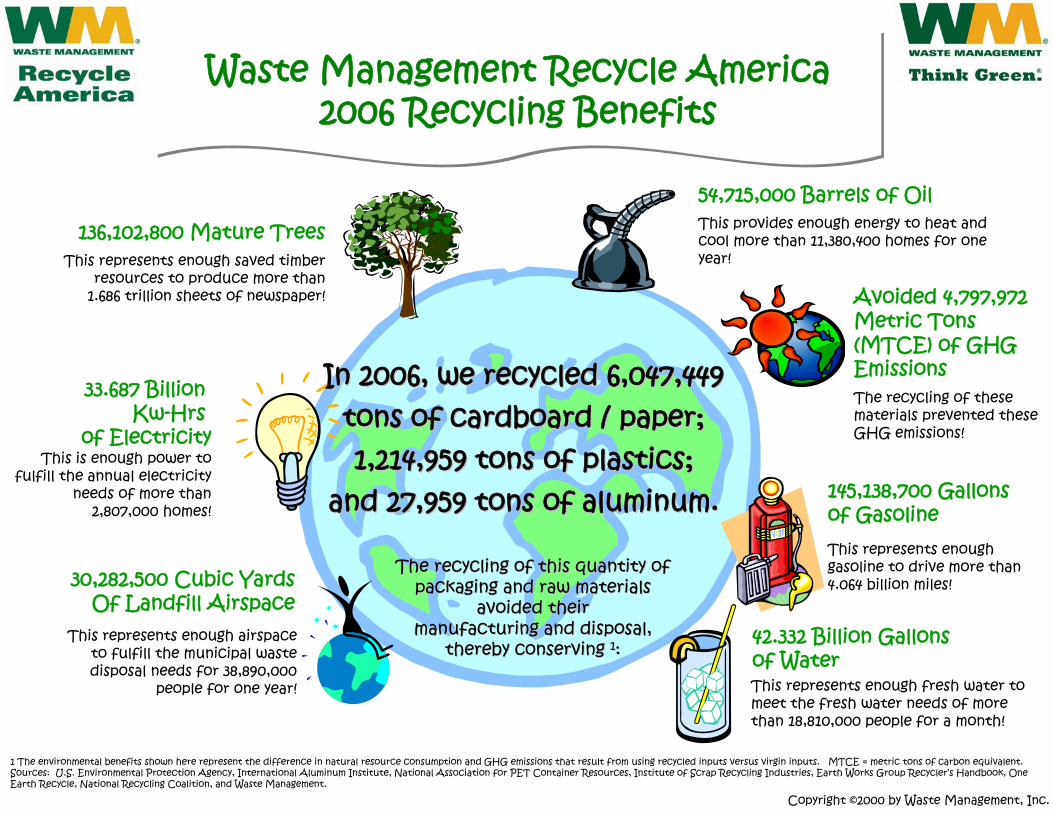
In 2006, we recycled 6,047,449In 2006, we recycled 6,047,449tons of cardboard / paper;tons of cardboard / paper;1,214,959 tons of plastics;1,214,959 tons of plastics;
and 27,959 tons of aluminum.and 27,959 tons of aluminum.
The recycling of this quantity of The recycling of this quantity of packaging and raw materials packaging and raw materials
avoided theiravoided theirmanufacturing and disposal, manufacturing and disposal,
thereby conserving thereby conserving 11::
136,102,800 Mature TreesThis represents enough saved timber
resources to produce more than1.686 trillion sheets of newspaper!
54,715,000 Barrels of OilThis provides enough energy to heat and cool more than 11,380,400 homes for one year!
33.687 Billion Kw-Hrs
of ElectricityThis is enough power to
fulfill the annual electricity needs of more than
2,807,000 homes!
30,282,500 Cubic YardsOf Landfill Airspace
This represents enough airspace to fulfill the municipal waste disposal needs for 38,890,000
people for one year!
42.332 Billion Gallonsof WaterThis represents enough fresh water to meet the fresh water needs of more than 18,810,000 people for a month!
1 The environmental benefits shown here represent the difference in natural resource consumption and GHG emissions that result from using recycled inputs versus virgin inputs. MTCE = metric tons of carbon equivalent. Sources: U.S. Environmental Protection Agency, International Aluminum Institute, National Association for PET Container Resources, Institute of Scrap Recycling Industries, Earth Works Group Recycler’s Handbook, One Earth Recycle, National Recycling Coalition, and Waste Management.
Copyright ©2000 by Waste Management, Inc.
145,138,700 Gallonsof GasolineThis represents enough gasoline to drive more than 4.064 billion miles!
Avoided 4,797,972Metric Tons(MTCE) of GHGEmissionsThe recycling of these materials prevented these GHG emissions!
Waste Management Recycle America2006 Recycling Benefits
Waste Management Recycle America2006 Recycling Benefits
For Additional Info…
• Paul Ligon– T: 281-914-7402– E: [email protected]
• www.wmupstream.com– Links and related references– Case studies
Thanks for your time!