solid waste management and hydro geochemistry of limestone
TRANSCRIPT

Solid Waste Management and Hydro
geochemistry of Limestone Quarries in and
around Yerraguntla Town, Y.S.R District, A.P
B. Suvarna V. Sunitha, Y. Sudharshan Reddy*, Y. Sai Sudha
Department of Geology, Yogi Vemana University, Kadapa
Corresponding author: [email protected]
ABSTRACT
In view of associated environmental problems and their impacts on public health and safety,
efforts must be made to minimize waste generation; systematic disposal practices must be
followed. This study aims at a better understanding of spatial and temporal changes of unplanned
dumping sites from 2006 to 2018 through application of Google images in assessing the temporal
changes of solid waste at limestone quarries in and around Yerraguntla village, YSR district,
A.P. Results revealed that the solid waste management in the study area is very poor which need
to be properly monitored so as to mitigate the present and future environmental threats. The
waste generated during the quarrying operations is mainly in the form of rock fragments.
Specifications for the judicious application of calcareous stone were discussed. In this paper an
attempt has been made to observe the impact of limestone waste on the ground water quality in
the vicinity of quarries. The quality of water is also compared to the WHO drinking water
standard to observe the difference in the prescribed values. Overall drinking water quality in this
area is not suitable for drinking purpose and requires some proper measurements in water quality
management.
Key Words: Solid waste management, Hydrogeochemistry, Limestone quarries, Yerraguntla,
Kadapa Y.S.R district, A.P
The International journal of analytical and experimental modal analysis
Volume XII, Issue VII, July/2020
ISSN NO:0886-9367
Page No485
INTRODUCTION
Waste is defined as the discarded and discharged material during every stage of human life that
causes impact on human health and the environment [1]. Solid waste is now become a global
problem in developing and also developed countries. It is estimated that well over 170
million tonnes of solid wastes related to generated in India every year. This is expected to
increase substantially with the increase in the production of various minerals and may
exceed 300 million tonnes of waste per year. This figure of course, relates to the mining
of metal and industrial minerals only. Besides this, the mining of coal and certain other
decorative rocks like granite, marble, etc. are also expected to produce large amount of solid
wastes. A new factor namely, solid waste management has made its presence in the
Indian mineral Industry. Further, change in the national mineral policy is expected to
bring about large investments in high value minerals like gold, base metals, diamonds, etc.
These high value minerals will mostly be mined in large open cast mines producing
additionally several million tonnes of mining wastes annually [2].
India is a diverse country endowed with potentially rich mineral resources.
According to the Indian [3], India produces around 90 minerals. Of these, 4 are fuel minerals, 11
metallic minerals, 52 non-metallic and 23 minor minerals (building and other materials). This
indicates that the mining industry in India is a very important industry essential for the
economic development of the country. Limestone is a nonmetallic mineral and is a raw
ingredient required for the manufacturing of cement, an important construction material. The
total estimated resources of limestone of all categories and grades in India are 184,935 million
tonnes. Of this, 14,926 million tonnes (8%) are under reserves category and 170,009 million
tonnes (92%) are under remaining resources category. The state of Karnataka alone accounts for
about 28% of the total limestone resources in India followed by Andhra Pradesh (20%),
Rajasthan (12%), Gujarat (11%), Meghalaya (9%), Chattisgarh (5%) and remaining 15% by
other states. However in terms of production, the state with maximum production is Andhra
Pradesh accounting about 21% of the total cement production, followed by Rajasthan (20%),
Madhya Pradesh (13%), Tamil Nadu (9%), Gujarat, Karnataka and Chhattisgarh (8% each),
Himachal Pradesh and Maharashtra (4%each) and the remaining 5% is contributed by Odisha
Meghalaya, Uttar Pradesh, Jharkhand, Kerala, Bihar, Assam and Jammu & Kashmir. In India,
cement industry alone consumed about 76% of the limestone produced, whereas 16% is used by
iron and steel industry, 4% by chemical industries and remaining 4% is used in sugar, paper,
fertilizer and ferromanganese industries. India is the second largest cement producing country in
the world after China.
The International journal of analytical and experimental modal analysis
Volume XII, Issue VII, July/2020
ISSN NO:0886-9367
Page No486
There were 178 large cement plants having an installed capacity of 318.94 million
tonnes in 2012-13 in addition to mini and white cement plants having estimated capacity of
around 6 million tonnes per annum (Indian Minerals Yearbook).At present waste management
became a unavoidable challenge in a regional, national level and global level. Mining is one of
the major incoming source for the developing countries like India, at the same time it’s the major
source of huge amounts of Solid waste generation in terms of overburden, milling, processing
and tail end wastes which need to be monitored and maintain proper mine plan and
environmental policy particularly in opencast mining areas. The unplanned mining became a
cause’s depletion of forest cover, land scape, soil erosion, and contamination of air, water, land
and reduction in biodiversity [4]. Depending on the extent and geographical location mining
activity causes adverse impact on surrounding environment in view of human settlements, air
quality, water body’s agriculture and forest land. In India limestone mines are operated opencast
mining method [3].Opencast mining activity is an intensive processes causes huge impact on the
environment unless it is properly planned. Mine wastes can cause release of toxic metals damage
to heritage, air water and soil pollution, release of sulphide minerals and acid drainage.
Comparatively, Opencast mining activity causes some adverse impacts on the surrounding
environment, unless proper environmental management plan is adopted. Mine wastes require
careful management to ensure the long-term stability of storage and disposal facilities, and to
prevent and minimize air, water, and soil contamination. The inappropriate or unsafe
management of wastes at mining operations continues to generate opposition from local
communities, the general public, and non-government organizations, and has contributed to the
negative public perception of the mining industry. The unplanned mining became a cause’s
depletion of forest cover, land scape, soil erosion, contamination of air, water, land and reduction
in biodiversity [5].
Groundwater is a vital natural resource and is used for domestic, industrial water
supply and irrigation. Word’s supply of groundwater is rapidly decreasing in Asia & North
America[6]. Groundwater quality deterioration and supply of safe drinking water is a major
health concern throughout the world. India has acute public health problems due to contaminated
water resources. Water scarcity is certainly one of the major challenges in urban areas especially
in arid and semi-arid regions of the world. According to UNICEF and WHO reports 748 million
people do not have adequate and safe water resource and over 2.5 billion people have access to
meager water supply [7]. Groundwater is a vital resource to play a crucial role in both hydrologic
and human systems. In the world, less than 1% of the water is available for human consumption
and more greater than 1.2 billion of the people still had no accessibility for safe drinking water.
As we know water had a high dissolving capacity and also it is a universal solvent to dissolved
minerals in the rocks when it comes in contact [8, 9]. Groundwater constitutes nearly 80% for
domestic purposes, around 45% of total agricultural water for irrigating to utilized in India
(Kumar et al., 2005; Sunitha et al., 2019), and it contributes 45% gross of the national product of
the majority of people (Singh, 1983). Excess amount of physico-chemical components, cause a
certain ecological and physical problems to human beings [10]. In India especially in Andhra
The International journal of analytical and experimental modal analysis
Volume XII, Issue VII, July/2020
ISSN NO:0886-9367
Page No487

Pradesh, various studies have been carried out on evaluation groundwater quality for drinking
and irrigation purpose, such as [11-14]. Groundwater quality has been assessed by various
researchers in many parts of the world and various parts of India and found that groundwater of
irrigated areas have higher ionic concentration as compared to non-irrigated areas in hard rock
terrain of central India. In view of present scanning the study focused on solid Waste
management and hydro geochemistry of Limestone quarries in and around Yerraguntla Town,
Y.S.R. District Kadapa. The main objectives of the present study are to identify Limestone
Quarries surrounding Yerraguntla town and to demarcate the Lime stone waste in the study area
using Google earth; deciphering groundwater quality in and around limestone quarries nearby
Yerraguntla town.
STUDY AREA
Yerraguntla is a leading Industrial town in Kadapa district of the Indian state
of Andhra Pradesh. It is located in Yerraguntla mandal of Kadapa revenue division. The
Leading Industrial town is home to many cement factories and Rayalaseema Thermal
Power Plant. Niduzivi, Koduru, Valasapalli areas of Yerraguntla Mandal are known for Napa
slabs/Kadapa slabs are black coloured limestone belonging to Koilakuntla Limestones [15-16].
Geographically Yerraguntla is located at 14°39ˈ0ˈˈN 78°28ˈ30ˈˈE with average elevation of 152
meters (501 feet). The study area falls in Survey of India toposheet no: 57 J/6 and J/10. Study
area & Sample locations are shown in Figure. 1&3
Fig. 1 showing the Study Area of the Yerraguntla mandal
The International journal of analytical and experimental modal analysis
Volume XII, Issue VII, July/2020
ISSN NO:0886-9367
Page No488

The study area in question forms a part of the well-known crescent shaped Cuddapah Basin with
middle Proterozoic sediments and igneous intrusives and flows. The Cuddapah Supergroup
comprising mainly arenaceous and argillaceous sediments with sub-ordinate calcareous facies is
overlain unconformably by the kurnool Group with essentially calcareous rocks. The latter is
present in three sub-basins viz. the northernmost Palnad, northern Srisailam and middle Kurnool
sub-basin. The present study area is in the Kurnool sub-basin and its lithostratigraphy is as
follows:
Fig. 2 Geology map of the study area
MATERIALS AND METHODS
A systematic integrated methodology adopted for the present study to assess the solid waste
disposal. The intensive study of relevant literature, periodicals etc. has been carried out, based on
the review of literature it is clear that remote sensing is the only effective tool to monitor the
changes for multi date scenarios. Thus Google earth satellite images were chosen as the data
source for the study area and the time series changes have been mapped for the years 2006 and
2018. Further detailed field work carried out in the areas of waste disposal sites, mines, tailings,
The International journal of analytical and experimental modal analysis
Volume XII, Issue VII, July/2020
ISSN NO:0886-9367
Page No489
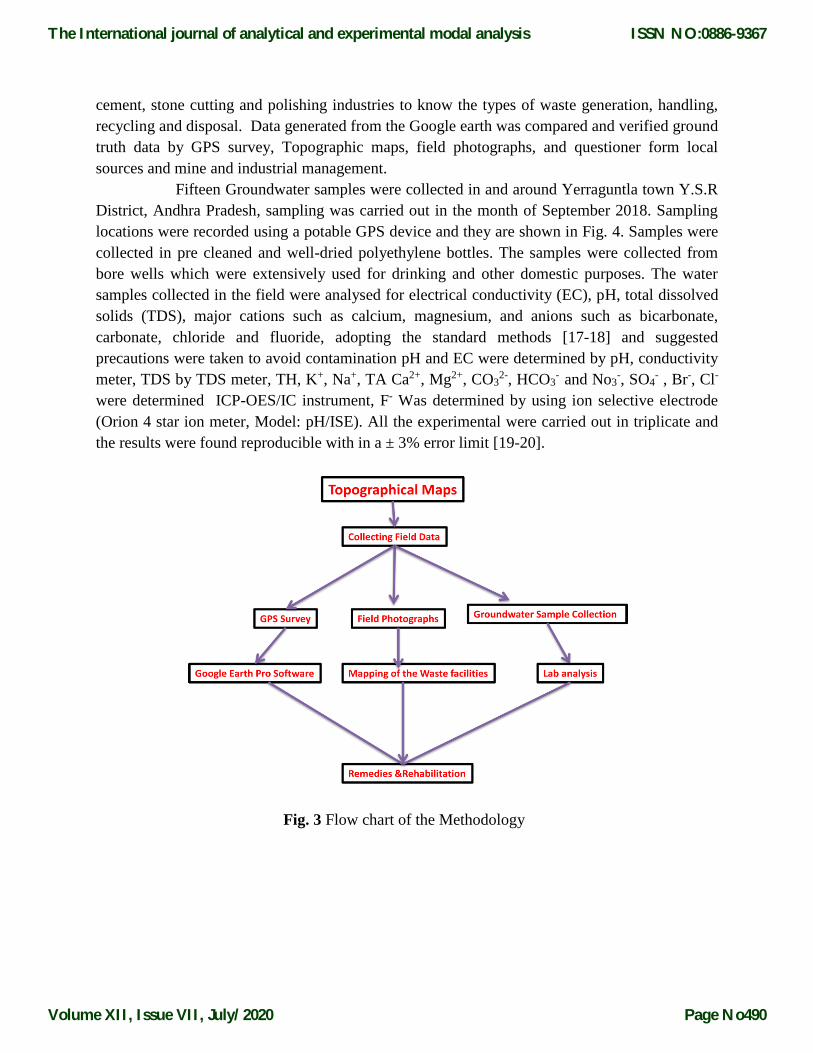
cement, stone cutting and polishing industries to know the types of waste generation, handling,
recycling and disposal. Data generated from the Google earth was compared and verified ground
truth data by GPS survey, Topographic maps, field photographs, and questioner form local
sources and mine and industrial management.
Fifteen Groundwater samples were collected in and around Yerraguntla town Y.S.R
District, Andhra Pradesh, sampling was carried out in the month of September 2018. Sampling
locations were recorded using a potable GPS device and they are shown in Fig. 4. Samples were
collected in pre cleaned and well-dried polyethylene bottles. The samples were collected from
bore wells which were extensively used for drinking and other domestic purposes. The water
samples collected in the field were analysed for electrical conductivity (EC), pH, total dissolved
solids (TDS), major cations such as calcium, magnesium, and anions such as bicarbonate,
carbonate, chloride and fluoride, adopting the standard methods [17-18] and suggested
precautions were taken to avoid contamination pH and EC were determined by pH, conductivity
meter, TDS by TDS meter, TH, K+, Na+, TA Ca2+, Mg2+, CO32-, HCO3
- and No3-, SO4
- , Br-, Cl-
were determined ICP-OES/IC instrument, F- Was determined by using ion selective electrode
(Orion 4 star ion meter, Model: pH/ISE). All the experimental were carried out in triplicate and
the results were found reproducible with in a ± 3% error limit [19-20].
Fig. 3 Flow chart of the Methodology
The International journal of analytical and experimental modal analysis
Volume XII, Issue VII, July/2020
ISSN NO:0886-9367
Page No490
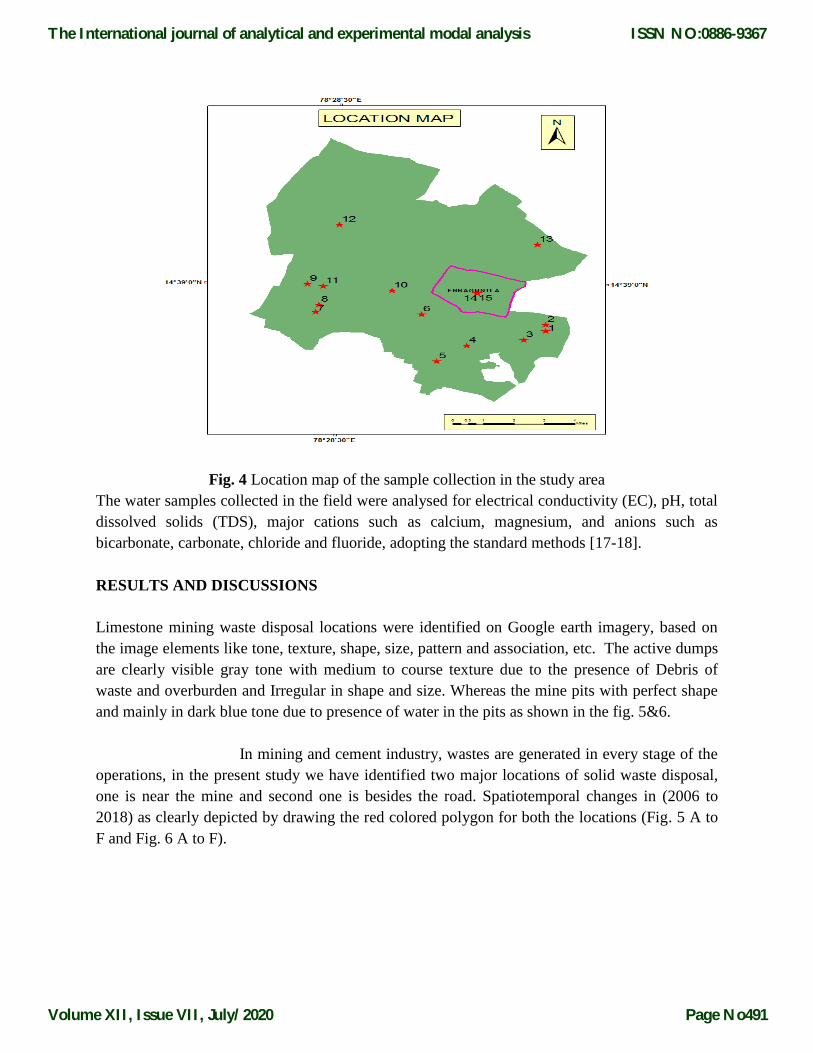
Fig. 4 Location map of the sample collection in the study area
The water samples collected in the field were analysed for electrical conductivity (EC), pH, total
dissolved solids (TDS), major cations such as calcium, magnesium, and anions such as
bicarbonate, carbonate, chloride and fluoride, adopting the standard methods [17-18].
RESULTS AND DISCUSSIONS
Limestone mining waste disposal locations were identified on Google earth imagery, based on
the image elements like tone, texture, shape, size, pattern and association, etc. The active dumps
are clearly visible gray tone with medium to course texture due to the presence of Debris of
waste and overburden and Irregular in shape and size. Whereas the mine pits with perfect shape
and mainly in dark blue tone due to presence of water in the pits as shown in the fig. 5&6.
In mining and cement industry, wastes are generated in every stage of the
operations, in the present study we have identified two major locations of solid waste disposal,
one is near the mine and second one is besides the road. Spatiotemporal changes in (2006 to
2018) as clearly depicted by drawing the red colored polygon for both the locations (Fig. 5 A to
F and Fig. 6 A to F).
The International journal of analytical and experimental modal analysis
Volume XII, Issue VII, July/2020
ISSN NO:0886-9367
Page No491

Fig. 5 Temporal and Spatial Formation and Changes during 2006 - 2018 in location of solid
waste beside railway track surrounding Yerraguntla village.
The International journal of analytical and experimental modal analysis
Volume XII, Issue VII, July/2020
ISSN NO:0886-9367
Page No492

Fig. 6 Temporal and Spatial Formation and Changes of solid waste during 2006 - 2018 beside
highway road near India cement factory surrounding Yerraguntla village.
The International journal of analytical and experimental modal analysis
Volume XII, Issue VII, July/2020
ISSN NO:0886-9367
Page No493

By observing the Google earth temporal images as shown on the figures 5&6 and the filed
observations as shown in the figures 7A to 7F. It is clear that overburden management and solid
waste of these quarries are extremely poor; most of the mining companies are poor in practices
on overburden management and fugitive dust from waste pile. They do not bother to take
preventive measures against the limestone waste management. The best method is to backfill the
excavated land and this is hardly implemental as companies keep opening from time to time
different faces of mine open began without exhausting previous one. The open cast mines are
characterized by enormous open pits surrounded by huge dump yards surrounded by the
croplands. Dust and slurry figure 7B and 7C; from these sites is being transported by the air and
rainwater to nearby croplands ponds which is major threat to soil porosity, productivity,
permeability and crop yield. During dry summer, these dumps become a key source of air
pollution for the surrounding areas [21].
Fig. 7 Showing Limestone wastes dump around yerraguntla town, yerraguntla mandal, Kadapa
District.
The International journal of analytical and experimental modal analysis
Volume XII, Issue VII, July/2020
ISSN NO:0886-9367
Page No494

Environmental damage due to Quarrying & Trimming Waste
The Cutting waste produced during trimming of edges of the slabs, broken pieces, unsalable
blocks, irregular and odd shaped blocks are lying scattered here and there in the mine area as
well as in processing units. The quarrying waste is just piled in the forest area by the miners,
creating huge mounds of stone waste, thereby destroying the natural vegetation and ecology of
the area. The quarrying waste is even being dumped on seasonal river beds, thereby threatening
the porosity of the aquifer zones. Quantum of Marble Waste Generated
Dump Rehabilitation
Establishing a vegetative cover is the best long term strategy for stabilization and erosion
control. To begin this process the top soil should be replaced to a similar depth as that
removed from the site originally i.e. 200-300mm. If topsoil is in short supply it may
be necessary to place the topsoil in strips. This at least provides areas of improved
surfaces for regeneration. To increase the success of vegetation establishment, rehabilitation
techniques should aim to increase rainfall infiltration. The term used for this approach
is “water harvesting” and many specific techniques have been developed for various
applications. The most basic of these techniques is to leave the surface of the
dump as rough as possible by deep ripping along the contour after the top soil has
been spread. The roughness and ripping allows for water penetration and provides places
for seeds to lodge. Replacing Pre-stripped vegetation also helps this process and reduces
wind erosion. Creating a surface which enhances water harvesting will also help
to leach soil salts out of the surface profile aid the re vegetation programme. In areas
where salt content of the over burden is high, it is recommended that the dumps be
screened with overburden of the lowest possible salt content. This is usually from
material closer to the surface. This selective handling of overburden may be
considered expensive. However, such treatments will be required to provide a
suitable environment for plant growth, as it will take many years for the salts to leach out
of the surface layers. The screening material needs to be covered by topsoil. In
all cases the surface and faces of waste dumps will need to be ripped to break
compaction and to allow water penetration. This ripping will usually be carried out by
a dozer after the topsoil and old vegetation material is spread. It is stressed that
water harvesting and erosion control are the key issues in establishing the final
surface for the rehabilitation programme.
Hydro geochemistry
To accses the groundwater quality fifty groundwater samples were collected from borewells in
and around Yerraguntla mandal, Y.S.R District, Andhra Pradesh during March 2018. Sample
locations are given in Fig: 4. In order to evaluate the suitability of drinking water quality
parameters like pH, electrical conductivity, Total Dissolved Solids (TDS) Total Hardness, Ca2+,
The International journal of analytical and experimental modal analysis
Volume XII, Issue VII, July/2020
ISSN NO:0886-9367
Page No495

Table. 1 Statistical summary of physico-chemical parameters in the study area
Mg2+, Na+, K+, CO32-, HCO3-, Cl-, SO42-, NO3-, F-.The techniques and methods adopted for
collection, parameteranalytical techniques were followed according to Hem (1985), Raghunath
(1987), Karanth (1989), and APHA (2005). The statistical data is depicted in Table1 and
Concentrations of ions and their comparison with the WHO and BIS presented in Table 2.
Table. 2 Concentrations of ions and their comparison with the WHO and BIS
Parameters Min Max Mean St. Dev CV
pH 7.3 8.2 7.7 0.26 3.41
EC µS/cm 1380 9580 5117 2531 49
TDS mg/L 660 4580 2458 1217 49
TH mg/L 100 1080 481 275 57
Ca2+ mg/L 54 260 135 64 47
Mg2+ mg/L 10 152 63 38 68
K+ mg/L 0.2 82 34 35 102
Na+ mg/L 22 433 242 109 45
Cl- mg/L 77 1776 531 407 76
Br- mg/L 0.04 3.6 1.2 1 87
NO3- mg/L 2.29 751 126 187 148
SO4- mg/L 45 1281 433 446 103
TA mg/L 304 998 660 208 31
F- mg/L 0.6 5.81 1.2 1 68
Water Quality
Parameter
W.H.O Max
accept limit
W.H.O Max
allow limit
BIS Max accept
limit
BIS Max
allow limit
Concentration in study
area
Exceed
permissible limit
%
pH 7.0 8.5 6.5 8.5 7.3-8.2 Nil
EC (µS/cm) 400 1500 500 1500 1380-9580 92
TDS (mg/L) 500 1500 500 1500 660-4580 64
TH (mg/L) 100 500 300 600 100-1080 41
Ca2+ (mg/L) 75 200 75 200 54-260 20
Mg2+ (mg/L) 50 150 30 100 10-152 5.5
K+ (mg/L) 100 200 - - 0.2-82 Nil
Na+ (mg/L) 50 200 - - 22-433 85
Cl- (mg/L) 250 600 250 1000 77-1776 25
Br- (mg/L) - - - - 0.04-3.6 -
NO3- (mg/L) - 50 45 100 2.2-751 54
SO42- (mg/L) 200 600 200 400 45-1281 20
TA (mg/L) 200 600 200 600 304-998 68
F- (mg/L) 0.6 1.5 0.6 1.5 0.6-5.8 47
The International journal of analytical and experimental modal analysis
Volume XII, Issue VII, July/2020
ISSN NO:0886-9367
Page No496
pH:
The limit of pH value for drinking water is specified as 6.5 mg/L to 8.5 mg/L. Most ground
waters have a pH range of 6 to 8.5 [18]. pH of groundwater in the study area is ranging from 7.3
to 8.2 with a mean of 7.7 mg/L. pH values for all the samples are within the desirable limits. The
Maximum pH 8.2 was recorded at station in Peddapadu village and minimum pH 7.3 was
recorded at station in village Chirrajupalle. It is observed that most of the groundwater is
alkaline in nature. Though pH has no direct effect on the human health, all biochemical reactions
are sensitive to variation of the pH. Most of the samples are within the permissible limit of pH
fits for drinking and irrigation purpose.
Electrical Conductivity
The maximum limit of electrical conductivity in drinking water is prescribed as 1500
microSiemens/cm [22]. Electrical conductivity of the groundwater is ranging from 1380 to 9580
S/cm at 250C with a mean of 5117S/cm (Table 1). In the present investigation minimum
concentration of EC 1380 S/cm was observed at Niduzuvi village and maximum EC 9580
S/cm was observed at Chirrajupalle village. High electrical conductivity in these samples may
be due to extensive agricultural practices.
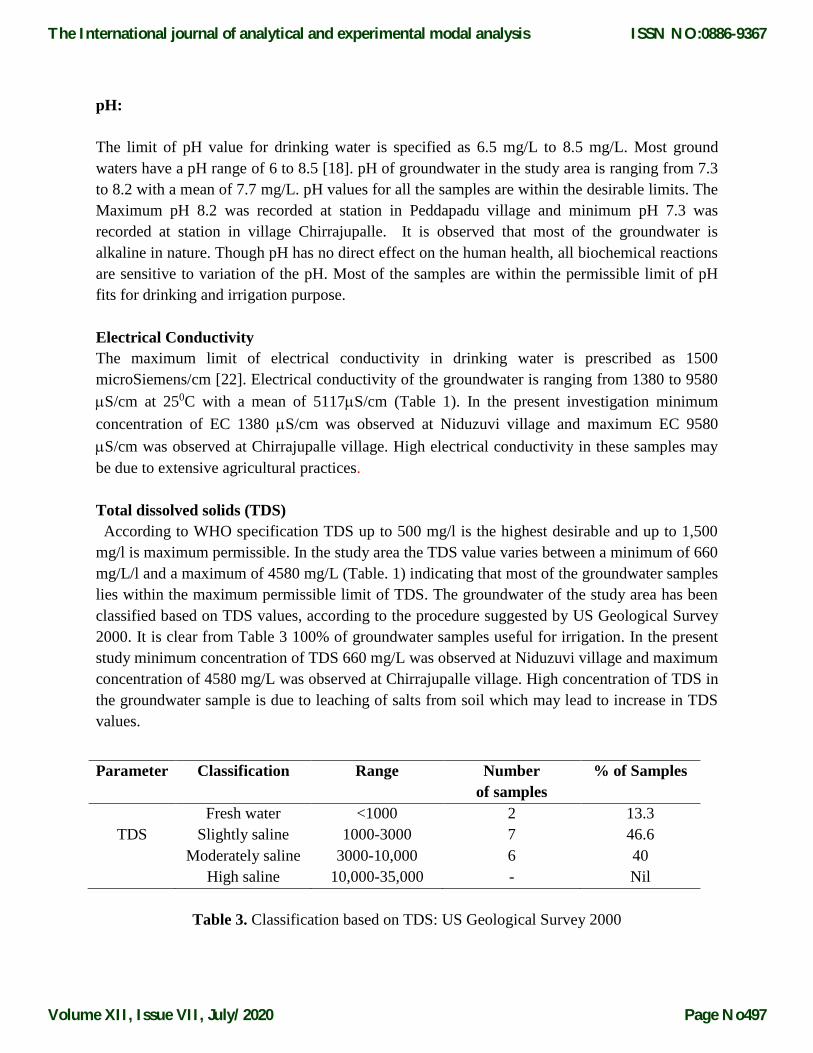
Total dissolved solids (TDS)
According to WHO specification TDS up to 500 mg/l is the highest desirable and up to 1,500
mg/l is maximum permissible. In the study area the TDS value varies between a minimum of 660
mg/L/l and a maximum of 4580 mg/L (Table. 1) indicating that most of the groundwater samples
lies within the maximum permissible limit of TDS. The groundwater of the study area has been
classified based on TDS values, according to the procedure suggested by US Geological Survey
2000. It is clear from Table 3 100% of groundwater samples useful for irrigation. In the present
study minimum concentration of TDS 660 mg/L was observed at Niduzuvi village and maximum
concentration of 4580 mg/L was observed at Chirrajupalle village. High concentration of TDS in
the groundwater sample is due to leaching of salts from soil which may lead to increase in TDS
values.
Table 3. Classification based on TDS: US Geological Survey 2000
Parameter Classification Range Number
of samples
% of Samples
TDS
Fresh water
Slightly saline
Moderately saline
High saline
<1000
1000-3000
3000-10,000
10,000-35,000
2
7
6
-
13.3
46.6
40
Nil
The International journal of analytical and experimental modal analysis
Volume XII, Issue VII, July/2020
ISSN NO:0886-9367
Page No497
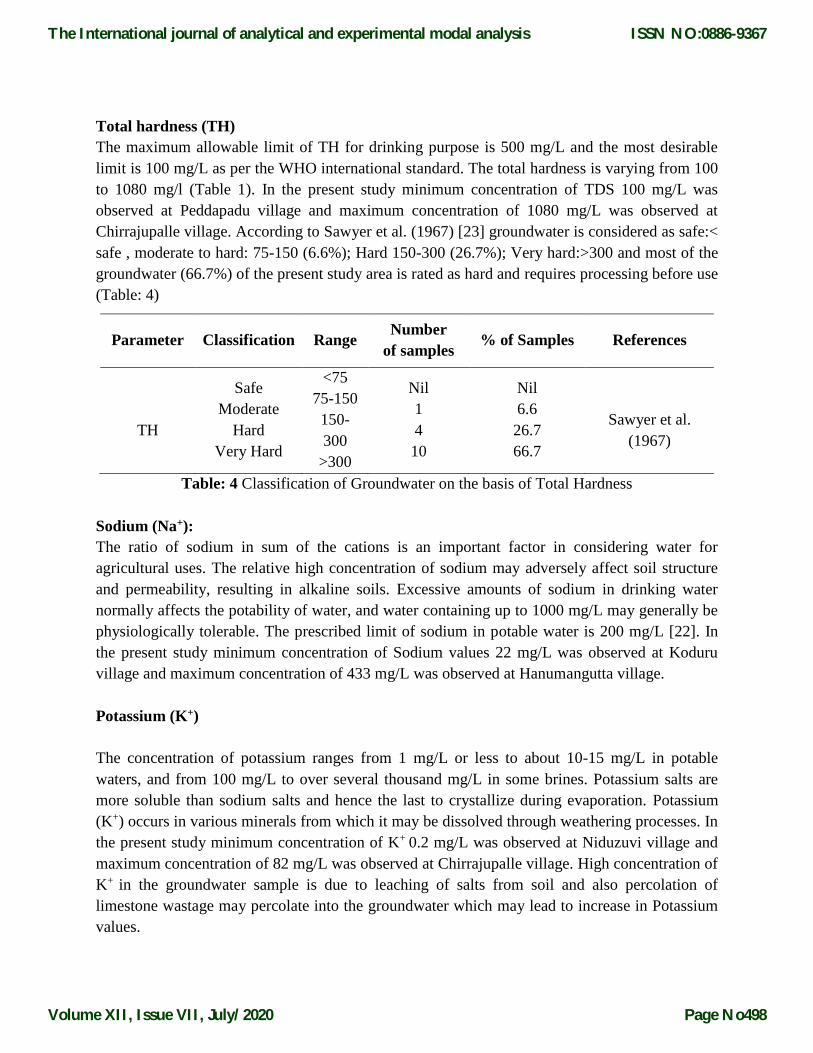
Total hardness (TH)
The maximum allowable limit of TH for drinking purpose is 500 mg/L and the most desirable
limit is 100 mg/L as per the WHO international standard. The total hardness is varying from 100
to 1080 mg/l (Table 1). In the present study minimum concentration of TDS 100 mg/L was
observed at Peddapadu village and maximum concentration of 1080 mg/L was observed at
Chirrajupalle village. According to Sawyer et al. (1967) [23] groundwater is considered as safe:<
safe , moderate to hard: 75-150 (6.6%); Hard 150-300 (26.7%); Very hard:>300 and most of the
groundwater (66.7%) of the present study area is rated as hard and requires processing before use
(Table: 4)
Table: 4 Classification of Groundwater on the basis of Total Hardness
Sodium (Na+):
The ratio of sodium in sum of the cations is an important factor in considering water for
agricultural uses. The relative high concentration of sodium may adversely affect soil structure
and permeability, resulting in alkaline soils. Excessive amounts of sodium in drinking water
normally affects the potability of water, and water containing up to 1000 mg/L may generally be
physiologically tolerable. The prescribed limit of sodium in potable water is 200 mg/L [22]. In
the present study minimum concentration of Sodium values 22 mg/L was observed at Koduru
village and maximum concentration of 433 mg/L was observed at Hanumangutta village.
Potassium (K+)
The concentration of potassium ranges from 1 mg/L or less to about 10-15 mg/L in potable
waters, and from 100 mg/L to over several thousand mg/L in some brines. Potassium salts are
more soluble than sodium salts and hence the last to crystallize during evaporation. Potassium
(K+) occurs in various minerals from which it may be dissolved through weathering processes. In
the present study minimum concentration of K+ 0.2 mg/L was observed at Niduzuvi village and
maximum concentration of 82 mg/L was observed at Chirrajupalle village. High concentration of
K+ in the groundwater sample is due to leaching of salts from soil and also percolation of
limestone wastage may percolate into the groundwater which may lead to increase in Potassium
values.
Parameter Classification Range Number
of samples % of Samples References
TH
Safe
Moderate
Hard
Very Hard
<75
75-150
150-
300
>300
Nil
1
4
10
Nil
6.6
26.7
66.7
Sawyer et al.
(1967)
The International journal of analytical and experimental modal analysis
Volume XII, Issue VII, July/2020
ISSN NO:0886-9367
Page No498

Total Alkalinity (CO3- and HCO3
-)
The alkalinity of natural waters is due to the salts of carbonates, bicarbonates, borates, silicates
and phosphates along with hydroxyl ions in the free state. The permissible limit of bicarbonate
in drinking water is 150 mg/L [22]. In the present study minimum concentration of Total
alkalinity 304 mg/L was observed at Sunkesula village and maximum concentration of 998.4
mg/L was observed at Peddapadu village.
Chloride (Cl- )
Chloride in drinking water originates from natural sources, sewage and industrial effluents and
saline intrusion. Its concentration in natural water is commonly less than 100 mg/L unless the
water is brackish or saline [24]. High concentration of chloride gives a salty taste to water and
beverages and may cause physiological damages. Water with high chloride content usually has
an unpleasant taste and may be objectionable for some agricultural purposes. As per [22]
standard Cl- has desirable and acceptable limits less than 250 and 250-600 mg/L. Chloride
concentration in the study area varies from 77 mg/L to 1776 mg/L with a mean of 478.64 mg/l.
The desirable limit of chloride in potable water is 250 mg/L and the permissible limit is 1000
mg/L. Higher concentration of 1776 mg/l at station in Hanumangutta village can be
groundwater contamination may be due to wastage of limestone. This can also be due to leaching
of upper soil layers due to industrial & domestic activities and dry climate [7]. The desirable
limit of chloride in potable water is 250 mg/L and the permissible limit is 1000 mg/L.
Calcium and Magnesium
Calcium and magnesium contribute to the hardness of water. Calcium varied from 54 mg/L to
260 mg/l and the values of magnesium ranged from 10 mg/L to 152 mg/L. The maximum value
of Calcium was recorded as 260 mg/L at sampling location Hanumangutta and minimum was 54
mg/L at Peddapadu village. The maximum admissible limit for calcium is 200 mg/L [22]. 20%
of the samples are exceeding permissible limit of calcium suggested by W.H.O (1990) (Table 3).
Magnesium in the groundwater of the study area is varying from 10 to 152 mg/L and the average
value is 63 mg/L (Tables 5&6). Maximum value of the magnesium was recorded as 152.281
mg/L at sampling location Chirrajupalle.The required permissible limit of magnesium in
groundwater for drinking purpose is 30 mg/L and the concentrations are found to be within the
permissible limits.
Bromide (Br-)
Bromide (Br−) is the anion of the element bromine, which is a member of the common halogen
element series that includes fluorine, chlorine, bromine and iodine. These elements have
chemical similarities, but also important differences. Bromide commonly exists as salts with
sodium, potassium and other cations, which are usually very soluble in water. It also forms the
strong acid, hydrobromic acid (HBr). Bromide is commonly found in nature along with sodium
chloride, owing to their similar physical and chemical properties, but in smaller quantities.
The International journal of analytical and experimental modal analysis
Volume XII, Issue VII, July/2020
ISSN NO:0886-9367
Page No499
Bromide concentration in the study area varies from 0.04 mg/L at chilamkur village to 3.63 mg/L
with a mean of 1.2 mg/l at Hanumangutti.
Fluoride
Fluoride concentration varies from 0.6 mg/L (Yerraguntla) to 5.81 mg/L (Peddapadu) with a
mean of 1.662 mg/L. The desirable limit of fluoride in drinking water is between 0.5 to 1.5
mg/L. The permissible limit in drinking water 1.5mg/L (W.H.O 2011).Out of the total sample
analysis 40% of the samples are above the permissible limit of 1.5 mg/L. Six locations Sunkesula
(1.8 mg/L), Koduru (2.3 mg/L) , Peddapadu (5.8 mg/L), Valasapalli (2.3 mg/L), Kalamalla (1.6
mg/L), Yerraguntla (1.7) have a mean fluoride concentration beyond 1.6 mg/l. It can be
concluded that fluoride bearing water are usually high in the alkalinity and low in hardness and
chloride, sulphate [9]. It can be concluded that fluoride bearing water is usually high in alkalinity
and low in hardness and chloride, sulfate [2, 8]. Higher fluoride in groundwater of this region
may due to basic flows along with igneous formation like dolerites and carbonate minerals [25].
Fluorides occur in three forms, namely fluorspar or calcium fluoride (CaF2), apatite or rock
phosphate [Ca3F (PO4)3] and cryolite (Na3AlF6) [27]. Out of 416 fluoride-bearing rock minerals,
only topaz, fluorite, villiaunite, and cryolite contain fluorine as an essential constituent in the
formula. Geogenic sources like apatite, clay, biotite and also longer contact with the aquifer
media under alkaline environment is the one of the key factors to present higher concentration
fluoride in the study area [26]. The sources of geogenic (apatite, biotite, and clays) with a
combination of higher rate of evaporation and longer interaction of water with the aquifer
materials under alkaline environment are the key factors for the concentration of F- in the study
area. Prolonged water rock interactions facilitate fluoride enrichment in groundwater. Geological
settings and type of rocks play a crucial role in fluoride contamination in groundwater. The
various actors that govern the release of fluoride into groundwater are temperature, pH, and
solubility of fluoride-bearing minerals, anion exchange capacity of aquifer materials (OH− for
F−), the nature of geological formations drained by water, and the contact time of water with the
source minerals.
Nitrate (NO3-)
Nitrate concentration in groundwater ranges from 2.51 mg/L- 751 mg/L. Permissible limit of
nitrate in ground water is 45mg/L. Around 57% of the groundwater samples within the
permissible limit of nitrate and remaining 43% of the samples exceeds the desirable limit (45
mg/L) of nitrate. In most of the locations nitrate contamination occurs due to various sources like
agricultural activities, leachate from landfills, domestic sewage line leakage and poultry waste
disposal and cultivate animal dung [27]. A higher concentration of nitrates is leached in
groundwater in this region may be due to pollution by inactive/abandoned mine impoundment.
These impoundments are acted as strategic reservoirs of agriculture waste; and directly in contact
with groundwater table and easily contaminated by, NO3- ions into groundwater resources.
The International journal of analytical and experimental modal analysis
Volume XII, Issue VII, July/2020
ISSN NO:0886-9367
Page No500
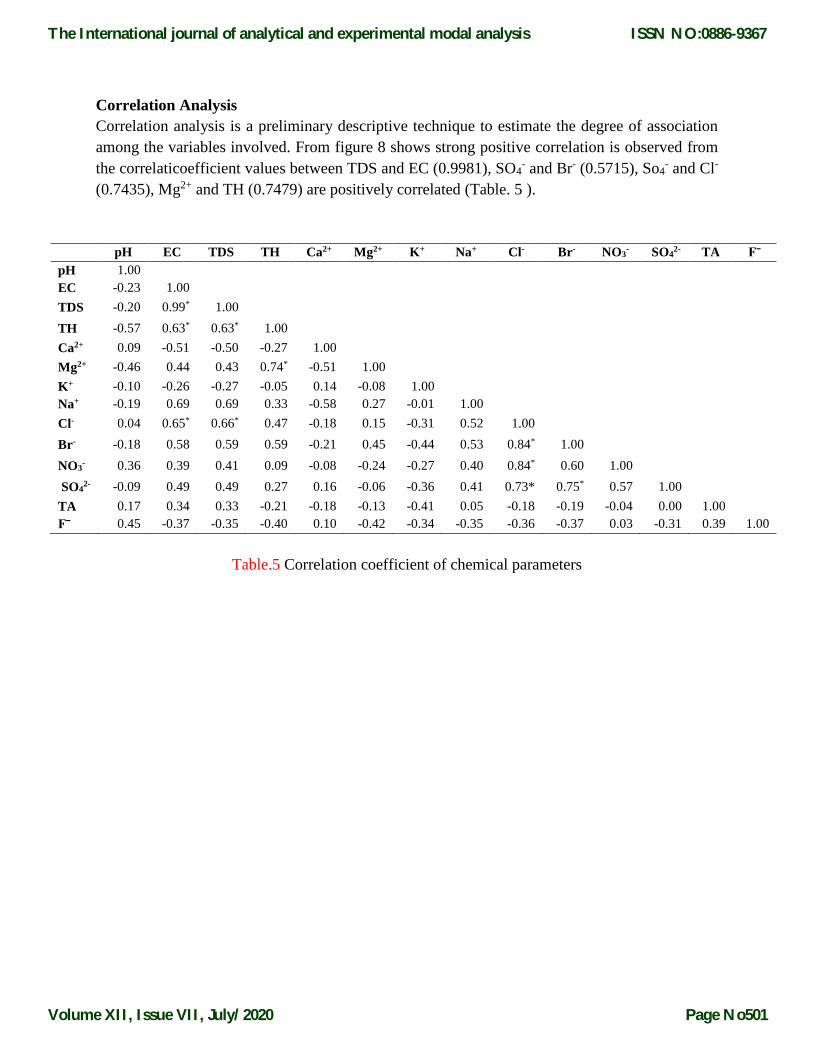
Correlation Analysis
Correlation analysis is a preliminary descriptive technique to estimate the degree of association
among the variables involved. From figure 8 shows strong positive correlation is observed from
the correlaticoefficient values between TDS and EC (0.9981), SO4- and Br- (0.5715), So4
- and Cl-
(0.7435), Mg2+ and TH (0.7479) are positively correlated (Table. 5 ).
pH EC TDS TH Ca2+ Mg2+ K+ Na+ Cl- Br- NO3- SO4
2- TA Fˉ
pH 1.00
EC -0.23 1.00
TDS -0.20 0.99* 1.00
TH -0.57 0.63* 0.63* 1.00
Ca2+ 0.09 -0.51 -0.50 -0.27 1.00
Mg2+ -0.46 0.44 0.43 0.74* -0.51 1.00
K+ -0.10 -0.26 -0.27 -0.05 0.14 -0.08 1.00
Na+ -0.19 0.69 0.69 0.33 -0.58 0.27 -0.01 1.00
Cl- 0.04 0.65* 0.66* 0.47 -0.18 0.15 -0.31 0.52 1.00
Br- -0.18 0.58 0.59 0.59 -0.21 0.45 -0.44 0.53 0.84* 1.00
NO3- 0.36 0.39 0.41 0.09 -0.08 -0.24 -0.27 0.40 0.84* 0.60 1.00
SO4
2- -0.09 0.49 0.49 0.27 0.16 -0.06 -0.36 0.41 0.73* 0.75* 0.57 1.00
TA 0.17 0.34 0.33 -0.21 -0.18 -0.13 -0.41 0.05 -0.18 -0.19 -0.04 0.00 1.00
Fˉ 0.45 -0.37 -0.35 -0.40 0.10 -0.42 -0.34 -0.35 -0.36 -0.37 0.03 -0.31 0.39 1.00
Table.5 Correlation coefficient of chemical parameters
The International journal of analytical and experimental modal analysis
Volume XII, Issue VII, July/2020
ISSN NO:0886-9367
Page No501
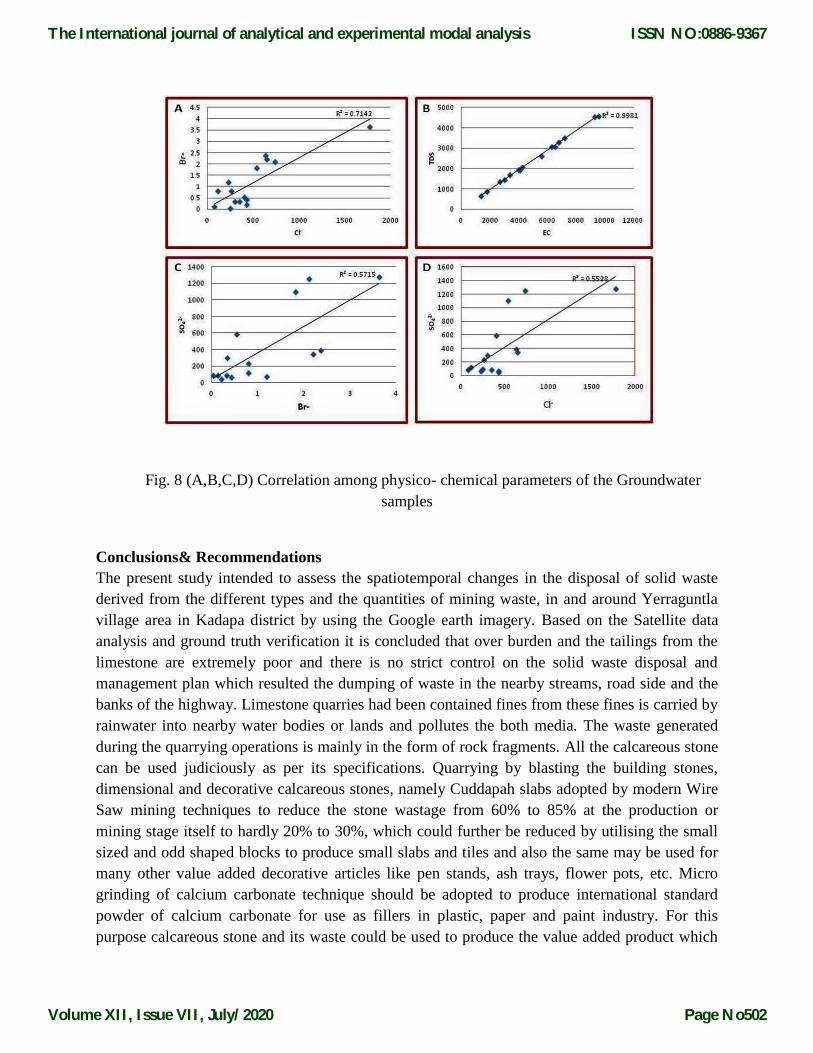
Fig. 8 (A,B,C,D) Correlation among physico- chemical parameters of the Groundwater
samples
Conclusions& Recommendations
The present study intended to assess the spatiotemporal changes in the disposal of solid waste
derived from the different types and the quantities of mining waste, in and around Yerraguntla
village area in Kadapa district by using the Google earth imagery. Based on the Satellite data
analysis and ground truth verification it is concluded that over burden and the tailings from the
limestone are extremely poor and there is no strict control on the solid waste disposal and
management plan which resulted the dumping of waste in the nearby streams, road side and the
banks of the highway. Limestone quarries had been contained fines from these fines is carried by
rainwater into nearby water bodies or lands and pollutes the both media. The waste generated
during the quarrying operations is mainly in the form of rock fragments. All the calcareous stone
can be used judiciously as per its specifications. Quarrying by blasting the building stones,
dimensional and decorative calcareous stones, namely Cuddapah slabs adopted by modern Wire
Saw mining techniques to reduce the stone wastage from 60% to 85% at the production or
mining stage itself to hardly 20% to 30%, which could further be reduced by utilising the small
sized and odd shaped blocks to produce small slabs and tiles and also the same may be used for
many other value added decorative articles like pen stands, ash trays, flower pots, etc. Micro
grinding of calcium carbonate technique should be adopted to produce international standard
powder of calcium carbonate for use as fillers in plastic, paper and paint industry. For this
purpose calcareous stone and its waste could be used to produce the value added product which
The International journal of analytical and experimental modal analysis
Volume XII, Issue VII, July/2020
ISSN NO:0886-9367
Page No502
is in great demand world over. Calcareous stone slurry, obtained during polishing of stones, a
mixture of calcium carbonate and silica, could successfully be used in manufacture of lime-silica
bricks. In the present era of Economic Liberalization, though the mineral and industrial policy
have been significantly revised for the industrial development of the country, yet following
suggestions are made to further improve upon the situation. Due to this irregular an uncontrolled
solid waste dumping in and around yerraguntla town water pollution has been noticed and hence
water quality analysis of physicochemical parameters study has been carried out. Groundwater is
exceeding the permissible limits of TDS, TH, EC, chloride and sulphates, fluorides and nitrates.
Excess fluoride may lead to tooth decay and kidney disease. Overall drinking water quality in
this area is not suitable for drinking purpose and fallows some proper measurements in water
quality management.
References
[1] Bringi SD 2007. Application of 3D principles to solid waste management on the Asian
Institute of Technology (Ait) Campus.Unpublished M.Sc Thesis.Indonsia
[2] Y. Sudarshan Reddy, V. Sunitha, B. Suvarna, M. Prasad 2018. Assessment of
Groundwater quality with special reference to Fluoride in groundwater surrounding
abandoned mine sites at Vemula, Y.S.R district, A.P. Journal of Emerging Technologies
and Innovative Research. 5(11), 769-777.
[3] Indian Minerals Yearbook (2017). Limestone & Other Calcareous Materials, Government
Of India Ministry of Mines Indian Bureau Of Mines
[4] K. Sarma, S.P.S Kushwaha 2005.Coal mining impact on land use /land cover in jaintia
hills district of Meghalaya, India using remote sensing and GIS technique.
www.csre.iitb.ac.in/~csre/conf/wp-content/uploads/.../OS5_17.pdf
[5] Rajdeep Das And Ipseet Choudhury 2013. Waste Management In Mining Industry,
Indian J.Sci.Res. 4(2) : 139-142, 2013.
[6] T. Gleeson, Y. Wada, M.F Bierkens, L.P Van Beek 2012. Water balance of global
aquifers revealed by groundwater footprint. Nature 488 (7410), 197-200.
The International journal of analytical and experimental modal analysis
Volume XII, Issue VII, July/2020
ISSN NO:0886-9367
Page No503

[7] Narsimha Adimalla, Sudarshan Venkatayogi 2018. Geochemical characterization and
evaluation Of groundwater suitability for domestic and agricultural utility in semi‑arid
region of Basara, Telangana State, South India Applied Water Science (2018) 8:44.
[8] B. Muralidhara Reddy, V. Sunitha, M. Prasad, Y. Sudharshan Reddy, M Ramakrishna
Reddy 2019. Evaluation of groundwater suitability for domestic and agricultural utility in
semi-arid region of Anantapur, Andhra Pradesh State, South India. Groundwater for
Sustainable Development. 9: 100262. https://doi.org/10.1016/j.gsd.2019.100262
[9] V. Sunitha, B. Muralidhara Reddy, M. Ramakrishna Reddy 2012. Variation of fluoride
and correlation with alkalinity in groundwater of shallow and deep aquifers- A case study
in and around Anantapur district, Andhra Pradesh. Int. Journal of Applied Sciences and
Engineering Research. 1(4), 2012.
[10] V. Sunitha, J. Abdullah Khan, B. Muralidhara Reddy 2013. Fluoride Contamination in
Groundwater in and around Badvel, Kadapa District, Andhra Pradesh. Indian Journal of
Advances in Chemical Science 2 (1):78-82.
[11] V. Sunitha, B. Muralidhara Reddy, J.Abdullah Khan, R.Siddi Raju, B.Sesha Reddy and
Ch.Stalin Richardson 2014. Assessment of Groundwater Quality of Kalasapadu,
Porumamilla Mandals, Kadapa, Y.S.R District, India. Journal of Chemical, Biological
and Physical Sciences 4(1) 787-796.
[12] V. Sunitha, G. Srinivasulu 2015. Fluoride contamination of groundwater and its impacts
on human health in and around vemula, vempalli mandals, Y.S.R district, A.P India
International Journal of Current Research and Academic Review. Int.J.Curr. Res AcaRev
3(7): 282-291.
[13] V. Sunitha, B. Muralidhara Reddy, S. Sumithra 2016. Assessment of Groundwater
Quality Index in the Kadapa Municipal City, Y.S.R. District, Andhra Pradesh
International Journal of Advanced Research 6(2): 545-548.
[14] V. Sunitha, B. Muralidhara Reddy, M. Ramakrishna Reddy 2014a. Mineral Resources of
Cuddapah Basin. Journal of Biological and Chemical Research, 31(1): 226-235.
[15] B. Suvarna, Y. Sudharsan Reddy, V. Sunitha, B. Muralidhara Reddy, M. Prasad, M.
Ramakrishna Reddy 2019. Data on application of water quality index method for
appraisal of water quality in around cement industrial corridor, Yerraguntla Mandal,
Y.S.R District, A.P South India. Data in brief.https://doi.org/10.1016/j.dib.2019.104872
The International journal of analytical and experimental modal analysis
Volume XII, Issue VII, July/2020
ISSN NO:0886-9367
Page No504
[16] Hem JD 1991. Study and interpretation of the chemical characteristics of natural water.
USGS Water Supply Paper, p 225.
[17] APHA 2012. Standard methods for the examination of water and wastewater, 22nd edn.
American Public Health Association, New York.
[18] Y. Sudharshan Reddy, V. Sunitha, B. Suvarna, M. Prasad, B. Muralidhara Reddy, M.
Ramakrishna Reddy 2018a. Data on physical impacts and hydrogeochemical assessment
of inactive/abandoned mines in and around Southwestern parts of the Cuddapah basin
using a conceptual site model (CSM). Data in Brief. 29 (2020) 105187.
https://doi.org/10.1016/j.dib.2020.105187
[19] M. Prasad, V. Sunitha, Y.Sudharshan Reddy, B. Suvarna, B.Muralidhara Reddy, M.
Ramakrishna Reddy 2019. Data on Water quality index development for groundwater
quality assessment from Obulavaripalli Mandal, YSR district, A.P India, Data in Brief
https://doi.org/10.1016/j.dib.2019.103846, ELSEWIER.
[20] Y. Sudarshan Reddy, B. Suvarna, M. Prasad, V. Sunitha and M. Ramakrishna Reddy
2018b. Temporal changes of Solid Waste at Limestone Quarries in and Around
Yerraguntla, Y.S.R District, A.P using Google Earth Images. Urban Mining and
Sustainable Waste Management, Pp. 99-109. https://doi.org/10.1007/978-981-15-0532-
4_12
[21] WHO 2011. Guidelines for drinking-water quality, 4th edn, vol 1: recommendations.
World Health Organization, Geneva.
[22] GN. Sawyer, DL. McCarthy 1967. Chemistry of sanitary engineers. 2nd edn. Mc Graw
Hill, New York,. p 518.
[23] B. Frengstad, D. Banks, U. Siewers 2001. The chemistry of Norwegian groundwaters: the
dependence of element concentrations in crystalline bedrock groundwaters. Sci Total
Environ 277:101–117.
[24] K. Brindha , K. Elango 2013. Geochemistry of Fluoride Rich Groundwater in
aWeathered Granitic Rock Region, Southern India. Water Qual Expo Health 5:127–138
DOI 10.1007/s12403-013-0096-0
The International journal of analytical and experimental modal analysis
Volume XII, Issue VII, July/2020
ISSN NO:0886-9367
Page No505
[25] N. Subba Rao, J. Prakasa Rao, D. John Devadas, K.V Srinivasa Rao, C. Krishna, B.
Nagamalleswara Rao, 2002. Hydrogeochemistry and groundwater quality in a developing
urban environment of a semi-arid region, Guntur, Andhra Pradesh. J Geol Soc India.
59:159–166.
[26] V. Sunitha, Y. Sudharshan Reddy 2019. Hydrogeochemical evaluation of groundwater in
and around Lakkireddipalli and Ramapuram, Y.S.R District, Andhra Pradesh, India,
Hydro Research. https://doi.org/10.1016/j.hydres.2019.11.008
The International journal of analytical and experimental modal analysis
Volume XII, Issue VII, July/2020
ISSN NO:0886-9367
Page No506