solid waste management in indonesia -...
TRANSCRIPT

SOLID WASTE MANAGEMENT IN INDONESIA
OPPORTUNITIES AND CHALLENGES FOR RECYCLING AND WASTE
REDUCTION
Jakarta, Indonesia
October 25, 2018

1
STRUCTURE OF PRESENTATION
1. Integrated Solid Waste Management in Indonesia
2. Potential for recycling and waste-to-energy
3. Marine Debris Management

October 2018

Section 1:
Current Status of Solid Waste Management Sector

4
Government targets demand high sector performance
Waste Management Act (No. 18/2008)• Requires the closure of all open dumping by 2013.
• Requires all three levels of government to contribute to financing the sector.
Regional Development Act (No. 23/2014)• Responsibility of local government in solid waste management (SWM).
National Medium Term Development Plan (RPJMN 2015 – 2019) • Targets: 100% SWM urban services (collection, treatment or disposal) by 2019.
National Waste Management Policy and Strategy– Perpres No. 97/2017• 30% waste reduction and 70% handling by 2025 Prov/City/District Jakstrada
Marine Debris Handling – Presidential Regulation (Perpres) No 83/2018• Commitment of Indonesia for reduction of 70% marine plastic by 2025
Acceleration of Development WtE Facilities – Perpres No 35/2018• Covering 12 cities, feed-in tariff of US$ 13.35 cent/KWh for power plant < 20
MW, and up to IDR 500k/ton-waste tipping fee contribution from APBN (central).
Conclusion: – IN SHORT AMOUNT OF TIME
Indonesia aims for 100% urban collection, 100% sanitary disposal for large
urban areas, & international best practice rates of waste reduction (30%).
Despite total waste generation rapidly increasing from wealth() and urbanization()

– 100% Household Collection in Urban Areas
– 100% Sanitary Disposal (Large Urban Areas) & Controlled Dumping (Small and Medium Urban Areas)
– 30% Waste Reduction
5
Current performance does not come close to targets
Decent Collection ~85 million people (62%)
Basic Collection ~10 million people (8%)
No Collection ~40 million people (30%)
Adequate Final Disposal ~6 million tons of waste annually (15%)
Illegal Dumping or Inadequate Disposal~30 million tons of waste annually (85%)
Waste Reduced ~1.9 million tons of waste recycled or
reused (~5%)
Remainder of ~40 million tons of waste targeted for reduction (25%)
100%
30%
100%
0%
0%
0%

6
SWM performance is poor in all types of cities
Metropolitan City Big City Medium City
Loss Rate (%) 17 30 39
Disposal Rate (%) 71,84 60,43 52,68
Treatment Rate (%) 9,96 8,46 6,56
Reduction at Source Rate (%) 1,39 0,83 1,51
0%
10%
20%
30%
40%
50%
60%
70%
80%
90%
100%
Pe
rce
nta
ge
(%
)
SWM Performance

7
Not one size fits all: performance varies significantly
between cities & urban districts.
0
10
20
30
40
50
60
70
80
90
100
Perc
enta
ge o
f W
ast
e R
eport
ed t
o b
e T
ransf
err
ed (
e.g
. Contr
olled
Dum
pin
g)
or
Treate
d (
e.g
. Recycle
d,
Com
post
ing)
(2015)
90% + of household waste is reported to be
transferred to dumping site or recycled
10-20% of waste reported
to be transferred or
recycled

8
Identifying the key sector challenges
1. Insufficient Financing
2. Organizing Collection
3. Operational Capacity
5. Land Shortages
4. Incentivizing City / District Performance

Analysis for National Sector Development Program
10
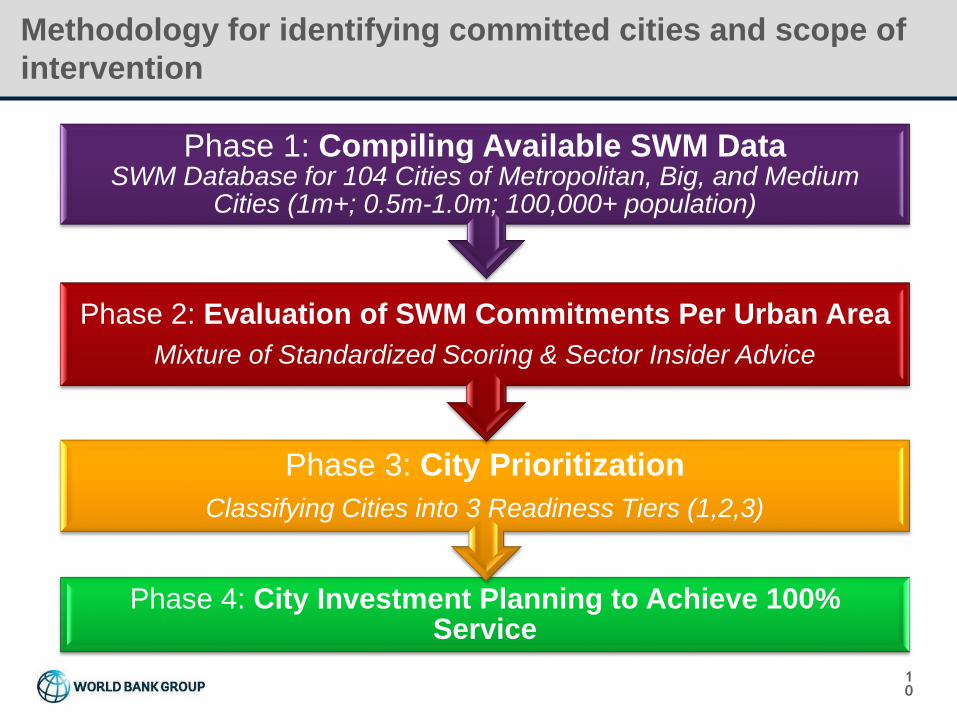
Methodology for identifying committed cities and scope of
intervention
Phase 4: City Investment Planning to Achieve 100% Service
Phase 3: City Prioritization
Classifying Cities into 3 Readiness Tiers (1,2,3)
Phase 2: Evaluation of SWM Commitments Per Urban Area
Mixture of Standardized Scoring & Sector Insider Advice
Phase 1: Compiling Available SWM DataSWM Database for 104 Cities of Metropolitan, Big, and Medium
Cities (1m+; 0.5m-1.0m; 100,000+ population)
11
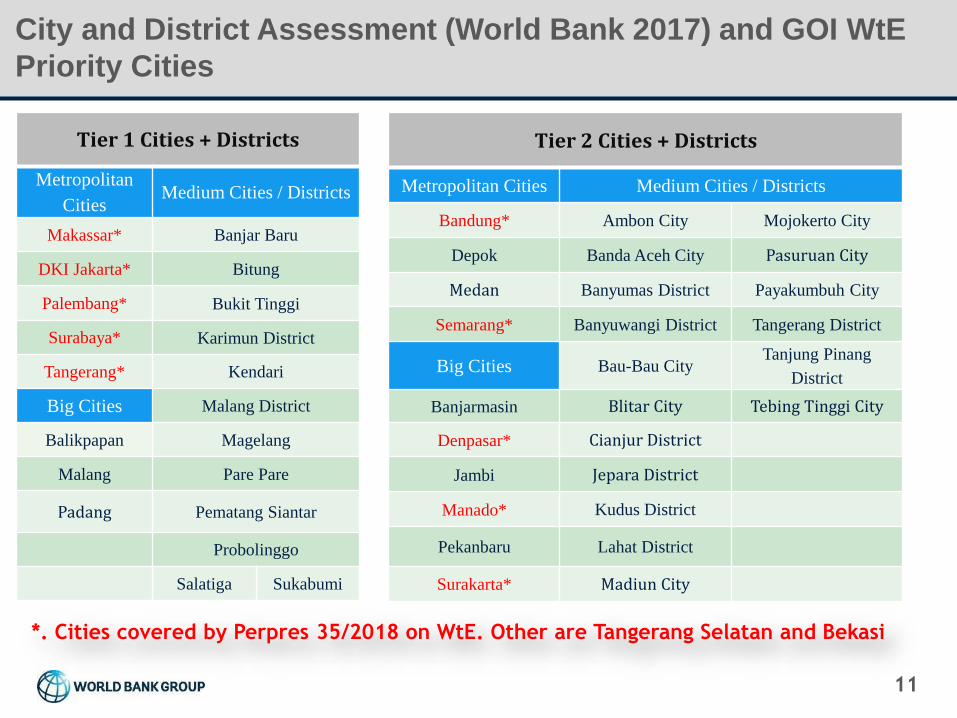
City and District Assessment (World Bank 2017) and GOI WtE
Priority Cities
Tier 1 Cities + Districts
Metropolitan
CitiesMedium Cities / Districts
Makassar* Banjar Baru
DKI Jakarta* Bitung
Palembang* Bukit Tinggi
Surabaya* Karimun District
Tangerang* Kendari
Big Cities Malang District
Balikpapan Magelang
Malang Pare Pare
Padang Pematang Siantar
Probolinggo
Salatiga Sukabumi
Tier 2 Cities + Districts
Metropolitan Cities Medium Cities / Districts
Bandung* Ambon City Mojokerto City
Depok Banda Aceh City Pasuruan City
Medan Banyumas District Payakumbuh City
Semarang* Banyuwangi District Tangerang District
Big Cities Bau-Bau CityTanjung Pinang
District
Banjarmasin Blitar City Tebing Tinggi City
Denpasar* Cianjur District
Jambi Jepara District
Manado* Kudus District
Pekanbaru Lahat District
Surakarta* Madiun City
*. Cities covered by Perpres 35/2018 on WtE. Other are Tangerang Selatan and Bekasi

12
Investment Financing Gaps are Apparent
Investment Funding
Challenges (2017-2022)
Required
(MPWH Estimate)
IDR 66 trillion
($5 billion)
Likely
Available
Financing
(e.g. APBN, APBD,
Donors)
IDR 17 trillion
($1.2 billion)
Financing
Gap
(e.g. DAK, APBN,
APBD, PPP)
IDR 49 trillion
($3.7 billion)
- In 2016, it was estimated that US$1.2 billion
is available for investments (25% of need),
which is large enough to deliver improved
sector performance measurable at a national
scale when funds are spent effectively
and efficiently.

13
Investment Scenarios – Current System
Current Waste Mass Balance

14
Investment Scenario – Full collection, adequate disposal,
30% Waste Reduction

15CONDITIONS IN INDONESIA FOR
ADVANCING WASTE RECYCLING
Approx. 3,000,000 people engaged in waste recycling, including informal
collection (waste picking, collection and processing, trade).
Informal collection of recyclables in Java estimated at about 10%, less on
other islands due to transport costs and lack of local capacity for trade and
treatment.
Formal recycling around 2% from waste banks (segregated collection) and
around 8% from sorting of mixed waste (self-reported, including
composting)
Poor data on waste volumes, some data such as up to 4,000,000 ton/a of
plastic recycling and low percentages of valuable recyclables in disposed
waste suggest overall recycling around 20% and thus quite effective
further improvements will need effort (and funding)
High end recycling (business to business) at IDR 700,000/ton.

16

17
WHEN DOES WTE MAKE SENSE?
Land availability and transport infrastructure constrained
Large land sites are not available near urban centers, land is expensive, or difficulties siting
WtE significantly extend landfill life
WtE facilities can be put in city centers, lowering waste transport costs
Electricity and/or and tipping fees are high
Attractive electricity tariffs (e.g. renewable FIT), especially if no or low tipping fees
Where displacing high cost import fossil fuels (e.g. diesel, LNG)
Proximity to electricity demand, co-locate with end user(s) for co-gen
Favorable policies–viewed as contributor to meeting future elect. capacity need
Favorable and consistent waste quality
Scale generally important, 1,000 tons per day MSW facility can support 16-40MW power
generation
Lower moisture content, higher calorific content, lower inerts (ash, construction debris)
However, new technologies available to upgrade pr burn low quality waste
Rapidly growing large urban cities – Have many of above attributes
Megacities or large cities in middle income countries (MICs)
Effective SW management favorably impacts other urban – flooding, tourism, property
values
Part of a integrated SW management plan including recycling, re-use, and waste reduction

18CONDITIONS IN INDONESIA FOR
WASTE-TO-ENERGY (INCINERATION)
Land availability, waste transport distances / transfer time and siting issues
cause problems with landfill extension in majority of cities
Tipping fees on average too low, but proposed feed-In-tariffs up to 133.5
$/MWh and topping up gate fees to IDR 500k/ton for earmarked cities can tip
the balance in favor of WtE (DKI Jakarta Province, The City of Tangerang,
Bandung, Semarang, Surakarta, Surabaya, Makassar, Bekasi, Manado,
Tangerang Selatan, Palembang and Dempassar)
High organics/water content of waste is less attractive
Limited capacity to creative required business conditions and guide
transactions for WtE arrangements with private sector funding
Sufficient interest from private technology providers and private financing

19
WASTE RECYCLING AND WTE ELSEWHERE

20
WTE IN WASTE HIERARCHY
WtE below 3R in
hierarchy, … but
processes mixed
waste

21
Marine Debris Management in Indonesia
1. Issues relating to oceans and marine debris management are high on GoI’s agenda.
2. Recognizing the scale of multiple challenges, Indonesia is developing a National Oceans
Agenda, anchored in a National Oceans Strategy (currently under preparation)
3. In June 2017, Indonesia launched the National Action Plan on Marine Debris, which calls for
efforts to control plastic waste leakage/marine debris and raise awareness of the issue. It
notes that improving municipal solid waste in coastal areas could reduce plastics leakage to
the ocean by as much as 80%, and prioritizes efforts to collect and safely dispose of solid
waste, including through a National Solid Waste Management (NSWM) Program


23
Marine Litter Management in Indonesia

24
Marine Litter Management in Indonesia
15 coastal cities in Indonesia
Baseline conditions in tidal and
non-tidal areas; systems and
institutional arrangements
(water basin and waste
management); waste
characteristics; hotspots
mapping: social behavior.

25
Marine Litter Management in Indonesia
15 target cities: Bali (Denpasar), Java (Jakarta, Semarang, Surabaya, Yogyakarta),
Kalimantan (Balikpapan, Pontianak), Sulawesi (Bitung, Makassar, Manado),
Lombok (Mataram), Sumatra (Lampung, Batam, Medan, Padang)

26
Marine Litter Management in Indonesia –
after the waste ends up in waterways

27
Marine Litter Management in Indonesia - Findings
1. Wide ranging approaches and effectiveness of waste removal from
waterways
2. Waste removed over 30% plastics (16% plastic bags), first results confirm
indicative estimates of marine litter quantities
3. Relatively poor waste services in tidal areas
4. Low awareness of problems with waste to waterways
5. Link marine litter management (reduction of waste to waterways) with solid
waste and water basin management programs

28
Marine Litter Management in Indonesia – Linkage to Waste
Management Services and Planning
1. Adequate waste collection and treatment/disposal can solve 80% of current waste
leakage to waterways
2. Scope for prioritizing reduction of waste to waterways in waste sector programs
(focus on coastal areas, public education, relocation of infrastructure)
3. Solid waste sector programs tend to focus on urban areas, thus poorly address waste
collection in tidal areas and river communities
4. Special policies for reduction of packaging materials, particularly plastic bags, sachets
(EPR)
5. Further research into waste removal from waterways

Reducing Ocean Plastics Pollution in Indonesia
Four-Pronged Approach
1. Reduce land-based leakage of plastics
2. Reduce sea-based leakage of plastics and
other pollutants
3. Reduce accumulated coastal and marine
pollution
4. Reduce plastics production and use

30
Main Messages from Hotspots assessment
Prioritize SWM –given linkages to marine debris –in coastal cities
Ensure city-level master plans include high leakage locations, including informal
settlements
Improved waste management infrastructure for capturing/avoiding leakage
• location of collection facilities TPS; accessibility
• feasibility of collection technologies
Strengthen communications and awareness
Long term solutions through targeted policies and incentive mechanisms for
exploring alternatives to plastics, reducing plastics production, increasing
recycling and reuse