solid waste management: laws, policies, institutional ... · solid waste management: laws,...
TRANSCRIPT
Solid Waste Management: Laws, Policies, Institutional Structure and Financial Mechanism
Technical Deep Dive on Solid Waste Management
Shiko HayashiProgramme Director, Kitakyushu Urban Centre, IGES
September 24th, 2018
22
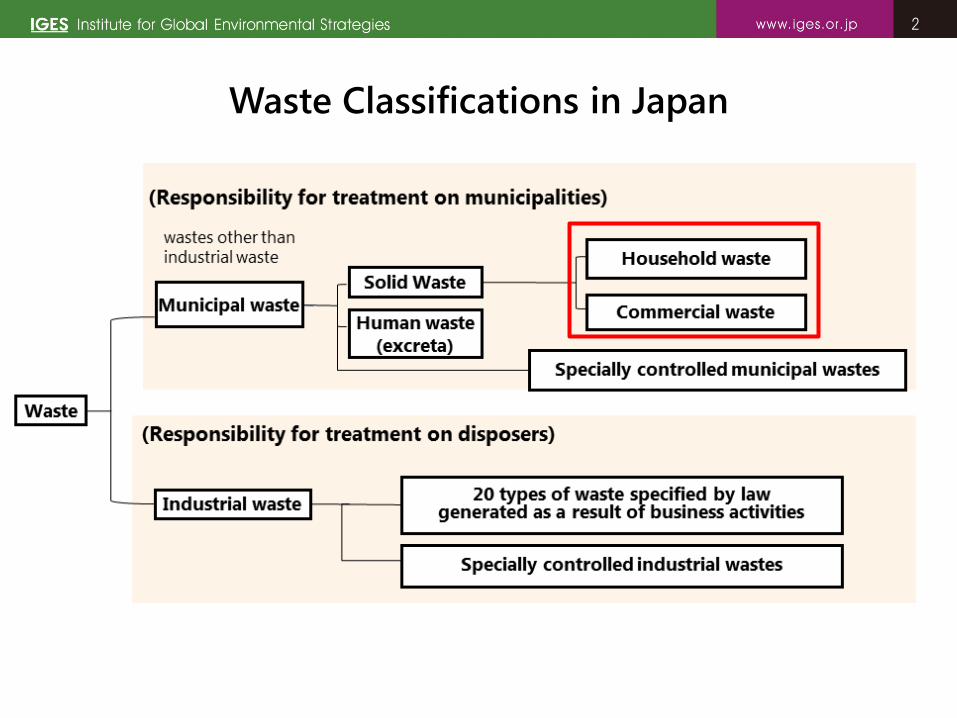
Waste Classifications in Japan
33
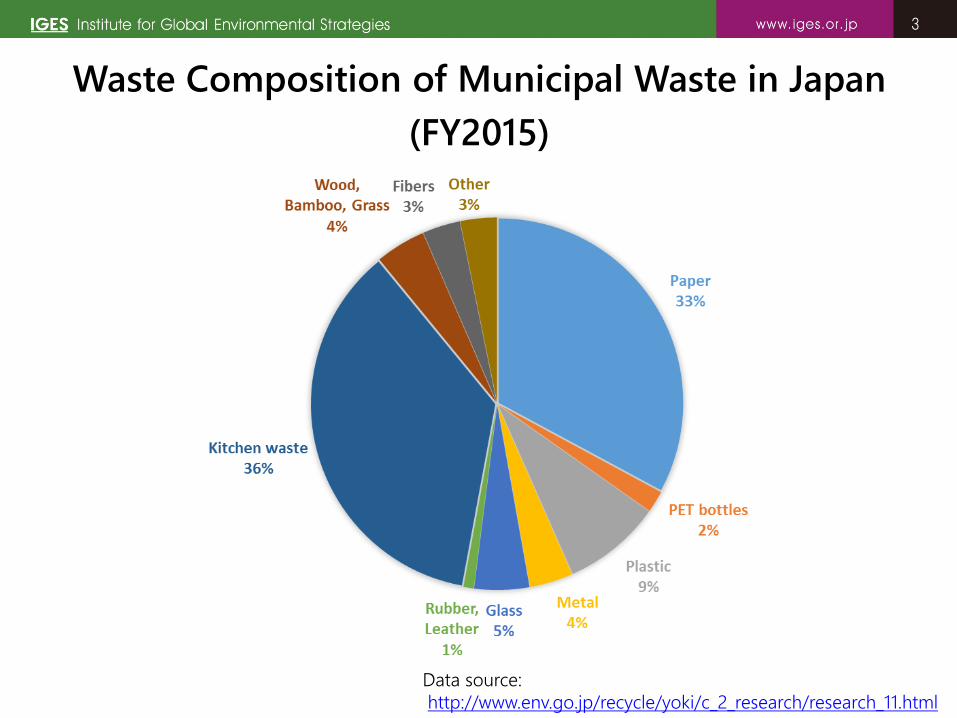
Waste Composition of Municipal Waste in Japan (FY2015)
Data source:http://www.env.go.jp/recycle/yoki/c_2_research/research_11.html
44
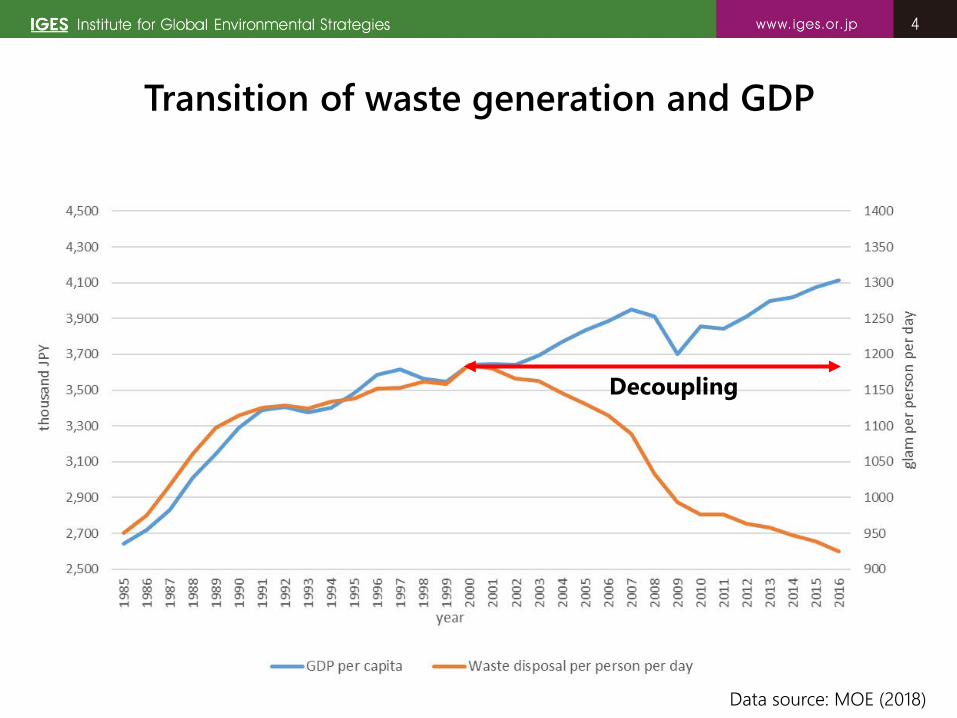
Transition of waste generation and GDP
Decoupling
Data source: MOE (2018)
55
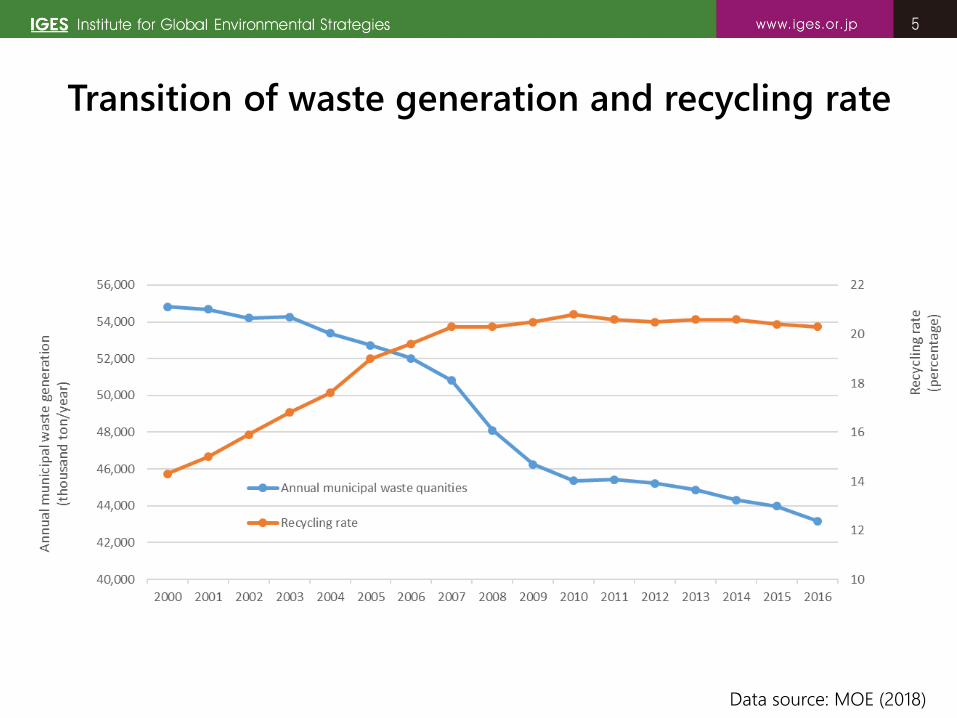
Transition of waste generation and recycling rate
Data source: MOE (2018)
66
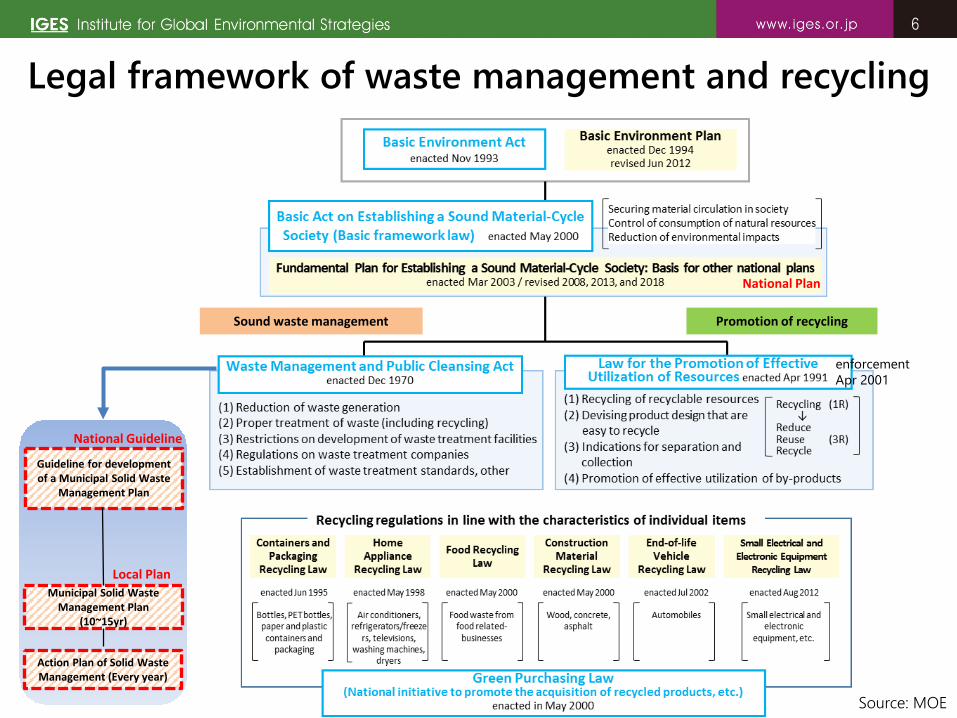
Legal framework of waste management and recycling
Source: MOE
Promotion of recyclingSound waste management
National Plan
Action Plan of Solid Waste Management (Every year)
Municipal Solid Waste Management Plan
(10~15yr)
Guideline for development of a Municipal Solid Waste
Management Plan
National Guideline
Local Plan
enforcement Apr 2001
77
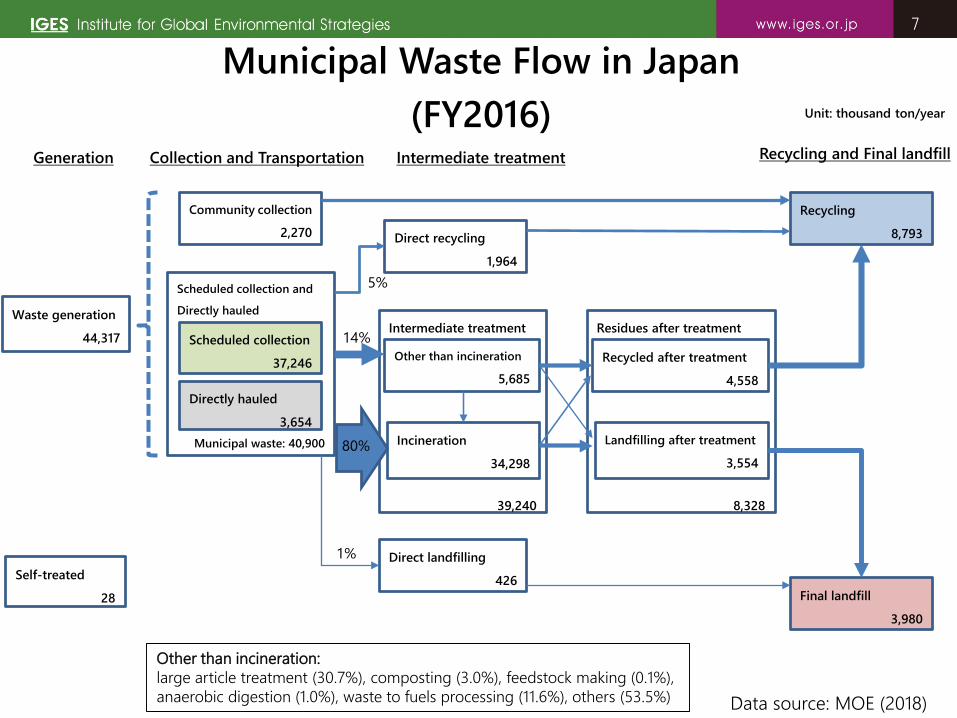
Scheduled collection and
Directly hauled
Municipal waste: 40,900
Waste generation
44,317
Community collection
2,270
Scheduled collection
37,246
Directly hauled
3,654
Self-treated
28
Recycling
8,793
Final landfill
3,980
Intermediate treatment
39,240
Other than incineration
5,685
Incineration
34,298
Residues after treatment
8,328
Recycled after treatment
4,558
Landfilling after treatment
3,554
Direct recycling
1,964
Direct landfilling
426
Collection and Transportation Intermediate treatment Recycling and Final landfillGeneration
Unit: thousand ton/year
80%
14%
5%
1%
Data source: MOE (2018)
Other than incineration:large article treatment (30.7%), composting (3.0%), feedstock making (0.1%), anaerobic digestion (1.0%), waste to fuels processing (11.6%), others (53.5%)
Municipal Waste Flow in Japan(FY2016)
88
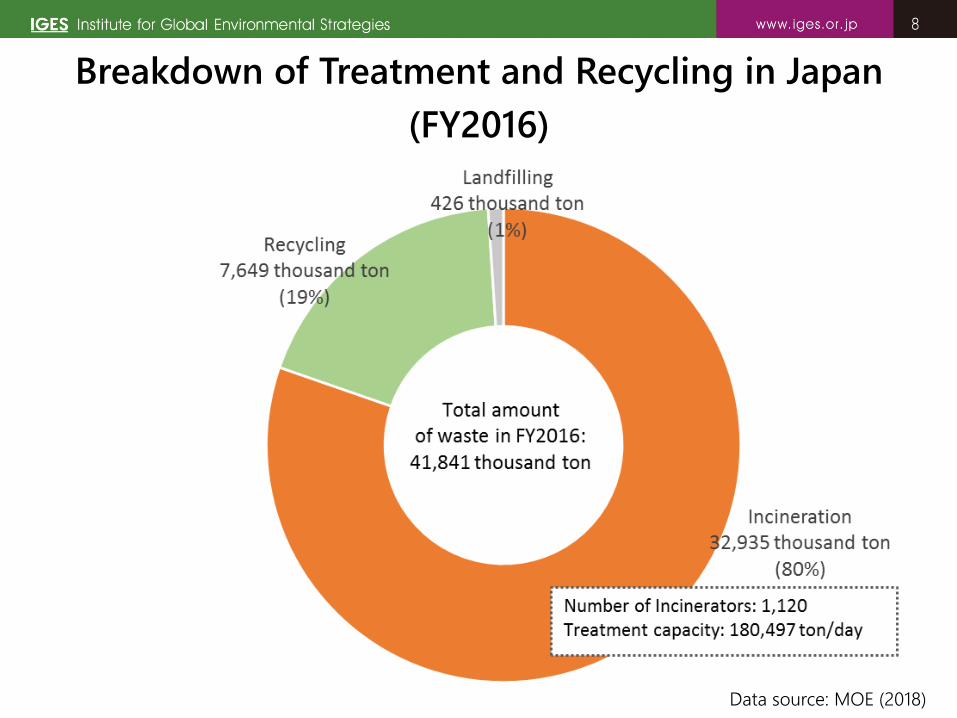
Breakdown of Treatment and Recycling in Japan (FY2016)
Data source: MOE (2018)
99
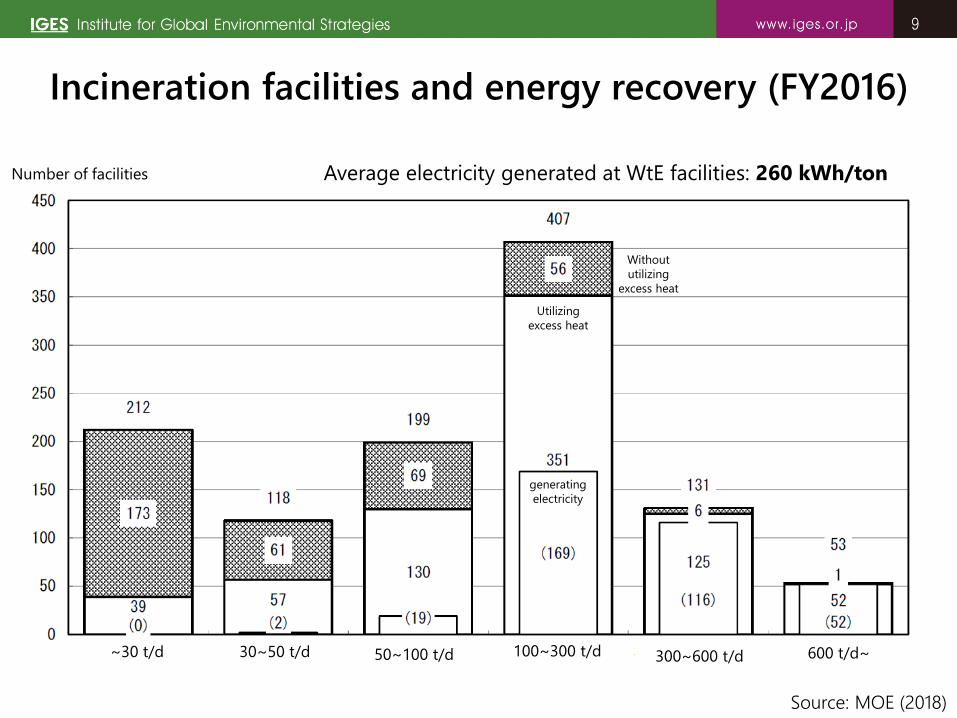
Incineration facilities and energy recovery (FY2016)
Number of facilities
~30 t/d 30~50 t/d 50~100 t/d 100~300 t/d 300~600 t/d 600 t/d~
generating electricity
Utilizing excess heat
Without utilizing
excess heat
Average electricity generated at WtE facilities: 260 kWh/ton
Source: MOE (2018)
1010
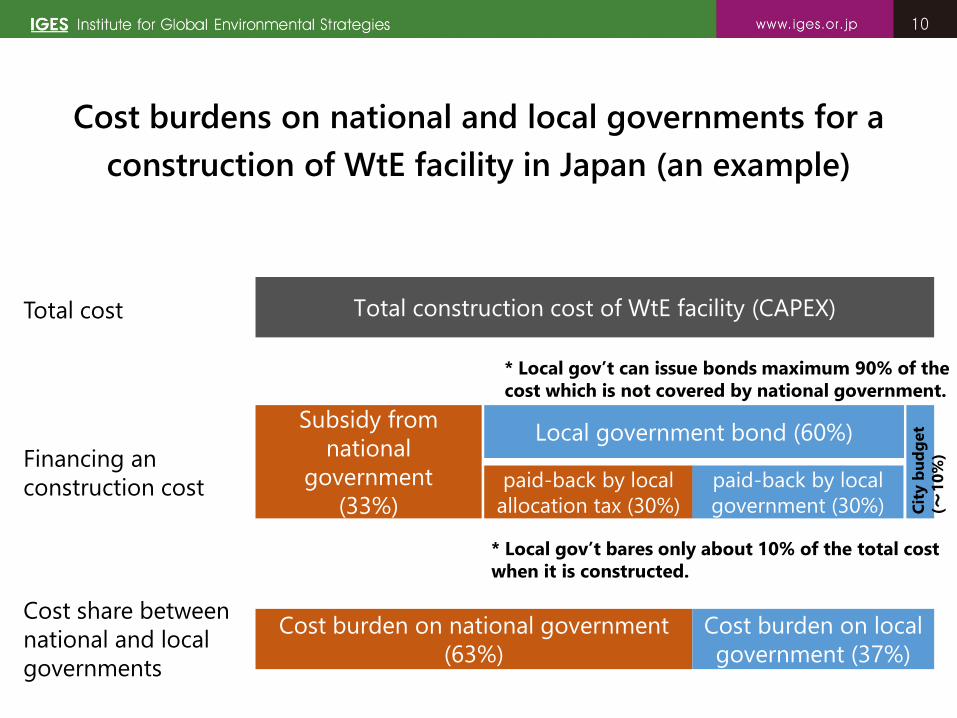
Total construction cost of WtE facility (CAPEX)
Subsidy from national
government(33%)
Cost burden on national government(63%)
Local government bond (60%)
paid-back by local allocation tax (30%)
paid-back by local government (30%)
Cost burden on local government (37%)
City
bud
get
(~10
%)
Total cost
Financing an construction cost
Cost share between national and local governments
Cost burdens on national and local governments for a construction of WtE facility in Japan (an example)
* Local gov’t can issue bonds maximum 90% of the cost which is not covered by national government.
* Local gov’t bares only about 10% of the total cost when it is constructed.
1111
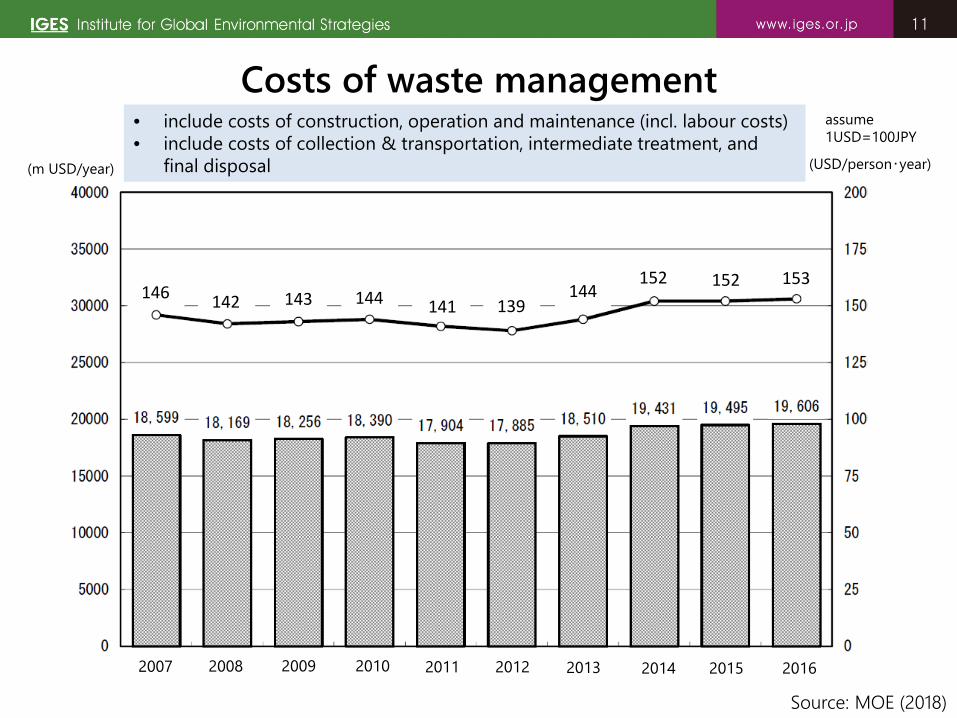
Costs of waste management
2007 2008 2009 2010 2011 2012 2013 2014 2015 2016
Source: MOE (2018)
(USD/person・year)(m USD/year)
assume 1USD=100JPY
146 142 143 144 141 139144
152 152 153
• include costs of construction, operation and maintenance (incl. labour costs)• include costs of collection & transportation, intermediate treatment, and
final disposal
1212
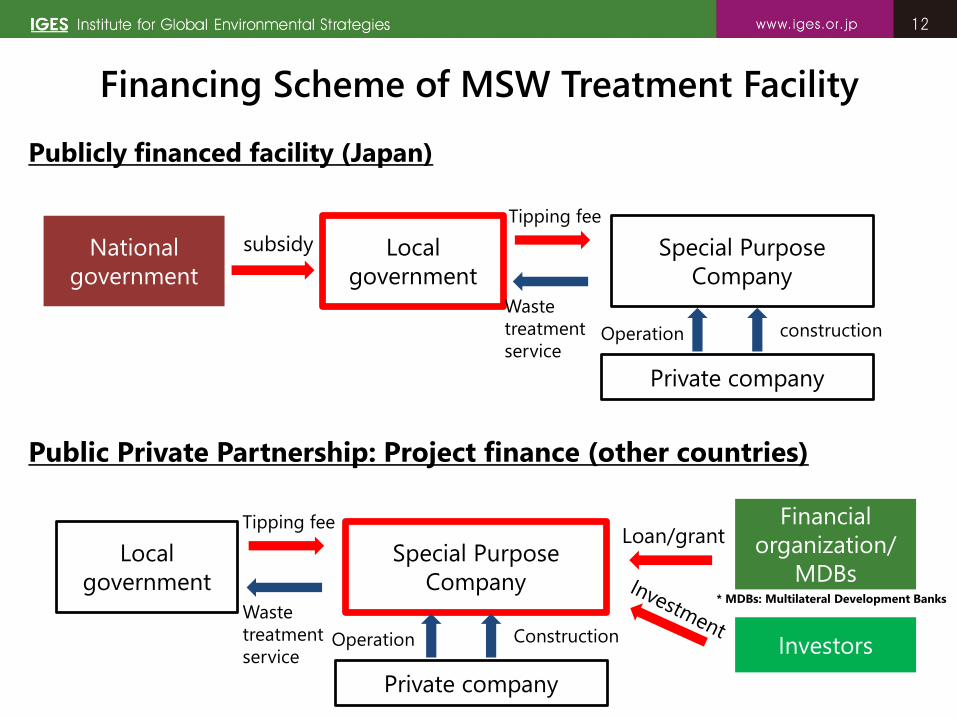
Publicly financed facility (Japan)
Public Private Partnership: Project finance (other countries)
Local government
Special Purpose Company
InvestorsPrivate company
Operation Construction
Financing Scheme of MSW Treatment Facility
Tipping fee
Waste treatment service
Local government
Special Purpose Company
National government
subsidy
Private company
Operation construction
Tipping fee
Waste treatment service
Financial organization/
MDBs* MDBs: Multilateral Development Banks
Loan/grant
1313
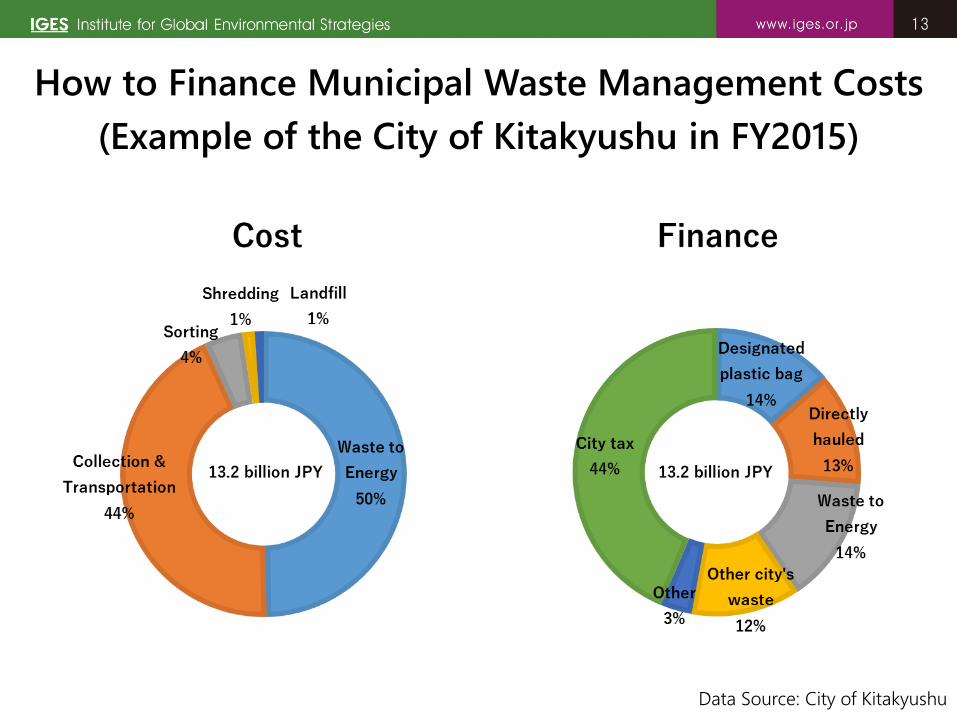
How to Finance Municipal Waste Management Costs (Example of the City of Kitakyushu in FY2015)
Data Source: City of Kitakyushu
1414
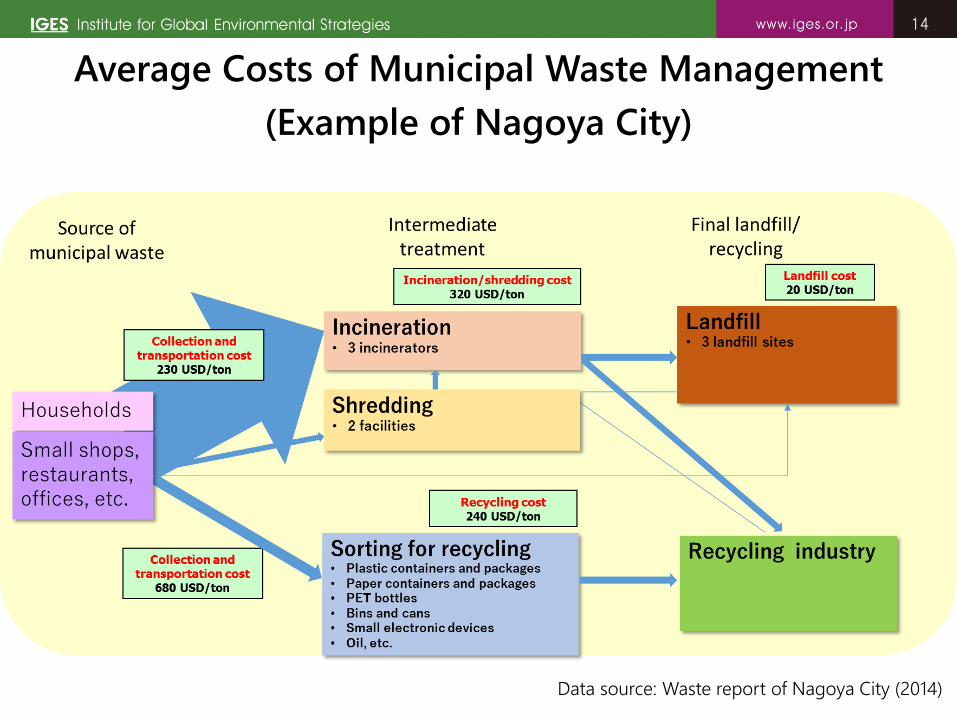
Average Costs of Municipal Waste Management (Example of Nagoya City)
Data source: Waste report of Nagoya City (2014)
1515
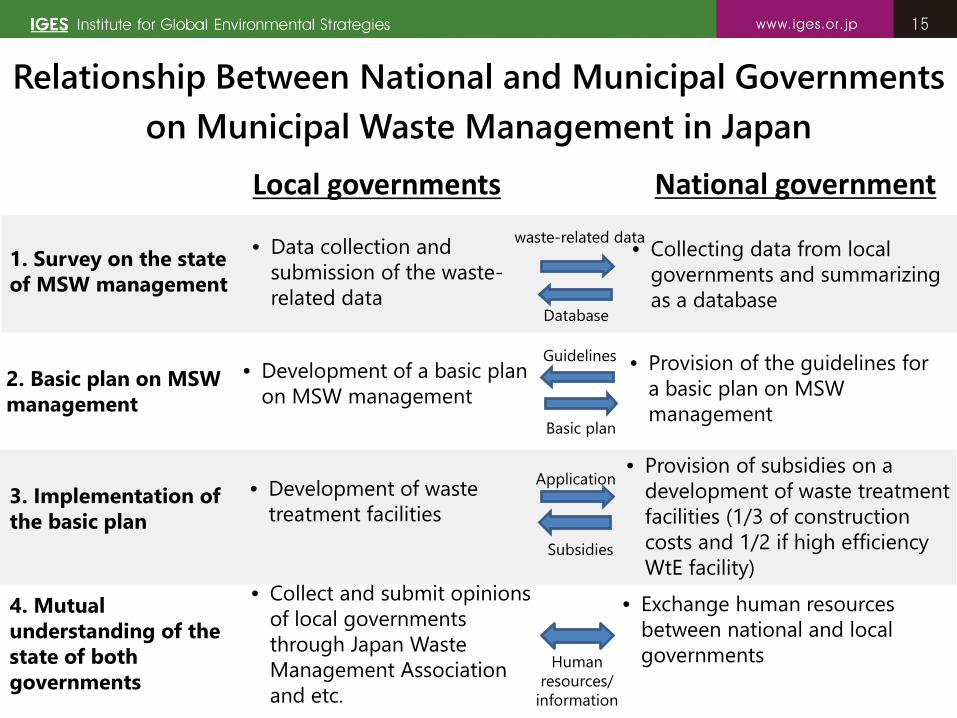
Local governments
• Collecting data from local governments and summarizing as a database
2. Basic plan on MSW management
• Provision of the guidelines for a basic plan on MSW management
• Development of a basic plan on MSW management
1. Survey on the state of MSW management
• Data collection and submission of the waste-related data
3. Implementation of the basic plan
• Development of waste treatment facilities
• Provision of subsidies on a development of waste treatment facilities (1/3 of construction costs and 1/2 if high efficiency WtE facility)
4. Mutual understanding of the state of both governments
• Collect and submit opinions of local governments through Japan Waste Management Association and etc.
• Exchange human resources between national and local governments
waste-related data
National government
Database
Guidelines
Basic plan
Subsidies
Human resources/
information
Application
Relationship Between National and Municipal Governments on Municipal Waste Management in Japan
1616
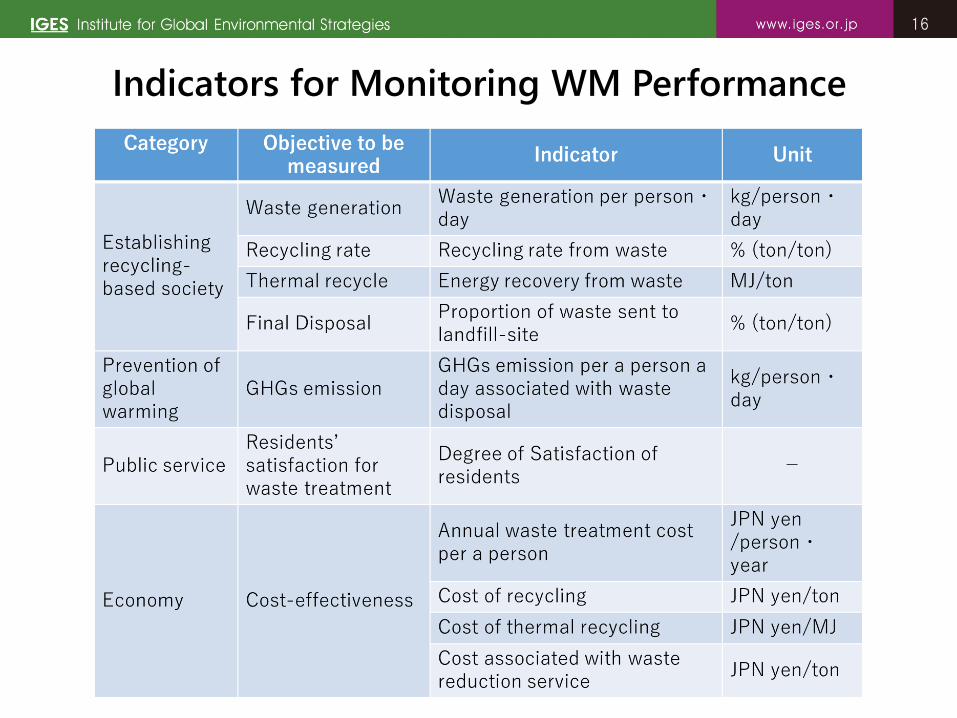
Indicators for Monitoring WM Performance
1717
For more information, please go to “Japan Case Study of Municipal Solid Waste Management: A
Roadmap for Reform for Policy Makers “or contact to [email protected]
Thank you.