solid waste services - anchorage, alaska: the official
TRANSCRIPT

Solid Waste Services
Mayor
Municipal Manager
Director
Finance and Administration
Customer ServiceEngineering and
Planning
Refuse Collections Utility
Disposal Utility
2013 Proposed Operating and Capital Budgets
SWS - 1

Solid Waste Services Organizational Overview
Solid Waste Services, comprised of the Refuse Collection Utility and Solid Waste Disposal Utility, is defined as a municipal utility by Anchorage Municipal Code [AMC 26.10.015]. The Utilities are self-funded and self supporting by revenues derived from operations; primarily customer fees for services. No tax dollars are used by Solid Waste Services (SWS) operations. By Code and Municipal Charter, each utility is required to operate in accordance with general business standards common to the solid waste industry [Charter Article 16.01] and to provide a reasonable profit in accordance with industry standards [AMC 26.10.060]. To support Refuse Collection and the Disposal Utilities, SWS is comprised of three operating divisions: Engineering, Customer Service, and Administration. Each SWS supervisor reports to the Director. Director The Director is responsible for the overall management of SWS. The Director oversees operational decisions, with the Solid Waste and Recycling Advisory Commission providing an overview of strategies, operating plans and budgets, along with offering input on solid waste issues, ordinances and policies. Refuse Collection Utility Refuse Collection Utility provides both residential and commercial service to the “City of Anchorage” service area. Commercial refuse collection is performed with a fleet of six commercial frontload refuse collections vehicles with a single operator on six routes serviced Monday through Friday and two routes on Saturdays. Refuse Collection services over 5,000 dumpsters weekly, with a route average of 635 dumpsters weekly and 127 dumpsters daily. All commercial refuse collected and unloaded at the Central Transfer Station. Commercial dumpster service is supported by a container repair technician who is responsible for the transportation of commercial refuse containers between sites while operating a medium-duty flatbed truck and forklift, as well as the repair, cleaning, and inventory of dumpsters. Residential service is changing, with all customers shifting into automated operations in 2013. Residential refuse and curbside recycling collection is performed with a fleet of five automated sideload vehicles with a single operator on five routes serviced Monday through Friday. Three automated residential trash routes service over 10,000 customers weekly, with a daily route average of 726 services. Recycling curbside is performed by two routes that service over 9,500 customers weekly, with an average of 700 daily. The remaining 2,000 can and bag customers receive traditional can/bag service collected manually, and are scheduled for conversion to automated service in the 2013. All residential refuse is collected and unloaded at the Central Transfer Station. Residential recycling is transported and unloaded at the Anchorage Recycling Center. Refuse Collections pays a recycling tipping fee.
2013 Proposed Operating and Capital Budgets
SWS - 2
Residential automated service is supported by a container inventory technician who is responsible for the transportation of trash and recycling roll carts between customer locations by a medium-duty cargo van, as well as the repair, cleaning, and inventory of roll carts. Mixed paper and cardboard recycling collection for municipal offices began in 2005, and is provided on a weekly, bi-weekly, and monthly basis to more than 50 locations using 64-gallon roll-carts. Recycling service is provided using a semi-automated vehicle with a single operator. The average weight of mixed paper and cardboard collected annually is 112 tons. Mixed paper and cardboard is transported and unloaded at the Anchorage Recycling Center with no tipping fees and at no cost to MOA general government. The donation to general government is being evaluated. All refuse and recycling collection activities are currently performed by the following positions:
General Foreman – Responsible for a total program of refuse collections. Working Foreman – Coordinates daily activities associated with refuse
collections. Commercial Equipment Operators – Operates commercial frontload vehicles to
service dumpsters for collection of commercial waste. Residential Equipment Operators – Operates automated sideload vehicles to
service roll carts for collection of residential waste. Swampers – Assists with collection of commercial and residential waste. Container Repair Technician – Responsible for transportation, repair, cleaning,
and inventory of commercial dumpsters. Container Inventory Technician – Responsible for transportation, repair, cleaning,
and inventory of residential trash and recycling roll carts. Refuse collection fleet consists of ten 40 cubic yard commercial frontload vehicles, nine 27 cubic yard automated sideload vehicles, one 25 cubic yard rear loader, six light-duty support vehicles, and one forklift. When Refuse Collection eliminates can and bag service in 2013, the residential manual 20 cubic yard vehicles and a 40 cubic yard frontloader will be sold. Located within a warm storage facility at the central transfer station, Refuse Collection vehicle maintenance employees repair and maintain the refuse collection fleet. Refuse Collection employees are members of the Teamster’s union and Vehicle Maintenance employees are with the International Brotherhood of Electrical Workers. All operators are required to participate in a pre-route safety-operations briefing, and daily DOT required pre-shift and post-shift vehicle inspections. Disposal Utility The main function of the Disposal Utility is to dispose of household and commercial refuse generated in the Municipality. The refuse is brought to three locations: Girdwood Transfer Station, Central Transfer Station and the Anchorage Regional Landfill. The Disposal Utility has an extensive fleet of specialized equipment for the disposal of refuse that is maintained, operated and supported by highly skilled and trained individuals located at the landfill.
2013 Proposed Operating and Capital Budgets
SWS - 3

The Girdwood Transfer Station (GTS) receives over 10,000 household garbage loads totaling 800 tons of refuse annually. GTS has a paved area where garbage is discarded into an enclosure containing a 120 cubic yard trailer for transfer to the Central Transfer Station. GTS accepts used oil and batteries from customers. The items are picked up by Household Hazardous Waste contractors for proper disposal, recycling or for reuse. The Central Transfer Station (CTS) is located between the old and new Seward Highways on 56th Avenue. The CTS transfers on average 50 loads totaling 1,000 tons per day. The refuse is transferred to the landfill by SWS tractors pulling 120 cubic yard open top trailers, referred to as transfer trucks. First, commercial and residential refuse is dumped on the tipping floor. Next, the transfer trucks pull into one of two loading pits and the refuse is pushed into the trailers by front end loader operators on the tipping floor. The refuse is then packed down in the trailers by a knuckle boom crane operator located above each loading pit. Finally, the loaded trailers are then driven to Anchorage Regional Landfill. CTS accepts residential used oil, batteries and appliances that are picked up by contractors for proper disposal, recycling or for reuse. The Disposal Utility has a Household Hazardous Waste facility operated by a private contractor at CTS. Customers can drop off small quantities (less than 220 pounds per month) of unregulated hazardous waste not allowed in the landfill; some of the items are made available for reuse by the public at a Paint and Materials Exchange building located near the entrance on East 54th Avenue. The Anchorage Regional Landfill (ARL), located near the intersection of the Glenn Highway and Hiland Road, is a 275 acre, award-winning, subtitle D landfill that disposes of 1,400 tons of refuse daily. Currently, nine cells are constructed, with a total of 12 cells to be developed. Every day the refuse is compacted, and then, by regulation, it must be covered using bulldozers. The cover material comes from the excavation of future cells. Each landfill cell is lined and contains a leachate collection system. Leachate is transported in pipelines to collection lagoons for pre-treatment. The leachate is aerated to increase the oxygen levels. On average, three specially designed leachate tankers transport and dispose of 50,000 gallons a day. ARL employees are responsible for the daily disposal of refuse, the excavation and hauling of daily cover material, the installation and maintenance of landfill gas recovery wells and lines, the hauling leachate, the building and maintaining roads, snow removal, dust control and equipment repair. Created in 2008, the Disposal Utility is responsible for a municipality-wide recycling program which has seen success in the last four years, as recycling has increased and trash disposed in the landfill has gone down; thus extending the life of the landfill. Funded from a recycling surcharge, the program promotes recycling and the recycling industry. The most visible feature is the semi-annual ‘Anchorage to Zero Waste Guide’. Two part-time recycling coordinators answer public inquiries, and, in coordination with private and non-profit partners, prepare educational media campaigns and events related to recycling. The surcharge has funded the development of an expanded paved public recycling drop-off site at the landfill that accepts aluminum cans, paper, plastic and cardboard. The materials are taken to the Anchorage Recycling Center.
2013 Proposed Operating and Capital Budgets
SWS - 4
The program also provides support to public space recycling and to the Anchorage School District which collects mixed paper from all ASD facilities. Recycling is further supported through a grant for Christmas tree recycling, and a grant to offset the Port of Anchorage wharfage fees that the Anchorage Recycling Center pays to ship recyclables out of state. A large, but less visible effort is economic and business development grants. The funds are used for developing local recycling businesses reusing materials in-state, such as glass, tires, construction and demolition debris and organics. Located within a warm storage facility located at ARL, vehicle maintenance employees repair and maintain heavy equipment and Disposal vehicles. The main Household Hazardous Waste facility is located at ARL. It is operated by a private contractor that serves the residential and small business customers. Engineering and Planning Engineering and Planning consists of one engineer / manager and two engineering technicians. The group has these main functions: Planning, design and construction of new facilities; Major facility upgrades and repairs; Technical landfill operations; Landfill gas collection system operation Regulatory compliance
The division is responsible for planning, design and management of construction on landfill expansion cells, gas collection system piping, and landfill closure projects. Over the next ten years, the Engineering will manage over $38 million in planned landfill cell construction. The division relies on contracted engineering services for major design and construction projects. As the landfill development progresses, engineering efforts will turn toward more closure and reclamation projects such as capping, re-vegetation and storm water management. The current closure cost includes $36 million (2005 dollars) of closure construction work that will be conducted over a period of 20 years. As facilities age, the Engineering and Planning division is responsible for planning, design and procurement of services for major repair and maintenance activities. These activities include periodic reconstruction of the Central Transfer Station tipping floor, paving of roads and work areas at the landfill, and rehabilitation of landfill gas and leachate wells and piping systems. The Engineering and Planning division provides technical support to the Solid Waste Disposal landfill operations staff to improve landfill operations and maximize landfill airspace utilization. In 2011 and 2012, the division helped re-engineer outer landfill slopes, recovering landfill volume equivalent of nearly one year of waste disposal. The engineering staff monitors waste compaction and daily cover quantities. The division provides support for planning fill operations, developing access roads, and efficiently mining cover materials from the site. In 2011, in addition to processing approximately 300,000 tons of solid waste, the landfill crew mined in excess of 450,000 tons of gravel for current and future cover operations. Operation of the landfill gas collection system will change from a compliance activity to a commercial production activity after startup of the Landfill Gas to Energy contract with
2013 Proposed Operating and Capital Budgets
SWS - 5
Doyon Utilities in late 2012. Operation will include daily checks on key operating parameters, as well as routine maintenance of well heads and monitoring equipment. The system will require bi-weekly checking and rebalancing of the 58 current gas collection points to optimize the efficiency of the gas collection system while maximizing the gas output delivered to Doyon Utilities. The Engineering and planning division is responsible for compliance with environmental regulations at the Anchorage Regional Landfill, as well as three closed landfill sites. All sites have groundwater monitoring and reporting requirements, as well as solid waste permit compliance requirements relating to operation or post-closure monitoring. The Merrill Field landfill site has active landfill gas and leachate management systems which have both operational and regulatory reporting requirements. The Anchorage Regional Landfill operates under an active Class I landfill operating permit, as well as a Title V Air Quality operating permit, both issued by the Alaska Department of Environmental Conservation. In addition to specific operating requirements, these permits require numerous inspections, as well as documentation and reporting requirements. Because the landfill accepts asbestos wastes, it is regulated under National Emissions Standards for Hazardous Air Pollutants which requires inspection and documentation of every load of regulated material received. Both the Landfill and Central Transfer Station have Storm Water Pollution Prevention Plans approved by the Alaska Department of Environmental Conservation which have regular inspection, monitoring, sampling and reporting requirements. Customer Service The Customer Service division is the direct communication link to the two utilities’ customers. Not only does the division manage Refuse Collection garbage service requests, explain rates, enforce solid waste municipal codes, manage billing and debt collection, Customer Service also greets Disposal Utility customers, and conducts business with the public and the commercial haulers at the Central Transfer Station, Girdwood Transfer Station, and the Anchorage Regional Landfill. To facilitate and promote waste management efforts, the division collaborates with local organizations such as the Anchorage Chamber of Commerce, Anchorage Downtown Partnership, ALPAR, City Wide Spring Clean-Up, as well as schools, universities, and the military bases. The Customer Service division consists of a Senior Administrative Officer, Junior Administrative Officer, Debt Collector, Administrative Account Representatives, Scale House/Cash Booth Representatives and a Code Enforcer. Customer Service Account Representatives are located in the main administrative building, but also work at two scale houses and three cash booth locations from Girdwood to Eagle River all days of the week between the hours of 6:15 a.m. to 5:30 p.m. The Customer Service division responds to incoming calls and assists customers at the counter with payments or other service-related matters such as trash collection, proper disposal regulations, municipal ordinances, general hazardous waste disposal, recycling awareness, and billing-related questions. Receiving over 300 calls per day, the representatives setup site services, work to resolve customer’s complaints and ensure that the best services are being provided for both trash pick up and disposal. The representatives facilitate work orders for route drivers, assist drivers in the field by radio
2013 Proposed Operating and Capital Budgets
SWS - 6

communication and ensure proper billing for services for each property that Refuse Collection Utility services and for Disposal Utility customer accounts. The Debt Collection Representative is responsible for the investigation, analysis, and follow-up of overdue customer accounts. To obtain information and to secure the collection of debt, the Representative corresponds with customers, attorneys, outside agencies. To assist customers, payment agreements and plans are prepared. The Code Enforcer monitors the SWS service area by actively facilitating corrective action for or resolution of code violations observed in the field or by general public complaints received. Working inside two scale houses or three cash booths, the Disposal Utility Account Representatives screen customer loads, process charges and fees, assist with hazardous waste or recycling questions, and monitor the safety of customers and employees. The Customer Service Division is responsible for face-to-face interaction with over a quarter of a million customers per year. Recognizing that the solid waste business is dangerous, the Customer Service strives to educate customer about safe disposal of waste and efficiently respond to as many waste related issues as possible to meet the needs of our customers. SWS works together to resolve customer issues as promptly as possible. Safety and customer service are the highest priorities. Administration The Administration division provides support to the Director and to each Utility. It is responsible for IT Systems & Communications, Safety, Finance & Accounting, Purchasing, and Accounts Payable, as well as human resources, labor relations, security, code enforcement, facility maintenance, and vehicle parts inventory functions. The IT Systems & Communications Section. The IT section manages the solid waste based computer systems that track loads, weights, customer accounts receivable, billing, revenues, as well as the upload of SWS data into the Municipal accounting systems. In addition, the section is responsible for the maintenance and technical support of the SWS 120,000 pound IP-based commercial truck scales for the Disposal Utility. The commercial scales are a vital resource that must be properly maintained and certified in order to conduct commerce, and are essential in monitoring the amount of waste Anchorage generates. The Disposal Utility has four scales at two locations—the Central Transfer Station and Anchorage Regional Landfill—which weigh and process over 150,000 transactions annually. This information is used for a multitude of business purposes such as revenue accounting, budget forecasting, and estimated landfill life. The two SWS IT staff maintain all technology devices/equipment, and the associated software applications—nearly 200 networked and local devices running a multitude of applications (AD, SQL, IIS, Tower, Database, File, Print Server, and Antivirus Suites), along with numerous other hardware devices necessary to operate an efficient and safe, local and wide area network.
2013 Proposed Operating and Capital Budgets
SWS - 7
The SWS IT Staff also researches, evaluates, and implements existing and emerging technologies when deemed necessary, fiscally responsible, and/or becomes critical to operations. For example, in 2005 SWS completed a database conversion, and moved from a mainframe database in use since 1985 to a SQL platform, reducing software and hardware cost by $20,000 annually ($140,000 saved and still counting). The solid waste focused PC Scale Tower system that replaced the mainframe is not only less expensive to maintain, but also far more modern, scalable, and advanced than the previous system. It enables users to create and develop reports instantaneously. Current projects under evaluation include a Tower-integrated GPS system, landfill geotechnical systems to aid in proper compaction (less compacter passes, reclaimed air space, extends landfill life), and e-billing implementation. The IT Staff at SWS recognizes the importance of technology in relation to business, and they are committed to ensuring that business requirements drive that technology—not vise versa. The Safety Section. The Safety Section ensures that all operations are conducted in a safe manner. The Safety Section is responsible for compliance with OSHA safety standards by ensuring that the work environment is safe, as well as identifying and mitigating potential hazards for SWS employees and the public long before the hazard becomes an accident statistic. The Safety Section is responsible for the development, administration and enforcement of safety codes, rules and practices. The Safety Officer inspects buildings, projects, equipment, operating practices and working conditions for compliance with various Municipal, State and Federal safety codes and regulatory requirements. The Safety Officer coordinates safety programs in training, personal protective equipment, clothing and devices, as well as organizes and conducting seminars on first aid and OSHA required safety training. The Safety Officer prepares reports and makes recommendations for improvement. By analyzing data on accident rates and compensation claims, the Safety Officer develops methods to reduce costs, loss time and personnel suffering. Finance & Accounting Section. The Finance and Accounting section manages the financial matters of the two utilities, including the accounting for revenues and expenses, the preparation of budgets, asset management, capital expenditures, as well as providing financial reports to SWS managers, the Advisory Commission, the Administration and the Assembly. The Purchasing Accounts Payable & Payroll section. The Purchasing and Accounts Payable section is responsible for the procurement of and the payment for all equipment, supplies, and contracts, in coordination with other municipal departments. Two employees process all accounts payable for both utilities. Invoices are received, checked, account coded, approved and entered into PeopleSoft for payment. Purchase orders are initiated at SWS: verifying proper account codes and funding, attaching all supporting documentation, obtaining proper department approval and then forwarding the packets to MOA Purchasing for final approval. Over 100 SWS timecards are processed each week into the PeopleSoft system from the Kronos timekeeping system to ensure proper pay and cost of service coding. Other support duties include: ordering office supplies, processing travel authorizations, expense reports, incoming and outgoing mail, maintaining files, providing administrative support to supervisors and to
2013 Proposed Operating and Capital Budgets
SWS - 8

the SWS Advisory Commission. The SWS philosophy is to retain a small staff, while encouraging safety and dedication to a job well done.
2013 Proposed Operating and Capital Budgets
SWS - 9

Solid Waste Services Business Plan
Mission Provide management of our solid waste resources to create a safe and sustainable waste system for the Municipality of Anchorage (MOA) in a way that is economical and environmentally responsible. Services The Refuse Collection Utility provides garbage collection to the service area of the former City of Anchorage, which is approximately 20% of the population of the MOA. Since at least 1952 there has been mandatory service for all occupants of the Refuse Collections Utility service area. The Refuse Collections Utility provides three types of service: commercial dumpster, automated roll cart service, and can and bag service. The Solid Waste Disposal Utility serves the entire MOA. The services include the disposal of solid waste, the collection of household hazardous waste, and the promotion of community recycling. Municipal solid waste is received at three transfer stations located within MOA. The waste is then transported by the Utility to the Anchorage Regional Landfill for final disposal. Business Goals Provide exceptional customer service for an equitable cost to the customer. Ensure facilities are safe for the customers and for Solid Waste Services employees Provide proper disposal of hazardous waste for commercial and residential generators. Promote community involvement through education and be responsive to the needs and
concerns of municipal citizens. Use technology to optimize operations. Plan and prepare for current and future waste collection and disposal needs. Create incentives and programs to promote source reduction first, then recycling, then
treatment, and finally disposal as the preferred means to handle waste. Strategies to Achieve Goals Solid Waste Services strategic plan provides a framework to achieve results for customers. Refuse Collection Utility
1. Reduce refuse volumes by promoting waste reduction and increased curbside recycling diversion.
2. Reduce injuries associated with residential refuse collection. Disposal Utility
1. Optimize solid waste transfer truck utilization. 2. Setting rates that reflect the cost of services while maintaining infrastructure.
Performance Measures to Track Progress in Achieving Goals Solid Waste Services measures progress in achieving these goals using sets of quantifiable performance measures. Refuse Collections Utility
1. Percent change in recyclable material diverted from the residential waste stream. 2. Percent change in worker injuries.
2013 Proposed Operating and Capital Budgets
SWS - 10

Disposal Utility 1. Solid waste transfer truck payload weight. 2. Maintain positive revenue stream.
2013 Proposed Operating and Capital Budgets
SWS - 11

Disposal Utility Solid Waste Services
Anchorage: Performance. Value. Results. Mission
Dispose of municipal solid waste generated within the Municipality in compliance with state and federal regulations.
Core Services
Operate the Anchorage Regional Landfill (ARL) Operate the solid waste transfer stations and transfer fleet Promote community recycling efforts
Accomplishment Goals
Optimize solid waste transfer truck utilization Performance Measures
Progress in achieving goals shall be measured by: Solid waste transfer truck payload weight Transfer loads per driver shift
Measure #1: Average transfer payload rate
The following provides actual average payloads by month from January 2009 through June 2012.
Transfer Truck Loads
0
10
20
30
40
50
JAN FEB MAR APR MAY JUN JUL AUG SEP OCT NOV DEC
AV
ER
AG
E P
AY
LO
AD
(th
ou
san
d p
ou
nd
s)
2009 2010 2011 2012
2013 Proposed Operating and Capital Budgets
SWS - 12
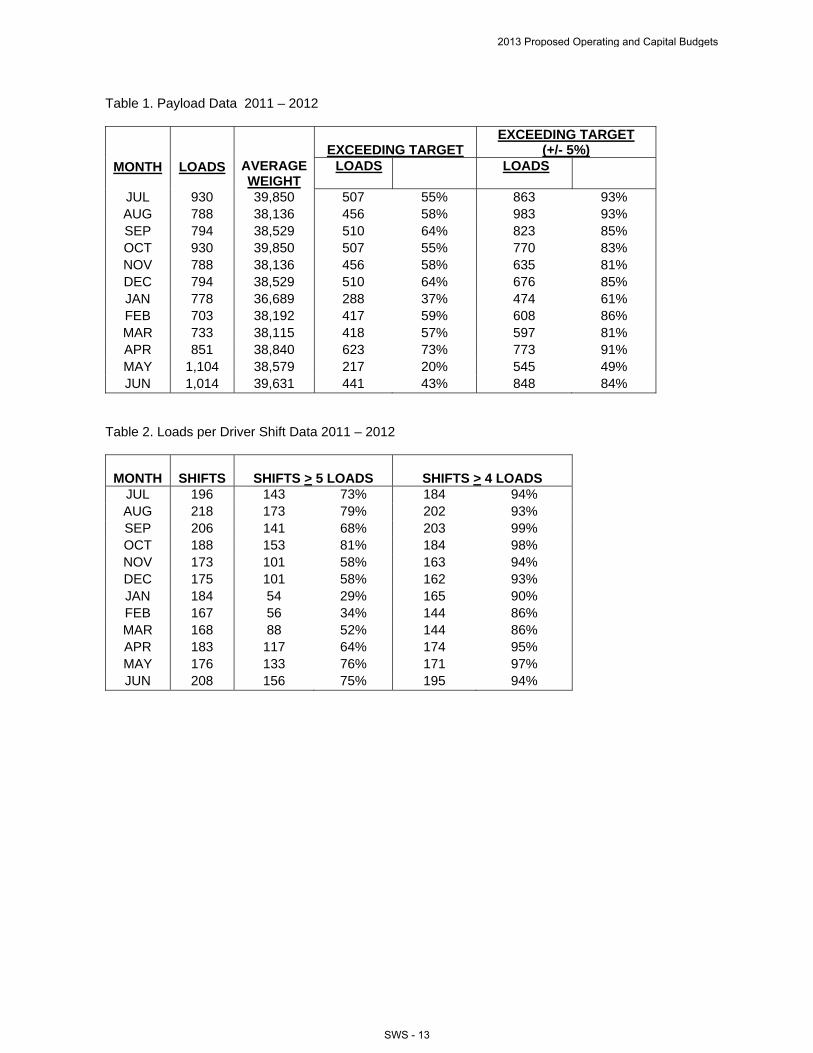
Table 1. Payload Data 2011 – 2012
EXCEEDING TARGET
EXCEEDING TARGET (+/- 5%)
MONTH LOADS
AVERAGE WEIGHT
LOADS LOADS
JUL 930 39,850 507 55% 863 93% AUG 788 38,136 456 58% 983 93% SEP 794 38,529 510 64% 823 85% OCT 930 39,850 507 55% 770 83% NOV 788 38,136 456 58% 635 81% DEC 794 38,529 510 64% 676 85% JAN 778 36,689 288 37% 474 61% FEB 703 38,192 417 59% 608 86% MAR 733 38,115 418 57% 597 81% APR 851 38,840 623 73% 773 91% MAY 1,104 38,579 217 20% 545 49% JUN 1,014 39,631 441 43% 848 84%
Table 2. Loads per Driver Shift Data 2011 – 2012
MONTH
SHIFTS
SHIFTS > 5 LOADS
SHIFTS > 4 LOADS
JUL 196 143 73% 184 94% AUG 218 173 79% 202 93% SEP 206 141 68% 203 99% OCT 188 153 81% 184 98% NOV 173 101 58% 163 94% DEC 175 101 58% 162 93% JAN 184 54 29% 165 90% FEB 167 56 34% 144 86% MAR 168 88 52% 144 86% APR 183 117 64% 174 95% MAY 176 133 76% 171 97% JUN 208 156 75% 195 94%
2013 Proposed Operating and Capital Budgets
SWS - 13

PVR Measure WC: Managing Workers' Compensation Claims
Reducing job-related injuries is a priority for the Administration by ensuring safe work conditions and safe practices. By instilling safe work practices we ensure not only the safety of our employees but reduce the potential for injuries and property damage to the public. The Municipality is self-insured and every injury poses a financial burden on the public and the injured worker's family. It just makes good sense to WORK SAFE.
Results are tracked by monitoring monthly reports issued by the Risk Management Division.
Workers' Compensation Claims
Solid Waste Services
0
50000
100000
150000
200000
250000
300000
350000
400000
450000
500000
12/31/2011 3/31/2012 6/30/2012
2013 Proposed Operating and Capital Budgets
SWS - 14
Refuse Collection Utility Solid Waste Services
Anchorage: Performance. Value. Results. Mission
Provide solid waste collection and disposal service to rate-paying customers within our defined service area.
Core Services Provide dumpster service to commercial and multifamily residential customers. Provide automated garbage and curbside recycle collection and disposal to
residential customers. Provide manual garbage collection to residential customers not serviced by
automated routes Accomplishment Goals
Reduce refuse disposal volumes by promoting waste reduction and increased curbside recycling diversion.
Reduce injuries associated with residential refuse collection. Performance Measures Progress in achieving these goals will be measured by:
Percent change in recyclable material diversion from the residential waste stream. Percent change in worker injuries
The following provides actual data from 2012 year-to-date and previous years which quantify these measures:
2013 Proposed Operating and Capital Budgets
SWS - 15

Measure #2: Increase curbside recycle diversion
SWS Refuse Collection Residential Waste and Recycle Tonnage
Automated Refuse / Recycle Collection
0
500
1,000
1,500
2,000
2,500
Q1 Q2 Q3 Q4 Q1 Q2 Q3 Q4 Q1 Q2 Q3 Q4 Q1 Q2
2009 2010 2011 2012
Ma
teri
al C
olle
cte
d (
ton
s)
0%
5%
10%
15%
20%
25%
30%
35%
All Routes - 2009 through 2012 YTD
Div
ers
ion
(%
)
Trash (tons) Recycle (tons) Recycling Rate
2013 Proposed Operating and Capital Budgets
SWS - 16

Measure #3: Improved safety for Refuse Collection Workers
Workers Comp Losses 2008 - 2012
Municipal Refuse Collection Utility
Service Injury 2008 2009 2010 2011 2012 (Q2)
Type Type Incidents Losses Incidents Losses Incidents Losses Incidents Losses Incidents Losses
TLI 4 $29,800 2 $76,898 2 $52,820 1 $17,771 0 $0 Manual Residential MO / RO 5 $799 7 $4,565 5 $0 1 $98 0 $0
TLI 0 $0 1 $1,735 0 $0 0 $0 0 $0 Automated Residential MO / RO 0 $0 2 $0 3 $0 1 $0 0 $0
TLI 0 $0 2 $45,750 2 $104,878 0 $0 0 $0 Commercial
MO / RO 0 $0 0 $0 2 $8,900 0 $0 2 $0
TLI 0 $0 0 $0 1 $83,339 0 $0 0 $0 Vehicle
Maintenance MO / RO 0 $0 2 $717 1 $0 0 $0 0 $0
TLI 0 $0 1 $85,571 0 $0 0 $0 0 $0 Other
MO / RO 0 $0 1 $0 0 $0 4 $2,806 0 $0
Total TLI 4 $29,800 6 $209,954 5 $241,037 1 $17,771 0 $0
MO / RO 5 $799 12 $5,282 11 $8,900 6 $2,904 2 $0
TLI = Time lost incident
MO = Incident required medical attention but no lost time
RO = Incident required no medical attention or lost time
2013 Proposed Operating and Capital Budgets
SWS - 17
Solid Waste Services Highlights and Future Events
Disposal Utility To compare prior years to the 2013 budget, the Disposal Utility 2013 total budget is projected at $20,663,958 compared to the 2012 approved budget of 20,203,063 and 2012 Proforma of $20,190,520. The 2013 budget is 2.3% higher than the 2012 approved budget. The increase is due to higher labor, repair, utility, and professional services costs. One important change in the amount to be appropriated by the Assembly is the removal of two non-cash items, depreciation and landfill closure expense, totaling $5,742,527. Depreciation expense is projected at $4,053,302 and the estimated landfill closure cost is $1,689,225. Although the budget appropriation excludes non-cash items, both depreciation and landfill closure costs will be included in the utility’s financial statements. Removing the $5,742,527 of non cash items from the total budget of $20,663,958, results in a 2013 appropriation budget of $14,921,431, 1.45% higher than the 2012 proforma (without non cash items). Total revenue for 2013 is projected at $21,015,168, compared to the 2012 Proforma revenue of $23,247,016, 4.2% higher than the 2012 budget, primarily due to the $5 per ton rate increase and to a one-time $2 million dollar grant for the construction of a landfill gas capital project. Despite the rate increase and the launch of the landfill gas project, a net income of $351,210 is forecast for 2013. With the higher anticipated expenses, an additional rate increase will likely be required in the future. With a capital budget of $8.2 million, 2013 capital projects include the construction of the next landfill cell, several leachate projects, and landfill equipment. Refuse Collection To compare prior years to the Refuse Collection 2013 budget, the Refuse Collection’s total operating budget is $9,017,187 compared to the 2012 Proforma $8,828,153 and the 2012 approved budget $8,849,093. The 2013 budget is 2% higher than the 2012 approved budget due to increasing labor, facility maintenance and heating costs. One important change in the amount to be appropriated by the Assembly is the removal of depreciation, a non cash item. The Refuse Collection budget authorization figure will exclude $949,166 of depreciation. Although the budget appropriation excludes non cash items, depreciation will be included in the utility’s financial statements.
2013 Proposed Operating and Capital Budgets
SWS - 18
Removing the $949,166 of depreciation from the total budget of $9,017,187, results in a 2013 appropriation budget of $8,068,027, 2% higher than the 2012 proforma (without depreciation). Total revenue for 2013 is projected at $9,471,575, compared to the 2012 Proforma revenue of $8,975,780, a 5.5% increase. The increase is due to a proposed increase for commercial dumpster rates. The estimated Refuse Collection net income is $454,387 for 2013. A capital budget of $1.7 million is proposed. Capital expenses include the purchase of three residential automated side load vehicles, and one commercial front load vehicle, as well as dumpsters for solid waste commercial customers.
2013 Proposed Operating and Capital Budgets
SWS - 19

Solid Waste Services External Impacts
Disposal SWS is scheduled to construct five new landfill cells at the Anchorage Regional Landfill before the end of 2020. The Utility anticipates utilizing the State of Alaska Clean Water Loans with a low interest rate and twenty year term, whenever possible. It is unknown if the program will be funded in the future; if the eligible expenses related to landfill construction will further limit use of these funds for construction; or if SWS will be awarded loans based on the program scoring criteria. Currently the total cost of the landfill expansion is over $38 million, with potential loan amounts estimated at $28 million to cover those costs. The Landfill Gas to Energy project will begin commercial operation in 2013. Revenue to the Disposal Utility derived from the sale of landfill gas to Doyon Utilities is based upon the purchase price for natural gas as reported by Chugach Electric to the Regulatory Commission of Alaska. Future revenues anticipated from this project will be based upon gas price projections by Chugach Electric and other area utilities, but the actual revenue generated will ultimately depend upon market price of natural gas in Southcentral Alaska. Currently Doyon Utilities Inc. holds a minor air quality permit which will allow continuous operation of three generating units at the landfill gas power plant on Fort Richardson. Doyon Utilities is in the process of applying for an additional permit to operate up to five generators. Until that permit is approved, landfill gas consumption at the facility will be limited to the operating annual hours in the current permit; limiting the amount of revenue which can be generated by the project. The duration of the permitting process is highly unpredictable.
2013 Proposed Operating and Capital Budgets
SWS - 20
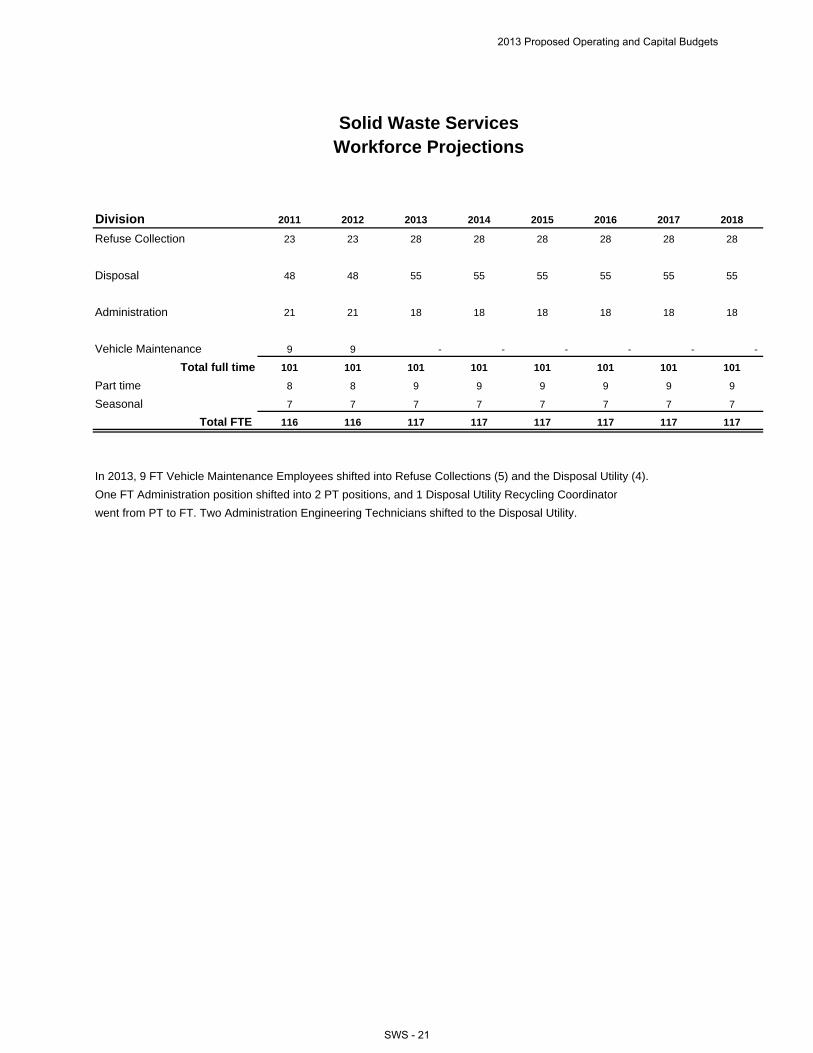
Division 2011 2012 2013 2014 2015 2016 2017 2018
Refuse Collection 23 23 28 28 28 28 28 28
Disposal 48 48 55 55 55 55 55 55
Administration 21 21 18 18 18 18 18 18
Vehicle Maintenance 9 9 - - - - - -
Total full time 101 101 101 101 101 101 101 101
Part time 8 8 9 9 9 9 9 9
Seasonal 7 7 7 7 7 7 7 7
Total FTE 116 116 117 117 117 117 117 117
In 2013, 9 FT Vehicle Maintenance Employees shifted into Refuse Collections (5) and the Disposal Utility (4).
One FT Administration position shifted into 2 PT positions, and 1 Disposal Utility Recycling Coordinator
went from PT to FT. Two Administration Engineering Technicians shifted to the Disposal Utility.
Solid Waste ServicesWorkforce Projections
2013 Proposed Operating and Capital Budgets
SWS - 21
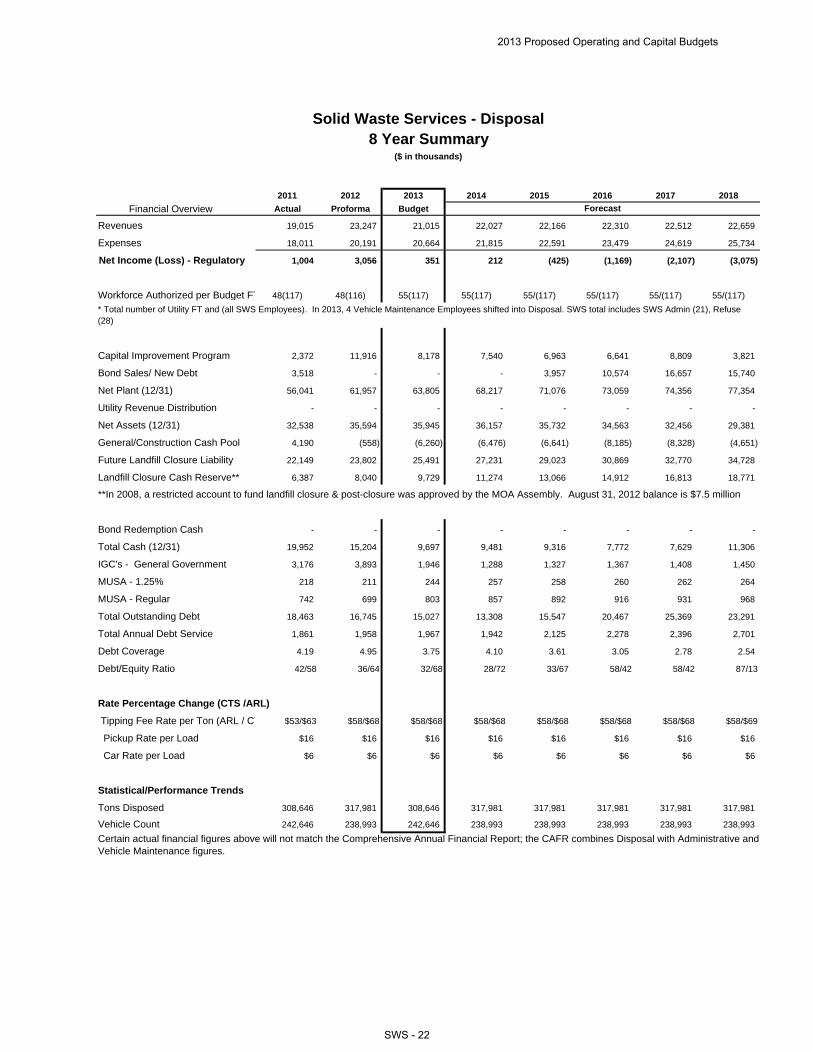
2011 2012 2013 2014 2015 2016 2017 2018
Financial Overview Actual Proforma Budget
Revenues 19,015 23,247 21,015 22,027 22,166 22,310 22,512 22,659
Expenses 18,011 20,191 20,664 21,815 22,591 23,479 24,619 25,734
Net Income (Loss) - Regulatory 1,004 3,056 351 212 (425) (1,169) (2,107) (3,075)
Workforce Authorized per Budget FT 48(117) 48(116) 55(117) 55(117) 55/(117) 55/(117) 55/(117) 55/(117)
Capital Improvement Program 2,372 11,916 8,178 7,540 6,963 6,641 8,809 3,821
Bond Sales/ New Debt 3,518 - - - 3,957 10,574 16,657 15,740
Net Plant (12/31) 56,041 61,957 63,805 68,217 71,076 73,059 74,356 77,354
Utility Revenue Distribution - - - - - - - -
Net Assets (12/31) 32,538 35,594 35,945 36,157 35,732 34,563 32,456 29,381
General/Construction Cash Pool 4,190 (558) (6,260) (6,476) (6,641) (8,185) (8,328) (4,651)
Future Landfill Closure Liability 22,149 23,802 25,491 27,231 29,023 30,869 32,770 34,728
Landfill Closure Cash Reserve** 6,387 8,040 9,729 11,274 13,066 14,912 16,813 18,771
Bond Redemption Cash - - - - - - - -
Total Cash (12/31) 19,952 15,204 9,697 9,481 9,316 7,772 7,629 11,306
IGC's - General Government 3,176 3,893 1,946 1,288 1,327 1,367 1,408 1,450
MUSA - 1.25% 218 211 244 257 258 260 262 264
MUSA - Regular 742 699 803 857 892 916 931 968
Total Outstanding Debt 18,463 16,745 15,027 13,308 15,547 20,467 25,369 23,291
Total Annual Debt Service 1,861 1,958 1,967 1,942 2,125 2,278 2,396 2,701
Debt Coverage 4.19 4.95 3.75 4.10 3.61 3.05 2.78 2.54
Debt/Equity Ratio 42/58 36/64 32/68 28/72 33/67 58/42 58/42 87/13
Rate Percentage Change (CTS /ARL)
Tipping Fee Rate per Ton (ARL / CT $53/$63 $58/$68 $58/$68 $58/$68 $58/$68 $58/$68 $58/$68 $58/$69
Pickup Rate per Load $16 $16 $16 $16 $16 $16 $16 $16
Car Rate per Load $6 $6 $6 $6 $6 $6 $6 $6
Statistical/Performance Trends
Tons Disposed 308,646 317,981 308,646 317,981 317,981 317,981 317,981 317,981
Vehicle Count 242,646 238,993 242,646 238,993 238,993 238,993 238,993 238,993
* Total number of Utility FT and (all SWS Employees). In 2013, 4 Vehicle Maintenance Employees shifted into Disposal. SWS total includes SWS Admin (21), Refuse (28)
**In 2008, a restricted account to fund landfill closure & post-closure was approved by the MOA Assembly. August 31, 2012 balance is $7.5 million
Certain actual financial figures above will not match the Comprehensive Annual Financial Report; the CAFR combines Disposal with Administrative and Vehicle Maintenance figures.
Solid Waste Services - Disposal8 Year Summary
($ in thousands)
Forecast
2013 Proposed Operating and Capital Budgets
SWS - 22
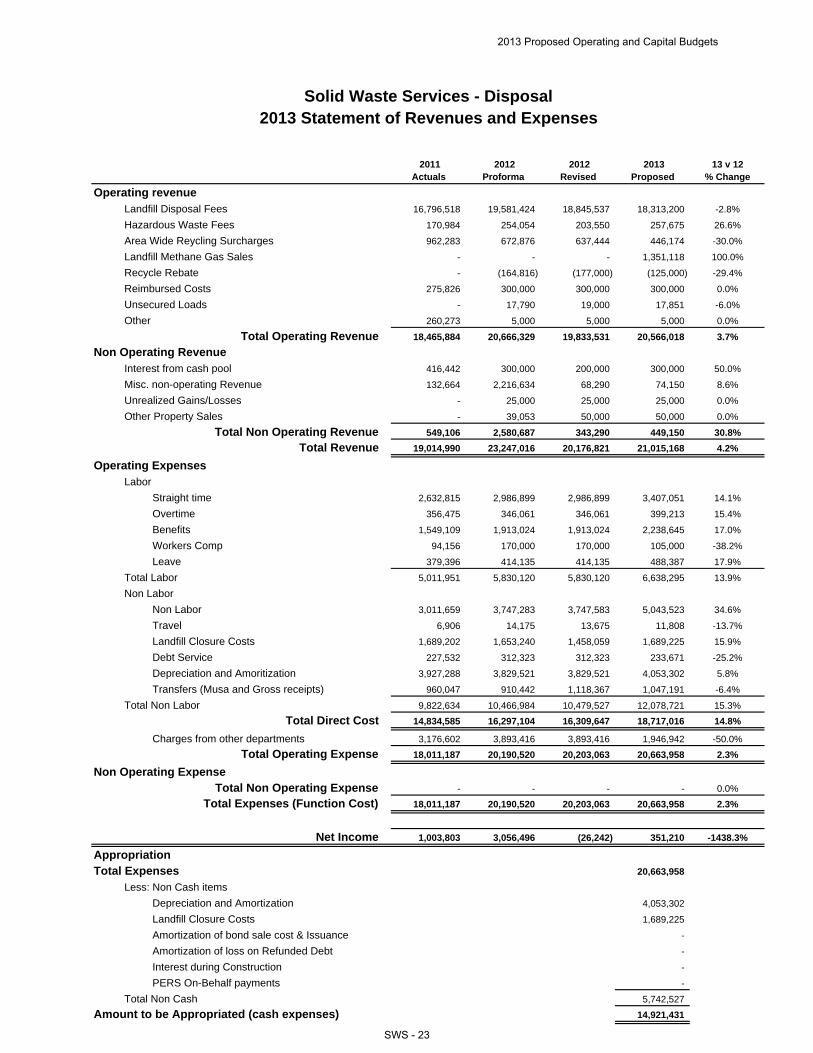
2011Actuals
2012Proforma
2012Revised
2013Proposed
13 v 12% Change
Operating revenueLandfill Disposal Fees 16,796,518 19,581,424 18,845,537 18,313,200 -2.8%
Hazardous Waste Fees 170,984 254,054 203,550 257,675 26.6%
Area Wide Reycling Surcharges 962,283 672,876 637,444 446,174 -30.0%
Landfill Methane Gas Sales - - - 1,351,118 100.0%
Recycle Rebate - (164,816) (177,000) (125,000) -29.4%
Reimbursed Costs 275,826 300,000 300,000 300,000 0.0%
Unsecured Loads - 17,790 19,000 17,851 -6.0%
Other 260,273 5,000 5,000 5,000 0.0%
Total Operating Revenue 18,465,884 20,666,329 19,833,531 20,566,018 3.7%
Non Operating RevenueInterest from cash pool 416,442 300,000 200,000 300,000 50.0%
Misc. non-operating Revenue 132,664 2,216,634 68,290 74,150 8.6%
Unrealized Gains/Losses - 25,000 25,000 25,000 0.0%
Other Property Sales - 39,053 50,000 50,000 0.0%
Total Non Operating Revenue 549,106 2,580,687 343,290 449,150 30.8%
Total Revenue 19,014,990 23,247,016 20,176,821 21,015,168 4.2%
Operating ExpensesLabor
Straight time 2,632,815 2,986,899 2,986,899 3,407,051 14.1%
Overtime 356,475 346,061 346,061 399,213 15.4%
Benefits 1,549,109 1,913,024 1,913,024 2,238,645 17.0%
Workers Comp 94,156 170,000 170,000 105,000 -38.2%
Leave 379,396 414,135 414,135 488,387 17.9%
Total Labor 5,011,951 5,830,120 5,830,120 6,638,295 13.9%
Non Labor
Non Labor 3,011,659 3,747,283 3,747,583 5,043,523 34.6%
Travel 6,906 14,175 13,675 11,808 -13.7%
Landfill Closure Costs 1,689,202 1,653,240 1,458,059 1,689,225 15.9%
Debt Service 227,532 312,323 312,323 233,671 -25.2%
Depreciation and Amoritization 3,927,288 3,829,521 3,829,521 4,053,302 5.8%
Transfers (Musa and Gross receipts) 960,047 910,442 1,118,367 1,047,191 -6.4%
Total Non Labor 9,822,634 10,466,984 10,479,527 12,078,721 15.3%
Total Direct Cost 14,834,585 16,297,104 16,309,647 18,717,016 14.8%
Charges from other departments 3,176,602 3,893,416 3,893,416 1,946,942 -50.0%
Total Operating Expense 18,011,187 20,190,520 20,203,063 20,663,958 2.3%
Non Operating ExpenseTotal Non Operating Expense - - - - 0.0%
Total Expenses (Function Cost) 18,011,187 20,190,520 20,203,063 20,663,958 2.3%
Net Income 1,003,803 3,056,496 (26,242) 351,210 -1438.3%
AppropriationTotal Expenses 20,663,958
Less: Non Cash items
Depreciation and Amortization 4,053,302
Landfill Closure Costs 1,689,225
Amortization of bond sale cost & Issuance -
Amortization of loss on Refunded Debt -
Interest during Construction -
PERS On-Behalf payments -
Total Non Cash 5,742,527
Amount to be Appropriated (cash expenses) 14,921,431
Solid Waste Services - Disposal2013 Statement of Revenues and Expenses
2013 Proposed Operating and Capital Budgets
SWS - 23
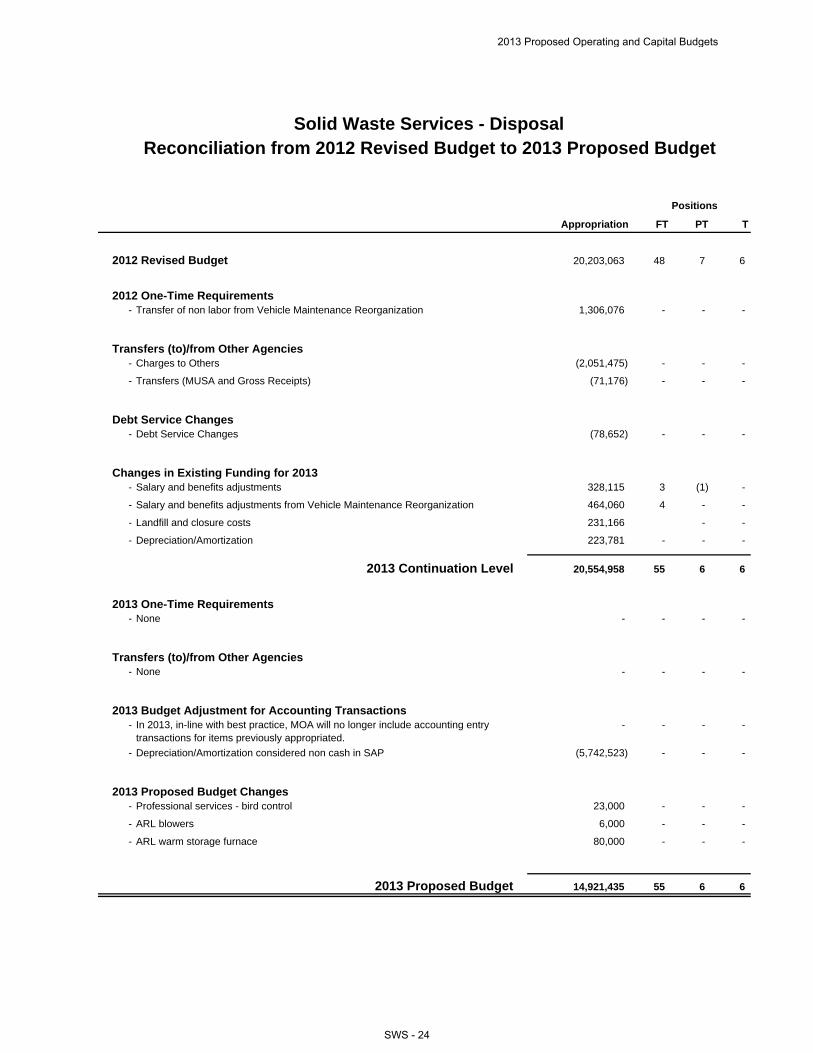
Appropriation FT PT T
20,203,063 48 7 6
- Transfer of non labor from Vehicle Maintenance Reorganization 1,306,076 - - -
- Charges to Others (2,051,475) - - -
- Transfers (MUSA and Gross Receipts) (71,176) - - -
- Debt Service Changes (78,652) - - -
- Salary and benefits adjustments 328,115 3 (1) -
- Salary and benefits adjustments from Vehicle Maintenance Reorganization 464,060 4 - -
- Landfill and closure costs 231,166 - -
- Depreciation/Amortization 223,781 - - -
20,554,958 55 6 6
- None - - - -
- None - - - -
- In 2013, in-line with best practice, MOA will no longer include accounting entry transactions for items previously appropriated.
- - - -
- Depreciation/Amortization considered non cash in SAP (5,742,523) - - -
- Professional services - bird control 23,000 - - -
- ARL blowers 6,000 - - -
- ARL warm storage furnace 80,000 - - -
2013 Proposed Budget 14,921,435 55 6 6
Solid Waste Services - Disposal
Debt Service Changes
Changes in Existing Funding for 2013
Transfers (to)/from Other Agencies
2012 Revised Budget
2012 One-Time Requirements
Positions
Reconciliation from 2012 Revised Budget to 2013 Proposed Budget
2013 Continuation Level
Transfers (to)/from Other Agencies
2013 One-Time Requirements
2013 Proposed Budget Changes
2013 Budget Adjustment for Accounting Transactions
2013 Proposed Operating and Capital Budgets
SWS - 24
Full Time Full Time Part Time
- - 3
- - -
- - -
- - -
- - -
- - -
- - 4
- - -
- - -
- - -
- - -
- - 1
- - 2
- - 1
- - -
- - 1
- - 12
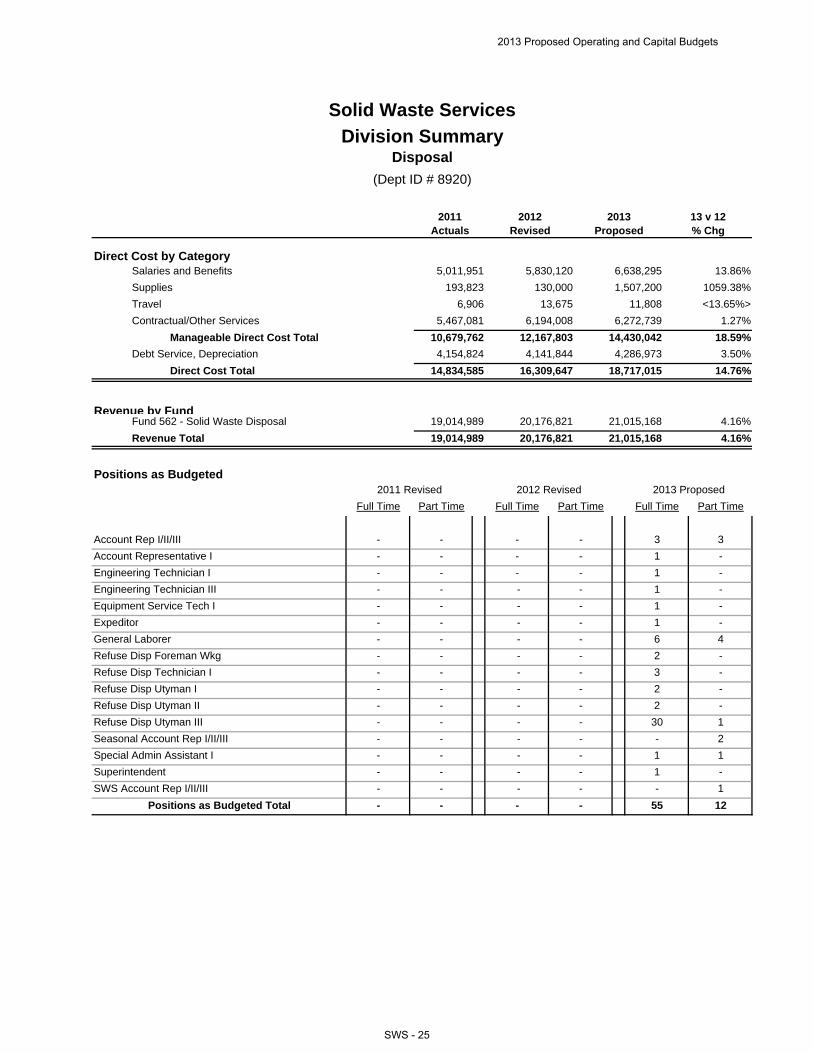
Solid Waste Services
Division SummaryDisposal
(Dept ID # 8920)
2011Actuals
2012Revised
2013Proposed
13 v 12% Chg
Salaries and Benefits 5,011,951 5,830,120 6,638,295 13.86%Direct Cost by Category
1059.38%
Travel 6,906 13,675 11,808 <13.65%>
Supplies 193,823 130,000 1,507,200
1.27%
Manageable Direct Cost Total 10,679,762 12,167,803 14,430,042 18.59%
Contractual/Other Services 5,467,081 6,194,008 6,272,739
3.50%
Direct Cost Total 14,834,585 16,309,647 18,717,015 14.76%
Debt Service, Depreciation 4,154,824 4,141,844 4,286,973
Revenue by Fund4.16%
Revenue Total 19,014,989 20,176,821 21,015,168 4.16%
Fund 562 - Solid Waste Disposal 19,014,989 20,176,821 21,015,168
Positions as Budgeted2011 Revised 2012 Revised 2013 Proposed
Part Time Part Time Full Time
Account Rep I/II/III - - 3
Account Representative I - - 1
Engineering Technician I - - 1
Engineering Technician III - - 1
Equipment Service Tech I - - 1
Expeditor - - 1
General Laborer - - 6
Refuse Disp Foreman Wkg - - 2
Refuse Disp Technician I - - 3
Refuse Disp Utyman I - - 2
Refuse Disp Utyman II - - 2
Refuse Disp Utyman III - - 30
Seasonal Account Rep I/II/III - - -
Special Admin Assistant I - - 1
Superintendent - - 1
SWS Account Rep I/II/III - - -
Positions as Budgeted Total - - 55
2013 Proposed Operating and Capital Budgets
SWS - 25

Direct Cost by CategorySalaries and Benefits
1101 - Straight Time Labor 2,632,815 2,986,899 3,405,395 14.01%
1201 - Overtime 356,475 346,061 399,213 15.36%
1301 - Leave/Holiday Accruals 473,552 584,135 640,662 9.68%
1401 - Benefits 1,543,655 1,906,525 2,186,525 14.69%
1501 - Allow Differentials/Premiums 5,455 6,500 6,500 -
Salaries and Benefits Total 5,011,951 5,830,120 6,638,295 13.86%
Supplies 193,823 130,000 1,507,200 1059.38%
Travel 6,906 13,675 11,808 <13.65%>
Contractual/Other Services 5,467,081 6,194,008 6,272,739 1.27%
Manageable Direct Cost Total 10,679,762 12,167,803 14,430,042 18.59%
Debt Service, Depreciation 4,154,824 4,141,844 4,286,973 3.50%
Direct Cost Total 14,834,585 16,309,647 18,717,015 14.76%
Intra-Governmental ChargesCharges By Other Departments 3,304,341 3,956,516 2,037,750 <48.50%>
Charges to Other Departments (127,740) (63,100) (90,808) 43.91%
Program Generated Revenue9494 - Copier Fees 108 - - -
9499 - Reimbursed Cost 275,826 300,000 300,000 -
9521 - Landfill Fees 16,886,985 18,845,537 18,313,200 <2.82%>
9522 - Recycle Rebate (90,467) (177,000) (125,000) <29.38%>
9524 - Hazardous Waste Fees 170,984 107,500 160,000 48.84%
9526 - Used Oil Fees 1,157 1,050 675 <35.71%>
9527 - Refrigerant Handling Fees 84,260 87,000 88,000 1.15%
9528 - E Waste 8,342 8,000 9,000 12.50%
9532 - Misc Non-Operating Income 77,419 68,290 74,150 8.58%
9535 - Unsecured Loads 17,390 19,000 17,851 <6.05%>
9536 - Late Fees 3,495 5,000 5,000 -
9537 - Community Recycle Residential 153,299 87,037 155,700 78.89%
9538 - Community Recycle Commercial 808,984 550,407 290,474 <47.23%>
9539 - Landfill Methande Gas Sales - - 1,351,118 -
9672 - Prior Yr Expense Recovery 166,514 - - -
9742 - Other Property Sales 2,400 50,000 50,000 -
9743 - Gain/Loss Sale Property - - - -
9761 - Cash Pools Short-Term Int 416,442 200,000 300,000 50.00%
9767 - Unrealized Gains & Losses 31,930 25,000 25,000 -
9791 - Cash Over & Short (78) - - -
Program Generated Revenue Total 19,014,989 20,176,821 21,015,168 4.16%
Solid Waste ServicesDivision Detail
(Dept ID # 8920)
Disposal
2012Revised
2013Proposed
2011Actuals
13 v 12% Chg
2013 Proposed Operating and Capital Budgets
SWS - 26
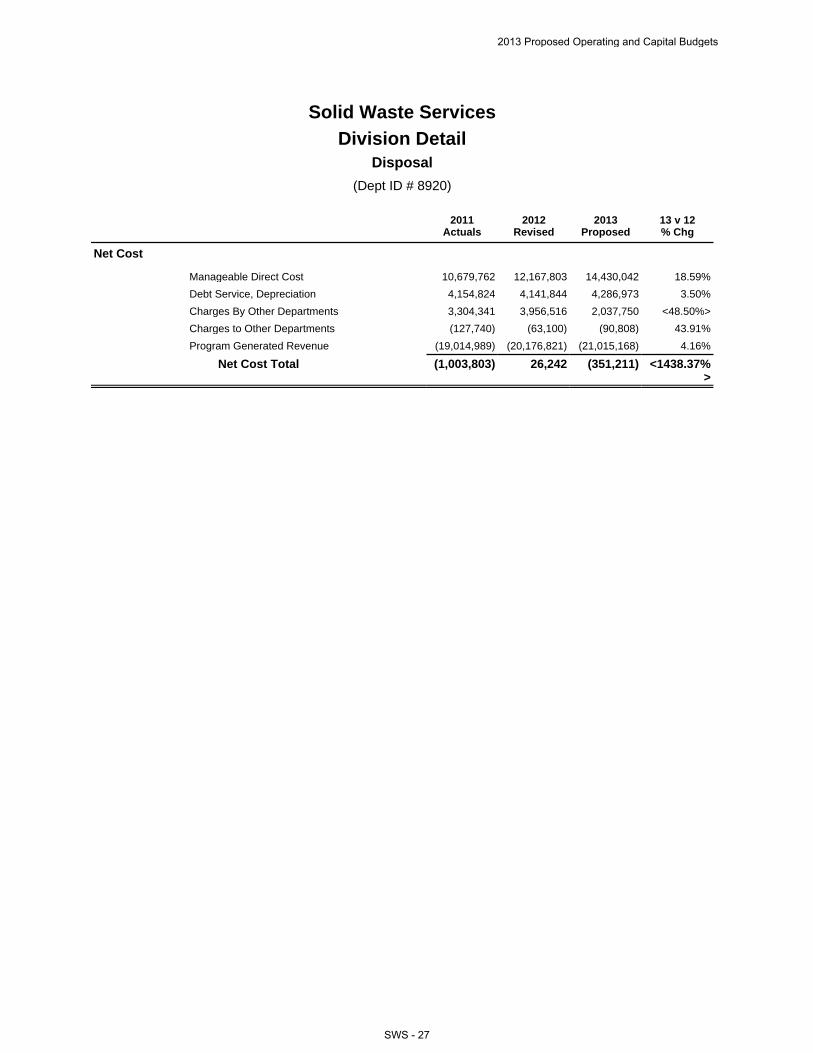
Net Cost
Manageable Direct Cost 10,679,762 12,167,803 14,430,042 18.59%
Debt Service, Depreciation 4,154,824 4,141,844 4,286,973 3.50%
Charges By Other Departments 3,304,341 3,956,516 2,037,750 <48.50%>
Charges to Other Departments (127,740) (63,100) (90,808) 43.91%
Program Generated Revenue (19,014,989) (20,176,821) (21,015,168) 4.16%
Net Cost Total (1,003,803) 26,242 (351,211) <1438.37%>
Solid Waste ServicesDivision Detail
(Dept ID # 8920)
Disposal
2012Revised
2013Proposed
2011Actuals
13 v 12% Chg
2013 Proposed Operating and Capital Budgets
SWS - 27

Project Category 2013 2014 2015 2016 2017 2018 TotalEquipment 2,073 1,761 3,918 3,332 1,448 2,902 15,434 ARL Landfill Cell Construction 4,165 4,185 - 2,484 6,536 93 17,463 ARL & CTS Improvements 1,840 1,569 3,020 800 800 801 8,830 Office Equipment 100 25 25 25 25 25 225
Total 8,178 7,540 6,963 6,641 8,809 3,821 41,952
Source of Funding 2013 2014 2015 2016 2017 2018 TotalClean Water Loan - 4,165 4,185 - - 6,536 14,886 Commercial Loan - - - 4,000 7,000 - 11,000 Equity/Operations 8,178 3,375 2,778 2,641 1,809 (2,715) 16,066
Total 8,178 7,540 6,963 6,641 8,809 3,821 41,952
Solid Waste Services - Disposal 2013 - 2018 Capital Improvement Program
(in thousands)
2013 Proposed Operating and Capital Budgets
SWS - 28
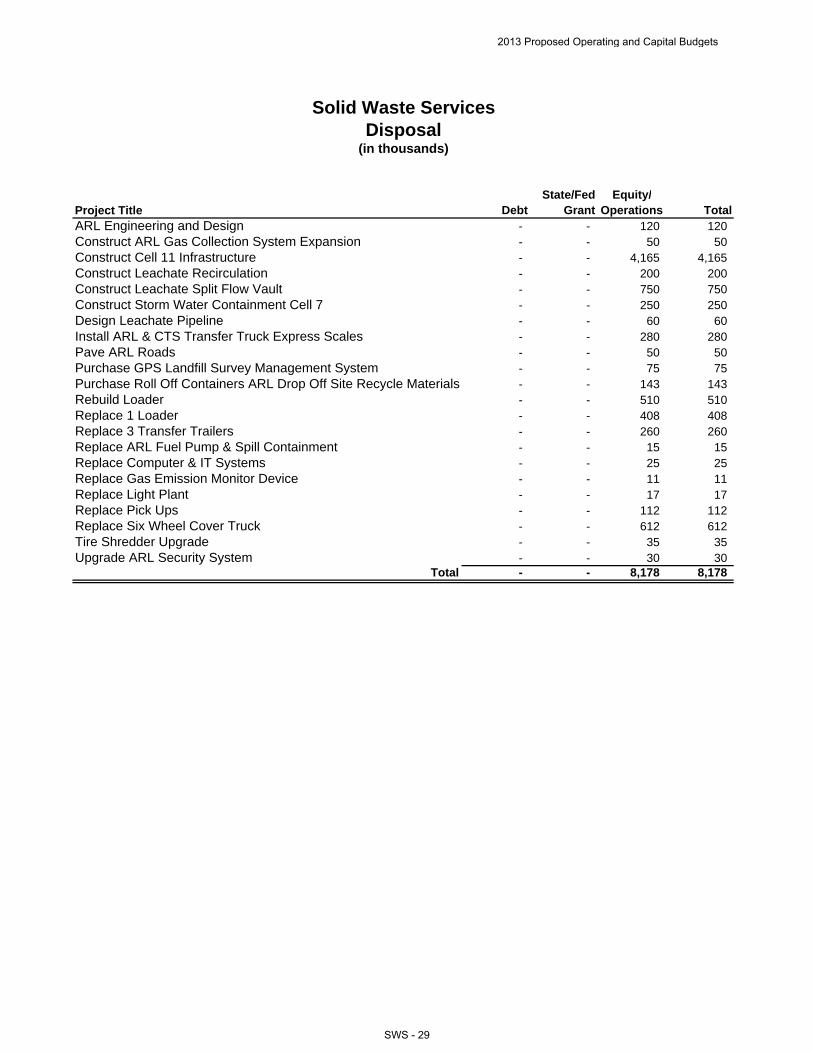
Project Title DebtState/Fed
GrantEquity/
Operations TotalARL Engineering and Design - - 120 120 Construct ARL Gas Collection System Expansion - - 50 50 Construct Cell 11 Infrastructure - - 4,165 4,165 Construct Leachate Recirculation - - 200 200 Construct Leachate Split Flow Vault - - 750 750 Construct Storm Water Containment Cell 7 - - 250 250 Design Leachate Pipeline - - 60 60 Install ARL & CTS Transfer Truck Express Scales - - 280 280 Pave ARL Roads - - 50 50 Purchase GPS Landfill Survey Management System - - 75 75 Purchase Roll Off Containers ARL Drop Off Site Recycle Materials - - 143 143 Rebuild Loader - - 510 510 Replace 1 Loader - - 408 408 Replace 3 Transfer Trailers - - 260 260 Replace ARL Fuel Pump & Spill Containment - - 15 15 Replace Computer & IT Systems - - 25 25 Replace Gas Emission Monitor Device - - 11 11 Replace Light Plant - - 17 17 Replace Pick Ups - - 112 112 Replace Six Wheel Cover Truck - - 612 612 Tire Shredder Upgrade - - 35 35 Upgrade ARL Security System - - 30 30
Total - - 8,178 8,178
Solid Waste Services
(in thousands)Disposal
2013 Proposed Operating and Capital Budgets
SWS - 29

2011 2012 2013
Actual Proforma Budget
Cash Flows From Operating Activities
Receipts from Customers 18,810,500 22,907,964 20,665,168
Payments to Employees (4,854,216) (5,660,120) (6,533,295)
Payments to Vendors (6,190,805) (7,824,874) (7,107,273)
Net Cash Provided by Operating Activities 7,765,479 9,422,970 7,024,600
Cash Flows From Non Capital and Related Financing Activities
Intergovernmental Revenue
Transfers to Other Funds (964,047) (910,442) (1,047,191)
Transfers from Other Funds - - -
Net Cash Used by Non-Capital and Related Financing Activities (964,047) (910,442) (1,047,191)
Cash Flows From Capital and Related Financing Activities
Proceeds from Grants - 2,000,000 -
Proceeds from Clean Water Loans - - -
Proceeds from Commercial Loans - - -
Principal Payments on Long-Term Obligations 2,343,855 (1,718,267) (1,718,267)
Interest Payments on Long-Term Obligations (241,791) (312,323) (248,985)
Acquisition and Construction of Capital Assets (2,372,205) (11,916,020) (8,177,844)
Landfill Post Closure Cash Reserve (1,790,024) (1,653,240) (1,689,225)
Gain on Asset Impairment - - -
Proceeds from Disposition of Capital Assets 2,402 39,052 50,000
Net Cash Used by Capital and Related Financing Activities (2,057,763) (13,560,797) (11,784,321)
Cash Flows From Investing Activities
Proceeds from Sale of Investments - - -
Investment Income (Loss) 416,636 300,000 300,000
Net Cash Provided (Used) by Investing Activities 416,636 300,000 300,000
Net Increase in Cash 5,160,305 (4,748,270) (5,506,913)
Cash, Beginning of Year 14,791,891 19,952,196 15,203,926
Cash, End of Year 19,952,196 15,203,926 9,697,014
Reserved Landfill Closure Account, End of Year 6,387,183 8,040,423 9,729,648
Components of Cash
Cash and Cash Equivalents 11,053,248 15,203,426 9,696,514
Capital Acquisition and Construction Accounts 8,898,948 500 500
Cash and Cash Equivalents, End of Year 19,952,196 15,203,926 9,697,014
Solid Waste Services - DisposalStatement of Cash Sources and Uses
2013 Proposed Operating and Capital Budgets
SWS - 30

2011 2012 2013
Actual Proforma Budget
Solid Waste Services - DisposalStatement of Cash Sources and Uses
Reconciliation of Operating Income (Loss) to Net Cash Provided By Operating Activities
Operating Activities
Operating Income (Loss) 1,744,610 3,940,209 1,282,073
Adjustments to Reconcile Operating Income (Loss) to Net Cash
Provided by Operating Activities:
Depreciation 3,927,288 3,829,521 4,053,302
Amortization of Landfill Closure Costs 1,689,202 1,653,240 1,689,225
Changes in Assets and Liabilities Which Increase (Decrease) Cash:
Accounts Receivable 246,282 - -
Prepaid Items and Deposits (654) - -
Accounts Payable 95,171 - -
Compensated Absences Payable 23,588 - -
Accrued Payroll Liabilities Payable 39,992 - -
Net Pension and Other Postemployment Benefits Obligation - -
Net Cash Provided by Operating Activities 7,765,479 9,422,970 7,024,600
Non Cash Investing, Capital and Financing Activities
Capital Purchases on Account - - -
Deferred Refunding Loss - - -
2013 Proposed Operating and Capital Budgets
SWS - 31

2011 2012 2013 2014 2015 2016 2017 2018
Financial Overview Actual Proforma Budget
Revenues 8,963 8,976 9,472 9,472 9,472 9,472 9,472 9,472
Expenses 8,292 8,828 9,017 9,456 9,867 10,191 10,433 10,555
Net Income (Loss) - Regulatory 671 148 455 16 (395) (719) (961) (1,083)
Workforce Authorized per Budget FT* 23 (117) 23(116) 28 (117) 28 (117) 28 (117) 28 (117) 28 (117) 28 (117)
Capital Improvement Program 133 1,206 1,703 1,699 1,459 1,612 1,811 1,633
Bond Sales - - - - - - - -
Net Plant (12/31) 3,524 3,525 3,950 4,073 5,190 5,200 5,214 5,363
Utility Revenue Distribution - - - - - - - -
Net Assets (12/31) 10,476 10,620 11,080 11,100 10,710 9,990 9,030 7,950
General/Construction Cash Pool 6,584 6,440 5,870 5,136 4,495 3,612 2,439 1,385
IGC's - General Government 1,050 907 835 860 885 912 939 968
MUSA - 1.25% - - - - - - - -
MUSA - Regular 64 55 59 71 78 78 78 80
Total Outstanding Debt - - - - - - - -
Total Annual Debt Service - - - - - - - -
Debt Service Coverage N/A N/A N/A N/A N/A N/A N/A N/A
Debt/Equity Ratio 0/100 0/100 0/100 0/100 0/100 0/100 0/100 0/100
Rate Change Percentage 16.69%
Residential Rate per month**
Commercial Rate (3Yd-1 per wk) $85.70 $85.70 $100.00 $100.00 $100.00 $100.00 $100.00 $100.00
Statistical/Performance Trends
Waste Collected (Tons) 38,495 38,495 38,495 38,495 38,495 38,495 38,495 38,495
Average Residential Services 12,120 12,120 12,120 12,120 12,120 12,120 12,120 12,120
Average Dumpsters Services 4,063 4,063 4,063 4,063 4,063 4,063 4,063 4,063
Forecast
* Total number of Utility FT and (all SWS Employees). In 2013, 5 Vehicle Maintenance Employees shifted into Refuse Collection. SWS total includes SWS Admin (21), Disposal (67)
**Phasing in automated collection: changing from flat rates to variable pay-as-you-throw rates eliminates the $18.25 flat fee and allows choices for rates ranging from $14.10 - $36.50 per month, depending upon roll cart size selection. Final phase roll out in 2013.
Solid Waste Services - Refuse Collection8 Year Summary
($ in thousands)
$14.10 - $36.50 pay as you throw variable residential rates
2013 Proposed Operating and Capital Budgets
SWS - 32
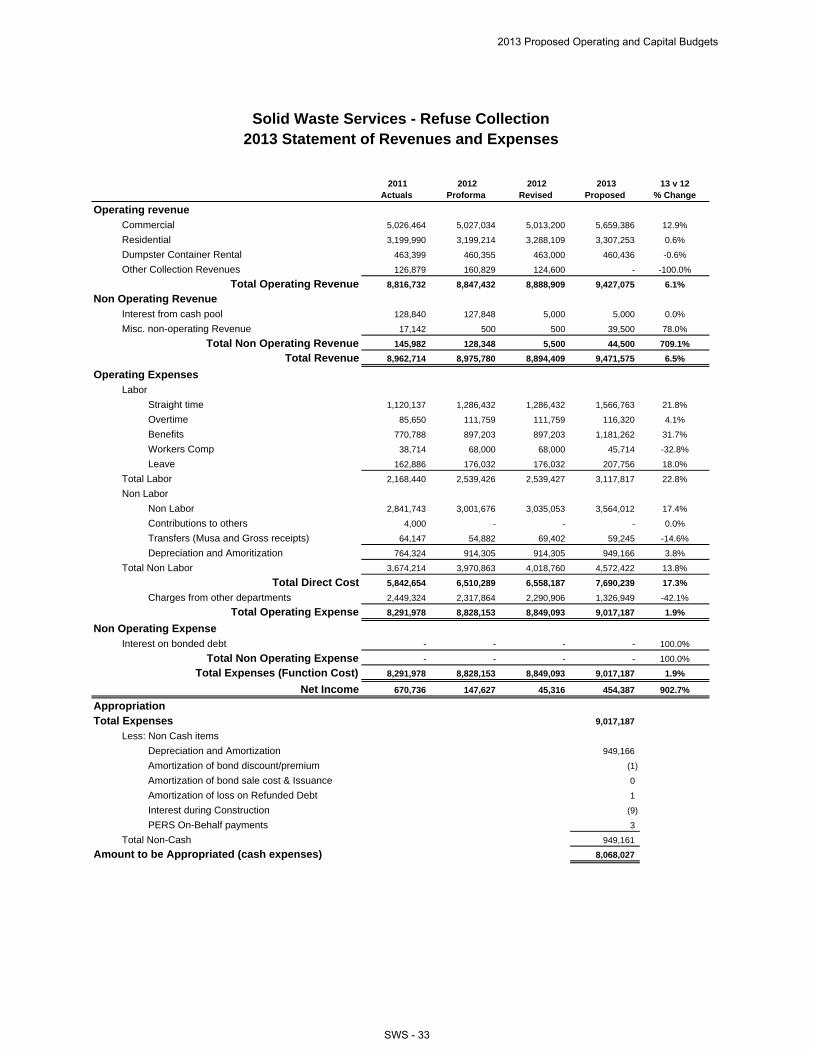
2011Actuals
2012Proforma
2012Revised
2013Proposed
13 v 12% Change
Operating revenueCommercial 5,026,464 5,027,034 5,013,200 5,659,386 12.9%
Residential 3,199,990 3,199,214 3,288,109 3,307,253 0.6%
Dumpster Container Rental 463,399 460,355 463,000 460,436 -0.6%
Other Collection Revenues 126,879 160,829 124,600 - -100.0%
Total Operating Revenue 8,816,732 8,847,432 8,888,909 9,427,075 6.1%
Non Operating RevenueInterest from cash pool 128,840 127,848 5,000 5,000 0.0%
Misc. non-operating Revenue 17,142 500 500 39,500 78.0%
Total Non Operating Revenue 145,982 128,348 5,500 44,500 709.1%
Total Revenue 8,962,714 8,975,780 8,894,409 9,471,575 6.5%
Operating ExpensesLabor
Straight time 1,120,137 1,286,432 1,286,432 1,566,763 21.8%
Overtime 85,650 111,759 111,759 116,320 4.1%
Benefits 770,788 897,203 897,203 1,181,262 31.7%
Workers Comp 38,714 68,000 68,000 45,714 -32.8%
Leave 162,886 176,032 176,032 207,756 18.0%
Total Labor 2,168,440 2,539,426 2,539,427 3,117,817 22.8%
Non Labor
Non Labor 2,841,743 3,001,676 3,035,053 3,564,012 17.4%
Contributions to others 4,000 - - - 0.0%
Transfers (Musa and Gross receipts) 64,147 54,882 69,402 59,245 -14.6%
Depreciation and Amoritization 764,324 914,305 914,305 949,166 3.8%
Total Non Labor 3,674,214 3,970,863 4,018,760 4,572,422 13.8%
Total Direct Cost 5,842,654 6,510,289 6,558,187 7,690,239 17.3%
Charges from other departments 2,449,324 2,317,864 2,290,906 1,326,949 -42.1%
Total Operating Expense 8,291,978 8,828,153 8,849,093 9,017,187 1.9%
Non Operating ExpenseInterest on bonded debt - - - - 100.0%
Total Non Operating Expense - - - - 100.0%
Total Expenses (Function Cost) 8,291,978 8,828,153 8,849,093 9,017,187 1.9%
Net Income 670,736 147,627 45,316 454,387 902.7%
AppropriationTotal Expenses 9,017,187
Less: Non Cash items
Depreciation and Amortization 949,166
Amortization of bond discount/premium (1)
Amortization of bond sale cost & Issuance 0
Amortization of loss on Refunded Debt 1
Interest during Construction (9)
PERS On-Behalf payments 3
Total Non-Cash 949,161
Amount to be Appropriated (cash expenses) 8,068,027
Solid Waste Services - Refuse Collection2013 Statement of Revenues and Expenses
2013 Proposed Operating and Capital Budgets
SWS - 33

Appropriation FT PT T
8,849,093 23 - 1
- Transfer of non labor from Vehicle Maintenance Reorganization 527,775 5 - -
- Charges to Others (1,238,569) - - -
- Transfers (MESA and Gross Receipts) (10,157)
- Depreciation/Amortization 34,861 - - -
- Salary and benefits adjustments 144,847 - - -
- Salary and benefits adjustments from Vehicle Maintenance Reorganization 455,828 - - -
- - -
8,763,678 28 - 1
- None - - - -
- None - - - -
- In 2013, in-line with best practice, MOA will no longer include accounting entry transactions for items previously appropriated.
- - - -
- Depreciation (949,161) - - -
- Non Labor 264,015 - - -
- Curbside Recycling Tipping Fee RocTenn from $15 to $10/ton (10,505) - - -
2013 Proposed Budget 8,068,027 28 - 1
Solid Waste Services - Refuse Collection
Debt Service Changes
Changes in Existing Programs/Funding for 2013
Transfers (to)/from Other Agencies
2012 Revised Budget
Transfers (to)/from Other Agencies
2013 One-Time Requirements
2013 Proposed Budget Changes
2013 Budget Adjustment for Accounting Transactions
2012 One-Time Requirements
Reconciliation from 2012 Revised Budget to 2013 Proposed Budget
Positions
2013 Continuation Level
2013 Proposed Operating and Capital Budgets
SWS - 34

Full Time Full Time Part Time
- - -
- - -
- - -
- - -
- - -
- - -
- - -
- - -
- - -
- - -
- - -
- - -
- - -
- - -
- - 1
- - 1
Swamper - - 3
Positions as Budgeted Total - - 28
Route Coordinator - - 1
Sideloader Operator - - 1
Refuse Repair Technician - - 1
Res Refuse Equipment Operator - - 4
Parts Warehouser II - - 1
Refuse Collection Foreman Wkg - - -
Expeditor - - 1
General Foreman - - 1
Equipment Tech Foreman Wkg - - 1
Equipment Technician - - 2
Dispatch Technician - - 1
Equipment Service Tech I - - 1
Automated Sideloader Operator - - 4
Commercial Refuse Equipment Op - - 6
Part Time Part Time Full Time
6.49%
Fund 560 - Refuse
2011 Revised 2012 Revised 2013 ProposedPositions as Budgeted
6.49%
Revenue Total 8,962,693 8,894,409 9,471,575
17.24%
Debt Service, Depreciation
8,962,693 8,894,409 9,471,575Revenue by Fund
19.42%
Contractual/Other Services
3.81%
Direct Cost Total 5,842,653 6,559,186 7,690,240
Supplies
764,323 914,306 949,166
Manageable Direct Cost Total 5,078,330 5,644,880 6,741,074
Travel 189 3,160 3,163
2,804,807 3,048,144 3,115,244
849.86%
0.09%
2.20%
Salaries and Benefits 2,168,440 2,540,426 3,117,817
104,893 53,150 504,850
22.73%
(Dept ID # 8950)
2011Actuals
2012Revised
2013Proposed
13 v 12% Chg
Direct Cost by Category
Solid Waste ServicesDivision Summary
Refuse
2013 Proposed Operating and Capital Budgets
SWS - 35
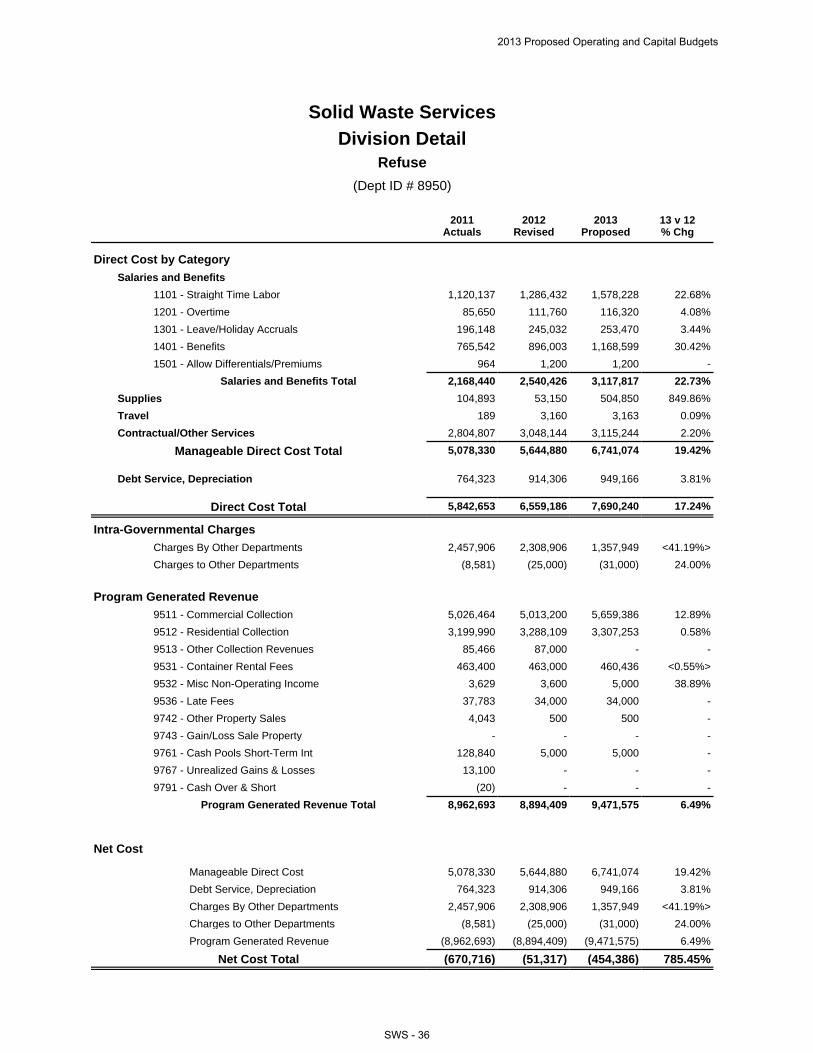
Net Cost
Manageable Direct Cost 5,078,330 5,644,880 6,741,074 19.42%
Debt Service, Depreciation 764,323 914,306 949,166 3.81%
Charges By Other Departments 2,457,906 2,308,906 1,357,949 <41.19%>
Charges to Other Departments (8,581) (25,000) (31,000) 24.00%
Program Generated Revenue (8,962,693) (8,894,409) (9,471,575) 6.49%
Net Cost Total (670,716) (51,317) (454,386) 785.45%
Direct Cost by CategorySalaries and Benefits
1101 - Straight Time Labor 1,120,137 1,286,432 1,578,228 22.68%
1201 - Overtime 85,650 111,760 116,320 4.08%
1301 - Leave/Holiday Accruals 196,148 245,032 253,470 3.44%
1401 - Benefits 765,542 896,003 1,168,599 30.42%
1501 - Allow Differentials/Premiums 964 1,200 1,200 -
Salaries and Benefits Total 2,168,440 2,540,426 3,117,817 22.73%
Supplies 104,893 53,150 504,850 849.86%
Travel 189 3,160 3,163 0.09%
Contractual/Other Services 2,804,807 3,048,144 3,115,244 2.20%
Manageable Direct Cost Total 5,078,330 5,644,880 6,741,074 19.42%
Debt Service, Depreciation 764,323 914,306 949,166 3.81%
Direct Cost Total 5,842,653 6,559,186 7,690,240 17.24%
Intra-Governmental ChargesCharges By Other Departments 2,457,906 2,308,906 1,357,949 <41.19%>
Charges to Other Departments (8,581) (25,000) (31,000) 24.00%
Program Generated Revenue9511 - Commercial Collection 5,026,464 5,013,200 5,659,386 12.89%
9512 - Residential Collection 3,199,990 3,288,109 3,307,253 0.58%
9513 - Other Collection Revenues 85,466 87,000 - -
9531 - Container Rental Fees 463,400 463,000 460,436 <0.55%>
9532 - Misc Non-Operating Income 3,629 3,600 5,000 38.89%
9536 - Late Fees 37,783 34,000 34,000 -
9742 - Other Property Sales 4,043 500 500 -
9743 - Gain/Loss Sale Property - - - -
9761 - Cash Pools Short-Term Int 128,840 5,000 5,000 -
9767 - Unrealized Gains & Losses 13,100 - - -
9791 - Cash Over & Short (20) - - -
Program Generated Revenue Total 8,962,693 8,894,409 9,471,575 6.49%
Solid Waste ServicesDivision Detail
(Dept ID # 8950)
Refuse
2012Revised
2013Proposed
2011Actuals
13 v 12% Chg
2013 Proposed Operating and Capital Budgets
SWS - 36
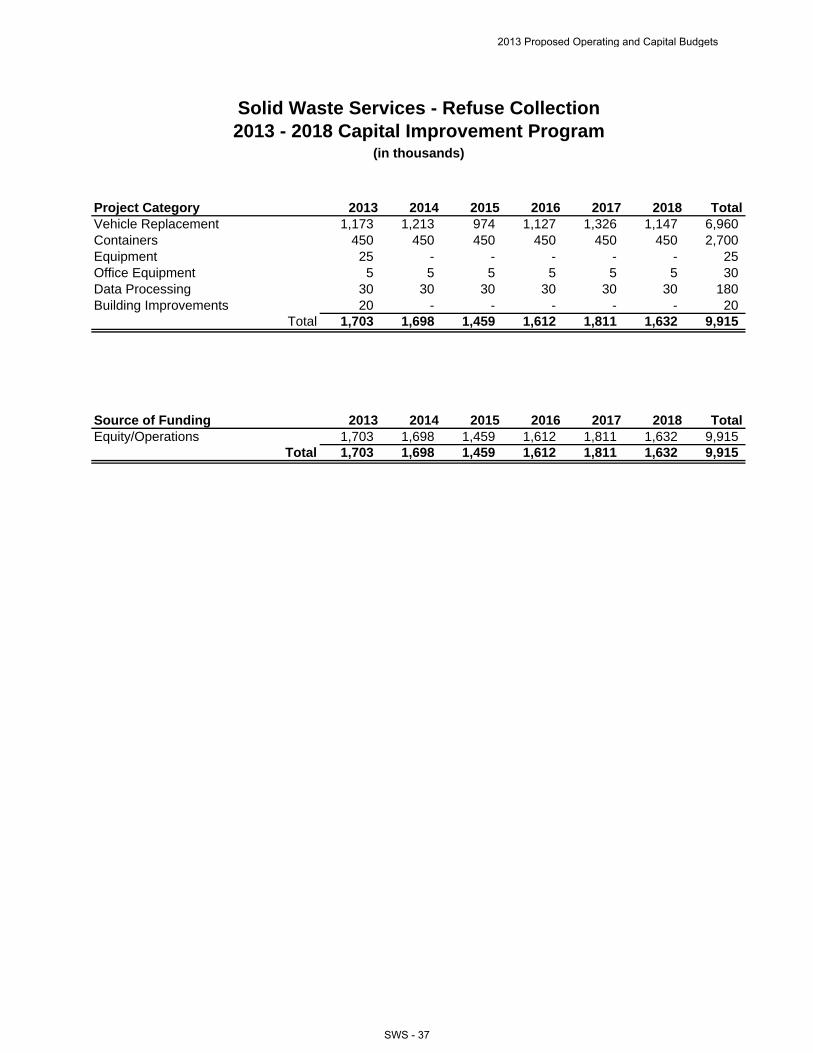
Project Category 2013 2014 2015 2016 2017 2018 TotalVehicle Replacement 1,173 1,213 974 1,127 1,326 1,147 6,960 Containers 450 450 450 450 450 450 2,700 Equipment 25 - - - - - 25 Office Equipment 5 5 5 5 5 5 30 Data Processing 30 30 30 30 30 30 180 Building Improvements 20 - - - - - 20
Total 1,703 1,698 1,459 1,612 1,811 1,632 9,915
Source of Funding 2013 2014 2015 2016 2017 2018 TotalEquity/Operations 1,703 1,698 1,459 1,612 1,811 1,632 9,915
Total 1,703 1,698 1,459 1,612 1,811 1,632 9,915
Solid Waste Services - Refuse Collection2013 - 2018 Capital Improvement Program
(in thousands)
2013 Proposed Operating and Capital Budgets
SWS - 37

Project Title DebtState/Fed
GrantEquity/
Operations TotalInstall AirVac Vehicle Exhaust Removal System - - 20 20 Install GPS Billing Software - - 25 25 Replace 1 Commercial Frontloader Truck - - 300 300 Replace 3 Residential Auto Sideloader Trucks - - 873 873 Replace Data Processing Equipment - - 30 30 Replace Dumpsters - - 450 450 Replace Office Equipment - - 5 5
Total - - 1,703 1,703
Solid Waste Services - Refuse Collection2013 Capital Improvement Budget
(in thousands)
2013 Proposed Operating and Capital Budgets
SWS - 38

2011 2012 2013
Actual Proforma Budget
Cash Flows From Operating ActivitiesReceipts from Customers 8,810,282 8,762,886 9,427,075
Payments to Employees (2,127,733) (2,471,427) (3,072,102)
Payments to Vendors (5,308,477) (5,387,539) (4,936,675)
Net Cash Provided by Operating Activities 1,374,072 903,920 1,418,298
Cash Flows From Non Capital and Related Financing ActivitiesIntergovernmental Revenue Transfers to Other Funds (68,147) (54,882) (59,245)
Transfers from Other Funds - - -
Net Cash Used by Non-Capital and Related Financing Activities (68,147) (54,882) (59,245)
Cash Flows From Capital and Related Financing ActivitiesAcquisition and Construction of Capital Assets (133,018) (1,205,900) (1,703,000)
Proceeds from Disposition of Capital Assets 4,043 500 500
Principal Payments on Long-Term Obligations - - -
Interest Payments on Long-Term Obligations - - -
Net Cash Used by Capital and Related Financing Activities (128,975) (1,205,400) (1,702,500)
Cash Flows From Investing ActivitiesInvestment Income 135,544 212,394 44,000
Net Cash Provided by Investing Activities 135,544 212,394 44,000
Net Increase (Decrease) in Cash 1,312,494 (143,968) (299,446)
Cash, Beginning of Year 5,271,716 6,584,210 6,440,242
Cash, End of Year 6,584,210 6,440,242 6,140,795
Components of CashCash and Cash Equivalents 4,278,016 6,440,242 6,140,795
Capital Acquisition and Construction Accounts 2,306,194
Cash and Cash Equivalents, End of Year 6,584,210 6,440,242 6,140,795
Reconciliation of Operating Income (Loss) to Net Cash Provided By Operating ActivitiesOperating Income 592,879 16,573 469,132
Adjustments to Reconcile Operating Income to Net CashProvided by Operating Activities:
Depreciation 764,324 914,305 949,166
Changes in Assets and Liabilities Which Increase (Decrease) Cash:Accounts Receivable (6,100) - -
Prepaid Items and Deposits (264) - -
Accounts Payable 21,569 - -
Deferred Revenue (329) - -
Compensated Absences Payable (4,357) - -
Accrued Payroll Liabilities Payable 6,350 - -
Net Cash Provided by Operating Activities 1,374,072 930,878 1,418,298
Solid Waste Services - Refuse CollectionStatement of Cash Sources and Uses
2013 Proposed Operating and Capital Budgets
SWS - 39

About Solid Waste Services Solid Waste Services (SWS) is composed of two separate utilities. The Refuse Collections Utility provides refuse collection service to residential and commercial customers in the “City of Anchorage” Service Area. The Solid Waste Disposal Utility operates multiple transfer stations and the regional landfill providing affordable and environmentally responsible municipal solid waste disposal services for the entire Municipality. SWS is divided into three organizations. The organizations include Refuse Collections and Solid Waste Disposal, which are separate operating utilities, and Administration, which is a support organization that fully charges out expenses to both Refuse Collections and Disposal Utilities. Refuse Collection Utility History Refuse Collections Utility was originally a function of the former City of Anchorage Public Works Department. When the City and Borough merged in 1975, Refuse Collections became an enterprise activity of the Municipality. Service Refuse Collections Utility provides garbage collection to the service area of the former City of Anchorage, which is approximately 20% of the population of the Municipality of Anchorage. Since at least 1952 there has been mandatory service for all occupants of the Refuse Collections Utility service area. The Refuse Collections Utility has three types of services: commercial dumpsters, automated roll cart service, and can and bag service. Refuse Collections Utility services over 5,000 dumpsters per week with six daily dumpster routes, and two Saturday routes to serve its commercial and multi-family residential customers. Most residential customers are serviced using automated vehicles and roll carts. Curbside recycling included in the service. A small number of residential and commercial customers remain can and bag customers. While the Refuse Collections Utility planned to switch the remaining can and bag customers to automated operations in 2012, the roll cart delivery was delayed until winter; therefore, the last 2,000 can and bag customers will be phased into automated operations in 2013. Regulation The Refuse Collections Utility is regulated by the Regulatory Commission of Alaska (RCA). The utility is granted the exclusive right to collect solid waste within its defined service area by a Certificate of Public Convenience and Necessity. The Alaska Public Utilities Commission (predecessor to the RCA) relinquished economic regulation authority to the Anchorage Municipal Assembly. As a part of Solid Waste Services, the Refuse Collections Utility has a seven member advisory commission. The members are appointed by the mayor and confirmed by the assembly. The commission meets monthly and, when necessary, holds special meetings. The advisory commission advises and makes recommendations to the
2013 Proposed Operating and Capital Budgets
SWS - 40

administration and assembly on matters pertaining to the operating budget, capital budget, rules, regulations, and administrative guidelines for the Utility. Environmental Mandates Although there is no specific state or federal regulations governing refuse collection, the Utility must comply with a number of federal and state mandated regulations. These regulations include, but are not limited to, the Federal Clean Air Act, the Clean Water Act and OSHA. These regulations have and will continue to impact the economics and operations of the Refuse Collections Utility. Physical Plant The Refuse Collection Utility’s assets include: Industry Specific truck fleet
10 commercial refuse collection vehicles 9 residential refuse and recycling vehicles (automated) 1 rear load vehicle for MOA paper collection and recycling 6 support vehicles
By the end of 2012 with the implementation of automated operations, the Utility will have purchased over 24,000 roll carts of various sizes for the use by residential customers for trash and for curbside recycling. Refuse Collections maintains a 27,000 square foot building that contains vehicle maintenance and warm storage space and administrative offices. Future Planning Efforts In 2013, Refuse Collection will complete the switch from can and bag operations to automated collection services for all Solid Waste Services residential and small commercial customers. Solid Waste Disposal Utility History Municipal solid waste disposal was originally a function of the City Public Works Department, which operated the city landfill at Merrill Field. Under unification, the Municipality acquired responsibility for five waste disposal sites from Peters Creek to Girdwood. The Solid Waste Disposal Utility was formed to operate and maintain these sites, while managing solid waste disposal matters throughout the Municipality. The five sites were closed and waste disposal was consolidated to a single site near Eagle River. The Anchorage Regional Landfill (ARL), an award winning, “state-of-the-art", fully lined, modern landfill, was started in 1987 and is the only operating landfill in MOA. Service The Solid Waste Disposal Utility serves the entire MOA. The services include the disposal of solid waste and collection of household hazardous waste. Municipal solid waste is received at three transfer stations located within MOA. The waste is then transported by the Utility to ARL for final disposal.
2013 Proposed Operating and Capital Budgets
SWS - 41

The ARL has a total land area of approximately 275 acres and is being developed in phases called cells. Currently 9 of 12 cells have been constructed, with the last cell completed in 2010. ARL is projected to have a total capacity in excess of 42.3 million cubic yards. It is estimated that ARL will reach full capacity in the year 2043. In 2011, 308,647 tons were deposited in ARL, 9,244 tons less than in 2010, a 3% decline from 2010. Solid Waste Disposal Utility also operates three transfer stations located at Girdwood, midtown Anchorage (Central Transfer Station, CTS), and ARL. The transfer stations allow the Solid Waste Disposal Utility to reduce traffic flow to the landfill and to restrict access to the working face of the landfill. CTS receives the largest amount of solid waste, having received over 222,330 tons in 2011 from over 164,600 customers. This facility has an operating capacity of 1,600 tons per day. The 2011 quantity was 134 tons less than 2010. The Solid Waste Disposal Utility operates a fleet of 17 transfer tractor and trailers that transport the solid waste from CTS. The trailers have a capacity of 120 yards each. Solid Waste Disposal Utility operates a 6,000 square foot hazardous waste collection facility built in 1989. In 1992, the facility was the only Hazardous Waste facility in North America to receive Solid Waste Association of North America's "System Excellence" award. Through 2011, the facility has collected over 22 million pounds of hazardous waste that otherwise may have been improperly disposed of at the landfill, the storm drain system or people's backyards. Household hazardous waste can be dropped off at CTS or the Hazardous Waste Facility located at ARL. The hazardous waste is then handled by a contractor that sorts and processes the waste in proper containers. Hazardous products are shipped out of state to federally approved hazardous waste disposal sites. Other materials are rendered inert and landfilled, processed locally or recycled. In March 2000, a new reuse program was successfully implemented. Anchorage residents bring household items such as paints, cleaners, and solvents to Reuse Centers at CTS or at ARL. The items are then stocked for other Anchorage residents to take home for reuse on household projects. In 2011, over 1,800 people took advantage of the program and as a result over 14,500 items were reused. Regulation The Solid Waste Disposal Utility is not economically regulated by any non-municipal agencies. However, the Utility operates under numerous permits and many EPA regulations. ARL is operated under a Solid Waste operating permit issued by the Alaska Department of Environmental Conservation (ADEC). This permit must be renewed every five years. ARL construction and certain operations must comply with the EPA Resource Conservation and Recovery Act (RCRA) subtitle D. The facility is also regulated under a Title V air emissions operating permit issued by ADEC. The Disposal Utility operates under two permits from AWWU for industrial water discharge, one for disposal of leachate from ARL and one for discharge of leachate contaminated groundwater at Merrill Field. ARL has permits from the US Department of Fish and Wildlife and the Alaska Department of Fish and Game for bird management. The Solid Waste Disposal Utility, as a part of Solid Waste Services, also has a seven member advisory commission. The members are appointed by the mayor and confirmed by the assembly. The commission normally meets monthly and when necessary holds
2013 Proposed Operating and Capital Budgets
SWS - 42

special meetings. The advisory commission advises and makes recommendations to the administration and assembly on matters pertaining to the operating budget, capital budget, rules, regulations, and administrative guidelines for the Utility. Environmental Mandates The Solid Waste Disposal Utility must operate under and comply with numerous environmental mandates. These mandates have a significant economic impact on the cost of operations and construction for the Utility. The main environmental mandates that have a significant impact on the Disposal Utility are RCRA subtitle D, the Clean Air Act, New Source Performance Standards (NSPS) , the Clean Water Act, SARA Title 3 (Super Fund), NESAP (asbestos), and NPDES (storm water discharge). In 2010, EPA added greenhouse gas monitoring and reporting requirements that affect both active and closed landfill sites. It is projected that the environmental mandates regarding operating and constructing a landfill will become even more stringent in the future. Physical Plant The Disposal Utility’s assets include: Anchorage Regional Landfill
275 acres, estimated to last through the year 2043 42.3 million cubic yard capacity Phased construction of cells lasting four to five years each Nine of the twelve landfill cells are constructed Located on municipal land Scale house and a 22,000 square foot shop with an adjoining storage facility Heavy equipment fleet: dozers, loaders, dump trucks, boom truck, water truck,
leachate trucks, tankers, lube trucks, grader and solid waste compactor Two leachate storage, treatment lagoons with a 2.9 million gallon capacity Gas collection facility with 700 square foot blower and flare station with a 2,000
cubic feet per minute capacity enclosed flare Gas processing facility under construction by Doyon Utilities will be completed by
the end of 2012. The facility will process gas to fuel quality and will transport it by pipeline to Doyon Utility’s power generation system to produce electricity on adjacent military lands
Three transfer stations provide intermediate disposal, easy access for public
Cash Booths at Girdwood, Central, and the ARL public site One Scale house at CTS 21 transfer tractor and trailers haul from stations to landfill
Hazardous waste management
6,000 square foot collection facility for household hazardous waste Opened in 1989, operated by private contractor Received the "System Excellence Award" in North America from Solid Waste
Association of North America
2013 Proposed Operating and Capital Budgets
SWS - 43

Future Planning Efforts Future projects include:
In 2011, completed development study for the next five landfill cells. Development of remaining cells will occur by 2020 with an estimated cost of $38 million.
Landfill methane gas to electricity project with Doyon Utilities was approved in 2011. Construction will be completed in 2012, with commercial operation expected to begin in 2013. The Disposal Utility will sell methane gas to Doyon under a twenty year agreement. Doyon will generate electricity to sell to JBER military customers.
2013 Proposed Operating and Capital Budgets
SWS - 44