solomon ecosystem and socio- economic resilience islands ... · solomon islands esram: volume 1...
TRANSCRIPT

SOLOMONISLANDS
Ecosystem and Socio- economic Resilience
Analysis and Mapping
Solomon Islands ESRAM: Volume 1 ESRAM Introduction and National Assessment i
SPREP Library Cataloguing-in-Publica�oa on Data Solomon Islands Ecosystem and Socio-Economic Resilience Analysis and Mapping (ESRAM), Volume 1 : Introduction and national assessment. Apia, Samoa: SPREP, 2018. 141 p. 29 cm. ISBN: 978-982-04-0757-2 (print) 978-982-04-0758-9 (ecopy) 1. Ecosystem management – Solomon Islands. 2. Nature conservation. 3. Climatic changes – Adaptation. 4. Biodiversity conservation – Economic aspects. 5. Biodiversity conservation – Social aspects. 6. Environmental impact analysis. I. Pacific Regional Environment Programme (SPREP). II. Title 333.72’9593 Copyright © Secretariat of the Pacific Regional Environment Programme (SPREP), 2017. Reproduction for educational or other non-commercial purposes is authorised without prior written permission from the copyright holder provided that the source is fully acknowledged. Reproduction of this publication for resale or other commercial purposes is prohibited without prior written consent of the copyright owner. Cover photo: Stuart Chape
Our vision: The Pacific environment, sustaining our livelihoods and natural heritage in harmony with our cultures.
This report produced by BMT WBM for the Secretariat of the Pacific Regional Environment Programme (SPREP) presents Volume 1
(of three volumes) prepared as part of the Solomon Islands Ecosystems and Socio-economic Resilience Analysis and Mapping (ESRAM)
to assess and prioritise climate change-related ecosystem-based adapation options for selected locations in Solomon Islands. Volume
1 provides the generic project background and methodology relevant to all three volumes, together with the high level national scale
assessment.
Authors: Beth Toki, Lyn Leger, Suanne Richards, Sophie Hipkin, Joseph Lorimer (Aither), Rod Coulton (Aither).
All photographs are credited to Beth Toki unless stated otherwise.
Key project partners
PO Box 240, Apia, Samoa [email protected], www.sprep.org
Project coordination: Fred Patison.
Solomon Islands ESRAM: Volume 1 ESRAM Introduction and National Assessment ii
Contents
List of Abbreviations viii
Acknowledgements ix
Executive Summary x
1 Introduction 1
1.1 Pacific Ecosystem-Based Adaptation to Climate Change Project 1
1.1.1 Background 1
1.1.2 Study components and outputs 1
1.2 Aims and objectives 2
1.3 Volume 1 report scope 3
1.4 Ecosystem services context 4
2 ESRAM methodology 9
2.1 Study approach 9
2.2 Ecosystem baseline and threats assessment 9
2.2.1 Review of existing literature 9
2.2.2 Stakeholder workshops 11
2.2.3 Mapping 12
2.3 Economic valuations 13
2.3.1 Economic approach 13
2.3.2 Step 1: Filter and sort ecosystem services 14
2.3.3 Step 2: Establish ecosystem unit values 15
2.3.4 Step 3: Calculate ecosystem service values 15
2.4 Climate change assessment 16
2.4.1 Current and future climate projections 16
2.4.2 Climate change vulnerability assessment 19
2.5 ESRAM study outcomes 20
3 National scale ESRAM – context 21
3.1 Specific methodology 21
3.1.1 Grouping of ecosystem services for valuation 22
3.2 Geographic setting 25
3.3 National socio-economic profile 25
3.4 Biodiversity and conservation 26
3.5 National governance 33
3.5.1 Climate change governance 36
Solomon Islands ESRAM: Volume 1 ESRAM Introduction and National Assessment iii
4 Current state, trends, drivers of change and environmental consequences 39
4.1 Current state of ecosystems and national trends 39
4.1.1 Forests 40
4.1.1.1 Forest types 40
4.1.2 Freshwater ecosystems 43
4.1.3 Coral reefs 43
4.1.4 Mangroves 44
4.1.5 Seagrass 45
4.1.6 Ocean health 45
4.2 Drivers of change 45
4.2.1 Population pressures 45
4.2.2 Subsistence use intensification 46
4.2.3 Commercial plantations 47
4.2.4 Urbanisation 47
4.2.5 Mining 47
4.2.6 Logging 48
4.2.7 Fishing and marine exports 49
4.2.8 Pollution 49
4.2.9 Energy production and use 50
4.3 Environmental consequences 50
4.3.1 Freshwater stress 50
4.3.2 Soil stress and degradation 51
4.3.3 Forest depletion 51
4.3.4 Loss of biodiversity 52
4.3.5 Fish stock depletion and coral reef degradation 52
5 National ecosystems and ecosystem services 54
5.1 National overview 54
5.2 Key ecosystems and ecosystem services 55
5.3 Rivers and streams 60
5.4 Wetlands, lakes and swamps 61
5.5 Terrestrial forests / vegetation 62
5.6 Mountains (highlands / cloud forests) 64
5.7 Other terrestrial land 65
5.8 Coral reefs 66
5.9 Seagrass / marine flora 70
5.10 Coastline / beaches 72
Solomon Islands ESRAM: Volume 1 ESRAM Introduction and National Assessment iv
5.11 Mangroves 73
5.12 Sea / Ocean 74
5.13 Groundwater 81
5.14 Cultivated land (gardens and plantations) 81
5.15 Summary of human induced threats to ecosystem services 82
6 National ecosystem valuations 88
6.1 Economic values for ecosystem services 88
7 Climate change vulnerability assessment 90
7.1 Current climate 90
7.1.1.1 Air temperature 90
7.1.1.2 Rainfall 90
7.1.1.3 Wind-driven waves 91
7.1.1.4 Tropical cyclones 91
7.1.1.5 Sea level 91
7.1.1.6 Ocean acidification 91
7.2 Future climate projections 91
7.2.1.1 Average temperature 92
7.2.1.2 Extreme temperature 92
7.2.1.3 Average rainfall 92
7.2.1.4 Extreme rainfall 92
7.2.1.5 Drought 92
7.2.1.6 Cyclones 92
7.2.1.7 Wind-driven waves 93
7.2.1.8 Sea level 93
7.2.1.9 Ocean acidification 93
7.2.1.10 Coral bleaching risk 93
7.3 Climate change threats 94
7.3.1 Temperature increase 94
7.3.2 Sea-level rise 95
7.3.3 Ocean acidification 95
7.3.4 More extreme rain events 96
7.3.5 Summary of climate change threats 96
7.4 Vulnerability of ecosystem services to climate change variables 97
7.4.1 Sea-level rise 97
7.4.2 Air and sea temperature 98
7.4.3 Ocean acidification 99
7.4.4 Extreme rainfall events 99

Solomon Islands ESRAM: Volume 1 ESRAM Introduction and National Assessment v
7.4.5 Summary of ecosystem service vulnerability to climate change 100
8 ESRAM outcomes 103
8.1 Resilience of ecosystem services to human induced and climate change effects 103
8.1.1 Freshwater ecosystems and services 103
8.1.2 Coastal and marine ecosystems and services 104
8.1.3 Terrestrial ecosystems and services 106
8.2 National ecosystem based adaptation options 107
Glossary 111
9 References and Bibliography 112
9.1 References 112
9.2 Bibliography 116
Appendix A National workshop attendees A-1
Appendix B Climate projections B-1
Appendix C National vulnerability assessment results C-1
List of Figures
Figure 1-1 Position of ESRAM study in the broader PEBACC process 2
Figure 1-2 Locality map 4
Figure 2-1 Categories for total economic valuation 13
Figure 2-2 Overarching methodology for economic valuations 14
Figure 2-3 Ecosystems and their services for the Solomon Islands 18
Figure 2-4 Climate change vulnerability assessment conceptual framework 19
Figure 3-1 Stakeholders at the national workshop conducting participatory activities in groups (photographs courtesy of Simon Albert) 24
Figure 3-2 Managed areas in Solomon Islands (image courtesy of MACBIO) 29
Figure 3-3 Example of ridge-to-reef benefits (SPREP 2014) 30
Figure 3-4 Key Biodiversity Areas (KBAs) and Ecologically and Biologically Significant Areas (EBSAs) (image courtesy MACBIO) 31
Figure 3-5 Important bird areas (IBAs) (image courtesy MACBIO) 32
Figure 3-6 Institutional arrangements for the implementation of the National Climate Change Policy (Source: Rodil and Mias-Cea 2014) 37
Figure 4-1 Projected population estimates for Solomon Islands (2.07% annual growth rate) 46
Figure 4-2 Projected forest clearing rates for Solomon Islands 52
Figure 5-1 Mangroves, seagrass and reefs 68
Solomon Islands ESRAM: Volume 1 ESRAM Introduction and National Assessment vi
Figure 5-2 Solomon Islands marine species richness (courtesy MACBIO) 69
Figure 5-3 Seaweed production sites (from Kronen 2010) 71
Figure 5-4 Fishing access area boundaries 77
Figure 5-5 Ocean productivity (courtesy MACBIO) 78
Figure 5-6 Artisanal fishing intensity (courtesy MACBIO) 79
Figure 5-7 Tuna catch in Solomon Islands, 2001–2010 (courtesy MACBIO) 80
Figure B-1 Projected emissions of greenhouse gases for the range of RCP trajectories. Radiative forcings for each trajectory shown (bottom right). (van Vuuren et.al. 2011). B-1
Figure B-2 The main climate features in the western tropical Pacific region (source: BOM and CSIRO 2012) B-2
List of Tables
Table 1-1 Summary of ecosystem services’ contribution to human resilience outcomes (Carabine 2015) 7
Table 2-1 Study tasks 9
Table 2-2 Overview of stakeholder participation and field approaches 11
Table 3-1 Summary of stakeholder workshop attendees, 9 August 2016 22
Table 3-2 National governance framework (SPREP 2016) 33
Table 4-1 Summary of current state of ecosystems and native species in Solomon Islands (SPREP 2016) 39
Table 4-2 Area coverage of forest types per province (Source: MFEC 1995) 42
Table 4-3 Change in forest cover over time in Solomon Islands (SPREP 2016) 43
Table 4-4 Change in mangrove forest in Solomon Islands (FAO 2010) 44
Table 4-5 Annual summary of log export production by province (Source: Pauku 2009) 49
Table 5-1 Examples of typical community reliance on local ecosystem resources 54
Table 5-2 Key ecosystems and ecosystem services identified for Solomon Islands 57
Table 5-3 Summary of ecosystem sources for key ecosystem services 59
Table 5-4 Fishing access arrangements (as per Solomon Islands Tuna Management and Development Plan) 76
Table 5-5 Production value of key crops, 2009 (adapted from Rodil and Mias-Crea 2014) 82
Table 5-6 Summary of key threats to each ecosystem service 84
Table 6-1 Summary of national ecosystem service values (adapted from MACBIO 2015) 88
Table 6-2 Summary of national ecosystem service values (adapted from de Groot et al. 2012) 89
Solomon Islands ESRAM: Volume 1 ESRAM Introduction and National Assessment vii
Table 7-1 Climate variables and the high to very highly vulnerable ecosystem services at the national scale 101
Table 8-1 Suggested EbA options to increase the adaptive capacity and resilience of Solomon Island ecosystems 108

Solomon Islands ESRAM: Volume 1 ESRAM Introduction and National Assessment viii
List of Abbreviations
ACMCA Anarvon Community Marine Conservation Area
AR5 Fifth Assessment Report of the IPCC
CBRM community-based resource management
EbA ecosystem-based adaptation
EBA endemic bird area
EBSA ecologically and biologically significant areas
EEZ exclusive economic zone
ENSO El Niño-Southern Oscillation
ESRAM Ecosystem and Socio-economic Resilience Analysis and Mapping
EVRI Environmental Valuation Reference Inventory
GCM Global Climate Model
GIS Global Information Systems
GPS Global Positioning System
IBA important bird areas
KBA key biodiversity areas
MHWM mean high water mark
MPA marine protected area
NM nautical miles
PEBACC Pacific Ecosystem-based Adaptation to Climate Change
PV present value
R2R ridge-to-reef
RCP Representative Concentration Pathway
SPC The Pacific Community
SOPAC Pacific Islands Applied Geoscience Commission (now the Geoscience Division) of SPC
SPREP Secretariat of the Pacific Regional Environment Programme
TBL triple Bottom Line
TEV total economic valuation
TNC The Nature Conservancy
UNCLOS United Nations Convention on the Law of the Sea
VandA vulnerability and adaptation

Solomon Islands ESRAM: Volume 1 ESRAM Introduction and National Assessment ix
Acknowledgements
With assistance from SPREP, this and the subsequent volumes (Volumes 2 and 3) are the result of a
collaboration between BMT WBM, our subconsultants, and the numerous community, government and other
stakeholder representatives who have been involved in the project to date.
Key project team personnel involved in the ESRAM process include:
Dr Beth Toki (BMT WBM)
Janice Booth (BMT WBM)
Dr Simon Albert (University of Queensland)
Rod Coulton (Aither)
Joseph Lorimer (Aither)
David Boseto (Ecological Solutions Solomon Islands)
Dr Tammy Tabe
Donald Kudu
Lyn Leger (BMT WBM)
Sophie Hipkin (BMT WBM)
Suanne Richards (BMT WBM)
On behalf of SPREP, BMT WBM also recognise the generosity of the German Federal Ministry of the
Environment, Nature Conservation and Nuclear Safety (BMU) as the donors sponsoring this work.
For this volume, in particular, we also thank the many people, ministries, non-governmental organisations and
other sources who contributed by making available the reports and data used or referred to herein, as well as
the stakeholder representatives who participated in the National ESRAM workshop (refer herein).
Fred Patison and Herman Timmermans from SPREP provided constructive feedback and suggested
improvements on the draft report, with Fred also providing valuable in-country assistance and data. Additional
acknowledgements specific to Honiara and Wagina Island are detailed in the respective volumes.
Special acknowledgment to the late Tia Masolo (d. September 2016) – Deputy Director of the Environment
and Conservation Division, MECDM. Mr Masolo participated in the national ESRAM workshop and
accompanied SPREP’s PEBACC team to Wagina Island in preparation for the commencement of the Wagina
Island ESRAM.
Solomon Islands ESRAM: Volume 1 ESRAM Introduction and National Assessment x
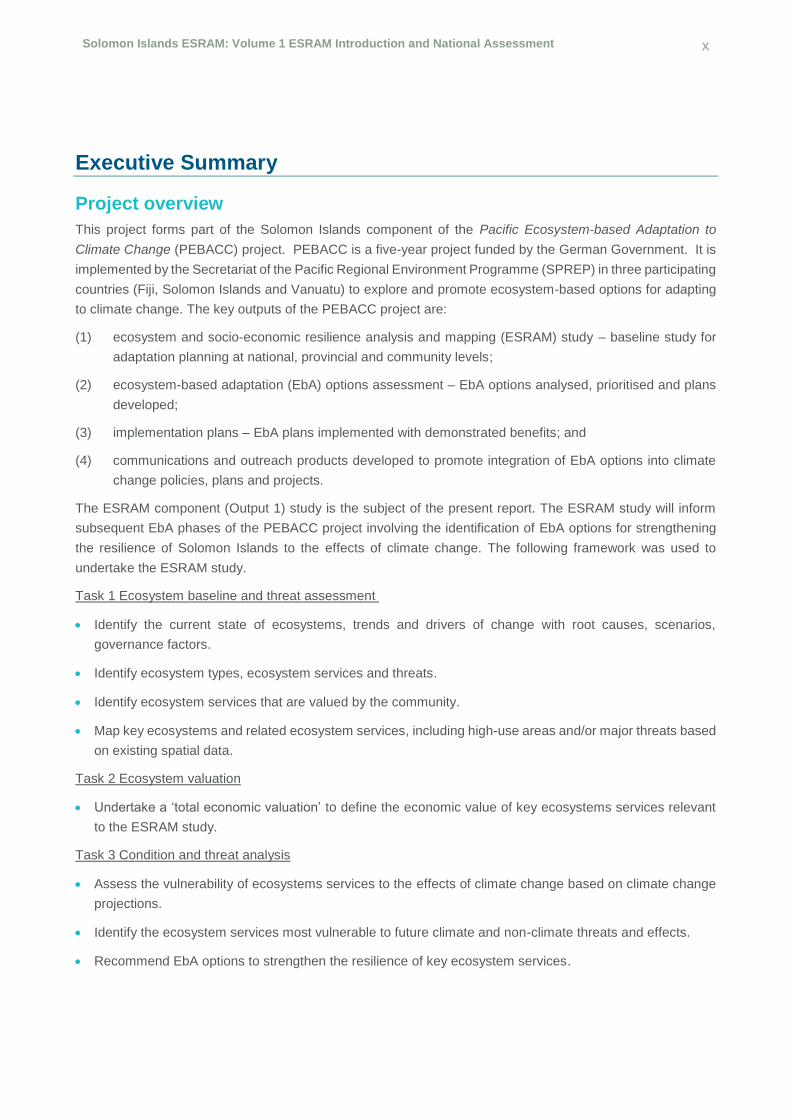
Executive Summary
Project overview
This project forms part of the Solomon Islands component of the Pacific Ecosystem-based Adaptation to
Climate Change (PEBACC) project. PEBACC is a five-year project funded by the German Government. It is
implemented by the Secretariat of the Pacific Regional Environment Programme (SPREP) in three participating
countries (Fiji, Solomon Islands and Vanuatu) to explore and promote ecosystem-based options for adapting
to climate change. The key outputs of the PEBACC project are:
(1) ecosystem and socio-economic resilience analysis and mapping (ESRAM) study – baseline study for
adaptation planning at national, provincial and community levels;
(2) ecosystem-based adaptation (EbA) options assessment – EbA options analysed, prioritised and plans
developed;
(3) implementation plans – EbA plans implemented with demonstrated benefits; and
(4) communications and outreach products developed to promote integration of EbA options into climate
change policies, plans and projects.
The ESRAM component (Output 1) study is the subject of the present report. The ESRAM study will inform
subsequent EbA phases of the PEBACC project involving the identification of EbA options for strengthening
the resilience of Solomon Islands to the effects of climate change. The following framework was used to
undertake the ESRAM study.
Task 1 Ecosystem baseline and threat assessment
Identify the current state of ecosystems, trends and drivers of change with root causes, scenarios,
governance factors.
Identify ecosystem types, ecosystem services and threats.
Identify ecosystem services that are valued by the community.
Map key ecosystems and related ecosystem services, including high-use areas and/or major threats based
on existing spatial data.
Task 2 Ecosystem valuation
Undertake a ‘total economic valuation’ to define the economic value of key ecosystems services relevant
to the ESRAM study.
Task 3 Condition and threat analysis
Assess the vulnerability of ecosystems services to the effects of climate change based on climate change
projections.
Identify the ecosystem services most vulnerable to future climate and non-climate threats and effects.
Recommend EbA options to strengthen the resilience of key ecosystem services.

Solomon Islands ESRAM: Volume 1 ESRAM Introduction and National Assessment xi
While ESRAM considers three geographic locations/scales, this Volume 1 report is the national scale
assessment. This is a broader (higher-level) exercise than the local and city scale assessments, as appropriate
to this spatial scale. Volume 1 presents:
(1) general ESRAM methodology – a description of the general ESRAM assessment approach used for the
three scales/locations in Solomon Islands; and
(2) national ESRAM – the results of the national scale ESRAM assessment.
The results of the Wagina Island and Honiara ESRAM assessments are presented in Volumes 2 and 3,
respectively.
National ESRAM outcomes
Well-managed and healthy ecosystems are critical for the provision of essential services to maintain the health,
well-being and livelihoods of all Solomon Island communities and economies. The vulnerability of social and
ecological systems to human activities, such as logging, agriculture, pollution and the over-exploitation of
marine resources throughout Solomon Islands, is increasing. As one of the fastest growing populations in the
world, these activities will only intensify and have an increased detrimental effect on the communities and
economies of Solomon Islands. The direct and indirect effects of climate change and their interactions with
human-induced threats increases the vulnerability of critical ecosystem services and reduces the resilience of
social and ecological systems.
Freshwater ecosystem services
Freshwater ecosystems provide essential services to many Solomon Island households. The key
anthropogenic threats to freshwater ecosystems are an increase in sedimentation of stream and river systems
from logging and land-clearing practices, pollution of water catchments from inappropriate solid waste and
sanitation practices, rapid population growth, and urbanisation. The key climate threats to freshwater
ecosystem services are an increase in extreme rainfall events and sea-level rise. The key ecosystem services
most vulnerable and in need of protection, restoration and enhancement to build their resilience under future
climate conditions are:
provision of water supply (for drinking, domestic and irrigation purposes) provided by groundwater, rivers,
streams and lakes;
provision of food for both subsistence and commercial purposes (eels and other fish, molluscs, crustaceans,
etc.) provided by rivers, streams, lakes, wetlands and swamps;
habitat provision (supporting biodiversity and food sources) provided by streams, rivers, wetlands, lakes
and swamps;
income generation (fisheries, aquaculture and bottled water) provided by streams, rivers, wetlands, lakes
and groundwater;
provision of recreational activities (swimming) provided by streams and rivers; and
water purification by wetlands, lakes and swamps.
The high reliance on freshwater resources for many households, particularly low-income households,
combined with the reduced water quality and a rapid population growth rate, are critical issues for building the

Solomon Islands ESRAM: Volume 1 ESRAM Introduction and National Assessment xii
nation’s resilience to future climate change effects. If effective measures are not implemented to conserve
freshwater resources and improve water quality issues, households that solely rely on freshwater ecosystems
services for their health and well-being and livelihoods (e.g. food and water supply), will need to adapt to
alternative means to strengthen their resilience to the future effects of climate change. If not managed
effectively, the potential economic loss of freshwater ecosystems (e.g. freshwater lakes, rivers, wetlands) is
estimated at USD 15,512 (2015) or SBD 121,282 (2015) per hectare per annum.
Coastal and marine ecosystems and services
Increasing habitat destruction, pollution and over-exploitation of marine resources for both subsistence and
commercial use has resulted in severe decline of marine biodiversity and ocean health, and the depletion of
important food and commercial species. The rapidly increasing population and inadequate environmental
regulations are intensifying the rate of marine ecosystem degradation. The climate change projections likely
to have the greatest effect on marine and coastal ecosystem services are an increase in sea and air
temperatures and associated ocean acidification and coral bleaching, an increase in extreme rainfall events
and sea-level rise. The key ecosystem services most vulnerable and in need of protection, restoration and
enhancement to ensure resilience under future climate conditions are:
provision of food (supplying daily protein and micronutrients through fish, including pelagic fish, turtles,
octopus, clams, beche-de-mer, trochus, molluscs and crustaceans) provided by coral reefs, mangroves,
marine waters, seagrass and macroalgae (seaweed);
supporting habitat (essential feeding, breeding, spawning, cleaning and aggregation habitat) and
biodiversity provided by coral reefs, mangroves, beaches, marine waters, seagrass and macroalgae;
income and revenue generation (fishing, seaweed, coral, lime extraction and tourism) provided by coral
reefs, marine waters and macroalgae;
provision of raw materials (timber, fuelwood, coral rock and lime production) provided by mangroves and
coral reefs;
hazard protection, including wave attenuation by coral reefs, seabed stabilisation by marine macroalgae,
and shoreline and coastal protection by mangroves;
cultural practices, values and identity (shell money, ornaments and decorations) provided by seagrass,
macroalgae and coral reefs;
provision of kastom medicine provided by seagrass and mangroves; and
regulating services (carbon sequestration, climate and atmospheric regulation, primary production, etc.)
provided by mangroves, marine waters, coral reefs, beaches, seagrass and marine macroalgae.
Marine and coastal ecosystem services are central to the livelihoods and well-being of a large portion of
Solomon Island communities and economies. Marine and coastal ecosystem resilience needs to be enhanced
by improving water quality, reducing coastal development pressures and sustainably managing fisheries
resources. A balance between meeting the subsistence food needs of households and maximising economic
benefits through export and sales of marine products is needed to build social and economic resilience.
The potential economic loss of marine and coastal ecosystems and all ecosystem services (e.g. coral reefs,
coastal systems, and coastal wetlands, including mangroves) is estimated to cost USD 295,052 (2015) or SBD
Solomon Islands ESRAM: Volume 1 ESRAM Introduction and National Assessment xiii
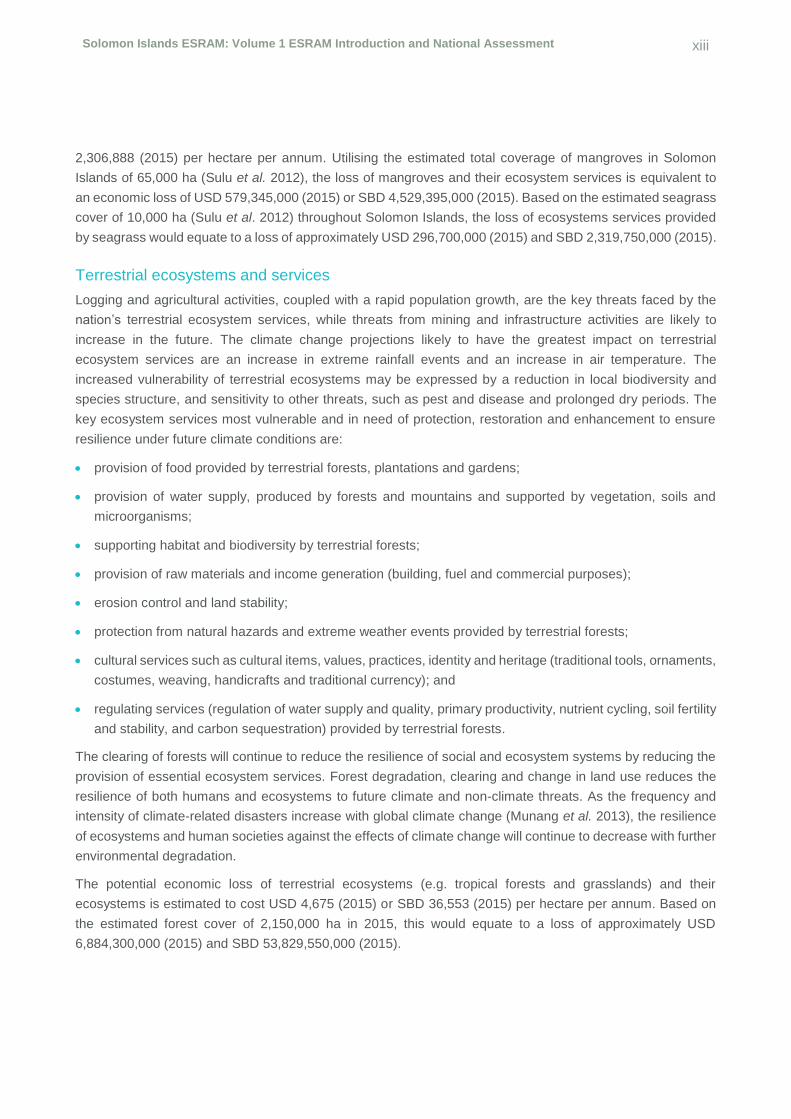
2,306,888 (2015) per hectare per annum. Utilising the estimated total coverage of mangroves in Solomon
Islands of 65,000 ha (Sulu et al. 2012), the loss of mangroves and their ecosystem services is equivalent to
an economic loss of USD 579,345,000 (2015) or SBD 4,529,395,000 (2015). Based on the estimated seagrass
cover of 10,000 ha (Sulu et al. 2012) throughout Solomon Islands, the loss of ecosystems services provided
by seagrass would equate to a loss of approximately USD 296,700,000 (2015) and SBD 2,319,750,000 (2015).
Terrestrial ecosystems and services
Logging and agricultural activities, coupled with a rapid population growth, are the key threats faced by the
nation’s terrestrial ecosystem services, while threats from mining and infrastructure activities are likely to
increase in the future. The climate change projections likely to have the greatest impact on terrestrial
ecosystem services are an increase in extreme rainfall events and an increase in air temperature. The
increased vulnerability of terrestrial ecosystems may be expressed by a reduction in local biodiversity and
species structure, and sensitivity to other threats, such as pest and disease and prolonged dry periods. The
key ecosystem services most vulnerable and in need of protection, restoration and enhancement to ensure
resilience under future climate conditions are:
provision of food provided by terrestrial forests, plantations and gardens;
provision of water supply, produced by forests and mountains and supported by vegetation, soils and
microorganisms;
supporting habitat and biodiversity by terrestrial forests;
provision of raw materials and income generation (building, fuel and commercial purposes);
erosion control and land stability;
protection from natural hazards and extreme weather events provided by terrestrial forests;
cultural services such as cultural items, values, practices, identity and heritage (traditional tools, ornaments,
costumes, weaving, handicrafts and traditional currency); and
regulating services (regulation of water supply and quality, primary productivity, nutrient cycling, soil fertility
and stability, and carbon sequestration) provided by terrestrial forests.
The clearing of forests will continue to reduce the resilience of social and ecosystem systems by reducing the
provision of essential ecosystem services. Forest degradation, clearing and change in land use reduces the
resilience of both humans and ecosystems to future climate and non-climate threats. As the frequency and
intensity of climate-related disasters increase with global climate change (Munang et al. 2013), the resilience
of ecosystems and human societies against the effects of climate change will continue to decrease with further
environmental degradation.
The potential economic loss of terrestrial ecosystems (e.g. tropical forests and grasslands) and their
ecosystems is estimated to cost USD 4,675 (2015) or SBD 36,553 (2015) per hectare per annum. Based on
the estimated forest cover of 2,150,000 ha in 2015, this would equate to a loss of approximately USD
6,884,300,000 (2015) and SBD 53,829,550,000 (2015).

Solomon Islands ESRAM: Volume 1 ESRAM Introduction and National Assessment xiv
Ecosystem-based adaptation options
Through sustainable resource management, ecosystem-based adaptation integrates biodiversity and
ecosystem services into an adaptation strategy. It is envisioned that EbA will be incorporated and implemented
in both policy and on-ground adaptation actions, providing a test case and model for other Pacific nations (or
other scales/locations within the participating countries). An ecosystem-based adaptation approach is
particularly relevant to the economies and communities of the Pacific Islands, which are heavily reliant on local
land and sea resources for maintaining national, provincial and local economies and community livelihoods
and socio-cultural values. In this respect, maintaining healthy and well-functioning ecosystems will be crucial
to building community resilience and reducing vulnerability to the effects of climate change.
By highlighting ecosystem service vulnerabilities, opportunities can be identified to protect and restore critical
ecosystems and their services, and retain and build on the strengths of social systems and effective
governance structures. Based on the vulnerable ecosystem services identified, high level EbA options have
been proposed to protect, restore and strengthen ecosystems to increase the resilience of Solomon Island
social and ecological systems.
Solomon Islands ESRAM: Volume 1 ESRAM Introduction and National Assessment 1
1 Introduction
1.1 Pacific Ecosystem-Based Adaptation to Climate Change Project
1.1.1 Background
This project forms part of the Solomon Islands component of the Pacific Ecosystem-based
Adaptation to Climate Change (PEBACC) project. PEBACC is a five-year project, funded by the
German Government. It is implemented by the Secretariat of the Pacific Regional Environment
Programme (SPREP) in three participating countries (Fiji, Solomon Islands and Vanuatu) to explore
and promote ecosystem-based options for adapting to climate change.
Ecosystem-based adaptation (EbA) is an ecosystem-focussed approach to building the resilience of
linked social and ecological systems to the negative effects of climate change. Through sustainable
resource management, ecosystem-based adaptation integrates biodiversity and ecosystem services
into an adaptation strategy. When delivered effectively, EbA can be cost-effective and contribute to
biodiversity conservation, while generating social, economic and cultural co-benefits (CBD 2009).
An ecosystem-based adaptation approach is particularly relevant to the economies and communities
of the Pacific Islands, which are heavily reliant on local land and sea resources for maintaining
national, provincial and local economies and community livelihoods and socio-cultural values. In this
respect, maintaining healthy and well-functioning ecosystems will be crucial to building community
resilience and reducing vulnerability to the effects of climate change.
1.1.2 Study components and outputs
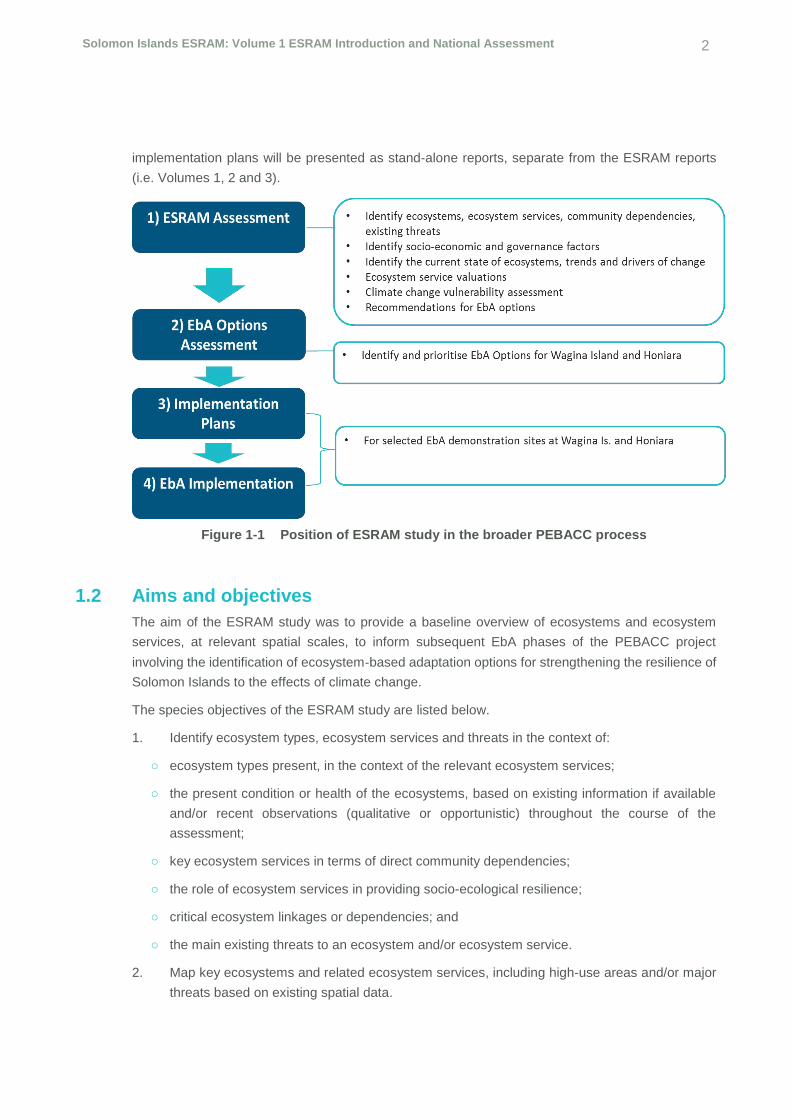
Figure 1-1 shows the key components of the PEBACC project, which are:
(1) ecosystem and socio-economic resilience analysis and mapping (ESRAM) study – baseline
study for adaptation planning at national, provincial and community levels;
(2) EbA options assessment – EbA options analysed, prioritised and plans developed;
(3) implementation plans – EbA plans implemented with demonstrated benefits; and
(4) communications and outreach products developed to promote integration of EbA options into
climate change policies, plans and projects
(SPREP 2016).
The ESRAM component (Step 1) study is the subject of the present report. The ESRAM study will
inform subsequent EbA phases of the PEBACC project, involving the identification of ecosystem‐
based adaptation options for strengthening the resilience of Solomon Islands to the effects of climate
change. It is envisioned that EbA will be incorporated and implemented in both policy and on-ground
adaptation actions, providing a test case and model for other Pacific nations (or other
scales/locations within the participating countries). Both the EbA options assessments and
implementation plans will be presented as stand-alone reports separate to this ESRAM study.
The ESRAM study will be followed by: a detailed EbA options assessment (step 2); the development
of implementation plans for selected demonstration sites (step 3); and on-ground EbA
implementation works (step 4) (see Figure 1-1). Both the EbA options assessments and
Solomon Islands ESRAM: Volume 1 ESRAM Introduction and National Assessment 2
implementation plans will be presented as stand-alone reports, separate from the ESRAM reports
(i.e. Volumes 1, 2 and 3).
Figure 1-1 Position of ESRAM study in the broader PEBACC process
1.2 Aims and objectives
The aim of the ESRAM study was to provide a baseline overview of ecosystems and ecosystem
services, at relevant spatial scales, to inform subsequent EbA phases of the PEBACC project
involving the identification of ecosystem‐based adaptation options for strengthening the resilience of
Solomon Islands to the effects of climate change.
The species objectives of the ESRAM study are listed below.
1. Identify ecosystem types, ecosystem services and threats in the context of:
○ ecosystem types present, in the context of the relevant ecosystem services;
○ the present condition or health of the ecosystems, based on existing information if available
and/or recent observations (qualitative or opportunistic) throughout the course of the
assessment;
○ key ecosystem services in terms of direct community dependencies;
○ the role of ecosystem services in providing socio-ecological resilience;
○ critical ecosystem linkages or dependencies; and
○ the main existing threats to an ecosystem and/or ecosystem service.
2. Map key ecosystems and related ecosystem services, including high-use areas and/or major
threats based on existing spatial data.

Solomon Islands ESRAM: Volume 1 ESRAM Introduction and National Assessment 3
3. Identify the current state of ecosystems, trends and drivers of change with root causes,
scenarios and governance factors.
4. Undertake a ‘total economic valuation’ to define the economic value of key ecosystems
services relevant to ESRAM.
5. Assess the vulnerability of ecosystems services to the effects of climate change, based on
climate change projections and other existing threats.
6. Provide broad recommendations regarding strategic EbA options.
This ESRAM study (and its counterparts in Vanuatu and Fiji) represent the first time that such
extensive and broad-scale assessments have been undertaken to guide EbA implementation in the
Pacific region. An additional objective of the ESRAM studies is therefore to provide a case study for
future knowledge-sharing and developments in the application of EbA elsewhere.
1.3 Volume 1 report scope
While ESRAM considers three geographic locations/scales, this Volume 1 report is the national scale
assessment. It is a broader (higher-level) exercise than the local and city scale assessments, as
appropriate to this spatial scale.
Volume 1 presents:
general ESRAM methodology – A description of the general ESRAM assessment approach used
for the three scales/locations in Solomon Islands; and
national ESRAM – The results of the national scale ESRAM assessment.
The results of the Wagina Island and Honiara ESRAM assessments are presented in Volumes 2 and
3 respectively.
Solomon Islands ESRAM: Volume 1 ESRAM Introduction and National Assessment 4
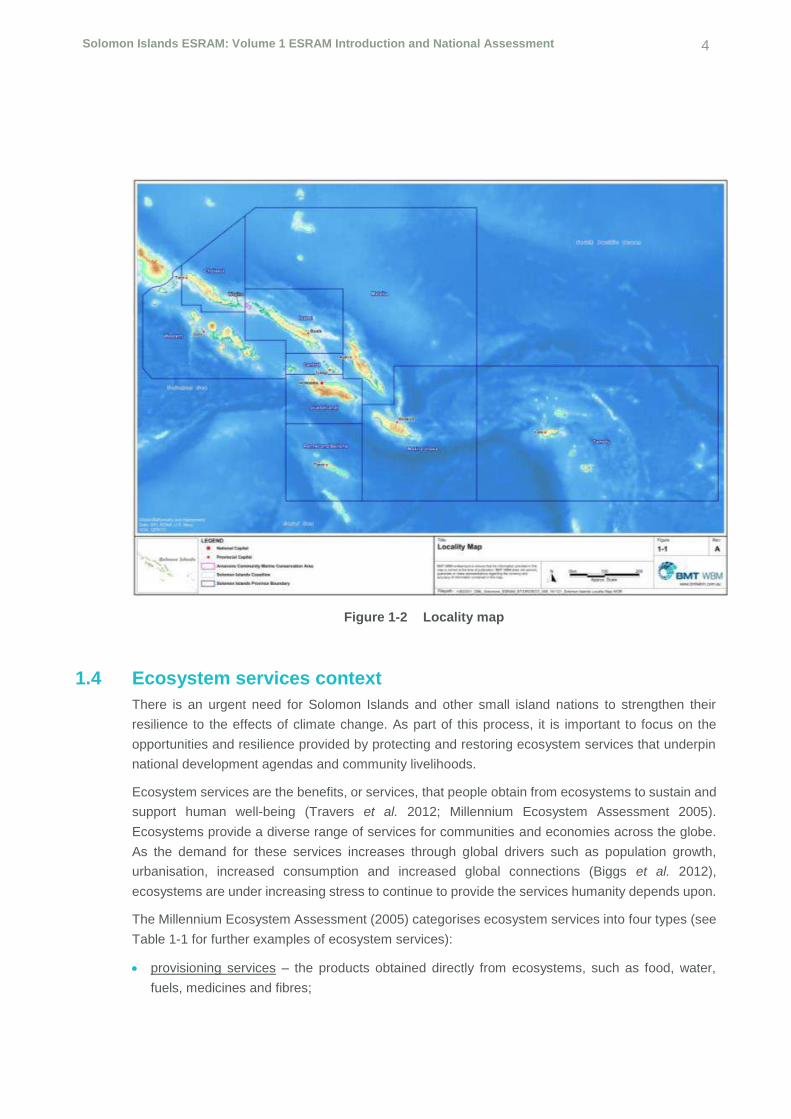
Figure 1-2 Locality map
1.4 Ecosystem services context
There is an urgent need for Solomon Islands and other small island nations to strengthen their
resilience to the effects of climate change. As part of this process, it is important to focus on the
opportunities and resilience provided by protecting and restoring ecosystem services that underpin
national development agendas and community livelihoods.
Ecosystem services are the benefits, or services, that people obtain from ecosystems to sustain and
support human well-being (Travers et al. 2012; Millennium Ecosystem Assessment 2005).
Ecosystems provide a diverse range of services for communities and economies across the globe.
As the demand for these services increases through global drivers such as population growth,
urbanisation, increased consumption and increased global connections (Biggs et al. 2012),
ecosystems are under increasing stress to continue to provide the services humanity depends upon.
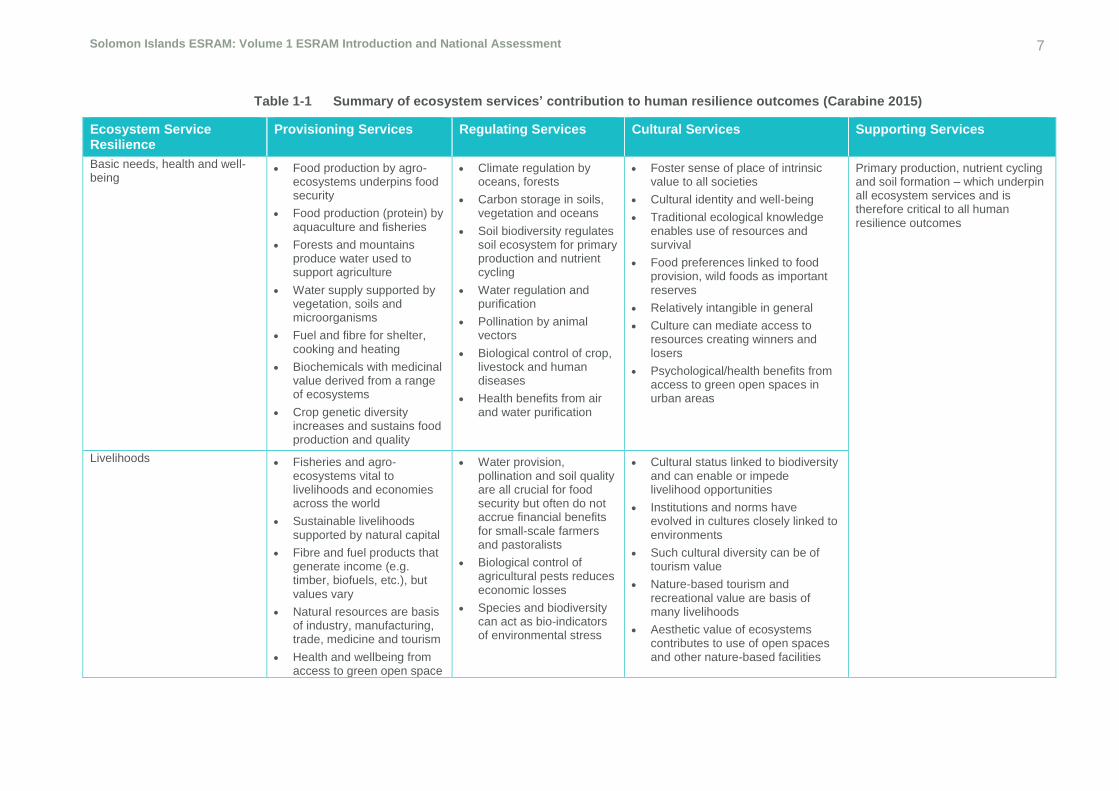
The Millennium Ecosystem Assessment (2005) categorises ecosystem services into four types (see
Table 1-1 for further examples of ecosystem services):
provisioning services – the products obtained directly from ecosystems, such as food, water,
fuels, medicines and fibres;
Solomon Islands ESRAM: Volume 1 ESRAM Introduction and National Assessment 5
regulating services – the benefits obtained from the regulation of ecosystem processes, such as
water regulation, erosion control, regulation of climate cycles and pollination;
cultural services – the largely non-consumptive benefits obtained from ecosystems, such as
spiritual, religious and aesthetic well-being.
supporting services – supporting services encompass the main ecosystem processes that
underpin all other services, such as soil formation, photosynthesis, primary production, nutrients,
and water cycling. Supporting services make it possible for the ecosystems to provide the above
services.
The linkage to and dependence on the natural world is complex and introduces the concept of social-
ecological systems, which is defined by Berkes and Folke (1998) as complex, integrated systems in
which humans are part of nature. One approach to better understand the dynamics of social-
ecological systems is the ‘resilience’ thinking approach (Folke 2006). The United Nations Framework
Convention on Climate Change (IPCC 2007) defines resilience as ‘The ability of a social or ecological
system to absorb disturbances while retaining the same basic structure and ways of functioning, the
capacity for self-organisation, and the capacity to adapt to stress and change’. Resilience describes
the degree to which the system is capable of self-organisation, learning and adaptation (Holling 1973;
Gunderson and Holling 2002; Walker et al. 2004). A resilience-thinking approach attempts to
investigate how these interacting social-ecological systems can best be managed to ensure a
sustainable and resilient supply of the essential ecosystem services on which humanity depends
(Biggs et al. 2015).
Managing ecosystems to conserve and improve ecosystem health is crucial for sustaining the various
ecosystem services important to human well-being. When resilience is strengthened, social-
ecological systems can maintain their structure and function. When resilience is reduced and a
social-ecological system becomes vulnerable, a system may be affected by disturbances that
previously would not have negatively influenced the system. This disturbance may cause the basic
structure and function of a social-ecological system to alter and the ecosystem services that once
benefited humans become diminished (Resilience Alliance 2017).
The Millennium Ecosystem Assessment (2005) reports that approximately 60% of all ecosystem
services and up to 70% of regulating services are being degraded or used unsustainably. A major
compounding factor to human induced ecosystem degradation is climate change, which increases
the frequency and intensity of climate-related disasters, and exacerbates ecosystem degradation
(Munang et al. 2012). These detrimental changes to ecosystems and the effect on the provision of
ecosystem services weaken the resilience of vulnerable ecosystems and societies. Communities
around the world are already vulnerable to the impacts of climate related hazards. Munang et al.
(2012) reports that the number of disasters linked to natural hazards continues to rise, while in recent
times (1975–2008), over 2.2 million people globally have lost their lives in natural hazard-induced
disasters (excluding epidemics), with associated economic losses at approximately USD 1,527.6
billion (UNISDA 2009).
There is growing evidence that ecosystem services are critical to human society resilience, i.e. how
linked social-ecological systems can deal with shocks and stressors (Carabine 2015). Carabine
(2015) defines human resilience to include four outcomes: (1) providing basic needs for health and

Solomon Islands ESRAM: Volume 1 ESRAM Introduction and National Assessment 6
well-being, (2) supporting livelihoods; (3) building social capital, stability and security; and (4)
reducing exposure to natural hazards and enhancing adaptive capacity in a changing climate.
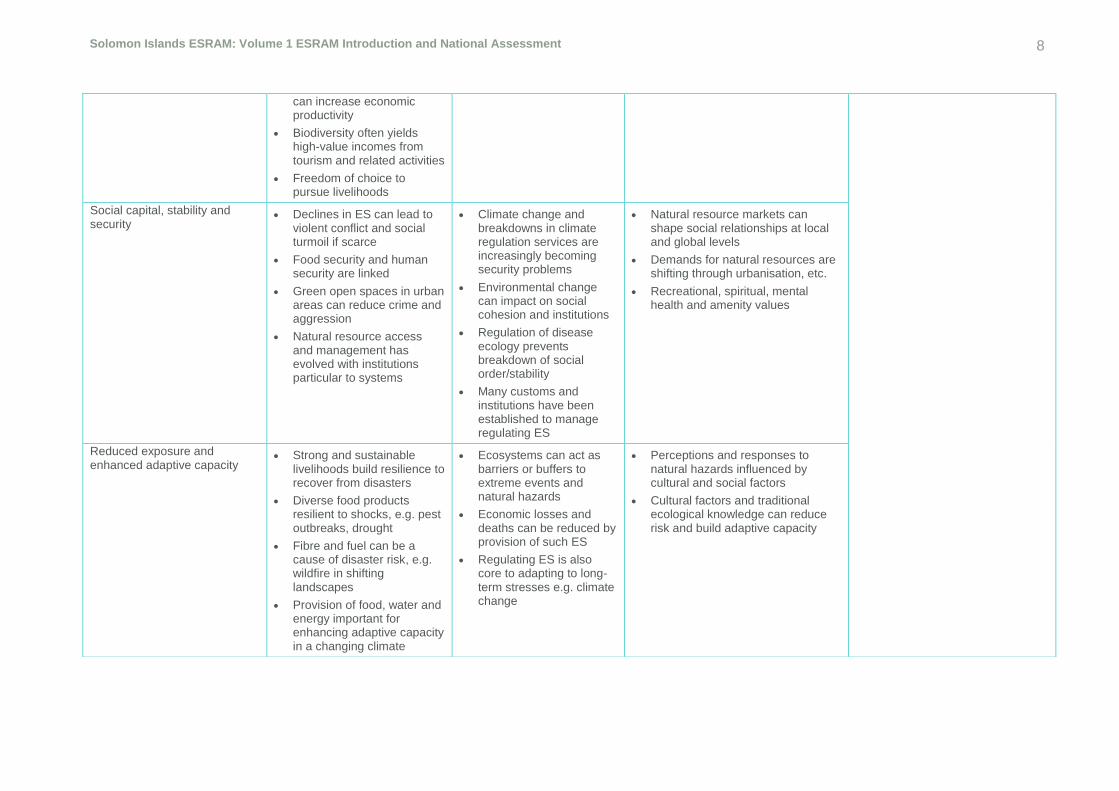
Table 1-1 presents the four ecosystem service types (provisioning, regulating, cultural and
supporting) and how these ecosystem services contribute to the human resilience outcomes listed
above.
Solomon Islands ESRAM: Volume 1 ESRAM Introduction and National Assessment 7
Table 1-1 Summary of ecosystem services’ contribution to human resilience outcomes (Carabine 2015)
Ecosystem Service Resilience
Provisioning Services Regulating Services Cultural Services Supporting Services
Basic needs, health and well-being
Food production by agro- ecosystems underpins food security
Food production (protein) by aquaculture and fisheries
Forests and mountains produce water used to support agriculture
Water supply supported by vegetation, soils and microorganisms
Fuel and fibre for shelter, cooking and heating
Biochemicals with medicinal value derived from a range of ecosystems
Crop genetic diversity increases and sustains food production and quality
Climate regulation by oceans, forests
Carbon storage in soils, vegetation and oceans
Soil biodiversity regulates soil ecosystem for primary production and nutrient cycling
Water regulation and purification
Pollination by animal vectors
Biological control of crop, livestock and human diseases
Health benefits from air and water purification
Foster sense of place of intrinsic value to all societies
Cultural identity and well-being
Traditional ecological knowledge enables use of resources and survival
Food preferences linked to food provision, wild foods as important reserves
Relatively intangible in general
Culture can mediate access to resources creating winners and losers
Psychological/health benefits from access to green open spaces in urban areas
Primary production, nutrient cycling and soil formation – which underpin all ecosystem services and is therefore critical to all human resilience outcomes
Livelihoods Fisheries and agro-ecosystems vital to livelihoods and economies across the world
Sustainable livelihoods supported by natural capital
Fibre and fuel products that generate income (e.g. timber, biofuels, etc.), but values vary
Natural resources are basis of industry, manufacturing, trade, medicine and tourism
Health and wellbeing from access to green open space
Water provision, pollination and soil quality are all crucial for food security but often do not accrue financial benefits for small-scale farmers and pastoralists
Biological control of agricultural pests reduces economic losses
Species and biodiversity can act as bio-indicators of environmental stress
Cultural status linked to biodiversity and can enable or impede livelihood opportunities
Institutions and norms have evolved in cultures closely linked to environments
Such cultural diversity can be of tourism value
Nature-based tourism and recreational value are basis of many livelihoods
Aesthetic value of ecosystems contributes to use of open spaces and other nature-based facilities
Solomon Islands ESRAM: Volume 1 ESRAM Introduction and National Assessment 8
can increase economic productivity
Biodiversity often yields high-value incomes from tourism and related activities
Freedom of choice to pursue livelihoods
Social capital, stability and security
Declines in ES can lead to violent conflict and social turmoil if scarce
Food security and human security are linked
Green open spaces in urban areas can reduce crime and aggression
Natural resource access and management has evolved with institutions particular to systems
Climate change and breakdowns in climate regulation services are increasingly becoming security problems
Environmental change can impact on social cohesion and institutions
Regulation of disease ecology prevents breakdown of social order/stability
Many customs and institutions have been established to manage regulating ES
Natural resource markets can shape social relationships at local and global levels
Demands for natural resources are shifting through urbanisation, etc.
Recreational, spiritual, mental health and amenity values
Reduced exposure and enhanced adaptive capacity
Strong and sustainable livelihoods build resilience to recover from disasters
Diverse food products resilient to shocks, e.g. pest outbreaks, drought
Fibre and fuel can be a cause of disaster risk, e.g. wildfire in shifting landscapes
Provision of food, water and energy important for enhancing adaptive capacity in a changing climate
Ecosystems can act as barriers or buffers to extreme events and natural hazards
Economic losses and deaths can be reduced by provision of such ES
Regulating ES is also core to adapting to long-term stresses e.g. climate change
Perceptions and responses to natural hazards influenced by cultural and social factors
Cultural factors and traditional ecological knowledge can reduce risk and build adaptive capacity
Solomon Islands ESRAM: Volume 1 ESRAM Introduction and National Assessment 9
2 ESRAM methodology
2.1 Study approach
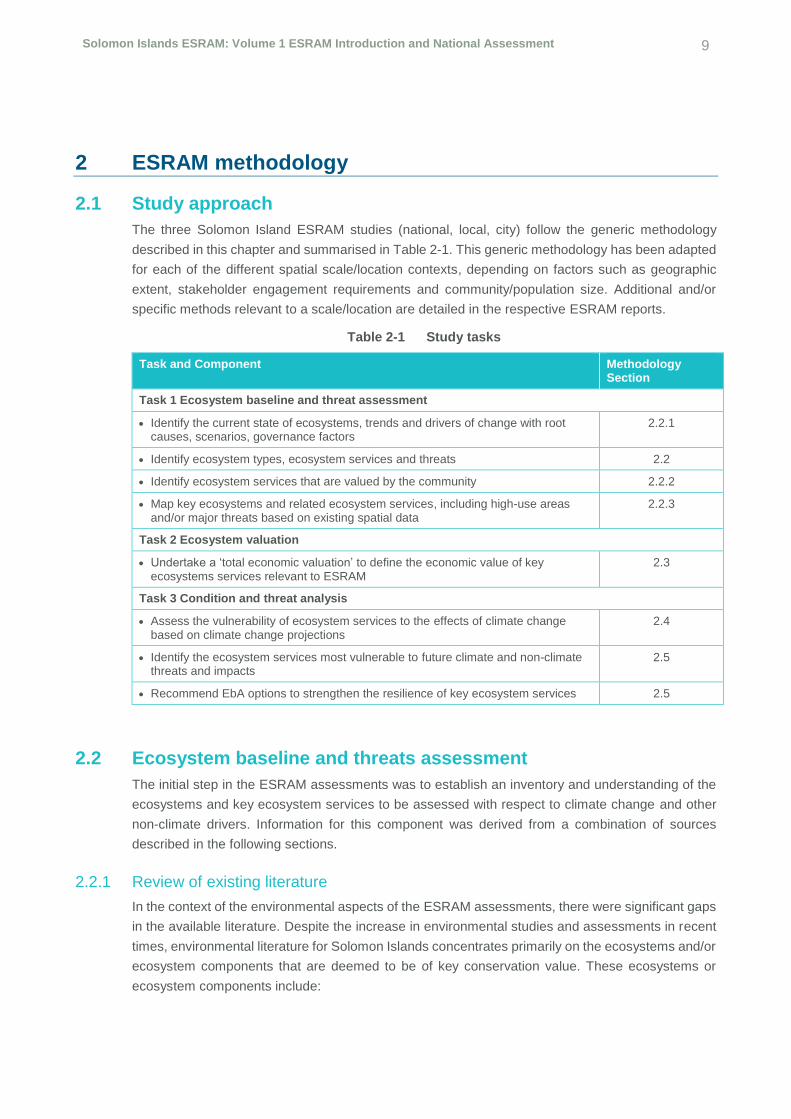
The three Solomon Island ESRAM studies (national, local, city) follow the generic methodology
described in this chapter and summarised in Table 2-1. This generic methodology has been adapted
for each of the different spatial scale/location contexts, depending on factors such as geographic
extent, stakeholder engagement requirements and community/population size. Additional and/or
specific methods relevant to a scale/location are detailed in the respective ESRAM reports.
Table 2-1 Study tasks
Task and Component Methodology Section
Task 1 Ecosystem baseline and threat assessment
Identify the current state of ecosystems, trends and drivers of change with root causes, scenarios, governance factors
2.2.1
Identify ecosystem types, ecosystem services and threats 2.2
Identify ecosystem services that are valued by the community 2.2.2
Map key ecosystems and related ecosystem services, including high-use areas and/or major threats based on existing spatial data
2.2.3
Task 2 Ecosystem valuation
Undertake a ‘total economic valuation’ to define the economic value of key ecosystems services relevant to ESRAM
2.3
Task 3 Condition and threat analysis
Assess the vulnerability of ecosystem services to the effects of climate change based on climate change projections
2.4
Identify the ecosystem services most vulnerable to future climate and non-climate threats and impacts
2.5
Recommend EbA options to strengthen the resilience of key ecosystem services 2.5
2.2 Ecosystem baseline and threats assessment
The initial step in the ESRAM assessments was to establish an inventory and understanding of the
ecosystems and key ecosystem services to be assessed with respect to climate change and other
non-climate drivers. Information for this component was derived from a combination of sources
described in the following sections.
2.2.1 Review of existing literature
In the context of the environmental aspects of the ESRAM assessments, there were significant gaps
in the available literature. Despite the increase in environmental studies and assessments in recent
times, environmental literature for Solomon Islands concentrates primarily on the ecosystems and/or
ecosystem components that are deemed to be of key conservation value. These ecosystems or
ecosystem components include:

Solomon Islands ESRAM: Volume 1 ESRAM Introduction and National Assessment 10
vertebrate terrestrial fauna and avifauna (i.e. birds and mammals), especially endemic fauna (e.g.
Filardi et al. 2007; Pikacha 2008; Pikacha et al. 2012).
areas identified as a high priority for environmental protection due to factors such as a pristine
condition, unique nature, high biodiversity and/or the presence of endemic fauna (e.g. Halpern et
al. 2013; Moseby et al. 2012; Pollard et al. 2013).
Often, these two topics interact to further restrict the scope of the available literature. The result is
that, even for environmental components that have been studied on numerous occasions, the
geographic coverage of available information may still be very limited and there are often extensive
gaps in knowledge and context for other locations. Conversely, where national scale documents exist
among the environmental literature (e.g. Pacific Horizon Group 2008; Sulu et al. 2012; Albert et al.
2013; Lavery et al. 2016), they are typically of a very broad and generic nature. The Solomon Islands
Marine Assessment (Green et al. 2006) is a notable exception, detailing marine survey results
throughout the country in a national scale report.
Ecosystem components of direct economic importance (e.g. to fisheries or forestry industries) are
also captured in the literature. Remaining information gaps relate to major ecosystem components,
both biological and physical, that contribute to ecosystem services. Key examples where there is a
notable paucity of country-specific information include:
invertebrate fauna;
groundwater ecosystems;
phytoplankton / zooplankton;
deep sea habitats and communities;
physico-chemical environmental drivers (i.e. of ecosystem processes and biological
communities); and
unconsolidated (i.e. non-reef) seabed habitats and associated communities.
The smaller scale locations that will be focused on as part of the present project (i.e. Wagina and
Honiara) are rarely mentioned in the environmental literature, in part due to the factors described
below.
(1) Honiara – Being the national capital, Honiara is highly developed and most environmental
values are highly modified or degraded. For this reason, environmental assessments tend to
focus on less disturbed locations elsewhere, or in locations subject to specific industry
developments, such as logging and mining (e.g. Morrison et al. 2007; SMM 2012; Envi-Green
Pacific 2012; Golder Associates 2014).
(5) Wagina Island – Being isolated from both the provincial capital Taro and priority terrestrial
conservation locations throughout Choiseul Province, Wagina has largely been overlooked by
the environmental literature. With the exception of marine works associated with the nearby
Anarvon Marine Conservation Area (Green et al. 2006), the main environmental assessments
to have focused on Wagina Island are the environmental impact assessment(s) relating to the
mining development presently proposed for the island (Envi-Green Pacific 2012; Envi-Green
Pacific 2013).

Solomon Islands ESRAM: Volume 1 ESRAM Introduction and National Assessment 11
2.2.2 Stakeholder workshops
In addition to sourcing existing information, in-country work was generally in the form of stakeholder
consultation workshops and a field component, noting that the format of these varied between
assessments (Table 2-2).
Table 2-2 Overview of stakeholder participation and field approaches
ESRAM Consultation Field
National One-day workshop with key stakeholders, primarily national government representatives (who are generally tertiary qualified, directly involved in environmental work and regularly consulted on environmental issues), to identify key ecosystems, services and threats on a broad national scale
Nil
Honiara Workshop with key stakeholder representatives (e.g. national government, community, local council and local projects) to identify key ecosystems, services and threats, and undertake interactive mapping activities
Site inspections at communities near Mataniko River, Vura District, White River, Independence Valley, Win Valley, waterfront areas of Honiara and other points of interest (i.e. as identified during the workshop activities). Included informal discussions with local community members on an opportunistic basis
Wagina Island
Workshops with each of the four communities to identify key ecosystems, services and threats, and undertake interactive mapping activities
Most detailed field component:
site inspections and guided tours of villages and surrounds
collection of GPS data for spatial validation
field surveys for mapping and qualitatively assess condition
locating water wells (mapping survey and water quality testing)
additional opportunistic observations
Dedicated workshops with representative stakeholders were the primary means of stakeholder
participation and engagement for informing the ESRAM assessments. Overall, six workshops were
undertaken as follows:
National – one workshop with key stakeholder representatives (mainly national government);
Wagina Island – four workshops, one ‘community level’ workshop at each of the four villages on
the island; and
Honiara - one workshop with a variety of key stakeholder representatives.
The field methodology specific to each of the Honiara and Wagina Island assessments is detailed in
the respective report volumes (2 and 3). The workshops had multiple broad objectives, as listed
below.
Provide follow up on earlier PEBACC meetings hosted by SPREP.
Advise attendees about the ESRAM study and its part in the broader PEBACC project.
Solomon Islands ESRAM: Volume 1 ESRAM Introduction and National Assessment 12
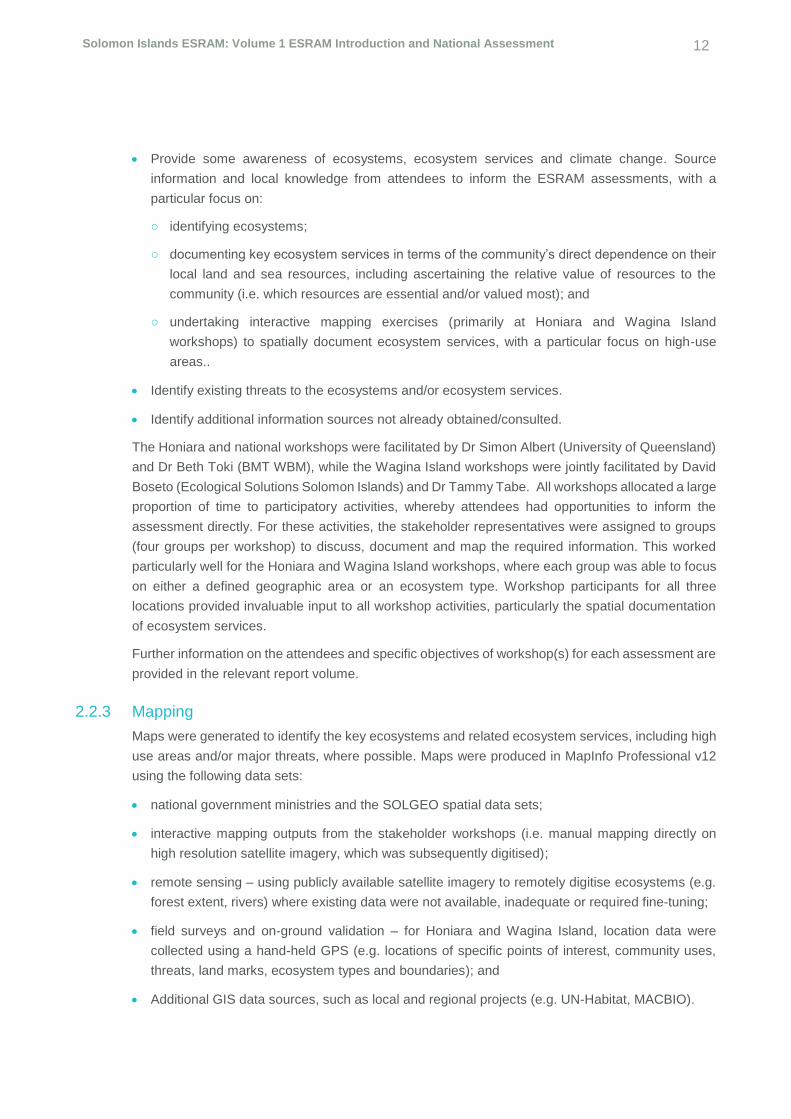
Provide some awareness of ecosystems, ecosystem services and climate change. Source
information and local knowledge from attendees to inform the ESRAM assessments, with a
particular focus on:
○ identifying ecosystems;
○ documenting key ecosystem services in terms of the community’s direct dependence on their
local land and sea resources, including ascertaining the relative value of resources to the
community (i.e. which resources are essential and/or valued most); and
○ undertaking interactive mapping exercises (primarily at Honiara and Wagina Island
workshops) to spatially document ecosystem services, with a particular focus on high-use
areas..
Identify existing threats to the ecosystems and/or ecosystem services.
Identify additional information sources not already obtained/consulted.
The Honiara and national workshops were facilitated by Dr Simon Albert (University of Queensland)
and Dr Beth Toki (BMT WBM), while the Wagina Island workshops were jointly facilitated by David
Boseto (Ecological Solutions Solomon Islands) and Dr Tammy Tabe. All workshops allocated a large
proportion of time to participatory activities, whereby attendees had opportunities to inform the
assessment directly. For these activities, the stakeholder representatives were assigned to groups
(four groups per workshop) to discuss, document and map the required information. This worked
particularly well for the Honiara and Wagina Island workshops, where each group was able to focus
on either a defined geographic area or an ecosystem type. Workshop participants for all three
locations provided invaluable input to all workshop activities, particularly the spatial documentation
of ecosystem services.
Further information on the attendees and specific objectives of workshop(s) for each assessment are
provided in the relevant report volume.
2.2.3 Mapping
Maps were generated to identify the key ecosystems and related ecosystem services, including high
use areas and/or major threats, where possible. Maps were produced in MapInfo Professional v12
using the following data sets:
national government ministries and the SOLGEO spatial data sets;
interactive mapping outputs from the stakeholder workshops (i.e. manual mapping directly on
high resolution satellite imagery, which was subsequently digitised);
remote sensing – using publicly available satellite imagery to remotely digitise ecosystems (e.g.
forest extent, rivers) where existing data were not available, inadequate or required fine-tuning;
field surveys and on-ground validation – for Honiara and Wagina Island, location data were
collected using a hand-held GPS (e.g. locations of specific points of interest, community uses,
threats, land marks, ecosystem types and boundaries); and
Additional GIS data sources, such as local and regional projects (e.g. UN-Habitat, MACBIO).
Solomon Islands ESRAM: Volume 1 ESRAM Introduction and National Assessment 13
2.3 Economic valuations
2.3.1 Economic approach
The purpose of quantifying values as part of the ESRAM process was to provide insights on the
relative extent and magnitude of ecosystems and ecosystem service values across and between
different environments. However, while it may be simple to identify the existence of ecosystem
services, valuing ecosystem goods and services such as clean air, clean water, and biodiversity is
complicated, as these goods are often not traded in markets, meaning that they do not have an
obvious economic value revealed through consumers’ willingness to pay (market prices). As a result,
unregulated markets, or goods and services such as ecosystems services, often become
compromised or collapse. By placing a value on ecosystem services, priorities can be given to
protecting and restoring ecosystems through programmes, policies and actions. Additionally, if
ecosystems and their services are not valued, they may be overused or damaged, as there is no
incentive to protect or conserve the service (King and Mazzotta 2000).
Ecosystem valuations can assist resource managers to deal with the effects of market failures (i.e.
inability of a market to reflect the full social costs or benefits of goods or services), by measuring their
costs to society, in terms of lost economic benefits (King and Mazzotta 2000). These costs to society
can then be imposed on those who are responsible, or can be used to establish the value of actions
to reduce or eliminate environmental impacts.
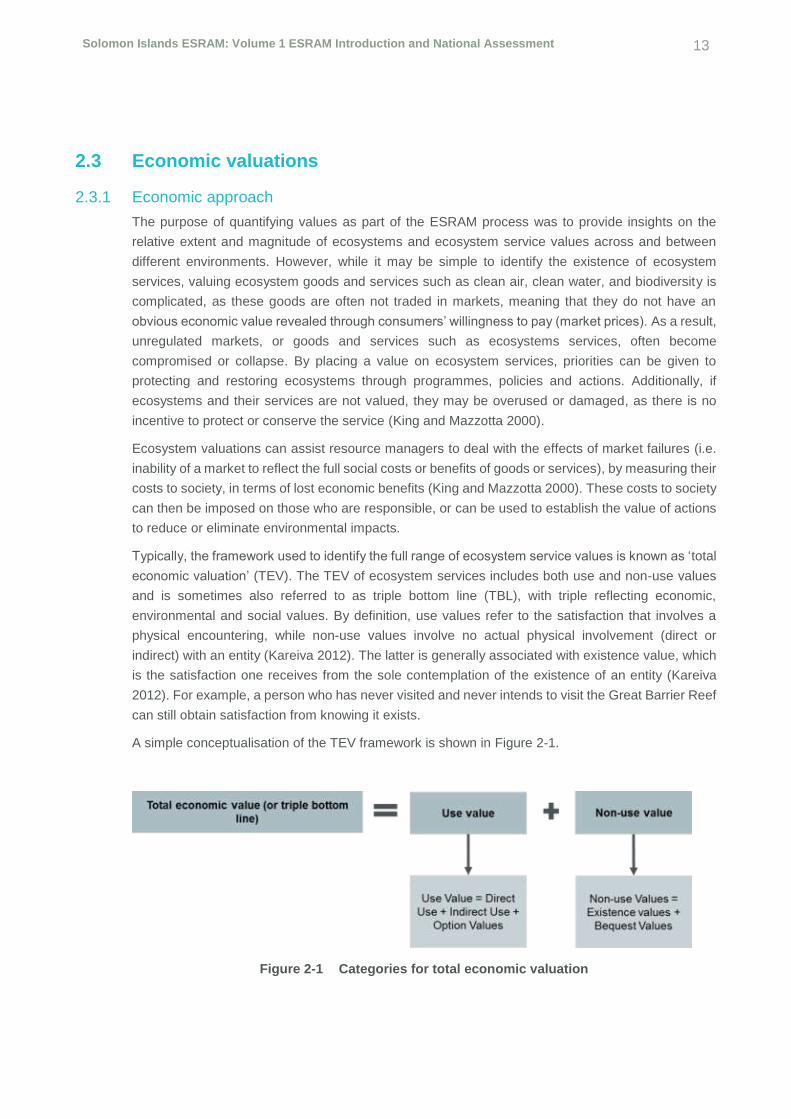
Typically, the framework used to identify the full range of ecosystem service values is known as ‘total
economic valuation’ (TEV). The TEV of ecosystem services includes both use and non-use values
and is sometimes also referred to as triple bottom line (TBL), with triple reflecting economic,
environmental and social values. By definition, use values refer to the satisfaction that involves a
physical encountering, while non-use values involve no actual physical involvement (direct or
indirect) with an entity (Kareiva 2012). The latter is generally associated with existence value, which
is the satisfaction one receives from the sole contemplation of the existence of an entity (Kareiva
2012). For example, a person who has never visited and never intends to visit the Great Barrier Reef
can still obtain satisfaction from knowing it exists.
A simple conceptualisation of the TEV framework is shown in Figure 2-1.
Figure 2-1 Categories for total economic valuation

Solomon Islands ESRAM: Volume 1 ESRAM Introduction and National Assessment 14
For non-use values, there are two broad approaches for determining values: revealed preference
and stated preference. Revealed preference methods utilise prices from related services or products
to estimate non-use values, while stated preference methods utilise survey methods to outline
people’s preferences (and willingness to pay) for social and environmental changes. Both of these
methods require significant resources and time to implement, and it is not always possible to adopt
these methods in practice. A common way to overcome these limitations is to use ‘benefit transfer’.
Benefit transfer in its simplest form uses ecosystem values calculated for one locality to estimate the
values for another (similar) locality. This can be used to leverage previous non-use valuation studies,
as well as to substitute for market values where local information is insufficient (e.g. fish prices from
a neighbouring province or island could be used as a proxy for the target site).
Both the TEV framework and benefit transfer have underpinned the ecosystem service valuation
methodology used for this project. To do this, a relatively straightforward framework was utilised to
identify, describe and value (where possible) the ecosystem services. The same methodology was
used across the three spatial scales considered in the project, with different inputs used as
appropriate. An overview of the approach is shown in Figure 2-2.
Figure 2-2 Overarching methodology for economic valuations
2.3.2 Step 1: Filter and sort ecosystem services
Before valuing the ecosystem services, it was necessary to filter and sort the services to assist with
the valuation process. This was done to help consolidate the valuation requirements and to better
reflect that scope of the project.
The sorting process was guided by ecosystems present at each scale, the identified services,
available valuation studies (for non-use values), and local economic information where available (e.g.
market prices and production data for market values).
Solomon Islands ESRAM: Volume 1 ESRAM Introduction and National Assessment 15
2.3.3 Step 2: Establish ecosystem unit values
Once the ecosystem services were appropriately filtered and considered, an inventory of ecosystem
unit values was developed. Values were developed based on local inputs and valuation studies
(benefit transfer).
To maximise the accuracy and appropriateness of inputs within the project scope and timeline, a
‘bottom-up, top down’ approach was adopted to selecting values. This essentially meant that, where
possible, local scale data and information were used for establishing unit values in the first instance
(i.e. ‘bottom-up’). Where local level figures were not available, figures from other locations and global
averages were identified for benefit transfer (i.e. ‘top-down’) to fill gaps. Values were presented in
2015 dollars, and in two currencies: Solomon Island Dollars (SBD) and United States Dollars (USD).
Where values were used from previous years, consumer price index figures were used to account
for inflation, based on government data. Where conversion was required, the United Nations
Operational Rates of Exchange were used.
This approach helped to maximise the coverage of ecosystem values to ecosystem services whilst
favouring local values. Additionally, more recent and robust information sources were favoured, with
each input being considered on a case-by-case basis.
The most relevant and adaptable local information was found in the MACBIO National Marine
Ecosystem Service Valuation, Solomon Islands (2015), which provides detailed data on ecosystem
service values across the country. This information was used wherever applicable. It should be noted
that, while MACBIO provided a number of relatively robust and applicable values, many were quite
specific and did not necessarily capture the full range of ecosystem services. Furthermore, due to
the different ways in which different studies capture and produce data, there may be duplication
between values. Where this occurs, values for the same or overlapping ecosystem services have
been presented alongside each other for each of the three geographic scales.
Where localised values could not be identified, global median values were used. These values were
sourced from a study by de Groot et al. (2012) which builds on over 320 publications and incorporates
over 655 value estimates.
The data from de Groot et al. were sorted by removing all studies that contained values from
countries ranked as ‘High Income’ countries by the World Bank, as of September 2016, and removing
studies that were published prior to 1990. The median values were then calculated for the remaining
studies.
2.3.4 Step 3: Calculate ecosystem service values
The next step of the process was to generate indicative values for ecosystem services at the target
scale. This was done at a high-level, based on the inventory of values developed in the previous
step, as well as the spatial and population data from other sections of the ESRAM report.
The values generated are indicative only and provide an estimate of their benefits to society –
benefits that would be lost if they were destroyed or gained if they were restored. It must be noted
that values may be more or less accurate in reality. The following passage summarises the need for
and trade-offs in using benefits transfer:
Solomon Islands ESRAM: Volume 1 ESRAM Introduction and National Assessment 16
Although the use of high-quality primary research to estimate values is preferred in
most cases, the realities of the policy process, particularly time and budget
constraints, often dictate that benefit transfer is the only feasible option. Given these
realities, benefit transfer has become a central component of virtually all large-scale
benefit-cost analyses. Hence, while benefit transfers are subject to a variety of
potential errors, the literature increasingly recognizes the need for the resulting
information (Johnston et al. 2015: 20).
2.4 Climate change assessment
2.4.1 Current and future climate projections
A summary of the current climate for Solomon Islands was based on the assessments by Pacific-
Australia Climate Change Science and Adaptation Planning (PACCSAP) and sourced from:
the Australian Bureau of Meteorology and CSIRO (2011). Climate Change in the Pacific: Scientific
Assessment and New Research, Volume 2: Country Reports; and
the Australian Bureau of Meteorology and CSIRO (2014). Climate Variability, Extremes and
Change in the Western Tropical Pacific: New Science and Updated Country Reports.
The climate projections for Solomon Islands for this assessment (Australian Bureau of Meteorology
and CSIRO [2014]) are based on the very high IPCC emissions scenario Representative
Concentration Pathways (RCP) 8.5, the highest scenario of the 5th Assessment Report, for the short
term (2030) and longer term (2090).
To identify immediate potential threats and vulnerabilities of ecosystems services, the 2030
timeframe was selected and 2090 chosen for long-term planning. For adaptation planning purposes,
particularly for long term, i.e. 2090, the RCP 8.5 emission scenario was chosen for this assessment
because it provides the worst case scenarios for projected climate change. In addition, it should be
noted that greenhouse gas emissions are currently tracking at the higher end of the emissions
scenarios. Building ecosystem resilience to worst-case climate induced changes is likely to lead to
significant co-benefits to community livelihoods and the environment.
The latest global climate model (GCM) projections and climate science findings for Solomon Islands
indicate:
very high confidence that El Niño and La Niña events will continue to occur in the future, but it is
not clear whether these events will change in intensity or frequency;
very high confidence that annual mean temperatures and extremely high daily temperatures will
continue to rise;
very high confidence that sea level will continue to rise;
very high confidence that ocean acidification is expected to continue;
very high confidence that the risk of coral bleaching will increase in the future;
high confidence that more extreme rain events will occur;
low confidence that annual rainfall is projected to increase slightly;

Solomon Islands ESRAM: Volume 1 ESRAM Introduction and National Assessment 17
low confidence that drought is projected to decrease slightly;
low confidence that December–March wave heights are projected to decrease; and
low confidence that there will be no significant changes projected in June–September waves.
Refer to Appendix B for further information on the data sets used by PACCSAP for Solomon Islands,
as well as further information on emission scenarios.

Solomon Islands ESRAM: Volume 1 ESRAM Introduction and National Assessment 18
Figure 2-3 Ecosystems and their services for the Solomon Islands

Solomon Islands ESRAM: Volume 1 ESRAM Introduction and National Assessment 19
2.4.2 Climate change vulnerability assessment
The key objective of ecosystem-based adaptation to climate change is to develop solutions that will
help decrease vulnerability and increase the resilience of communities and ecosystems to climate
change threats. The vulnerability of ecosystems to climate change is the degree to which ecosystems
are susceptible to the adverse effects of climate change, which is a function of its exposure to climate
stimuli, sensitivity of the service to these stimuli, and its adaptive capacity to climate change, as
defined below (IPCC 2007).
Exposure refers to the nature and degree to which an ecosystem is exposed to significant climatic
variations or threats.
Sensitivity refers to the degree to which an ecosystem is affected, either adversely or
beneficially, by climate-related stimuli. The effect may be direct (e.g. coral bleaching in response
to temperature rise) or indirect (e.g. seagrass dieback due to sedimentation from extreme rainfall
events).
Adaptive capacity refers to the ability of an ecosystem to adjust to climate change, to moderate
potential damages, to take advantage of opportunities, or to cope with the consequences.
A climate change vulnerability assessment was undertaken, based on exposure, sensitivity and
adaptive capacity of key ecosystem services to potential climate change threats identified for
Solomon Islands. This assessment was based on the process presented in Figure 2-4 and outlined
below.
Figure 2-4 Climate change vulnerability assessment conceptual framework

Solomon Islands ESRAM: Volume 1 ESRAM Introduction and National Assessment 20
(1) Identification of provisioning, regulating, supporting and cultural ecosystem services
(2) For each climate change threat, the vulnerability of each ecosystem service was evaluated.
In order to do this, each ecosystem service was given a score between 1 and 3 for exposure
and sensitivity (1 = low, 2 = moderate, 3 = high).
(3) The exposure and sensitivity ratings were used to calculate the potential impact of the climate
change threat to each ecosystem service, where:
Potential Impact = Exposure x Sensitivity
(4) The adaptive capacity of the ecosystem service to the climate change threat considered the
vulnerabilities of both natural and human systems and the links between them, and was scored
between 1 and 3, where:
1 = ecosystem service has a high adaptive capacity to climate change threat (e.g. food
gardens can be readily relocated inland in response to sea-level rise)
2 = ecosystem service has moderate adaptive capacity to climate change threat (e.g.
saltmarsh has some adaptive capacity to migrate with sea-level rise)
3 = ecosystem service has low adaptive capacity to climate change threat (e.g. reef
has low adaptive capacity to aragonite concentrations <3)
(5) The product of the potential impact ranking and adaptive capacity was calculated to determine
the overall vulnerability of the ecosystem service to the climate change threat, where:
Vulnerability = Potential Impact 𝑥 Adaptive Capacity
Ecosystems services that scored 18 or more are predicted to be highly to very highly vulnerable to
the specified climate change variable for 2030 and/or 2090. The results of the vulnerability
assessment were used to identify adaptation management options.
This vulnerability assessment has used a similar approach to the assessment undertaken in the
Solomon Islands National Report: TA7394-REG: Strengthening the capacity of developing member
countries to respond to climate change (International Centre for Environmental Management 2012).
2.5 ESRAM study outcomes
The resilience of ecosystem services to human-induced and climate change impacts was assessed,
based on the information obtained from the tasks outlined above, including: the current state of
ecosystems; social-economic and ecological trends; drivers of change and environment
consequences, scenarios, and governance factors; key ecosystems and ecosystem services utilised
by Solomon Island communities and economies; and the economic value of ecosystem services.
Based on these findings, recommended EbA options were compiled in order to guide the adaptation
and management of ecosystem services vulnerable to the existing and future impacts of climate-
related and human-induced threats identified at the national scale. Potential key stakeholder groups
and organisations were also identified to support, enable and implement EbA options.

Solomon Islands ESRAM: Volume 1 ESRAM Introduction and National Assessment 21
3 National scale ESRAM – context
This chapter provides relevant context for the national scale ESRAM assessment, including:
additional methodology, primarily providing further stakeholder workshop details and grouping of
ecosystem services for valuation; and
information about the national setting, such as the national socio-economic profile, introduction to
local biodiversity and conservation, national governance and climate change governance.
3.1 Specific methodology
The following reports provide the primary existing information that forms the underlying basis and
understanding for ecosystems at a national scale in this assessment, and the current state of
ecosystems, trends and drivers of change, scenarios and governance factors (see Section 4). The
reports listed below should be referred to for further context and information.
Solomon Islands State of the Environment Report 2008 (Pacific Horizon 2008)
Freshwater biotas of the Solomon Islands (Polhemus et al. 2008)
Solomon Islands Forest Life – Information on biology and management of forest resources
(Lavery et al. 2016)
State of the Coral Reefs of Solomon Islands (Sulu et al. 2012)
Solomon Islands Marine Life: information on biology and management of marine resources (Albert
et al. 2013)
State of Conservation In Solomon Islands – Country Report 2013 (SPREP 2016)
Solomon Islands Marine Assessment (Green et al. 2006)
The dedicated stakeholder workshop for this assessment provided the primary means for focussing
the scope of the assessment (i.e. stakeholder liaison and participation during the workshop was used
to identify what the ‘key’ ecosystems and ecosystem services were). Objectives specific to the
national ESRAM stakeholder workshop were to:
acquire inputs and advice from representative key stakeholders, especially representatives from
national government ministries;
define the focus of the assessment – i.e. what are the ‘key’ ecosystem services and where are
they most important?
identify key existing threats at the national scale; and
identify available existing information and data for further informing the assessment (e.g. existing
spatial data sources).
The stakeholder workshop was held in Honiara on 9 August 2016 and was attended by 26
participants representing the following organisations:
Ministry of Environment, Climate Change, Disaster Management and Meteorology
Solomon Islands ESRAM: Volume 1 ESRAM Introduction and National Assessment 22
Ministry of Fisheries and Marine Resources
Ministry of Forestry and Research
Ministry of Infrastructure and Development
Ministry of Development, Planning and Aid Coordination
Solomon Island Community Resilience to Climate and Disaster Risk Project (CRISP)
Solomon Island Water Sector Adaptation Project (UNDP)
Prime Minister’s Office
UN-Habitat project
Solomon Islands National University
Ecological Solutions SI
SPREP
WWF-Pacific.
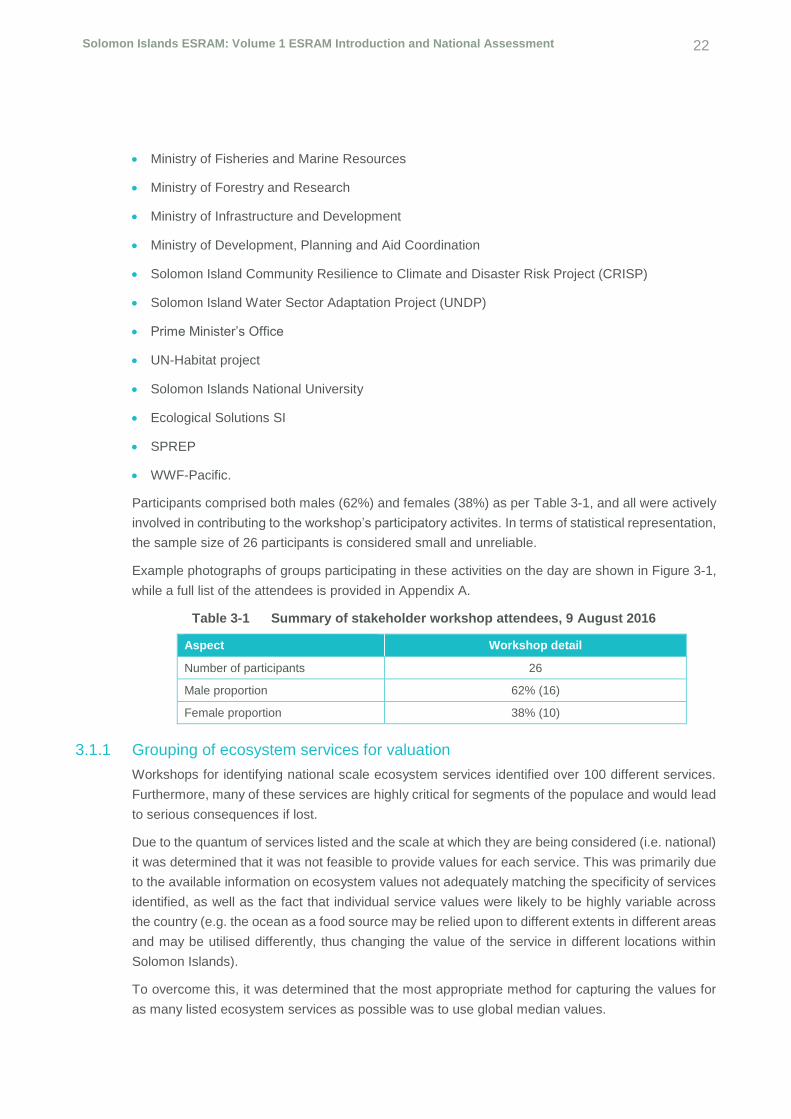
Participants comprised both males (62%) and females (38%) as per Table 3-1, and all were actively
involved in contributing to the workshop’s participatory activites. In terms of statistical representation,
the sample size of 26 participants is considered small and unreliable.
Example photographs of groups participating in these activities on the day are shown in Figure 3-1,
while a full list of the attendees is provided in Appendix A.
Table 3-1 Summary of stakeholder workshop attendees, 9 August 2016
Aspect Workshop detail
Number of participants 26
Male proportion 62% (16)
Female proportion 38% (10)
3.1.1 Grouping of ecosystem services for valuation
Workshops for identifying national scale ecosystem services identified over 100 different services.
Furthermore, many of these services are highly critical for segments of the populace and would lead
to serious consequences if lost.
Due to the quantum of services listed and the scale at which they are being considered (i.e. national)
it was determined that it was not feasible to provide values for each service. This was primarily due
to the available information on ecosystem values not adequately matching the specificity of services
identified, as well as the fact that individual service values were likely to be highly variable across
the country (e.g. the ocean as a food source may be relied upon to different extents in different areas
and may be utilised differently, thus changing the value of the service in different locations within
Solomon Islands).
To overcome this, it was determined that the most appropriate method for capturing the values for
as many listed ecosystem services as possible was to use global median values.

Solomon Islands ESRAM: Volume 1 ESRAM Introduction and National Assessment 23
To achieve this, representative ecosystems were grouped to match the biomes defined in the global
median values used for the project (see de Groot et al. 2012). This was done to avoid duplication,
whilst ensuring as many of the ecosystems described above were considered. The revised list of
ecosystems selected for valuation includes:
coral reefs
coastal systems
coastal wetlands
freshwater lakes and rivers
inland wetlands
tropical forests
grasslands.
The ecosystems and services that could not be assessed were groundwater and
plantations/gardens. Groundwater, while an exceptionally important ecosystem service, has been
poorly captured in past ecosystem valuation studies and there is not a reliable global value that can
be applied in the same manner as other ecosystem services (see Greibler and Avramov 2013 for
further information). While groundwater values can be readily broadly defined (e.g. drinking water
supply, water purification), relevant information was not available or applicable to the national scale,
and was also not representative of the full range of ecosystem services from groundwater (see Brink
et al. 2011).
Plantations and gardens provide a range of services and products to humans, and can also perform
ecosystem services, such as regulation of soil and water quality. However, at the same time,
agricultural practices (including crops and gardens) can also cause ecosystem disservices, e.g.
contaminating water and increasing sedimentation run-off. The exact value of these types of systems
are therefore a function of the services and disservices they provide and vary greatly, depending on
the land-use type and the natural environment it is replacing. It is not feasible to provide a high-level
value that could be applied to cultivated land across Solomon Islands.
Despite this, the project team considered, where plausible, the economic benefits of agricultural
production in weighing up the costs and benefits in the options assessment phase of the project.
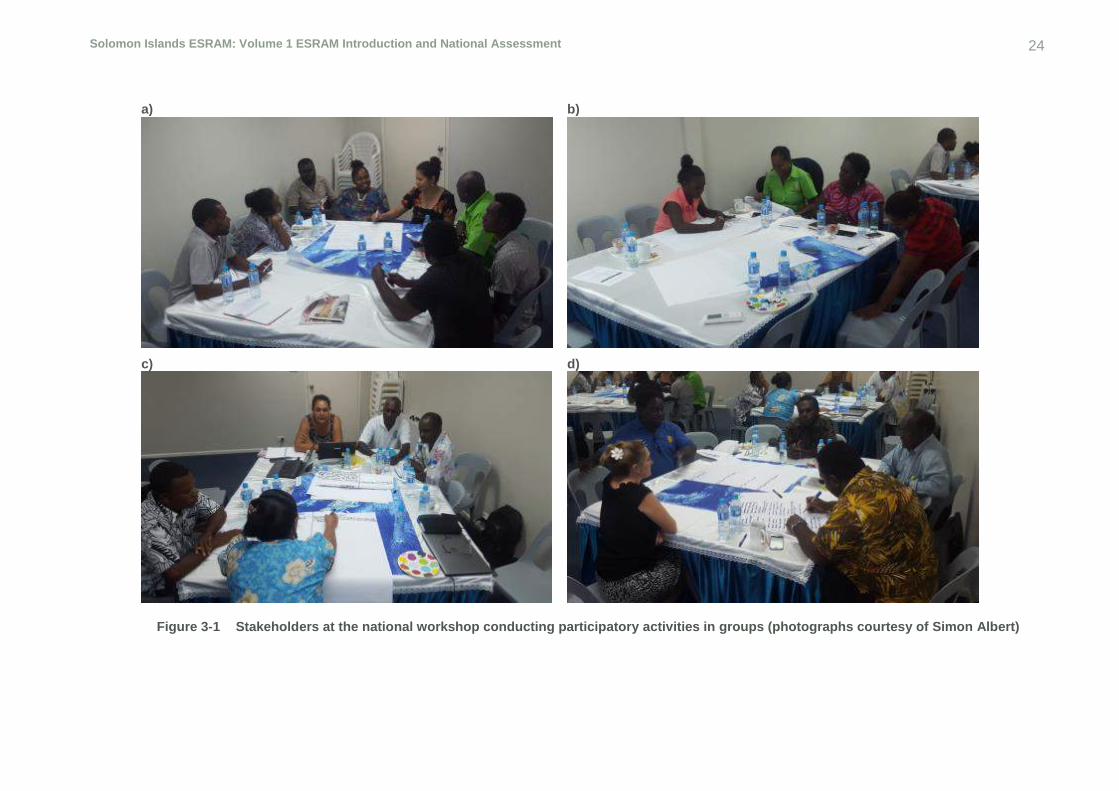
Solomon Islands ESRAM: Volume 1 ESRAM Introduction and National Assessment 24
a) b)
c) d)
Figure 3-1 Stakeholders at the national workshop conducting participatory activities in groups (photographs courtesy of Simon Albert)

Solomon Islands ESRAM: Volume 1 ESRAM Introduction and National Assessment 25
3.2 Geographic setting
Solomon Islands is an island state, located in the south-west Pacific Ocean and spread across the
third largest archipelago in the South Pacific (SPC 2008; Pollard et al. 2014). Located between 5-
12°S and 152-170°E, the archipelago comprises a double chain of approximately 1000 islands
extending over 1450 km in a south-eastern direction (Mueller-Dombois and Fosberg 1998; Filardi et
al. 2007). It includes seven major islands groups (Guadalcanal, Malaita, Makira-Ulawa, Isabel, the
New Georgia Group, Rennell and Bellona, and Choiseul), and over 900 smaller islands, islets, atolls
and cayes (Filardi et al. 2007).
Being an island state, the nation has a relatively small land area of around 28,785 km2 and an
extensive total marine area of around 1.3 million km2 (Gough et al. 2010; Pollard et al. 2014).
Nine of the larger islands exceed 900 m in elevation (Guadalcanal 2450 m, Kolombangara 1768 m,
Isabel 1250 m, Rendova 1063 m, Malaita 1280 m, New Georgia 1006 m, Vangunu 1124 m, Makira
1040 m, Choiseul 970 m) (Filardi et al. 2007).
The volcanic islands are mostly steep, with river systems that are usually short (<100 km) and
watershed areas that vary in size, depending on local terrain and topography (Gehrke et al. 2011;
Boseto et al. 2016).
3.3 National socio-economic profile
The population of Solomon Islands in 2014 was approximately 609,800, with a rapid annual growth
rate of 2.07% (SPREP 2016). The UN classifies Solomon Islands as a ‘Least Developed Nation’
with most people living in coastal villages, practising a subsistence lifestyle, and retaining customary
ownership of their land and shallow seas.
The population can be divided into urban and rural residents. Approximately one-fifth (102,030) of
the population during 2009 was classified as urban dwellers (2009 census data), of which over 70%
resided in the capital city of Honiara. With an annual urban growth rate of 4.7%, it is anticipated that
by 2020 approximately 25% of the Solomon Island population will be living in urban areas if the
present trend continues (UN-Habitat 2012). While urbanisation in Solomon Islands is a relatively
recent phenomenon, the predicted urban growth rate is expected to present confronting challenges,
such as urban poverty, unemployment, housing, environmental risk, land administration, and
infrastructure provision and maintenance (UN-Habitat 2012).
Poverty in Solomon Islands is widespread and characterised by a lack of access to essential services
and income-earning opportunities (Solomon Islands Government Ministry of Development Planning
and Aid Coordination 2013). In 2013, Solomon Islands had an estimated GDP per capita of USD
3,400 (SPREP 2016). Income distribution is inequitable, with rural expenditure levels significantly
below expenditure levels in urban areas. Similarly, social indicators, although improving, are among
the worst in the region (ibid). Employment rates are somewhat unclear. The 2009 census reports a
rate of only 2.0% unemployment but, under the census definition, the ‘employed’ include subsistence
workers, who make up more than 50% of the workforce (ibid).
With more than 80% of the labour force engaged in subsistence agriculture and fishing (Filardi et al.
2007) in rural communities, the need for high-income generation is low. However, cash is still
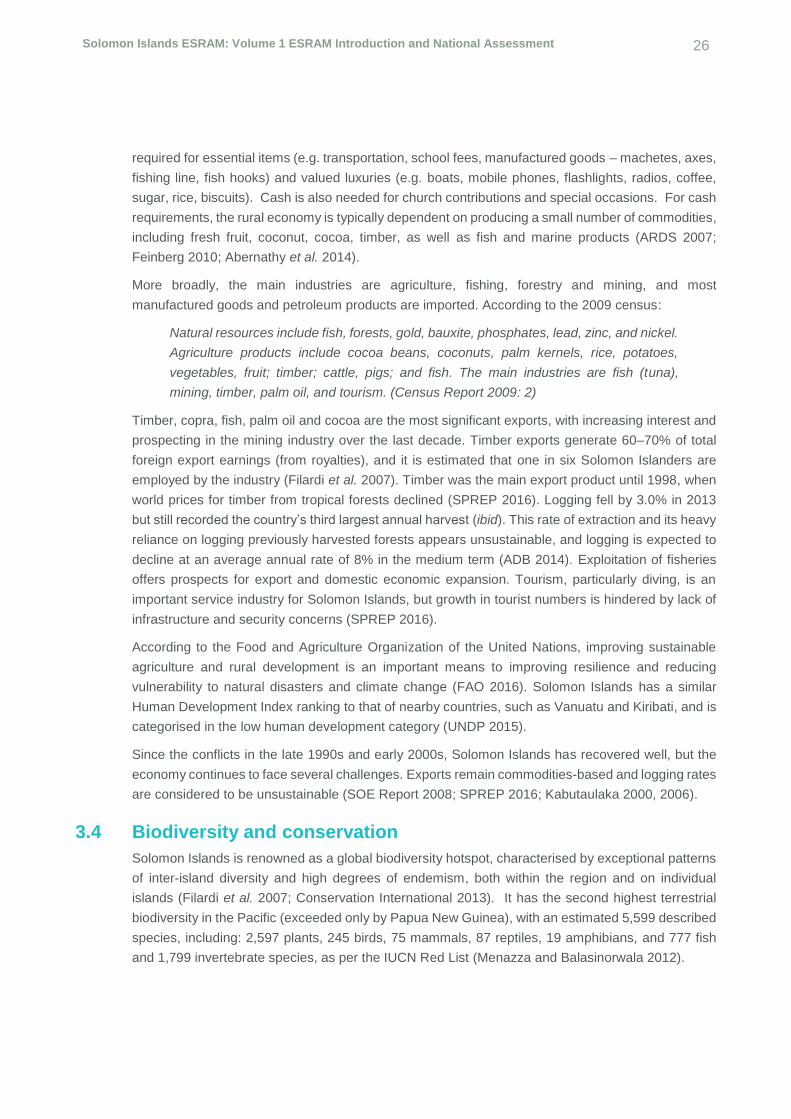
Solomon Islands ESRAM: Volume 1 ESRAM Introduction and National Assessment 26
required for essential items (e.g. transportation, school fees, manufactured goods – machetes, axes,
fishing line, fish hooks) and valued luxuries (e.g. boats, mobile phones, flashlights, radios, coffee,
sugar, rice, biscuits). Cash is also needed for church contributions and special occasions. For cash
requirements, the rural economy is typically dependent on producing a small number of commodities,
including fresh fruit, coconut, cocoa, timber, as well as fish and marine products (ARDS 2007;
Feinberg 2010; Abernathy et al. 2014).
More broadly, the main industries are agriculture, fishing, forestry and mining, and most
manufactured goods and petroleum products are imported. According to the 2009 census:
Natural resources include fish, forests, gold, bauxite, phosphates, lead, zinc, and nickel.
Agriculture products include cocoa beans, coconuts, palm kernels, rice, potatoes,
vegetables, fruit; timber; cattle, pigs; and fish. The main industries are fish (tuna),
mining, timber, palm oil, and tourism. (Census Report 2009: 2)
Timber, copra, fish, palm oil and cocoa are the most significant exports, with increasing interest and
prospecting in the mining industry over the last decade. Timber exports generate 60–70% of total
foreign export earnings (from royalties), and it is estimated that one in six Solomon Islanders are
employed by the industry (Filardi et al. 2007). Timber was the main export product until 1998, when
world prices for timber from tropical forests declined (SPREP 2016). Logging fell by 3.0% in 2013
but still recorded the country’s third largest annual harvest (ibid). This rate of extraction and its heavy
reliance on logging previously harvested forests appears unsustainable, and logging is expected to
decline at an average annual rate of 8% in the medium term (ADB 2014). Exploitation of fisheries
offers prospects for export and domestic economic expansion. Tourism, particularly diving, is an
important service industry for Solomon Islands, but growth in tourist numbers is hindered by lack of
infrastructure and security concerns (SPREP 2016).
According to the Food and Agriculture Organization of the United Nations, improving sustainable
agriculture and rural development is an important means to improving resilience and reducing
vulnerability to natural disasters and climate change (FAO 2016). Solomon Islands has a similar
Human Development Index ranking to that of nearby countries, such as Vanuatu and Kiribati, and is
categorised in the low human development category (UNDP 2015).
Since the conflicts in the late 1990s and early 2000s, Solomon Islands has recovered well, but the
economy continues to face several challenges. Exports remain commodities-based and logging rates
are considered to be unsustainable (SOE Report 2008; SPREP 2016; Kabutaulaka 2000, 2006).
3.4 Biodiversity and conservation
Solomon Islands is renowned as a global biodiversity hotspot, characterised by exceptional patterns
of inter-island diversity and high degrees of endemism, both within the region and on individual
islands (Filardi et al. 2007; Conservation International 2013). It has the second highest terrestrial
biodiversity in the Pacific (exceeded only by Papua New Guinea), with an estimated 5,599 described
species, including: 2,597 plants, 245 birds, 75 mammals, 87 reptiles, 19 amphibians, and 777 fish
and 1,799 invertebrate species, as per the IUCN Red List (Menazza and Balasinorwala 2012).

Solomon Islands ESRAM: Volume 1 ESRAM Introduction and National Assessment 27
Solomon Islands is also part of the Coral Triangle, the global centre of marine biodiversity that
comprises 76% of the world’s corals and 37% of the world’s coral reef fish species, in an area that
covers less than 2% of the planet’s oceans (TNC 2008).
While basic taxonomic and distribution data are lacking for many taxa (Filardi et al. 2007) and it is
likely that many species remain undescribed, the following is noted from the existing literature.
Patterns of avian endemism are particularly noteworthy and have received the most attention
(ibid). While at least 163 species of breeding land birds, including 72 endemic species, are known
(Ciamond and Mayr 1976), an additional 62 bird species are represented by unique sub-species
on different islands throughout the country (Morrison et al. (2007). Overall, the Solomon group’s
endemic bird area (EBA) has the greatest number of restricted range bird species of all the world’s
EBAs. Further, most of the larger islands have their own endemic species and/or subspecies
(Filardi et al. 2007).
Other taxonomic groups also reveal high endemism; more than half of the known palm and orchid
species are endemic, as are 75% of climbing Pandanus species, 21% mammals and there is high
reptile and amphibian endemism – over 80% of all frogs are endemic (Filardi et al. 2007).
Tetepare Island deserves a special mention from a biodiversity and conservation perspective. It
is the largest uninhabited island in the South Pacific, totalling 18 square km, retaining >96% of its
old growth rainforest, and supporting several endemic and rare species (Moseby et al. 2012).
The island is recognised as an area of international biological and conservation significance by
those who have carried out biological surveys there (e.g. Read and Moseby 2006; Keppel 2007;
Jenkins and Boseto 2007), and it supports important refuge populations for species of
international conservation significance (Jenkins and Boseto 2007).
The rich biological diversity and high endemicity of Solomon Islands is most likely due to the area’s
geographical complexity (Conservation International 2013). Numerous tectonic events between the
Pacific and Australian tectonic plates formed a diverse range of islands of varying age and isolation
(Meuller-Dubois 1998). The islands have never been in land contact with the Asian or Australian
continents, or New Guinea Island, allowing a unique tropical rainforest flora and fauna to evolve with
high levels of endemism (Furusawa et al. 2014).
Throughout Solomon Islands, environmental and natural resource management is predominantly
community based, in line with the local customary tenure and governance system. Approximately
87% of the land is classified as ’customary land’. The land and nearshore sea is both owned and
managed by traditional genealogical groups, such that rural communities themselves have autonomy
over their natural resources and the right both to close or to provide resource access (Abernathy et
al. 2014; Furusawa et al. 2014).
Tribal chiefs have the responsibility to manage both land and marine resources for the benefit of the
tribe, traditionally involving decisions over when to close fishing access to reefs and where to use
land for farming and dwellings (Aswani 1999). More recently, communities have been leasing rights
to fisheries or timber, primarily to companies from Malaysia, China and Japan (Halpern et al. 2013).
Given the customary tenure system, formal conservation initiatives are most commonly in the form
of community-based resource management (CBRM). More than 350 communities are known to have
carried out some sort of CBRM (Govan et al. 2015).

Solomon Islands ESRAM: Volume 1 ESRAM Introduction and National Assessment 28
Government policies also recognise the value of CBRM, even for achieving objectives associated
with climate change. For example, the Solomon Islands National Plan of Action for the Coral Triangle
Initiative on Coral Reefs, Fisheries and Food Security (SI-NPOA CTI), and subsequently the Inshore
Fisheries Strategy (2010–2012), both recommend CBRM as the basis of resource management to
achieve a variety of goals covering climate change vulnerability and adaptation, ecosystem
approaches, food security, management of key species and habitats, and appropriate use of
protected areas (Govan et al. 2015).
In terms of protected areas, a relatively small proportion of the country is protected by formal
protected areas, with 28 land based and 24 marine protected areas formally recognised (PIPAP
2016). The Pacific Islands Protected Areas Portal (PIPAP 2016) states that 2.21% (644 km2) of the
total land area of Solomon Islands is protected, while 0.12% (1,926 km2) of the total marine area is
protected (WDPA 2013). The largest managed areas include (Figure 3-2):
East Rennell World Heritage Area (87,500 ha);
Anarvon Community Marine Conservation Area (16,187 ha); and
a notable network of marine protected areas in Temotu Province.
All other managed areas are typically small scale CBRM areas (Figure 3-2), which generally aim to
achieve sustainable resource use and secure resources for future exploitation (Halpern et al. 2013;
Abernathy et al. 2014).
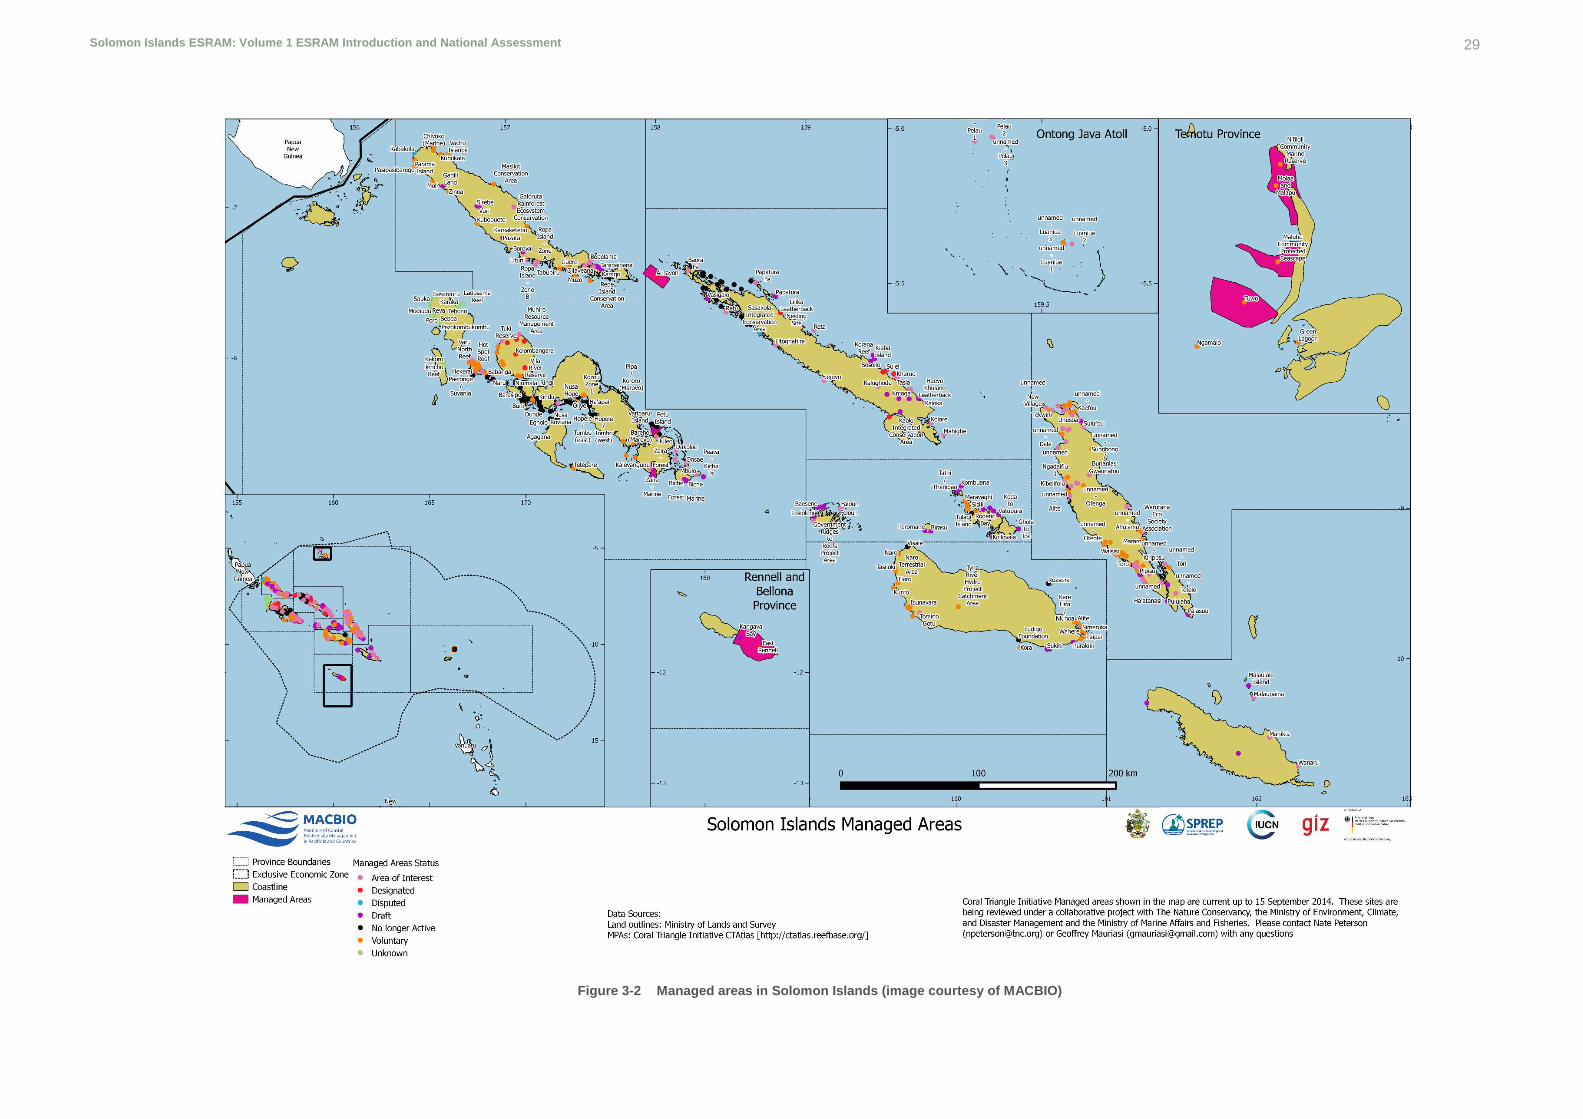
Solomon Islands ESRAM: Volume 1 ESRAM Introduction and National Assessment 29
Figure 3-2 Managed areas in Solomon Islands (image courtesy of MACBIO)
Solomon Islands ESRAM: Volume 1 ESRAM Introduction and National Assessment 30
While the total area of protected and/or otherwise formally managed areas remains small, there has
been considerable recent investment in identifying areas of conservation significance for the
purposes of informing future conservation planning and development decisions. In particular, the
following have been identified at the national scale (Figure 3-4 and Figure 3-5).
Key Biodiversity Areas (KBAs). KBAs are sites that contribute to the global persistence of
biodiversity, including vital habitat for threatened plant and animal species in terrestrial, freshwater
and marine ecosystems (BirdLife International 2017).
Ecologically and Biologically Significant Areas (EBSAs). EBSAs are areas which, through
scientific criteria, have been identified as important for the healthy functioning of our oceans and
the services that they provide (CBD Secretariat 2012).
Important Bird and Biodiversity Areas (IBAs). IBAs are KBAs identified for birds, using
internationally agreed criteria applied locally by experts (BirdLife International 2017).
These are predominantly terrestrial areas of significance, and together encompass a large proportion
of the total land area. Further information on individual KBAs, EBSAs and IBAs is provided in the
Solomon Island Government’s National Biodiversity Strategic Action Plan (NBSAP) (Pauku and Lapo
2009) and supporting documents such as Filardi et al. (2007).
In the context of climate change and EbA, these significant areas are likely indicative of high value
or intact ecosystems that provide a range of ecosystem services at the national scale (i.e. services
in addition to those relating to biodiversity and conservation). They provide a starting point for
considering future adaptation and resilience-building initiatives, particularly where these significant
areas coincide with areas of high resource use or other existing/future threats.
Future conservation efforts, including those associated with EbA initiatives, should continue to
consider a ‘ridge-to-reef’ approach, which is already recognised as a holistic conservation strategy
that is appropriate in Solomon Islands. This approach focused on the importance of biological and
physical interactions and linkages between ecosystems (see example in Figure 3-3). This could
include, for example, the need to restrict
terrestrial vegetation clearing to reduce
sediment run-off to a nearby marine
protected area (MPA). Its importance is
also highlighted by freshwater fish. Since
amphidromy is the dominant life history
strategy for freshwater fish in Solomon
Islands (i.e. 25% of species rely on access
to move between fresh and saline waters),
conserving adequate ecological links
between freshwaters and estuarine/marine
waters is critical (Jenkins and Boseto 2007;
Jenkins et al. 2008).
Figure 3-3 Example of ridge-to-reef benefits (SPREP 2014)

Solomon Islands ESRAM: Volume 1 ESRAM Introduction and National Assessment 31
Figure 3-4 Key Biodiversity Areas (KBAs) and Ecologically and Biologically Significant Areas (EBSAs) (image courtesy MACBIO)
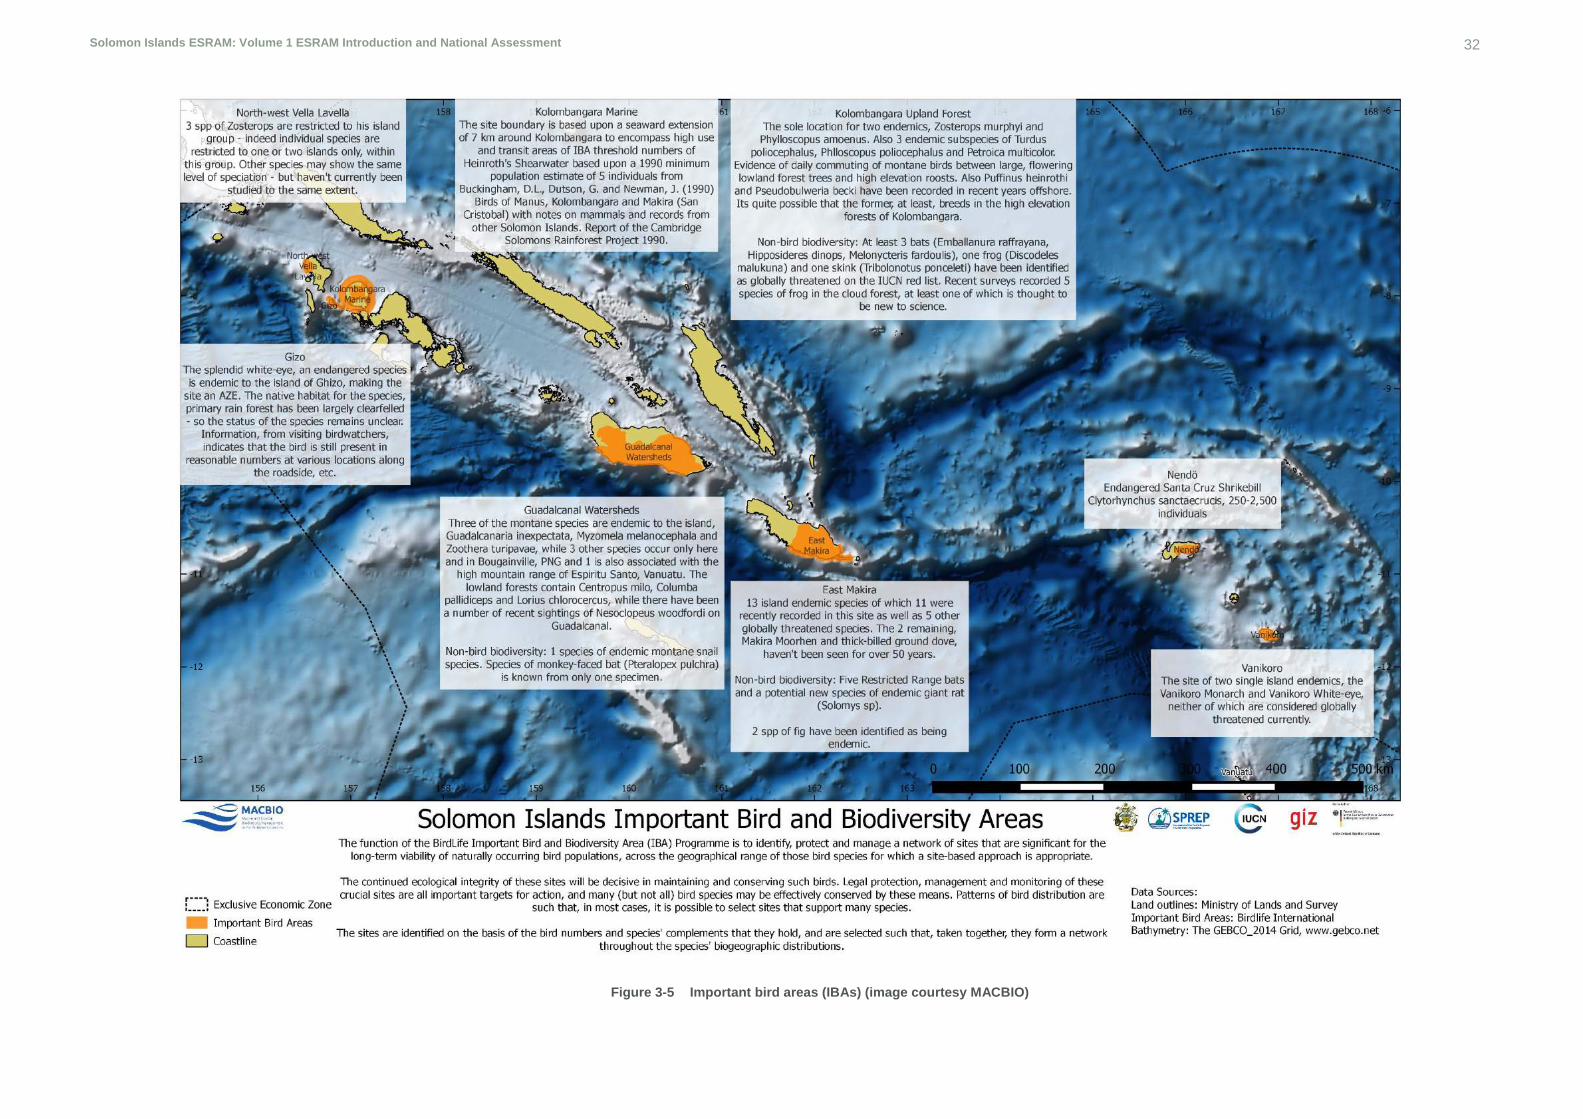
Solomon Islands ESRAM: Volume 1 ESRAM Introduction and National Assessment 32
Figure 3-5 Important bird areas (IBAs) (image courtesy MACBIO)
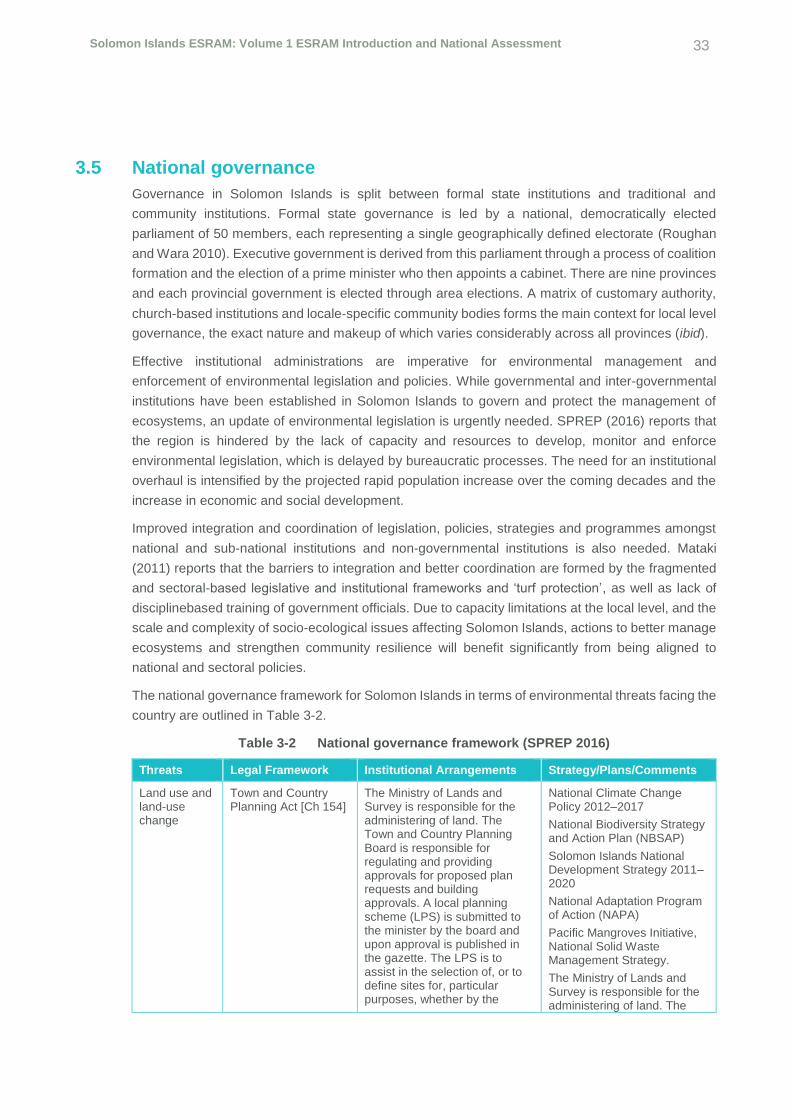
Solomon Islands ESRAM: Volume 1 ESRAM Introduction and National Assessment 33
3.5 National governance
Governance in Solomon Islands is split between formal state institutions and traditional and
community institutions. Formal state governance is led by a national, democratically elected
parliament of 50 members, each representing a single geographically defined electorate (Roughan
and Wara 2010). Executive government is derived from this parliament through a process of coalition
formation and the election of a prime minister who then appoints a cabinet. There are nine provinces
and each provincial government is elected through area elections. A matrix of customary authority,
church-based institutions and locale‐specific community bodies forms the main context for local level
governance, the exact nature and makeup of which varies considerably across all provinces (ibid).
Effective institutional administrations are imperative for environmental management and
enforcement of environmental legislation and policies. While governmental and inter-governmental
institutions have been established in Solomon Islands to govern and protect the management of
ecosystems, an update of environmental legislation is urgently needed. SPREP (2016) reports that
the region is hindered by the lack of capacity and resources to develop, monitor and enforce
environmental legislation, which is delayed by bureaucratic processes. The need for an institutional
overhaul is intensified by the projected rapid population increase over the coming decades and the
increase in economic and social development.
Improved integration and coordination of legislation, policies, strategies and programmes amongst
national and sub-national institutions and non-governmental institutions is also needed. Mataki
(2011) reports that the barriers to integration and better coordination are formed by the fragmented
and sectoral-based legislative and institutional frameworks and ‘turf protection’, as well as lack of
disciplinebased training of government officials. Due to capacity limitations at the local level, and the
scale and complexity of socio-ecological issues affecting Solomon Islands, actions to better manage
ecosystems and strengthen community resilience will benefit significantly from being aligned to
national and sectoral policies.
The national governance framework for Solomon Islands in terms of environmental threats facing the
country are outlined in Table 3-2.
Table 3-2 National governance framework (SPREP 2016)
Threats Legal Framework Institutional Arrangements Strategy/Plans/Comments
Land use and land-use change
Town and Country Planning Act [Ch 154]
The Ministry of Lands and Survey is responsible for the administering of land. The Town and Country Planning Board is responsible for regulating and providing approvals for proposed plan requests and building approvals. A local planning scheme (LPS) is submitted to the minister by the board and upon approval is published in the gazette. The LPS is to assist in the selection of, or to define sites for, particular purposes, whether by the
National Climate Change Policy 2012–2017
National Biodiversity Strategy and Action Plan (NBSAP)
Solomon Islands National Development Strategy 2011–2020
National Adaptation Program of Action (NAPA)
Pacific Mangroves Initiative, National Solid Waste Management Strategy.
The Ministry of Lands and Survey is responsible for the administering of land. The

Solomon Islands ESRAM: Volume 1 ESRAM Introduction and National Assessment 34
Threats Legal Framework Institutional Arrangements Strategy/Plans/Comments
carrying out of development thereon or otherwise.
Constitution of Solomon Islands explicitly recognises customary law and states that it will have effect as part of the law of Solomon Islands.
Environmental effect of developments and activities
No legislation specifically relating to the EIA process. The primary piece of legislation concerning EIAs is the Environment Act and the Environment Regulations 2008
The Ministry of Environment is responsible for regulating the Environment Act, including the overseeing of the EIA process for any development proposals. The Director of Environment and Conservation assesses the EIA report, letters and comments and decides whether or not to grant the mining, logging or whatever development proposal is before him. The director’s decision may be appealed against by the proponent to the Environment Advisory Committee (EAC) within 30 days of notice of decision. Proponents may further appeal the Environment Advisory Committee’s decision to the Minister of Environment.
NBSAP
Solomon Islands National Development Strategy 2011–2020
National Solid Waste Management Strategy Landowners have a right to be given a copy of the EIA report, if logging or mining will affect their land or community. The thrust of the Environment Act is on the procedures of EIAs. It is a requirement of the act that all prescribed developments are required to undergo an EIA, for which development consent is required.
The Solomon Islands EIA guideline has been prepared by the Environment and Conservation Division with the aim of simplifying the procedures of EIA outlined in the act and accompanying Environment Regulations 2008. This was to provide basic advice and guidance on the EIA process for government officers, planners, developers, resource owners and those involved in processing development proposals.
Pollution and waste management
No legislation specific to pollution or waste management.
The key relevant legislation includes Environment Act 1998 and the Environment Regulations 2008
The Director of Environment is mandated to receive applications for licences to discharge waste or emit noise, odour or electronic magnetic radiation. The director may revoke or suspend the licence, if satisfied that there has been a breach of any of the conditions of the licence issued.
Under the Environment Act, the minister may make regulations on matters pertaining to the effectiveness of the act that include matters pertaining to pollution and waste management.
The director may serve abatement notices for non-
Japanese Technical Cooperation Project Promotion for Regional Initiative on Solid Waste Management (JPRISIM)
National Climate Change Policy 2012–2017
NBSAP
Solomon Islands National Development Strategy 2011–2020, National Adaptation Program of Action (NAPA)
National Solid Waste Management Strategy
There is a substantial lack of policy, strategy and government initiative and commitment to tackling Solomon islands’ pollution

Solomon Islands ESRAM: Volume 1 ESRAM Introduction and National Assessment 35
Threats Legal Framework Institutional Arrangements Strategy/Plans/Comments
compliance of provisions of a pollution abatement notice.
Environment inspectors may serve stop notices to persons not complying with any of the requirements contained in the pollution abatement notice.
and waste problems. There is a poor level of domestic wastewater disposal and solid waste management, which is the primary source of pollution to the marine environment. At least 75% of sewage flows through a piped collection system directly into the sea without treatment, reflecting the level of waste management in the country.
Deforestation and mining
Forest Resources and Timber Utilisation Act Forest Resources and Timber Utilisation
Protected species
Mines and Minerals Act 1996
Mines and Minerals Regulations 1996
Legislation specific to mining is the Mines and Minerals Act 1996 and the Mines and Minerals Regulations 1996. The government department with primary responsibility for administration of the mineral sector is the Department of Mines and Energy. The government department with primary responsibility for administration of the mineral sector is the Department of Mines and Energy, which is responsible for prescribing appropriate procedures and granting tenements, primarily in the form of permits, licences, and leases.
. The Ministry of Environment, Climate Change, Disaster Management and Meteorology also plays an important role in the mineral sector because of its role in overseeing mineral sector developers’ compliance with the environmental components of the regulatory framework. The Minerals Board advises the Minister for Mines on issuance of mineral permits, licences and leases. The Minerals Board assists with negotiations, determination of access arrangements and fees, and compensation for damage. The provincial government is responsible for granting business licences to development proponents. Loggers must first get development consent from the Ministry of Environment and a logging licence from the Ministry of Forestry.
MESCAL
POWPA
Solomon Islands Code of Logging Practice
National Climate Change Policy 2012–2017
NBSAP
Solomon Islands National Development Strategy 2011–2020
National Adaptation Programme of Action (NAPA)
Clean Development Mechanism (CDM)
Pacific Mangroves Initiative
National Solid Waste Management Strategy.
Forests cover 79% of the land in Solomon Islands and are all privately owned. Solomon Islands’ forestry industry faces the challenges of unsustainable logging and the unregulated conversion of forests to other land uses. A decline of harvestable logs has resulted in mining now being seen as the mainstay of the economy.
Climate change and
Legislation specific to disaster impacts is the National Disaster Act.
The National Disaster Act supported by the National Disaster Plan established the
National Climate Change Policy 2012–2017
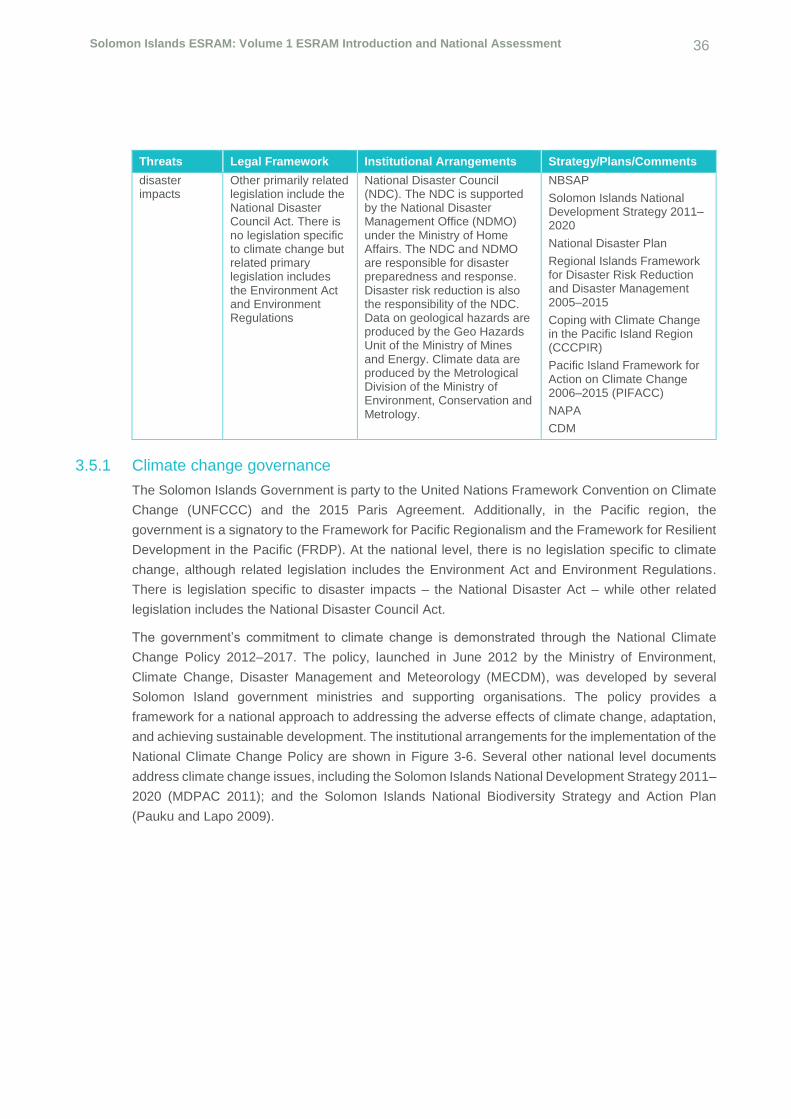
Solomon Islands ESRAM: Volume 1 ESRAM Introduction and National Assessment 36
Threats Legal Framework Institutional Arrangements Strategy/Plans/Comments
disaster impacts
Other primarily related legislation include the National Disaster Council Act. There is no legislation specific to climate change but related primary legislation includes the Environment Act and Environment Regulations
National Disaster Council (NDC). The NDC is supported by the National Disaster Management Office (NDMO) under the Ministry of Home Affairs. The NDC and NDMO are responsible for disaster preparedness and response. Disaster risk reduction is also the responsibility of the NDC. Data on geological hazards are produced by the Geo Hazards Unit of the Ministry of Mines and Energy. Climate data are produced by the Metrological Division of the Ministry of Environment, Conservation and Metrology.
NBSAP
Solomon Islands National Development Strategy 2011–2020
National Disaster Plan
Regional Islands Framework for Disaster Risk Reduction and Disaster Management 2005–2015
Coping with Climate Change in the Pacific Island Region (CCCPIR)
Pacific Island Framework for Action on Climate Change 2006–2015 (PIFACC)
NAPA
CDM
3.5.1 Climate change governance
The Solomon Islands Government is party to the United Nations Framework Convention on Climate
Change (UNFCCC) and the 2015 Paris Agreement. Additionally, in the Pacific region, the
government is a signatory to the Framework for Pacific Regionalism and the Framework for Resilient
Development in the Pacific (FRDP). At the national level, there is no legislation specific to climate
change, although related legislation includes the Environment Act and Environment Regulations.
There is legislation specific to disaster impacts – the National Disaster Act – while other related
legislation includes the National Disaster Council Act.
The government’s commitment to climate change is demonstrated through the National Climate
Change Policy 2012–2017. The policy, launched in June 2012 by the Ministry of Environment,
Climate Change, Disaster Management and Meteorology (MECDM), was developed by several
Solomon Island government ministries and supporting organisations. The policy provides a
framework for a national approach to addressing the adverse effects of climate change, adaptation,
and achieving sustainable development. The institutional arrangements for the implementation of the
National Climate Change Policy are shown in Figure 3-6. Several other national level documents
address climate change issues, including the Solomon Islands National Development Strategy 2011–
2020 (MDPAC 2011); and the Solomon Islands National Biodiversity Strategy and Action Plan
(Pauku and Lapo 2009).

Solomon Islands ESRAM: Volume 1 ESRAM Introduction and National Assessment 37
Figure 3-6 Institutional arrangements for the implementation of the National Climate Change Policy (Source: Rodil and Mias-Cea 2014)
Difficulties to adaptation and mitigation of climate change in Solomon Islands include a lack of
governmental commitment, a lack of policy and institutional framework, poor coordination and links,
a lack of data capacity, and budgetary constraints. The Global Climate Change Alliance1 (GCCA
2012), which leads the Solomon Islands Climate Assistance Program (SICAP), provided an
evaluation of the lessons learned and recommendations gathered from their time in supporting the
implementation of the national climate change policy, as listed below.
Capacities in the Ministry of Environment (particularly in the Climate Change Division) remain
overstretched and addressing these capacity constraints has been slower than anticipated (in
the context of the recruitment freeze of public servants). The appointment of the new
Permanent Secretary at the Ministry of Environment (July 2013) has improved the leadership
and momentum of climate change activities in the ministry.
Timely access to general budget support funds has proved difficult for the Ministry of Environment,
with resulting delays in planned activities. The budget allocated to climate change actions is
unknown.
The large number of actors (ministries, donors, NGOs) and broad definition of the ‘climate change’
sector (encompassing adaptation, mitigation, disaster management, environment) poses
challenges for effective coordination.
1 The GCCA is an organisation established by the European Union (EU) in 2007 to strengthen dialogue and cooperation with developing countries, in particular least developed countries (LDCs) and small island developing States (SIDS).

Solomon Islands ESRAM: Volume 1 ESRAM Introduction and National Assessment 38
Ownership and leadership by the government, political commitment and an action-oriented matrix
of reform priorities to assess progress and structure the policy dialogue are important success
factors.
The target of drafting appropriate guidelines for managed human resettlement that was included
within SICAP was too ambitious. Human resettlement or relocation is a delicate issue. Cultural
aspects, physical infrastructure (education and health services, elderly care, trauma counselling)
and political concerns are factors that play a role and require consideration and involvement of
wider authorities. It is obviously a lengthy process that should be taken forward holistically.
GCCA’s recommendations:
Ongoing vulnerability assessment to identify and rank affected, high-risk communities according
to risk related criteria. Determining a realistic costing of climate change adaptation measures,
including relocation. Drafting guidelines for human resettlement projects, after nation-wide
consultations, including safeguard standards, to minimise risks of conflict due to resettlement.
Ongoing strengthening of capacity in the Climate Change Division of the Ministry of Environment.
Drafting a matrix of action and deliverables in the climate change sector as a tool for the Ministry
of Environment’s Climate Change Working Group.

Solomon Islands ESRAM: Volume 1 ESRAM Introduction and National Assessment 39
4 Current state, trends, drivers of change and environmental consequences
The greatest current threat to ecosystems stem from human activities (SPREP 2016). These threats
include habitat loss; invasive species; urban, agricultural and industrial pollution; and over-
exploitation of natural resources. The direct and indirect effects of climate change and their
interactions with human-induced threats will only intensify the risks to ecosystems.
This sections explores the current state of ecosystems, trends, drivers of change (non-climatic) and
the environmental consequences of these changes at a national level.
4.1 Current state of ecosystems and national trends
As discussed in Section 3.4, Solomon Islands is globally recognised as a biodiversity hotspot, with
extraordinary patterns of inter-island diversity and high degrees of endemism (Filardi et al. 2007;
Conservation International 2013) and the second highest terrestrial biodiversity in the Pacific
(exceeded only by Papua New Guinea). As part of the Coral Triangle, Solomon Islands contributes
to the global centre of marine biodiversity that comprises 76% of the world’s corals and 37% of the
world’s coral reef fish species (TNC 2008).
The SPREP State of Conservation in Solomon Islands – Country Report 2013 (SPREP 2016)
provides a high-level summary of the current state, pressures and threats facing ecosystems and
native species, and trends predicted as of 2013 (see Table 4-1).
Table 4-1 Summary of current state of ecosystems and native species in Solomon Islands (SPREP 2016)
NB: The status of ‘High’ for ‘Pressure and threats’ on ‘Coral reef’ is believed to be incorrectly rated.
Data quality listed in Table 4-1 provides an estimate of the amount and quality of the data that were used
to assess the trend for each indicator.
In Table 4-1, the status of each ecosystem is rated good, fair or poor for its current state and for the
pressures and threats it faces. . A trend for each indicator is then presented and ranges from ‘mixed’,
Solomon Islands ESRAM: Volume 1 ESRAM Introduction and National Assessment 40
indicating that some aspects have improved and some have worsened, ‘deteriorating’, indicating the
state of biodiversity has worsened, and ‘improving’, indicating the state of biodiversity has improved.
In terms of the current state of Solomon Island ecosystems, all indicators investigated by SPREP
(2016) were rated as being in a good to fair state. As reflected in the Solomon Islands unique and
high level of biodiversity and endemism, ratings of fair or poor indicate a reduction in ecosystem
biodiversity and habitat. Furthermore, all ecosystem indicators are reported to be deteriorating or
mixed, i.e. some aspects are improving, and some are deteriorating.
The following section provides further information on the current state of Solomon Island ecosystems
and the projected future trends.
4.1.1 Forests
4.1.1.1 Forest types
Solomon Islands has six distinct forest types and approximately 5,000 plant species (Pauku 2009).
The forest types vary in extent across each province, but the species mix is generally uniform
between the islands (Whitmore 1969). The six vegetation types are described below (adapted from
MFEC 1995).
Grassland and other non-forest areas comprise mainly herbaceous species. The predominant
species include Imperata cylindrica, Dicranoptera linearis and Themeda australis. Examples of
commonly occurring species are Mimosa invisa, Morinda citrifolia, Saccharum spontaneum,
Polygala paniculata and Timonius timon. Some of these species (e.g. M. invisa) are also very
common in disturbed areas.
Saline swamp forests are subject to tidal influence as they are found in estuaries and foreshores.
Examples of commonly occurring species are Barringtonia asiatica, Calophyllum inophyllum,
Casuarina equisetifolia, Terminalia catappa, Intsia bijuga, Inocarpus fagifer, Pandanus spp.,
Barringtonia racemosa and species of mangroves.
Freshwater swamp and riverine forests are typically found in poorly drained soil at low altitudes
with little micro-relief. Species such as Inocarpus fagifer, Mextroxylon salomonense, M. sagu,
Barringtonia racemosa are found here, although some important timber species are also present
(e.g. Terminalia brassii and Dillenia salomonensis).
Lowland rainforests include forests at altitudes up to 5 m–70 m, often with complex structure
due to the high number of species in upper or hill forest and patches of freshwater swamp forest.
Natural disasters such as cyclones and human activities often disturb this forest type, as evident
in a high incidence of re-growth and secondary species. Commonly occurring species in this
vegetation are timber species, such as Campnosperma brevipetiolata, Dillenia salomonensis,
Endospermum medullosum, Parinari salomonensis, Terminalia calamansanai, Schizomeria
serrata, Maranthes corymbosa, Pometia pinnata, Gmelina moluccana, Elaeocarpus sphaericus
and Vitex cofasus. Most indigenous fruit trees are also found in this forest, including Canarium
spp, Syzygium malaccensis, Magnifera minor, Spondius dulce, Barringtonia procera, B. edulis,
Artocarpus altilis, Gnetum gnemon, and Burkella obovata.

Solomon Islands ESRAM: Volume 1 ESRAM Introduction and National Assessment 41
Hill forests occur at altitudes of 400–600 m and on well-drained soils. They exhibit a complex
structure, with varying tree heights and canopy density. Some species in the lowland forest are
also present here, as well as those species commonly found in the montane forest. Species
forming this forest include Pometia pinnata, Gmelina moluccana, Elaeocarpus sphaericus,
Campnosperma brevipetiolata, Dillenia salomonensis, Endospermum medullosum, Parinari
salomonensis, Terminalia calamansanai, Schizomeria serrata, Maranthes corymbosa, and Vitex
cofasus. Fruit tree species such as Canarium spp., Gnetum gnemon and Artocarpus altilis are
also present.
Montane forests occur at altitudes above 600 m, on ridge tops and mountain summits, but can
be found in lower elevations under harsher conditions. These are characterised by a dense and
compact canopy with small, light tree crowns. Species in this forest type are Callophyllum
kajewskii, Callophyllum pseudovitiense, Eugenia spp., Dacrydium spp., Pandanus spp.,
Racembambos scandens and ferns.
The forest types and their area of coverage (ha) and percentage of land area of each province are
presented in Table 4-2.
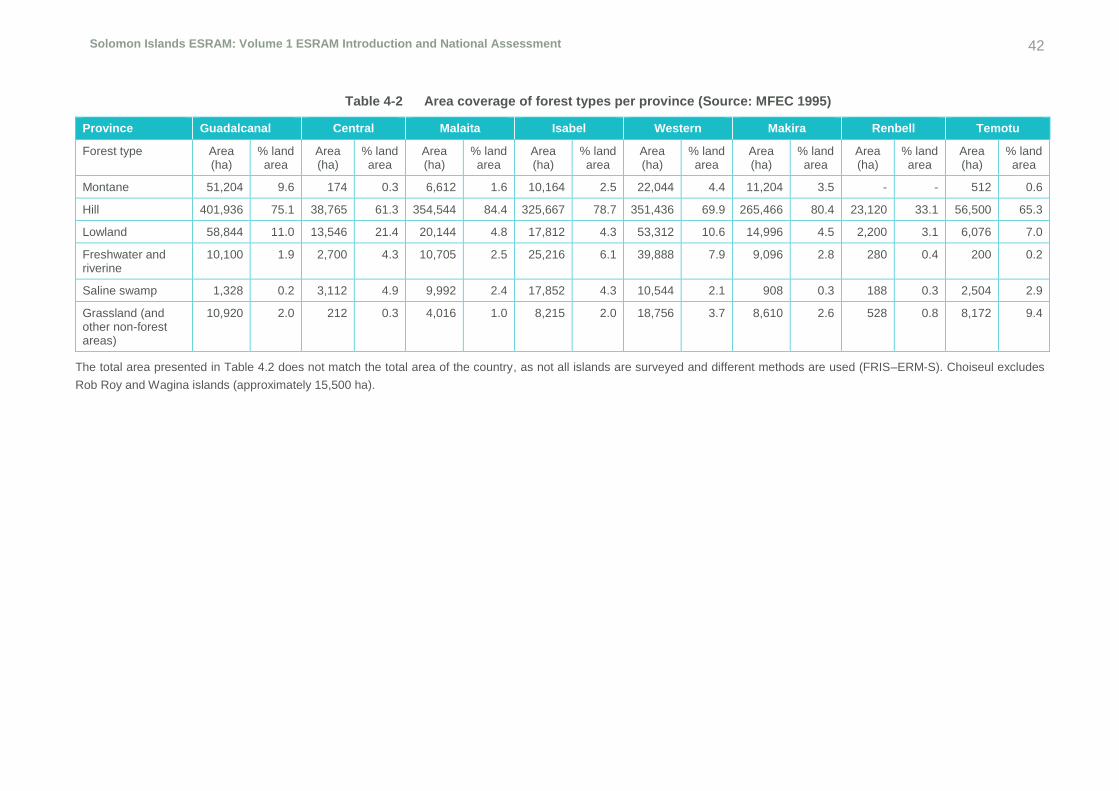
Solomon Islands ESRAM: Volume 1 ESRAM Introduction and National Assessment 42
Table 4-2 Area coverage of forest types per province (Source: MFEC 1995)
Province Guadalcanal Central Malaita Isabel Western Makira Renbell Temotu
Forest type Area (ha)
% land area
Area (ha)
% land area
Area (ha)
% land area
Area (ha)
% land area
Area (ha)
% land area
Area (ha)
% land area
Area (ha)
% land area
Area (ha)
% land area
Montane 51,204 9.6 174 0.3 6,612 1.6 10,164 2.5 22,044 4.4 11,204 3.5 - - 512 0.6
Hill 401,936 75.1 38,765 61.3 354,544 84.4 325,667 78.7 351,436 69.9 265,466 80.4 23,120 33.1 56,500 65.3
Lowland 58,844 11.0 13,546 21.4 20,144 4.8 17,812 4.3 53,312 10.6 14,996 4.5 2,200 3.1 6,076 7.0
Freshwater and riverine
10,100 1.9 2,700 4.3 10,705 2.5 25,216 6.1 39,888 7.9 9,096 2.8 280 0.4 200 0.2
Saline swamp 1,328 0.2 3,112 4.9 9,992 2.4 17,852 4.3 10,544 2.1 908 0.3 188 0.3 2,504 2.9
Grassland (and other non-forest areas)
10,920 2.0 212 0.3 4,016 1.0 8,215 2.0 18,756 3.7 8,610 2.6 528 0.8 8,172 9.4
The total area presented in Table 4.2 does not match the total area of the country, as not all islands are surveyed and different methods are used (FRIS–ERM-S). Choiseul excludes
Rob Roy and Wagina islands (approximately 15,500 ha).
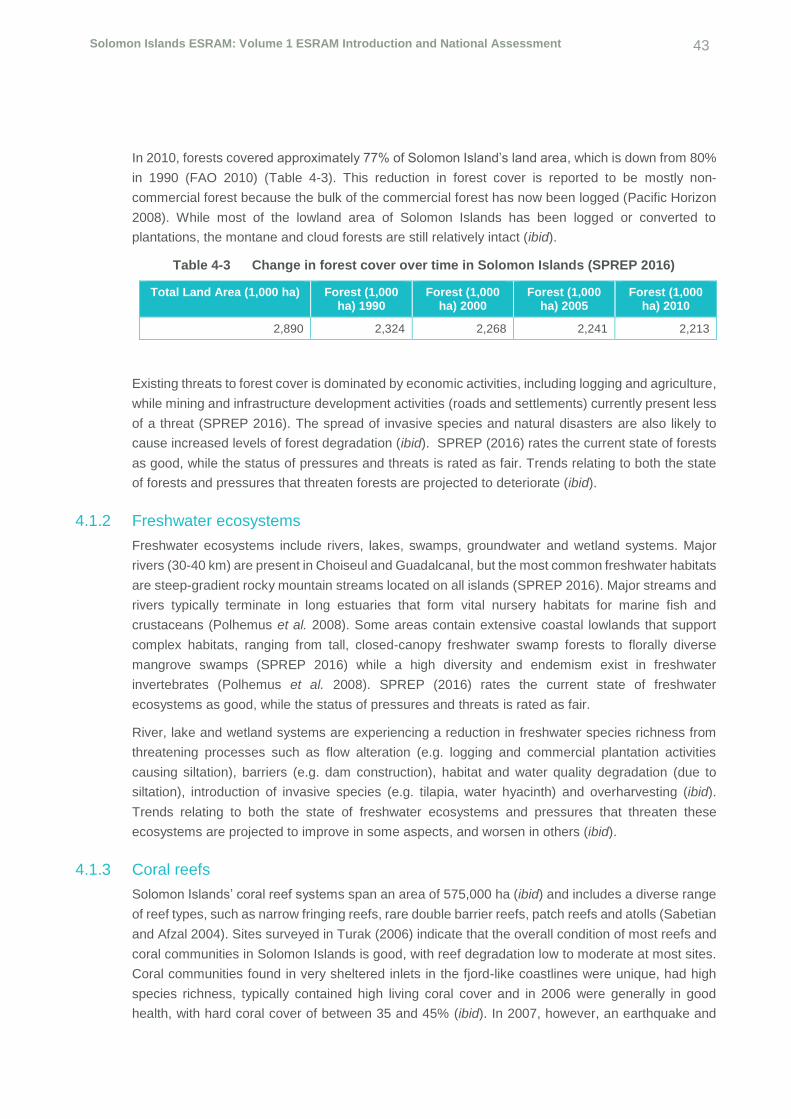
Solomon Islands ESRAM: Volume 1 ESRAM Introduction and National Assessment 43
In 2010, forests covered approximately 77% of Solomon Island’s land area, which is down from 80%
in 1990 (FAO 2010) (Table 4-3). This reduction in forest cover is reported to be mostly non-
commercial forest because the bulk of the commercial forest has now been logged (Pacific Horizon
2008). While most of the lowland area of Solomon Islands has been logged or converted to
plantations, the montane and cloud forests are still relatively intact (ibid).
Table 4-3 Change in forest cover over time in Solomon Islands (SPREP 2016)
Total Land Area (1,000 ha) Forest (1,000 ha) 1990
Forest (1,000 ha) 2000
Forest (1,000 ha) 2005
Forest (1,000 ha) 2010
2,890 2,324 2,268 2,241 2,213
Existing threats to forest cover is dominated by economic activities, including logging and agriculture,
while mining and infrastructure development activities (roads and settlements) currently present less
of a threat (SPREP 2016). The spread of invasive species and natural disasters are also likely to
cause increased levels of forest degradation (ibid). SPREP (2016) rates the current state of forests
as good, while the status of pressures and threats is rated as fair. Trends relating to both the state
of forests and pressures that threaten forests are projected to deteriorate (ibid).
4.1.2 Freshwater ecosystems
Freshwater ecosystems include rivers, lakes, swamps, groundwater and wetland systems. Major
rivers (30-40 km) are present in Choiseul and Guadalcanal, but the most common freshwater habitats
are steep-gradient rocky mountain streams located on all islands (SPREP 2016). Major streams and
rivers typically terminate in long estuaries that form vital nursery habitats for marine fish and
crustaceans (Polhemus et al. 2008). Some areas contain extensive coastal lowlands that support
complex habitats, ranging from tall, closed-canopy freshwater swamp forests to florally diverse
mangrove swamps (SPREP 2016) while a high diversity and endemism exist in freshwater
invertebrates (Polhemus et al. 2008). SPREP (2016) rates the current state of freshwater
ecosystems as good, while the status of pressures and threats is rated as fair.
River, lake and wetland systems are experiencing a reduction in freshwater species richness from
threatening processes such as flow alteration (e.g. logging and commercial plantation activities
causing siltation), barriers (e.g. dam construction), habitat and water quality degradation (due to
siltation), introduction of invasive species (e.g. tilapia, water hyacinth) and overharvesting (ibid).
Trends relating to both the state of freshwater ecosystems and pressures that threaten these
ecosystems are projected to improve in some aspects, and worsen in others (ibid).
4.1.3 Coral reefs
Solomon Islands’ coral reef systems span an area of 575,000 ha (ibid) and includes a diverse range
of reef types, such as narrow fringing reefs, rare double barrier reefs, patch reefs and atolls (Sabetian
and Afzal 2004). Sites surveyed in Turak (2006) indicate that the overall condition of most reefs and
coral communities in Solomon Islands is good, with reef degradation low to moderate at most sites.
Coral communities found in very sheltered inlets in the fjord-like coastlines were unique, had high
species richness, typically contained high living coral cover and in 2006 were generally in good
health, with hard coral cover of between 35 and 45% (ibid). In 2007, however, an earthquake and

Solomon Islands ESRAM: Volume 1 ESRAM Introduction and National Assessment 44
tsunami resulted in extensive reef damage and some shallow reefs received irreparable damage.
SPREP (2016) rates the status of the state of coral reefs as fair, while the status of pressures and
threats is rated as good.
SPREP (2016) reports that 71% of Solomon Island reefs are considered to be at medium or higher
threat level from local factors, including: watershed-based pollution/sedimentation from
developments such as mining; vegetation clearance for agriculture and forestry; marine pollution
(ports, oil terminals, shipping channels, agricultural pesticides and fertilizers, sewage from
residential/tourist centres); coastal development (cities, settlements, airports and military bases,
mines, tourist resorts); and destructive fishing and overfishing.
One of the most critical issues facing Solomon Islands and its marine resources is the rapid
population growth rate, coupled with the high dependence on marine resources for ecosystem
services such as food and income (SPREP 2016). If population growth and deforestation continue
at high rates, threats to coral reefs are expected to increase significantly. Trends relating to both the
state of coral reefs and the pressures that threaten coral reefs are projected to deteriorate (ibid).
4.1.4 Mangroves
Mangroves are prevalent throughout Solomon Islands, particularly in the western group of islands.
Mangrove species are dominated by Rhizophora and Bruguiera while Lumnitzera is also common.
Mangroves are of great significance to the livelihoods of many Solomon Island communities and
economies. SPREP (2016) rates the status of the state of mangroves as good, while the status of
pressures and threats is rated as fair.
Unlike terrestrial forests, mangroves have not been commercially exploited to date, but they are
increasingly under threat from conversion to other land uses from urban development and mining
(SPREP 2016). Over-harvesting of mangroves for fuelwood, timber extraction for building materials
and herbal medicines, overharvesting of fish and invertebrate resources, and logging are also major
threats (ibid). Converting mangroves to other land uses and the over harvesting of mangroves
increases coastal erosion, reduces mangrove species richness and threatens fish and invertebrate
spawning grounds. This results in ecosystem changes and affects the provisioning and regulating
ecosystem services that many communities rely on (e.g. habitat for food sources, coastal protection,
water regulation, shelter).
Table 4-4 presents the trend in the decline in mangrove forest cover over time from 1990 to 2010.
Trends relating to both the state of mangroves and the pressures that threaten mangroves are
predicted to improve in some aspects and deteriorate in other areas (ibid).
Table 4-4 Change in mangrove forest in Solomon Islands (FAO 2010)
Mangrove Forest in 1990 (1,000 ha)
Mangrove Forest in 2000 (1,000 ha)
Mangrove Forest in 2005 (1,000 ha)
Mangrove Forest in 2010 (1,000 ha)
53.0 45.5 41.5 37.3
Solomon Islands ESRAM: Volume 1 ESRAM Introduction and National Assessment 45
4.1.5 Seagrass
Solomon Islands has an estimated area of 10,000 ha of seagrass beds spread across the coastal
intertidal flats around the country (Sulu et al. 2012). Ten species of seagrass have been recorded in
Solomon Islands (Short et al. 2007; Ellis 2009). Seagrass is of high importance to fish and
invertebrates in the provision of food and nursery grounds, including for endangered species such
as green sea turtle (Chelonia mydas) and dugong (Dugong dugon). Seagrass is also of commercial
importance to artisanal fisheries (SPREP 2016). SPREP (2016) rates the status of the state of
seagrass as good, while the status of pressures and threats is rated as fair.
At a local level, seagrass is likely to be affected by coastal development, pollution from inadequate
waste and sanitation management, overharvesting of coral and fisheries, coastal erosion, flooding,
and the sedimentation of rivers due to mining, logging and agricultural activities (ibid). Trends relating
to both the state of seagrass and the pressures that threaten seagrass are projected to improve in
some areas and in others are likely to deteriorate (ibid).
4.1.6 Ocean health
The Pacific Ocean is the largest ecosystem in the world. The coastal and marine environments of
Oceania sustain numerous activities that underpin local, sub-national, national and international
economies and provide livelihoods and food security for millions of people (SPREP 2016). Marine
ecosystems are continually being devastated by habitat destruction, pollution, climate change and
overfishing, with the latter activity believed to be the greatest human-induced threat to ocean health
in the region (ibid). Over-exploitation has reduced many fish stocks throughout the Pacific and
caused ecological shifts that reduce biodiversity and productivity. By-catch during commercial fishing
activities and live capture and harvesting for the aquarium trade contribute to these effects (ibid).
SPREP (2016) rate the status of the state of ocean health as fair, while the status of pressures and
threats is rated as poor.
Human activities that alter the marine environment by affecting water quality, such as sedimentation
from mining or agricultural practices, are likely to make it unsuitable for marine life that require precise
environmental regulation. In addition to oil and gas extraction, most pollution in the ocean originates
from industry, agriculture or domestic sources on land (ibid). Marine invasive species are also an
increasing threat to marine ecosystems. Trends relating to both the state of ocean health and the
pressures that threaten ocean health are projected to deteriorate (ibid).
4.2 Drivers of change
The following section further explores the non-climatic drivers of factors contributing to the change
in ecosystem condition, biodiversity and habitat. In the absence of recent information and data, all
information presented in this section is sourced from Solomon Islands State of the Environment
Report 2008 (SOE 2008) and the SPREP Solomon Island Country Profile and Virtual Environment
Library, unless stated otherwise.
4.2.1 Population pressures
A rapidly increasing population has seen a considerable intensification of land use in Solomon
Islands over the past 30 years. The population estimate in 2014 was approximately 609,800 with an
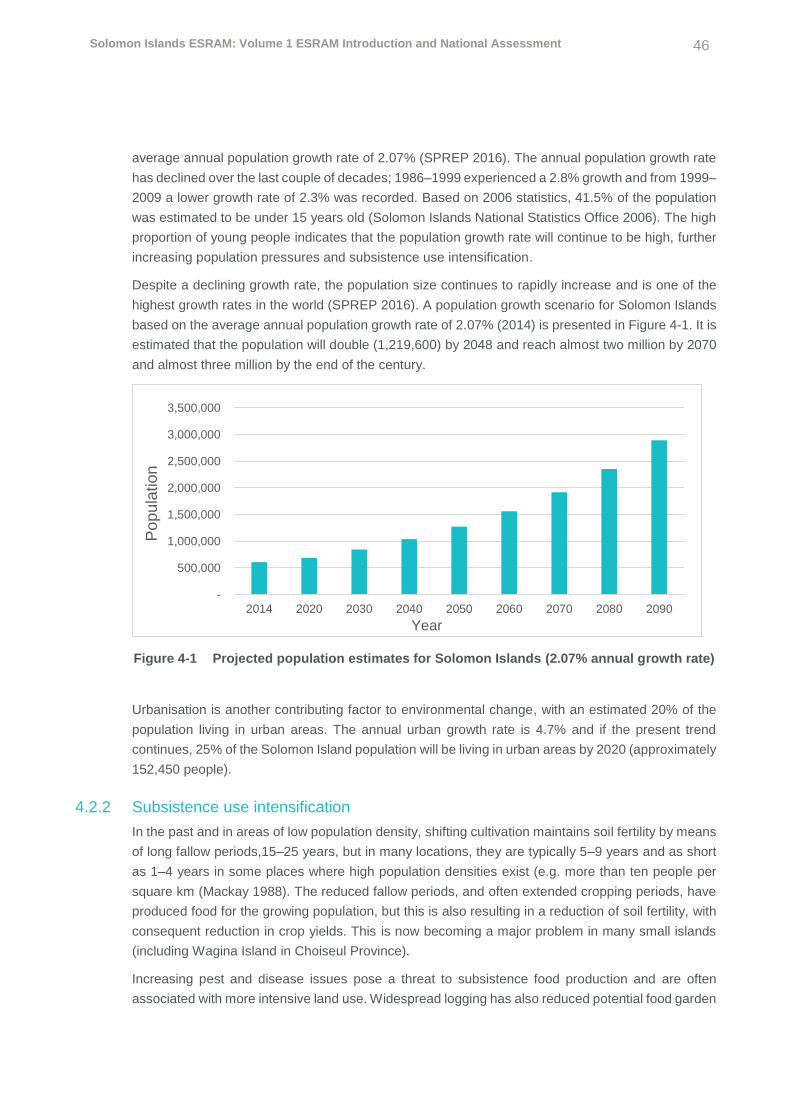
Solomon Islands ESRAM: Volume 1 ESRAM Introduction and National Assessment 46
average annual population growth rate of 2.07% (SPREP 2016). The annual population growth rate
has declined over the last couple of decades; 1986–1999 experienced a 2.8% growth and from 1999–
2009 a lower growth rate of 2.3% was recorded. Based on 2006 statistics, 41.5% of the population
was estimated to be under 15 years old (Solomon Islands National Statistics Office 2006). The high
proportion of young people indicates that the population growth rate will continue to be high, further
increasing population pressures and subsistence use intensification.
Despite a declining growth rate, the population size continues to rapidly increase and is one of the
highest growth rates in the world (SPREP 2016). A population growth scenario for Solomon Islands
based on the average annual population growth rate of 2.07% (2014) is presented in Figure 4-1. It is
estimated that the population will double (1,219,600) by 2048 and reach almost two million by 2070
and almost three million by the end of the century.
Figure 4-1 Projected population estimates for Solomon Islands (2.07% annual growth rate)
Urbanisation is another contributing factor to environmental change, with an estimated 20% of the
population living in urban areas. The annual urban growth rate is 4.7% and if the present trend
continues, 25% of the Solomon Island population will be living in urban areas by 2020 (approximately
152,450 people).
4.2.2 Subsistence use intensification
In the past and in areas of low population density, shifting cultivation maintains soil fertility by means
of long fallow periods,15–25 years, but in many locations, they are typically 5–9 years and as short
as 1–4 years in some places where high population densities exist (e.g. more than ten people per
square km (Mackay 1988). The reduced fallow periods, and often extended cropping periods, have
produced food for the growing population, but this is also resulting in a reduction of soil fertility, with
consequent reduction in crop yields. This is now becoming a major problem in many small islands
(including Wagina Island in Choiseul Province).
Increasing pest and disease issues pose a threat to subsistence food production and are often
associated with more intensive land use. Widespread logging has also reduced potential food garden
-
500,000
1,000,000
1,500,000
2,000,000
2,500,000
3,000,000
3,500,000
2014 2020 2030 2040 2050 2060 2070 2080 2090
Po
pu
latio
n
Year

Solomon Islands ESRAM: Volume 1 ESRAM Introduction and National Assessment 47
areas in some locations, while a lack of labour due to young population migrating to urban areas is
another issue facing subsistence food production.
The pressure to farm cash crops has driven the introduction of harmful farming practices, such as
extensive land clearing, intensification of land use and inappropriate soil cultivation. The occupation
of most flat arable lands by cash crops is also pushing subsistence cropping onto marginal areas
especially steep lands. About 63% of the total land area (28,000 square km) in Solomon Islands
comprises steep lands (> 20% slope) which are used for shifting cultivation by smallholders.
Intensified and constant cultivation of marginal sloping lands is unsustainable and is responsible for
soil erosion, loss of soil fertility, an increase in pest and diseases, a decline in crop yield, and
widespread land degradation (Cheatle 1987). The SOE report (2008) indicates that there are few, if
any, widespread and quantitative data on soil erosion rates, the extent and severity of land
degradation, the decline in soil fertility, and the sustainability of current cropping systems in Solomon
Islands.
4.2.3 Commercial plantations
Solomon Islands’ agriculture sector exports are largely palm oil, palm kernels, copra and cocoa. They
are key measured contributors to the country’s gross domestic product (GDP). The agriculture sector
accounts for approximately 50% of GDP (SPREP 2013). Copra and cocoa production are dominated
by smallholder production, with average farm size ranging from 0.1 to around 10 ha.
As demonstrated in Section 4.1.1, forests covered approximately 77% of Solomon Islands’ land area
in 2010, which is down from 80% in 1990 (FAO 2010). The conversion of large areas of land, mostly
fertile coastal lands, into commercial plantations, is a significant threat to biodiversity. This form of
land change adds pressure on land resources by displacing domestic food gardening and, if not
managed properly, will pollute river systems and coastal marine ecosystems due to excessive run-
off and siltation during heavy rains. If not properly managed, these all have considerable potential to
affect the country’s rapidly growing population.
4.2.4 Urbanisation
Urbanisation is recognised as one of the principal causes of environmental change. Around 20% of
the population is classified as urban dwellers (2009 census data), of which over 70% reside in the
capital city of Honiara. If the adjoining urban areas of Guadalcanal are included, ‘greater Honiara’
represents 82% of the urban population of Solomon Islands. With an annual urban growth rate of
4.7%, it is anticipated that, by 2020, approximately 25% of the Solomon Island population will be
living in urban areas if the present trend continues (UN-Habitat 2012). The national and urban
population increase is placing severe stress on public services and utility companies, which are
struggling to provide essential services (health and education) and maintain regular supplies (water,
electricity and waste collection services).
4.2.5 Mining
Open-pit mining has been limited to date to the Gold Ridge Mine on Guadalcanal. Open-pit mining
can have a severe impact on the surrounding environment, due to deforestation and earth removal
for the pit and ancillary earthworks, and also on the riverine drainage systems in the area, which are
the potential receiving environment for contaminated run-off.

Solomon Islands ESRAM: Volume 1 ESRAM Introduction and National Assessment 48
In July 2015, following Tropical Cyclone Raquel, which brought extreme rainfall to the region, the
Solomon Islands government declared the Gold Ridge Mine a disaster area, with the tailings dam
close to overflowing, resulting in an environmental catastrophe. The unseasonably heavy rain filled
the Gold Ridge tailings dam to within 20 cm of full capacity, which threatened to rupture and result in
arsenic, cyanide and heavy metals-laden tailings to flow downstream and potentially severely affect
residents and ecosystems.
There are no mines currently in operation in Solomon Islands, although there are proposals for new
mines throughout Isabel and Choiseul Provinces, including a proposed bauxite mine on Wagina
Island.
4.2.6 Logging
There are several resources within the environment that are being exploited at unsustainable rates,
but the most pressing is the country’s forest resource. A critical situation exists with the forests of
Solomon Islands; of all activities threatening the terrestrial biodiversity, logging is considered the
leading threat. SPREP (2016) describes the current condition of biodiversity, habitat and ecosystems
as good, while the status of pressures and threats to forests is rated as moderate.
Logging has played a central role in the economy of Solomon Islands for decades. Large scale
commercial wood harvest from primary forests started in the 1960s and, until the 1980s, most logging
took place on state land (Kabutaulaka 2000, 2006). Beginning in the early 1980s, exploitation shifted
to customary land (which makes up approximately 90% of the total land area in Solomon Islands).
An influx of multinational companies followed and the number of logging licences issued increased
rapidly (TEEBcase 2012).
By the mid-1990s, timber exports contributed to approximately half the country’s export revenue and
a third of government revenue (Montgomery 1995; Fraser 1997). The sustainable harvest rate for
Solomon Islands was estimated to be 325,000 cubic metres per year, but in the 1990s, actual logging
rates reached double this amount (or 700,000 cubic metres per year) (Kabutaulaka 2000, 2006). The
timber harvest increased to 1 million cubic metres in 2004, which equates to four times the
sustainable harvest levels (SPREP 2016). Although the amount of timber exported continued to
increase, government revenues decreased. Between 2002 and 2005, exports doubled while the
contribution of logging revenue to government income fell from 16% in 2002 to 13% in 2004 (Tokaut
2006). SPREP (2016) estimates that forest cover has reduced by 4% from 1990 to 2013 (an
additional 1% reduction from the 2010 figures presented in Section 4.1.1). The annual log export
production for each province is outlined in Table 4-5 below, noting the forest coverage for each
province previously presented in Table 4-2. Small-scale logging (for the local market) may be higher
around major population centres, especially Honiara. However, given the scale and locations of
logging for the export market, there is not necessarily an overall spatial link at the national scale
between population densities and rates of deforestation from logging. Rather, the extent of logging
in each province is more driven by the interaction between factors such as existing resource
availability (i.e. forest cover) and resource access (i.e. landowner permissions).

Solomon Islands ESRAM: Volume 1 ESRAM Introduction and National Assessment 49
Table 4-5 Annual summary of log export production by province (Source: Pauku 2009)
4.2.7 Fishing and marine exports
Most marine ecosystems such as mangroves, lagoons and reefs are also being over-exploited in
many areas. While population growth is responsible for additional pressure on these ecosystems
throughout the country, commercial extraction is worsening these effects in many cases. In Oceania,
an estimated 70–80% of the catch from inshore fisheries is used for subsistence purposes, while
around 20% is going to markets (SPREP 2016). In 2008, an Asian Development Bank (ADB) project
examined several studies on coastal fishing in Solomon Islands and estimated the annual catch for
commercial production during the mid-2000s to be 3,250 tonnes, worth USD 3,307,190 and the
subsistence fisheries at 15,000 tonnes, worth USD 10,980,393.
Continued over-harvesting is further undermining the resilience of ocean systems, while fisheries
management is failing to halt the decline of key species and damage to marine ecosystems (ibid).
SPREP (2016) reports that there was a significant deterioration of the quality of governance in the
fisheries sector by the government and donors to strengthen fisheries institutions during the period
of ethnic tension.
4.2.8 Pollution
Many households in the country do not have access to water supply systems and still rely on streams
and rivers to obtain water for drinking and domestic purposes (e.g. washing and bathing). Pollution
from both solid waste and sanitation and sewerage discharges is the major existing threat to
waterways throughout Solomon Islands. Poor community awareness or attitudes, a high reliance on
plastic as opposed to biodegradable or reusable products, and the lack of adequate waste collection
and disposal services throughout most of the country, result in excessive disposal and accumulation
of solid wastes to rivers and streams. Additional pollution inputs directly to rivers and streams include
contaminants from sanitation uses, industrial discharges, agricultural run-off, and watershed run-off
(e.g. sediment inputs). These pose human health risks through the community’s use of this
ecosystem type, both directly (e.g. drinking, swimming) and indirectly (e.g. consumption of
contaminated food). They also undermine the integrity and resilience of ecosystem components in

Solomon Islands ESRAM: Volume 1 ESRAM Introduction and National Assessment 50
the rivers and streams (i.e. flora, fauna and their habitats), as well as of downstream marine
ecosystems.
Pollution to the coastal and marine environment stems from two main sources: (a) land-based
sources and through rivers and streams; and (b) marine-based sources. For example, in Honiara
alone, at least 75% of sewage flows through a piped collection system directly into the sea without
treatment. Discharges from ships in the form of garbage, bilge water and other pollutants are also a
major source of sea-based pollution. An increase in these forms of pollution is already a concern as
more ships are coming into and using the country’s harbours and waters. Local ships are also
contributing to these forms of pollution.
4.2.9 Energy production and use
The majority of energy use in Solomon Islands is biomass for cooking and for drying copra and cocoa
for export. However, the accessible fuelwood is increasingly scarce in some areas. For some parts
of the country, the major fuelwoods for copra drying is mangrove, and its overuse is now a major
contributing factor to coastal erosion.
4.3 Environmental consequences
The drivers of change and root causes outlined above have a significant effect on ecosystems and
ecosystem services. In line with the drivers of change and root causes outlined in the SOE 2008
report, the consequences of these changes are explored and summarised below. Threats to specific
ecosystems types are then explored further as part of this ESRAM study (see Section 5).
4.3.1 Freshwater stress
Freshwater resources are under stress, as indicated below.
Erosion and sedimentation of stream and river systems from logging operations, subsistence
cultivation on sloping lands and land clearing for plantations affect water quality and thus degrade
reefs, mangrove areas and coastal fisheries. There is poor understanding amongst loggers and
communities of the effects of land-clearing, logging, erosion and run-off on downstream and
receiving environments including reefs and fisheries.
Flow alteration, barriers, habitat and water quality degradation, introduction of invasive species
and over-harvesting are resulting in a decline in freshwater species richness (SPREP 2016).
Indiscriminate land-clearing for subsistence food production and for plantation and commercial
logging is resulting in catchment drying. In 2008, the Honiara water supply source saw a 50%
drop in water availability in the catchment.
Pollution problems in river catchments are also increasing with rapid population growth, reflecting
inadequate planning to control development in catchments and conflicting regulatory decisions,
such as the granting of development rights and logging licenses in catchment or conservation
areas.
The cumulative effects of these threats are intensifying the risk of extinctions, with several
endemic fish species reported in the IUCN Red List as threatened, and are compromising the
sustainable use of freshwater ecosystems by local communities (SPREP 2016).

Solomon Islands ESRAM: Volume 1 ESRAM Introduction and National Assessment 51
4.3.2 Soil stress and degradation
Serious soil stress is experienced through low crop yield and high incidence of pests and diseases.
As land is degraded, it becomes a haven for invasive species due to the diminished ability of the
ecosystem to control them. Invasive species in turn affect the soil-nutrient moisture regimes of
catchments, leading to poor soil structures and further fertility decline. Most of the accessible soils
have fertility and/or micronutrient deficiencies and increased exposure results in soil leaching and
erosion, with great impact on soil quality and subsequently low crop yield. Soil degradation reduces
food security by reducing not only the quantity of food produced but also its nutritional quality, which
is critical to human health (FAO 2011).
4.3.3 Forest depletion
Due to the depletion of forests, communities are finding it increasingly difficult to access good quality
water and forest products and materials for housing and food, which are important for village well-
being and livelihoods. Much of the deforestation over large tracts of land occurs on very steep land.
Serious erosion, siltation, soil structure decline and loss of soil fertility threaten terrestrial and marine
biodiversity, provisioning services such as renewable water supplies, and regulating services such
as and pollution and water quality regulation. The production potential of the land is also heavily
diminished. Highly invasive weeds further threaten disturbed forest areas and increase soil
degradation.
Existing threats to forest cover are dominated by logging and agriculture, while mining and
infrastructure development pose less of a threat. Based on the forest cover estimates presented in
Table 4-3 for 1990, 2000, 2005 and 2010, a forest clearing scenario is presented in Figure 4-2. The
scenario is based on a five-year clearing rate estimated at 1.2%.
Forest management and governance practices have been poor, due to corruption and the lack of
technical and human resources to conduct and monitor logging operations (TEEBcase 2012). The
significant dependence of the national economy on timber exports was also a driver of continued
deforestation. Poor forestry practices not only cause the loss of biodiversity and other ecosystem
services, but also excessive soil erosion, silting of rivers and degradation of adjacent coral reefs due
to sedimentation.
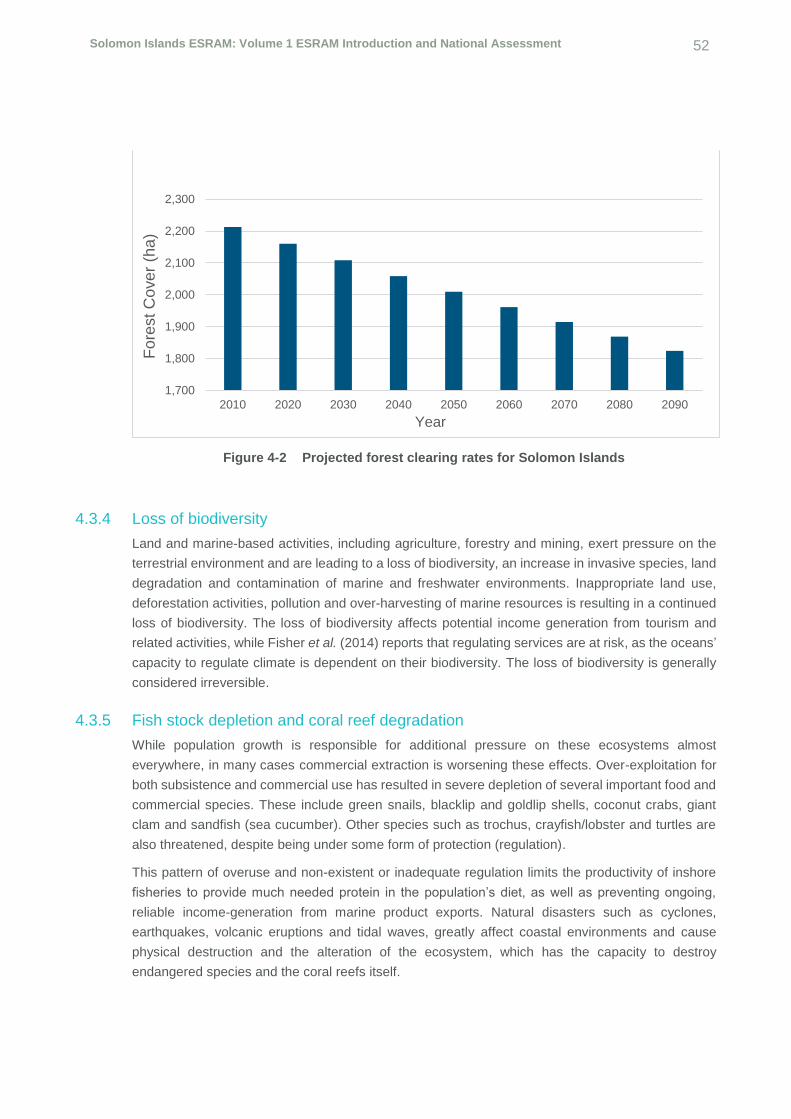
Solomon Islands ESRAM: Volume 1 ESRAM Introduction and National Assessment 52
Figure 4-2 Projected forest clearing rates for Solomon Islands
4.3.4 Loss of biodiversity
Land and marine-based activities, including agriculture, forestry and mining, exert pressure on the
terrestrial environment and are leading to a loss of biodiversity, an increase in invasive species, land
degradation and contamination of marine and freshwater environments. Inappropriate land use,
deforestation activities, pollution and over-harvesting of marine resources is resulting in a continued
loss of biodiversity. The loss of biodiversity affects potential income generation from tourism and
related activities, while Fisher et al. (2014) reports that regulating services are at risk, as the oceans’
capacity to regulate climate is dependent on their biodiversity. The loss of biodiversity is generally
considered irreversible.
4.3.5 Fish stock depletion and coral reef degradation
While population growth is responsible for additional pressure on these ecosystems almost
everywhere, in many cases commercial extraction is worsening these effects. Over-exploitation for
both subsistence and commercial use has resulted in severe depletion of several important food and
commercial species. These include green snails, blacklip and goldlip shells, coconut crabs, giant
clam and sandfish (sea cucumber). Other species such as trochus, crayfish/lobster and turtles are
also threatened, despite being under some form of protection (regulation).
This pattern of overuse and non-existent or inadequate regulation limits the productivity of inshore
fisheries to provide much needed protein in the population’s diet, as well as preventing ongoing,
reliable income-generation from marine product exports. Natural disasters such as cyclones,
earthquakes, volcanic eruptions and tidal waves, greatly affect coastal environments and cause
physical destruction and the alteration of the ecosystem, which has the capacity to destroy
endangered species and the coral reefs itself.
1,700
1,800
1,900
2,000
2,100
2,200
2,300
2010 2020 2030 2040 2050 2060 2070 2080 2090
Fo
rest C
ove
r (h
a)
Year

Solomon Islands ESRAM: Volume 1 ESRAM Introduction and National Assessment 53
The 2015 coastal fisheries report card (SPC 2015) reports that significant losses of coral reefs,
mangroves, seagrasses and intertidal habitats, all of which provide shelter and food for coastal
marine fauna, are expected to cause reductions in the productivity of coastal fisheries due to climate
change, threatening food security and livelihoods.
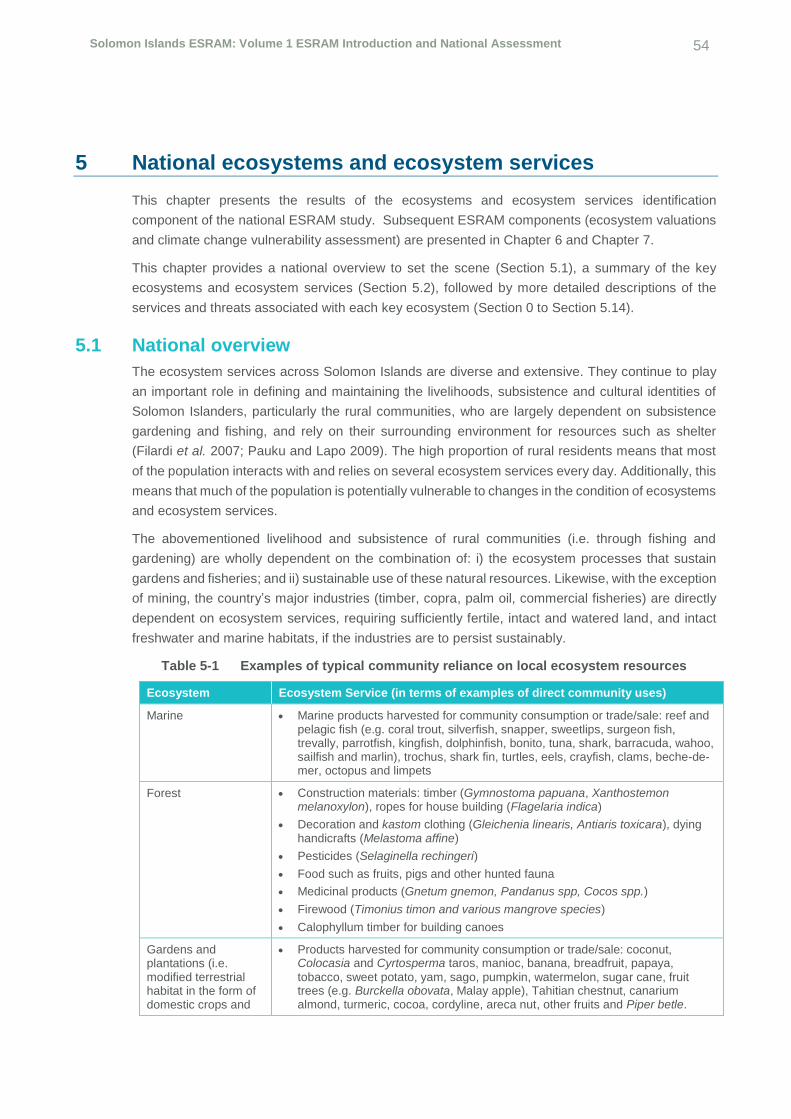
Solomon Islands ESRAM: Volume 1 ESRAM Introduction and National Assessment 54
5 National ecosystems and ecosystem services
This chapter presents the results of the ecosystems and ecosystem services identification
component of the national ESRAM study. Subsequent ESRAM components (ecosystem valuations
and climate change vulnerability assessment) are presented in Chapter 6 and Chapter 7.
This chapter provides a national overview to set the scene (Section 5.1), a summary of the key
ecosystems and ecosystem services (Section 5.2), followed by more detailed descriptions of the
services and threats associated with each key ecosystem (Section 0 to Section 5.14).
5.1 National overview
The ecosystem services across Solomon Islands are diverse and extensive. They continue to play
an important role in defining and maintaining the livelihoods, subsistence and cultural identities of
Solomon Islanders, particularly the rural communities, who are largely dependent on subsistence
gardening and fishing, and rely on their surrounding environment for resources such as shelter
(Filardi et al. 2007; Pauku and Lapo 2009). The high proportion of rural residents means that most
of the population interacts with and relies on several ecosystem services every day. Additionally, this
means that much of the population is potentially vulnerable to changes in the condition of ecosystems
and ecosystem services.
The abovementioned livelihood and subsistence of rural communities (i.e. through fishing and
gardening) are wholly dependent on the combination of: i) the ecosystem processes that sustain
gardens and fisheries; and ii) sustainable use of these natural resources. Likewise, with the exception
of mining, the country’s major industries (timber, copra, palm oil, commercial fisheries) are directly
dependent on ecosystem services, requiring sufficiently fertile, intact and watered land, and intact
freshwater and marine habitats, if the industries are to persist sustainably.
Table 5-1 Examples of typical community reliance on local ecosystem resources
Ecosystem Ecosystem Service (in terms of examples of direct community uses)
Marine Marine products harvested for community consumption or trade/sale: reef and pelagic fish (e.g. coral trout, silverfish, snapper, sweetlips, surgeon fish, trevally, parrotfish, kingfish, dolphinfish, bonito, tuna, shark, barracuda, wahoo, sailfish and marlin), trochus, shark fin, turtles, eels, crayfish, clams, beche-de-mer, octopus and limpets
Forest Construction materials: timber (Gymnostoma papuana, Xanthostemon melanoxylon), ropes for house building (Flagelaria indica)
Decoration and kastom clothing (Gleichenia linearis, Antiaris toxicara), dying handicrafts (Melastoma affine)
Pesticides (Selaginella rechingeri)
Food such as fruits, pigs and other hunted fauna
Medicinal products (Gnetum gnemon, Pandanus spp, Cocos spp.)
Firewood (Timonius timon and various mangrove species)
Calophyllum timber for building canoes
Gardens and plantations (i.e. modified terrestrial habitat in the form of domestic crops and
Products harvested for community consumption or trade/sale: coconut, Colocasia and Cyrtosperma taros, manioc, banana, breadfruit, papaya,
tobacco, sweet potato, yam, sago, pumpkin, watermelon, sugar cane, fruit trees (e.g. Burckella obovata, Malay apple), Tahitian chestnut, canarium almond, turmeric, cocoa, cordyline, areca nut, other fruits and Piper betle.
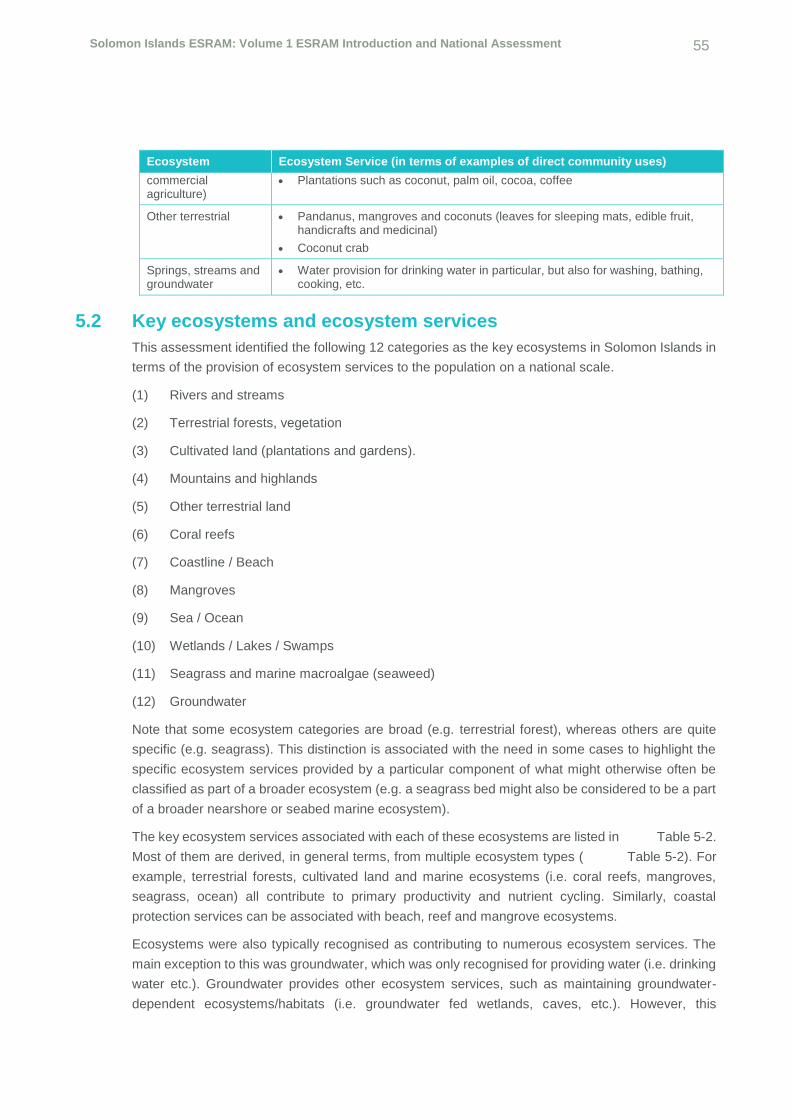
Solomon Islands ESRAM: Volume 1 ESRAM Introduction and National Assessment 55
Ecosystem Ecosystem Service (in terms of examples of direct community uses)
commercial agriculture)
Plantations such as coconut, palm oil, cocoa, coffee
Other terrestrial Pandanus, mangroves and coconuts (leaves for sleeping mats, edible fruit, handicrafts and medicinal)
Coconut crab
Springs, streams and groundwater
Water provision for drinking water in particular, but also for washing, bathing, cooking, etc.
5.2 Key ecosystems and ecosystem services
This assessment identified the following 12 categories as the key ecosystems in Solomon Islands in
terms of the provision of ecosystem services to the population on a national scale.
(1) Rivers and streams
(2) Terrestrial forests, vegetation
(3) Cultivated land (plantations and gardens).
(4) Mountains and highlands
(5) Other terrestrial land
(6) Coral reefs
(7) Coastline / Beach
(8) Mangroves
(9) Sea / Ocean
(10) Wetlands / Lakes / Swamps
(11) Seagrass and marine macroalgae (seaweed)
(12) Groundwater
Note that some ecosystem categories are broad (e.g. terrestrial forest), whereas others are quite
specific (e.g. seagrass). This distinction is associated with the need in some cases to highlight the
specific ecosystem services provided by a particular component of what might otherwise often be
classified as part of a broader ecosystem (e.g. a seagrass bed might also be considered to be a part
of a broader nearshore or seabed marine ecosystem).
The key ecosystem services associated with each of these ecosystems are listed in Table 5-2.
Most of them are derived, in general terms, from multiple ecosystem types ( Table 5-2). For
example, terrestrial forests, cultivated land and marine ecosystems (i.e. coral reefs, mangroves,
seagrass, ocean) all contribute to primary productivity and nutrient cycling. Similarly, coastal
protection services can be associated with beach, reef and mangrove ecosystems.
Ecosystems were also typically recognised as contributing to numerous ecosystem services. The
main exception to this was groundwater, which was only recognised for providing water (i.e. drinking
water etc.). Groundwater provides other ecosystem services, such as maintaining groundwater-
dependent ecosystems/habitats (i.e. groundwater fed wetlands, caves, etc.). However, this
Solomon Islands ESRAM: Volume 1 ESRAM Introduction and National Assessment 56
assessment focuses only on key ecosystem services in the context of direct benefits to the human
population.
Despite their high value, contributions of essential ecosystem services to the people of Solomon
Islands, the ecosystems are subject to significant anthropogenic stressors and threats (i.e. human-
derived pressures and degradation). In fact, most of the main existing threats of concern to
ecosystems are directly brought about by human activities (see Section 4.2). This contrasts with
future climate-related threats, which are typically indirect effects transpiring as legacy issues from
past human activities affecting the global climate.
Understanding and addressing existing threats is a core feature of EbA. This is because a crucial
adaptation option in EbA is to ameliorate existing threats (i.e. improve ecosystem health or
functioning) in order to build the resilience of an ecosystem to future climate change. In terms of
existing threats to ecosystems or ecosystem services at the national scale, major threats include
commercial logging, commercial inshore fishing, industrial agriculture such as oil palm plantations,
land-use change and habitat loss through urbanisation and the expansion of agricultural land,
construction of urban infrastructure, and mining (Roughan and Wara 2010; Peterson et al. 2012;
Furusawa et al. 2014). These threats are exacerbated by the nation’s rapid rate of population growth
and ongoing climate change (Walter and Hamilton 2014).
Further descriptions of the main services and threats associated with each ecosystem category are
provided in the following sections.
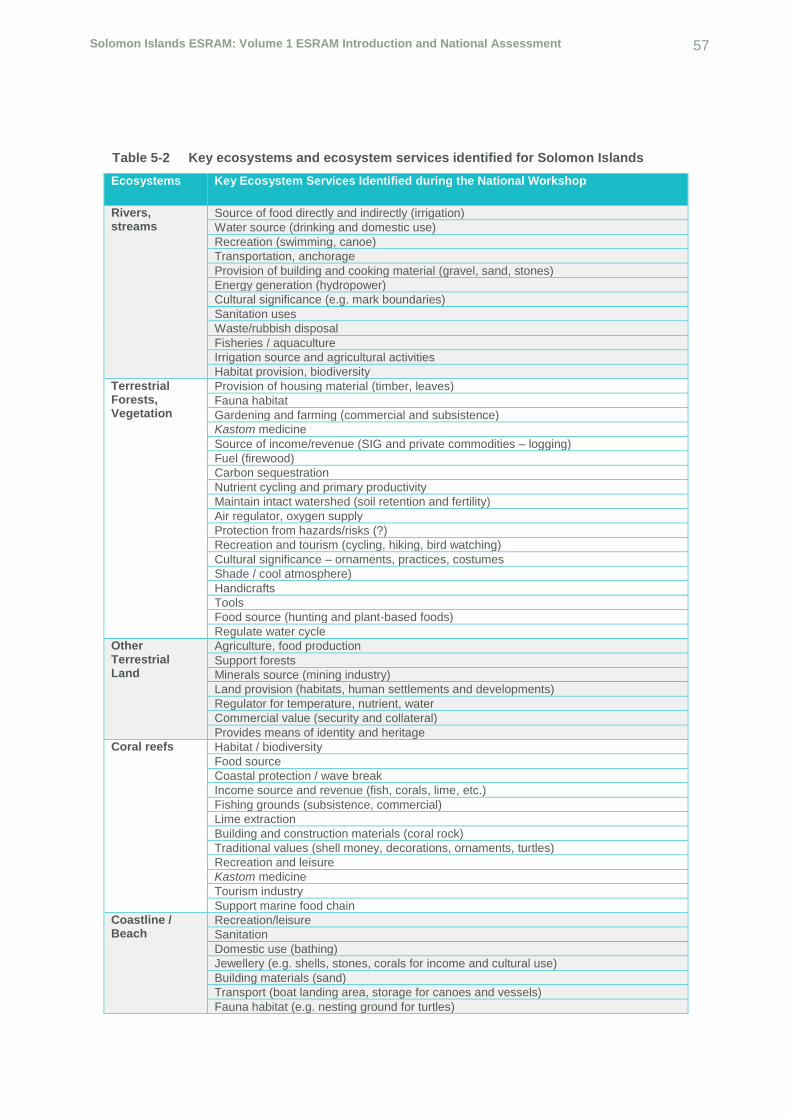
Solomon Islands ESRAM: Volume 1 ESRAM Introduction and National Assessment 57
Table 5-2 Key ecosystems and ecosystem services identified for Solomon Islands
Ecosystems Key Ecosystem Services Identified during the National Workshop
Rivers, streams
Source of food directly and indirectly (irrigation)
Water source (drinking and domestic use)
Recreation (swimming, canoe)
Transportation, anchorage
Provision of building and cooking material (gravel, sand, stones)
Energy generation (hydropower)
Cultural significance (e.g. mark boundaries)
Sanitation uses
Waste/rubbish disposal
Fisheries / aquaculture
Irrigation source and agricultural activities
Habitat provision, biodiversity
Terrestrial Forests, Vegetation
Provision of housing material (timber, leaves)
Fauna habitat
Gardening and farming (commercial and subsistence)
Kastom medicine
Source of income/revenue (SIG and private commodities – logging)
Fuel (firewood)
Carbon sequestration
Nutrient cycling and primary productivity
Maintain intact watershed (soil retention and fertility)
Air regulator, oxygen supply
Protection from hazards/risks (?)
Recreation and tourism (cycling, hiking, bird watching)
Cultural significance – ornaments, practices, costumes
Shade / cool atmosphere)
Handicrafts
Tools
Food source (hunting and plant-based foods)
Regulate water cycle
Other Terrestrial Land
Agriculture, food production
Support forests
Minerals source (mining industry)
Land provision (habitats, human settlements and developments)
Regulator for temperature, nutrient, water
Commercial value (security and collateral)
Provides means of identity and heritage
Coral reefs Habitat / biodiversity
Food source
Coastal protection / wave break
Income source and revenue (fish, corals, lime, etc.)
Fishing grounds (subsistence, commercial)
Lime extraction
Building and construction materials (coral rock)
Traditional values (shell money, decorations, ornaments, turtles)
Recreation and leisure
Kastom medicine
Tourism industry
Support marine food chain
Coastline / Beach
Recreation/leisure
Sanitation
Domestic use (bathing)
Jewellery (e.g. shells, stones, corals for income and cultural use)
Building materials (sand)
Transport (boat landing area, storage for canoes and vessels)
Fauna habitat (e.g. nesting ground for turtles)

Solomon Islands ESRAM: Volume 1 ESRAM Introduction and National Assessment 58
Ecosystems Key Ecosystem Services Identified during the National Workshop
Protection from coastal inundation
Mangroves Source of food
Building materials
Breeding grounds
Fuel source (firewood)
Coastal protection, shoreline stabilisation, buffer
Kastom medicine
Recreation
Sanitation
Habitat, biodiversity, nursery grounds
Carbon sequestration
Craft materials and dye
Tools (gardening) and weapons
Shell money source
Income / revenue source
Sea / Ocean Transportation
Habitat
Food source
Regulator of temperature/air
Income source (both commercial, SIG and small scale)
Mountains Building materials
Habitat (particularly for endemic species – high biodiversity value)
Support rivers (source of headwaters)
Regulate climate and weather
Safety from disasters (e.g. high ground)
Navigation land marks
Wetlands / Lakes / Swamps
Food source
Water source (drinking, domestic)
Habitat (incl. fauna breeding sites)
Transport
Building materials
Aquaculture
Heritage
Environmental filtration and water purification
Reduce flood flow rates
Tourism (birdwatching)
Seagrass and macroalgae (seaweeds)
Habitat (e.g. turtles, dugong)
Food source (e.g. Caulerpa spp.)
Income generation (commercial seaweed farming)
Kastom medicine
Stabilises coastal environments
Groundwater Water source (drinking and domestic use)
Source commercial bottled water (spring water)
Plantations and Gardens
Source of income and employment/livelihoods
Food source

Solomon Islands ESRAM: Volume 1 ESRAM Introduction and National Assessment 59
Table 5-3 Summary of ecosystem sources for key ecosystem services
Ecosystems
Fo
od
(la
nd
)
Fo
od
(sea,
river)
Wate
r (d
rin
kin
g)
Wate
r (o
the
r)
Bu
ild
ing
an
d h
ou
seh
old
m
ate
rials
Fu
el
and e
ne
rgy
Oth
er
mate
rials
, la
nd
,
min
era
ls
Cu
ltu
ral and t
rad
itio
nal
valu
es
Tra
ns
po
rt, n
avig
ati
on
Waste
dis
po
sal
and
san
itati
on
Hab
itat
and b
iod
ivers
ity
Ind
us
try a
nd c
om
merc
e
(in
co
me a
nd r
even
ue
)
Me
dic
ine
Recre
ati
on
and t
ou
rism
Carb
on
seq
ue
str
ati
on
Co
asta
l p
rote
cti
on
Nu
trie
nt
cyclin
g a
nd
pri
mary
pro
du
cti
vit
y
Safe
ty (
sh
ad
e,
tsu
na
mi,
ha
zard
s)
Reg
ula
te c
lim
ate
, air
, w
ate
r
cycle
, te
mp
.
Reg
ula
te w
ate
r q
ua
lity
Reg
ula
te w
ate
r fl
ow
rate
s
Rivers, streams
Terrestrial Forests, Vegetation
Other Terrestrial Land
Coral Reefs
Coastline / Beach
Mangroves
Sea / Ocean
Mountains
Wetlands / Lakes / Swamps
Seagrass and macroalgae (seaweeds)
Groundwater
Plantations and Gardens

Solomon Islands ESRAM: Volume 1 ESRAM Introduction and National Assessment 60
5.3 Rivers and streams
Rivers and streams, including both freshwater and tidal systems, occur throughout Solomon Islands,
particularly on the large islands, which have major rivers and watershed areas. The main exception
is many of the very small and/or atoll type islands, where the topography does not support river or
stream systems. Such waterways, and the ecosystems services they provide, are highly valued by
the people of Solomon Islands, such that the majority of settlements are located adjacent, or in close
proximity, to these ecosystems.
The ecosystem services provided by rivers and streams are many and varied, with the main services
from a community perspective including:
provision of water for drinking, domestic uses (i.e. bathing, laundry, cooking), industrial and
irrigation needs;
provision of food for both subsistence and commercial purposes (e.g. fish, eels, molluscs/shells,
crustaceans, kangkung);
support for both local and commercial fisheries, including aquaculture (e.g. tilapia aquaculture);
provision of opportunities for recreation and leisure (e.g. swimming, canoeing);
support for biodiversity, food sources and local flora and fauna through the provision of a range
of aquatic habitats;
provision of a means of transportation and travel, as well as storage (anchorage) for supporting
vessels;
provision of raw materials for building and cooking material (e.g. gravel, sand, motu stones);
provision of a means of energy generation through hydro-power (e.g. Tina River Hydro Project);
provision of various cultural values, depending on the location and local kastom (e.g. designate
boundaries, baptisms, source of ornamental and handicraft materials); and
provision of a conduit for waste disposal and dispersal, particularly for sanitation and household
waste.
Together, the provision of river/stream derived food, water and sanitation disposal services are
extremely high value services at a national scale. Adaptation to maintain these services in the face
of climate change would be considered a high priority at a national scale, especially at locations
where settlements are large or vulnerable, and highly dependent on local waterways.
Despite providing high value ecosystem services, rivers and streams are subject to major
disturbances and degradation from development and pollution. Most of these threats persist
throughout the nation.
The primary existing threats can generally be classified as developments, pollution, extraction and
other threats, as follows:
development – including instream, bank side and watershed developments, such as settlement
development, mining, infrastructure, urbanisation;

Solomon Islands ESRAM: Volume 1 ESRAM Introduction and National Assessment 61
pollution – from household sanitation and solid waste disposal, commercial and industrial inputs,
run-off from farming and catchment development (i.e. pesticide, fertiliser and sediment loads),
mining discharges, logging-related run-off (especially sediment loads from cleared land), vessel
inputs (e.g. fuel and oil spills);
extraction activities, such as gravel extraction, fishing and aquaculture, particularly where these
activities are undertaken on a commercial scale; and
other threats such as habitat modification and disturbance (e.g. bank revetment works), flooding
and extreme high rainfall events, slash and burn practices in close vicinity to waterways, invasive
species (e.g. tilapia Oreochromis spp., water hyacinth Eichhornia crassipes), and growing human
populations placing increasing pressure on waterway resources.
5.4 Wetlands, lakes and swamps
Enclosed fresh or brackish water bodies and swamps are common throughout Solomon Islands.
Swamp areas may support various vegetation types, such as freshwater swamp forest, herbaceous
swamps, sago swamp forest, and swamp with cultivated crops. At the community level and on a day-
to-day basis, wetlands and lakes are most highly valued for their role in providing food and food
security. Overall key ecosystem services associated with this ecosystem include:
provision of food – commonly used for cultivation of swamp taro (Cyrtosperma merkusii), taro
(Colocasia esculenta), sago palm Metroxylon sagu, fishing and aquaculture activities (e.g. fishing
for freshwater eels, aquaculture of tilapia Oreochromis spp. and milkfish Chanos chanos) at both
local subsistence and commercial scales;
environmental and natural hazard regulation, such as filtration and purification of run-off from
watersheds, and reducing flood flow rates;
provision of aquatic fauna habitat and support of biodiversity, including value as critical habitat for
migratory bird species;
provision of raw materials (i.e. traditional building materials, reeds for weaving);
support of tourism activities (e.g. bird watching) and
provision of opportunities for transport and research, and provides links with cultural heritage.
Pollution, development, habitat modification and increased population growth are the main existing
threats to the capacity of wetlands and lakes to continue to provide the above ecosystem services to
communities. In some respects, wetlands and lakes are more prone to the effects of existing threats
than are rivers and streams. This is because wetlands and lakes are often comparatively small in
size (and therefore smaller relative to a given development or other threat), and have longer water
retention times (i.e. lower capacity to flush pollutants). Key existing threats to this ecosystem type
can be summarised as:
pollution from household and commercial waste disposal (including sanitation), run-off from
agriculture and watershed development, and mining discharges;

Solomon Islands ESRAM: Volume 1 ESRAM Introduction and National Assessment 62
developments such as wetland reclamation, as well as logging and developments in the
watershed (i.e. causing direct disturbance through habitat loss and/or indirect disturbance via
pollutant inputs);
existing climatic effects through droughts and floods (i.e. loss of habitat and fauna) and
other threats such as human population growth (i.e. increasing both pollutant inputs and extraction
pressures) and invasive species (e.g. cane toad Rhinella marina, tilapia Oreochromis spp., water
hyacinth Eichhornia crassipes).
5.5 Terrestrial forests / vegetation
This broad ecosystem captures the majority of the land area in Solomon Islands, specifically any
vegetated land, excluding cultivated or otherwise developed land (i.e. plantations, built areas etc.).
In 2010, forest covered approximately 77% of the land area of Solomon Islands (SPREP 2016). Most
terrestrial vegetation is classified as varying types of forest, dominated by rainforest vegetation types
(e.g. rainforest, lowland rainforest, degraded rainforest, etc.). Other vegetation types, such as
grasslands also occur.
Important ecosystem services are provided not only from the vegetation directly but also from the
fauna – and products thereof – that inhabit terrestrial ecosystems. Communities rely on vegetated
land for raw materials (e.g. building materials, firewood) and food on a daily basis, and also
acknowledge their dependence on many other ecosystem services associated with the vegetated
terrestrial environment around them. Examples of forest uses by communities include: construction
timber (Gymnostoma papuana, Xanthostemon melanoxylon), ropes for house building (Flagelaria
indica), decoration and kastom clothing (Gleichenia linearis), dyeing handicrafts (Melastoma affine),
pesticides (Selaginella rechingeri), food (Finschia spp.), medicinal (Gnetum gnemon) and firewood
(Timonius timon) (Morrison et al. 2007).
Overall, key ecosystem services include:
provision of raw materials for building, fuel and commercial purposes, particularly timber and
thatching/weaving materials (i.e. materials for housing and household items, firewood, round log
export, canoe trees, such as the kerosene tree);
provision of food (i.e. hunting grounds, nuts such as the nglai nut from canarium indicum,
traditional fruits and vegetables);
provision of kastom medicine, and support of cultural items, practices and heritage (e.g. traditional
tools, ornaments, costumes, weaving, handicrafts and traditional currency); examples of
important resources in this regard include pandanus, reeds, feathers, shells, bark, coconut shells
and seeds;
environmental regulation of local environment and atmosphere by way of providing shade, cooler
areas and oxygen;
provision and regulation of environmental processes and functions such as primary productivity,
nutrient cycling, soil fertility and carbon sequestration;
Solomon Islands ESRAM: Volume 1 ESRAM Introduction and National Assessment 63
provision of opportunities for recreation, sport, leisure and tourism (e.g. hiking, bird watching), as
well as scientific research pursuits;
means of generating income and revenue (e.g. logging);
provision of fauna habitat (e.g. birds, insects, wildlife) and support of biodiversity;
provision of landmarks (e.g. for navigation) and trees that can mark other important areas such
as land ownership boundaries; and
provision of soil stability and hazard protection for communities (e.g. landslides, erosion, wind or
weather breaks).
Logging is arguably one of the most destructive existing threats to terrestrial forests and their
inhabitant flora and fauna communities in Solomon Islands. As stated by Filardi et al. (2007):
There is increasing pressure on forest systems to provide cash for landholding communities with
little access to alternatives for school fees, medical care and other basic services. The civil unrest
of the early 2000’s and accompanying economic hardship escalated large-scale unregulated
logging, with devastating ecological effects.
Extensive logging of lowland and hill forests, and subsequent land-clearing for copra and oil palm
plantations, have devastated much of the easily accessible forest (Filardi et al. 2007). Isabel, in
particular, has been subject to widespread and unregulated logging, with the only remaining tracts
of intact forest on its most eastern and western ends (Filardi et al. 2007). Despite extensive
degradation, there remain fragments of pristine forest, especially further inland and at higher altitudes
(Filardi et al. 2007; Pollard et al. 2014).
In addition to the direct loss of forest vegetation, logging also has indirect consequences, such as
the loss of important trees integral to the livelihoods of forest-dependent human communities, threats
to clean running water, loss of biodiversity, and threats to marine life via sediment run-off (Morrison
et al. 2007).
Other existing threats to this ecosystem and its services are numerous and may vary significantly
between locations. In a general sense, the most significant threats are described below.
Logging and deforestation, particularly at locations where logging activity is intensive and/or
widespread. Upland logging has been extensive and ongoing in the region for last 30 years, with
most of the upland area from the coast to 400 m elevation licensed to logging companies at one
time or another during this period (Halpern et al. 2013). Other industries such as mining and
agriculture may cause deforestation, noting that there are currently numerous proposals for new
mines (especially for tenements throughout Isabel and Choiseul Provinces). Deforestation is also
undertaken to improve land for the expansion of settlements (i.e. urban encroachment),
plantations and other agriculture (e.g. slash and burn agricultural) practices, which occurs at both
subsistence and commercial scales.
Unsustainable harvesting – harvesting of plant species and local wildlife such as giant rats and
possums as bush meat (Morrison et al. 2007), together with human population growth and
increased cash-based needs (i.e. rising food and education costs), result in over-harvesting and
further exploitation and/or destruction of terrestrial forests.

Solomon Islands ESRAM: Volume 1 ESRAM Introduction and National Assessment 64
Pollution, particularly from the use of pesticides and other agricultural chemicals on the land,
sanitation uses (which also create a human health risk), and illegal waste disposal.
Existing climate related threats such as bush fires, droughts, cyclones, alternating climate cycles
(i.e. El Niño and La Niña cycles) and other natural disasters. Frequent deforestation occurs as
result of cyclones, earthquakes, landslides and volcanism (Mayr and Diamond 2001).
Invasive species – The Pacific Island Ecosystem at Risk (PIER) project lists over 150 invasive
and potentially invasive species threatening terrestrial ecosystems in Solomon Islands. Key
invasive species of concern include: feral pigs, rats, cats and dogs; insects such as fire ants
(Wasmannia auropunctata), black twig borer, and fruit flies; cane toads (Rhinella marina); and
invasive plants such as Merremia peltata, Browsonaetia papyrifera, and mimosa weed Mimosa
sp. (Filardi et al. 2007). Note also that reforestation efforts on cleared lands often use introduced
species of Eucalyptus (Morrison et al. 2007).
Illegal wildlife trade – native wildlife (e.g. birds, snakes and possums), including species of high
conservation value, are commonly captured and sold in the illegal wildlife trade (Morrison et al.
2007; Pikacha et al. 2012).
Other threats such as poor governance or poor coordination between jurisdictions for
management, lack of awareness among the community about forest values, recovery and
sustainable management.
5.6 Mountains (highlands / cloud forests)
Mountains and their montane cloud forests are a high-altitude sub-category of terrestrial forest. In
this sense, they provide many of the same ecosystem services (and are subject to many of the same
threats) as those described above for terrestrial forests (Section 5.5). However, they are commonly
perceived as a separate ecosystem type with discrete values worth highlighting, in part due to both
altitude related factors and their often unique biodiversity values. These are briefly addressed below.
Montane cloud forests descend to approximately 1200 m above sea level on Guadalcanal and
Kolombangara, 650 m on Vangunu and Makira, and to 600 m on Gatakae (Filardi et al. 2007). Note
that these elevations are somewhat unique (i.e. they only descend to 2000 m above sea level in
neighbouring Papua New Guinea) due to small island effects on climate (Filardi et al. 2007). At high
elevations, the forests are situated within a zone shrouded by cloud on most days; trees are stunted,
decreasing forest height; trunks and branches are gnarled and draped with moss and ferns; the
canopy is more open; and palm and pandana are plentiful (Hadden 1981; Filardi et al. 2007).
Montane cloud forests in Solomon Islands are recognised for their high biodiversity value because
they: i) support high altitude species that do not occur in other ecosystems; and ii) often contain
endemic species. These montane ecosystems often give rise to endemic species because they
essentially comprise isolated high altitude ‘islands’ within the terrestrial landscape.
These high altitude ecosystems tend to be most valued for the following ecosystem services:
provision of raw materials (trees) for building materials;
support for biodiversity, particularly by providing habitat for endemic species;

Solomon Islands ESRAM: Volume 1 ESRAM Introduction and National Assessment 65
provision of the headwaters (i.e. water source) for downstream waters;
regulating local climate and weather;
provision of hazard protection and safety from disasters (e.g. high ground, physical barrier against
weather); and
supporting navigation (i.e. natural landmarks).
While the threats identified in Section 5.5 are broadly applicable here also, the most relevant existing
threats (in terms of the above-mentioned ecosystem services) include logging and deforestation,
mining proposals, and invasive species. Even where logging does not occur directly within a montane
area, logging of adjacent hills and lowlands can continue to cause environmental effects on lands at
higher elevations. Firstly, with the loss of lowland and hill forests, communities are forced to rely
more heavily on montane forests for ecosystem services (e.g. provision of building materials) that
would normally be provided by forests at lower elevations. Secondly, land clearing appears to cause
shifts in local microclimates along altitudinal gradients (i.e. along the lowland to montane forest
gradient), such that some otherwise intact montane environments are being degraded due to
microclimate shifts (Filardi et al. 2007). Other edge effects associated with the deforestation of
adjacent (lowland/hill) ecosystems may also be an issue, such as exposed montane forests
potentially being more vulnerable to infiltration by weed species.
Tourism is an additional threat that has been identified since the mountains are targeted for
ecotourism pursuits, such as trekking and bird watching. The mountains generally cover a
comparatively small spatial area and have fewer residents compared to lowland and hilly terrains, so
tourism and its effects may be more prominent.
5.7 Other terrestrial land
This ecosystem category has been included to capture any terrestrial lands that would not typically
be considered to be vegetated or cultivated land (i.e. forests, plantations, etc.). It includes built-up
areas, such as settlements, urban areas, industrial and commercial precincts, and the locations of
infrastructure. While inherently highly modified or disturbed by definition, this category is important
from a human perspective, as it is where the majority of the population of Solomon Islands reside
and spend most of their time.
Non-forested or otherwise vegetated lands provide areas for housing, development, businesses,
administrative buildings, and services, such as schools, police stations, hospitals, landfill and
transport services (e.g. airports). Land has commercial value (e.g. security and collateral). It also
provides a means of identity and heritage for people.
As a source of minerals, land in general (regardless of whether it is vegetated or not) also has value
to the mining industry.
Despite the above values, this category is not considered to provide much in the way of ecosystem
services, given its highly modified nature and particularly when compared to ecosystems in a more
natural state. That being said, it is acknowledged that the greener areas of this landscape (e.g. urban
greenspace, urban gardens and landscaped areas) provide ecosystem services at highly localised
scales. These include, for example:
Solomon Islands ESRAM: Volume 1 ESRAM Introduction and National Assessment 66
provision of shade (and associated human health and leisure values);
provision of aesthetic values (in an often heavily built-up environment);
support for biodiversity through the provision of urban habitat and fauna corridors; and
provision of opportunities for recreation and leisure.
Threats arise through pollution (e.g. solid waste disposal), physical damage by people and vehicles,
poor management and inadequate maintenance.
5.8 Coral reefs
Coral reefs border most of the islands and/or form barrier reefs around and between the larger
islands, especially throughout Choiseul and Isabel Provinces (Figure 5-1). These reefs and the
marine lagoons they form are a vital natural resource, sustaining the livelihoods and sustenance of
nearby coastal communities, and are also directly essential for maintaining the nation’s inshore
fisheries. Specifically, inshore fisheries and marine resources play a critical and unique role in the
rural economy and livelihoods of Solomon Islands communities, supplying daily protein and
micronutrients, and serving as one of the few sources of cash income (Abernathy et al. 2014).
Examples of the types of resources harvested include fish (e.g. coral trout, silverfish, snapper,
sweetlips, surgeon fish, trevally, parrotfish, kingfish, sharks, eels), crayfish, turtles, octopus, clams,
beche-de-mer, trochus and coral (Feinberg 2010; Moseby et al. 2012).
Other ecosystem services are also recognised and together the key services for coral reefs at a
national scale are summarised below.
Provision of food – Inshore marine resources are the most common source of animal-based food
in diets (Aswani 2002; Bell et al. 2009 in Abernathy et al. 2014), essential for subsistence and
food security.
Support biodiversity and marine fauna of the Solomon Islands’ EEZ – marine species’ richness is
mainly concentrated in waters from Guadalcanal north-westward to Isabel, Western and Choiseul
Provinces (
Figure 5-2). These are largely coastal waters, of which coral reefs are a prominent feature. Coral
reefs are a very important habitat for marine fauna, often being required as essential feeding,
breeding, spawning, cleaning and aggregation habitats (e.g. for sea turtles, grouper, coral and
migratory species).
Support income and revenue generation, as well as community livelihoods – This is primarily
through commercial extractive enterprises (e.g. fishing, aquarium trade, coral, lime extraction),
and also tourism operations such as scuba diving.
Provision of raw materials – This includes coral rock (i.e. building and construction material) and
lime production (associated with both the construction industry for concrete production, and also
for betel nut use).
Hazard protection, particularly coastal protection from natural hazards – Reefs act as a wave
against wave energy (important during major events such as tsunami, cyclones and storm
surges).

Solomon Islands ESRAM: Volume 1 ESRAM Introduction and National Assessment 67
Regulation of marine primary productivity, nutrient and carbon cycling – Reefs are critical to
coastal food chains, which are in turn essential for maintaining the food, biodiversity and income-
related services above.
Support of traditional cultural values and practices – this includes kastom medicine, shell money,
ornaments and decorations.
Provision of opportunities for recreation and leisure, as well as scientific research pursuits.
With respect to commercial harvesting of sharks (i.e. reef sharks for both the meat and fin trades) it
is worth mentioning that shark fins are highly valued as both a reliable and extremely cost-effective
export. Fins are dried, do not require refrigeration and, if treated with care, can be stored for months
without losing their value (Feinberg 2010). Demand is high and Solomon Islanders eat shark meat
so the carcasses do not go to waste (Feinberg 2010).

Solomon Islands ESRAM: Volume 1 ESRAM Introduction and National Assessment 68
Figure 5-1 Mangroves, seagrass and reefs
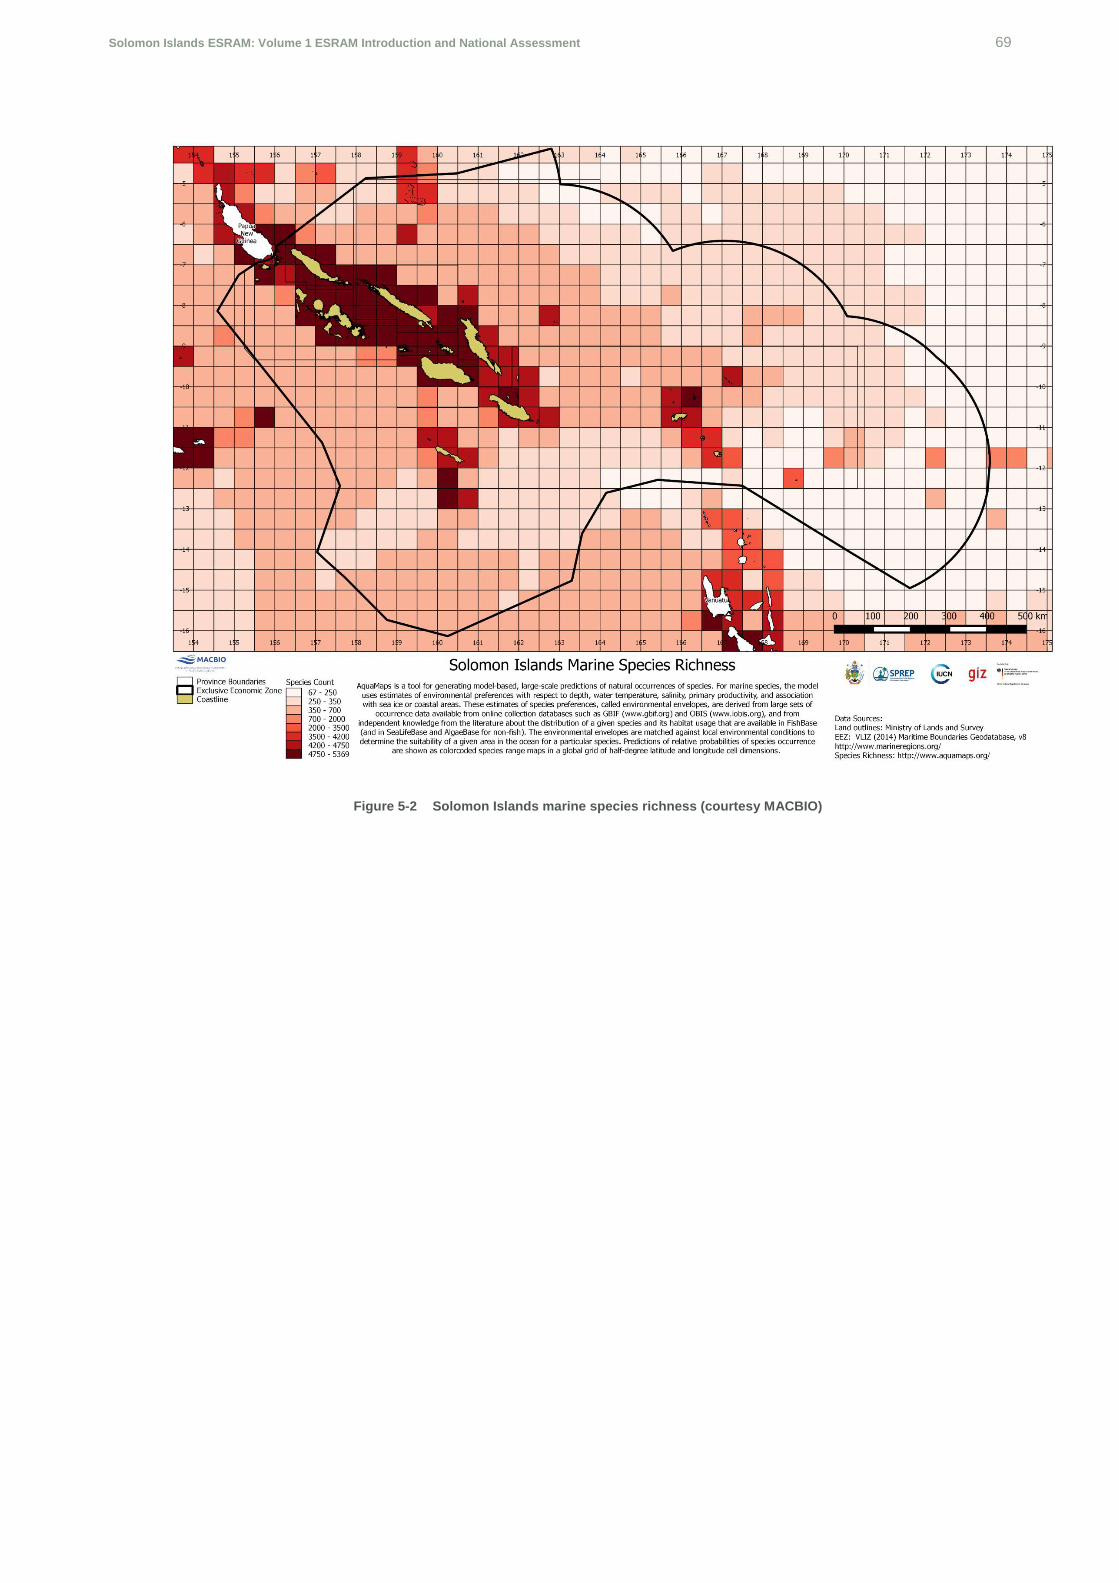
Solomon Islands ESRAM: Volume 1 ESRAM Introduction and National Assessment 69
Figure 5-2 Solomon Islands marine species richness (courtesy MACBIO)
69

Solomon Islands ESRAM: Volume 1 ESRAM Introduction and National Assessment 70
Coral reefs and the services they provide are subject to existing threats from both land and sea-
based sources, most of which are associated with anthropogenic activities. Key threats are described
below.
Logging and deforestation result in increased sediment loads to coastal waters and sedimentation
of reefs and seagrass meadows. Halpern et al. (2013) observed many lagoon reefs in the
Solomon Islands smothered with sediment up to 10 cm deep through sedimentation from upland
logging. It is thought that lagoons and reefs have some resilience to sedimentation where they
are located in close proximity to major rivers, because they naturally experience sediment run-off
(Halpern et al. 2013).
Overharvesting – overfishing and unsustainable harvesting/extraction of marine resources occur
to varying degrees throughout Solomon Islands. This threat is likely to be exacerbated by
increasing population growth and the associated increase in demand for reef resources. With
respect to fisheries, there are limits to the capacity of the domestic fisheries sector to support the
nutritional requirements of people in Solomon Islands (Bell et al. 2009; Weeratunge et al. 2011 in
Abernathy et al. 2014). In this regard, the SI National Strategy for the Management of Inshore
Fisheries and Marine Resources (2010) identifies community-based marine resource
management as critical for sustainable and secure inshore fisheries. This strategy is essential to
the Solomon Island government’s strategy for sustaining inshore marine resources and ensuring
food security in the face of population growth, climate change and resource degradation
(Abernathy et al. 2014) and additionally, the government is considered an existing EbA strategy.
Habitat destruction and deterioration through destructive harvesting practices such as dynamite
fishing, and other activities damaging reef habitat (e.g. anchorage, coral harvesting, tourism
pollution – see below).
Coastal pollution – which primarily originates from untreated discharges, solid waste disposal and
chemical inputs (e.g. sewage and industrial, shipping and hospital waste disposal), and run-off
(e.g. sediment, nutrients, pesticides). In addition to direct pollution threats (e.g. digestion of
plastic, food contamination, water quality decline, bioaccumulation), secondary threats may also
occur and may include increasing populations of crown-of-thorns starfish (which feed on corals).
Coastal development through developments, such as reclamation and settlement expansion, and
construction of coastal infrastructure, such as jetties and seawalls.
Other threats such as coral bleaching, ghost fishing (i.e. fishing by discarded nets and traps), and
the potential threat of invasive species (i.e. marine pests) via shipping activities or other means.
5.9 Seagrass / marine flora
Seagrass meadows in the Solomon Islands occur in shallow nearshore areas, primarily in marine lagoons, in the vicinity of river mouths and other semi-enclosed coastal waters (Figure 5-1).
This ecosystem category also includes other marine flora (marine macroalgae), primarily to capture the commercial farming of seaweed. Seaweed farming tends to occur in marine lagoons and therefore tends to occupy a similar niche to seagrass (see map of production sites in
Figure 5-3), and therefore are also subject to some of the same threats as seagrass.

Solomon Islands ESRAM: Volume 1 ESRAM Introduction and National Assessment 71
From a community perspective, the following key ecosystem services are recognised:
provision of food for subsistence and commercial purposes directly (i.e. net fishing in marine
lagoons), and indirectly as a primary producer contributing to the productivity and food chains of
nearshore marine environments;
source of income generation (i.e. in the case of commercial farming of seaweed);
support for marine fauna habitats and biodiversity, including essential habitats for marine
megafauna of cultural and conservation significance (e.g. turtles, dugong);
provision of kastom medicine (e.g. there are traditional medicinal uses for holophila spp.); and
regulation of coastal sedimentary habitats and sediment transport (i.e. stabilises coastal
environments by trapping and retaining sediment).
Figure 5-3 Seaweed production sites (from Kronen 2010)
Existing threats to this ecosystem category are derived from both land and sea-based sources, with
key threats to seagrass meadows including:
sedimentation, which smothers seagrass and is exacerbated by run-off from deforested areas;

Solomon Islands ESRAM: Volume 1 ESRAM Introduction and National Assessment 72
physical habitat loss and disturbance from destructive harvesting practices (e.g. trawling) in
seagrass areas, anchoring, reclamation and coastal development;
pollution from sources such as sewage inputs, run-off and inappropriate disposal of solid wastes,
which can affect seagrasses (e.g. nutrient, sediment and herbicide loads) and their inhabitant
fauna (e.g. plastic digestion, contamination, bioaccumulation of potential contaminants); and
overharvesting of target fauna species associated with seagrass meadows.
Seaweed farms are affected by threats such as cyclones and other climatic events that can devastate
farms, herbivory of seaweed by fish and other animals, extreme low tides and market effects.
5.10 Coastline / beaches
Beaches and other foreshores throughout Solomon Islands’ extensive coastline(s) – or side sea –
provide the boundary between terrestrial and marine environments. As most communities are
situated in or near coastal areas, environments along the coastline are often heavily utilised by
communities for a variety of uses. Key ecosystem services in this regard include:
supporting waste disposal for sanitation purposes (i.e. toileting).;
provision of water for domestic uses (e.g bathing);
provision of raw materials for building and construction (e.g. sand, gravel, stones).
support for transport activities (e.g. act as a boat landing area, provide accessible land for storage
for canoes and other vessels);
support for cultural values and practices through the provision of materials for jewellery,
ornaments and decorations (e.g. shells, stones).
support of biodiversity and fauna, with special recognition as an essential breeding habitat for sea
turtles (both of which are of high cultural and conservation value);
regulation of coastal protection from natural hazards (i.e. buffer coastal communities against
inundation from tsunami and storm surge etc.); and
provision of opportunities for recreation and leisure activities.
Existing threats tend to be concentrated at locations where this ecosystem occurs in close proximity
to human settlements and/or other human activities. At these locations, the main existing threats
include:
habitat loss and modification through activities such as coastal development and reclamation,
seawall construction and other physical disturbances (including extraction of sand, gravel and
other materials);
habitat loss and modification via natural events and processes, such as cyclones, tsunami, natural
sediment transport processes (i.e. coastal erosion and accretion);
pollution caused by sanitation and disposal of household solid wastes. These have multiple
effects on the environment, such as habitat modification, habitat and fauna contamination and

Solomon Islands ESRAM: Volume 1 ESRAM Introduction and National Assessment 73
loss of aesthetic values. They also pose a significant human health risk to communities that utilise
the same area for bathing, recreation and/or fishing.
unsustainable or excessive extraction of raw materials, especially sand and gravel, which can
alter both the ecosystem characteristics and functions; and
increasing human population sizes, which adds pressure to the above ecosystem services.
5.11 Mangroves
Solomon Islands possesses nearly 65,000 ha of mangrove forests containing approximately 25
mangrove species (Warren-Rhodes et al. 2011). The indicative location of mangrove areas is shown
in Figure 5-1, noting that this intertidal vegetation type is patchily distributed and not prominent
around the coastline of all islands. Again, being a coastal ecosystem, mangroves are often located
in close proximity to coastal settlements. In such cases, they are usually highly valued and heavily
utilised by local communities.
The primary mangrove ecosystem services for communities and the natural resources they rely upon
are:
provision of food, primarily to meet subsistence and food security needs through sources such as
fish, mud crabs, molluscs, mangrove fruit (e.g. mangrove clams in the genus Polymesoda and
ark clams Andara spp.);
provision of raw materials (mainly mangrove timber) for construction and building, as well as for
firewood;
support of biodiversity and fauna habitat, noted for value as breeding, nursery and feeding
grounds for fisheries species;
contribution to coastal protection from natural hazards by acting as a physical barrier between the
land and sea, and stabilising foreshores to protect against coastal erosion;
support of traditional cultural values and practices through the provision of materials used for
kastom medicine, crafts, tools (gardening), weapons, shell money and dye, etc.
support of waste disposal and dispersal services, particularly with respect to sanitation uses (i.e.
common toilet area);
regulating of the carbon cycle and climate, particularly through carbon sequestration; and
support for community-level income-generation and livelihoods where the above services are
commercialised or traded (e.g. food, timber).
In the context of the above ecosystem services, the most relevant existing threats to mangroves are
unsustainable harvesting of mangrove timber, as well as clearing/loss of mangroves for reclamation
and coastal constructions. Overall, key existing threats include:
unsustainable harvesting of timber and food resources, which is being exacerbated in coastal
communities that have high population growth rates (and rely on mangroves);
Solomon Islands ESRAM: Volume 1 ESRAM Introduction and National Assessment 74
mangrove clearing/loss for land reclamation, construction and coastal development, as well as
clearing for transport/passage;
sediment transport processes (erosion and accretion), particularly large scale and sudden
sediment movements such as sedimentation resulting from flooding; such processes can
undermine (erosion) or smother (sedimentation) mangrove root systems;
pollution from household sanitation uses and solid waste disposal, which can contaminate local
food resources, cause water quality degradation, reduce aesthetic values and introduce
persistent materials such plastics into the environment; and
the fact that mangrove environments are often poorly perceived by people (i.e. often considered
a waste disposal area) and do not usually have the conservation prestige afforded to coral reefs,
for example). This can further contribute to the above anthropogenic effects.
5.12 Sea / Ocean
Beyond the nearshore marine ecosystems already mentioned (i.e. reefs, seagrasses, mangroves,
beaches), the marine area of Solomon Islands remains vast, encompassing much of the nation ’s
approximately 1.6 million km2 exclusive economic zone (EEZ). This sea contains pelagic waters to
the deep sea, and a complex topography of seafloor features such as seamounts, ridges and
canyons. While oceans provide extensive ecosystem services on a global scale, for the people of
Solomon Islands, the most directly relevant services at a local to national scale include:
provision of food in the form of pelagic fish (e.g. dolphinfish, bonito, tuna, sharks, barracuda,
wahoo, sailfish and marlin); together with fish from other marine environments (e.g. reefs and
lagoons), this food contributes to providing the primary animal protein in local diets;
a means of income and revenue-generation through supporting the fisheries industries, from
artisanal to major international fishing operations (detailed further below);
provision of a means of transport, noting that marine-based transport is an important means of
inter-island travel, freight and logistics, as well as the primary means of importing and exporting
international goods;
provision of mineral resources – while deep-sea mining is not being undertaken, the ocean is
recognised as containing a wealth of mineral resources in Solomon Islands’ EEZ; these minerals
are particularly concentrated around deep-sea hydrothermal vents and sea mounts, and have
been the subject of considerable exploration activities in recent years; and
regulation of atmosphere and climate.
Seas are highly connected globally, such that Solomon Island marine ecosystems are prone to
effects from outside the nation’s EEZ. Indeed, global phenomena such as global warming are among
the greatest threats. Existing threats originating locally remain relevant and are also important to
concentrate on, particularly since they are within the nation’s jurisdiction and can be managed
autonomously by the Solomon Island’s government. In this regard, and in the context of the above
ecosystem services, the key existing threats are pollution and unsustainable extractive industries.

Solomon Islands ESRAM: Volume 1 ESRAM Introduction and National Assessment 75
Pollution is both land-derived (i.e. run-off, sewage inputs, solid waste disposal) and marine-derived
from shipping and vessel operations (e.g. vessel fuel and oil spills, antifoulant, ballast, rubbish
disposal). Solid wastes (i.e. rubbish) do not necessary originate locally, but may be mobilised from
external waters by currents (e.g. floating plastics, ghost nets, floating rafts of accumulated marine
debris). Unsustainable harvesting is also a significant threat to most of the fisheries resources,
especially some tuna species that are a major revenue stream to the nation through fishing licences
to international fishing fleets.
By way of further fisheries background, marine waters in Solomon Islands are separated into distinct fishing access areas as summarised in Table 5-4 and illustrated in Figure 5-4.
Note that waters from the mean high water mark (MHWM) to the archipelagic waters, inclusive, are the most productive of the EEZ (Figure 5-5).
In part due to these fishing access boundaries, as well as other factors (such as proximity and access
to land and markets, varying population sizes across the nation, and the distribution of marine
habitats and productivity), the intensity of fishing is not uniform across the nation.
Higher intensity artisanal fishing tends to occur around northern Guadalcanal, Western Province and
Malaita (Figure 5.6).
Tuna catches (combining catches from purse seine, pole-and-line, and longline tuna fishing methods
from 2001 to 2010) are strongly concentrated in the north-western quarter of the EEZ (Figure 5-7).
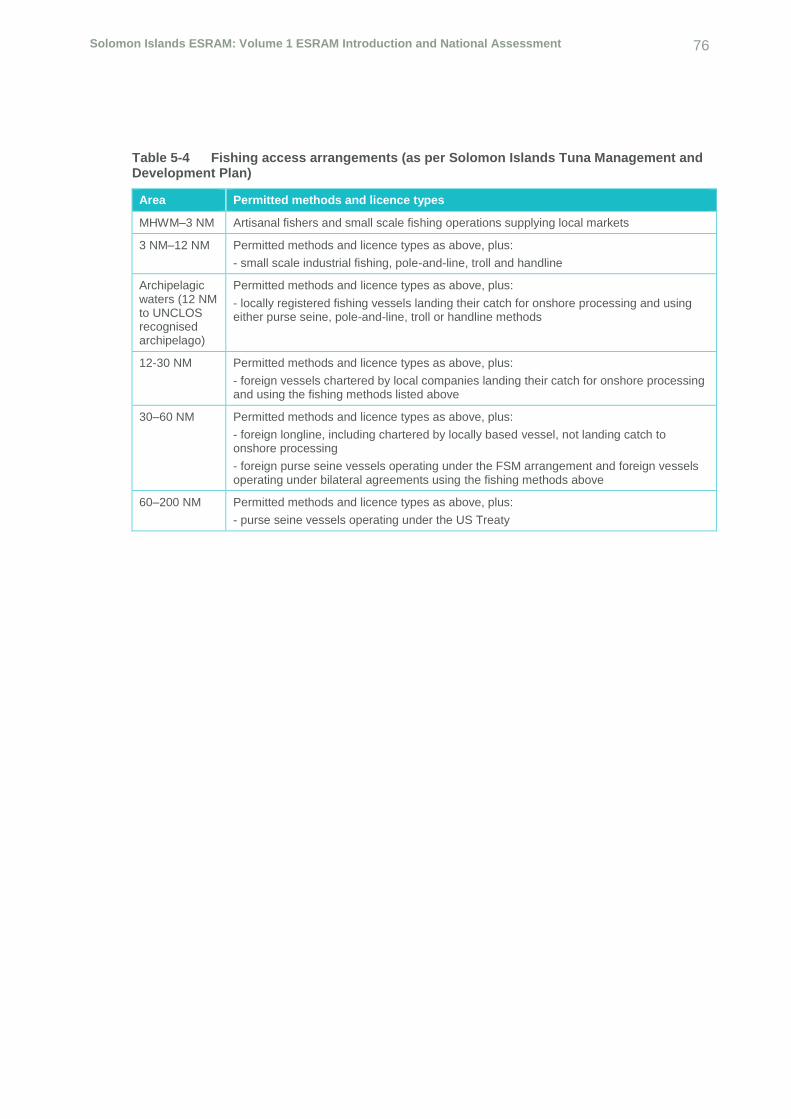
Solomon Islands ESRAM: Volume 1 ESRAM Introduction and National Assessment 76
Table 5-4 Fishing access arrangements (as per Solomon Islands Tuna Management and Development Plan)
Area Permitted methods and licence types
MHWM–3 NM Artisanal fishers and small scale fishing operations supplying local markets
3 NM–12 NM Permitted methods and licence types as above, plus:
- small scale industrial fishing, pole-and-line, troll and handline
Archipelagic waters (12 NM to UNCLOS recognised archipelago)
Permitted methods and licence types as above, plus:
- locally registered fishing vessels landing their catch for onshore processing and using either purse seine, pole-and-line, troll or handline methods
12-30 NM Permitted methods and licence types as above, plus:
- foreign vessels chartered by local companies landing their catch for onshore processing and using the fishing methods listed above
30–60 NM Permitted methods and licence types as above, plus:
- foreign longline, including chartered by locally based vessel, not landing catch to onshore processing
- foreign purse seine vessels operating under the FSM arrangement and foreign vessels operating under bilateral agreements using the fishing methods above
60–200 NM Permitted methods and licence types as above, plus:
- purse seine vessels operating under the US Treaty
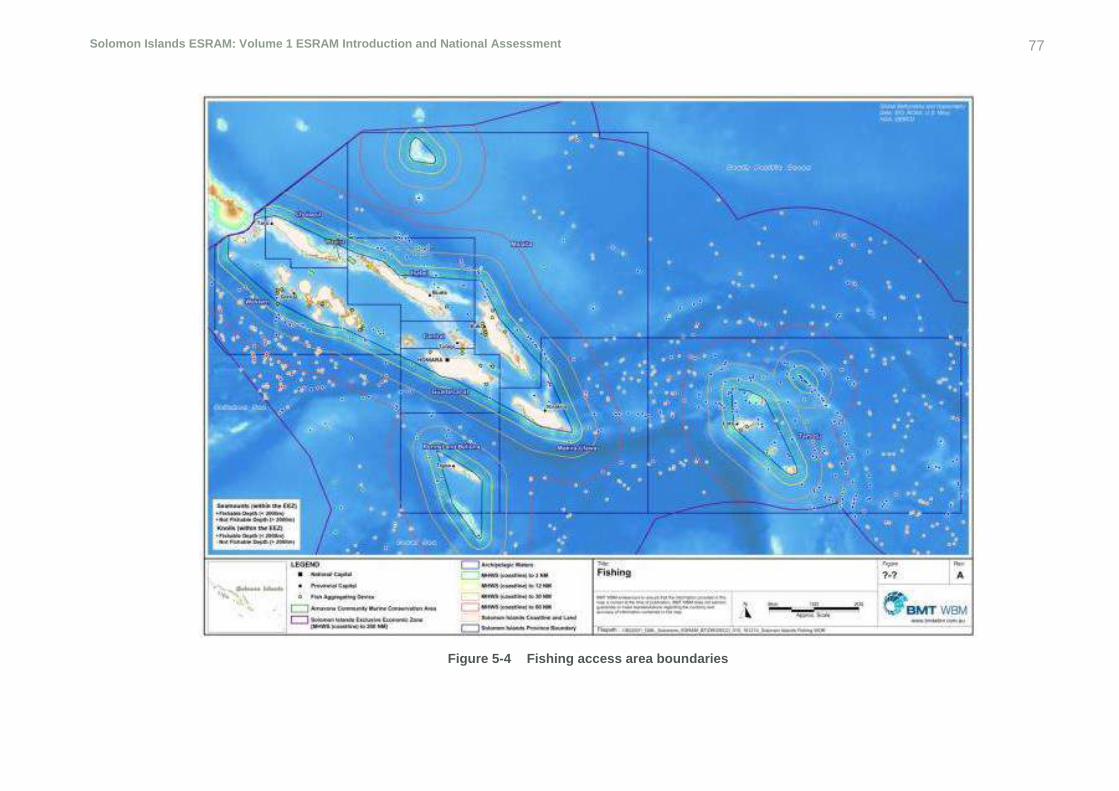
Solomon Islands ESRAM: Volume 1 ESRAM Introduction and National Assessment 77
Figure 5-4 Fishing access area boundaries
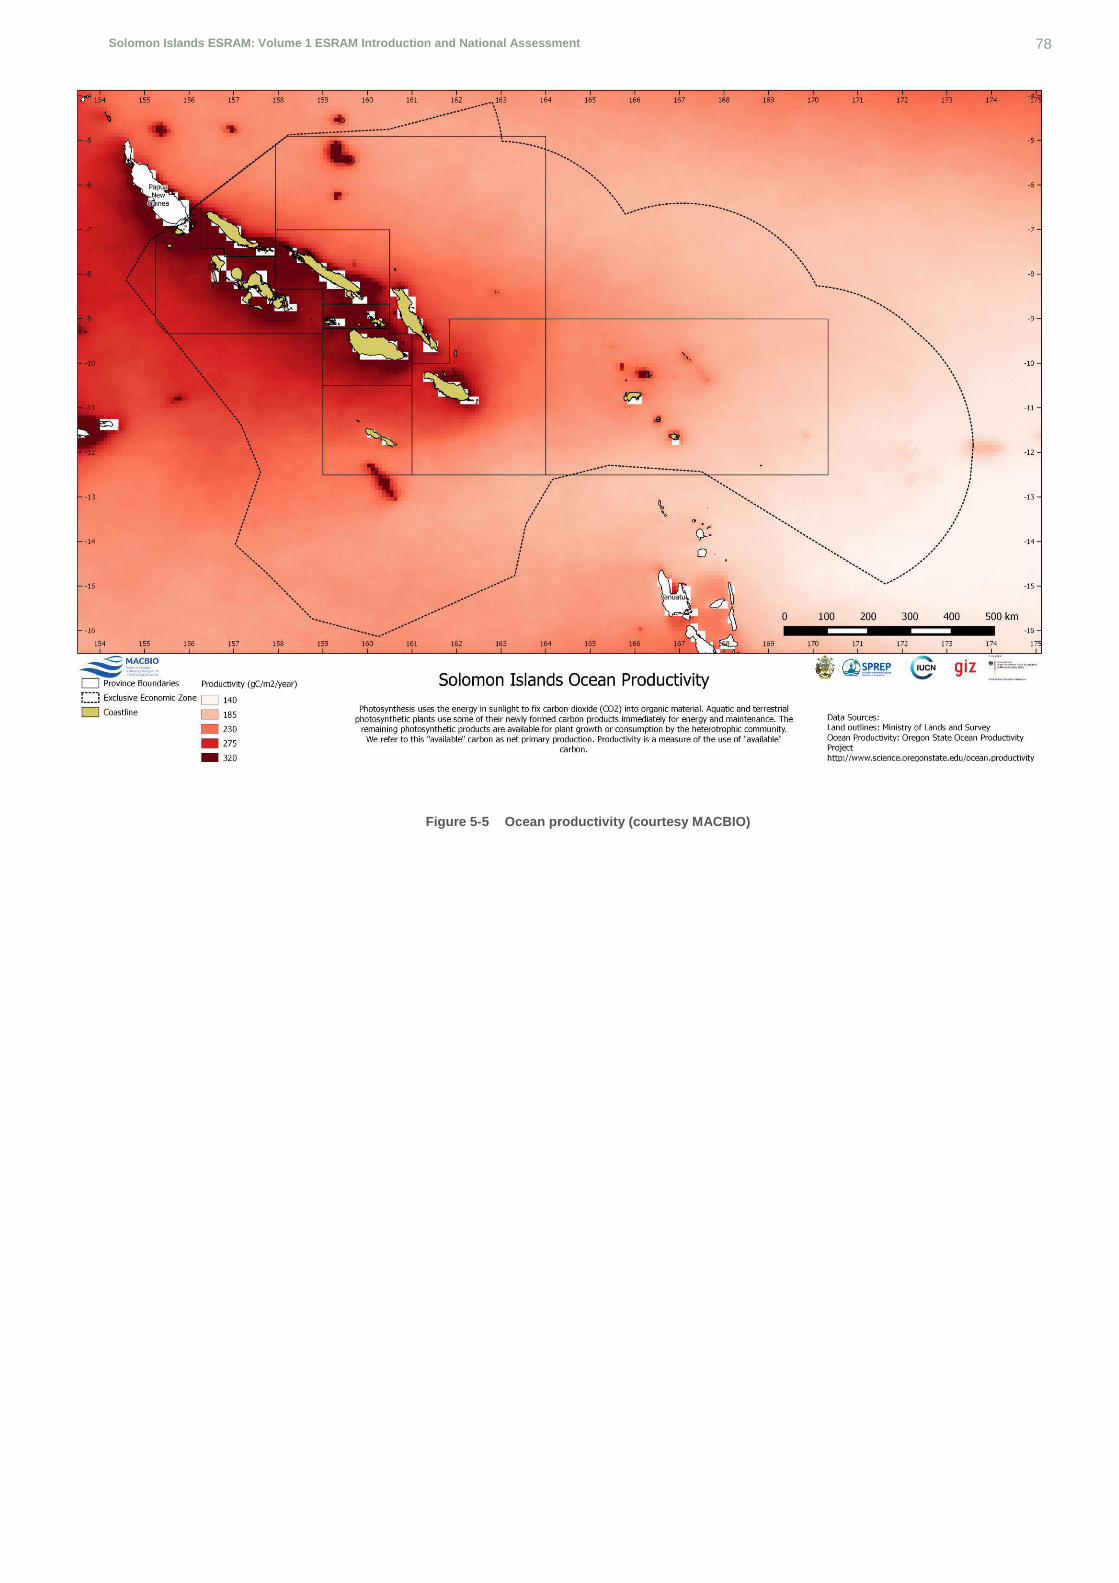
Solomon Islands ESRAM: Volume 1 ESRAM Introduction and National Assessment 78
Figure 5-5 Ocean productivity (courtesy MACBIO)
78
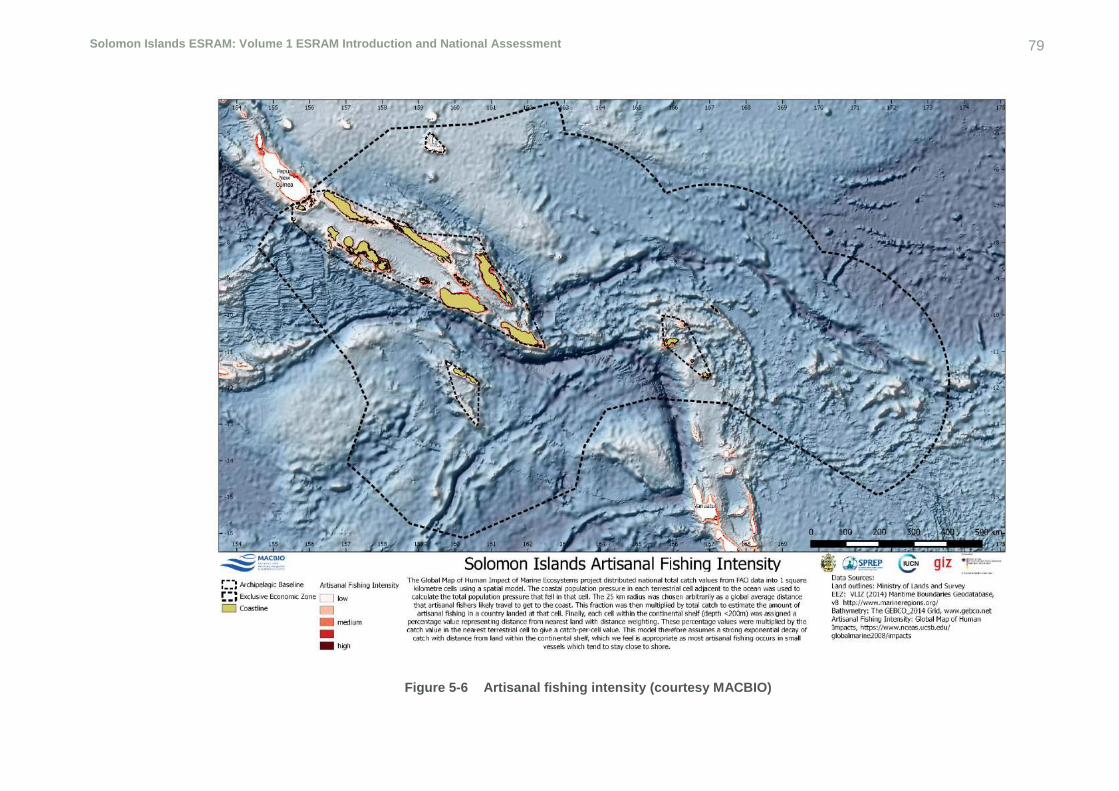
Solomon Islands ESRAM: Volume 1 ESRAM Introduction and National Assessment 79
Figure 5-6 Artisanal fishing intensity (courtesy MACBIO)
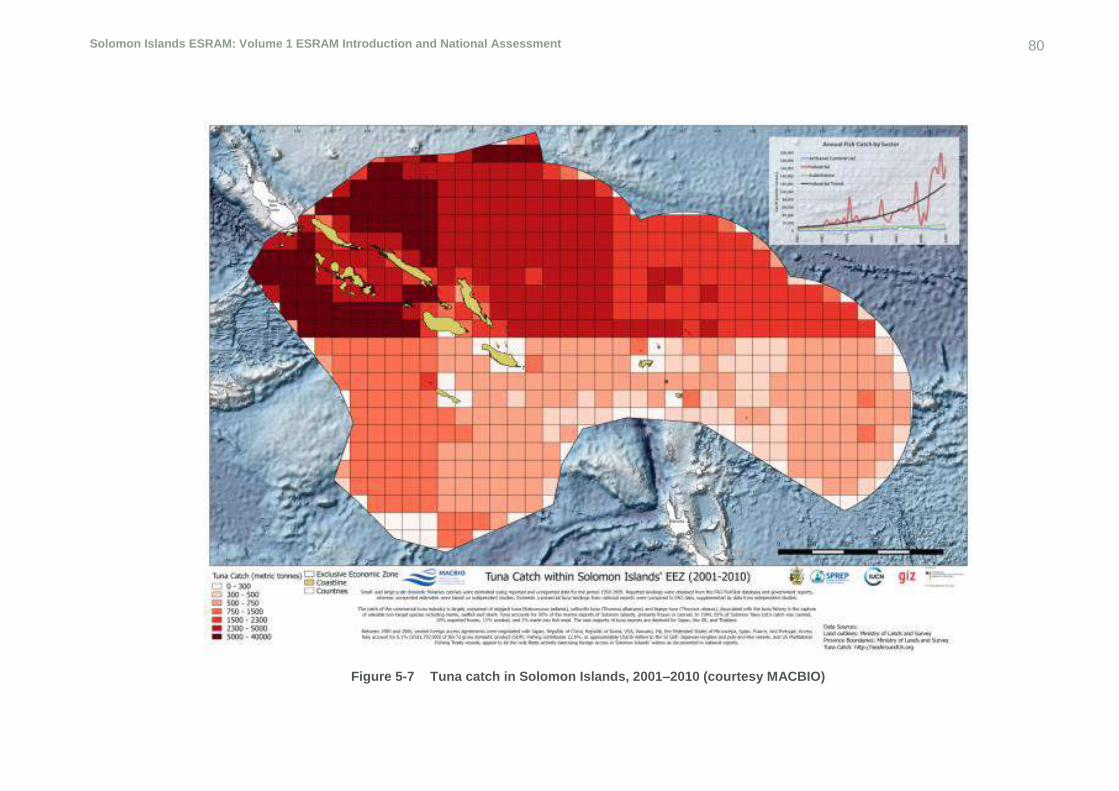
Solomon Islands ESRAM: Volume 1 ESRAM Introduction and National Assessment 80
Figure 5-7 Tuna catch in Solomon Islands, 2001–2010 (courtesy MACBIO)

Solomon Islands ESRAM: Volume 1 ESRAM Introduction and National Assessment 81
5.13 Groundwater
Fresh to brackish ground water is thought to occur throughout most of the Solomon Islands. At a
national scale, ground water is an essential ecosystem providing a water source for communities,
including water for drinking and/or domestic uses. This is particularly important for communities on
smaller islands, atolls and cays with little in the way of alternative freshwater sources. In such cases,
groundwater is a critical survival resource for communities. These locations include, for example,
many communities in Rennell and Bellona, and Temote Provinces, as well as Ontong Java atoll.
Groundwater is also used as a commercial resource for income generation through the bottled water
industry.
Given the primary ecosystem service to communities is the provision of water for human consumption
and domestic uses, the main threat of concern in this respect is contamination and declining water
quality. This can occur as a result of natural disturbances (e.g. drought, tsunami or earthquakes
causing saltwater infiltration) or human-derived pollution sources such as sewage, domestic wastes
(e.g. grey water, domestic animals such as keeping pig pens near wells), and industrial discharges
(e.g. mining). Growing human populations also increase the reliance on (and/or extraction of)
groundwater.
5.14 Cultivated land (gardens and plantations)
Land is cultivated throughout Solomon Islands, primarily as a means of subsistence, but also
commercially for income-generation through both the local and export markets. Land may be
cultivated in the form of community gardens or larger plantations. Communities rely heavily on root
crops as staples for subsistence (e.g. cassava, sweet potato, taro, yam). Other important cultivated
crops and food sources include banana, pineapple, breadfruit, papaya, tobacco, sago, coconuts, oil
palm, pumpkin, watermelon, sugar cane, fruit trees (e.g. Burckella spp., Malay apple), Tahitian
chestnut, canarium almond, turmeric, and areca nut (Feinburg 2010).
In addition to food and income, commercial use of cultivated land provides wealth, employment and
livelihoods. Coconuts, palm oil and, to a lesser extent, sweet potato, yams and taro have the highest
production value. For example, coconuts had an estimated production value of approximately
25,000,000 in 2009 (Table 5-5). Coconuts, oil palm and cocoa were the crops with the greatest
export value.

Solomon Islands ESRAM: Volume 1 ESRAM Introduction and National Assessment 82
Table 5-5 Production value of key crops, 2009 (adapted from Rodil and Mias-Crea 2014)
Crop Banana Cassava
Cocoa Coconut
Oil Palm
Rice Sweet Potato
Taro Yam
Production (tons)
330 2,500 4,259 276,000 39,000 2,800 86,000 44,000 32,000
Production value (million)
3.3 25.0 11.8 0.6 8.6 4.5 6.5
Quantity exported (tons)
3,575 21,352 19,745
Export value (million)
5.6 6.5 14.0
Key existing threats to the ongoing functioning and value of cultivated land for food and income
production include:
invasive species, pests and diseases affecting crops;
reduced soil fertility and land productivity from factors such as over farming and monoculture
cropping;
accumulation and/or inappropriate use of chemicals (i.e. pesticides, fertilisers);
climatic effects and natural hazards, especially drought and extremely hot days, as well as
physical damage from cyclone and storm events; and
competing land uses and indirect impacts from other industries (e.g. logging, mining, industrial
activities).
5.15 Summary of human induced threats to ecosystem services
Table 5-6 provides a summary of the key threats to ecosystems at the national scale. The concept
of social-ecological resilience recognises the interdependence between people and nature and is
clearly reflected by the ecosystem services identified above, on which Solomon Island communities
and economies rely heavily for their livelihoods and well-being.
Despite the critical contribution ecosystem services provide to the human resilience, the ecosystems
of Solomon Islands are subject to significant anthropogenic threats such as land-use change, habitat
loss and pollution through logging, urbanisation, expansion of agricultural land, infrastructure
development, mining, overfishing and exploitation. Furthermore, these threats are exacerbated by
the nation’s rapid rate of population growth and the current and future effects of climate change (to
be explored further in Section 7).

Solomon Islands ESRAM: Volume 1 ESRAM Introduction and National Assessment 83
By identifying key ecosystem services that are under threat by these pressures, targeted
management options can be designed to build and strengthen the resilience of ecosystems services
and, in turn, the resilience of Solomon Islands to future climate change effects.

Solomon Islands ESRAM: Volume 1 ESRAM Introduction and National Assessment 84
Table 5-6 Summary of key threats to each ecosystem service
Key Ecosystems
Key Ecosystem Services identified by community
Climate Related Threats Non-Climate Related Threats
Tid
es, sto
rm s
urg
e,
salin
e
intr
usio
n
Dro
ug
ht
/ d
ecre
ased
rain
fall
Flo
od
ing
/ in
cre
ased
rain
fall
Co
asta
l ero
sio
n / c
urr
en
t
ch
an
ges
Riv
er,
gu
lly, str
eam
ba
nk
ero
sio
n
Ho
t d
ays
La
nd
slid
e
Ocean
acid
ific
ati
on
Cyclo
ne
s (
inte
ns
. fr
eq
.)
Inv
asiv
es
Dis
ease
Ch
an
gin
g s
pe
cie
s
dis
trib
uti
on
Po
llu
tio
n (
wate
r-b
ased
)
So
lid
waste
Mn
gt.
Develo
pm
en
t (e
.g.
reso
urc
e
de
vel.
)
La
nd
cle
ari
ng
/ h
ab
itat
los
s
and m
od
ific
ati
on
Po
p. In
cre
ase, lo
ss o
f
kn
ow
led
ge
tra
ns
fer
Ch
an
ge in
lan
d u
se /
urb
an
isati
on
Ina
deq
ua
te r
eso
urc
e
man
ag
em
en
t
Eco
no
mic
pre
ssu
res
Po
licy c
ha
ng
es
Neg
ati
ve h
um
an
be
havio
ur/
att
itu
de
Rivers, streams
Food provision
Water supply (drinking and domestic)
Water supply (irrigation)
Recreation
Transportation, anchorage
Raw materials provision
Energy generation (hydropower)
Cultural values
Waste disposal and dispersal
Support fisheries
Habitat provision, biodiversity
Terrestrial Forests, Vegetation
Raw materials and fuel provision
Fauna habitat
Kastom medicine provision
Source of income/revenue
Carbon sequestration
Nutrient cycling and primary productivity
Soil retention and fertility
Air regulation and shade provision
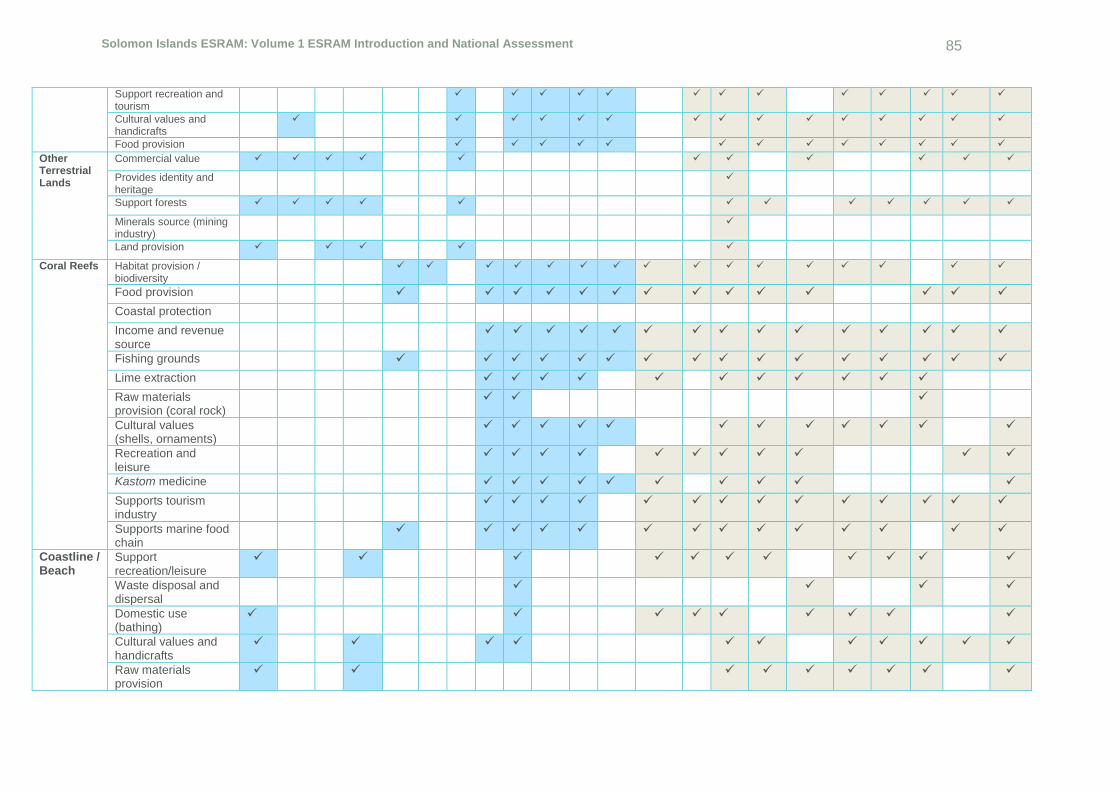
Solomon Islands ESRAM: Volume 1 ESRAM Introduction and National Assessment 85
Support recreation and tourism
Cultural values and handicrafts
Food provision
Other Terrestrial Lands
Commercial value
Provides identity and heritage
Support forests
Minerals source (mining industry)
Land provision
Coral Reefs Habitat provision / biodiversity
Food provision
Coastal protection
Income and revenue source
Fishing grounds
Lime extraction
Raw materials provision (coral rock)
Cultural values (shells, ornaments)
Recreation and leisure
Kastom medicine
Supports tourism industry
Supports marine food chain
Coastline / Beach
Support recreation/leisure
Waste disposal and dispersal
Domestic use (bathing)
Cultural values and handicrafts
Raw materials provision

Solomon Islands ESRAM: Volume 1 ESRAM Introduction and National Assessment 86
Supports transport (boat landing)
Fauna habitat (e.g. turtle nesting)
Coastal protection
Mangroves
Food provision
Raw materials and fuel provision
Fauna habitat
Coastal protection, shoreline stabilisation
Kastom medicine
Recreation Waste disposal and dispersal
Cultural values (crafts, dye)
Carbon sequestration
Sea / Ocean
Support transport
Habitat provision
Food provision
Climate and atmospheric regulation
Income and revenue generation
Mountains, Highlands
Raw materials provision
Habitat provision and biodiversity
Water source
Climatic regulation
Provide protection from disasters
Support navigation
Wetlands / Lakes / Swamps
Food provision
Water provision (drinking, domestic)
Habitat provision
Support aquaculture
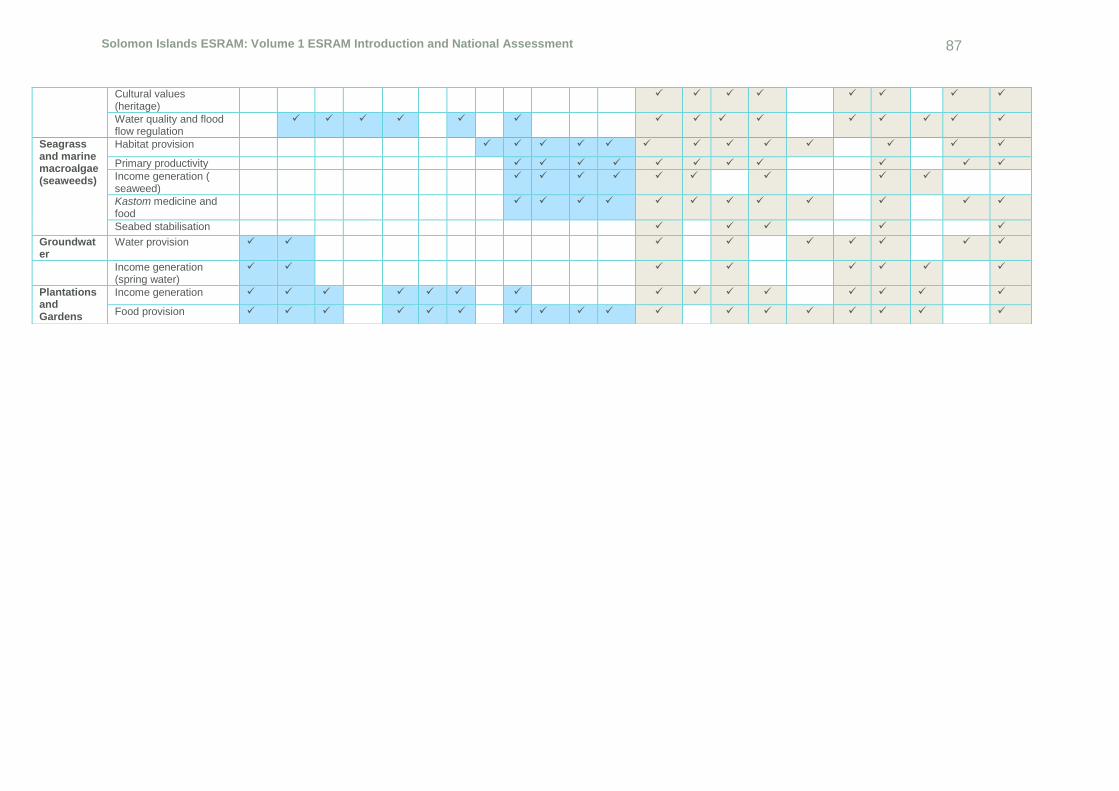
Solomon Islands ESRAM: Volume 1 ESRAM Introduction and National Assessment 87
Cultural values (heritage)
Water quality and flood flow regulation
Seagrass and marine macroalgae (seaweeds)
Habitat provision
Primary productivity
Income generation ( seaweed)
Kastom medicine and food
Seabed stabilisation
Groundwater
Water provision
Income generation (spring water)
Plantations and Gardens
Income generation
Food provision

Solomon Islands ESRAM: Volume 1 ESRAM Introduction and National Assessment 88
6 National ecosystem valuations
6.1 Economic values for ecosystem services
The values used for national scale ecosystem services have been adapted from MACBIO (2015)
and de Groot et al (2012). The values from MACBIO (2015) are based on local analysis and were
used in the first instance, while the values from de Groot et al. 2015 were used where MACBIO
values are not applicable.
MACBIO (2015) values are shown in Table 6-1. It should be noted that these values are shown as
national totals, and while they provide insights into the total value of services they may be less
applicable in economic assessment. Additionally, some values may not completely capture benefits
or costs.
Table 6-1 Summary of national ecosystem service values (adapted from MACBIO 2015)
Ecosystem USD 2015, hectare/p.a. SBD 2015, hectare/p.a.
Subsistence fisheries 61,000,000 476,900,000
Inshore commercial 9,700,000 75,800,000
Beche-der-mer 500,000 3,600,000
Aquarium trade 200,000 1,300,000
Trochus 300,000 2,300,000
Offshore tuna 228,900,000 1,789,900,000
Deep sea minerals 100,000 1,100,000
Tourism 16,400,000 128,000,000
Coastal protection 5,000,000 39,400,000
Carbon sequestration 22,300,000 174,600,000
Research, education and management 1,300,000 9,900,000
The de Groot et al. (2012) values presented in Table 6-2 have been aggregated at the ecosystem
level. Disaggregated values for specific services within specific ecosystems can also be utilised for
the development of future adaptation options.
888

Solomon Islands ESRAM: Volume 1 ESRAM Introduction and National Assessment 89
Table 6-2 Summary of national ecosystem service values (adapted from de Groot et al. 2012)
Ecosystem USD 2015, hectare/p.a. SBD 2015, hectare/p.a.
Coral reefs 256,469 2,005,230
Coastal systems (estuaries, continental shelf area and seagrass)
29,670 231,975
Coastal wetlands (tidal marsh, mangroves and saltwater wetlands)
8,913 69,683
Fresh water lakes, rivers 7,071 55,289
Inland wetlands 8,441 65,993
Tropical forests 3,202 25,037
Grasslands 1,473 11,516
Solomon Islanders rely heavily on ecosystem services for their livelihood, income generation, health
and well-being. The economic value of these services is clearly substantial and likely to exceed
revenue generated from services involved in extractive industries (e.g. forest ecosystems).
Where data were available on ecosystem coverage at a national scale, the estimated overall annual
economic value is presented below.
Mangroves are reported to cover an estimated 65,000 ha in Solomon Islands (Sulu et al. 2012).
Utilising the per hectare estimate for coastal wetlands in Table 6-2, mangroves have an annual
economic value of USD 579,345,000 (2015) or SBD 4,529,395,000 (2015).
Seagrass is estimated to cover an area of 10,000 ha (ibid) and represents an economic value of
USD 296,700,000 (2015) and SBD 2,319,750,000 (2015) based on the annual ecosystem value
for coastal systems.
Based on the trend of forest clearing presented in Section 5, Figure 4-2, forests were estimated
to cover an area of 2,150,000 ha in 2015. Utilising the economic value presented in Table 6-2 for
tropical forest, Solomon Island forests represent an annual economic value of approximately USD
6,884,300,000 (2015) and SBD 53,829,550,000 (2015).
Ecosystem valuations provide the support and justification for public policies to protect ecosystems
and prioritise the allocation of programme spending to maximise the environmental benefits per dollar
spent (King and Mazzotta 2000). There is a strong economic case for investing in ecosystem
services, as many studies find that the costs of ecosystem restoration and protection are far
outweighed by the benefits (Carabine 2015). Additionally, if land and resource owners had an
increased understanding of the value of ecosystems and the ecosystem services they provide, more
informed decisions could be made for the long term.
89

Solomon Islands ESRAM: Volume 1 ESRAM Introduction and National Assessment 90
7 Climate change vulnerability assessment
As discussed in Section 2.4, the vulnerability of an ecosystem to climate change is the degree to
which a system is susceptible to the adverse effects of climate change. This is a function of its
exposure to climatic variations, its sensitivity to climate variation, and its adaptive capacity, or ability
to adjust or cope, with climate change.
The following section presents a snapshot of Solomon Islands’ current climate, climate projections
for 2030 and 2090, the potential effects of climate change threats on the broad marine, aquatic and
terrestrial ecosystems, and, lastly, it identifies the ecosystem services that are predicted to have high
or very high vulnerability to various climate change variables for 2030 and 2090.
7.1 Current climate
Climate is usually defined as the average weather over 30 years or more. Climate change refers to
a change in the state of the climate that can be identified by changes in the mean and/or the variability
of its properties and that persists for an extended period, typically decades or longer (IPCC 2007).
The climate of Solomon Islands varies considerably from year to year due to the El Niño-Southern
Oscillation (ENSO). ENSO includes two extreme phases and a neutral phase. The El Niño phase
brings warmer, drier wet season conditions and La Niña brings cooler, wetter, wet seasons. The
ENSO effect is stronger in Santa Cruz than in Honiara.
The following section presents a snapshot of the current climate for Solomon Islands based on the
assessments by PACCSAP (CSIRO 2011; 2014).
7.1.1.1 Air temperature
Temperatures in Solomon Islands are relatively constant throughout the year with only very small
changes from season to season and are strongly tied to changes in ocean temperature. Annual
maximum and minimum temperatures have increased in Honiara since 1951, with maximum
temperatures increasing at a rate of 0.15°C per decade. Consistent with global warming, there have
been significant increases in warm nights and decreases in cool nights for both Honiara and Munda.
Cool days have also decreased at Munda.
7.1.1.2 Rainfall
Rainfall in Solomon Islands is affected by the South Pacific Convergence Zone and the Intertropical
Convergence Zone, which bring bands of heavy rainfall and thunderstorm activity. The West Pacific
Monsoon also influences rainfall in Solomon Islands. It is driven by large differences in temperature
between the land and the ocean.
Solomon Islands has two distinct seasons, with a wet season from November to April and a dry
season from May to October. In the dry season at Honiara, on average about 100 mm of rain falls
per month compared to upwards of 300 mm in the wet season. Further east, Santa Cruz receives
more constant rainfall during the year, averaging between 280 mm and 420 mm per month.
There is notable interannual variability in rainfall associated with ENSO but there has been little
change in rainfall trends at Honiara since 1950 and at Munda since 1962. However, since 1955 there
90
Solomon Islands ESRAM: Volume 1 ESRAM Introduction and National Assessment 91
has been a decreasing trend in the number of rainy days at Honiara. Since 1962, there has been an
increasing trend in annual maximum one-day rainfall at Munda.
7.1.1.3 Wind-driven waves
The wind-wave climate for Solomon Islands shows strong interannual variability associated with
ENSO and there is strong spatial variation across the region. Small waves (mean height around 0.15
m) occur at Honiara, which is sheltered from easterly trade winds, and display strong seasonal
variability of direction characterised by trade winds, monsoons and cyclones. Larger waves occur on
the outlying easterly islands (e.g. to the north of Santa Cruz), and are characterised by variability of
the Southern Hemisphere trade winds and westerly monsoon winds. Waves larger than 2.5 m occur
mostly during December–March from the north-west through to north-east associated with tropical
cyclones and extra-tropical storms. The height of a 1-in-50 year wave event on the north coast of
Santa Cruz is 8.0 m.
7.1.1.4 Tropical cyclones
Based on the 1969 to 2011 seasons, tropical cyclones occur mainly between November and April
with an average of 29 cyclones per decade. Cyclones were most frequent in El Niño years (39
cyclones per decade) and least frequent in La Niña years and neutral years (21 cyclones per
decade). Twenty-seven per cent of the cyclones between 1981 and 2011 were severe events
(Category 3 or stronger) and most intense events occur during an El Niño.
7.1.1.5 Sea level
Sea level has risen near Solomon Islands by about 8 mm per year since 1993, which is more than
the global average of 2.8–3.6 mm per year. The higher rate of rise may be related to natural
fluctuations caused by ENSO.
7.1.1.6 Ocean acidification
Aragonite, a metastable form of calcium carbonate, is used by hard reef-building corals to build
skeletons. As the oceans acidify in response to increasing carbon uptake, the carbonate ion
concentration of seawater decreases, making it harder for corals to grow. For coral growth, saturation
states above 4 are optimal, Between 3.5 and 4 are adequate, and between 3 and 3.5, marginal, with
no corals historically found below 3 (Guinotte et al. 2003). Aragonite saturation state has declined
In Solomon Islands from about 4.5 in the late 18th century to an observed value of about 3.9 ± 0.1
by 2000.
7.2 Future climate projections
The following section summarises the climate projections for Solomon Islands (Australian Bureau of
Meteorology and CSIRO [2014]) based on the very high IPCC emissions scenario Representative
Concentration Pathways (RCP) 8.5, the highest scenario of the 5th Assessment Report, for the short
term (2030) and longer term (2090). All projected changes represent the overall change relative to
1995 levels of each climate variable.
91
Solomon Islands ESRAM: Volume 1 ESRAM Introduction and National Assessment 92
7.2.1.1 Average temperature
There is very high confidence there will be further warming over Solomon Islands. Relative to 1995,
warming increases up to 1.0°C by 2030 and up to 2.0–4.0°C by 2090 are projected for RCP 8.5.
Temperature rises may be 0.2°C greater over land than over the ocean. While relatively warm and
cool years and decades will still occur due to natural variability, there is projected to be more warm
years and decades on average in a warmer climate.
7.2.1.2 Extreme temperature
There is very high confidence that the temperature of extremely hot days and extremely cool days
will increase, but there is low confidence in the magnitude of projected change. The temperature on
extremely hot days is projected to increase by about the same amount as the average temperature,
and the frequency of extremely hot days is expected to increase. The temperature of the 1-in-20-
year hot day is projected to increase by approximately 0.6°C to 0.8°C by 2030 and 0.8°C to 2.9°C by
2090.
7.2.1.3 Average rainfall
The effect of climate change on average rainfall may not be obvious in the short or medium term due
to natural variability, and there is low confidence that annual rainfall will increase slightly. The CMIP5
model average is for a slight increase in projected annual rainfall change, with the range greater in
the highest emissions scenarios. Dynamical downscaling suggests that there may be some
difference in the rainfall change over land compared to over the ocean, and on the western side of
islands compared to the east.
7.2.1.4 Extreme rainfall
There is high confidence that the frequency and intensity of extreme rainfall events will increase but
there is there is low confidence in the magnitude of projected change. The current 1-in-20-year daily
rainfall amount is projected to increase by approximately 9 mm by 2030. By 2090, it is projected to
increase by 43 mm under RCP 8.5. The current 1-in-20-year daily rainfall event may become, on
average, a 1-in-4-year event for RCP 8.5 by 2090.
7.2.1.5 Drought
There is low confidence in the projections of drought duration and frequency because of the low
confidence in the magnitude of rainfall projections and uncertainty around projected changes in
ENSO. However, the overall proportion of time spent in drought is expected to decrease under all
scenarios. Under RCP 8.5 the frequency of mild, moderate and severe drought events is expected
to decrease, while the frequency of extreme drought events is expected to remain stable.
7.2.1.6 Cyclones
There is a medium level of confidence that globally, the frequency of tropical cyclones is likely to
decrease by the end of the 21st century. However, there is likely to be an increase in the mean
maximum wind speed between 2% and 11% and an increase in rainfall intensity of about 20% within
100 km of the cyclone centre. For Solomon Islands, there is a medium level of confidence that there
will be a decrease in cyclone genesis frequency for the south-west basin in the order of 5 to 30%.
92

Solomon Islands ESRAM: Volume 1 ESRAM Introduction and National Assessment 93
However, by the late 21st century there is an expected increase in the proportion of more intense
storms.
7.2.1.7 Wind-driven waves
Overall, there is low confidence in projected changes in Solomon Islands’ windwave climate. There
is low confidence that during December–March, projected changes will include a significant decrease
in mean wave height, accompanied by a decrease in wave period, with no significant change in
direction (which is variable in the wet season). There is also low confidence there will be a decrease
in the strength of prevailing winds, with no change in the height of larger storm waves predicted. In
June–September, there are no statistically significant projected changes in wave properties. Possible
changes may include an increase in wave height and a decrease in period.
7.2.1.8 Sea level
There is very high confidence that mean sea level in Solomon Islands will continue to rise over the
21st century. There is moderate confidence that there will be a rise of between approximately 5–15
cm by 2030, with increases of 20–60 cm indicated by 2090 under the higher emissions scenarios. A
rise larger than that projected cannot be excluded and, since the early 1990s, sea level has been
rising globally near the upper end of the projections. Similar levels of interannual variability of sea
level, leading to periods of lower and higher regional sea levels, will occur in the order of 31 cm.
Winds and waves associated with weather phenomena will continue to lead to extreme sea-level
events.
7.2.1.9 Ocean acidification
The aragonite saturation state in Solomon Islands has declined from about 4.5 in the late 18th century
to about 3.9 by 2000. There is very high confidence that levels will continue to decrease with
increases in atmospheric CO2. Under RCP 8.5, the median aragonite will transition to marginal
conditions (3.5) around 2030. There is moderate confidence that the annual maximum aragonite
saturation state will reach values below 3.5 by about 2045 and continue to decline thereafter. Under
RCP 8.5 the aragonite saturation state continues to strongly decline thereafter to values where coral
reefs have not historically been found (<3.0).
7.2.1.10 Coral bleaching risk
The risk of coral bleaching increases with elevated water temperatures and depends on the duration
and magnitude of the temperature rise. There is very high confidence that, as the ocean warms, the
risk of coral bleaching increases. However, there is medium confidence in the projected rate of
change for Solomon Islands based on the medium confidence in the rate of change of sea-surface
temperature, and the complexity of changes at the reef-scale, including other potential stressors.
Based on current projections for sea-surface temperature, there is an overall decrease in the time
between two periods of elevated risk for bleaching and an increase in the duration of the elevated
risk. Under a long-term mean increase of 1°C, the average period of severe bleaching risk will last
8.2 weeks (with a minimum of 1.8 weeks and maximum of 4.5 months), and the average time
between risk events will be 2.6 years (minimum recurrence of 4.3 months and maximum recurrence
93

Solomon Islands ESRAM: Volume 1 ESRAM Introduction and National Assessment 94
of 7.4 years). If severe bleaching events occur more often than once every five years, the long-term
viability of coral reef ecosystems becomes threatened.
7.3 Climate change threats
The following section discusses the potential effects of these climate change threats on the broad
marine, aquatic and terrestrial ecosystems of Solomon Islands and their ecosystem services.
Climate change threats have focused on the use of projections that have high to very high confidence
of occurring and represent the highest risks to Solomon Islands. Whilst drought may be an issue,
there is limited capacity to predict future scenarios for Solomon Islands based on current projections
and it has not been considered further. In addition, future scenarios for more intense cyclones and
altered wave patterns are not well established.
7.3.1 Temperature increase
Temperature is important in regulating chemical and physiological processes in terrestrial, aquatic,
estuarine and marine communities. However, predicting ecosystem responses to increasing
temperatures is complicated by the feedback and interactions among temperature change and the
interactions of other climate change stressors, such as rainfall and ocean acidification.
Increases in temperature could result in some changes to the composition and structure of terrestrial
vegetation communities of Solomon Islands, which may include the spread of insects, pathogens,
herbivores and pests. These ecological changes could affect native vegetation and community
responses to stressors such as fire, drought, storms and erosion, and also affect fauna habitat
values, including aquatic receiving environments. The potential increase in pests and disease could
affect agricultural lands, potentially resulting in reduced crop yields, and an increase in the number
of hot days will potentially have negative effects on human health.
Water temperature regulates oxygen, pH, conductivity, photosynthesis and respiration rates.
Increases in temperatures could directly alter aquatic ecological processes, affect the distribution of
aquatic species and could also affect the quality of water resources for human and agricultural use.
Increased water temperature could affect algal production and the availability of light, oxygen and
carbon for estuarine species. It could also affect important microbial processes such as nitrogen
fixation and denitrification in estuaries (Short and Neckles 1999; Lomas et al. 2002).
It is well established that the risk of coral bleaching increases with elevated sea temperatures. When
ocean temperatures exceed summertime maximums by 1.0–2.0°C for a prolonged period (1–3
weeks), corals become stressed, increasing the risk of coral bleaching (Berkelmans et al. 2004;
Hoegh-Guldberg 1999). The longer the temperature is elevated above this limit, the greater the coral
bleaching risk. Long-term ocean warming will reduce the time between risk events and if these occur
more often than once every five years, the long-term viability of coral reef ecosystems becomes
threatened (Donner 2009).
Sea and air temperatures will continue to rise, with projections of up to 1.0°C by 2030 and
up to 2.0–4.0°C by 2090
94
Solomon Islands ESRAM: Volume 1 ESRAM Introduction and National Assessment 95
7.3.2 Sea-level rise
The sea level will continue to rise, with projected increases of 5–15 cm by 2030 and 20–60
cm by 2090.
Ongoing sea-level rise may exacerbate shoreline erosion, inundate low-lying coastal habitats and
infrastructure, cause saline intrusion of surface waters and coastal aquifers, lead to higher levels of
sea flooding and increase the landward reach of sea waves and storm surges. Provided coastal
ecosystems can accrete vertically and maintain their elevation relative to sea level, they may be able
to adapt and migrate with sea level rise. However, local ecosystem responses to sea-level rise will
depend on coastal dynamic processes, including the total sediment budget, and the effect of
saltwater intrusion will depend on local conditions, such as aquifer dimensions, geology, groundwater
and surface water factors, run-off and rainfall patterns.
The combined effects of beach erosion from sea-level rise and an increase in cyclone intensity as a
result of climate change may exacerbate erosion, sedimentation or saline inundation of coastal
ecosystems, and may alter coastal hydrological regimes. Other variables, such as altered
biogeochemistry, altered amounts and patterns of suspended sediments loading, oxidation of organic
sediments, and the physical effects of wave energy, may all play important roles in determining
regional and local effects of-sea level rise and more intense storms (IPCC 2007).
When not subjected to environmental or anthropogenic stresses, coral reefs have been shown to
keep pace with rapid postglacial sea-level rise, suggesting sea-level rise may be unlikely to threaten
reefs in the next few decades (Hallock 2005). However, degradation of reefs following bleaching or
from ocean acidification may result in increased wave energy across reef flats, with the potential for
exacerbating shoreline erosion with sea-level rise (Sheppard et al. 2005).
Erosion of sandy barrier islands as a result of increased sea level could also alter local wave
conditions, which may enhance erosion rates of the shoreline, tidal creeks and adjacent wetlands.
Whilst the effects of accelerated sea-level rise on rocky shores is poorly understood, their persistence
will be influenced by storms and other coastal processes.
7.3.3 Ocean acidification
Ocean acidification is projected to increase with an associated decline in aragonite
concentrations, potentially to 3.5 around 2030, below 3.5 by 2045, and could potentially
continue to decline to 2090, and after, to < 3.0.
Decreased sea-water pH and carbonate saturation has the potential for reducing the ability of
carbonate flora and fauna to calcify, and could potentially increase dissolution of nutrients and
carbonate minerals in sediments (IPCC 2007).
Increases in the amount of dissolved CO2 in ocean ecosystems may lead to higher rates of
photosynthesis in submerged aquatic vegetation, such as seagrass and seaweed. However, algae
growth in lagoons and estuaries may also respond positively to elevated dissolved inorganic nutrients
95

Solomon Islands ESRAM: Volume 1 ESRAM Introduction and National Assessment 96
and an increase in epiphytic or suspended algae may decrease light availability to submerged
aquatic vegetation.
As the oceans acidify in response to increasing carbon uptake, the aragonite concentration of
seawater decreases. Guinotte et al. (2003) suggest that seawater aragonite saturation states above
4 are optimal for coral growth and for the development of healthy reef ecosystems, with values from
3.5 to 4 adequate for coral growth, and values between 3 and 3.5, marginal. Coral reef ecosystems
have not been recorded at aragonite saturation states below 3, and these conditions have been
classified as extremely marginal for supporting coral growth (Guinotte et al. 2003). Ocean
acidification may also affect the growth of crustaceans and molluscs, and fisheries production. The
effect of acidification on the health of reef and marine ecosystems is likely to be compounded by
other stressors, including coral bleaching, storm damage, water quality and fishing pressure, and will
be an important adaptive challenge.
7.3.4 More extreme rain events
More extreme rain events are projected to occur with the current 1-in-20-year daily rainfall
amount, increasing by 9 mm by 2030 and 43 mm by 2090, and becoming a 1-in-4-year
event by 2090.
More extreme rain events could lead to more frequent episodes of soil saturation, increased soil
instability and soil erosion, and landslide frequency. Receiving aquatic ecosystems are sensitive to
changes in the frequency, duration and timing of extreme rainfall events and long-term changes in
run-off may alter hydrologic characteristics of aquatic ecosystems and affect species’ composition
and productivity.
Extreme rainfall events also determine the patterns and quality of freshwater flow to coastal and
estuarine habitats. Run-off into estuaries influences water residence time, nutrient delivery, vertical
stratification and salinity. Altering these properties can have significant effects on phytoplankton
populations and increase the risk of eutrophication. Changes in freshwater flow and timing can also
affect migration and spawning of many estuarine and marine fishery species. Rainfall patterns and
sea-level rise, in combination with human land use, will be important determinants of water quality in
coastal and marine ecosystems of Solomon Islands.
7.3.5 Summary of climate change threats
Figure 2-3 provides a summary of the ecosystems and their services for Solomon Islands, a summary
of their critical biophysical, ecological and land management dependencies, and the major climate
change threats to these. The way these ecosystems and their services will respond to the effects of
climate change will depend on the extent of ecosystem degradation from other anthropogenic
pressures, the magnitude and frequency of climate change threats, and the adaptive capacity of the
services. The following section provides a vulnerability assessment to calculate exposure, sensitivity
and adaptive capacity of the key ecosystem services to the main climate changes identified for
Solomon Islands: temperature rise, sea-level rise, ocean acidification and more extreme rain events.
96

Solomon Islands ESRAM: Volume 1 ESRAM Introduction and National Assessment 97
7.4 Vulnerability of ecosystem services to climate change variables
Based on the critical climate variables or threats assessed for this project, by 2030 sea-level rise and
temperature increases, including extremes, could potentially affect a broad range of national
ecosystem services. Whilst sea-level rise will continue to affect coastal ecosystem services to 2090
and beyond, the projected magnitude of temperature increase may become the dominant climate
change threat to the broadest range of national ecosystem services (refer to Appendix C for the
output scores of the national scale vulnerability assessment). All projected changes presented in
each text box are changes relative to 1995 levels for each climate variable (e.g. for sea-level rise, an
increase of 13 cm to that of 1995 levels is projected).
7.4.1 Sea-level rise
By 2030, sea-level rise poses potential climate
change threats across a range of national
ecosystem services. A large proportion of national
ecosystem services identified during stakeholder
engagement are found to be potentially highly
vulnerable to sea-level rise, including income
generation and food provision, demonstrating the social attachment and reliance on coastal
ecosystems. At an overall ecosystem level, those potentially most vulnerable to 2030 and 2090 (and
beyond) sea-level rise are freshwater-dependent wetlands, lakes, swamps, and groundwater, which
have low adaptive capacity to saline intrusion. Beach-dependent species such as marine turtles (and
the services which rely on these) have a high vulnerability to sea-level rise, given their limitations to
adapt to other ecosystems (nesting is restricted to sand dunes). These projections are dependent on
the specific ecosystems’ adaptive capacity to retreat landward, and factors such as topography and
development boundaries.
As expected, 2090 sea level rise by 40 to 89 cm
will potentially affect a broader range of coastal
ecosystems and their services. Despite their
potentially high adaptability, mangroves and their
associated services, such as kastom medicine,
raw material and fuel, are expected to be more
vulnerable to 2090 sea levels, depending on mangrove location and their ability to migrate.
Ecosystem services associated with coastal rivers, streams and terrestrial forests, including food,
biodiversity, fisheries and water supply for both drinking and irrigation purposes, may also be
vulnerable, due to their low adaptive capacity to saline intrusion, but effects will depend on their
location and local hydrologic and geographic features.
2030 Sea-level Rise Projection Summary
Sea-level rise of between approx. 7–18 cm
Mean change: 13 cm
Confidence level is medium
2090 Sea-level Rise Projection Summary
Sea-level rise of between approx. 40–89 cm
Mean change: 63 cm
Confidence level is medium
97
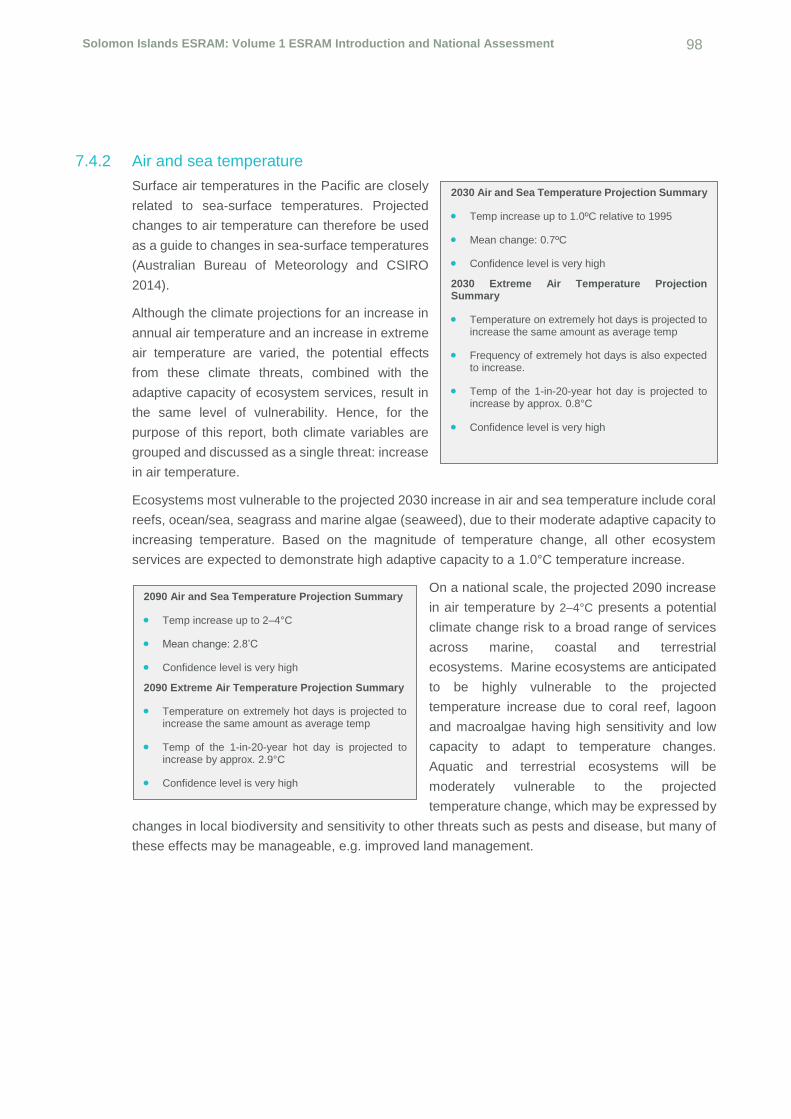
Solomon Islands ESRAM: Volume 1 ESRAM Introduction and National Assessment 98
7.4.2 Air and sea temperature
Surface air temperatures in the Pacific are closely
related to sea-surface temperatures. Projected
changes to air temperature can therefore be used
as a guide to changes in sea-surface temperatures
(Australian Bureau of Meteorology and CSIRO
2014).
Although the climate projections for an increase in
annual air temperature and an increase in extreme
air temperature are varied, the potential effects
from these climate threats, combined with the
adaptive capacity of ecosystem services, result in
the same level of vulnerability. Hence, for the
purpose of this report, both climate variables are
grouped and discussed as a single threat: increase
in air temperature.
Ecosystems most vulnerable to the projected 2030 increase in air and sea temperature include coral
reefs, ocean/sea, seagrass and marine algae (seaweed), due to their moderate adaptive capacity to
increasing temperature. Based on the magnitude of temperature change, all other ecosystem
services are expected to demonstrate high adaptive capacity to a 1.0°C temperature increase.
On a national scale, the projected 2090 increase
in air temperature by 2–4°C presents a potential
climate change risk to a broad range of services
across marine, coastal and terrestrial
ecosystems. Marine ecosystems are anticipated
to be highly vulnerable to the projected
temperature increase due to coral reef, lagoon
and macroalgae having high sensitivity and low
capacity to adapt to temperature changes.
Aquatic and terrestrial ecosystems will be
moderately vulnerable to the projected
temperature change, which may be expressed by
changes in local biodiversity and sensitivity to other threats such as pests and disease, but many of
these effects may be manageable, e.g. improved land management.
2030 Air and Sea Temperature Projection Summary
Temp increase up to 1.0ºC relative to 1995
Mean change: 0.7ºC
Confidence level is very high
2030 Extreme Air Temperature Projection Summary
Temperature on extremely hot days is projected to increase the same amount as average temp
Frequency of extremely hot days is also expected to increase.
Temp of the 1-in-20-year hot day is projected to increase by approx. 0.8°C
Confidence level is very high
2090 Air and Sea Temperature Projection Summary
Temp increase up to 2–4°C
Mean change: 2.8’C
Confidence level is very high
2090 Extreme Air Temperature Projection Summary
Temperature on extremely hot days is projected to increase the same amount as average temp
Temp of the 1-in-20-year hot day is projected to increase by approx. 2.9°C
Confidence level is very high
98
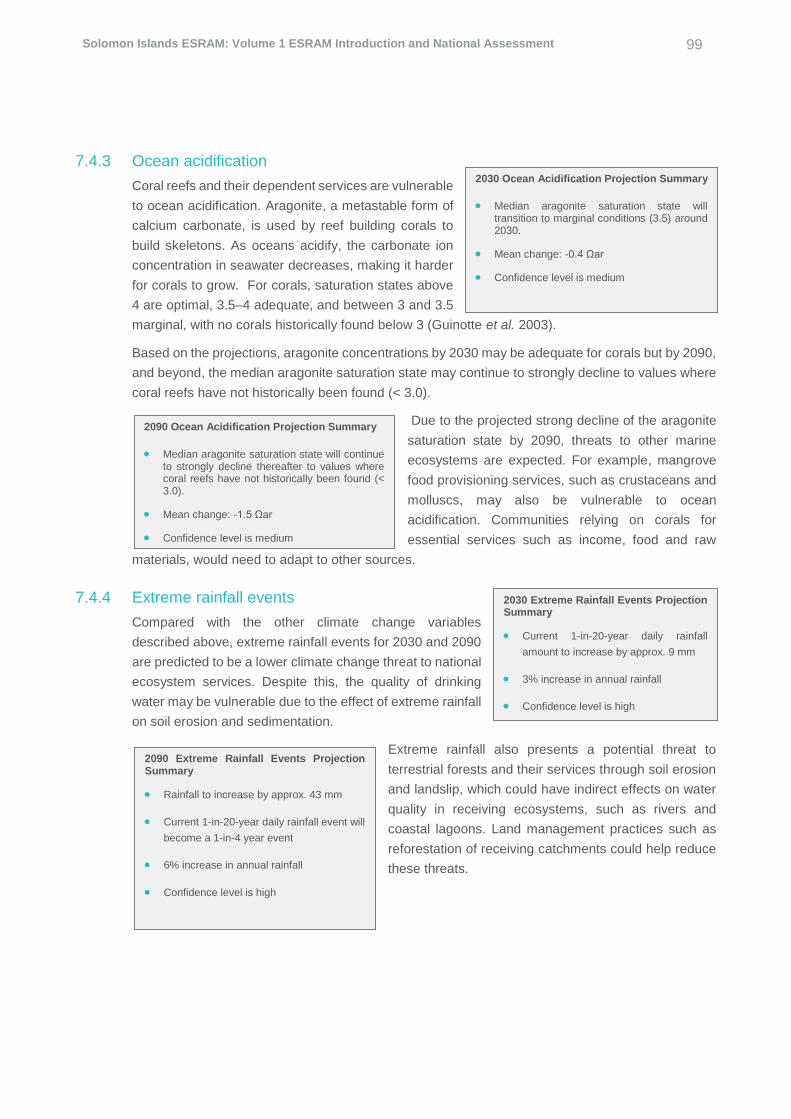
Solomon Islands ESRAM: Volume 1 ESRAM Introduction and National Assessment 99
7.4.3 Ocean acidification
Coral reefs and their dependent services are vulnerable
to ocean acidification. Aragonite, a metastable form of
calcium carbonate, is used by reef building corals to
build skeletons. As oceans acidify, the carbonate ion
concentration in seawater decreases, making it harder
for corals to grow. For corals, saturation states above
4 are optimal, 3.5–4 adequate, and between 3 and 3.5
marginal, with no corals historically found below 3 (Guinotte et al. 2003).
Based on the projections, aragonite concentrations by 2030 may be adequate for corals but by 2090,
and beyond, the median aragonite saturation state may continue to strongly decline to values where
coral reefs have not historically been found (< 3.0).
Due to the projected strong decline of the aragonite
saturation state by 2090, threats to other marine
ecosystems are expected. For example, mangrove
food provisioning services, such as crustaceans and
molluscs, may also be vulnerable to ocean
acidification. Communities relying on corals for
essential services such as income, food and raw
materials, would need to adapt to other sources.
7.4.4 Extreme rainfall events
Compared with the other climate change variables
described above, extreme rainfall events for 2030 and 2090
are predicted to be a lower climate change threat to national
ecosystem services. Despite this, the quality of drinking
water may be vulnerable due to the effect of extreme rainfall
on soil erosion and sedimentation.
Extreme rainfall also presents a potential threat to
terrestrial forests and their services through soil erosion
and landslip, which could have indirect effects on water
quality in receiving ecosystems, such as rivers and
coastal lagoons. Land management practices such as
reforestation of receiving catchments could help reduce
these threats.
2030 Ocean Acidification Projection Summary
Median aragonite saturation state will transition to marginal conditions (3.5) around 2030.
Mean change: -0.4 Ωar
Confidence level is medium
2090 Ocean Acidification Projection Summary
Median aragonite saturation state will continue to strongly decline thereafter to values where coral reefs have not historically been found (< 3.0).
Mean change: -1.5 Ωar
Confidence level is medium
2030 Extreme Rainfall Events Projection Summary
Current 1-in-20-year daily rainfall
amount to increase by approx. 9 mm
3% increase in annual rainfall
Confidence level is high
2090 Extreme Rainfall Events Projection Summary
Rainfall to increase by approx. 43 mm
Current 1-in-20-year daily rainfall event will
become a 1-in-4 year event
6% increase in annual rainfall
Confidence level is high
99
Solomon Islands ESRAM: Volume 1 ESRAM Introduction and National Assessment 100
7.4.5 Summary of ecosystem service vulnerability to climate change
Under future climate change scenarios, Solomon Islands is likely to face rising sea levels, increasing
air and sea temperatures and an increase in extreme rainfall events. It is anticipated that these
changes will put further stress on marine resources by increasing bleaching events and the death of
corals, molluscs and crustaceans from ocean acidification. Based on the vulnerability assessment to
climate threats, Table 7-1 summarises the national ecosystem services that are predicted to have
high (ticked) to very high (ticked and shaded) vulnerability to various climate change variables for
2030 and 2090.
The key findings from the results of this assessment are outlined below.
As climate change threats intensify over time, ecosystems may become more vulnerable, which
correlates to the increased number of climate variables listed for 2090 in Table 7-1.
The key climate change threat to national ecosystems and their services for 2030 is sea-level
rise. Many of the ecosystem services vulnerable to this threat are critical provisioning services
related to water supply (groundwater, lakes, rivers and streams) and food source (seaweed,
aquaculture)
By 2090, a high proportion of national ecosystem services could be highly vulnerable to sea-level
rise, increased temperatures and ocean acidification.
A 2-4°C temperature increase by 2090 is a potential threat to a broad range of national services
across marine, coastal and terrestrial ecosystems, where:
○ marine ecosystems are anticipated to be vulnerable to the projected temperature increase due
to coral reef, lagoon and macroalgae having high sensitivity and low capacity to adapt to
temperature changes. Local communities that rely upon these ecosystems for essential
services (such as food, income and raw materials) are likely to be required to adapt to
alternative ecosystems for these provisional services; and
○ aquatic and terrestrial ecosystems will be moderately vulnerable to the projected temperature
change, which may be expressed by changes in local biodiversity and sensitivity to other
threats such as pest and disease. Adaptive land management practices may address these
threats,
Based on current projections, coral reefs and their services will be particularly vulnerable to 2090
ocean acidification levels, where aragonite concentrations may decline to values where coral
reefs have not historically been found. Intertidal ecosystems providing food, such as crustaceans
and molluscs, may also be vulnerable. Local communities that rely on these ecosystems for
essential services (such as food, income and raw materials) will be required to adapt to alternative
ecosystems for provisional services by 2090.
The effects of extreme rainfall events by 2090 may affect soil stability and the water quality of
receiving environments. Improving land management practices and reforestation within
catchments may help reduce these threats.
100
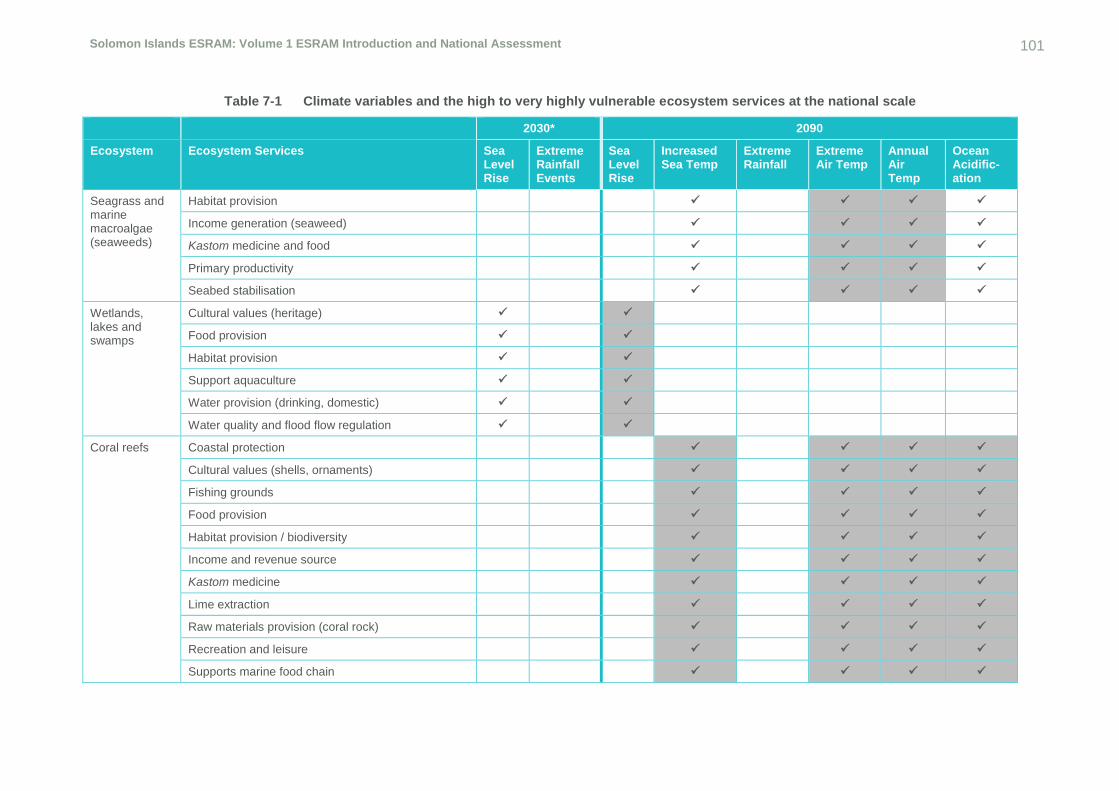
Solomon Islands ESRAM: Volume 1 ESRAM Introduction and National Assessment 101
Table 7-1 Climate variables and the high to very highly vulnerable ecosystem services at the national scale
2030* 2090
Ecosystem Ecosystem Services Sea Level Rise
Extreme Rainfall Events
Sea Level Rise
Increased Sea Temp
Extreme Rainfall
Extreme Air Temp
Annual Air Temp
Ocean Acidific-ation
Seagrass and marine macroalgae (seaweeds)
Habitat provision
Income generation (seaweed)
Kastom medicine and food
Primary productivity
Seabed stabilisation
Wetlands, lakes and swamps
Cultural values (heritage)
Food provision
Habitat provision
Support aquaculture
Water provision (drinking, domestic)
Water quality and flood flow regulation
Coral reefs Coastal protection
Cultural values (shells, ornaments)
Fishing grounds
Food provision
Habitat provision / biodiversity
Income and revenue source
Kastom medicine
Lime extraction
Raw materials provision (coral rock)
Recreation and leisure
Supports marine food chain
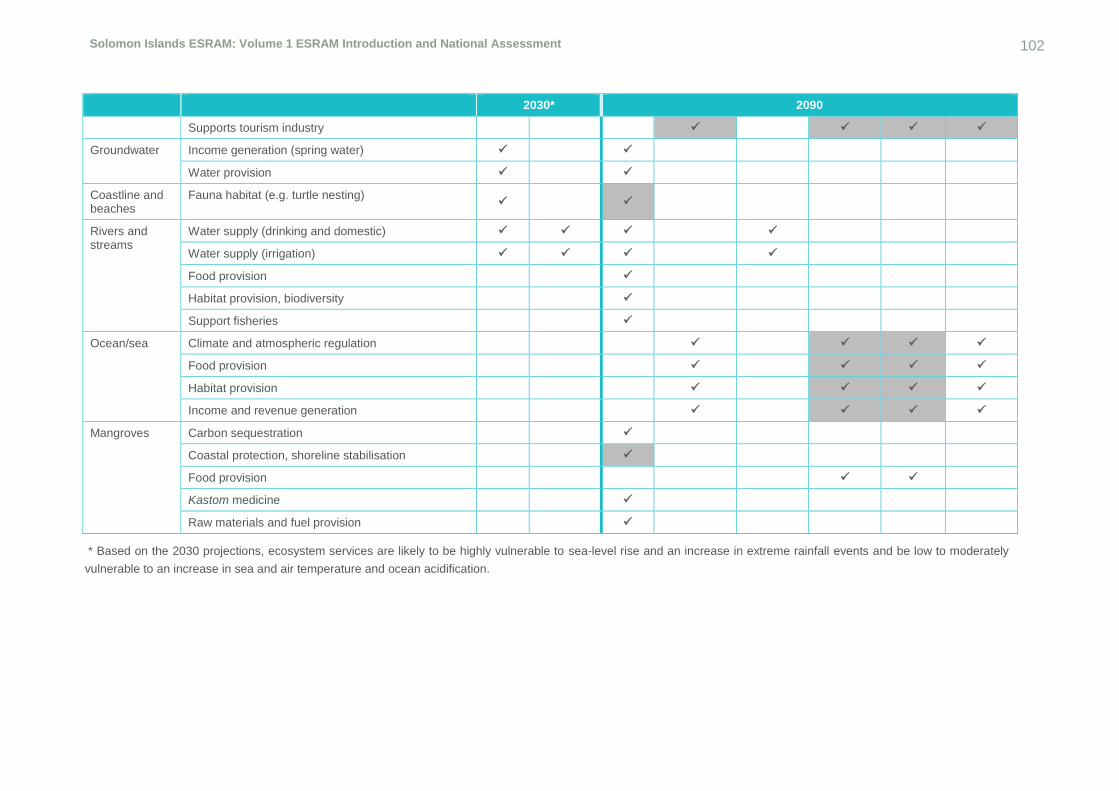
Solomon Islands ESRAM: Volume 1 ESRAM Introduction and National Assessment 102
2030* 2090
Supports tourism industry
Groundwater Income generation (spring water)
Water provision
Coastline and beaches
Fauna habitat (e.g. turtle nesting)
Rivers and streams
Water supply (drinking and domestic)
Water supply (irrigation)
Food provision
Habitat provision, biodiversity
Support fisheries
Ocean/sea Climate and atmospheric regulation
Food provision
Habitat provision
Income and revenue generation
Mangroves Carbon sequestration
Coastal protection, shoreline stabilisation
Food provision
Kastom medicine
Raw materials and fuel provision
* Based on the 2030 projections, ecosystem services are likely to be highly vulnerable to sea-level rise and an increase in extreme rainfall events and be low to moderately
vulnerable to an increase in sea and air temperature and ocean acidification.

Solomon Islands ESRAM: Volume 1 ESRAM Introduction and National Assessment 103
8 ESRAM outcomes
The vulnerability of social and ecological systems to human activities such as logging, agriculture,
pollution and the over-exploitation of marine resources is increasing. As one of the fastest growing
populations in the world, these activities will only intensify and have an increased detrimental effect
on the communities and economies of Solomon Islands. The direct and indirect effects of climate
change and their interactions with human-induced threats increases the vulnerability of critical
ecosystems and ecosystem services. By highlighting these vulnerabilities, opportunities to protect
and restore critical ecosystems and their services can be identified to retain and build on the
strengths of social systems and effective governance structures and ultimately increase the
resilience of both people and ecosystems.
The following section provides a summary of the vulnerabilities of Honiara’s ecosystem services to
climate and non-climate related threats and their effect on the resilience of the communities and
economies of Solomon Islands. Due to the linked, interconnectedness of the social ecological
systems and climate and non-climate threats, and the high-level nature of the national scale study,
ESRAM outcomes are presented in three broad ecosystem types: freshwater (groundwater,
wetlands, swamps, lakes, rivers, and streams), coastal and marine (beaches, mangroves, coral
reefs, estuaries, seagrass and marine macroalgae, and ocean) and terrestrial (forests and cultivated
land).
8.1 Resilience of ecosystem services to human induced and climate change effects
8.1.1 Freshwater ecosystems and services
Increasing erosion and sedimentation of stream and river systems from logging operations,
subsistence cultivation on sloping lands, and land clearing for commercial and residential purposes
is affecting the water quality of freshwater systems. In addition to sediment run-off, pollution in water
catchments from inappropriate solid waste and sanitation practices, and chemical, pesticide and
fertiliser inputs is increasing with rapid population growth, urbanisation and extractive industries. The
projected increase in extreme rainfall events is likely to increase pollution inputs in the upper
catchment areas, which then have detrimental flow-on effects to lower catchments.
The effects of extreme rainfall events by 2030 and beyond is likely to worsen soil stability and the
water quality of receiving environments. Ecosystem services most likely to be vulnerable to these
threats are critical provisioning services provided by freshwater ecosystems (i.e. rivers and streams)
such as water supply (for drinking, domestic and irrigation purposes), food provision for both
subsistence and commercial purposes (eels and other fish, molluscs, crustaceans, etc.), habitat
provision (supporting biodiversity and food sources) and recreational activities (e.g. swimming).
Communities and economies that rely on these ecosystems for essential services (such as food,
income and raw materials) may be required to adapt to alternative ecosystems for provisional
services.
The effect on freshwater systems such as groundwater, wetlands, swamps, lakes, rivers and streams
will be further intensified by the threat of saltwater intrusion from rising sea levels due to ecosystems
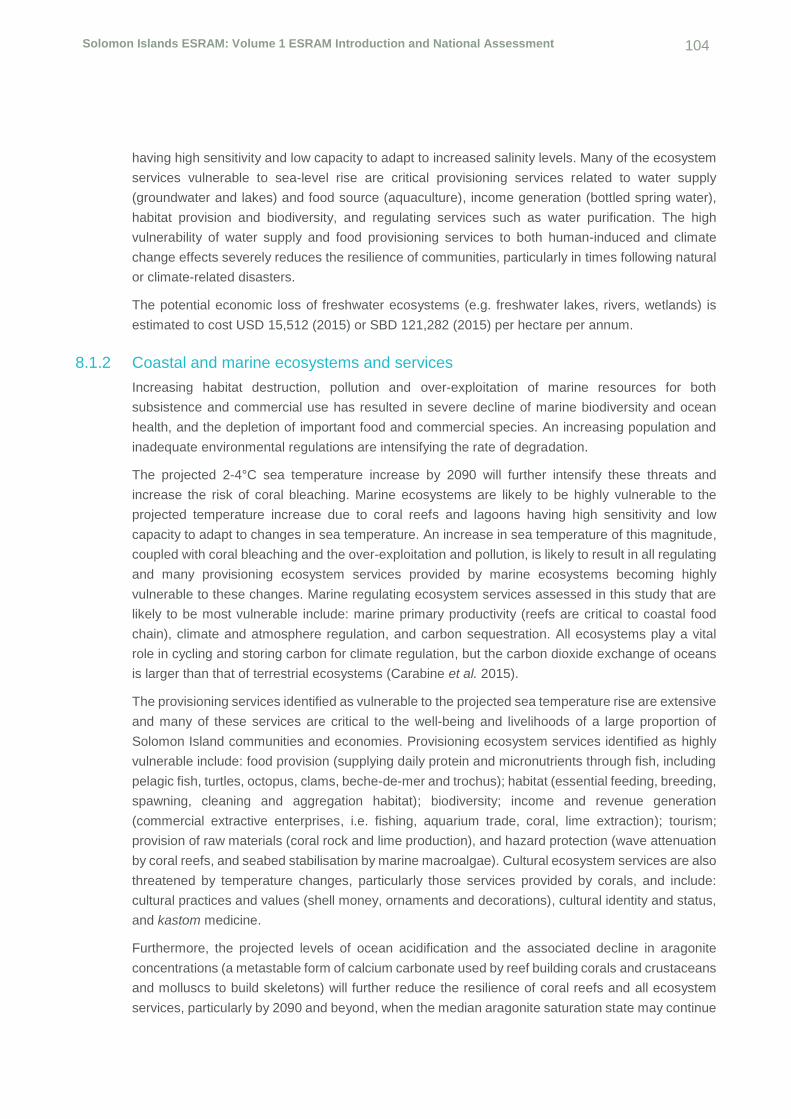
Solomon Islands ESRAM: Volume 1 ESRAM Introduction and National Assessment 104
having high sensitivity and low capacity to adapt to increased salinity levels. Many of the ecosystem
services vulnerable to sea-level rise are critical provisioning services related to water supply
(groundwater and lakes) and food source (aquaculture), income generation (bottled spring water),
habitat provision and biodiversity, and regulating services such as water purification. The high
vulnerability of water supply and food provisioning services to both human-induced and climate
change effects severely reduces the resilience of communities, particularly in times following natural
or climate-related disasters.
The potential economic loss of freshwater ecosystems (e.g. freshwater lakes, rivers, wetlands) is
estimated to cost USD 15,512 (2015) or SBD 121,282 (2015) per hectare per annum.
8.1.2 Coastal and marine ecosystems and services
Increasing habitat destruction, pollution and over-exploitation of marine resources for both
subsistence and commercial use has resulted in severe decline of marine biodiversity and ocean
health, and the depletion of important food and commercial species. An increasing population and
inadequate environmental regulations are intensifying the rate of degradation.
The projected 2-4°C sea temperature increase by 2090 will further intensify these threats and
increase the risk of coral bleaching. Marine ecosystems are likely to be highly vulnerable to the
projected temperature increase due to coral reefs and lagoons having high sensitivity and low
capacity to adapt to changes in sea temperature. An increase in sea temperature of this magnitude,
coupled with coral bleaching and the over-exploitation and pollution, is likely to result in all regulating
and many provisioning ecosystem services provided by marine ecosystems becoming highly
vulnerable to these changes. Marine regulating ecosystem services assessed in this study that are
likely to be most vulnerable include: marine primary productivity (reefs are critical to coastal food
chain), climate and atmosphere regulation, and carbon sequestration. All ecosystems play a vital
role in cycling and storing carbon for climate regulation, but the carbon dioxide exchange of oceans
is larger than that of terrestrial ecosystems (Carabine et al. 2015).
The provisioning services identified as vulnerable to the projected sea temperature rise are extensive
and many of these services are critical to the well-being and livelihoods of a large proportion of
Solomon Island communities and economies. Provisioning ecosystem services identified as highly
vulnerable include: food provision (supplying daily protein and micronutrients through fish, including
pelagic fish, turtles, octopus, clams, beche-de-mer and trochus); habitat (essential feeding, breeding,
spawning, cleaning and aggregation habitat); biodiversity; income and revenue generation
(commercial extractive enterprises, i.e. fishing, aquarium trade, coral, lime extraction); tourism;
provision of raw materials (coral rock and lime production), and hazard protection (wave attenuation
by coral reefs, and seabed stabilisation by marine macroalgae). Cultural ecosystem services are also
threatened by temperature changes, particularly those services provided by corals, and include:
cultural practices and values (shell money, ornaments and decorations), cultural identity and status,
and kastom medicine.
Furthermore, the projected levels of ocean acidification and the associated decline in aragonite
concentrations (a metastable form of calcium carbonate used by reef building corals and crustaceans
and molluscs to build skeletons) will further reduce the resilience of coral reefs and all ecosystem
services, particularly by 2090 and beyond, when the median aragonite saturation state may continue
Solomon Islands ESRAM: Volume 1 ESRAM Introduction and National Assessment 105
to strongly decline to values where coral reefs have not historically been found (< 3.0). The effect of
acidification on the health of reef and marine ecosystems is likely to be compounded by other
stressors, including coral bleaching, storm damage, water quality and fishing pressure. Intertidal
ecosystems that provide food, such as crustaceans and molluscs, may also be vulnerable, further
reducing the resilience of local communities that rely on these ecosystems for essential services
such as food, income and raw materials. Communities and economies that rely on these ecosystems
for essential services (such as food, income and raw materials) will be required to adapt to alternative
ecosystems for provisional services by 2090.
The projected sea-level rise of 40 to 89 cm by 2090, together with the effects of coastal development,
urbanisation and pollution, are likely to increase the vulnerability of ecosystem services provided by
mangroves and sand beaches from inundation and erosion of coastal habitats. The level of
vulnerability for both ecosystems and their services will, however, largely depend on their location,
adequate expansion space, and local hydrologic and geographic features. Mangrove ecosystem
services likely to be vulnerable to 2090 sea levels include: carbon sequestration, coastal protection
and shoreline stabilisation, food provision, raw material and fuelwood provision, and kastom
medicine. It is estimated between 50% and 71% of the carbon sequestered in oceans (which totals
up to 55% of total sequestration) is captured by coastal vegetation (Nellemann et al. 2009) while the
rates of sequestration and storage by coastal vegetation can be equal or more than the sequestration
rates of tropical rainforests or peatlands (ibid). Beach-dependent species such as marine turtles, are
likely to have a high vulnerability to sea-level rise, given their inability to adapt to nesting outside of
sand dunes. The over-exploitation of marine turtles, their sensitivity to temperature changes and the
increasing pollution of oceans will further increase their vulnerability to rising sea levels.
An increase in extreme rainfall events will also result in an increase of run-off into estuaries, which
influences water residence time, nutrient delivery, vertical stratification and salinity. Changes to these
properties can have significant effects on phytoplankton populations and increase the risk of
eutrophication. Changes in freshwater flow and timing can also affect migration and spawning of
many estuarine and marine fishery species. The increased levels of rainfall events and sea levels,
together with threatening land-based activities, will be critical determining factors of water quality in
coastal and marine ecosystems of Solomon Islands.
Marine and coastal ecosystem services are essential to the livelihoods and well-being of many
Solomon Islanders for both subsistence and income generation purposes. The depletion of marine
resources, and the corresponding reduced generation of income, will affect food security by forcing
people to be more dependent on the market, which can have severe implications due to increasing
prices. The high reliance on resources for subsistence, combined with the depletion of marine
resources, is reducing the resilience of communities and ecosystems, both to future climate change
effects and the high population growth. The degradation of marine resources from both climate and
human-induced impacts is also likely to increase the rural-urban migration, as the provision of food
and income becomes insufficient to meet the basic needs of rural households.
The potential economic loss of marine and coastal ecosystems (e.g. coral reefs, coastal systems,
and coastal wetlands, including mangroves) and all ecosystem services is estimated to cost USD
295,052 (2015) or SBD 2,306,888 (2015) per hectare per annum. Utilising the estimated total
coverage of mangroves in Solomon Islands of 65,000 ha (Sulu et al. 2012), the loss of mangroves

Solomon Islands ESRAM: Volume 1 ESRAM Introduction and National Assessment 106
and their ecosystem services is equivalent to an economic loss of USD 579,345,000 (2015) or SBD
4,529,395,000 (2015). Based on the estimated seagrass cover of 10,000 ha (Sulu et al. 2012)
throughout Solomon Islands, the loss of ecosystem services provided by seagrass would equate to
a loss of approximately USD 296,700,000 (2015) and SBD 2,319,750,000 (2015).
8.1.3 Terrestrial ecosystems and services
The greatest threat to terrestrial forests and inhabitant flora and fauna communities in Solomon
Islands is dominated by logging and agriculture activities, while threats from mining and infrastructure
development activities are likely to increase in the future. Rapid population growth and urbanisation
will further increase land-clearing activities. The projected air temperature increase of 2–4°C by 2090
and beyond is likely to further increase the existing vulnerability of forests and cultivated land to these
threatening activities. The increased vulnerability of terrestrial ecosystems may be expressed by a
reduction in local biodiversity and species structure, and sensitivity to other threats, such as pests
and disease and prolonged dry periods.
Climate, water and soil regulation provide suitable conditions for cultivated lands for food production
and quality. Land-use change affects the levels of these regulating services, while the interaction of
land-clearing and climate change is predicted to affect the provision of stable climatic conditions
(Carabine et al. 2015) and threaten food security and livelihoods at a national scale.
The clearing of forests will continue to reduce the resilience of social and ecological systems by
reducing the provision of essential ecosystem services. Ecosystem services identified in this study
likely to be highly vulnerable include: provisioning services, such as food (hunting grounds, nuts,
traditional fruits and vegetables); water supply (produced by forests and mountains and supported
by vegetation, soils and microorganisms); habitat and biodiversity; raw materials and income
generation (building, fuel and commercial purposes); and cultural services, such as cultural items,
values, practices, identity and heritage (traditional tools, ornaments, costumes, weaving, handicrafts
and traditional currency). Irreplaceable regulating services of forests are also vulnerable to climate
and non-climate threats. Deforestation has the potential to reduce the capacity of terrestrial
ecosystems to regulate and provide freshwater. The clearing of large forested areas can affect
microclimates and vapour formation and rainfall patterns (Gordon 2003). Regulating services likely
to be highly vulnerable to human-induced and climate change effects include: primary productivity,
nutrient cycling, soil fertility and stability, and carbon sequestration.
A critical ecosystem service provided by terrestrial forests is the mitigation of natural hazards and
extreme weather events. Terrestrial forests act as a barrier or buffer to extreme events and natural
hazards by protecting people in downstream areas from landslides and flash floods, and reduce the
level of sediment run-off into rivers and streams. Forest degradation, clearing and change in land
use reduces the resilience of both humans and ecosystems to natural hazards. As the frequency and
intensity of climate-related disasters increase with global climate change (Munang et al. 2013), the
resilience of ecosystems and human societies against the effects of climate change will continue to
decrease with further environmental degradation.
The potential economic loss of terrestrial ecosystems (e.g. tropical forests and grasslands) and their
ecosystems is estimated to cost USD 4,675 (2015) or SBD 36,553 (2015) per hectare per annum.
Solomon Islands ESRAM: Volume 1 ESRAM Introduction and National Assessment 107
Based on the estimated forest cover of 2,150,000 ha in 2015, this would equate to a loss of
approximately USD 6,884,300,000 (2015) and SBD 53,829,550,000 (2015).
8.2 National ecosystem based adaptation options
Well managed and healthy ecosystems provide essential services for the health, well-being and
livelihoods of the people of Solomon Islands. The ESRAM process has identified the vulnerabilities
of social ecological systems to climate and non‐climate change threats and impacts. By
strengthening and assisting ecosystems to adapt to future threats, the resilience of local communities
and national and sub-national economies is increased.
There is a strong economic case for investing in ecosystem services for human benefits, and most
studies discover that the costs of ecosystem restoration and protection are far outweighed by the
benefits (Carabine et al. 2015). Political support at the national level is critical for mainstreaming
ecosystem-based adaptation to respond and act to future climate change impacts and climate-
related disasters. Strong governance and well-coordinated regulations between jurisdictions of
management is needed at all levels of government, together with awareness among communities
about the values, restoration, protection and sustainable management of ecosystem services.
Based on the vulnerable ecosystem services outlined above, Table 8-1 presents high level EbA
options to be considered in the protection, restoration and strengthening of ecosystems to increase
the resilience of Solomon Island social and ecological systems.

Solomon Islands ESRAM: Volume 1 ESRAM Introduction and National Assessment 108
Table 8-1 Suggested EbA options to increase the adaptive capacity and resilience of Solomon Island ecosystems
High Level Ecosystem Type
Most Vulnerable Ecosystem Services to Climate and Non-climate Effects
Anthropogenic and Non-Climate Stressors
Potential Climate Change Related Impact
Adaptation and Ecosystem Resilience Options
Key Stakeholders to Support EbA Option Implementation
Fresh water Water supply (drinking, domestic, irrigation)
Habitat and biodiversity
Food provision (aquaculture)
Income generation
Recreational activities (swimming)
Population growth
Vegetation clearing and land disturbance
Sediment run-off from inappropriate land management activities such as logging and agriculture
Pollution from poor solid waste management and sanitation, chemical, pesticides and fertiliser inputs, urbanisation and extractive industries
Soil erosion, sedimentation and landslip from extreme rainfall events. Exacerbated by more intense tropical cyclones.
Salt water intrusion from sea-level rise
Relocate communities and businesses from vulnerable riparian areas to drier, higher ground
Rezone areas within 50 m of a waterway to exclude development
Environmental compliance training for government staff
Vegetation protection and catchment and riparian revegetation programme
Land-use planning restrictions on steep and unstable soils
Nationwide environmental awareness and education programmes on:
- Sustainable land management practices, including importance of riparian vegetation
- Stormwater management systems
- Good waste management and sanitation practices
Ministry of Environment, Climate Change, Disaster Management and Meteorology
Ministry of Forests and Research
Ministry of Education and Human Resources Development
Ministry of Women, Children and Youth
Solomon Islands Water Authority
Town and Country Planning Board
Ministry of Infrastructure and Development
Botanical Garden and National Herbarium
Solo Enviro Beautification
The Nature Conservancy
World Wildlife Fund
SPREP
Coastal and marine
Food provision (fish, including pelagic fish, turtles, octopus, clams, beche-de-mer and trochus)
Habitat (essential feeding, breeding, spawning, cleaning and aggregation habitat) and biodiversity
Population growth
Depletion of marine resources and loss of biodiversity from over-exploitation (over-fishing)
Sediment run-off from inappropriate land management activities
Decline in reef ecosystem condition and coral dieback due to coral bleaching (rising temperature), ocean acidification, poor water quality (sedimentation due to extreme rainfall events)
Exacerbated by more intense tropical cyclones.
Designate national marine and reef protection areas
Relocate communities and businesses from vulnerable coastal areas further inland or to higher ground
Sustainable fisheries management
Environmental compliance training for government staff
Ministry of Environment, Climate Change, Disaster Management and Meteorology
Ministry of Fisheries and Marine Resources
Ministry of Education and Human Resources Development

Solomon Islands ESRAM: Volume 1 ESRAM Introduction and National Assessment 109
High Level Ecosystem Type
Most Vulnerable Ecosystem Services to Climate and Non-climate Effects
Anthropogenic and Non-Climate Stressors
Potential Climate Change Related Impact
Adaptation and Ecosystem Resilience Options
Key Stakeholders to Support EbA Option Implementation
Income generation (commercial extractive enterprises and tourism)
Provision of raw materials (coral rock and lime production)
Hazard protection (wave attenuation by coral reefs, shoreline stabilisation by mangroves, and sea-bed stabilisation by marine macroalgae).
Cultural practices and values (shell money, ornaments and decorations)
Cultural identity and status
Kastom medicine
Marine primary productivity
Climate and atmosphere regulation
Carbon sequestration
such as logging and agriculture
Pollution from poor solid waste management and sanitation, chemical, pesticide and fertiliser inputs, urbanisation and extractive industries
Coastal development and vegetation clearing
Shift in marine ecosystem structure due to rise in sea temperature
Altered capacity for oceans to regulate climate from increased sea temperatures
Sediment run-off from extreme rainfall events
Coastal erosion of mangroves forests and sand beaches from sea-level rise, storm surge and tropical cyclones
Permanent saltwater inundation of mangrove areas
Coastal vegetation protection and revegetation
Land-use planning restrictions on coastal fringe
Nationwide environmental awareness and education programmes on the value of coral reefs for ecosystem services and sustainable fishing
Ministry of Education and Human Resources Development
Ministry of Women, Children and Youth
Solomon Islands Water Authority
Town and Country Planning Board
Ministry of Infrastructure and Development
Botanical Garden and National Herbarium
Solo Enviro Beautification
The Nature Conservancy
World Wildlife Fund
SPREP
Terrestrial Provision of food (hunting grounds, nuts, fruits and vegetables)
Water supply (produced by forests and mountains)
Habitat and biodiversity
Raw materials and income generation (building, fuel and commercial purposes)
Cultural items (traditional tools, ornaments, costumes, weaving, handicrafts and traditional currency)
Cultural values and practices
Population growth
Depletion of forests and loss of biodiversity from clearing and development
Change of land use
Sediment run-off from inappropriate land management activities such as logging and agriculture
Soil degradation from chemical, pesticide and
Soil erosion, sedimentation and landslip from extreme rainfall events. Exacerbated by more intense tropical cyclones.
Increase in invasive species due to increase in temperature and extreme rainfall events
Designate national protected areas
National food security programme
Environmental compliance training for government staff
Vegetation protection and catchment and riparian revegetation programme
Nationwide education programme on the value of terrestrial watersheds and sustainable land management practices
Land-use planning restrictions on steep and unstable soils
Ministry of Environment, Climate Change, Disaster Management and Meteorology
Ministry of Forests and Research
Ministry of Education and Human Resources Development
Ministry of Women, Children and Youth
Solomon Islands Water Authority
Town and Country Planning Board
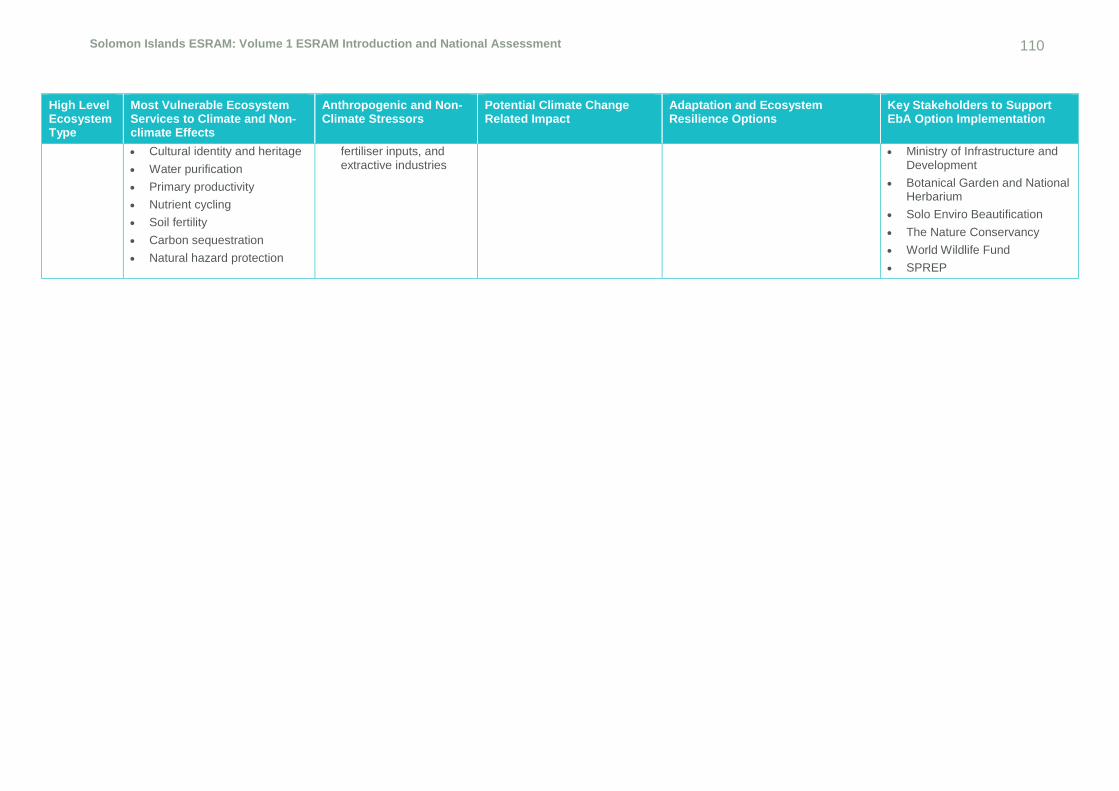
Solomon Islands ESRAM: Volume 1 ESRAM Introduction and National Assessment 110
High Level Ecosystem Type
Most Vulnerable Ecosystem Services to Climate and Non-climate Effects
Anthropogenic and Non-Climate Stressors
Potential Climate Change Related Impact
Adaptation and Ecosystem Resilience Options
Key Stakeholders to Support EbA Option Implementation
Cultural identity and heritage
Water purification
Primary productivity
Nutrient cycling
Soil fertility
Carbon sequestration
Natural hazard protection
fertiliser inputs, and extractive industries
Ministry of Infrastructure and Development
Botanical Garden and National Herbarium
Solo Enviro Beautification
The Nature Conservancy
World Wildlife Fund
SPREP

Solomon Islands ESRAM: Volume 1 ESRAM Introduction and National Assessment 111
Glossary
Adaptation Changes made in order to reduce the vulnerability of a community, society or system to the negative effects of climate change
Adaptive capacity The ability of an ecosystem service to adjust to climate change, to moderate potential damage, to take advantage of opportunities, or to cope with the consequences
Biodiversity The variability among living organisms from all sources, including terrestrial, marine and other aquatic ecosystems, and the ecological complexes of which they are part; this includes diversity within species, between species and of ecosystems (CBD)
Climate change Changes in the Earth’s climate, due to human activities (anthropogenic climate change) or natural processes, which are already occurring or predicted to occur. Anthropogenic climate change is expected to happen much more rapidly than natural changes in the climate, posing an enormous challenge to both natural and human systems.
Ecosystem A complex set of relationships of living organisms functioning as a unit and interacting with their physical environment
Ecosystem-based adaptation
Ecosystem-based adaptation (EbA) is an ecosystems focussed approach to building the resilience of human communities to the negative effects of climate change.
Ecosystem services The benefits that an ecosystem provides to humans
Exposure The degree to which an ecosystem service is affected, either adversely or beneficially, by climate-related stimuli. The effect may be direct (e.g. coral bleaching in response to temperature rise) or indirect (e.g. seagrass dieback due to sedimentation from extreme rainfall events).
Resilience The capacity of a community, society or natural system to maintain its structure and functioning through stress or change. The combination of resistance and recovery time influence the degree to which a system experiences long-term consequences of a stressor’s impact (Folke 2006).
Risk The potential for consequences where something of value is at stake and where the outcome is uncertain. (Probability of physical event occurring x Consequences).
Sensitivity The degree to which an ecosystem service is affected, either adversely or beneficially, by climate-related stimuli. The effect may be direct (e.g. coral bleaching in response to temperature rise) or indirect (e.g. seagrass dieback due to sedimentation from extreme rainfall events).
Vulnerability The degree to which exposed elements, such as human beings, their livelihoods and their assets, are susceptible and unable to cope with the adverse impacts of natural and climate change hazard events.

Solomon Islands ESRAM: Volume 1 ESRAM Introduction and National Assessment 112
9 References and Bibliography
9.1 References
Abernethy, K., Bodin, O., Olsson, P., Hilly, Z., Schwarz, A. (2014) Two steps forward, two steps back:
the role of innovation in transforming towards community-based marine resource management in
Solomon Islands. Global Environmental Change 28: 309-321.
Aswani, S., Albert, S. (2015) Change in Roviana Lagoon Coral Reef Ethnobiology. In: Ethnobiology
of Corals and Coral Reefs, Springer, Switzerland.
Australian Bureau of Meteorology and CSIRO (2011). Climate Change in the Pacific: Scientific
Assessment and New Research, Volume 2: Country Reports, Pacific Climate Change Science
Program, Australian Bureau of Meteorology and Commonwealth Scientific and Industrial Research
Organisation (CSIRO), Melbourne, Australia 273 pp
Australian Bureau of Meteorology and CSIRO (2012). Pacific Climate Change Science Program, End
of Program Report July 2009 – December 2011. Australian Bureau of Meteorology and
Commonwealth Scientific and Industrial Research Organisation (CSIRO), Melbourne,
http://www.pacificclimatechangescience.org/wp-
content/uploads/2013/06/PCCSP_EofProgram_Report.pdf)
Australian Bureau of Meteorology and CSIRO (2014). Climate Variability, Extremes and Change in
the Western Tropical Pacific: New Science and Updated Country Reports, Pacific Australia Climate
Change Science and Adaptation Planning Program, Australian Bureau of Meteorology and
Commonwealth Scientific and Industrial Research Organisation (CSIRO), Melbourne, Australia 358
pp http://www.pacificclimatechangescience.org/publications/reports/climatevariability-extremes-
and-change-in-the-western-tropical-pacific-2014/
Australian Bureau of Meteorology and CSIRO (2014). Climate Variability, Extremes and Change in
the Western Tropical Pacific: New Science and Updated Country Reports. Pacific-Australia Climate
Change Science and Adaptation Planning Program Technical Report, Australian Bureau of
Meteorology and Commonwealth Scientific and Industrial Research Organisation, Melbourne,
Australia.
Berkelmans, R., De’ath, G., Kininmouth., S., and Skirving, W.J. (2004). A comparison of the 1998
and 2002 coral bleaching events on the Great Barrier Reef: spatial correlation, patterns and
predications. Coral Reefs, 23, 74-83.
BirdLife International (2017). ‘What are KBAs and how are they identified?’ Accessed 24 May 2017
at: http://www.keybiodiversityareas.org/what-are-kbas
Biggs, R., Schluter, M., and Schoon, M.L (2015). Principles for Building Resilience: Sustaining
Ecosystem Services in Social–Ecological Systems. Cambridge University Press 978-1-107-08265-6
Bourke, RM., McGregor, A., Allen, MG., Evans, BR., Mullen, BF., Pollard, AA., Wairiu, M and Zotalis,
S (2006). Solomon Islands Smallholder Agriculture Study, vol. 1, 5, Commonwealth of Australia,
Canberra.
Solomon Islands ESRAM: Volume 1 ESRAM Introduction and National Assessment 113
Butler, R. (no year). Solomon Islands Forest Information and Data. Accessed 27 March 2017 at:
http://rainforests.mongabay.com/deforestation/2000/Solomon_Islands.htm
CBD (Secretariat of the Convention on Biological Diversity) (2012). COP 11 Decision XI/17. Marine
and coastal biodiversity: ecologically or biologically significant marine areas. Accessed from:
http://www.cbd.int/decision/cop/default.shtml?id=13178
CBD (Secretariat of the Convention on Biological Diversity) (2009). Connecting Biodiversity and
Climate Change Mitigation and Adaptation: Report of the Second Ad Hoc Technical Expert Group
on Biodiversity and Climate Change. Montreal, Technical Series No. 41, 126 pages.
Chin, A., Lison De Loma, T., Reytar, K., Planes, S., Gerhardt, K., Clua, E., Burke, L. and Wilkinson,
C. (2011) Status of Coral Reefs of the Pacific and Outlook: 2011. Global Coral Reef Monitoring
Network.
Donner, S.D., Skirving, W.J., Little, C.M., Oppenheimer, M., and Hoegh-Guldberg, O. (2005). Global
assessment of coral bleaching and required rates of adaptation under climate change. Glob. Change
Biol., 11, 2251-2265.
Groot, R. de, Brander, L., Ploeg, S. van der, Costanza, R., Bernard, F., Braat, L., Christie, M.,
Crossman, N., Ghermandi, A., Hein, L.G., Hussain, S., Kumar, P., McVittie, A., Portela, R.,
Rodriguez, L.C., Brink, P., Beukering, P., van (2012) Global estimates of the value of ecosystems
and their services in monetary units. Ecosystem Services 1 ISSN 2212-0416 p.50-61.
FAO (2011) Payments for ecosystem services and food security. Food and Agriculture Organisation
of the United Nations: Rome, Italy.
Filardi, C., Boseto, D., Filardi, C. (2007) A preliminary desk study identifying important bird areas
(IBAs) in the Solomon Islands. Birdlife International.
Folke, C. (2006) Resilience: The emergence of a perspective for social–ecological systems analyses.
Global Environmental Change Volume 16, Issue 3, 2006, p. 253–267.
Frazer, I. (1997) The struggle for control of Solomon Islands’ forests. The Contemporary Pacific, 9,
1. pp. 39–72.
Furusawa, T., Sirikolo, M., Sasaoka, M., Ohtsuka, R. (2014) Interaction between forest biodiversity
and people’s use of forest resources in Roviana, Solomon Islands: implications for biocultural
conservation under socio-economic changes. Journal of Ethnobiology and Ethnomedicine 10: 10-
20.
Global Climate Change Alliance (GCCA) (2012) The Solomon Islands Climate Assistance
Programme. Accessed 29 May 2017 at: http://www.gcca.eu/national-programmes/pacific/gcca-
solomon-islands-climate-assistance-programme
Gordon, L. (2003) Land use, freshwater flows and ecosystem services in an era of global change.
Doctoral Thesis. Stockholm University: Stockholm, Sweden.
Green, A., Lokani, P., Atu, W., Ramohia, P., Thomas, P., Almany, J. (eds.) (2006) Solomon Islands
Marine Assessment: Technical report of a survey conducted May 13 to June 17, 2004. The Nature
Conservancy – Pacific Island Countries, Report No. 1/06.

Solomon Islands ESRAM: Volume 1 ESRAM Introduction and National Assessment 114
Guinotte, J.M., Buddemeier, R., W. and Kleypas, J.A., (2003). Future coral reef habitat marginality:
temporal and spatial effects of climate change in the Pacific basin. Coral Reefs, 22, 551-558
Gunderson, L. H., and Holling, C. S. eds. (2002) Panarchy: Understanding Transformations in
Systems of Humans and Nature. Island Press, Washington DC.Hallock, P., (2005): Global change
and modern coral reefs: new opportunities to understand shallow water-carbonate depositional
processes. Sediment. Geol., 175, 19-33.
Halpern, B.S., Selkoe, K., White, C., Albert, S., Aswani, S., Lauer, M. (2013) Marine protected areas
and resilience to sedimentation in Solomon Islands. Coral Reefs 32:61-69.
Hoegh-Guldberg, O., 1999. Climate change, coral bleaching and the future of the world’s coral reefs.
Mar. Freshwater Res., 50, 839-866
Holling, C. S. (1973) Resilience and stability of ecological systems. Annu Rev Ecol Syst 4:1-23.
IPCC, 2007: Climate Change 2007: Impacts, Adaptation and Vulnerability, Contribution of Working
Group II to the Fourth Assessment Report of the Intergovernmental Panel on Climate Change., M.L
Parry, O.F. Canziani. J.P. Palutikof, P.J. van der Linden and C.E. Hanson, Eds., Cambridge
University Press, Cambridge, UK, 976pp.t
Kabutaulaka, T., (2000) Rumble in the Jungle: land, culture and (un)sustainable logging Solomon
Islands. Hooper, A. (ed.). Culture and Sustainable Development in the Pacific. Canberra: 88-97.
Kabutaulaka, T., (2006) Global Capital and Local Ownership in Solomon Islands’ Forestry Industry.
Stewart F. (ed.). Globalisation and governance in the Pacific Islands. State, society and governance
in Melanesia. Studies in State and Society in the Pacific, No. 1. Canberra pp. 239-257.
Kareiva, P.M., 2012. Natural capital: theory and practice of mapping ecosystem services. Oxford
[u.a.]: Oxford Univ. Press, 2012.
King, D.M., Mazzotta, M.J. (2000) Ecosystem Valuations. Published by US Department of Agriculture
Natural Resources Conservation Service and National Oceanographic and Atmospheric
Administration. Accessed 22 May 2017 at: http://www.ecosystemvaluation.org/big_picture.htm
Lomas, M.W., Gilbert, P.M., Shiah, F., and Smith, E.M., (2202). Microbial process and temperature
in Chesapeake Bay: Current relationships and potential impacts of regional warming. Glob. Change
Biol., 8, 51-70.
Mackay, E. (1988) Report on Farming Systems Survey in Solomon Islands. Unpublished report.
MAL, Honiara.
Mataki, M., Solo, G., Donohoe, P., Alele, D., Sikajajaka, L. (2013) Choiseul Province Climate Change
Vulnerability and Adaptation Assessment Report. Prepared for Secretariat of the Pacific Community
(SPC), Deutsche Gesellschaft für Internationale Zusammenarbeit (GIZ) and Secretariat of the Pacific
Regional Environment Programme (SPREP).
Mataki, M (2011) Solomon Islands National Assessment Report RIO + 20.
Millennium Ecosystem Assessment, 2005. Ecosystems and Human Well-being: Synthesis. Island
Press, Washington, DC.
Solomon Islands ESRAM: Volume 1 ESRAM Introduction and National Assessment 115
Ministry of Forests, Environment and Conservation (MFEC) (1995). Solomon Islands National Forest
Resources Inventory. The Forests of the Solomon Islands: Volume Six: Western Province, Honiara,
Guadalcanal Island, the Solomon Islands
Montgomery, P. (1995) Forestry in Solomon Islands. Pacific Economic Bulletin, 10, 2. pp. 74–6.
Moseby, K., Labere, J., Read, J. (2012) Landowner surveys inform protected area management: a
case study from Tetepare Island, Solomon Islands. Hum Ecol 4):227-235.
National Statistical Office (2009) Population and Housing Census – Report on Economic Activity and
Labour Force. Solomon Islands National Statistical Office, Ministry of Finance and Treasury, Honiara.
Nellemann, C., Corcoran, E., Duarte, C., Valdes, L., De Young, C., Fonseca, L. and Grimsditch, G.
(2009) Blue carbon: a rapid response assessment. United Nations Environment Programme, GRID-
Arendal.
Pacific Horizon Group (2008) Solomon Islands State of Environment Report 2008. Prepared for the
Solomon islands Ministry of Environment, Conservation and Meteorology by Pacific Horizon
Consultancy Group, Honiara.
Pauku, R., Lapo, W, (2009) National Biodiversity Strategy and Action Plan for Solomon Islands.
Solomon Islands Ministry of Environment, Conservation and Meteorology, Honiara.
Pauku, R., (2009) Solomon Islands Forestry Outlook Study. Food and Agriculture Organization of
the United Nations Regional Office for Asia and the Pacific, Bangkok.
PIPAP (2016) Pacific Islands Protected Areas Portal. Interactive online database, accessed:
November 2016. www.pipap.sprep.org
Resilience Alliance (2017) Resilience. Accessed: 19 May 2017 at:
http://www.resalliance.org/resilience
Rodil, A., Mias-Cea, M. (2014) Cities and Climate Change Initiative, Honiara, Solomon Islands,
Climate Change Vulnerability Assessment. United Nations Human Settlements Programme (UN-
Habitat)
Roughan, P. and Wara, S. (2010) Solomon Islands Country Report for the 5‐Year Review of the
Mauritius Strategy for Further Implementation of the Barbados Programme of Action for Sustainable
Devlopment of SIDS (MSI+5). Prepared by Paul Roughan (PHCG Ltd) and Sammy Wara (Ministry
of Development Planning and Aid Coordination).
Sabetian A. and Afzal, D. (2004) Status of Coral Reefs in the Solomon Islands. In: Sulu R (ed) Status
of Coral Reefs in the Southwest Pacific: 2004. p. 1-81. Suva, Fiji, IPS Publications, University of the
South Pacific 2007 ISBN 978- 982-02-0386-0.
Scheffer, M., Carpenter, S., Foley, J. A., Folke, C., Walker, B. (2001) Catastrophic shifts in
ecosystems. Nature 413:591-596.
Sheppard, C.R.C., Dixon, D.J., Gourlay, M., Sheppard, A., and Payet., R. (2005). Coral mortality
increases wav energy reaching shores protected by ref flats: examples from the Seychelles. Estuar.
Coast Shelf S. , 64, 223-234.

Solomon Islands ESRAM: Volume 1 ESRAM Introduction and National Assessment 116
Short, F.T. and Neckles, H.A., (1999). The effects of global change on seagrasses. Aquat. Bot., 63,
169-196.
SPC (Secretariat of the Pacific Community) 2008. Solomon Islands Country Profile, October 2008.
Prepared by SPC Strategic Engagement, Policy and Planning Facility.
SPREP (Secretariat of the Pacific Regional Environment Programme) 2016. State of conservation in
Solomon Islands – Country Report 2013. Prepared by SPREP.
Sulu, R.J., Boso, D.N., Vave-Karamui, A., Mauli, S., Wini-SimeonState, L. (2012) State of the Coral
Reefs of Solomon Islands Coral Triangle Marine Resources: their Status, Economies, and
Management.
TEEBcase (2012) Benefits of Forest Certification, Solomon Islands. Written by Padma N. Lal, for The
Economics of Ecosystems and Biodiversity.
Travers, A., Elrick, C., Kay, R., Vestergaard, O. (2012) Ecosystem-Based Adaptation Guidance –
Moving From Principles To Practice. UNEP Working Document, April 2012. Prepared on behalf of
the United Nations Environment Programme (UNEP).
UN-Habitat (2012) Solomon Islands country profile. http://unhabitat.org/solomon-islands/ Accessed
online 3 September 2016.
UNISDR (2009) Global Assessment Report 2009. Accessed 27 May 2017 at:
http://www.preventionweb.net/english/hyogo/gar/2009/?pid:34andpih:2
van Vuuren, D.P., Edmonds, J., Kainuma, M. et al. Climatic Change (2011) 109: 5.
Walker, B., C. S. Holling, S. R. Carpenter, and Kinzig, A. (2004) Adaptability and Transformability in
Social-Ecological Systems. Ecology and Society 9:5.
9.2 Bibliography
Albert, S., Udy, J. and Tibbetts, I. (2008) Responses of algal communities to gradients in herbivore
biomass and water quality in Marovo Lagoon, Solomon Islands. Coral Reefs. 27:73-82.
Albert, S., Udy, J., Tibbetts, I. (2013) Solomon Islands Marine Life – information on biology and
management of marine resources. The University of Queensland, Brisbane.
BMT WBM (2014) Integrated Climate Change Risk and Adaptation Assessment to Inform Settlement
Planning in Choiseul Bay, Solomon Islands Hazards Assessment. Prepared for the Australian
Government Department of Environment by BMYT WBM, Brisbane.
Boseto, D., Morrison, C., Pikacha, P., Pitakia, T. (2007) Biodiversity and conservation of freshwater
fishes in selected rivers on Choiseul Island, Solomon Islands. The South Pacific Journal of Natural
Science 3: 16-21.
Boseto, D., Sirikolo, M. (2009) A report on the freshwater fishes and other fauna biodiversity of two
proposed protected areas on southwest Choiseul Island, Solomon Islands. Report to World Wide
Fund For Nature, 69pp.
Solomon Islands ESRAM: Volume 1 ESRAM Introduction and National Assessment 117
Boseto, D., Furiness Magnuson, S., Pezold, F. (2016) Population genetic structure of the goby
Stiphodon rutilaureus (Gobiidae) in the New Georgia Group, Solomon Islands. Conservation Biology
22:281-291.
Boseto, D., Furiness Magnuson, S., Pezold, F. (2016) Population genetic structure of the goby
Stiphodon rutilaureus (Gobiidae) in the New Georgia Group, Solomon Islands. Conservation Biology
22:281-291.
Choiseul Province (2008) Choiseul Province Medium Term Development Plan, 2009-2011. Choiseul
Provincial Government, Solomon Islands.
Envi-Green Pacific (2012) Proposed project for Solomon Bauxite Limited (SBL) – Environmental
Impact Assessment (EIA), Final Report. Prepared for Greenpac by Envi-Green Pacific Consultancy
Limited, Fiji.
Envi-Green Pacific (2013) Environmental Impact Statement Supplementary Report: Proposed
Bauxite mining, Vaghena, Choiseul, Solomon. Prepared for Greenpac and Solomon Bauxite Limited
by Envi-Green Pacific Consultancy Limited, Fiji.
Feinberg, R. (2010) Marine resource conservation and prospects for environmental sustainability in
Anuta, Solomon Islands. Singapore Journal of Tropical Geography 31:41-54.
Flannery, t. (1990) Mammals of the south-west Pacific and Moluccan Islands, Australian Museum /
Reed Books, Chatswood.
Game, E., Lip-sett-Moore, G., Hamilton, R., Perterson, N., Kereseka, J., Atu, W., Watts, M.,
Possingham, H. (2010) Informed opportunism for conservation planning in the Solomon Islands.
Conservation Letters 4:38-46.
Golder Associates (2014) Jejevo/Isabel B Project Environmental and Social Impact Assessment –
Volume 3, Ecology Appendix B: Terrestrial Baseline Ecology Report. Prepared for Sumitomo Metal
Mining, Solomon Islands Nickel Project.
Govan, H., Maeda, T., Warakohia, D., Atitete, T., Boso, D., Masu, R., Orirana, G., Schwarz, A., Vave-
Karamui, A. (2015) From Village to village: local approaches to promoting spread of community
based resource management: Lessons from Mararo Community Based Organisation, East ‘Are’are,
Malaita Province, Solomon Islands. Report to IUCN Oceania Learning Component.
Iacovino, C., Donohoe, P., Carruthers, T., Chape, S. (2013) Ecosystem-based adaptation and
climate change vulnerability for Choiseul Province, Solomon Islands – a Synthesis Report.
Secretariat of the Pacific Rehgional Environemnet Programme (in collaboration with SPC and GIZ),
Apia, Samoa.
Jenkins, A., Boseto, D. (2007) Freshwater fishes of Tetepare Island. Report to Wetlands International
– Oceania. 33pp.
Jenkins, A., Allen, G., Boseto, D. (2008) Lentipes solomonensis, a new species of freshwater goby
(Teleostei: Gobioidei: Sicydiinae) from the Solomon Islands. International Journal of Ichthyology
(aqua) 14(4): 165-174.
Lavery, T., Pikacha, P., Fisher, D. (2016) Solomon Islands Forest Life – information on biology and
management of forest resources. The University of Queensland, Brisbane.

Solomon Islands ESRAM: Volume 1 ESRAM Introduction and National Assessment 118
Lipsett-Moore, G., Hamilton, R., Peterson, N., Game, E., Atu, W., Kereseka, J., Pita, J., Ramohia,
P., Siota, C. (2010). Ridges to Reefs Conservation Plan for Choiseul Province, Solomon Islands. The
Nature Conservancy: TNC Pacific Islands Countries Report No. 2/10. 53 pp.
MDPAC (2011) National Development Strategy 2011 to 2020. Ministry of Development Planning and
Aid Coordination, Honiara, Solomon Islands.
Menazza, S., Balasinorwala, T. (2012) Assessing ecosystem services for Lauru Protected Area
Network (LPAN), Choiseul, Solomon Islands. The Economics of Ecosystems and Biodiversity,
January 2012 (www. teebweb.org).
Morrison, C., Pikacha, P., Pitakia, T., Boseto, D, (2007) Herpetofauna, community education and
logging on Choiseul Island, Solomon Islands: implications for conservation. Pacific Conservation
Biology 13: 250-58.
Mueller-Dombois, D., Fosberg, R. (1998) Vegetation of the tropical Pacific Islands. New York,
Springer-Verlag. 733 pp.
Pikacha, P. (2008) Distribution, habitat preference and conservation status of the endemic giant rats
Solomys ponceleti and S. salebrosus on Choiseul Island, Solomon Islands. Final Report (Project no.
700305) to BP Conservation Programme. 25pp.
Pikacha, P., Sirikolo, M. (2009) A report on the biodiversity of three proposed protected areas on
southwest Choiseul island, Solomon Islands. Prepared for WWF (Solomon Islands) and Melanesian
Geo (Solomon Islands) by Ecological Solutions Solomon Islands.
Pikacha, P., Sirikolo, M., Boseto, D., Filardi, C. (2012) Ecological observations on Sanford’s sea-
eagle Haliaeetus (leucogaster) sanfordi. Australian Field Ornithology 29: 143-148.
Pollard, E., Brodie, G., Thaman, R., Morrison, C. (2014) The use of herpetofauna and cultural values
to identify priority conservation forests on Malaita, Solomon Islands. Pacific Conservation Biology
20(4): 354-362.
Warren-Rhodes, K., Schwarz, A. M., Boyle, L. N., Albert, J., Agalo, S. S., Warren, R., Bana, A., Paul,
C., Kodosiku, R., Bosma, W., Yee, D., Rönnbäck, P., Crona, B., Duke, N. (2011) Mangrove
ecosystem services and the potential for carbon revenue programmes in Solomon Islands.
Whitmore, T.C. (1969) The Vegetation of the Solomon Islands. Philosophical Transactions of the
Royal Society of London. Series B, Biological Sciences, Volume 255, Issue 800, pp. 259-270

Solomon Islands ESRAM: Volume 1 ESRAM Introduction and National Assessment A-1
Appendix A National workshop attendees
National ESRAM Workshop Attendees (9 August 2016, Honiara)
Name Affiliation
Rosemary Apa Ministry of Environment, Climate and Disaster Management
Steve Likaveke UN-Habitat
Gloria Suluia SI Water Sector Adaptation Project (UNDP)
Reginald Reuban PRRP / Ministry of Environment, Climate and Disaster Management
Mary Tahu SI National University
Joyce Aburii Youth@Work
May SI Community Resilience to Climate and Disaster Risk Project (CRISP)
Debra Potakana ECD / Ministry of Environment, Climate and Disaster Management
Junior Pikacha Ecological Solutions SI
Ikuo Tigulu Ecological Solutions SI
Tammy Tabe University of South Pacific
Hudson K Ministry of Environment, Climate and Disaster Management
Gideon Solo Ministry of Forestry and Research
Nelly K Ministry of Environment, Climate and Disaster Management
Myknee Sirikolo Ministry of Forestry and Research
Simba Paza Prime Minister’s Office
Winston Lapo Ministry of Infrastructure and Development
Shannon Seeto WWF-Pacific
Matsuko Pelomo Ministry of Development, Planning and Aid Coordination
Nancy Raeka Ministry of Environment, Climate and Disaster Management
John Leqata Ministry of Fisheries and Marine Resources
Tia Masolo Ministry of Environment, Climate and Disaster Management
Donald Kudu DREGAR Consulting
Fred Patison SPREP
Simon Albert University of Queensland
Beth Toki BMT WBM

Solomon Islands ESRAM: Volume 1 ESRAM Introduction and National Assessment B-1
Appendix B Climate projections
The Fifth Assessment Report of the Intergovernmental Panel on Climate Change (AR5 2013)
provides projections of future changes in the climate system. These projections use a hierarchy of
global climate models based on a set of four greenhouse gas concentration trajectories, called
representative concentration pathways (RCPs). In combination, the RCPs represent a range of 21st
century climate policies.
The RCPs are labelled according to the range of radiative forcing values in the year 2100 relative to
pre-industrial values:
RCP 2.6 applies a radiative forcing value of +2.6 W/m2 and represents a low forcing level.
RCP 4.5 and RCP 6 apply radiative forcing values of +4.5 and +6.0 W/m2 and represent
stabilisation scenarios.
RCP 8.5 applies a radiative forcing value +8.5 W/m2 and represents a high forcing level.
Figure B-1 Projected emissions of greenhouse gases for the range of RCP trajectories. Radiative forcings for each trajectory shown (bottom right). (van Vuuren et.al. 2011).

Solomon Islands ESRAM: Volume 1 ESRAM Introduction and National Assessment B-2
The Solomon Islands National Climate Change Policy 2012–2017 (MECDM, 2012) was prepared
prior to the release of the AR5 (IPCC 2013). This policy is based on the projections produced by the
Pacific Climate Change Science Program (PCCSP) using data from the IPCC Fourth Assessment
Report (AR4 2007).
B.1.1 Pacific and country-based projections
The climates of countries within the Pacific region (partners in the PCCSP) are strongly influenced
by one or more of the following features of the climate: the South Pacific Convergence Zone (SPCZ),
the West Pacific Monsoon (WPM), the Inter-Tropical Convergence Zone (ITCZ) and El Niño-
Southern Oscillation (ENSO) (refer to Figure B-2). There are still major deficiencies in understanding
the properties and impacts of these climate features, despite the fact that they can strongly influence
rainfall, winds, tropical cyclone tracks, ocean currents, nutrients and other aspects of the environment
(BOM and CSIRO 2012).
Figure B-2 The main climate features in the western tropical Pacific region (source: BOM and CSIRO 2012)
Prior to PCCSP, limited information was available regarding projections for the Pacific region.
PCCSP aimed to provide more detailed atmospheric and ocean projections for each Pacific country.
Twenty-four global climate models were evaluated. AR4 climate simulations were compared against
historical observations from participating PCCSP countries, and 18 models were considered suitable
for projections in the Pacific region. Projections were developed for three 20-year periods (centred
on 2030, 2055 and 2090) and three emissions scenarios (low-B1, medium-A1B and high-A2. Further
information on these scenarios is provided in the AR4).

Solomon Islands ESRAM: Volume 1 ESRAM Introduction and National Assessment C-1
Appendix C National vulnerability assessment results
Climate Variable
Current Climate
Time Slice and Scenario
Projection
Ecosystem Ecosystem Service
SLR
203
0
SLR
203
0
SLR
203
0
SLR
203
0
SLR
203
0
SLR
209
0
SLR
209
0
SLR
209
0
SLR
209
0
SLR
209
0
Sea
temp
203
0
Sea
temp
203
0
Sea
temp
203
0
Sea
temp
203
0
Sea
temp
203
0
Sea
temp
209
0
Sea
temp
209
0
Sea
temp
209
0
Sea
temp
209
0
Sea
temp
209
0
Extr
eme
rainf
all
203
0
Extr
eme
rainf
all
203
0
Extr
eme
rainf
all
203
0
Extr
eme
rainf
all
203
0
Extr
eme
rainf
all
203
0
Extr
eme
rainf
all
209
0
Extr
eme
rainf
all
209
0
Extr
eme
rainf
all
209
0
Extr
eme
rainf
all
209
0
Extr
eme
rainf
all
209
0
Oce
an
Acid
if icat
ion
203
0
Oce
an
Acid
if icat
ion
203
0
Oce
an
Acid
if icat
ion
203
0
Oce
an
Acid
if icat
ion
203
0
Oce
an
Acid
if icat
ion
203
0
Oce
an
Acid
if icat
ion
209
0
Oce
an
Acid
if icat
ion
209
0
Oce
an
Acid
if icat
ion
209
0
Oce
an
Acid
if icat
ion
209
0
Oce
an
Acid
if icat
ion
209
0
Incr
easi
ng
Air
Tem
p
203
0
Incr
easi
ng
Air
Tem
p
203
0
Incr
easi
ng
Air
Tem
p
203
0
Incr
easi
ng
Air
Tem
p
203
0
Incr
easi
ng
Air
Tem
p
203
0
Incr
easi
ng
Air
Tem
p
209
0
Incr
easi
ng
Air
Tem
p
209
0
Incr
easi
ng
Air
Tem
p
209
0
Incr
easi
ng
Air
Tem
p
209
0
Incr
easi
ng
Air
Tem
p
209
0
Extr
eme
Air
Tem
p
203
0
Extr
eme
Air
Tem
p
203
0
Extr
eme
Air
Tem
p
203
0
Extr
eme
Air
Tem
p
203
0
Extr
eme
Air
Tem
p
203
0
Extr
eme
Air
Tem
p
209
0
Extr
eme
Air
Tem
p
209
0
Extr
eme
Air
Tem
p
209
0
Extr
eme
Air
Tem
p
209
0
Extr
eme
Air
Tem
p
209
0
E S PI AC V E S PI AC V E S PI AC V E S PI AC V E S PI AC V E S PI AC V E S PI AC V E S PI AC V E S PI AC V E S PI AC V E S PI AC V E S PI AC V
Rivers, streams Food provision 1 3 3 3 9 2 3 6 3 18 0 0 0 1 0 0 0 0 1 0 3 1 3 1 3 3 1 3 1 3 0 0 0 1 0 0 0 0 1 0 3 1 3 1 3 3 2 6 2 12 3 1 3 1 3 3 2 6 2 12
Rivers, streams Water supply (drinking and domestic) 1 3 3 3 9 2 3 6 3 18 0 0 0 1 0 0 0 0 1 0 3 2 6 3 18 3 2 6 3 18 0 0 0 1 0 0 0 0 1 0 3 1 3 1 3 3 2 6 2 12 3 1 3 1 3 3 2 6 2 12
Rivers, streams Water supply (irrigation) 1 3 3 3 9 2 3 6 3 18 0 0 0 1 0 0 0 0 1 0 3 2 6 3 18 3 2 6 3 18 0 0 0 1 0 0 0 0 1 0 3 1 3 1 3 3 2 6 2 12 3 1 3 1 3 3 2 6 2 12
Rivers, streams Recreation 1 1 1 3 3 2 1 2 3 6 0 0 0 1 0 0 0 0 1 0 3 2 6 1 6 3 2 6 1 6 0 0 0 1 0 0 0 0 1 0 3 0 0 1 0 3 0 0 1 0 3 0 0 1 0 3 0 0 1 0
Rivers, streams Transportation, anchorage 1 1 1 1 1 2 1 2 1 2 0 0 0 1 0 0 0 0 1 0 3 1 3 1 3 3 1 3 1 3 0 0 0 1 0 0 0 0 1 0 3 0 0 1 0 3 0 0 1 0 3 0 0 1 0 3 0 0 1 0
Rivers, streams Raw materials provision 1 3 3 3 9 2 2 4 3 12 0 0 0 1 0 0 0 0 1 0 3 1 3 1 3 3 1 3 1 3 0 0 0 1 0 0 0 0 1 0 3 1 3 1 3 3 2 6 2 12 3 1 3 1 3 3 2 6 2 12
Rivers, streams Energy generation (hydropow er) 1 1 1 3 3 2 1 2 2 4 0 0 0 1 0 0 0 0 1 0 3 1 3 1 3 3 1 3 3 9 0 0 0 1 0 0 0 0 1 0 3 0 0 1 0 3 0 0 1 0 3 0 0 1 0 3 0 0 1 0
Rivers, streams Cultural values 1 1 1 2 2 2 2 4 2 8 0 0 0 1 0 0 0 0 1 0 3 2 6 1 6 3 2 6 3 18 0 0 0 1 0 0 0 0 1 0 3 1 3 1 3 3 2 6 2 12 3 1 3 1 3 3 2 6 2 12
Rivers, streams Waste disposal and dispersal 1 1 1 1 1 2 1 2 1 2 0 0 0 1 0 0 0 0 1 0 3 1 3 1 3 3 1 3 1 3 0 0 0 1 0 0 0 0 1 0 3 0 0 1 0 3 0 0 1 0 3 0 0 1 0 3 0 0 1 0
Rivers, streams Support f isheries 1 3 3 3 9 2 3 6 3 18 0 0 0 1 0 0 0 0 1 0 3 1 3 1 3 3 1 3 1 3 0 0 0 1 0 0 0 0 1 0 3 1 3 1 3 3 2 6 2 12 3 1 3 1 3 3 2 6 2 12
Rivers, streams Habitat provision, biodiversity 1 3 3 3 9 2 3 6 3 18 0 0 0 1 0 0 0 0 1 0 3 1 3 1 3 3 1 3 1 3 0 0 0 1 0 0 0 0 1 0 3 1 3 1 3 3 2 6 2 12 3 1 3 1 3 3 2 6 2 12
Terrestrial Forests, Vegetation Raw materials and fuel provision 0 3 0 3 0 1 3 3 3 9 0 0 0 1 0 0 0 0 1 0 3 1 3 1 3 3 1 3 1 3 0 0 0 1 0 0 0 0 1 0 3 1 3 1 3 3 2 6 2 12 3 1 3 1 3 3 2 6 2 12
Terrestrial Forests, Vegetation Fauna habitat 0 3 0 3 0 1 3 3 3 9 0 0 0 1 0 0 0 0 1 0 3 1 3 1 3 3 1 3 1 3 0 0 0 1 0 0 0 0 1 0 3 1 3 1 3 3 2 6 2 12 3 1 3 1 3 3 2 6 2 12
Terrestrial Forests, Vegetation Kastom medicine provision 0 3 0 3 0 1 3 3 3 9 0 0 0 1 0 0 0 0 1 0 3 1 3 1 3 3 1 3 1 3 0 0 0 1 0 0 0 0 1 0 3 1 3 1 3 3 2 6 2 12 3 1 3 1 3 3 2 6 2 12
Terrestrial Forests, Vegetation Source of income/revenue 0 3 0 3 0 1 3 3 3 9 0 0 0 1 0 0 0 0 1 0 3 1 3 1 3 3 1 3 1 3 0 0 0 1 0 0 0 0 1 0 3 1 3 1 3 3 2 6 2 12 3 1 3 1 3 3 2 6 2 12
Terrestrial Forests, Vegetation Carbon sequestration 0 3 0 3 0 1 3 3 3 9 0 0 0 1 0 0 0 0 1 0 3 1 3 1 3 3 1 3 1 3 0 0 0 1 0 0 0 0 1 0 3 1 3 1 3 3 2 6 2 12 3 1 3 1 3 3 2 6 2 12
Terrestrial Forests, Vegetation Nutrient cycling and primary productivity 0 3 0 3 0 1 3 3 3 9 0 0 0 1 0 0 0 0 1 0 3 1 3 1 3 3 1 3 1 3 0 0 0 1 0 0 0 0 1 0 3 1 3 1 3 3 2 6 2 12 3 1 3 1 3 3 2 6 2 12
Terrestrial Forests, Vegetation Soil retention and fertility 0 3 0 3 0 1 3 3 3 9 0 0 0 1 0 0 0 0 1 0 3 1 3 1 3 3 1 3 1 3 0 0 0 1 0 0 0 0 1 0 3 1 3 1 3 3 2 6 2 12 3 1 3 1 3 3 2 6 2 12
Terrestrial Forests, Vegetation Air regulation and shade provision 0 3 0 3 0 1 3 3 3 9 0 0 0 1 0 0 0 0 1 0 3 1 3 1 3 3 1 3 1 3 0 0 0 1 0 0 0 0 1 0 3 1 3 1 3 3 2 6 2 12 3 1 3 1 3 3 2 6 2 12
Terrestrial Forests, Vegetation Support recreation and tourism 0 3 0 3 0 1 3 3 3 9 0 0 0 1 0 0 0 0 1 0 3 1 3 1 3 3 1 3 1 3 0 0 0 1 0 0 0 0 1 0 3 1 3 1 3 3 2 6 2 12 3 1 3 1 3 3 2 6 2 12
Terrestrial Forests, Vegetation Cultural values and handicrafts 0 3 0 3 0 1 3 3 3 9 0 0 0 1 0 0 0 0 1 0 3 1 3 1 3 3 1 3 1 3 0 0 0 1 0 0 0 0 1 0 3 1 3 1 3 3 2 6 2 12 3 1 3 1 3 3 2 6 2 12
Terrestrial Forests, Vegetation Food provision 0 2 0 2 0 1 2 2 2 4 0 0 0 1 0 0 0 0 1 0 3 1 3 1 3 3 1 3 1 3 0 0 0 1 0 0 0 0 1 0 3 1 3 1 3 3 2 6 2 12 3 1 3 1 3 3 2 6 2 12
Other terrrestrial land Commercial value (incl. agriculture) 0 3 0 3 0 1 3 3 3 9 0 0 0 1 0 0 0 0 1 0 3 1 3 1 3 3 1 3 1 3 0 0 0 1 0 0 0 0 1 0 3 1 3 1 3 3 1 3 2 6 3 1 3 2 6 3 1 3 2 6
Other terrrestrial land Provides identity and heritage 0 3 0 3 0 1 3 3 3 9 0 0 0 1 0 0 0 0 1 0 3 1 3 1 3 3 1 3 1 3 0 0 0 1 0 0 0 0 1 0 3 1 3 1 3 3 1 3 1 3 3 1 3 1 3 3 1 3 1 3
Other terrrestrial land Support forests 0 3 0 3 0 1 3 3 3 9 0 0 0 1 0 0 0 0 1 0 3 1 3 1 3 3 1 3 1 3 0 0 0 1 0 0 0 0 1 0 3 1 3 1 3 3 1 3 2 6 3 1 3 2 6 3 1 3 2 6
Other terrrestrial land Minerals source (mining industry) 0 3 0 3 0 1 3 3 3 9 0 0 0 1 0 0 0 0 1 0 3 1 3 1 3 3 1 3 1 3 0 0 0 1 0 0 0 0 1 0 3 1 3 1 3 3 1 3 1 3 3 1 3 1 3 3 1 3 1 3
Other terrrestrial land Land provision 0 3 0 3 0 1 3 3 3 9 0 0 0 1 0 0 0 0 1 0 3 1 3 1 3 3 1 3 1 3 0 0 0 1 0 0 0 0 1 0 3 1 3 1 3 3 1 3 2 6 3 1 3 2 6 3 1 3 2 6
Coral Reefs Habitat provision / biodiversity 3 1 3 1 3 3 1 3 1 3 3 2 6 2 12 3 3 9 3 27 0 0 0 1 0 0 0 0 1 0 3 2 6 2 12 3 3 9 3 27 3 2 6 2 12 3 3 9 3 27 3 2 6 2 12 3 3 9 3 27
Coral Reefs Food provision 3 1 3 1 3 3 1 3 1 3 3 2 6 2 12 3 3 9 3 27 0 0 0 1 0 0 0 0 1 0 3 2 6 2 12 3 3 9 3 27 3 2 6 2 12 3 3 9 3 27 3 2 6 2 12 3 3 9 3 27
Coral Reefs Coastal protection 3 1 3 1 3 3 1 3 1 3 3 2 6 2 12 3 3 9 3 27 0 0 0 1 0 0 0 0 1 0 3 2 6 2 12 3 3 9 3 27 3 2 6 2 12 3 3 9 3 27 3 2 6 2 12 3 3 9 3 27
Coral Reefs Income and revenue source 3 1 3 1 3 3 1 3 1 3 3 2 6 2 12 3 3 9 3 27 0 0 0 1 0 0 0 0 1 0 3 2 6 2 12 3 3 9 3 27 3 2 6 2 12 3 3 9 3 27 3 2 6 2 12 3 3 9 3 27
Coral Reefs Fishing grounds 3 1 3 1 3 3 1 3 1 3 3 2 6 2 12 3 3 9 3 27 0 0 0 1 0 0 0 0 1 0 3 2 6 2 12 3 3 9 3 27 3 2 6 2 12 3 3 9 3 27 3 2 6 2 12 3 3 9 3 27
Coral Reefs Lime extraction 3 1 3 1 3 3 1 3 1 3 3 2 6 2 12 3 3 9 3 27 0 0 0 1 0 0 0 0 1 0 3 2 6 2 12 3 3 9 3 27 3 2 6 2 12 3 3 9 3 27 3 2 6 2 12 3 3 9 3 27
Coral Reefs Raw materials provision (coral rock) 3 1 3 1 3 3 1 3 1 3 3 2 6 2 12 3 3 9 3 27 0 0 0 1 0 0 0 0 1 0 3 2 6 2 12 3 3 9 3 27 3 2 6 2 12 3 3 9 3 27 3 2 6 2 12 3 3 9 3 27
Coral Reefs Cultural values (shells, ornaments) 3 1 3 1 3 3 1 3 1 3 3 2 6 2 12 3 3 9 3 27 0 0 0 1 0 0 0 0 1 0 3 2 6 2 12 3 3 9 3 27 3 2 6 2 12 3 3 9 3 27 3 2 6 2 12 3 3 9 3 27
Coral Reefs Recreation and leisure 3 1 3 1 3 3 1 3 1 3 3 2 6 2 12 3 3 9 3 27 0 0 0 1 0 0 0 0 1 0 3 2 6 2 12 3 3 9 3 27 3 2 6 2 12 3 3 9 3 27 3 2 6 2 12 3 3 9 3 27
Coral Reefs Kastom medicine 3 1 3 1 3 3 1 3 1 3 3 2 6 2 12 3 3 9 3 27 0 0 0 1 0 0 0 0 1 0 3 2 6 2 12 3 3 9 3 27 3 2 6 2 12 3 3 9 3 27 3 2 6 2 12 3 3 9 3 27
Coral Reefs Supports tourism industry 3 1 3 1 3 3 1 3 1 3 3 2 6 2 12 3 3 9 3 27 0 0 0 1 0 0 0 0 1 0 3 2 6 2 12 3 3 9 3 27 3 2 6 2 12 3 3 9 3 27 3 2 6 2 12 3 3 9 3 27
Coral Reefs Supports marine food chain 3 1 3 1 3 3 1 3 1 3 3 2 6 2 12 3 3 9 3 27 0 0 0 1 0 0 0 0 1 0 3 2 6 2 12 3 3 9 3 27 3 2 6 2 12 3 3 9 3 27 3 2 6 2 12 3 3 9 3 27
Coast line / Beach Support recreation/leisure 2 1 2 1 2 3 1 3 1 3 0 0 0 1 0 0 0 0 1 0 3 1 3 1 3 3 1 3 1 3 0 0 0 1 0 0 0 0 1 0 3 0 0 1 0 3 0 0 1 0 3 0 0 1 0 3 0 0 1 0
Coast line / Beach Waste disposal and dispersal 2 1 2 1 2 3 1 3 1 3 0 0 0 1 0 0 0 0 1 0 3 0 0 1 0 3 0 0 1 0 0 0 0 1 0 0 0 0 1 0 3 0 0 1 0 3 0 0 1 0 3 0 0 1 0 3 0 0 1 0
Coast line / Beach Domestic use (bathing) 2 1 2 1 2 3 1 3 1 3 0 0 0 1 0 0 0 0 1 0 3 1 3 1 3 3 1 3 1 3 0 0 0 1 0 0 0 0 1 0 3 0 0 1 0 3 0 0 1 0 3 0 0 1 0 3 0 0 1 0
Coast line / Beach Cultural values and handicrafts 2 1 2 2 4 3 1 3 2 6 0 0 0 1 0 0 0 0 1 0 3 1 3 1 3 3 1 3 1 3 0 0 0 1 0 0 0 0 1 0 3 0 0 1 0 3 0 0 1 0 3 0 0 1 0 3 0 0 1 0
Coast line / Beach Raw materials provision 2 1 2 2 4 3 1 3 2 6 0 0 0 1 0 0 0 0 1 0 3 1 3 1 3 3 1 3 1 3 0 0 0 1 0 0 0 0 1 0 3 0 0 1 0 3 0 0 1 0 3 0 0 1 0 3 0 0 1 0
Coast line / Beach Supports transport (boat landing) 2 1 2 1 2 3 1 3 1 3 0 0 0 1 0 0 0 0 1 0 3 0 0 1 0 3 0 0 1 0 0 0 0 1 0 0 0 0 1 0 3 0 0 1 0 3 0 0 1 0 3 0 0 1 0 3 0 0 1 0
Coast line / Beach Fauna habitat (e.g. turtle nesting) 2 3 6 3 18 3 3 9 3 27 0 0 0 1 0 0 0 0 1 0 3 0 0 3 0 3 0 0 3 0 0 0 0 1 0 0 0 0 1 0 3 1 3 1 3 3 2 6 2 12 3 1 3 1 3 3 2 6 2 12
Coast line / Beach Coastal protection 2 2 4 2 8 3 2 6 2 12 0 0 0 1 0 0 0 0 1 0 3 1 3 1 3 3 1 3 1 3 0 0 0 1 0 0 0 0 1 0 3 0 0 1 0 3 0 0 1 0 3 0 0 1 0 3 0 0 1 0
Mangroves Food provision 2 2 4 2 8 3 2 6 2 12 2 2 4 2 8 2 2 4 3 12 3 1 3 1 3 3 1 3 1 3 2 2 4 2 8 2 2 4 3 12 3 2 6 2 12 2 3 6 3 18 3 2 6 2 12 2 3 6 3 18
Mangroves Raw materials and fuel provision 2 3 6 2 12 3 3 9 2 18 2 1 2 2 4 2 1 2 3 6 3 1 3 1 3 3 1 3 1 3 2 1 2 2 4 2 1 2 3 6 2 1 2 2 4 2 2 4 3 12 2 1 2 2 4 2 2 4 3 12
Mangroves Fauna habitat 2 2 4 2 8 3 2 6 2 12 2 1 2 2 4 2 1 2 3 6 3 1 3 1 3 3 1 3 1 3 2 1 2 2 4 2 1 2 3 6 2 1 2 2 4 2 2 4 3 12 2 1 2 2 4 2 2 4 3 12
Mangroves Coastal protection, shoreline stabilisation 2 3 6 2 12 3 3 9 2 18 2 1 2 2 4 2 1 2 3 6 3 1 3 1 3 3 1 3 1 3 2 1 2 2 4 2 1 2 3 6 2 1 2 2 4 2 2 4 3 12 2 1 2 2 4 2 2 4 3 12
Mangroves Kastom medicine 2 3 6 2 12 3 3 9 2 18 2 1 2 2 4 2 1 2 3 6 3 1 3 1 3 3 1 3 1 3 2 1 2 2 4 2 1 2 3 6 2 1 2 2 4 2 2 4 3 12 2 1 2 2 4 2 2 4 3 12
Mangroves Recreation 2 1 2 2 4 3 1 3 2 6 2 0 0 2 0 2 0 0 3 0 3 1 3 1 3 3 1 3 1 3 2 0 0 2 0 2 0 0 3 0 2 0 0 2 0 2 0 0 3 0 2 0 0 2 0 2 0 0 3 0
Mangroves Waste disposal and dispersal 2 1 2 1 2 3 1 3 1 3 2 0 0 2 0 2 0 0 3 0 3 1 3 1 3 3 1 3 1 3 2 0 0 2 0 2 0 0 3 0 2 0 0 2 0 2 0 0 3 0 2 0 0 2 0 2 0 0 3 0
Mangroves Cultural values (crafts, dye) 2 2 4 2 8 3 2 6 2 12 2 1 2 2 4 2 1 2 3 6 3 1 3 1 3 3 1 3 1 3 2 1 2 2 4 2 1 2 3 6 2 1 2 2 4 2 2 4 3 12 2 1 2 2 4 2 2 4 3 12
Mangroves Carbon sequestration 2 3 6 2 12 3 3 9 2 18 2 1 2 2 4 2 1 2 3 6 3 1 3 1 3 3 1 3 1 3 2 1 2 2 4 2 1 2 3 6 2 1 2 2 4 2 2 4 3 12 2 1 2 2 4 2 2 4 3 12
Sea / Ocean Support transport 3 0 0 1 0 3 0 0 1 0 3 0 0 1 0 3 0 0 1 0 0 0 0 1 0 0 0 0 1 0 3 0 0 1 0 3 0 0 1 0 3 0 0 1 0 3 0 0 2 0 3 0 6 1 12 3 0 0 1 0
Sea / Ocean Habitat provision 3 0 0 1 0 3 0 0 1 0 3 2 6 2 12 3 2 6 3 18 0 0 0 1 0 0 0 0 1 0 3 2 6 2 12 3 2 6 3 18 3 2 6 2 12 3 3 9 3 27 3 2 6 2 12 3 3 9 3 27
Sea / Ocean Food provision 3 0 0 1 0 3 0 0 1 0 3 2 6 2 12 3 2 6 3 18 0 0 0 1 0 0 0 0 1 0 3 2 6 2 12 3 2 6 3 18 3 2 6 2 12 3 3 9 3 27 3 2 6 2 12 3 3 9 3 27
Sea / Ocean Climate and atmospheric regulation 3 0 0 1 0 3 0 0 1 0 3 2 6 2 12 3 2 6 3 18 0 0 0 1 0 0 0 0 1 0 3 2 6 2 12 3 2 6 3 18 3 2 6 2 12 3 3 9 3 27 3 2 6 2 12 3 3 9 3 27
Sea / Ocean Income and revenue generation 3 0 0 1 0 3 0 0 1 0 3 2 6 2 12 3 2 6 3 18 0 0 0 1 0 0 0 0 1 0 3 2 6 2 12 3 2 6 3 18 3 2 6 2 12 3 3 9 3 27 3 2 6 2 12 3 3 9 3 27
Mountains, Highlands Raw materials provision 0 3 0 3 0 0 3 0 3 0 0 0 0 1 0 0 0 0 1 0 3 1 3 1 3 3 1 3 1 3 0 0 0 1 0 0 0 0 1 0 3 1 3 1 3 3 2 6 2 12 3 1 3 1 3 3 2 6 2 12
Mountains, Highlands Habitat provision and biodiversity 0 3 0 3 0 0 3 0 3 0 0 0 0 1 0 0 0 0 1 0 3 1 3 1 3 3 1 3 1 3 0 0 0 1 0 0 0 0 1 0 3 1 3 1 3 3 2 6 2 12 3 1 3 1 3 3 2 6 2 12
Mountains, Highlands Water source 0 3 0 3 0 0 3 0 3 0 0 0 0 1 0 0 0 0 1 0 3 1 3 1 3 3 1 3 1 3 0 0 0 1 0 0 0 0 1 0 3 1 3 1 3 3 2 6 2 12 3 1 3 1 3 3 2 6 2 12
Mountains, Highlands Climatic regulation 0 3 0 3 0 0 3 0 3 0 0 0 0 1 0 0 0 0 1 0 3 0 0 1 0 3 0 0 1 0 0 0 0 1 0 0 0 0 1 0 3 1 3 1 3 3 2 6 2 12 3 1 3 1 3 3 2 6 2 12
Mountains, Highlands Provide protection from disasters 0 3 0 3 0 0 3 0 3 0 0 0 0 1 0 0 0 0 1 0 3 1 3 1 3 3 1 3 1 3 0 0 0 1 0 0 0 0 1 0 3 1 3 1 3 3 2 6 2 12 3 1 3 1 3 3 2 6 2 12
Mountains, Highlands Support navigation 0 3 0 3 0 0 3 0 3 0 0 0 0 1 0 0 0 0 1 0 3 0 0 1 0 3 0 0 1 0 0 0 0 1 0 0 0 0 1 0 3 0 0 1 0 3 0 0 1 0 3 0 0 1 0 3 0 0 1 0
Wetlands / Lakes / Sw amps Food provision 2 3 6 3 18 3 3 9 3 27 0 0 0 1 0 0 0 0 1 0 3 0 0 2 0 3 0 0 2 0 0 0 0 1 0 0 0 0 1 0 3 1 3 1 3 3 2 6 2 12 3 1 3 1 3 3 2 6 2 12
Wetlands / Lakes / Sw amps Water provision (drinking, domestic) 2 3 6 3 18 3 3 9 3 27 0 0 0 1 0 0 0 0 1 0 3 2 6 2 12 3 2 6 2 12 0 0 0 1 0 0 0 0 1 0 3 1 3 1 3 3 2 6 2 12 3 1 3 1 3 3 2 6 2 12
Wetlands / Lakes / Sw amps Habitat provision 2 3 6 3 18 3 3 9 3 27 0 0 0 1 0 0 0 0 1 0 3 0 0 2 0 3 0 0 2 0 0 0 0 1 0 0 0 0 1 0 3 1 3 1 3 3 2 6 2 12 3 1 3 1 3 3 2 6 2 12
Wetlands / Lakes / Sw amps Support aquaculture 2 3 6 3 18 3 3 9 3 27 0 0 0 1 0 0 0 0 1 0 3 0 0 2 0 3 0 0 2 0 0 0 0 1 0 0 0 0 1 0 3 1 3 1 3 3 2 6 2 12 3 1 3 1 3 3 2 6 2 12
Wetlands / Lakes / Sw amps Cultural values (heritage) 2 3 6 3 18 3 3 9 3 27 0 0 0 1 0 0 0 0 1 0 3 1 3 2 6 3 1 3 2 6 0 0 0 1 0 0 0 0 1 0 3 1 3 1 3 3 2 6 2 12 3 1 3 1 3 3 2 6 2 12
Wetlands / Lakes / Sw amps Water quality and f lood f low regulation 2 3 6 3 18 3 3 9 3 27 0 0 0 1 0 0 0 0 1 0 3 2 6 2 12 3 2 6 2 12 0 0 0 1 0 0 0 0 1 0 3 1 3 1 3 3 2 6 2 12 3 1 3 1 3 3 2 6 2 12
Seagrass and marine macroalgae (seaw eeds)Habitat provision 3 2 6 1 6 3 2 6 1 6 3 2 6 2 12 3 2 6 3 18 0 0 0 1 0 0 0 0 1 0 3 2 6 2 12 3 2 6 3 18 3 2 6 2 12 3 3 9 3 27 3 2 6 2 12 3 3 9 3 27
Seagrass and marine macroalgae (seaw eeds)Primary productivity 3 2 6 1 6 3 2 6 1 6 3 2 6 2 12 3 2 6 3 18 0 0 0 1 0 0 0 0 1 0 3 2 6 2 12 3 2 6 3 18 3 2 6 2 12 3 3 9 3 27 3 2 6 2 12 3 3 9 3 27
Seagrass and marine macroalgae (seaw eeds)Income generation ( seaw eed) 3 2 6 2 12 3 2 6 2 12 3 2 6 2 12 3 2 6 3 18 0 0 0 1 0 0 0 0 1 0 3 2 6 2 12 3 2 6 3 18 3 2 6 2 12 3 3 9 3 27 3 2 6 2 12 3 3 9 3 27
Seagrass and marine macroalgae (seaw eeds)Kastom medicine and food 3 2 6 2 12 3 2 6 2 12 3 2 6 2 12 3 2 6 3 18 0 0 0 1 0 0 0 0 1 0 3 2 6 2 12 3 2 6 3 18 3 2 6 2 12 3 3 9 3 27 3 2 6 2 12 3 3 9 3 27
Seagrass and marine macroalgae (seaw eeds)Seabed stabilisation 3 2 6 2 12 3 2 6 2 12 3 2 6 2 12 3 2 6 3 18 0 0 0 1 0 0 0 0 1 0 3 2 6 2 12 3 2 6 3 18 3 2 6 2 12 3 3 9 3 27 3 2 6 2 12 3 3 9 3 27
Groundw ater Water provision 2 3 6 3 18 3 3 9 3 27 0 0 0 1 0 0 0 0 1 0 3 1 3 1 3 3 1 3 1 3 0 0 0 1 0 0 0 0 1 0 3 1 3 1 3 3 2 6 2 12 3 1 3 1 3 3 2 6 2 12
Groundw ater Income generation (spring w ater) 2 3 6 3 18 3 3 9 3 27 0 0 0 1 0 0 0 0 1 0 3 1 3 1 3 3 1 3 1 3 0 0 0 1 0 0 0 0 1 0 3 1 3 1 3 3 2 6 2 12 3 1 3 1 3 3 2 6 2 12
Plantations and Gardens Income generation 2 3 6 1 6 3 3 9 1 9 0 0 0 1 0 0 0 0 1 0 3 1 3 1 3 3 1 3 1 3 0 0 0 1 0 0 0 0 1 0 3 1 3 1 3 3 2 6 2 12 3 1 3 1 3 3 2 6 2 12
Plantations and Gardens Food provision 2 3 6 1 6 3 3 9 1 9 0 0 0 1 0 0 0 0 1 0 3 1 3 1 3 3 1 3 1 3 0 0 0 1 0 0 0 0 1 0 3 1 3 1 3 3 2 6 2 12 3 1 3 1 3 3 2 6 2 12
- SLR of betw een approx.
7–18cm (very similar values
for different RCPs)
- Mean change: 13cm
- Confidence level is
medium
- SLR of betw een approx.
40–89 cm
- Mean change: 63cm
- Confidence level is
medium
- Median aragonite
saturation state w ill
continue to strongly decline
thereafter to values w here
coral reefs have not
historically been found (<
3.0).
- Mean change: -1.5 Ωar
- Confidence level is
medium
- Median aragonite
saturation state w ill
transition to marginal
conditions (3.5) around
2030.
- Mean change: -0.4 Ωar
- Confidence level is
medium
- Under all RCPs, the
w arming is up to 1.0°C
relative to 1995
- Mean change: 0.7’C
- Confidence level is very
high
- Under all RCP8.5, the
w arming is up to 2 - 4°C
- Mean change: 2.8'C
- Confidence level is very
high
- The current 1-in-20-year
daily rainfall amount is
projected to increase by
approx. 9 mm
- 3% increase in annual
rainfall
- Confidence level for
frequency and intensity of
extreme rainfall events is
high
- Rainfall to increase by
approx. 43 mm
- current 1-in-20-year daily
rainfall event w ill become,
on average, a 1-in-4- year
event
- 6% increase in annual
rainfall
- Confidence level for
frequency and intensity of
2030 RCP8.5 2090 RCP8.5
Sea surface temperatures average 27 to 30 deg C. No clear trends in rainfall since mid-1950s w ith
substantial variation in rainfall from year to year. Little
change in extreme daily rainfall over the same period.
70% of Honiara’s annual rainfall occurs in w et season
w ith average monthly rainfall of more than 300 mm. Dry
season monthly average is 100 mm. Santa Cruz
receives more constant rainfall during the year,
averaging 280 mm and 420 mm per month.
2090 RCP8.52030 RCP8.52090 RCP8.52030 RCP8.5 2030 RCP8.5 2090 RCP8.5
Ocean acidification
- sea level has risen by about 8 mm per year since 1993
(larger than the global average of 2.8–3.6 mm per year
possibly due to El Nino-Southern Oscillation)
-
Since 18th century level of ocean acidif ication has been
slow ly increasing
SLR Extreme rainfall event Increasing sea temperature
- Under all RCPs, the
w arming is up to 1.0°C,
relative to 1995
- Mean change: 0.7’C
- Confidence level is very
high
- Under all RCP8.5, the
w arming is up to 2 - 4°C
- Mean change: 2.8'C
- Confidence level is very
high
- Temp on extremely hot
days is projected to
increase by about the same
amount as average temp
- Frequency of extremely
hot days is also expected
to increase.
- Temp of the 1-in-20-year
hot day is projected to
increase by approx. 0.8°C
- Projected hot day temp
increase and frequency is
expected to increase as
per 2030.
- Temp of the 1-in-20-year
hot day is projected to
increase by approximately
2.9°C
- Confidence level is very
high
Increasing Air Temperature Extreme Air Temperature
Temperatures are relatively constant throughout the
year. Average temperature ranges from 26-27 deg C.
Max temperatures range from 29-31 deg C.
2030 RCP8.5 2090 RCP8.5 2030 RCP8.5 2090 RCP8.5

Solomon Islands ESRAM: Volume 1 ESRAM Introduction and National Assessment C-1
Climate Variable
Current Climate
Time Slice and Scenario
Projection
Ecosystem Ecosystem Service
SLR
203
0
SLR
203
0
SLR
203
0
SLR
203
0
SLR
203
0
SLR
209
0
SLR
209
0
SLR
209
0
SLR
209
0
SLR
209
0
Sea
temp
203
0
Sea
temp
203
0
Sea
temp
203
0
Sea
temp
203
0
Sea
temp
203
0
Sea
temp
209
0
Sea
temp
209
0
Sea
temp
209
0
Sea
temp
209
0
Sea
temp
209
0
Extr
eme
rainf
all
203
0
Extr
eme
rainf
all
203
0
Extr
eme
rainf
all
203
0
Extr
eme
rainf
all
203
0
Extr
eme
rainf
all
203
0
Extr
eme
rainf
all
209
0
Extr
eme
rainf
all
209
0
Extr
eme
rainf
all
209
0
Extr
eme
rainf
all
209
0
Extr
eme
rainf
all
209
0
Oce
an
Acid
if icat
ion
203
0
Oce
an
Acid
if icat
ion
203
0
Oce
an
Acid
if icat
ion
203
0
Oce
an
Acid
if icat
ion
203
0
Oce
an
Acid
if icat
ion
203
0
Oce
an
Acid
if icat
ion
209
0
Oce
an
Acid
if icat
ion
209
0
Oce
an
Acid
if icat
ion
209
0
Oce
an
Acid
if icat
ion
209
0
Oce
an
Acid
if icat
ion
209
0
Incr
easi
ng
Air
Tem
p
203
0
Incr
easi
ng
Air
Tem
p
203
0
Incr
easi
ng
Air
Tem
p
203
0
Incr
easi
ng
Air
Tem
p
203
0
Incr
easi
ng
Air
Tem
p
203
0
Incr
easi
ng
Air
Tem
p
209
0
Incr
easi
ng
Air
Tem
p
209
0
Incr
easi
ng
Air
Tem
p
209
0
Incr
easi
ng
Air
Tem
p
209
0
Incr
easi
ng
Air
Tem
p
209
0
Extr
eme
Air
Tem
p
203
0
Extr
eme
Air
Tem
p
203
0
Extr
eme
Air
Tem
p
203
0
Extr
eme
Air
Tem
p
203
0
Extr
eme
Air
Tem
p
203
0
Extr
eme
Air
Tem
p
209
0
Extr
eme
Air
Tem
p
209
0
Extr
eme
Air
Tem
p
209
0
Extr
eme
Air
Tem
p
209
0
Extr
eme
Air
Tem
p
209
0
E S PI AC V E S PI AC V E S PI AC V E S PI AC V E S PI AC V E S PI AC V E S PI AC V E S PI AC V E S PI AC V E S PI AC V E S PI AC V E S PI AC V
Rivers, streams Food provision 1 3 3 3 9 2 3 6 3 18 0 0 0 1 0 0 0 0 1 0 3 1 3 1 3 3 1 3 1 3 0 0 0 1 0 0 0 0 1 0 3 1 3 1 3 3 2 6 2 12 3 1 3 1 3 3 2 6 2 12
Rivers, streams Water supply (drinking and domestic) 1 3 3 3 9 2 3 6 3 18 0 0 0 1 0 0 0 0 1 0 3 2 6 3 18 3 2 6 3 18 0 0 0 1 0 0 0 0 1 0 3 1 3 1 3 3 2 6 2 12 3 1 3 1 3 3 2 6 2 12
Rivers, streams Water supply (irrigation) 1 3 3 3 9 2 3 6 3 18 0 0 0 1 0 0 0 0 1 0 3 2 6 3 18 3 2 6 3 18 0 0 0 1 0 0 0 0 1 0 3 1 3 1 3 3 2 6 2 12 3 1 3 1 3 3 2 6 2 12
Rivers, streams Recreation 1 1 1 3 3 2 1 2 3 6 0 0 0 1 0 0 0 0 1 0 3 2 6 1 6 3 2 6 1 6 0 0 0 1 0 0 0 0 1 0 3 0 0 1 0 3 0 0 1 0 3 0 0 1 0 3 0 0 1 0
Rivers, streams Transportation, anchorage 1 1 1 1 1 2 1 2 1 2 0 0 0 1 0 0 0 0 1 0 3 1 3 1 3 3 1 3 1 3 0 0 0 1 0 0 0 0 1 0 3 0 0 1 0 3 0 0 1 0 3 0 0 1 0 3 0 0 1 0
Rivers, streams Raw materials provision 1 3 3 3 9 2 2 4 3 12 0 0 0 1 0 0 0 0 1 0 3 1 3 1 3 3 1 3 1 3 0 0 0 1 0 0 0 0 1 0 3 1 3 1 3 3 2 6 2 12 3 1 3 1 3 3 2 6 2 12
Rivers, streams Energy generation (hydropow er) 1 1 1 3 3 2 1 2 2 4 0 0 0 1 0 0 0 0 1 0 3 1 3 1 3 3 1 3 3 9 0 0 0 1 0 0 0 0 1 0 3 0 0 1 0 3 0 0 1 0 3 0 0 1 0 3 0 0 1 0
Rivers, streams Cultural values 1 1 1 2 2 2 2 4 2 8 0 0 0 1 0 0 0 0 1 0 3 2 6 1 6 3 2 6 3 18 0 0 0 1 0 0 0 0 1 0 3 1 3 1 3 3 2 6 2 12 3 1 3 1 3 3 2 6 2 12
Rivers, streams Waste disposal and dispersal 1 1 1 1 1 2 1 2 1 2 0 0 0 1 0 0 0 0 1 0 3 1 3 1 3 3 1 3 1 3 0 0 0 1 0 0 0 0 1 0 3 0 0 1 0 3 0 0 1 0 3 0 0 1 0 3 0 0 1 0
Rivers, streams Support f isheries 1 3 3 3 9 2 3 6 3 18 0 0 0 1 0 0 0 0 1 0 3 1 3 1 3 3 1 3 1 3 0 0 0 1 0 0 0 0 1 0 3 1 3 1 3 3 2 6 2 12 3 1 3 1 3 3 2 6 2 12
Rivers, streams Habitat provision, biodiversity 1 3 3 3 9 2 3 6 3 18 0 0 0 1 0 0 0 0 1 0 3 1 3 1 3 3 1 3 1 3 0 0 0 1 0 0 0 0 1 0 3 1 3 1 3 3 2 6 2 12 3 1 3 1 3 3 2 6 2 12
Terrestrial Forests, Vegetation Raw materials and fuel provision 0 3 0 3 0 1 3 3 3 9 0 0 0 1 0 0 0 0 1 0 3 1 3 1 3 3 1 3 1 3 0 0 0 1 0 0 0 0 1 0 3 1 3 1 3 3 2 6 2 12 3 1 3 1 3 3 2 6 2 12
Terrestrial Forests, Vegetation Fauna habitat 0 3 0 3 0 1 3 3 3 9 0 0 0 1 0 0 0 0 1 0 3 1 3 1 3 3 1 3 1 3 0 0 0 1 0 0 0 0 1 0 3 1 3 1 3 3 2 6 2 12 3 1 3 1 3 3 2 6 2 12
Terrestrial Forests, Vegetation Kastom medicine provision 0 3 0 3 0 1 3 3 3 9 0 0 0 1 0 0 0 0 1 0 3 1 3 1 3 3 1 3 1 3 0 0 0 1 0 0 0 0 1 0 3 1 3 1 3 3 2 6 2 12 3 1 3 1 3 3 2 6 2 12
Terrestrial Forests, Vegetation Source of income/revenue 0 3 0 3 0 1 3 3 3 9 0 0 0 1 0 0 0 0 1 0 3 1 3 1 3 3 1 3 1 3 0 0 0 1 0 0 0 0 1 0 3 1 3 1 3 3 2 6 2 12 3 1 3 1 3 3 2 6 2 12
Terrestrial Forests, Vegetation Carbon sequestration 0 3 0 3 0 1 3 3 3 9 0 0 0 1 0 0 0 0 1 0 3 1 3 1 3 3 1 3 1 3 0 0 0 1 0 0 0 0 1 0 3 1 3 1 3 3 2 6 2 12 3 1 3 1 3 3 2 6 2 12
Terrestrial Forests, Vegetation Nutrient cycling and primary productivity 0 3 0 3 0 1 3 3 3 9 0 0 0 1 0 0 0 0 1 0 3 1 3 1 3 3 1 3 1 3 0 0 0 1 0 0 0 0 1 0 3 1 3 1 3 3 2 6 2 12 3 1 3 1 3 3 2 6 2 12
Terrestrial Forests, Vegetation Soil retention and fertility 0 3 0 3 0 1 3 3 3 9 0 0 0 1 0 0 0 0 1 0 3 1 3 1 3 3 1 3 1 3 0 0 0 1 0 0 0 0 1 0 3 1 3 1 3 3 2 6 2 12 3 1 3 1 3 3 2 6 2 12
Terrestrial Forests, Vegetation Air regulation and shade provision 0 3 0 3 0 1 3 3 3 9 0 0 0 1 0 0 0 0 1 0 3 1 3 1 3 3 1 3 1 3 0 0 0 1 0 0 0 0 1 0 3 1 3 1 3 3 2 6 2 12 3 1 3 1 3 3 2 6 2 12
Terrestrial Forests, Vegetation Support recreation and tourism 0 3 0 3 0 1 3 3 3 9 0 0 0 1 0 0 0 0 1 0 3 1 3 1 3 3 1 3 1 3 0 0 0 1 0 0 0 0 1 0 3 1 3 1 3 3 2 6 2 12 3 1 3 1 3 3 2 6 2 12
Terrestrial Forests, Vegetation Cultural values and handicrafts 0 3 0 3 0 1 3 3 3 9 0 0 0 1 0 0 0 0 1 0 3 1 3 1 3 3 1 3 1 3 0 0 0 1 0 0 0 0 1 0 3 1 3 1 3 3 2 6 2 12 3 1 3 1 3 3 2 6 2 12
Terrestrial Forests, Vegetation Food provision 0 2 0 2 0 1 2 2 2 4 0 0 0 1 0 0 0 0 1 0 3 1 3 1 3 3 1 3 1 3 0 0 0 1 0 0 0 0 1 0 3 1 3 1 3 3 2 6 2 12 3 1 3 1 3 3 2 6 2 12
Other terrrestrial land Commercial value (incl. agriculture) 0 3 0 3 0 1 3 3 3 9 0 0 0 1 0 0 0 0 1 0 3 1 3 1 3 3 1 3 1 3 0 0 0 1 0 0 0 0 1 0 3 1 3 1 3 3 1 3 2 6 3 1 3 2 6 3 1 3 2 6
Other terrrestrial land Provides identity and heritage 0 3 0 3 0 1 3 3 3 9 0 0 0 1 0 0 0 0 1 0 3 1 3 1 3 3 1 3 1 3 0 0 0 1 0 0 0 0 1 0 3 1 3 1 3 3 1 3 1 3 3 1 3 1 3 3 1 3 1 3
Other terrrestrial land Support forests 0 3 0 3 0 1 3 3 3 9 0 0 0 1 0 0 0 0 1 0 3 1 3 1 3 3 1 3 1 3 0 0 0 1 0 0 0 0 1 0 3 1 3 1 3 3 1 3 2 6 3 1 3 2 6 3 1 3 2 6
Other terrrestrial land Minerals source (mining industry) 0 3 0 3 0 1 3 3 3 9 0 0 0 1 0 0 0 0 1 0 3 1 3 1 3 3 1 3 1 3 0 0 0 1 0 0 0 0 1 0 3 1 3 1 3 3 1 3 1 3 3 1 3 1 3 3 1 3 1 3
Other terrrestrial land Land provision 0 3 0 3 0 1 3 3 3 9 0 0 0 1 0 0 0 0 1 0 3 1 3 1 3 3 1 3 1 3 0 0 0 1 0 0 0 0 1 0 3 1 3 1 3 3 1 3 2 6 3 1 3 2 6 3 1 3 2 6
Coral Reefs Habitat provision / biodiversity 3 1 3 1 3 3 1 3 1 3 3 2 6 2 12 3 3 9 3 27 0 0 0 1 0 0 0 0 1 0 3 2 6 2 12 3 3 9 3 27 3 2 6 2 12 3 3 9 3 27 3 2 6 2 12 3 3 9 3 27
Coral Reefs Food provision 3 1 3 1 3 3 1 3 1 3 3 2 6 2 12 3 3 9 3 27 0 0 0 1 0 0 0 0 1 0 3 2 6 2 12 3 3 9 3 27 3 2 6 2 12 3 3 9 3 27 3 2 6 2 12 3 3 9 3 27
Coral Reefs Coastal protection 3 1 3 1 3 3 1 3 1 3 3 2 6 2 12 3 3 9 3 27 0 0 0 1 0 0 0 0 1 0 3 2 6 2 12 3 3 9 3 27 3 2 6 2 12 3 3 9 3 27 3 2 6 2 12 3 3 9 3 27
Coral Reefs Income and revenue source 3 1 3 1 3 3 1 3 1 3 3 2 6 2 12 3 3 9 3 27 0 0 0 1 0 0 0 0 1 0 3 2 6 2 12 3 3 9 3 27 3 2 6 2 12 3 3 9 3 27 3 2 6 2 12 3 3 9 3 27
Coral Reefs Fishing grounds 3 1 3 1 3 3 1 3 1 3 3 2 6 2 12 3 3 9 3 27 0 0 0 1 0 0 0 0 1 0 3 2 6 2 12 3 3 9 3 27 3 2 6 2 12 3 3 9 3 27 3 2 6 2 12 3 3 9 3 27
Coral Reefs Lime extraction 3 1 3 1 3 3 1 3 1 3 3 2 6 2 12 3 3 9 3 27 0 0 0 1 0 0 0 0 1 0 3 2 6 2 12 3 3 9 3 27 3 2 6 2 12 3 3 9 3 27 3 2 6 2 12 3 3 9 3 27
Coral Reefs Raw materials provision (coral rock) 3 1 3 1 3 3 1 3 1 3 3 2 6 2 12 3 3 9 3 27 0 0 0 1 0 0 0 0 1 0 3 2 6 2 12 3 3 9 3 27 3 2 6 2 12 3 3 9 3 27 3 2 6 2 12 3 3 9 3 27
Coral Reefs Cultural values (shells, ornaments) 3 1 3 1 3 3 1 3 1 3 3 2 6 2 12 3 3 9 3 27 0 0 0 1 0 0 0 0 1 0 3 2 6 2 12 3 3 9 3 27 3 2 6 2 12 3 3 9 3 27 3 2 6 2 12 3 3 9 3 27
Coral Reefs Recreation and leisure 3 1 3 1 3 3 1 3 1 3 3 2 6 2 12 3 3 9 3 27 0 0 0 1 0 0 0 0 1 0 3 2 6 2 12 3 3 9 3 27 3 2 6 2 12 3 3 9 3 27 3 2 6 2 12 3 3 9 3 27
Coral Reefs Kastom medicine 3 1 3 1 3 3 1 3 1 3 3 2 6 2 12 3 3 9 3 27 0 0 0 1 0 0 0 0 1 0 3 2 6 2 12 3 3 9 3 27 3 2 6 2 12 3 3 9 3 27 3 2 6 2 12 3 3 9 3 27
Coral Reefs Supports tourism industry 3 1 3 1 3 3 1 3 1 3 3 2 6 2 12 3 3 9 3 27 0 0 0 1 0 0 0 0 1 0 3 2 6 2 12 3 3 9 3 27 3 2 6 2 12 3 3 9 3 27 3 2 6 2 12 3 3 9 3 27
Coral Reefs Supports marine food chain 3 1 3 1 3 3 1 3 1 3 3 2 6 2 12 3 3 9 3 27 0 0 0 1 0 0 0 0 1 0 3 2 6 2 12 3 3 9 3 27 3 2 6 2 12 3 3 9 3 27 3 2 6 2 12 3 3 9 3 27
Coast line / Beach Support recreation/leisure 2 1 2 1 2 3 1 3 1 3 0 0 0 1 0 0 0 0 1 0 3 1 3 1 3 3 1 3 1 3 0 0 0 1 0 0 0 0 1 0 3 0 0 1 0 3 0 0 1 0 3 0 0 1 0 3 0 0 1 0
Coast line / Beach Waste disposal and dispersal 2 1 2 1 2 3 1 3 1 3 0 0 0 1 0 0 0 0 1 0 3 0 0 1 0 3 0 0 1 0 0 0 0 1 0 0 0 0 1 0 3 0 0 1 0 3 0 0 1 0 3 0 0 1 0 3 0 0 1 0
Coast line / Beach Domestic use (bathing) 2 1 2 1 2 3 1 3 1 3 0 0 0 1 0 0 0 0 1 0 3 1 3 1 3 3 1 3 1 3 0 0 0 1 0 0 0 0 1 0 3 0 0 1 0 3 0 0 1 0 3 0 0 1 0 3 0 0 1 0
Coast line / Beach Cultural values and handicrafts 2 1 2 2 4 3 1 3 2 6 0 0 0 1 0 0 0 0 1 0 3 1 3 1 3 3 1 3 1 3 0 0 0 1 0 0 0 0 1 0 3 0 0 1 0 3 0 0 1 0 3 0 0 1 0 3 0 0 1 0
Coast line / Beach Raw materials provision 2 1 2 2 4 3 1 3 2 6 0 0 0 1 0 0 0 0 1 0 3 1 3 1 3 3 1 3 1 3 0 0 0 1 0 0 0 0 1 0 3 0 0 1 0 3 0 0 1 0 3 0 0 1 0 3 0 0 1 0
Coast line / Beach Supports transport (boat landing) 2 1 2 1 2 3 1 3 1 3 0 0 0 1 0 0 0 0 1 0 3 0 0 1 0 3 0 0 1 0 0 0 0 1 0 0 0 0 1 0 3 0 0 1 0 3 0 0 1 0 3 0 0 1 0 3 0 0 1 0
Coast line / Beach Fauna habitat (e.g. turtle nesting) 2 3 6 3 18 3 3 9 3 27 0 0 0 1 0 0 0 0 1 0 3 0 0 3 0 3 0 0 3 0 0 0 0 1 0 0 0 0 1 0 3 1 3 1 3 3 2 6 2 12 3 1 3 1 3 3 2 6 2 12
Coast line / Beach Coastal protection 2 2 4 2 8 3 2 6 2 12 0 0 0 1 0 0 0 0 1 0 3 1 3 1 3 3 1 3 1 3 0 0 0 1 0 0 0 0 1 0 3 0 0 1 0 3 0 0 1 0 3 0 0 1 0 3 0 0 1 0
Mangroves Food provision 2 2 4 2 8 3 2 6 2 12 2 2 4 2 8 2 2 4 3 12 3 1 3 1 3 3 1 3 1 3 2 2 4 2 8 2 2 4 3 12 3 2 6 2 12 2 3 6 3 18 3 2 6 2 12 2 3 6 3 18
Mangroves Raw materials and fuel provision 2 3 6 2 12 3 3 9 2 18 2 1 2 2 4 2 1 2 3 6 3 1 3 1 3 3 1 3 1 3 2 1 2 2 4 2 1 2 3 6 2 1 2 2 4 2 2 4 3 12 2 1 2 2 4 2 2 4 3 12
Mangroves Fauna habitat 2 2 4 2 8 3 2 6 2 12 2 1 2 2 4 2 1 2 3 6 3 1 3 1 3 3 1 3 1 3 2 1 2 2 4 2 1 2 3 6 2 1 2 2 4 2 2 4 3 12 2 1 2 2 4 2 2 4 3 12
Mangroves Coastal protection, shoreline stabilisation 2 3 6 2 12 3 3 9 2 18 2 1 2 2 4 2 1 2 3 6 3 1 3 1 3 3 1 3 1 3 2 1 2 2 4 2 1 2 3 6 2 1 2 2 4 2 2 4 3 12 2 1 2 2 4 2 2 4 3 12
Mangroves Kastom medicine 2 3 6 2 12 3 3 9 2 18 2 1 2 2 4 2 1 2 3 6 3 1 3 1 3 3 1 3 1 3 2 1 2 2 4 2 1 2 3 6 2 1 2 2 4 2 2 4 3 12 2 1 2 2 4 2 2 4 3 12
Mangroves Recreation 2 1 2 2 4 3 1 3 2 6 2 0 0 2 0 2 0 0 3 0 3 1 3 1 3 3 1 3 1 3 2 0 0 2 0 2 0 0 3 0 2 0 0 2 0 2 0 0 3 0 2 0 0 2 0 2 0 0 3 0
Mangroves Waste disposal and dispersal 2 1 2 1 2 3 1 3 1 3 2 0 0 2 0 2 0 0 3 0 3 1 3 1 3 3 1 3 1 3 2 0 0 2 0 2 0 0 3 0 2 0 0 2 0 2 0 0 3 0 2 0 0 2 0 2 0 0 3 0
Mangroves Cultural values (crafts, dye) 2 2 4 2 8 3 2 6 2 12 2 1 2 2 4 2 1 2 3 6 3 1 3 1 3 3 1 3 1 3 2 1 2 2 4 2 1 2 3 6 2 1 2 2 4 2 2 4 3 12 2 1 2 2 4 2 2 4 3 12
Mangroves Carbon sequestration 2 3 6 2 12 3 3 9 2 18 2 1 2 2 4 2 1 2 3 6 3 1 3 1 3 3 1 3 1 3 2 1 2 2 4 2 1 2 3 6 2 1 2 2 4 2 2 4 3 12 2 1 2 2 4 2 2 4 3 12
Sea / Ocean Support transport 3 0 0 1 0 3 0 0 1 0 3 0 0 1 0 3 0 0 1 0 0 0 0 1 0 0 0 0 1 0 3 0 0 1 0 3 0 0 1 0 3 0 0 1 0 3 0 0 2 0 3 0 6 1 12 3 0 0 1 0
Sea / Ocean Habitat provision 3 0 0 1 0 3 0 0 1 0 3 2 6 2 12 3 2 6 3 18 0 0 0 1 0 0 0 0 1 0 3 2 6 2 12 3 2 6 3 18 3 2 6 2 12 3 3 9 3 27 3 2 6 2 12 3 3 9 3 27
Sea / Ocean Food provision 3 0 0 1 0 3 0 0 1 0 3 2 6 2 12 3 2 6 3 18 0 0 0 1 0 0 0 0 1 0 3 2 6 2 12 3 2 6 3 18 3 2 6 2 12 3 3 9 3 27 3 2 6 2 12 3 3 9 3 27
Sea / Ocean Climate and atmospheric regulation 3 0 0 1 0 3 0 0 1 0 3 2 6 2 12 3 2 6 3 18 0 0 0 1 0 0 0 0 1 0 3 2 6 2 12 3 2 6 3 18 3 2 6 2 12 3 3 9 3 27 3 2 6 2 12 3 3 9 3 27
Sea / Ocean Income and revenue generation 3 0 0 1 0 3 0 0 1 0 3 2 6 2 12 3 2 6 3 18 0 0 0 1 0 0 0 0 1 0 3 2 6 2 12 3 2 6 3 18 3 2 6 2 12 3 3 9 3 27 3 2 6 2 12 3 3 9 3 27
Mountains, Highlands Raw materials provision 0 3 0 3 0 0 3 0 3 0 0 0 0 1 0 0 0 0 1 0 3 1 3 1 3 3 1 3 1 3 0 0 0 1 0 0 0 0 1 0 3 1 3 1 3 3 2 6 2 12 3 1 3 1 3 3 2 6 2 12
Mountains, Highlands Habitat provision and biodiversity 0 3 0 3 0 0 3 0 3 0 0 0 0 1 0 0 0 0 1 0 3 1 3 1 3 3 1 3 1 3 0 0 0 1 0 0 0 0 1 0 3 1 3 1 3 3 2 6 2 12 3 1 3 1 3 3 2 6 2 12
Mountains, Highlands Water source 0 3 0 3 0 0 3 0 3 0 0 0 0 1 0 0 0 0 1 0 3 1 3 1 3 3 1 3 1 3 0 0 0 1 0 0 0 0 1 0 3 1 3 1 3 3 2 6 2 12 3 1 3 1 3 3 2 6 2 12
Mountains, Highlands Climatic regulation 0 3 0 3 0 0 3 0 3 0 0 0 0 1 0 0 0 0 1 0 3 0 0 1 0 3 0 0 1 0 0 0 0 1 0 0 0 0 1 0 3 1 3 1 3 3 2 6 2 12 3 1 3 1 3 3 2 6 2 12
Mountains, Highlands Provide protection from disasters 0 3 0 3 0 0 3 0 3 0 0 0 0 1 0 0 0 0 1 0 3 1 3 1 3 3 1 3 1 3 0 0 0 1 0 0 0 0 1 0 3 1 3 1 3 3 2 6 2 12 3 1 3 1 3 3 2 6 2 12
Mountains, Highlands Support navigation 0 3 0 3 0 0 3 0 3 0 0 0 0 1 0 0 0 0 1 0 3 0 0 1 0 3 0 0 1 0 0 0 0 1 0 0 0 0 1 0 3 0 0 1 0 3 0 0 1 0 3 0 0 1 0 3 0 0 1 0
Wetlands / Lakes / Sw amps Food provision 2 3 6 3 18 3 3 9 3 27 0 0 0 1 0 0 0 0 1 0 3 0 0 2 0 3 0 0 2 0 0 0 0 1 0 0 0 0 1 0 3 1 3 1 3 3 2 6 2 12 3 1 3 1 3 3 2 6 2 12
Wetlands / Lakes / Sw amps Water provision (drinking, domestic) 2 3 6 3 18 3 3 9 3 27 0 0 0 1 0 0 0 0 1 0 3 2 6 2 12 3 2 6 2 12 0 0 0 1 0 0 0 0 1 0 3 1 3 1 3 3 2 6 2 12 3 1 3 1 3 3 2 6 2 12
Wetlands / Lakes / Sw amps Habitat provision 2 3 6 3 18 3 3 9 3 27 0 0 0 1 0 0 0 0 1 0 3 0 0 2 0 3 0 0 2 0 0 0 0 1 0 0 0 0 1 0 3 1 3 1 3 3 2 6 2 12 3 1 3 1 3 3 2 6 2 12
Wetlands / Lakes / Sw amps Support aquaculture 2 3 6 3 18 3 3 9 3 27 0 0 0 1 0 0 0 0 1 0 3 0 0 2 0 3 0 0 2 0 0 0 0 1 0 0 0 0 1 0 3 1 3 1 3 3 2 6 2 12 3 1 3 1 3 3 2 6 2 12
Wetlands / Lakes / Sw amps Cultural values (heritage) 2 3 6 3 18 3 3 9 3 27 0 0 0 1 0 0 0 0 1 0 3 1 3 2 6 3 1 3 2 6 0 0 0 1 0 0 0 0 1 0 3 1 3 1 3 3 2 6 2 12 3 1 3 1 3 3 2 6 2 12
Wetlands / Lakes / Sw amps Water quality and f lood f low regulation 2 3 6 3 18 3 3 9 3 27 0 0 0 1 0 0 0 0 1 0 3 2 6 2 12 3 2 6 2 12 0 0 0 1 0 0 0 0 1 0 3 1 3 1 3 3 2 6 2 12 3 1 3 1 3 3 2 6 2 12
Seagrass and marine macroalgae (seaw eeds)Habitat provision 3 2 6 1 6 3 2 6 1 6 3 2 6 2 12 3 2 6 3 18 0 0 0 1 0 0 0 0 1 0 3 2 6 2 12 3 2 6 3 18 3 2 6 2 12 3 3 9 3 27 3 2 6 2 12 3 3 9 3 27
Seagrass and marine macroalgae (seaw eeds)Primary productivity 3 2 6 1 6 3 2 6 1 6 3 2 6 2 12 3 2 6 3 18 0 0 0 1 0 0 0 0 1 0 3 2 6 2 12 3 2 6 3 18 3 2 6 2 12 3 3 9 3 27 3 2 6 2 12 3 3 9 3 27
Seagrass and marine macroalgae (seaw eeds)Income generation ( seaw eed) 3 2 6 2 12 3 2 6 2 12 3 2 6 2 12 3 2 6 3 18 0 0 0 1 0 0 0 0 1 0 3 2 6 2 12 3 2 6 3 18 3 2 6 2 12 3 3 9 3 27 3 2 6 2 12 3 3 9 3 27
Seagrass and marine macroalgae (seaw eeds)Kastom medicine and food 3 2 6 2 12 3 2 6 2 12 3 2 6 2 12 3 2 6 3 18 0 0 0 1 0 0 0 0 1 0 3 2 6 2 12 3 2 6 3 18 3 2 6 2 12 3 3 9 3 27 3 2 6 2 12 3 3 9 3 27
Seagrass and marine macroalgae (seaw eeds)Seabed stabilisation 3 2 6 2 12 3 2 6 2 12 3 2 6 2 12 3 2 6 3 18 0 0 0 1 0 0 0 0 1 0 3 2 6 2 12 3 2 6 3 18 3 2 6 2 12 3 3 9 3 27 3 2 6 2 12 3 3 9 3 27
Groundw ater Water provision 2 3 6 3 18 3 3 9 3 27 0 0 0 1 0 0 0 0 1 0 3 1 3 1 3 3 1 3 1 3 0 0 0 1 0 0 0 0 1 0 3 1 3 1 3 3 2 6 2 12 3 1 3 1 3 3 2 6 2 12
Groundw ater Income generation (spring w ater) 2 3 6 3 18 3 3 9 3 27 0 0 0 1 0 0 0 0 1 0 3 1 3 1 3 3 1 3 1 3 0 0 0 1 0 0 0 0 1 0 3 1 3 1 3 3 2 6 2 12 3 1 3 1 3 3 2 6 2 12
Plantations and Gardens Income generation 2 3 6 1 6 3 3 9 1 9 0 0 0 1 0 0 0 0 1 0 3 1 3 1 3 3 1 3 1 3 0 0 0 1 0 0 0 0 1 0 3 1 3 1 3 3 2 6 2 12 3 1 3 1 3 3 2 6 2 12
Plantations and Gardens Food provision 2 3 6 1 6 3 3 9 1 9 0 0 0 1 0 0 0 0 1 0 3 1 3 1 3 3 1 3 1 3 0 0 0 1 0 0 0 0 1 0 3 1 3 1 3 3 2 6 2 12 3 1 3 1 3 3 2 6 2 12
- SLR of betw een approx.
7–18cm (very similar values
for different RCPs)
- Mean change: 13cm
- Confidence level is
medium
- SLR of betw een approx.
40–89 cm
- Mean change: 63cm
- Confidence level is
medium
- Median aragonite
saturation state w ill
continue to strongly decline
thereafter to values w here
coral reefs have not
historically been found (<
3.0).
- Mean change: -1.5 Ωar
- Confidence level is
medium
- Median aragonite
saturation state w ill
transition to marginal
conditions (3.5) around
2030.
- Mean change: -0.4 Ωar
- Confidence level is
medium
- Under all RCPs, the
w arming is up to 1.0°C
relative to 1995
- Mean change: 0.7’C
- Confidence level is very
high
- Under all RCP8.5, the
w arming is up to 2 - 4°C
- Mean change: 2.8'C
- Confidence level is very
high
- The current 1-in-20-year
daily rainfall amount is
projected to increase by
approx. 9 mm
- 3% increase in annual
rainfall
- Confidence level for
frequency and intensity of
extreme rainfall events is
high
- Rainfall to increase by
approx. 43 mm
- current 1-in-20-year daily
rainfall event w ill become,
on average, a 1-in-4- year
event
- 6% increase in annual
rainfall
- Confidence level for
frequency and intensity of
2030 RCP8.5 2090 RCP8.5
Sea surface temperatures average 27 to 30 deg C. No clear trends in rainfall since mid-1950s w ith
substantial variation in rainfall from year to year. Little
change in extreme daily rainfall over the same period.
70% of Honiara’s annual rainfall occurs in w et season
w ith average monthly rainfall of more than 300 mm. Dry
season monthly average is 100 mm. Santa Cruz
receives more constant rainfall during the year,
averaging 280 mm and 420 mm per month.
2090 RCP8.52030 RCP8.52090 RCP8.52030 RCP8.5 2030 RCP8.5 2090 RCP8.5
Ocean acidification
- sea level has risen by about 8 mm per year since 1993
(larger than the global average of 2.8–3.6 mm per year
possibly due to El Nino-Southern Oscillation)
-
Since 18th century level of ocean acidif ication has been
slow ly increasing
SLR Extreme rainfall event Increasing sea temperature
- Under all RCPs, the
w arming is up to 1.0°C,
relative to 1995
- Mean change: 0.7’C
- Confidence level is very
high
- Under all RCP8.5, the
w arming is up to 2 - 4°C
- Mean change: 2.8'C
- Confidence level is very
high
- Temp on extremely hot
days is projected to
increase by about the same
amount as average temp
- Frequency of extremely
hot days is also expected
to increase.
- Temp of the 1-in-20-year
hot day is projected to
increase by approx. 0.8°C
- Projected hot day temp
increase and frequency is
expected to increase as
per 2030.
- Temp of the 1-in-20-year
hot day is projected to
increase by approximately
2.9°C
- Confidence level is very
high
Increasing Air Temperature Extreme Air Temperature
Temperatures are relatively constant throughout the
year. Average temperature ranges from 26-27 deg C.
Max temperatures range from 29-31 deg C.
2030 RCP8.5 2090 RCP8.5 2030 RCP8.5 2090 RCP8.5
C-2
Secretariat of the Pacific Regional Environment ProgrammePO Box 240, Apia, Samoa
+685 21929+685 20231