solomon islands 2012/13 household income and …
TRANSCRIPT

SOLOMON ISLANDS 2012/13 HOUSEHOLD INCOME AND EXPENDITURE SURVEY
NATIONAL ANALYTICAL REPORT
(Volume I)
Solomon Islands National Statistics Office Ministry of Finance and Treasury
PO Box G6, Honiara, Solomon Islands Enquiries: Tel: (677) 27835/22154,
Email: [email protected]
October 2015

ii
FOREWORD
As Minister responsible for Finance and Treasury (MOFT) and the National Statistics Office (SINSO), and on behalf of the Government (Democratic Coalition of Change, DCC) of Solomon Islands, it is my pleasure to present the 2012/13 Household Income and Expenditure Survey (HIES) National Analysis Report (Volume I) to the people of the Solomon Islands. The National Analysis Report provides information on the income and expenditure behavior of households at the country level, by urban and rural areas. This report is complemented by the Provincial Analysis Report (Volume II) that focusses on provincial level analysis. The provincial report is presented separately. As you are aware, in February 2015 the newly elected DCC Government launched its Policy Statement and Translation Matrix. This policy manifesto provides a vibrant and coherent framework of how the government plans to drive socio-economic development and structural reforms in the Solomon Islands. Within this framework, and in connection with the current efforts towards the development of the first ever Solomon Islands National Statistics Development Strategy (NSDS), the government recognizes the need for the provision of timely, relevant and vital socio-economic statistics and indicators to enable evidence based decision making, policy development and planning in the country. In particular, the national findings from the HIES will inform the effective implementation of the medium-term fiscal strategy, monetary policy and the national development strategy (NDS) in utilizing new information in assessing the change in household consumption behavior, income inequalities and access to basic services. The data is a key source for the revision of the country’s inflation (CPI) measure, updating of the gross domestic product (GDP) and in supporting programs for poverty alleviation. Moreover, the indicators compiled from this report will also support the government’s efforts to address the objectives of the United Nations millennium development and sustainable development goals. I acknowledge the invaluable technical support of the Government of Australia’s Department of Foreign Affairs (DFAT)-Aid Programme through the Governance (SIGOV) and Education-Statistics Programmes, the Secretariat of the Pacific Community (SPC) and the leadership of the National Statistics Office and the Ministry of Finance and Treasury, in ensuring the completion of this major project. I also take this opportunity to sincerely thank the Government of Australia for their financial support towards the successful undertaking of the 2012/13 HIES. I also want to convey my appreciation to the Government Statistician, Mr. Douglas Kimi; former Permanent Secretaries for MOFT, Mr. Shadrach Fanega, Mr. Fred Fakarii and the current Permanent Secretary for MOFT, Mr. Harry Kuma, for their leadership at the Ministry and project level. In particular, I want to thank the staff of the National Statistics Office, MOFT for their efforts in successfully undertaking the HIES on behalf of the government. Lastly, I wish to acknowledge the co-operation of the families and individuals representing the sampled households throughout the country in making this survey possible, for without them, this publication would not have been possible. Hon. Snyder Rini, MP Minister of Finance and Treasury

iii
PREFACE AND ACKNOWLEDGEMENT
The 2012/13 HIES is the third nation-wide survey conducted by the Solomon Islands National Statistics Office (SINSO) of the Ministry of Finance and Treasury. The first survey was conducted in 1992 and was limited in scope, followed by the second HIES undertaken in 2005-2006. The National Analysis Report (Volume I) is presented at the country level by urban and rural areas, and is complemented by the Provincial Analysis Report (Volume II) that is presented separately. The 2012/13 HIES is a key data source for updating core official statistical indicators, such as the Consumer Price Index (CPI), Gross Domestic Product (GDP), United Nations millennium development and sustainable development goals-indicators and poverty measures for evidenced based-decision making, policy formulation and planning purposes. The success of the 2012/13 HIES project reinforces SINSO’s efforts towards the development of the first ever National Statistical Development Strategy (NSDS) for the country. The NSDS aims to strengthen the national statistics system and guide future plans for undertaking statistical surveys and censuses. In this connection, the 2012/13 HIES has been undertaken successfully with the support and cooperation of the Governments of Solomon Islands and Australia, the Secretariat of the Pacific Community (SPC), the World Bank, various stakeholders and the people of the Solomon Islands. The SINSO is indebted to the Governments of Solomon Islands and Australia for budgetary and technical support. The DFAT’s Solomon Islands Public Sector and Governance Programme (SIGOV) and the Education-Statistics Programme have provided technical assistance and programme support for the HIES. The NSO also acknowledges the technical assistance and support provided by the Secretariat of the Pacific Community (SPC) and the World Bank. Technical support provided through DFAT’s Aid-Programme, particularly the SIGOV and Education-Statistics Programmes are acknowledged through: Willie Lahari (in-country technical assistance, capacity building and analysis), and programme management and strategic support from: late Mr. Edward Smith, Mr. Moses Tongare, Rebecca Gibb, Jane Bastin-Sikimeti and Kirsten Hawke. The technical support from SPC is acknowledged through: Mr. Bertrand Buffière (survey design, logistics and analysis); Mr. Pierre Wong (data processing), Mr. Michael Sharp (analysis) and Mia Rimon (in-county support). The support from the World Bank is recognized through: Mr. Tim Bulman (HIES-poverty support); Mr. Manohar Shamar (HIES-poverty support); Kristen Himelein (sampling review); Darcey Johnson (data validations) and Valerie Evans (data management). Lastly but not least, I would like to acknowledge the SINSO staff directly involved in the HIES: Michael Dimola (Director of the HIES); Raphael Aipaina; Joseph Naesol; Irene Kalauma; Anterlyn Tuzakana; Anna Pitaboe; Josephat Tako; Loyce Pabulu; Henry Risoni; Moffat Sanau; Alfred Palo; Samson Kanamoli and Clera Sa’ohu including Project staff: Adrick Sese; Josiah Karich; Glen Pabulu and all the field enumerators including many individuals that I have not mentioned directly whom the NSO is indebted to their contributions. For further information and requires, please contact the SINSO on phone: 677 27835 or email: [email protected] Douglas Kimi Government Statistician

iv
TABLE OF CONTENTS
FOREWORD ...................................................................................................................................................... ii
PREFACE AND ACKNOWLEDGEMENT ............................................................................................................... iii
LIST OF TABLES ................................................................................................................................................ vi
LIST OF FIGURES ............................................................................................................................................. viii
LIST OF MAPS ................................................................................................................................................... ix
ABBREVIATIONS AND ACRONYMS ................................................................................................................... ix
EXECUTIVE SUMMARY ...................................................................................................................................... x
INTRODUCTION ................................................................................................................................................ 1
SECTION 1: SURVEY OVERVIEW ........................................................................................................................ 1
Background .......................................................................................................................................................... 1
Survey Objectives ................................................................................................................................................. 2
Survey-Sampling Procedure ................................................................................................................................. 3
Urban-Rural Distinction ....................................................................................................................................... 4
Error Measurements and Limitations .................................................................................................................. 4
SECTION 2: DEMOGRAPHIC, HOUSEHOLD AND DWELLING CHARACTERISTICS .................................................. 6
Demographic Profile ............................................................................................................................................ 6
Population and Household Estimates .................................................................................................................. 6
Age Structure ....................................................................................................................................................... 7
Place of Birth and Ethnicity .................................................................................................................................. 8
Marital Status ....................................................................................................................................................... 8
Education Profile ................................................................................................................................................ 10
Household and Dwelling Characteristics ............................................................................................................ 11
Housing Tenure .................................................................................................................................................. 11
Construction Materials ...................................................................................................................................... 12
Type of Dwelling and Communal Facilities ........................................................................................................ 12
Source of Lighting............................................................................................................................................... 13
Source of Cooking .............................................................................................................................................. 14
Source of Water ................................................................................................................................................. 14
Access to Services .............................................................................................................................................. 15
Healthcare ..................................................................................................................................................... 15
Communication ............................................................................................................................................. 16
Main Activity Status ........................................................................................................................................... 17
Gardening Activities ........................................................................................................................................... 18
Use of Alcoholic Beverage, Betel-nut, Kava and Tobacco .................................................................................. 19
SECTION 3: EXPENDITURE ANALYSIS ............................................................................................................... 21
Expenditure Definitions ..................................................................................................................................... 21

v
Main Expenditure Categories ........................................................................................................................ 21
Sub-Categories and Divisions of Main Expenditure ....................................................................................... 22
Type of Expenditure ....................................................................................................................................... 23
Expenditure Analysis by Area ............................................................................................................................. 24
Expenditure by Main Category and Type ........................................................................................................... 26
Expenditure by Division and Sub-Category ........................................................................................................ 28
Consumption Expenditure by Division (COICOP) ............................................................................................... 31
Average and Median Household Expenditure ................................................................................................... 40
Expenditure Distribution and Inequality ............................................................................................................ 41
Expenditure by Household Head Characteristics ............................................................................................... 44
Expenditure Distribution by Gender ............................................................................................................... 46
Expenditure by Province .................................................................................................................................... 47
SECTION 4: INCOME ANALYSIS ........................................................................................................................ 49
Income Definitions ............................................................................................................................................. 49
Main Income Categories ................................................................................................................................. 49
Sub-Categories of Main Income ..................................................................................................................... 51
Type of income ............................................................................................................................................... 52
Income Analysis by Area .................................................................................................................................... 53
Income by Major Category ................................................................................................................................. 54
Income by Category & Type ............................................................................................................................... 57
Employment Income by Sub-Category ............................................................................................................... 61
Income Deciles/Quintiles ................................................................................................................................... 63
Income Distribution and Inequality ................................................................................................................... 66
Individual Wage and Salary Income Analysis ..................................................................................................... 67
Household Head and Related Characteristics .................................................................................................... 70
SECTION 5: HOUSEHOLD BUSINESS RELATED INCOME/EXPENDITURE ............................................................ 74
SECTION 6: COMPARING EXPENDITURE AND INCOME .................................................................................... 78
APPENDIX 1: SELECTED DEMOGRAPHIC AND HOUSEHOLD TABLES ................................................................. 80
APPENDIX 2: SELECTED EXPENDITURE TABLES .............................................................................................. 113
APPENDIX 3: SELECTED INCOME TABLES ....................................................................................................... 154
APPENDIX 4: FURTHER REFERENCES AND INFORMATION ............................................................................. 162

vi
LIST OF TABLES
Table A1: Annual total, average and median expenditure (excluding imputed rents) by area xiii Table A2: Annual average consumption expenditure by urban and rural area xiii Table A3: Total annual expenditure in deciles by area (‘000) xiv Table A4: Annual total, average and median income (excluding imputed rents) by area xv Table A5: Average annual income by main type and category/source xv Table 1: Survey response rate by province 4 Table 2: Population age dependency ratios 7 Table 3: Distribution of population by marital status, area and gender 9 Table 4: Number (#) and % of population by use of internet, area and gender 17 Table 5: Total, average, median and per capita annual expenditures (excl. imputed rents) by area 24 Table 6: Total household expenditure in main and sub-category by expenditure type (‘000) 25 Table 7: Total household expenditure in main expenditure category by area (‘000) 26 Table 8: Total household expenditure in main expenditure category (‘000) 27 Table 9: Total annual consumption expenditure by type of expenditure and area (‘000) 29 Table 10: Total annual consumption expenditure by expenditure on food and non- alcoholic beverages and alcoholic beverages, tobacco and narcotics by area (‘000) 32 Table 11: Total annual consumption expenditure by selected sub-category of expenditure items by area (‘000) 34 Table 12: Total annual consumption expenditure of selected goods and services by area (‘000) 39 Table 13: Annual average, median and per capita expenditure (excl. imputed rent) by area 40 Table 14: Annual average consumption expenditure by area 40 Table 15: Total annual expenditure in deciles by area (‘000) 41 Table 16: Total annual expenditure in deciles by main expenditure type (‘000) 42 Table 16a: Total Urban annual expenditure in deciles by main expenditure type (‘000) 42 Table 16b: Total Rural annual expenditure in deciles by main expenditure type (‘000) 43 Table 17: Gini coefficient by expenditure type and area 44 Table 18: Distribution of heads of households 15 years and over by gender and age 44 Table 19: Total, average, median household expenditure by gender and age of head of household 45 Table 20: Distribution (%) of consumption and non-consumption expenditure by gender, hh head 46 Table 21: Percent of expenditure (consumption and non-consumption) by gender of hh head, area 47 Table 22: Annual total, average and median income (excluding imputed rents) by area 53 Table 23: Comparison of household and per capita net average, median income (ex. imputed rent) 54 Table 24: Household income by income sub-categories and area (‘000, %) 58 Table 25: Percent (%) of total annual income sub-categories by area 59 Table 26: Average annual income by main type and category/source 60 Table 27: Average annual household income by sub-categories, type and area 61 Table 28: Total annual ('000), average and median wage and salary by industry 63 Table 29: Total annual household income in decile by main type of income ('000) 64 Table 29a: Urban annual household income in decile by main type of income ('000) 64 Table 29b: Rural annual household income in decile by main type of income ('000) 65 Table 30: Total (‘000) and average income in decile/quintiles – including imputed rent 65 Table 31: Average annual income (excluding imputed rent) in quintiles by area 66 Table 32: Gini coefficient of total annual income (excluding imputed rents) and cash-income 67

vii
Table 33: Proportion (%) of population 10 years and over in wage/salary jobs by area, gender
68
Table 34: Persons in wage and salary jobs by income (total, average, median) and gender 68 Table 35: Average annual wage and salary income by quintile and gender 69 Table 36: Average annual wage and salary income by sector and gender 69 Table 37: Distribution of population aged 10 years and over by activity status, gender and area (%) 70 Table 38: Distribution of households, contribution to total income and average income (excl. imputed rents) by gender of the head of households and area 70 Table 39: Distribution of households, contribution to total income and average income excl. imputed rents) by age of the head of households and area 71 Table 40: Distribution (%) of total annual income groups (excluding imputed rents) by gender of head of household 72 Table 41: Percent of income generated by gender of hhold head and type of income generated 72 Table 42: Average annual household total income and distribution of total income by cash and non-cash (%) (excl. imputed rents) 73 Table 43: Distribution (%) of households by gender and activity status of the head of household 73 Table 44: Percent of households involved in subsistence and business activities by area 74 Table 45: Percent of households earning income in subsistence and business activities by area 74 Table 46: Operating and overhead costs by type of subsistence and business activities (‘000, %) 75 Table 47: Details of annual total operating/overhead costs by type of subsistence/buss. activities 76 Table 48: Gross income, operating/overhead costs, net income of subsist/buss. activities (‘000) 77 Table 49: Ratio of total annual expenditure over total annual income 78 APPENDIX TABLES
Appendix 1: Selected demographic and household tables 79 Appendix 2: Selected expenditure tables 112 Appendix 3: Selected Income tables 153 Appendix 4: Further references and information 162

viii
LIST OF FIGURES
Figure 1: Population comparison between 2012/13 HIES and 2009 census by gender and area 6 Figure 2: Provincial population estimates by gender 7 Figure 3: Population pyramid by gender for (a) 2012/13 HIES, 2009 census; and (b) 2012/13 HIES, urban and rural 8 Figure 4: Age dependency ratio by area 9 Figure 5: Population of school attendance (a), reason never attending school (b) by area, gender 10 Figure 6: Population at highest education (a), reason for leaving school (b) by area, gender 11 Figure 7: Household dwelling ownership and rent received by area 12 Figure 8: Household dwelling construction materials by area 12 Figure 9: Household by main bathing and toilet facility by area 13 Figure 10: Household by main source of lighting and electricity by area 14 Figure 11: Household by main cooking fuel by area 14 Figure 12: Household by main source of drinking water by area 15 Figure 13: Households by main healthcare facility by area 15 Figure 14: Household by travel time to health care facility by location 16 Figure 15: Population (%) by mobile phone use (a) and ownership (b) by area and gender 17 Figure 16: Population (%) by main activity status at (a) national, (b) urban and (c) rural areas 18 Figure 17: Proportion of households with gardens by area (a); and location of gardens by area (b) 19 Figure 18: Proportion of urban (a) and rural (b) households growing different types of produce 19 Figure 19: Population (%) using alcohol (a), betel-nut (b), tobacco (c) last week by area, gender 20 Figure 20: National expenditure distribution by main category (a); and main category by area (b) 26 Figure 21: Total Expenditure distribution by type of expenditure and area 28 Figure 22: Total consumption expenditure (COICOP) by type, national (a), urban (b) and rural (c) 30 Figure 23: Total non-consumption expenditure by type, national (a), urban (b), rural (c) 30 Figure 24: Total investment expenditure in sub-categories by national (a), urban (b) and rural (c) 31 Figure 25: National (a), urban (b) and rural (c) expenditure distribution within food and non-alcoholic beverage COICOP division by class and type 33 Figure 26: Expenditure distribution within alcoholic beverages, tobacco and narcotics COICOP division by class, type and area 33 Figure 27: Expenditure distribution within clothing and footwear COICOP division by class, area 33 Figure 28: National (a), urban (b) and rural (c) expenditure distribution within housing and utilities COICOP division by class and type 35 Figure 29: National (a), urban (b) and rural (c) expenditure distribution within furnishing, equipment and maintenance COICOP division by class 35 Figure 30: National (a), urban (b) and rural (c) expenditure distribution within health COICOP division by class 36 Figure 31: National (a), urban (b) and rural (c) expenditure distribution within transportation COICOP division by class 36 Figure 32: Expenditure distribution within communication COICOP division by class and area 37 Figure 33: Expenditure distribution within education COICOP division by class and area 37 Figure 34: National (a), urban (b) and rural (c) expenditure distribution within recreation and Culture COICOP division by class 37 Figure 35: Expenditure distribution within restaurant COICOP division by class and area 38

ix
Figure 36: National (a), urban (b), rural (c) expenditure distribution within miscellaneous goods
and services COICOP division by class 38 Figure 37: Lorenz curve for national (a), rural (b) and urban (c) area 43 Figure 38: Proportion of expenditure by main activity status of household head, gender, area 45 Figure 39: Total expenditure distribution by type and province 47 Figure 40: Expenditure distribution by type and province 48 Figure 41: Total household income by major category and area (‘million) 55 Figure 42: Distribution of total household income by major category and area (%) 55 Figure 43: Total household income by type and area (‘million) 56 Figure 44: Distribution of total household income by type and area (%) 56 Figure 45: Distribution of cash-income by major sub-category (%) at national level 56 Figure 46: Distribution of cash-income by major sub-category (%) in urban and rural areas 57 Figure 47: Percentage contribution to total employment income by main category 61 Figure 48: Percent contribution of subsistence sub-categories to total home production income 62 Figure 49: Lorenz curve – distribution of total income and cash-income – National 66 Figure 50: Lorenz curve – distribution of total income and cash-income – urban / rural areas 67 Figure 51: Distribution of annual wage job income by sector 69 Figure 52: Average annual total income by age and gender of the household head 71
LIST OF MAPS
Map 1 Solomon Islands 2 Map 2 Urban Centres/Settlements, Solomon Islands 5
ABBREVIATIONS AND ACRONYMS
COICOP Classification of Individual Consumption According to Purpose CPI Consumer Price Index DFAT Department of Foreign Affairs and Trade, Australia EA Enumeration Area GDP Gross Domestic Product HIES Household Income and Expenditure Survey Hhold, hh Households ILO International Labour Organisation nec Not Elsewhere Classified PSU Primary Sampling Unit Ren-Bel Rennell-Bellona Province SBD Solomon Islands Dollar SINSO Solomon Islands National Statistics Office SNA System of National Accounts SPC Secretariat of the Pacific Community SSU Secondary Sampling Unit

x
EXECUTIVE SUMMARY
The Solomon Islands 2012/13 Household Income and Expenditure Survey (HIES) was implemented over a 12-month period from mid-October 2012 to early October 2013. This report is the first generated output of the HIES and provides information on the income and spending behaviour of households at the national level, and by urban and rural areas. This report is complemented by a secondary report focusing on provincial level analysis. This summary provides information on the survey design and objectives, basic demographic and household profile, main results on expenditure and income, and income-expenditure comparisons.
SURVEY AIMS AND OVERVIEW The 2012/13 HIES was undertaken to collect household income and expenditure information, and related socio-demographic, household dwelling and accessibility data to meet the following main objectives:
• Revise the weights of the current basket of goods and services in the consumer price index (CPI) to capture the changing spending behaviour of households.
• Update the national account estimates particularly the Gross Domestic Product (GDP) by updating the household final consumption expenditure (HFCE) and informal sector estimates.
• To collect information on the incidence of poverty in the Solomon Islands.
The HIES data is also able to meet other related objectives such as providing supplementary data for the production of the country’s balance of payments and the United Nations Millennium and Sustainable Development goals. A stratified sample of 4,608 households was selected based on the 2009 Census frame that covered urban and rural geographical areas of the nine provinces including Honiara. Honiara is the only fully urban area and Rennell-Bellona is the only rural province. The survey was designed to generate estimates at the national and provincial levels only, in view of budgetary limitations. A response rate of 97.2% (i.e., 4,479 households) was achieved in the survey. The 2012/13 HIES is fundamentally different in design and implementation from the previous HIES 2005/6, and thus caution must be taken in any direct comparison of results. The design took into consideration the Pacific regional standardized methodology of the Secretariat of the Pacific Community (SPC), poverty concerns by the World Bank, and considerations from the Solomon Islands government and development partners.
POPULATION ESTIMATES
From the 2012/13 HIES, the estimated total population is 615,804 persons and 108,041 households. The total population consisted of 317,205 (51.5%) males and 298,598 (48.5%) females resulting in a sex ratio of 106 males per 100 females. About 19% of the population reside in urban areas while the remaining majority (81%) reside in rural areas. An average household size is estimated at 6 persons, and over half of the Solomon Islands’ population is less than 20 years old.
The annual national population growth rate between the 2009 Census (22 November 2009) adjusted for an undercount in 2009, and the mid-point of the 2012/13 HIES (1 April 2013) was 3.8% which is slightly higher than the adjusted 2009 Census growth rate (1999-2009) of 3.0%.

xi
HOUSEHOLD AND DWELLING CHARACTERISTICS
The survey results show that 18% of total households are located in urban areas with 82%, the majority of households, based in rural areas.
About 84% of total household dwellings are owned by their tenants (owner-occupied). Fifty-eight percent of the owner-occupied dwellings are in urban areas. The survey records that 4% of all households rent their current dwellings and these households make up 19% of households in the urban areas.
The survey shows that 94% of all household dwellings are free-standing individual dwellings, and about 83% of these dwellings consist of an outdoor kitchen. A majority (83%) of total households reported having their kitchens located outside the house; 54% of these households are located in urban areas.
The findings show that 43% of households in urban areas have a private flush toilet facility, while 24% reported having a private slab toilet facility. Nearly half of the rural households use the seaside/mangrove areas as their main toilet facility.
Slightly less than half of all households in the country have access to electricity. Electricity (45%) and solar (40%) energy are the main sources of lighting for the majority of households. However, 20% of households that have access to electricity reported Solomon Islands Electricity Authority (SIEA) as their main supplier. The majority (98%) of these households are in urban areas.
The survey reports that slightly more than half the households in urban areas use wood and coconut shells as their main energy source for cooking.
In rural areas, the main source of drinking water is community standpipes as reported by 45% of households, followed by river/spring (25%), household tank (13%) and community tanks (11%). Two-thirds of rural households have to travel to the main source of drinking water. In urban areas, 57% of households obtain their drinking water primarily from metered-piped supplies provided by the Solomon Islands Water Authority (SIWA), followed by the household tank (16%). Close to 90% of all households in both urban and rural areas claim that the same source of drinking water is also the same source for cooking.
At the national level, 7% of total population reported using alcoholic beverages. Use of alcoholic beverages among the population is higher (11%) in urban areas than in rural areas (6%). Betel-nut is more widely used than alcohol and tobacco, with 45% of total population reported chewing betel-nut. However, in terms of spending on these commodities (alcohol, betel-nut and tobacco), tobacco is a relatively more important item in the household budget.
ACCESS TO BASIC SERVICES
The survey also collected basic information on access to basic services particularly in healthcare, water, transport, communications and internet services. The findings show that the majority (66%) of urban households access the Honiara Town Council (HTC) clinics, while in rural areas, the majority (45%) of households access the Rural Aid Centre as their primary health care facilities.
At the national level, 67% of households reported that their main mode of transport to the primary health care facility is walking, while 15% of households travel by vehicle, and 13% of households travel by canoe. In urban areas, 62% of households travel for less than 30 minutes to reach their nearest healthcare facility. In rural areas, although 38% of households travel for

xii
less than 30 minutes to reach their primary health care facility, almost 40% of the other households take more than one hour. Only 12% of households in the urban area travel more than one hour to a primary health care facility.
About 90% of both urban and rural households reported less than 30 minutes of travel time to the primary source of water. However, more than half of these households have to make two to three trips per day to reach the water source.
Only 3% of all households have access to internet at their household dwelling, with 8% reported in urban areas and close to 2% in rural areas. Almost (99%) of households in the country reported not having telephone landlines connected to their dwellings. In terms of population, only 4% of the total population use internet; 13% of those who use the internet are located in urban areas while 2% are located in rural areas. In terms of the main source of internet usage, 47% of the people who use the internet, use it at their work places, followed by usages from mobile phones (18%) and school facilities (15%).
It was found that 26% of total population owned a mobile phone while 38% of the population used mobile phones. This was predominantly the case in both urban and rural areas. In urban areas, similar proportions of males (59%) and females (59%) within respective populations, use mobiles phones, and in owning mobile phones - males (49%) and females (47%).
MAIN ACTIVITY STATUS
The findings on the main activity status of individuals aged 10 years and over in the last week before the survey shows that the highest proportions of population (28%) at the national level are engaged in the production of goods for self-consumption, as well as those reported as being full-time students. The former activity is obviously predominant in the rural areas, with 35% of the rural population, and accounting for slightly more than a third of the female population. Following at the national level are those engaged in unpaid housework/domestic work (8%), producing goods for sale (8%), private employees (7%) and private employees (5%), while those engaged in other activities represented 15%.
EXPENDITURE ANALYSIS
The total annual household expenditure inclusive of imputed rent charges (SBD$1.082 billion) is estimated at SBD$6.913 billion in nominal terms. The total annual expenditure excluding imputed rental charges is recorded at SBD$5.830 billion, as presented in Table A1 below. By area, rural households account for more than half (68%) the total expenditure excluding imputed rent.
Households spent on average SBD$53,961 annually, excluding imputed rent. This is slightly more than a third (36%) of median household expenditure of SBD$39,546. The variation between the average and median amounts show the skewness in the distribution of expenditure (income) and implies that certain households have relatively higher annual expenditures than the majority of the households. This is further evident when disaggregated by urban and rural areas. In the urban areas, average household expenditure is about a third more than median expenditure, while in the rural areas average expenditure is a quarter more than median expenditure, suggesting that wealthier households are spending relatively more than the average household. Hence, the median expenditure appears more representative of the average expenditure of households.
Moreover, the median household in the urban area spent slightly more than twice (204%) the amount spent by rural households. This suggests that the cost of living is higher in urban areas and also indicates the significant uneven spending behaviour of households. This is further

xiii
affirmed by the high per-capita expenditure among the urban population, who spent twice the amount spent by persons in the rural areas.
Table A1: Annual total, average, median and per capita expenditure (excluding imputed rent) by area
Area Hholds Pop- ulation
Av. Hhold
size
Total expenditure
(SBD)
Average expenditure (SBD)
Median expenditure (SBD)
Per hhold Per
capita Per hhold Per
capita Urban 19,015 114,451 6.0 1,882,610,468 99,007 16,449 73,147 12,443 Rural 89,026 501,353 5.6 3,947,443,032 44,340 7,874 35,772 6,152 Total 108,041 615,804 5.7 5,830,053,500 53,961 9,467 39,546 6,856 Total annual expenditure consists of consumption expenditure, non-consumption expenditure and investment expenditure. Consumption expenditure accounts for 92% of total expenditure - the same share in both urban and rural areas, respectively. Non-consumption expenditure consists of 5% at the country level and in both urban and rural areas, respectively. Investment expenditure accounts for 3% at the national level, and 3.5% in urban and 2.8% in rural areas, respectively. Table A2: Annual average consumption expenditure by urban and rural areas Major consumption expenditure groups (COICOP)
Total Urban Rural SBD % SBD % SBD %
Food and non-alcoholic beverages 27,026 45.9 32,065 29.9 25,950 53.4 Alcoholic beverages, tobacco & narcotics 5,184 8.8 11,111 10.3 3,918 8.1 Clothing and footwear 1,246 2.1 2,180 2.0 1,047 2.2 Housing and utilities* 13,277 22.5 31,548 29.4 9,375 19.3 Furnishings, equipment & maintenance 1,494 2.5 2,788 2.6 1,218 2.5 Health 133 0.2 202 0.2 118 0.2 Transportation 6,193 10.5 16,442 15.3 4,004 8.2 Communication 1,783 3.0 4,993 4.7 1,097 2.3 Recreation & culture 773 1.3 1,297 1.2 660 1.4 Education 932 1.6 2,178 2.0 666 1.4 Restaurants & hotels 397 0.7 1,162 1.1 234 0.5 Miscellaneous good & services 493 0.8 1,398 1.3 300 0.6 Annual average consumption expenditure 58,931 100.0 107,364 100.0 48,587 100.0 * includes imputed rent Consumption expenditure by major expenditure groups (see Table A2) reveals that food and non-alcoholic beverages account for close to half the total consumption. This indicates an average amount of SBD$27,000 spent by households on food and non-alcoholic beverages at the country level. This is slightly higher in urban areas where households spent SBD$32,000 on average on food and non-alcoholic beverages, with about similar amounts spent on housing and utilities annually. In urban areas, food and non-alcoholic beverages, and housing and utilities make up about a third of consumption, respectively. Urban households spent on average slightly more than SBD$2,000 on education costs (mainly school fees) annually. It should be noted that according to the COICOP classification of expenditure, some expenses often regarded as part of education expenditure, such as school uniforms, boarding and lodging etc., are not classified as part of education expenditure, but

xiv
reclassified in other divisions according to purpose. For example, school uniforms are classified under the clothing division, and boarding and lodging fees are treated as part of the accommodation group within the restaurant and hotel division. Moreover, this average amount is about three times the average amount spent by households in rural areas. Households at the national level spent about SBD$133 annually on average on health costs. The national average is highly influenced by the relatively lower rural average. This is relatively the lowest (0.2%) spending in average consumption expenditure. Moreover, 20% (decile 9 and10) of households (wealthier households) spent close to four times the expenditure of the lowest 20% (decile 1 and 2) at the national level, and three times in both urban and rural areas, respectively (see Table A3). Table A3: Total annual expenditure in deciles by area ('000) National Urban Rural Decile SBD % SBD % SBD %
1 312,488 4.5 130,171 5.9 234,076 5.0 2 389,400 5.6 127,814 5.8 289,989 6.2 3 429,843 6.2 150,603 6.8 314,812 6.7 4 473,215 6.8 175,762 7.9 361,077 7.7 5 545,556 7.9 175,888 7.9 396,917 8.5 6 626,692 9.1 168,700 7.6 457,265 9.7 7 693,304 10.0 222,163 10.0 483,466 10.3 8 770,014 11.1 269,605 12.1 519,457 11.1 9 981,959 14.2 316,729 14.3 626,610 13.4
10 1,690,253 24.5 482,421 21.7 1,009,201 21.5 Total 6,912,725 100.0 2,219,856 100.0 4,692,869 100.0
A quarter of total expenditure inclusive of imputed rent is attributed to the highest 10% (decile 10) of households. Although deciles 1-5 represent half the expenditure of all households, their combined expenditure accounts for just a third of total expenditure in the country. This further confirms the extent of uneven expenditure (income) distribution and supports the national expenditure Gini coefficient of 0.41 that suggests that inequality is relatively high among households.
The survey results also show that the bread and cereals sub-group is an important food group in the household budget accounting for over half the total cash-expenditure. Within this group, households spent close to half a million dollars (SBD$470 million) annually in cash payments on rice as a main staple product. About 76% of this amount originates from rural households. This is despite the fact that home production of food is predominant in the rural areas.
Following expenditure on rice is expenditure on transport services, particularly sea transport accounting for close to 80% of rural household expenditure. This is indicative of the preferred mode of transport, and the geography and transport logistical needs of the country. It is also noted that tobacco is highly consumed, followed by beer and betel-nut consumption. The total annual spending on betel-nut, excluding betel-nut supplements (e.g., lime and mustard) is SBD$106 million.

xv
INCOME ANALYSIS
Total annual household income in nominal terms is estimated at SBD$7.282 billion inclusive of imputed rental income. Total income excluding imputed rent amounts to SBD$6.199 billion. Rural households account for 65% of total expenditure excluding imputed rent. Total income consists of five main categories or sources, namely employment income, property income, home production consumed, transfers, and casual income. The survey findings show that employment income accounts for 77% of total income, followed by imputed rents (15%) while transfers (1%) is the lowest source of household income.
Although households earned on average SBD$57,379 annually excluding imputed rent, they spent less than what they earned (SBD$53,961) on average by 6%. However, the scenario changes when median income is compared with median expenditure. In addition, Table A4 shows that median income is lower than average income by 73%. This variation shows the skewed distribution of income and the impact of higher and extremely lower incomes on average income. This implies that the median income is a more representative average income of the middle class, as observed on the expenditure side analysis.
Table A4: Annual total, average and median income (excluding imputed rents) by area
Area Hholds Pop-
ulation
Av. Hhold
size Total income
(SBD)
Average income (SBD)
Median income (SBD)
Per hhold
Per capita
Per hhold
Per capita
Urban 19,015 114,451 6 2,182,783,139 114,793 19,072 58,791 10,508 Rural 89,026 501,353 5.6 4,016,479,028 45,116 8,011 29,928 5,104 Total 108,041 615,804 5.7 6,199,262,166 57,379 10,067 33,131 5,798 Urban households earn close to three times the average income of rural households, and twice the median and per-capita income. This shows further evidence of the extent of uneven income distribution amongst households and persons in urban and rural areas.
A household earns on average close to SBD$52,000 in total employment income annually, as shown in Table A5. Although this amount is slightly above the amount earned by rural households, urban households earn twice the national average.
Table A5: Average annual income by main type and category/source
Main income type and category Total Urban Rural
SBD % SBD % SBD %
Average Annual Income 67,395 100 132,532 100 53,489 100
Income type Cash 42,133 63 105,543 80 28,593 53 Home produced 13,425 20 2,756 2 15,706 29 Imputed rents 10,020 15 17,733 13 8,373 16 Income in kind 1,816 3 6,500 5 818 2
Income category Employment 51,903 77 101,388 77 41,334 77 Property 2,625 4 8,946 7 1,274 2 Regular transfers 885 1 1,930 1 662 1 Casual income 1,965 3 2,524 2 1,847 3 Imputed rents 10,020 15 17,733 13 8,373 16

xvi
Income from employment includes wages and salary (cash and in-kind) that account for 31% of employment income, followed by business/self-employment income (28%), and income estimated from home production (25%). Income from subsistence-based activities (agriculture, fishing, livestock and handicraft and food processing) makes up the remaining 16%. In terms of the types of income, cash-income from wages and salaries, and business/self-employed income accounts for 63% of total types of income. As noted in the expenditure analysis, the distribution of income throughout the household population demonstrates a high degree of income inequality. The survey found that the top 10% of households (decile 10) earn more than a third (42%) of all income in the country and more than half (55%) of all cash-income in the country. Compared with the expenditure analysis, the same richest group of households spent 25% of total expenditure, and 30% of total cash-expenditure. The poorest 50% of households in the country earn close to 20% of the total household income. This is consistent with the national income Gini coefficient of 0.54, indicating a relatively high income inequality among households.
COMPARING EXPENDITURE AND INCOME
In a survey such as a HIES, it is not often found where income would be greater than expenditure at the national level, as found in the current 2012/13 HIES. However, at the provincial level, a number of provinces recorded their total expenditures higher than their corresponding total incomes and this is discussed in the provincial HIES report.
In terms of the relative contributions of total expenditure over total income, expenditure is lower than income by 5%. When imputed rent is excluded, expenditure reduces by 6%. By area, income is higher than expenditure by 14% while in rural areas, income exceeds expenditure by 2%. In rural areas, the gap between income and expenditure is smaller than in urban areas. The survey also shows that a third of all households reported income greater than expenditure.
At the national level, an analysis of income and expenditure by income deciles found that income was relatively higher for households represented by deciles 9 and 10, the top 2 most wealthy income deciles. Lower income deciles reported expenditure in excess of income which is in line with the expectation that households typically underreport their incomes.
Similar HIESs conducted in many other countries, including the past two HIES in the country, showed that expenditure data appeared more reliable and was often used as the proxy of income. However, the quality of income and expenditure data is limited by a number of factors where practical biases are often experienced by the interviewer and respondents during enumeration, such as unsatisfactory recall by the household respondents, underreporting of income for fear of taxation purposes, overstating of consumption of certain luxury items and services, and understating alcohol, tobacco or illicit substances etc. It is noted that the conceptual treatment of certain variables and the questionnaire design can also have implications for the quality of the data. These are unfortunate but practical realities of any complex survey operation and thus caution must be taken in the direct comparisons and treatment of income and expenditure data. In this report, both income and expenditure results are presented even where similar indicators are produced from expenditure and income data, such as the income deciles and Gini coefficient etc. Unlike previous survey reports, this is an attempt to disseminate as much information as possible, and to also allow the user to decide on a preferred measure or information, depending on their specific interest.

1
INTRODUCTION
This National Analysis Report (Volume I) is the first generated output from the Solomon Islands 2012/13 Household Income and Expenditure Survey (HIES). It is the third HIES conducted since 1992. The second HIES was conducted in 2005/6. The fundamental differences in design and implementation, in particular in the survey instruments, definitions, classifications, and the duration of enumeration limits direct comparisons among these survey estimates particularly with respect to the income and expenditure data. This report provides analysis at the country level by urban and rural areas, in the following sections:
1) Survey Overview (Section 1) a. Background b. Objectives, survey procedure, urban-rural distinction c. Error measurements and limitations
2) Analysis Sections (Section 2 - Section 6) a. Section 2: Demographic, household and dwelling characteristics b. Section 3: Expenditure analysis c. Section 4: Income analysis d. Section 5: Household business related income/expenditure e. Section 6: Comparing expenditure and income
3) Appendices This National Analysis Report (Volume I) will be complemented by the Provincial Analysis Report (Volume II). This secondary report will address the provincial estimates, following a similar structure. Apart from these two main reports, selected technical reports have been produced, such as the methodological report that addresses sampling issues, field operation management, data processing and data quality.
SECTION 1: SURVEY OVERVIEW
BACKGROUND
Immediately after the civil unrest in 1999, the Solomon Islands Government undertook a structural reform process including attempts to revitalise the national statistical system in the country. The Government saw the need to undertake a HIES to assess the changing spending behaviour of households over time and to ensure that the data collected is used to update key socio-economic indicators such as the consumer price index (CPI), gross domestic product (GDP) and poverty measures to inform the current and future development policies and plans of the country. Although the first household survey was conducted in 1992, it was limited in scope. The coverage and data from the survey was used primarily to support the updating of the weights of the CPI and provide data for the updating of the GDP at the time. The 2005/6 HIES was the second and comprehensive nation-wide survey conducted by the NSO in partnership with the Secretariat of the Pacific Community (SPC). The design of the 2012/13 HIES considered the newly developed standardized HIES methodology for the Pacific region proposed by the Secretariat of the Pacific Community (SPC), considerations by the Solomon Islands Government, specific recommendations by the World

2
Bank and the DFAT supported Solomon Islands Economic Governance (SIGOV) and Education-Statistics Programmes. The approach proposed by the SPC to harmonise HIESs across the Pacific region resulted in various changes to the design and implementation of the 2012/13 HIES, including changes to the survey instruments, classifications, definitions and the field enumeration, that involved collecting the data over a 12 month period to account for seasonal factors. The latter was a significant change from the 2005/6 HIES, where data was collected over a 6 months period.
Map 1: Solomon Islands
SURVEY OBJECTIVES
A survey such as a HIES collects a wealth of information on not just income and expenditure, but also about related socio-demographics, household dwelling and accessibility data. The main objectives of the 2012/13 HIES were as follows:
1. Revise the weights of the current basket of goods and services in the consumer price index (CPI) to capture the changing spending behaviour of households.
2. Update the national account estimates, particularly the Gross Domestic Product
(GDP), by updating the household final consumption expenditure (HFCE) and informal sector estimates.
3. To collect information on the incidence of poverty in the Solomon Islands.

3
The HIES has the potential to be a key source of data required to formulate key socio-economic policies, planning and support decision making in the country, as well as in making country comparisons in the Pacific region. The HIES data is useful as a supplementary source in the production of the country’s balance of payments statistics, and the United Nations millennium and sustainable development goals. In addition, the survey findings presented in this report also aim to provide useful indicators for a range of topics in the Solomon Islands and the Pacific region such as:
Food security Education Gender Fisheries Labour Force Home Production Agriculture Transport Food in general Health IT/Communication Ceremonies/Gift Giving
Further research and analysis of these topics and other specialised subjects can be expanded from the HIES data and information.
SURVEY-SAMPLING PROCEDURE
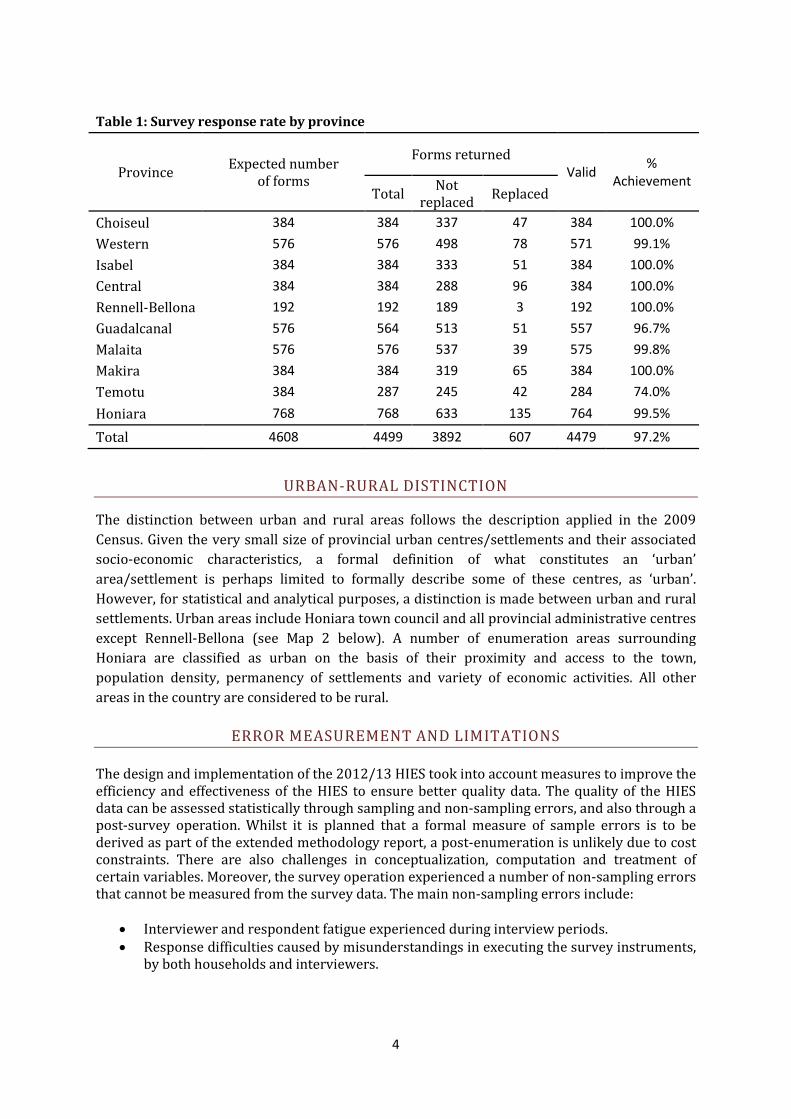
The sampling procedure expands on a similar design in the 2005/6 HIES in that it is based on a stratified two stage design covering urban and rural areas of all the nine provinces, including Honiara. The urban areas covered included Honiara and all provincial centres excluding Rennell-Bellona. There was no rural area for Honiara and no urban area for Rennell-Bellona. Due to cost constraints, the sampling design and the selected sample size meant that estimates could only be derived at the national by urban and rural areas, and provincial levels. The design is based on the enumeration areas (EA) as the primary sampling unit (PSU), and the households within the sample areas as the secondary sampling unit (SSU). In the first stage, the EAs are selected with probability proportional to population size based on the 2009 census frame. In the second stage, households are selected using the household listing for the selected EA updated during the field operation. The sample selected was allocated to each province proportional to their respective population size in such a way that each provincial estimate would roughly have the same level of selection and accuracy. The sample was then split for each province between the provincial centres (considered to be urban, including Honiara) and the remaining rural population. The last stage in the process involved adjusting the final counts to accommodate the workloads of interviewers doing the fieldwork. The interviewers were expected to be in the field for 12 months and could accommodate 12 households per EA. In total, 384 EAs were randomly selected (out of 1370) and spread over the 12 months of field operation. Field staff operated in teams of three (one supervisor and two enumerators) and spent three weeks to complete one EA (12 households = six households per enumerator). In case of absences and refusals by selected households, enumerators had to apply the replacement procedure where necessary to select another appropriate household to interview. A separate methodological report provides further information regarding the survey procedure. Table 1 below shows that out of the 4,608 households planned to be surveyed, 97.2% of households, including 86.5% of the selected households, responded favourably meeting the survey requirements. It was noted that midway into field enumeration in February 2013, the islands making up Temotu Province were affected by the tsunami and this impacted on the survey operations. This affected the enumeration for three months and contributed to the relatively low response rate.
4
Table 1: Survey response rate by province
Province Expected number of forms
Forms returned Valid %
Achievement Total Not
replaced Replaced
Choiseul 384 384 337 47 384 100.0% Western 576 576 498 78 571 99.1% Isabel 384 384 333 51 384 100.0% Central 384 384 288 96 384 100.0% Rennell-Bellona 192 192 189 3 192 100.0% Guadalcanal 576 564 513 51 557 96.7% Malaita 576 576 537 39 575 99.8% Makira 384 384 319 65 384 100.0% Temotu 384 287 245 42 284 74.0% Honiara 768 768 633 135 764 99.5%
Total 4608 4499 3892 607 4479 97.2%
URBAN-RURAL DISTINCTION
The distinction between urban and rural areas follows the description applied in the 2009 Census. Given the very small size of provincial urban centres/settlements and their associated socio-economic characteristics, a formal definition of what constitutes an ‘urban’ area/settlement is perhaps limited to formally describe some of these centres, as ‘urban’. However, for statistical and analytical purposes, a distinction is made between urban and rural settlements. Urban areas include Honiara town council and all provincial administrative centres except Rennell-Bellona (see Map 2 below). A number of enumeration areas surrounding Honiara are classified as urban on the basis of their proximity and access to the town, population density, permanency of settlements and variety of economic activities. All other areas in the country are considered to be rural.
ERROR MEASUREMENT AND LIMITATIONS The design and implementation of the 2012/13 HIES took into account measures to improve the efficiency and effectiveness of the HIES to ensure better quality data. The quality of the HIES data can be assessed statistically through sampling and non-sampling errors, and also through a post-survey operation. Whilst it is planned that a formal measure of sample errors is to be derived as part of the extended methodology report, a post-enumeration is unlikely due to cost constraints. There are also challenges in conceptualization, computation and treatment of certain variables. Moreover, the survey operation experienced a number of non-sampling errors that cannot be measured from the survey data. The main non-sampling errors include:
• Interviewer and respondent fatigue experienced during interview periods. • Response difficulties caused by misunderstandings in executing the survey instruments,
by both households and interviewers.

5
• The questionnaires being in English, a second language for interviewers and respondents resulted in communication and interpretation of technical related questions in some cases.
• The exclusion of remote areas from the sampling frame due to logistics, costs and safety considerations.
• Lack of coordination and communication among some teams affecting adherence to the field work plan. Consequently, some households were skipped or work was in-complete.
• Weather, particularly long periods of rain affected the enumeration and logistics. • Due to the tsunami in February 2013, data collection stopped in Temotu Province for 3
months resulting in the exclusion of 97 households.
Other related limitations regarding the scope and coverage of the survey include:
• The major differences in design and implementation in the 2012/13 HIES and the past two surveys, in particular in the survey instruments, definitions, classifications, and the duration of enumeration impends on direct comparisons of estimates among these surveys, particularly with respect to the income and expenditure data.
• The design of the 2012/13 HIES allows for analysis of the data by geographical levels at the national by urban and rural areas, and provincial levels only, due to sample size limitations. Due to cost constraints, the sampling design could not allow for estimation of results beyond the provincial level.
Note that a separate methodological report provides a discussion section on data quality.
Map 2: Urban centres/settlements, Solomon Islands
6
SECTION 2: DEMOGRAPHIC, HOUSEHOLD AND DWELLING CHARACTERISTICS
This section aims to present national estimates of general demographic characteristics of persons or members of households, households and household dwellings characteristics.
Although the demographic characteristics of the past 2009 Census and HIES populations are not expected to be directly identical, it is expected that the general distribution of the two populations will be similar to help us to observe and make inferences about the general trends in population structure and behaviour noting also that the 2009 census frame was used in the HIES sampling procedure. All information is reported at the national level and disaggregated by urban and rural areas.
DEMOGRAPHIC PROFILE
The demographic profile presents estimates of the population by age structure, place of birth, ethnicity, marital status and education.
POPULATION AND HOUSEHOLD ESTIMATES
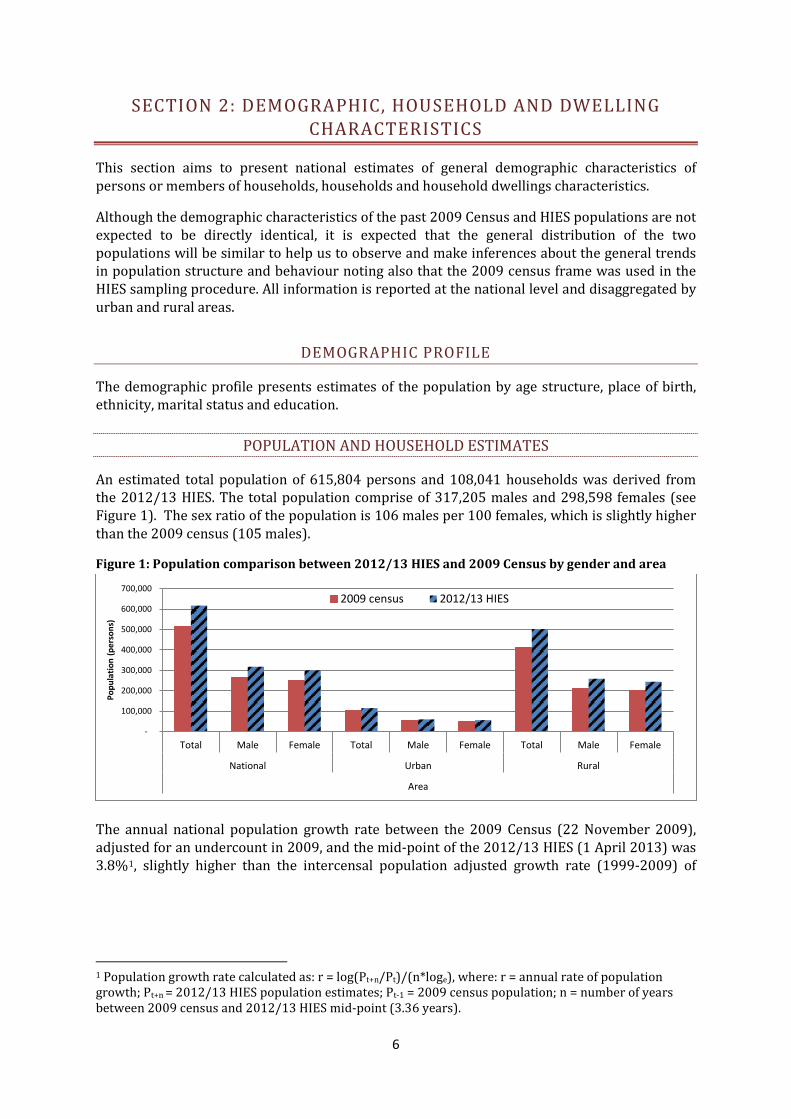
An estimated total population of 615,804 persons and 108,041 households was derived from the 2012/13 HIES. The total population comprise of 317,205 males and 298,598 females (see Figure 1). The sex ratio of the population is 106 males per 100 females, which is slightly higher than the 2009 census (105 males).
Figure 1: Population comparison between 2012/13 HIES and 2009 Census by gender and area
The annual national population growth rate between the 2009 Census (22 November 2009), adjusted for an undercount in 2009, and the mid-point of the 2012/13 HIES (1 April 2013) was 3.8%1, slightly higher than the intercensal population adjusted growth rate (1999-2009) of
1 Population growth rate calculated as: r = log(Pt+n/Pt)/(n*loge), where: r = annual rate of population growth; Pt+n = 2012/13 HIES population estimates; Pt-1 = 2009 census population; n = number of years between 2009 census and 2012/13 HIES mid-point (3.36 years).
-
100,000
200,000
300,000
400,000
500,000
600,000
700,000
Total Male Female Total Male Female Total Male Female
National Urban Rural
Area
Popu
latio
n (p
erso
ns)
2009 census 2012/13 HIES

7
3.0%.2 The growth rate of 3.8% is significantly high by regional standards and will have drastic implications on future development planning and service delivery.3
By area, 19% of the population resides in urban areas, with the remaining 81% residing in rural areas (Figure 1). The national average household size is 5.7 or six persons per household with urban and rural areas averaging 6 and 5.6 persons per household, respectively. These numbers correspond with those from the 2009 census.
Figure 2: Provincial population estimates by gender
By province, Malaita has the largest population and accounts for 28% of total population followed by Guadalcanal (18%), Western (15%) and Honiara (11%). The remaining provinces account for 29% of the total population (Figure 2).
AGE STRUCTURE
The population age structure is highly skewed towards the age group less than 15 years old, with 41% of the population falling into this group. Cumulatively, 52% of the population is less than 20 years old. The population age structure appears similar with those from the 1999 and 2009 Censuses, indicating the significance of the HIES population estimates (see Figure 3a).
Table 2: Population age dependency ratios
2 Using the unadjusted 2009 census population figures (515,870), the annual population growth rate between the 2009 Census and the 2012/13 HIES would be 5.27%, which is extremely high and of serious concern. 3 Caution should be taken when making population projections especially at the provincial level, in view of the 2009 Census undercount of 8.3% at the national level.
170,883
108,663
91,033
68,651 53,199
31,433 31,172 28,509 27,610
4,650 -
20,000
40,000
60,000
80,000
100,000
120,000
140,000
160,000
180,000
Popu
latio
n (p
erso
ns)
Province
Total Male Female
Age dependency ratio National Urban Rural
2012/13 HIES 77.13 55.77 82.86 2009 census 78.95
2005/6 HIES 72.00 55.00 76.00 1999 census 81.55

8
Figure 3: Population pyramid by gender for (a) 2012/13 HIES & 2009 census; (b) 2012/13 HIES, urban and rural areas
In terms of the age dependency ratios, the HIES reveals that for every 100 persons of the working age population (aged 15 and 64, inclusive), there were 77 dependents at the national level. In urban areas, this falls to 56 dependents, but increases to 83 in rural areas (see Table 2; Figure 4). This is demonstrated from the population age structure (see Figure 3), where it can be seen that a significant proportion of the population is below the age of 15.
50000 40000 30000 20000 10000 0 10000 20000 30000 40000 50000 60000
< 5
10 to 14
20 to 24
30 to 34
40 to 44
50 to 54
60 to 64
70 to 74
80 +
Population (persons)
Age
clas
s
(a)
Females (2009) Females (2013) Males (2009) Males (2013)
50000 40000 30000 20000 10000 0 10000 20000 30000 40000 50000 60000
< 5
10 to 14
20 to 24
30 to 34
40 to 44
50 to 54
60 to 64
70 to 74
80 +
Population (persons)
Age
clas
s
(b)
Females (rural) Females (urban) Males (rural) Males (urban)

9
Across the entire population, 90% of households identified a male as being the household head. In urban and rural areas, a male was identified as the household head in 87% and 91% of households, respectively. Figure 4: Age dependency ratio by area
PLACE OF BIRTH AND ETHNICITY
The survey shows that 99.5% of total population is born in the Solomon Islands; with 98.6% of urban population born in urban areas and 99.7% of rural population born in rural areas.
In terms of ethnicity, 95.7% of total population identified themselves as being Melanesian, 2.4% as Polynesian and 1.1% as Micronesian. In urban areas, 94% of population identified themselves as Melanesian, 3.4% as Polynesian, 1.5% as mixed ethnicity and 1.2% as from other ethnicities. In rural areas, 96.2% identified themselves as Melanesian, 2.1% as Polynesian, and 1% as Micronesian.
MARITAL STATUS
Nearly two-thirds of the population reported being never married, as shown in Table 3. The majority of the remainder of the population identified themselves as legally married (29%), including those married by custom (6%). Area disaggregated (urban and rural) figures are similar to national trends.
Table 3: Distribution of population by marital status, area and gender
Area Sex Marital status
Never married
Legally married
Custom married De-facto Divorced Separated Widowed
National Total 61.6% 28.7% 6.4% 0.8% 0.2% 0.4% 1.9% Male 64.5% 27.6% 6.2% 0.6% 0.1% 0.2% 0.8% Female 58.5% 29.9% 6.6% 1.0% 0.3% 0.7% 3.0%
Urban Total 61.1% 27.7% 7.1% 1.3% 0.4% 0.8% 1.6% Male 63.9% 26.8% 6.9% 1.1% 0.3% 0.3% 0.9% Female 58.2% 28.7% 7.3% 1.5% 0.6% 1.4% 2.3%
Rural Total 61.7% 28.9% 6.3% 0.6% 0.1% 0.4% 2.0% Male 64.7% 27.7% 6.1% 0.5% 0.1% 0.1% 0.8% Female 58.5% 30.2% 6.5% 0.8% 0.2% 0.6% 3.2%
88 85 84 83 82 78 77 77 72 71
50 56
83
Area

10
The findings are consistent with the 2009 census on marital status across age groups showing that a high proportion of the population who have never been married are less than 20 years old and an increasing proportion of widowed individuals are in the upper age groups.
EDUCATION PROFILE
This section presents the results for the current population 2 years and over at the time of the survey, by status of school attendance. The survey found that of the total current population, 15% had never attended school, 47% had already left school and 38% were currently attending school. Disaggregated by urban and rural areas, similar trends are apparent. However, in rural areas, there is a higher occurrence of females who have never attended school (19% of females against 14% of males) and a slightly lower prevalence of rural females against their male counterparts who are currently attending school (37% of females against 40% of males) (Figure 5a).
In assessing non-school attendance, of the current population of 15% that never attended school, reasons include refusing to go to school (16%), being too young (49%), parents did not provide support (13%), and other reasons (21%) including travel distance (8%). Similar trends exist between urban and rural areas, except for travel distance, which was a greater constraint in rural areas. However, the survey found a distinctly higher proportion of females in both urban and rural areas whose parents did not want them to attend school. This included 17% of females against 2% of males in urban, and 21% females against 5% males in rural areas (see Figure 5b).
Figure 5: Population (%) in school attendance (a); and reason for never attending school (b) by gender and area
At the national level, of those who attended school, 54% reported completing primary education, 22% reported completing junior secondary and 14% completed senior secondary. Moreover, 9% of those who attended school completed other educational levels – early childhood, tertiary (college/university) and professional (technical/vocational etc).4 A lower proportion of educational attainment at post-secondary levels is reported in rural (4%) compared to urban areas (22%). See Figure 6a.
In terms of the reasons for leaving school, at the national level, 29% of those who attended school left due to poor academic performance, followed by having completed the desired level 4 Further information can be produced based on a formal or recognised classification of educational levels in the country.
12% 12% 14% 19%
51% 53% 46% 45%
37% 35% 40% 37%
0%
20%
40%
60%
80%
100%
Male Female Male Female
Urban Rural
% o
f pop
ulat
ion
Area
(a) Never attended Already left Currently attending
59% 47% 58% 41%
20% 17%
14% 17%
2% 17% 5% 21%
18% 19% 23% 21%
0%
20%
40%
60%
80%
100%
Male Female Male Female
Urban Rural
% o
f pop
ulat
ion
Area
(b) Too young Refused to goParents not want Other

11
(28%), school being too expensive (11%), school seen as having no value (9%) and other reasons (24%). Similar trends exist between urban and rural areas, and by gender. Fewer females reported that they had finished their desired level of school (see Figure 6b). Figure 6: Population (%) in highest level of education completed (a) by reason for leaving (b) by gender and area
HOUSEHOLD AND DWELLING CHARACTERISTICS
This section presents the survey findings on housing tenure, particularly dwelling ownership, construction materials, living quarters, bathing and toilet facilities, sources of lighting, cooking and water. This discussion also covers the main activity status and the use of alcohol, betel-nut, kava and tobacco.
HOUSING TENURE
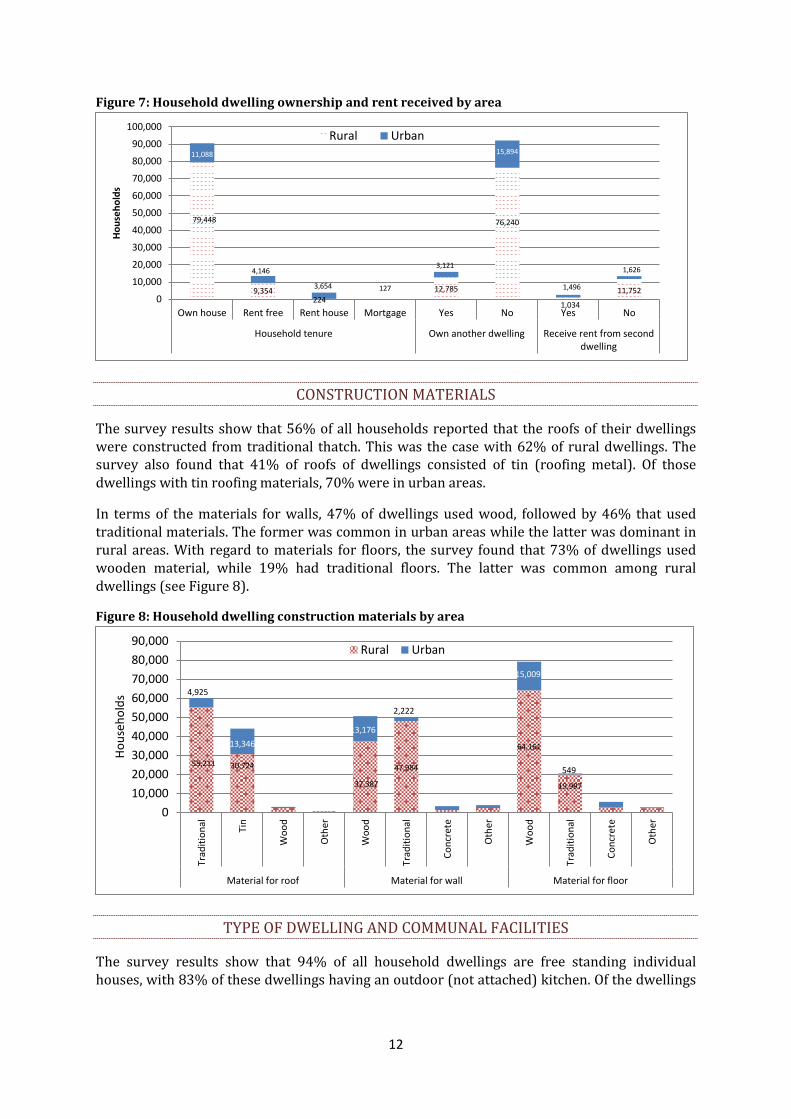
Across the country, 84% of private household dwellings are owner-occupied, 12.5% are occupied for free and 3.6% are rented. These figures differ when the results are disaggregated by urban and rural areas, with 89% of rural dwellings owned by their occupants while in urban areas, this percent falls to 58%. However, a higher proportion of urban households occupy dwellings free of rent (22%) compared to rural households (11%). Dwelling ownership through mortgages appeared negligible across the country and the survey revealed that a small proportion of households rent dwellings in rural areas (see Figure 7).
Moreover, the survey found that 15% of all households owned another dwelling. Of this percentage, only 16% received rent. This was higher in urban areas with 40% of second dwelling owners receiving rent.
28% 39%
56% 63% 24%
23%
21% 21%
22% 20%
13% 10% 26%
17% 9% 5%
0%
20%
40%
60%
80%
100%
Male Female Male Female
Urban Rural
% o
f pop
ulat
ion
Area
(a) Primary Junior secondarySenior secondary Other
27% 32% 28% 29%
38% 30% 29% 24%
7% 9% 12% 11%
5% 5% 10% 9%
23% 24% 21% 26%
0%
20%
40%
60%
80%
100%
Male Female Male Female
Urban Rural
% o
f pop
ulat
ion
Area
(b)
Poor progress Completed desired levelToo expensive Does not see valueOther
12
Figure 7: Household dwelling ownership and rent received by area
CONSTRUCTION MATERIALS
The survey results show that 56% of all households reported that the roofs of their dwellings were constructed from traditional thatch. This was the case with 62% of rural dwellings. The survey also found that 41% of roofs of dwellings consisted of tin (roofing metal). Of those dwellings with tin roofing materials, 70% were in urban areas.
In terms of the materials for walls, 47% of dwellings used wood, followed by 46% that used traditional materials. The former was common in urban areas while the latter was dominant in rural areas. With regard to materials for floors, the survey found that 73% of dwellings used wooden material, while 19% had traditional floors. The latter was common among rural dwellings (see Figure 8).
Figure 8: Household dwelling construction materials by area
TYPE OF DWELLING AND COMMUNAL FACILITIES
The survey results show that 94% of all household dwellings are free standing individual houses, with 83% of these dwellings having an outdoor (not attached) kitchen. Of the dwellings
79,448
9,354 224
12,785
76,240
1,034
11,752
11,088
4,146
3,654 127
3,121
15,894
1,496
1,626
0
10,000
20,000
30,000
40,000
50,000
60,000
70,000
80,000
90,000
100,000
Own house Rent free Rent house Mortgage Yes No Yes No
Household tenure Own another dwelling Receive rent from seconddwelling
Hous
ehol
ds
Rural Urban
55,211 30,724
37,387
47,984
64,161
19,997
4,925
13,346 13,176
2,222
15,009
549
010,00020,00030,00040,00050,00060,00070,00080,00090,000
Trad
ition
al Tin
Woo
d
Oth
er
Woo
d
Trad
ition
al
Conc
rete
Oth
er
Woo
d
Trad
ition
al
Conc
rete
Oth
er
Material for roof Material for wall Material for floor
Hous
ehol
ds
Rural Urban

13
with outdoor kitchen, 89% are in rural areas and 54% in urban areas. It was also found that 85% of dwellings did not have a room or space dedicated to professional use.
The majority (41%) of all households reported using a standpipe either from within the community or within the household dwelling for bathing purposes. This is common in rural areas. Moreover, in urban areas, 17% of households bath using standpipes, whilst 47% of households use private bathrooms. In rural areas, 32% of households bath in a river/stream.
An interesting result was observed regarding toilet facilities where more than a third (42%) of all households reported using the seaside/mangroves as their main toilet facility. This can be attributed to the high proportion of rural households (49%) using this type of toilet facility. In urban areas, private flush toilets are used in 43% of households, followed by private slab toilets in 24% of households (see also Figure 9). Figure 9: Households by main bathing and toilet facility by area
SOURCE OF LIGHTING
At the national level, electricity and solar (lamps) energy are the main sources of lighting for 45% and 40% of households, respectively. Slightly more than half of all households in the country do not have access to electricity. By area, electric lighting is used by a higher proportion (60%) of households in the urban areas, compared to 41% of rural households. The highest percentage of rural households (44%) use solar lamps as their main source of lighting.
Of the households that have access to electricity, 20% reported Solomon Islands Electricity Authority (SIEA) as their main supplier. Moreover, only 9% of all households in the country reported obtaining their electricity from SIEA. In urban areas, the majority (98%) of households who reported having access to electricity, stated that SIEA was their main supplier.
40,668
28,714
10,667
2,344 2,418 499 2,603 1,113
43,888
15,088
8,835 10,295 3,015 3,664 2,859 944 438
3,233
1,309
2,070
8,930 684 2,315 81 393
1,210
241
4,614 1,044
8,211 485 319 1,719 1,172
0
10,000
20,000
30,000
40,000
50,000
Stan
dpip
e
Rive
r/st
ream Wel
l
Priv
ate
Wat
er ta
nk
Shar
ed Sea
Oth
er
Seas
ide
Oth
er
Priv
ate
slab
Priv
ate
latr
ine
Priv
ate
flush
Com
. Lat
rine
Rive
r/st
ream
Com
. Sla
b
Com
. Flu
sh
Bathing facilities Main toilet facility
Hous
ehol
ds
Rural Urban

14
Figure 10: Households by main source of lighting and electricity by area
SOURCE OF COOKING
The results presented in Figure 11 reveal that 90% of all households use wood and coconut shell as their main energy source for cooking. In rural areas, 97% of households use wood and coconut shell compared to 57% of urban households. After wood and coconut shell, the next main cooking fuel is gas, which is used mainly in urban areas by 33% of households.
Figure 11: Households by main cooking fuel by area
SOURCE OF WATER
At the national level, the primary source of household drinking water is standpipes, as reported by 39% of households. Following this are, river/spring water (22%), household tanks (13%), metered-piped water (11%) and community tanks (10%). Disaggregated by area, in urban areas, the primary source of drinking water is metered-piped water (57%) supplied by the Solomon Islands Water Authority (SIWA), followed by the household tank (16%). In rural areas, the community standpipe is the primary source of drinking water (45%), followed by river/spring water (25%), household tanks (13%) and community tanks (11%).
The survey reveals that 92% of households use the same water source for drinking and cooking (see also Figure 12).
36,750 39,491
9,275 3,511
52,275
31,971
197 4,582
11,493 3,517
2,789
1,217
7,522
1,706
9,513 274
0
10,000
20,000
30,000
40,000
50,000
60,000
70,000
Electricity Solar lamp Kerosene lamp Other No electricity HH solar unit SIEA Other
Main source of lighting Electricity provider
Hous
ehol
ds
Rural Urban
86,559
2,467
10,782
8,233
0
10,000
20,000
30,000
40,000
50,000
60,000
70,000
80,000
90,000
100,000
Wood/coconut Other
Main cooking fuel
Hous
ehol
ds
Rural Urban

15
The survey findings show that 59% of households in the country have to travel for water (21% in urban areas and 66% in rural areas).
Figure 12: Households by main source of drinking water by area
ACCESS TO SERVICES
This section presents the survey results regarding accessibility to healthcare and communication services.
HEALTHCARE
The results from Figure 13 show that, at the national level, 37% of all households access rural aid centres as their primary health care facility. This is followed by aid centres (26%), Honiara Town Council clinics (HTC) (15%) and provincial centres (15%). A high proportion (66%) of households in urban areas reported primarily accessing the HTC clinic while 45% and 30% of rural households reported primarily accessing rural aid centres and aid posts, respectively.
Figure 13: Households by main healthcare facility by area
The main mode of transport to a healthcare facility is walking (land), as reported by 67% of households. This is followed by vehicle (land) and canoe transport (sea), as reported by 15% and 13% of households, respectively. In urban areas, walking is the main mode of transport for
40,041
22,476
11,423 10,090 4,188
1,724
853
3,049 10,801
861
1,729
0
5,000
10,000
15,000
20,000
25,000
30,000
35,000
40,000
45,000
50,000
Com. S-pipe River/spring HH tank SIWA Com. tank Other
Main source of drinking water
Hous
ehol
ds
Rural Urban
NHR 3%
Province centre
15% HTC clinic 15%
Aid post 26%
Rural aid
center 37%
Other 4%
National
NHR 7%
Province centre
16%
HTC clinic 66%
Aid post 4%
Other 7%
Urban
NHR 2%
Province centre
15%
HTC clinic 4%
Aid post 30%
Rural aid center 46%
Other 3%
Rural

16
56% of households, followed by 41% of households that use vehicles. In rural areas, walking is the main mode of transport for 70% of households followed by canoe (16%) of households.
The survey found that 27% of households in the country travel for less than 15 minutes to access a health care facility, while 35% of households travel for more than one hour. In urban areas, 36% of households travel for less than 15 minutes. However, a higher cumulative proportion (84%) of households travels for less than 45 minutes to access a health care facility. In rural areas, 25% of households travel for less than 15 minutes, while more than a third (39%) of rural households take more than one hour to travel to a healthcare facility.
Figure 14: Households by travel time to health care facility by area
COMMUNICATION
At the national level, 97% of households do not have internet access at home. This consists of 92% of urban households and 98% of rural households. In addition, the survey found that 99% of all households are not connected to a telephone landline. This consists of 95% of urban households and 99% of rural households.
Apart from the households, the survey found that out of the total population, 38% of the population use a mobile phone. Males (42%) show relatively higher use of mobiles than the females (35%) within their respective populations. The concentration of mobile phone usage is found in urban areas among 59% of the population compared to 33% in rural areas (see Figure 15).
In terms of ownership of mobile phones, 26% of the population at the national level reported owning one mobile phone. Although in urban areas similar use (59%) and ownership (47%-49%) patterns were apparent among males and females, it was apparent that in rural areas, males use and own mobile phones more than females (see Figure 15a & b).
22,413
11,188 16,164
4,166
11,881
23,213
6,913
4,827
4,211
744
874
1,445
0
5,000
10,000
15,000
20,000
25,000
30,000
35,000
0 - 14 mins 15 - 29 mins 30 - 44 mins 45 - 59 mins 60 - 74 mins >74 mins
Hous
ehol
ds
Time to HC facility
Rural Urban

17
Figure 15: Population (%) by mobile phone use (a) and ownership (b) by gender and area
Only 3% of all households have access to internet at their household dwelling, with 8% reported in urban areas and close to 2% in rural areas. In terms of population, 4% of the total population use internet comprising of 13% of people in the urban areas and 2% in rural areas. According to Table 4 below, there is less variation in use of the internet between males and females. In the rural areas, the proportion of males and females using the internet is the same at 2%. In addition, the primary mediums and facilities sourced to access the internet include at work-places (47%), mobile phones (18%), school (15%) and home (10%). Moreover, less than half of internet users have secondary internet sources. However, of those who do, 77% access internet mostly at the work-place.
Table 4: Number (#) and Percent (%) of population by use of internet, gender and area
Use Internet (# of people) Use Internet (% of population) Total Yes No NA Total Yes No
Total 579,530 21,803 557,727 36,273 100% 4% 96% Male 297,044 12,303 284,741 20,162 100% 4% 96% Female 282,487 9,500 272,987 16,111 100% 3% 97% Urban 107,939 13,613 94,326 6,513 100% 13% 87% Male 55,468 7,808 47,660 3,485 100% 14% 86% Female 52,470 5,805 46,665 3,028 100% 11% 89% Rural 471,593 8,191 463,402 29,760 100% 2% 98% Male 241,575 4,495 237,080 16,677 100% 2% 98% Female 230,017 3,696 226,321 13,083 100% 2% 98%
MAIN ACTIVITY STATUS
The HIES collected information on the main activity status of individuals aged 10 years and over in the previous week. The findings show that at the national level, the highest proportion of the population (28%) reported having engaged in the production of goods for self-consumption (home production), as well as those reported as being full-time students. The former activity is obviously predominant in rural areas with 35% of the rural population, of whom, over a third (40%) are females. Following at the national level are those engaged in unpaid housework/domestic work (8%), those producing goods for sale (8%), private employees (7%)
40% 35% 59% 59%
36% 30%
60% 65% 41% 41%
64% 70%
0%10%20%30%40%50%60%70%80%90%
100%
Male Female Male Female Male Female
Total Urban Rural
% o
f po
pula
tion
(a) Yes No
29% 22%
49% 47% 25% 16%
71% 78%
51% 53% 75% 84%
0%10%20%30%40%50%60%70%80%90%
100%
Male Female Male Female Male Female
Total Urban Rural
% o
f pop
ulat
ion
(b) Yes No

18
and private employees (5%), while those engaged in other activities represented 15% of the population (see Figure 16a). Figure 16: Main activity status of population 10 years and over by: (a) national, (b) urban (c) rural areas
By urban and rural areas, and by gender, there is an apparent pattern that shows that whilst a relatively higher proportion of females than males are engaged in non-monetary activities such as unpaid household domestic work in both urban (13% females; 6% males) and rural areas (11% females; 4% males), conversely, more males than females are engaged as employees in both the private and public sectors (38% males; 22% females in urban and 11% males; 4% females in rural) and in the production of goods for sale, particularly in rural areas (10% males; 6% females). A similar trend is observed where there are fewer females than males reported as being full-time students in both urban and rural areas (see Figure 16b,c) The survey also asked if a member of the household, apart from being engaged in an activity, was also engaged in a secondary activity. Of those that responded, the highest proportion (34%) reported being engaged in unpaid family work, followed by homemaking (22%) as their main secondary activities; these two main secondary activities account for 66% of urban population. Further analysis of the household income by main activity/industry will be discussed in section 4 (Income Analysis).
GARDENING ACTIVITIES
At the national level, 89% of households have gardens. In urban areas, this percentage falls to 45%, while in rural areas, 99% of households have gardens (see Figure 17a). The majority (82%) of gardens are located ‘elsewhere’ (i.e., away from the household dwelling area) in rural
Production - subsistence 28%
FT student 28%
Employee 12% HH unpaid work
8%
Production - sale 8%
Other 15%
Other 16%
(a)
Prodn- subsistence
2%
FT student 30%
Employee 30%
HH unpaid work 10%
Production - sale 7%
Other 21%
Other 19%
(b)
Production - subsistence
35%
FT student 27%
Employee 8%
HH unpaid work 8%
Production - sale 8%
Other 14%
Other 24%
(c)

19
areas. However, more than half (55%) of gardens in urban areas are located near the household dwelling (see Figure 17b).
Figure 17: Proportion (%) of households (a) with gardens by area; (b) location of gardens by area
The survey results show that kumara, cassava and banana are grown by more than 94% of households with gardens. Figure 18 below shows that in urban areas, cassava, banana, pawpaw, kumara, slippery cabbage, long beans and eggplant are grown by more than 50% of households with gardens. In rural areas, half of the households with gardens grow an entire array of fruit and vegetable produce (excluding cucumber and Chinese cabbage).
Figure 18: Proportion (%) of urban and rural households growing different types of produce
USE OF ALCOHOLIC BEVERAGE, BETEL-NUT, KAVA AND TOBACCO
This section reports on the population aged 10 years and above and their use of alcoholic beverages, betel-nut, kava and tobacco (see Figure 19). Kava is relatively the substance least used, that is by only 1% of the male population and thus is not included in Figure 19.
89%
45%
99%
11%
55%
0%
20%
40%
60%
80%
100%
National Urban Rural
% o
f Hou
seho
lds
Area
Yes No
21%
55%
17%
78%
45%
82%
0%
20%
40%
60%
80%
100%
National Urban Rural
% o
f hou
seho
lds
Area
Near the residence Elsewhere Other
0%
20%
40%
60%
80%
100%
Kum
ara
Cass
ava
Bana
naSl
ip. C
bgPa
wpa
wL.
bea
nsTa
roYa
mEg
gpl
Tom
Pum
pkO
ther
Cucu
m.
Chin
. Cbg
RURAL
% o
f hou
seho
lds
Yes No
0%
20%
40%
60%
80%
100%
Cass
ava
Bana
naPa
wpa
wKu
mar
aSl
ip. C
bgL.
bea
nsEg
gpl
Tom
Pum
pkTa
roCh
in. C
bgYa
mO
ther
Cucu
m.
URBAN
% o
f hou
seho
lds
Yes No
(a) (b)

20
Figure 19: Percent of population who use or not use (a) alcohol, (b) betel-nut, (c) tobacco, in the last week by gender and area
At the national level, 7% of the population reported having used alcoholic beverages in the past week (Figure 19a). Alcohol usage is higher (11%) in urban areas than in rural areas (6%). By gender, alcohol consumption is more prevalent among males than females (19% males; 3% females in urban; and 11% males; 1% females in rural areas).
Betel-nut is more widely used than alcoholic beverages and tobacco, with 45% of the population reported using betel-nut (Figure 19b). The proportion of males (49%) using betel-nut was slightly higher than females (41%). A higher proportion of the population (46%) reported using betel-nut in rural areas than in urban areas (43%). Males use more betel-nut than females in both urban and rural areas (47% males; 38% females in urban and 50% males; 42% females in rural areas).
Tobacco is used by 22% of the population and the more common users are males than females (Figure 19c). At the national level, 34% of males and 9% of females use tobacco. It is evident that a higher percentage of males than females use tobacco in both urban and rural areas – urban (36% males; 12% females) and rural (34% males; 8% females). However, in terms of spending on these commodities (alcohol, betel-nut and tobacco), tobacco is a relatively more important item in the household budget (see expenditure analysis section).
13%
1% 19
%
3%
11%
1%
87%
99%
81%
97%
89%
99%
0%10%20%30%40%50%60%70%80%90%
100%
Mal
e
Fem
ale
Mal
e
Fem
ale
Mal
e
Fem
ale
National Urban Rural
% o
f pop
ulat
ion
Area
(a) Yes No
49%
41%
47%
38%
50%
42%
51%
59%
53%
62%
50%
58%
0%10%20%30%40%50%60%70%80%90%
100%
Mal
e
Fem
ale
Mal
e
Fem
ale
Mal
e
Fem
ale
National Urban Rural
% o
f pop
ulat
ion
Area
(b) Yes No
34%
9% 36
%
12%
34%
8%
66%
91%
64%
88%
66%
92%
0%10%20%30%40%50%60%70%80%90%
100%
Mal
e
Fem
ale
Mal
e
Fem
ale
Mal
e
Fem
ale
National Urban Rural
% o
f pop
ulat
ion
Area
(c) Yes No

21
SECTION 3: EXPENDITURE ANALYSIS
This section presents the expenditure estimates in nominal terms and consists of two main sectional components of the analysis, namely the definitions and analysis. The definition section introduces the terms used in the analysis by expenditure category, sub-category, division and type. The analysis section presents the results at the national level, disaggregated by urban and rural areas by main expenditure topics. The outline of this section is as follows:
• Expenditure definitions • National expenditure by area • Expenditure by main category and type • Expenditure by division and sub-category • Consumption expenditure by division • Average consumption expenditure • Expenditure distribution and inequality • Expenditure by household head characteristics • Expenditure by province • Expenditure distribution by gender
This section of the analysis will also provide a brief overview of expenditure by province that otherwise will be covered in detail by the provincial analysis report.
EXPENDITURE DEFINITIONS
Statistically sound concepts and definitions of specific expenditure and classification of expenditure categories and sub-categories, divisions and types are presented to facilitate interpretation of the expenditure information, data tables and terms used in this analysis. The definitions and concepts employed in this section follow the International Labour Organisation’s (ILO) resolution 1 of the Seventeenth International Conference of Labour Statisticians. These definitions and concepts form the basis for the preference of standards relating to household income and expenditure from household based surveys.
In addition, other universally accepted statistical concepts and definitions are used, such as the United Nations System of National Accounts (SNA) and the Solomon Islands based Classification of Individual Consumption According to Purpose (COICOP) harmonised from the United Nations COICOP and the Pacific regional COICOP classifications.
MAIN EXPENDITURE CATEGORIES
The main categories of expenditure follow the ILO’s resolution 1 of the Seventeenth International Conference of Labour Statistician, with linkages to the related SNA definitions as follows: 1. Consumption Expenditure:
1.1. Household Consumption Expenditure: The value of consumer goods and services acquired, used or paid for by a household through direct monetary purchases, own-account production, barter or as income in-kind for the satisfaction of the needs and wants of its members.

22
System of National Accounts definition: Household final consumption expenditure consists of the expenditure, including expenditure whose value must be estimated indirectly, incurred by resident households on individual consumption goods and services, including those sold at prices that are not economically significant and including consumption goods and services acquired abroad.
1.2. Other Consumption Expenditure: The value of consumer goods and services acquired or used by the household through transfers from government, non-profit institutions or other households.
2. Non-Consumption Expenditure: Those expenditures are incurred by a household as transfers made to government, non-profit institutions and other households, without acquiring any goods or services in return for the satisfaction of the needs of its members.
3. Investment expenditure: Covers expense items incurred by household members for
financial security or accumulation of significant assets, such as a house/property.
System of National Accounts definition: Gross fixed capital formation is measured by the total value of a producer’s acquisitions, less disposals, of fixed assets during the accounting period plus certain specified expenditure on services that adds to the value of non-produced assets. The asset boundary for fixed assets consists of goods and services that are used in production for more than one year.
SUB-CATEGORIES AND DIVISIONS OF MAIN EXPENDITURE
The sub-categories of the main expenditure mentioned earlier include the following:
1. Consumption expenditure division5 For a more standard statistical presentation and tabulation of consumption expenditure, the COICOP classification is employed that sub-divides the data by 12 main expenditure sub-divisions or sub-categories namely:
1. Food and Non-Alcoholic Beverages 2. Alcoholic Beverages, Tobacco and Narcotics 3. Clothing and Footwear 4. Housing, Water, Electricity, Gas and Other Fuels 5. Furnishings, Household Equipment and Routine Household Maintenance 6. Health 7. Transport 8. Communication 9. Recreation and Culture 10. Education 11. Restaurants and Hotels 12. Miscellaneous Goods and Services
It is crucial to understand the composition and description of the COICOP classification not only by division as stated above but by group, class, sub-class and commodity. This will aid in the
5 The consumption expenditure sub-category is referred to as a ‘division’ to align with the COICOP classification.

23
understanding of the analysis and interpretation of the results where COICOP is being applied. A detailed COICOP classification list can be obtained from the SINSO.
2. Non-consumption expenditure sub-categories The non-consumption expenditure has been further disaggregated into seven sub-categories of relative importance to the Solomon Islands. These seven main sub-categories include:
1. Cash donations to ceremonies 2. Cash donations to households 3. Cash donations to church 4. Cash donations to village 5. Cash donations to associations 6. Other charitable cash donations 7. Taxes and fines
Ceremonies cover a household’s contribution or gifts to weddings, funerals, birthdays, etc. The next five sub-categories reflect mainly acts of generosity, cultural, family or religious supported obligations on behalf of the household to another household, community, church, village, school, etc. The last sub-category 7 refers to taxes and fines paid by the household members as direct transfers to the government or other authority. 3. Investment expenditure sub-categories Investment expenditure comprises of five sub-categories as follows:
1. Purchase of land or house 2. House construction 3. Major improvements to house 4. Plant or equipment 5. Mortgage payment
TYPE OF EXPENDITURE
The types of expenditure are aggregated in the following 5 main types:
1. Cash/In-kind purchases 2. Home production 3. In-kind receipts – cash-expenditure for the benefit of another household 4. In kind receipts – home production given away 5. Imputed rents
Explanations for each of the main type of expenditure are provided below.
1. Cash/In-kind purchases Cash/In-kind purchases represent any purchases made in the form of a cash payment or payment in-kind (that is, the household pays for the good or service with something other than cash). In a situation where a purchase is made in-kind, an estimated value of the item/service exchanged for the purchase is made. 2. Home production Home production expenditure covers the value of items which were directly or finally home produced by the household and then consumed by the same household. Using their (household/member) combined labour, goods are initially acquired, grown or gathered, often
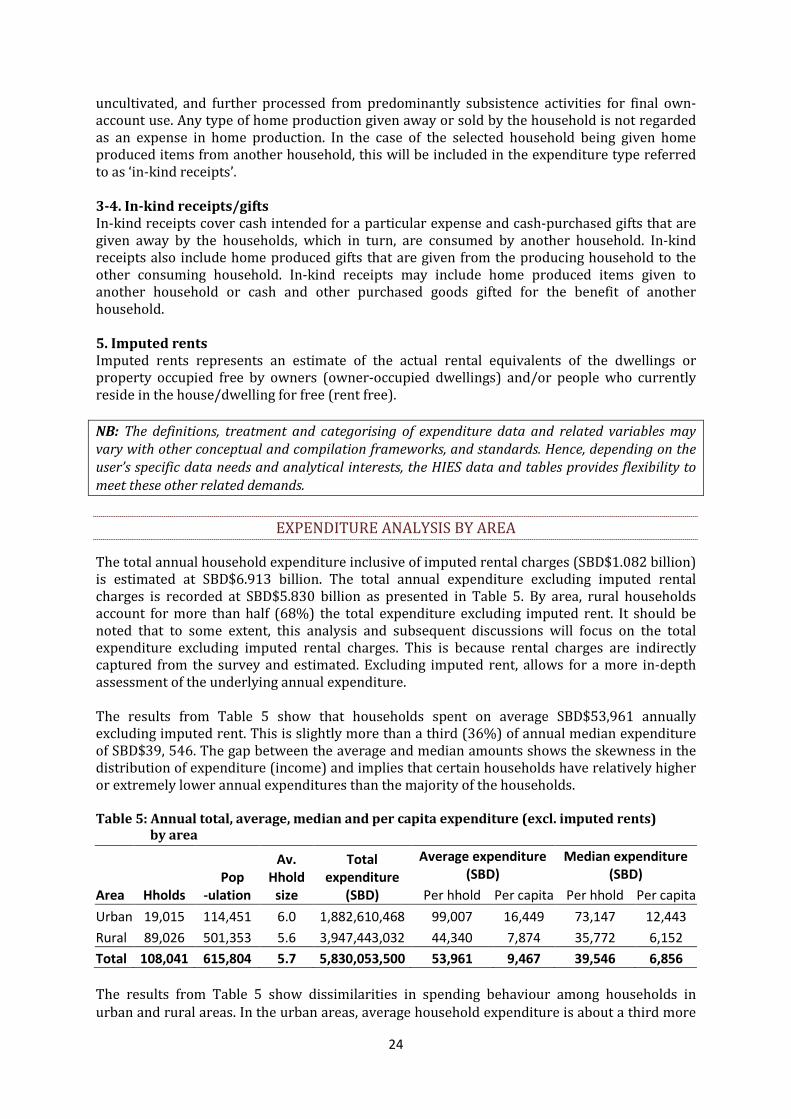
24
uncultivated, and further processed from predominantly subsistence activities for final own-account use. Any type of home production given away or sold by the household is not regarded as an expense in home production. In the case of the selected household being given home produced items from another household, this will be included in the expenditure type referred to as ‘in-kind receipts’. 3-4. In-kind receipts/gifts In-kind receipts cover cash intended for a particular expense and cash-purchased gifts that are given away by the households, which in turn, are consumed by another household. In-kind receipts also include home produced gifts that are given from the producing household to the other consuming household. In-kind receipts may include home produced items given to another household or cash and other purchased goods gifted for the benefit of another household. 5. Imputed rents Imputed rents represents an estimate of the actual rental equivalents of the dwellings or property occupied free by owners (owner-occupied dwellings) and/or people who currently reside in the house/dwelling for free (rent free). NB: The definitions, treatment and categorising of expenditure data and related variables may vary with other conceptual and compilation frameworks, and standards. Hence, depending on the user’s specific data needs and analytical interests, the HIES data and tables provides flexibility to meet these other related demands.
EXPENDITURE ANALYSIS BY AREA
The total annual household expenditure inclusive of imputed rental charges (SBD$1.082 billion) is estimated at SBD$6.913 billion. The total annual expenditure excluding imputed rental charges is recorded at SBD$5.830 billion as presented in Table 5. By area, rural households account for more than half (68%) the total expenditure excluding imputed rent. It should be noted that to some extent, this analysis and subsequent discussions will focus on the total expenditure excluding imputed rental charges. This is because rental charges are indirectly captured from the survey and estimated. Excluding imputed rent, allows for a more in-depth assessment of the underlying annual expenditure. The results from Table 5 show that households spent on average SBD$53,961 annually excluding imputed rent. This is slightly more than a third (36%) of annual median expenditure of SBD$39, 546. The gap between the average and median amounts shows the skewness in the distribution of expenditure (income) and implies that certain households have relatively higher or extremely lower annual expenditures than the majority of the households. Table 5: Annual total, average, median and per capita expenditure (excl. imputed rents) by area
Area Hholds Pop
-ulation
Av. Hhold
size
Total expenditure
(SBD)
Average expenditure (SBD)
Median expenditure (SBD)
Per hhold Per capita Per hhold Per capita Urban 19,015 114,451 6.0 1,882,610,468 99,007 16,449 73,147 12,443 Rural 89,026 501,353 5.6 3,947,443,032 44,340 7,874 35,772 6,152 Total 108,041 615,804 5.7 5,830,053,500 53,961 9,467 39,546 6,856 The results from Table 5 show dissimilarities in spending behaviour among households in urban and rural areas. In the urban areas, average household expenditure is about a third more
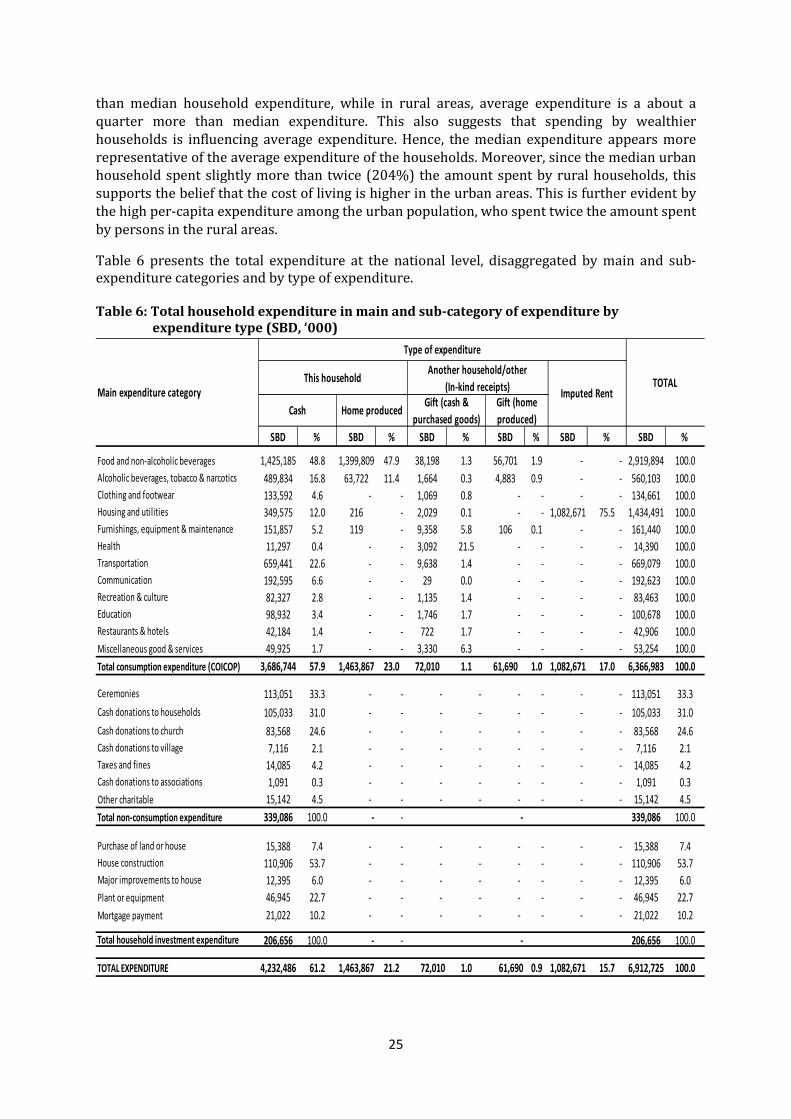
25
than median household expenditure, while in rural areas, average expenditure is a about a quarter more than median expenditure. This also suggests that spending by wealthier households is influencing average expenditure. Hence, the median expenditure appears more representative of the average expenditure of the households. Moreover, since the median urban household spent slightly more than twice (204%) the amount spent by rural households, this supports the belief that the cost of living is higher in the urban areas. This is further evident by the high per-capita expenditure among the urban population, who spent twice the amount spent by persons in the rural areas.
Table 6 presents the total expenditure at the national level, disaggregated by main and sub-expenditure categories and by type of expenditure. Table 6: Total household expenditure in main and sub-category of expenditure by expenditure type (SBD, ‘000)
SBD % SBD % SBD % SBD % SBD % SBD %
Food and non-alcoholic beverages 1,425,185 48.8 1,399,809 47.9 38,198 1.3 56,701 1.9 - - 2,919,894 100.0Alcoholic beverages, tobacco & narcotics 489,834 16.8 63,722 11.4 1,664 0.3 4,883 0.9 - - 560,103 100.0Clothing and footwear 133,592 4.6 - - 1,069 0.8 - - - - 134,661 100.0Housing and utilities 349,575 12.0 216 - 2,029 0.1 - - 1,082,671 75.5 1,434,491 100.0Furnishings, equipment & maintenance 151,857 5.2 119 - 9,358 5.8 106 0.1 - - 161,440 100.0Health 11,297 0.4 - - 3,092 21.5 - - - - 14,390 100.0Transportation 659,441 22.6 - - 9,638 1.4 - - - - 669,079 100.0Communication 192,595 6.6 - - 29 0.0 - - - - 192,623 100.0Recreation & culture 82,327 2.8 - - 1,135 1.4 - - - - 83,463 100.0Education 98,932 3.4 - - 1,746 1.7 - - - - 100,678 100.0Restaurants & hotels 42,184 1.4 - - 722 1.7 - - - - 42,906 100.0Miscellaneous good & services 49,925 1.7 - - 3,330 6.3 - - - - 53,254 100.0Total consumption expenditure (COICOP) 3,686,744 57.9 1,463,867 23.0 72,010 1.1 61,690 1.0 1,082,671 17.0 6,366,983 100.0
Ceremonies 113,051 33.3 - - - - - - - - 113,051 33.3Cash donations to households 105,033 31.0 - - - - - - - - 105,033 31.0Cash donations to church 83,568 24.6 - - - - - - - - 83,568 24.6Cash donations to village 7,116 2.1 - - - - - - - - 7,116 2.1Taxes and fines 14,085 4.2 - - - - - - - - 14,085 4.2Cash donations to associations 1,091 0.3 - - - - - - - - 1,091 0.3Other charitable 15,142 4.5 - - - - - - - - 15,142 4.5Total non-consumption expenditure 339,086 100.0 - - - 339,086 100.0
Purchase of land or house 15,388 7.4 - - - - - - - - 15,388 7.4House construction 110,906 53.7 - - - - - - - - 110,906 53.7Major improvements to house 12,395 6.0 - - - - - - - - 12,395 6.0Plant or equipment 46,945 22.7 - - - - - - - - 46,945 22.7Mortgage payment 21,022 10.2 - - - - - - - - 21,022 10.2
Total household investment expenditure 206,656 100.0 - - - 206,656 100.0
TOTAL EXPENDITURE 4,232,486 61.2 1,463,867 21.2 72,010 1.0 61,690 0.9 1,082,671 15.7 6,912,725 100.0
TOTALMain expenditure category
Cash Home produced Gift (cash & purchased goods)
Gift (home produced)
Type of expenditure
Imputed Rent
Another household/other (In-kind receipts)
This household

26
At the national level, Table 6 shows that households spent close to half the total consumption expenditure on food and non-alcoholic beverages mainly through cash-payments and home production. Another significant spending recorded is the rental equivalent of imputed rent that accounted for close to 80% of total expenditure within the housing and utilities expenditure sub-category. It should be noted that although the findings from the HIES 2012/13 reveal payments on some specific non-consumption items, such as taxes and fines, the amounts appear understated when compared with other administrative data sources. The same is likely to apply to spending on alcoholic beverages, tobacco and illicit drugs etc. Hence, caution must be taken by the user and adjustments made where necessary depending on user interests and focus of analysis. The main underlying reasons or factors are discussed earlier as part of non-sampling errors.
EXPENDITURE BY MAIN CATEGORY AND TYPE
Total annual expenditure consists of consumption expenditure, non-consumption expenditure and investment expenditure, as presented in Table 7 below. Consumption expenditure accounts for 92% of total expenditure. The same percent is recorded in both urban and rural areas. Non-consumption expenditure consists of 5% of total expenditure at the national, and both urban and rural areas. Investment expenditure accounts for 3% and is slightly higher in urban areas (3.5%) than in rural areas (2.8%). Table 7: Total household expenditure in main expenditure category by area ('000)
Main Expenditure category National Urban Rural
SBD % SBD % SBD %
Total consumption expenditure (COICOP) 6,366,983 92.1 2,041,519 92.0 4,325,465 92.2
Total non-consumption expenditure 339,086 4.9 101,260 4.6 237,825 5.1
Total H/hold investment expenditure 206,656 3.0 77,077 3.5 129,579 2.8
TOTAL EXPENDITURE 6,912,725 100.0 2,219,856 100.0 4,692,869 100.0 Figure 20: Total expenditure by (a) main category; and (b) category by area
Consumpt'n 92%
Non-consumpt'n
5%
Household investment
3%
0
1
2
3
4
5
Urban Rural
Annu
al e
xpen
ditu
re (S
BD)
Billi
ons
Area
Consumption Non-consumption Household investment
(a) (b)

27
For urban and rural areas, the breakdown of expenditure by main category is almost the same as the national levels (Figure 20). It is estimated that urban households spent SBD$2.2 billion (32% of total expenditure) per annum while rural households spent SBD$4.7 billion (68% of total expenditure). The contribution of urban and rural area expenditure to total expenditure is presented in Figure 20b. Following from Table 7 above, the total annual household expenditure disaggregated by main expenditure categories and by urban and rural areas is summarised in Table 8 below. Similar to the national level results, in both urban and rural areas, households spent relatively the highest amounts on food and non-alcoholic beverages (46% urban; 53% rural) as a share of consumption expenditure. This is followed by spending on housing and utilities in both urban (23%) and rural (19%) areas, respectively. Table 8: Total annual expenditure in main expenditure categories (SBD, ‘000)
Food and non-a lcohol ic beverages 2,919,894 45.9 609,707 29.9 2,310,188 53.4
Alcohol ic beverages , tobacco & narcotics 560,103 8.8 211,271 10.3 348,833 8.1
Clothing and footwear 134,661 2.1 41,449 2.0 93,211 2.2
Hous ing and uti l i ties 1,434,491 22.5 599,890 29.4 834,601 19.3
Furnishings , equipment & maintenance 161,440 2.5 53,005 2.6 108,435 2.5
Health 14,390 0.2 3,846 0.2 10,544 0.2
Transportation 669,079 10.5 312,639 15.3 356,440 8.2
Communication 192,623 3.0 94,951 4.7 97,673 2.3
Recreation & cul ture 83,463 1.3 24,670 1.2 58,793 1.4
Education 100,678 1.6 41,419 2.0 59,259 1.4
Restaurants & hotels 42,906 0.7 22,092 1.1 20,816 0.5
Miscel laneous good & services 53,254 0.8 26,581 1.3 26,674 0.6
Total consumption expenditure COICOP 6,366,983 100.0 2,041,519 100.0 4,325,465 100.0
Ceremonies 113,051 33.3 27,707 27.4 85,344 35.9
Cash donations to households 105,033 31.0 40,332 39.8 64,701 27.2
Cash donations to church 83,568 24.6 21,754 21.5 61,814 26.0
Cash donations to vi l lage 7,116 2.1 1,161 1.1 5,955 2.5
Taxes and fines 14,085 4.2 5,005 4.9 9,080 3.8
Cash donations to associations 1,091 0.3 526 0.5 565 0.2
Other chari table 15,142 4.5 4,776 4.7 10,366 4.4
Total non-consumption expenditure 339,086 100.0 101,260 100.0 237,825 100.0
Purchase of land or house 15,388 7.4 3,870 5.0 11,518 8.9
House construction 110,906 53.7 30,104 39.1 80,802 62.4
Major improvements to house 12,395 6.0 6,276 8.1 6,120 4.7
Plant or equipment 46,945 22.7 21,205 27.5 25,740 19.9
Mortgage payment 21,022 10.2 15,623 20.3 5,399 4.2
Total household investment expenditure 206,656 100.0 77,077 100.0 129,579 100.0
TOTAL EXPENDITURE 6,912,725 100.0 2,219,856 100.0 4,692,869 100.0
Main Expenditure categoryTotal Urban Rural
SBD % SBD % SBD %

28
In terms of non-consumption expenditure, spending on ceremonies makes up the highest percent (36%) of total expenditure in the rural areas while in urban areas, households spent the highest on cash donations to another household (40%). Moreover, households spent relatively the highest in investment expenditure on housing construction in both urban (31%) and rural (62%) areas. The type of expenditure by area presented also in Figure 21 shows that two-thirds of total expenditure in the country is cash-based expenditure. This makes up of 82% and 53% of urban and rural expenditure, respectively. Figure 21 clearly demonstrates the importance of home production in rural areas although cash-based expenditure appears more predominant for the majority of rural-households. Figure 21: Total Expenditure by selected type of expenditure and area
EXPENDITURE BY DIVISION AND SUB-CATEGORY
Table 9 and Figure 22 below present a further breakdown of consumption expenditure by COICOP division (sub-category) at the national (a), urban (b) and rural (c) levels, and by expenditure type. Detailed tables are presented in Appendix 2.
It is evident that 60% of all consumption expenditure is made in cash. Cash purchases for food and non-alcoholic beverages are highly predominant among urban households, accounting for 88% of all the types of expenditure on food and non-alcoholic beverages.
Home production plays a much less significant role in urban food consumption expenditure than it does in rural areas. In addition, the estimated value of home production varies considerably among urban households, accounting for only 3% of total consumption expenditure compared to 32% in rural areas (see Figure 22).
Although expenditure on imputed rent (housing and utilities) in rural areas is SBD$745 million, more than twice the urban amount of SBD$337 million, its relative share of total consumption expenditure is 17% for both urban and rural areas, respectively.
It is interesting to note that in the rural areas, 18% of total consumption of alcohol beverages, tobacco and narcotic substances is home produced.
In-kind receipts in the form of gifts (cash and cash purchases) and home produce made to another household accounted for 2% of the total consumption expenditure at the national level, although this is slightly higher and more prominent among rural households.
62% 82%
53%
22% 3%
31%
16% 15% 16%
0%
20%
40%
60%
80%
100%
National Urban Rural
% o
f tot
al h
ouse
hold
exp
endi
ture
Cash Home produced Imputed rent

29
Table 9: Total annual consumption expenditure by type of expenditure and area (SBD, ‘000)
SBD % SBD % SBD % SBD % SBD % SBD %
Food and non-alcoholic bev. 1,425,185 48.8 1,399,809 47.9 38,198 1.3 56,701 1.9 - - 2,919,894 100.0Alcoholic bev., tob. & narcotic 489,834 16.8 63,722 11.4 1,664 0.3 4,883 0.9 - - 560,103 100.0Clothing and footwear 133,592 4.6 - - 1,069 0.8 - - - - 134,661 100.0Housing and utilities 349,575 12.0 216 - 2,029 0.1 - - 1,082,671 75.5 1,434,491 100.0Furnishings, equip. & maint. 151,857 5.2 119 - 9,358 5.8 106 0.1 - - 161,440 100.0Health 11,297 0.4 - - 3,092 21.5 - - - - 14,390 100.0Transportation 659,441 22.6 - - 9,638 1.4 - - - - 669,079 100.0Communication 192,595 6.6 - - 29 0.0 - - - - 192,623 100.0Recreation & culture 82,327 2.8 - - 1,135 1.4 - - - - 83,463 100.0Education 98,932 3.4 - - 1,746 1.7 - - - - 100,678 100.0Restaurants & hotels 42,184 1.4 - - 722 1.7 - - - - 42,906 100.0Miscellaneous 49,925 1.7 - - 3,330 6.3 - - - - 53,254 100.0Total consumption expenditure (COICOP)
3,686,744 57.9 1,463,867 23.0 72,010 1.1 61,690 1.0 1,082,671 17.0 6,366,983 100.0
Food and non-alcoholic bev. 539,355 88.5 57,863 9.49 8,031 1.32 4,458 0.7 - - 609,707 100.0Alcoholic bev., tob. & narcotic 208,765 98.8 2,065 0.98 311 0.15 130 0.1 - - 211,284 100.0Clothing and footwear 40,812 98.5 - - 637 1.54 - - - - 41,452 100.0Housing and utilities 261,091 43.5 - - 1,554 0.26 - - 337,245 56.22 599,906 100.0Furnishings, equip. & maint. 49,213 92.8 13 0.02 3,779 7.13 - - - - 53,008 100.0Health 3,831 99.6 - - 15 0.39 - - - - 3,846 100.0Transportation 309,880 99.1 - - 2,759 0.88 - - - - 312,658 100.0Communication 94,925 99.97 - - 26 0.03 - - - - 94,957 100.0Recreation & culture 24,066 97.5 - - 604 2.45 - - - - 24,671 100.0Education 40,625 98.1 - - 794 1.92 - - - - 41,422 100.0Restaurants & hotels 21,644 98.0 - - 448 2.03 - - - - 22,093 100.0Miscellaneous 25,864 97.3 - - 717 2.70 - - - - 26,583 100.0Total consumption expenditure (COICOP)
1,620,071 79.4 59,941 2.9 19,673 0.96 4,588 0.2 337,245 16.5 2,041,519 100.0
Food and non-alcoholic bev. 885,831 38.3 1,341,947 58.1 30,167 1.3 52,243 2.3 - - 2,310,188 100.0Alcoholic bev., tob. & narcotic 281,069 80.6 61,658 17.7 1,353 0.4 4,753 1.4 - - 348,833 100.0Clothing and footwear 92,779 99.5 - - 432 0.5 - - - - 93,211 100.0Housing and utilities 88,484 10.6 216 0.03 475 0.1 - - 745,426 89.3 834,601 100.0Furnishings, equip. & maint. 102,644 94.7 106 0.10 5,579 5.1 106 0.1 - - 108,435 100.0Health 7,467 70.8 - - 3,077 29.2 - - - - 10,544 100.0Transportation 349,561 98.1 - - 6,879 1.9 - - - - 356,440 100.0Communication 97,670 99.997 - - 3 0.0 - - - - 97,673 100.0Recreation & culture 58,261 99.1 - - 532 0.9 - - - - 58,793 100.0Education 58,307 98.4 - - 952 1.6 - - - - 59,259 100.0Restaurants & hotels 20,541 98.7 - - 275 1.3 - - - - 20,816 100.0Miscellaneous 24,061 90.2 - - 2,613 9.8 - - - - 26,674 100.0Total consumption expenditure (COICOP) 2,066,674 47.8 1,403,926 32.46 52,337 1.2 57,102 1.3 745,426 17.2 4,325,465 100.0
URBAN
RURAL
TOTALThis household Another household/other (In-kind receipts) Imputed Rent
Cash Home produced Gift (cash & purchased goods)
Gift (home produced)
Main expenditure category (COICOP)
Type of expenditure
TOTAL

30
Figure 22: Total consumption expenditure in COICOP division by selected type of expenditure by national (a), urban (b) and rural (c) areas
In terms of non-consumption expenditure, more than 70% of total non-consumption expenditure comes from households in rural areas. When analysed for specific type of expenditure, close to 90% of non-consumption expenditure at the national, urban and rural areas consists of cash-spending on ceremonies, cash donations to households and cash donations to churches (see Figure 23). Figure 23: Total non-consumption expenditure sub-categories by national (a), urban (b), (c) rural
23.0% 5.5% 10.5% 7.7% 3.0% 2.5% 2.1% 1.6% 1.3% 0.8% 0.7% 0.2%
22.9%
1.1%
17.0%
0% 10% 20% 30% 40% 50%
1. Food and non-alcoholic bev2. Housing and utilities
3. Transportation4. Alcoholic bev, tobac and illicit subs
5. Communication6. Furnishings, equipment & maint
7. Clothing and footwear8. Education
9. Recreation & culture10. Miscellaneous good & services
11. Restaurants & hotels12. Health
% of total expenditure
COIC
OP
divi
sion
(a)
Cash
Home produced
Imputed Rent
26.8% 12.9% 15.3% 10.2% 4.7% 2.6% 2.0% 2.0% 1.2% 1.3% 1.1% 0.2%
3.1% 16.5%
0% 5% 10% 15% 20% 25% 30% 35%
1
2
3
4
5
6
7
8
9
10
11
12 (b)
CashHome producedImputed Rent
21.2% 2.1% 8.2% 6.5% 2.3% 2.5% 2.2% 1.4% 1.4% 0.6% 0.5% 0.2%
32.2%
1.5%
17.2%
0% 10% 20% 30% 40% 50% 60%
123456789
101112 (c)
Cash
Home produced
Imputed Rent
Ceremony 33%
Donation to HHs
31%
Donation to church
25% Other charitable
5%
Taxes / fines 4%
Other 2%
Other 11%
(a)
Donation to HHs
40%
Ceremony 27%
Donation to church
21% Taxes / fines 5%
Other charitable
5%
Other 2%
Other 12%
(b)
Ceremony 36%
Donation to HHs
27%
Donation to church
26% Donation to village
2% Taxes /
fines 4%
Other 5%
Other 11%
(c)

31
Spending on investment by area shows that household investment in the rural areas accounts for 63% of all investment spending. In both urban and rural areas, the highest spending is on house construction (39% in urban; 62% in rural), followed by spending on plant or equipment (28% in urban; 20% in rural). Mortgage payment is more predominant in urban areas (20%) than rural (4%) (see Figure 24).
Figure 24: Total investment expenditure in sub-category by national (a), urban (b) and rural (c)
CONSUMPTION EXPENDITURE BY DIVISION (COICOP)
In this section, a further disaggregation of consumption expenditure by COICOP division or sub-category is presented by area. Firstly, Table 10 presents expenditure on the food and non-alcoholic beverages division, given its relatively higher weight (46%) of total consumption expenditure. The types of expenditure relating to gifts (cash or home-produced goods) to another household are aggregated into total cash and home production.
At the national level, Table 10 confirms that vegetables account for the highest share (34%) of all food and non-alcoholic expenditure group which is primarily due to the high proportion of home production consumed in rural areas (see also Figure 25). The high proportion of home produced expenditure in rural areas is indicative of the importance of subsistence production in rural areas. However, in terms of cash-expenditure, bread and cereals (e.g., rice) alone account for the highest share (54%) of total cash-expenditure. Rural households spent 60% of their total cash on bread and cereals, while urban households spent 43%. In addition, 70% of all expenditure on food and cereals was spent by rural households (see also Table 11).
House const'n
54% Plant or
equip 23%
Mortgage payment
10%
Other 13%
(a)
House const'n
39%
Plant or
equip 28%
Mortgage payment
20%
Other 13%
(b)
House const'n
62%
Plant or
equip 20%
Purchase of land or
house 9%
Other 9%
(c)

32
Table 10: Total annual consumption expenditure by expenditure on food and non-alcoholic beverages, and alcoholic beverages, tobacco and narcotics by area (‘000)
Tobacco consumption accounts for the highest expenditure class within the alcoholic beverages, tobacco and narcotics sub-divisional level. This is followed by spending on beer and narcotics (Figure 26). Households spent SBD$264 million, slightly more than half (54%) of their total cash-expenditure on tobacco. This is more predominant among rural households and accounts for 57% of their cash-expenditure. In addition, rural household spending on tobacco accounts for 61% of total consumption expenditure on tobacco (see Table 11). Betel-nut is particularly important in rural areas, accounting for almost 20% of rural expenditure in this division. Moreover, the majority of expenditure in the clothing and footwear division is on garments (see Figure 27).
SBD % SBD % SBD % SBD % SBD % SBD % SBD % SBD % SBD %Food and non-alcoholic bevVegetables 135,636 9.3 860,071 59.1 995,706 34.1 68,530 12.5 36,576 58.7 105,106 17.2 67,106 7.3 823,495 59.1 890,600 38.6Bread & cereals 785,615 53.7 383 0.03 785,999 26.9 235,977 43.1 5 0.0 235,982 38.7 549,638 60.0 378 0.0 550,017 23.8Fish and seafood 224,930 15.4 296,204 20.3 521,135 17.8 94,808 17.3 11,905 19.1 106,712 17.5 130,123 14.2 284,300 20.4 414,422 17.9Fruit 42,821 2.9 242,153 16.6 284,974 9.8 25,540 4.7 11,000 17.7 36,540 6.0 17,281 1.9 231,153 16.6 248,434 10.8Meat 92,202 6.3 51,255 3.5 143,457 4.9 50,288 9.2 2,537 4.1 52,826 8.7 41,914 4.6 48,717 3.5 90,631 3.9Sugar, jam, honey, choc, confec 75,054 5.1 100 0.01 75,154 2.6 22,104 4.0 0 0.0 22,104 3.6 52,950 5.8 100 0.0 53,051 2.3Coffee, tea, cocoa 39,937 2.7 2,075 0.1 42,013 1.4 16,038 2.9 0 0.0 16,038 2.6 23,899 2.6 2,075 0.1 25,974 1.1Oils & fats 20,371 1.4 21 0.001 20,392 0.7 9,837 1.8 0 0.0 9,837 1.6 10,534 1.2 21 0.0 10,555 0.5Food products nec 19,082 1.3 87 0.006 19,170 0.7 6,843 1.3 1 0.0 6,844 1.1 12,240 1.3 86 0.0 12,326 0.5Non-alcoholic bev 17,889 1.2 0 0.0 17,889 0.6 11,103 2.0 0 0.0 11,103 1.8 6,785 0.7 0 0.0 6,785 0.3Milk, cheese, eggs 9,846 0.7 4,161 0.3 14,006 0.5 6,318 1.2 297 0.5 6,615 1.1 3,528 0.4 3,864 0.3 7,392 0.3Total food and non-alcoholic bev 1,463,383 100.0 1,456,510 100.0 2,919,894 100.0 547,385 100.0 62,321 100.0 609,706 100.0 915,998 100.0 1,394,189 100.0 2,310,187 100.0Alcoholic beverages, tobacco & narcoticsBeer 165,091 33.6 0 0.0 165,091 29.5 76,211 36.5 0 0.0 76,211 36.1 88,880 31.5 0 0.0 88,880 25.5Narcotics 58,591 11.9 68,605 100.0 127,196 22.7 29,344 14.0 2,195 100.0 31,539 14.9 29,246 10.4 66,411 100.0 95,657 27.4Spirits 3,109 0.6 0 0.0 3,109 0.6 880 0.4 0 0.0 880 0.4 2,230 0.8 0 0.0 2,230 0.6Tobacco 263,855 53.7 0 0.0 263,855 47.1 102,067 48.8 0 0.0 102,067 48.3 161,788 57.3 0 0.0 161,788 46.4Wine 852 0.2 0 0.0 852 0.2 573 0.3 0 0.0 573 0.3 278 0.1 0 0.0 278 0.1Total alcoholic beverages, tobacco & narcotics 491,498 100.0 68,605 100.0 560,103 100.0 209,076 100.0 2,195 100.0 211,271 100.0 282,144 100.0 66,411 100.0 348,554 100.0
Home produced TotalExpenditure category and sub-categories Cash Home produced Total Cash Home produced Total CashTotal Urban Rural

33
Figure 25: National (a), urban (b) and rural (c) expenditure distribution within food and non-alcoholic beverage COICOP division by class and type
Figure 26 Figure 27
Figure 26: Expenditure within alcoholic beverages, tobacco and illicit substances COICOP division by class, type and area Figure 27: Expenditure within clothing and footwear COICOP division by class and area Figure 28 and Table 11 below show that imputed rent is the highest expenditure class in the housing and utilities COICOP division. This applies mainly in rural areas where rented households are rare and are imputed from mainly owner-occupied dwellings. In urban areas,
0% 10% 20% 30% 40%
1 Vegetables2 Bread & cereals
3 Fish and seafood4 Fruit
5 Meat6 Sug, choc, confec
7 Coffee, tea, cocoa8 Oils & fats
9 Food products nec10 Non-alcoholic bev11 Milk, cheese, eggs
Distribution of expenditure within COICOP division
COIC
OP
Cla
ss
(a)
Cash
0% 10% 20% 30% 40%
123456789
1011 (b)
Cash
Home produced
0% 10% 20% 30% 40%
123456789
1011 (c)
Cash
Home produced
0% 10% 20% 30% 40% 50%
TobaccoBeer
NarcoticsSpiritsWine
TobaccoBeer
NarcoticsSpiritsWine
TobaccoBeer
NarcoticsSpiritsWine
Nat
iona
lU
rban
Rura
l
Distribution of expenditure within COICOP division
COIC
OP
clas
s
Cash
Home produced
0% 20% 40% 60% 80% 100%
GarmentsShoes, footwear
Clothing materialsOther clothing
Cleaning, repair, hireGarments
Shoes, footwearClothing materials
Other clothingCleaning, repair, hire
GarmentsShoes, footwear
Clothing materialsOther clothing
Cleaning, repair, hire
Nat
iona
lU
rban
Rura
l
Distribution of expenditure within COICOP division
COIC
OP
clas
s

34
cash-based expenditure primarily consists of rental payments, electricity, water and gas. Liquid fuels as a source of energy are the largest cash-based expense in rural areas. The majority of expenditure in the furnishing, equipment and maintenance division is dedicated to non-durable goods as shown in Figure 29. In rural areas, a higher proportion of expenditure within this division consists of major tools and equipment. The results from Figure 30 and Table 11 show that in the health COICOP division, there is a difference in spending between urban and rural areas, with urban households allocating a higher proportion of their expenditure to medical services (doctor, etc.) while rural households allocate more of their expenditures to hospital services.
In terms of expenditure on transportation, Figure 31 shows that the majority of spending is allocated to passenger transport by road especially in urban areas, while transportation by sea and waterline areas is predominant in rural areas.
Table 11: Total annual consumption expenditure by selected sub-category of expenditure items by area (‘000)
In terms of spending on recreation and culture, Figure 34 below shows that the majority of expenditure is on major outdoor recreational durables, followed by information processing equipment, technical equipment, pets, pet products, and stationary.
Moreover, expenditure in the restaurant and hotel COICOP division is primarily in restaurants and cafes (see Figure 35). Last but not least, personal products and other personal effects account for the majority of expenditure within the miscellaneous goods and services division.
Expenditure sub-categories
SBD % SBD % SBD % Cont...Expenditure sub-categories
SBD % SBD % SBD %
Food & non-alcoholic bev TransportationBread & cereals 785,999 100 235,982 30.0 550,017 70.0 Passenger transport (road) 192,388 100 107,750 56.0 84,637 44.0
Fish and seafood 521,135 100 106,712 20.5 414,422 79.5Passenger transport (sea & waterway) 183,655 100 40,161 21.9 143,493 78.1
Fruit 284,974 100 36,540 12.8 248,434 87.2 CommunicationMeat 143,457 100 52,826 36.8 90,631 63.2 Postal services 640 100 147 23.0 493 77.0Sugar, jam, confec 75,154 100 22,104 29.4 53,051 70.6 Telephone and telefax servic 180,786 100 89,134 49.3 91,652 50.7Milk, cheese, eggs 14,006 100 6,615 47.2 7,392 52.8 Education
Alcohol bev, tobacco/narcoticsPost- secondary non-tertiary education 4,406 100 1,045 23.7 3,360 76.3
Beer 165,091 100 76,211 46.2 88,880 53.8Pre-primary and primary education 22,885 100 13,066 57.1 9,818 42.9
Narcotics 127,196 100 31,539 24.8 95,657 75.2 Secondary education 49,401 100 17,222 34.9 32,179 65.1Tobacco 263,855 100 102,067 38.7 161,788 61.3 Tertiary education 21,856 100 8,932 40.9 12,924 59.1Housing and utilities Restaurants & hotels
Actual rentals 104,472 100 103,745 99.3 727 0.7 Accommodation services 6,730 100 2,106 31.3 4,624 68.7Electricity 44,434 100 43,372 97.6 1,062 2.4 Restaurants, cafes 36,176 100 19,985 55.2 16,191 44.8Water supply 33,600 100 33,372 99.3 227 0.7 Miscellaneous good & servicesHealth Motor cars 17,030 100 12,380 72.7 4,650 27.3Hospital services 5,663 100 105 1.9 5,559 98.1Medical services 2,606 100 1,565 60.1 1,041 39.9
Total Urban RuralTotal Urban Rural

35
Figure 28: National (a), urban (b) and rural (c) expenditure distribution within housing and utilities COICOP division by class and type
Figure 29: National (a), urban (b) and rural (c) expenditure distribution within furnishing, equipment and maintenance COICOP division by class
0% 10% 20% 30% 40% 50% 60% 70%
1 Imputed rent (owner occupy)
3 Rent
5 Electricity
7 Water
9 Materials for repair & maint
11 Services for repair & maint
13 Other services nec
15 Heat energy
COIC
OP
clas
s
(a)
Cash
Home produced
Imputed rent
0% 10% 20% 30% 40% 50% 60% 70% 80%
1
3
5
7
9
11
13
15 (b)
Cash
Home produced
Imputed rent
0% 10% 20% 30% 40% 50% 60% 70% 80%
123456789
101112131415 (c)
Cash
Home produced
Imputed rent
0% 5% 10% 15% 20% 25%
1 Non durable goods
3 Hosehold services
5 Small tools and misc…
7 Glassware, tableware, utensils
9 Carpets, floor coverings
11 Repair of appliance
Distribution of expenditure within COICOP dividion
COIC
OP
clas
s
(a)
0% 5% 10% 15% 20% 25%
1
3
5
7
9
11(b)
0% 5% 10% 15% 20% 25%
123456789
101112 (c)

36
Figure 30: National (a), urban (b) and rural (c) expenditure distribution within health COICOP division by class
Figure 31: National (a), urban (b) and rural (c) expenditure distribution within transportation COICOP division by class
0% 10% 20% 30% 40% 50% 60%
1 Hospital services
2 Pharmaceutical products
3 Medical services
4 Paramedical serviecs
5 Dental services
6 Therapeutic appliances,…
7 Other medical products
COIC
OP
clas
s
(a)
0% 10% 20% 30% 40% 50% 60%
1
2
3
4
5
6
7 (b)
0% 10% 20% 30% 40% 50% 60%
1
2
3
4
5
6
7 (c)
0% 10% 20% 30% 40%
1 Road2 Sea and inland waterway
3 Fuel and lubricant for…4 Air
5 Cars6 Maintenance and repair
7 Spare parts and accessories8 Bicycles
9 Other services10 Motor cycles
11 Combined transport12 Other transport services (a)
0% 5% 10% 15% 20% 25% 30% 35% 40%
123456789
101112 (b)
0% 10% 20% 30% 40%
123456789
101112 (c)

37
Figure 32: Expenditure within communication COICOP division by class and area Figure 33: Expenditure within education COICOP division by class and area Communication Education
Figure 34: National (a), urban (b) and rural (c) expenditure distribution within recreation and culture COICOP division by class
0% 10% 20% 30% 40% 50% 60% 70% 80% 90% 100%
Telephone & fax services
Telephone & fax equipment
Postal services
Telephone & fax services
Telephone & fax equipment
Postal services
Telephone & fax services
Telephone & fax equipment
Postal services
Nat
iona
lU
rban
Rura
l
0% 10% 20% 30% 40% 50% 60%
Secondary
Tertiary
Other education
Pre-primary & primary
Post- secondary, non-tertiary
Secondary
Tertiary
Other education
Nat
iona
lU
rban
Rura
l
0% 5% 10% 15% 20% 25% 30%
1 Major outdoor rec durables
3 Technical equipment
5 Stationery
7 Games, toys, hobbies
9 Photographic equipment
11 Cultural services
13 Recording media
15 Maintenance and repair…
17 Repair of tech equipment
19 Miscellaneous (a)
0% 10% 20% 30%
1
3
5
7
9
11
13
15
17
19 (b)
0% 10% 20% 30% 40%
1
3
5
7
9
11
13
15
17
19 (c)

38
Figure 35: Expenditure distribution within restaurant COICOP division by class and area
Figure 36: National (a), urban (b) and rural (c) expenditure distribution within miscellaneous goods and services COICOP division by class
0% 10% 20% 30% 40% 50% 60% 70% 80% 90% 100%
Restaurants, cafes
Accommodation
Restaurants, cafes
Accommodation
Restaurants, cafes
Accommodation
Nat
iona
lU
rban
Rura
l
0% 10% 20% 30% 40% 50% 60%
1 Products personal care2 Other personal effects
3 Other services nec4 Jewellery, clocks, watches
5 HH insurance6 Life Insurance
7 Transport insurance8 Other insurance
9 Health insurance10 Hairdressing
11 Financial services nec12 Electric appliances (a)
0% 10% 20% 30% 40% 50% 60%
1
2
3
4
5
6
7
8
9
10
11
12 (b)
0% 10% 20% 30% 40% 50% 60%
1
2
3
4
5
6
7
8
9
10
11
12 (c)

39
Table 12 below presents the total annual expenditure of selected specific goods and services by area. It is evident that households spent close to half a million (SBD$470 million) annually in cash-payments on rice as a staple product in the country. About three quarters (76%) of this expenditure comes from rural households. This is despite the fact that home production of food products is predominant in rural areas.
Following from expenditure on rice is expenditure on transport services, particularly sea transport also mentioned earlier. Total sea transport expenditure amounts to SBD$170 million, and close to 80% of this amount is attributed to rural spending. This is indicative of the preferred mode of transport given the geographical nature of a country that mainly consists of scattered islands and atolls.
It is also evident that beer and betel-nut are highly consumed commodities. The former is consumed more by rural households (59%) than urban households (41%).
Table 12: Total annual consumption expenditure of selected goods and services by area ('000)
Selected goods and services Area
TOTAL URBAN RURAL SBD % SBD % SBD %
RICE (SOLRAIS) 470,063 100 111,690 23.8 358,373 76.2 FLOUR-PLAIN WHITE (25KG BAG) 12,759 100 3,025 23.7 9,734 76.3 BREAD-WHITE SLICED BREAD(LOAF) 41,062 100 31,842 77.5 9,220 22.5 NOODLE (MAMEE: 85G PKT) 87,965 100 27,479 31.2 60,487 68.8 CORNED BEEF (OX & PALM) 5,503 100 3,035 55.2 2,468 44.8 TUNA (2nd GRADE TAIYO: 180G CAN) 62,416 100 23,285 37.3 39,131 62.7
COCONUT (DRY) 50,431 100 5,296 10.5 45,135 89.5 CABBAGE (SLIPPERY CABBAGE) 67,126 100 16,645 24.8 50,480 75.2 SUGAR (WHITE 'CHELSEA') 58,360 100 13,430 23 44,929 77 BEER (SB) 119,006 100 48,661 40.9 70,345 59.1 BETEL-NUT* 105,935 100 24,499 23.1 81,437 76.9 SCHOOL UNIFORM (14+ YEARS MEN) 4,147 100 1,036 25 3,111 75
SCHOOL UNIFORM (14+ YEARS WOMEN) 3,307 100 1,054 31.9 2,253 68.1
WATER CHARGES (WATER RATES) 30,925 100 30,754 99.4 172 0.6 ELECTRICITY (CASH POWER) 29,412 100 29,412 100 - - MEDICINE (Prescription) 1,667 100 817 49 849 51 FUEL (Car/vehicle) 62,803 100 56,943 90.7 5,861 9.3 TRANSPORT SERVICE (BUS) 115,258 100 68,694 59.6 46,564 40.4 TRANSPORT SERVICE (SEAFARE, BOAT) 169,980 100 35,854 21.1 134,126 78.9
MOBILE CELL PHONES 11,183 100 5,655 50.6 5,528 49.4 SECONDARY EDUCATION FEES 47,418 100 16,910 35.7 30,508 64.3
* Excludes mustard and lime powder for betel-nut use.

40
AVERAGE CONSUMPTION EXPENDITURE
As observed in earlier discussions and in Table 13, annual average household spending excluding imputed rent is higher than the annual median expenditure by a third (36%). The variations in average and median expenditure many not only be influenced by the spending of certain wealthier or poorer households, but also reflects household choices on important expenditure depending on whether the household is located in an urban or rural area. This section expands the discussion on total consumption expenditure and examines average housing spending on consumption.
Table 13: Annual average, median and per capita expenditure (excluding imputed rents) by area
Area Average expenditure
(SBD) Median expenditure
(SBD) Per household Per capita Per household Per capita
Urban 99,007 16,449 73,147 12,443 Rural 44,340 7,874 35,772 6,152 Total 53,961 9,467 39,546 6,856 As seen from earlier discussions regarding consumption expenditure by major expenditure groups, food and non-alcoholic beverages contributed close to half the total consumption expenditure at the national level. This indicates an average amount of SBD$27,000 spent by households on food and non-alcoholic beverages at the country level. This was slightly higher in urban areas where households spent SBD$32,000 on average on food and non-alcoholic beverages, with about similar amounts spent on housing and utilities annually. Table 14: Annual average consumption expenditure by area Major consumption expenditure groups (COICOP)
Total Urban Rural SBD % SBD % SBD %
Food and non-alcoholic beverages 27,026 45.9 32,065 29.9 25,950 53.4 Alcoholic beverages, tobacco & narcotics 5,184 8.8 11,111 10.3 3,918 8.1 Clothing and footwear 1,246 2.1 2,180 2.0 1,047 2.2 Housing and utilities* 13,277 22.5 31,548 29.4 9,375 19.3 Furnishings, equipment & maintenance 1,494 2.5 2,788 2.6 1,218 2.5 Health 133 0.2 202 0.2 118 0.2 Transportation 6,193 10.5 16,442 15.3 4,004 8.2 Communication 1,783 3.0 4,993 4.7 1,097 2.3 Recreation & culture 773 1.3 1,297 1.2 660 1.4 Education 932 1.6 2,178 2.0 666 1.4 Restaurants & hotels 397 0.7 1,162 1.1 234 0.5 Miscellaneous good & services 493 0.8 1,398 1.3 300 0.6 Annual average consumption expenditure 58,931 100.0 107,364 100.0 48,587 100.0 * includes imputed rent Households spent on average slightly more than SBD$2,000 on education costs (mainly school fees) annually in urban areas. It should be noted that some items often generally considered to be a part of education-related expenditure such as school uniforms, school boarding fees and school books etc, are excluded in the current education division classification and reclassified in other divisions. According to the COICOP, school uniforms are classified under the clothing

41
division; school boarding fees are regarded as part of the accommodation group within the restaurant and hotel division; and school books fall under the books, newspaper and stationary group in the recreation and culture division.
The average education expenditure in urban areas is about three times the average amount spent by households in rural areas. Moreover, households spent about SBD$133 annually on average on health costs. The national average is highly influenced by the relatively lower rural average. This is relatively the least (0.2%) spending in the average consumption expenditure.
EXPENDITURE DISTRIBUTION AND INEQUALITY
This section presents an analysis of the distribution of expenditure and inequality. For consistency with the income analysis section, deciles have been produced based on similar expenditure/income types. It is important to note that the weighted household population distribution among the deciles and the analysis of expenditure (income) distribution using these deciles can be misleading, especially in the context where all households are treated within a single distribution. Hence, the deciles have been derived separately by expenditure type and area, and aggregated to ensure consistency in analysis. Table 15 summarises the annual expenditure distribution in deciles and by area. The table shows that 10% (decile 10) of households (wealthier households) spent a quarter of total expenditure in the country. Moreover, the 20% of households (deciles 9 and 10) spent close to four times the expenditure of the lowest 20% (deciles 1 and 2) at the national level, and three times in both urban and rural areas, respectively. Table 15: Total annual expenditure in deciles by area ('000) National Urban Rural Decile SBD % SBD % SBD %
1 312,488 4.5 130,171 5.9 234,076 5.0 2 389,400 5.6 127,814 5.8 289,989 6.2 3 429,843 6.2 150,603 6.8 314,812 6.7 4 473,215 6.8 175,762 7.9 361,077 7.7 5 545,556 7.9 175,888 7.9 396,917 8.5 6 626,692 9.1 168,700 7.6 457,265 9.7 7 693,304 10.0 222,163 10.0 483,466 10.3 8 770,014 11.1 269,605 12.1 519,457 11.1 9 981,959 14.2 316,729 14.3 626,610 13.4
10 1,690,253 24.5 482,421 21.7 1,009,201 21.5 Total 6,912,725 100.0 2,219,856 100.0 4,692,869 100.0
Although deciles 1-5 represent half of all household expenditure, their combined expenditure accounted for only a third of total expenditure in the country. A further disaggregation of deciles by expenditure type and area is shown in Tables 16, 16a and 16b below. As evident in the tables, the richest 20% of ‘cash’ spending households spent five times the amount spent by the lowest 20% of households at the national level, and about three and four times in urban and rural areas, respectively.

42
Table 16: Total annual household expenditure in decile by main expenditure type ('000) Main expenditure type Decile Cash % Home Produce % Imputed Rent % Total %
1 174,808 4.1 69,053 4.5 68,627 6.3 312,488 4.5 2 193,881 4.5 103,443 6.8 92,076 8.5 389,400 5.6 3 220,839 5.1 131,853 8.6 77,150 7.1 429,843 6.2 4 245,241 5.7 151,653 9.9 76,321 7.0 473,215 6.8 5 294,776 6.8 160,669 10.5 90,112 8.3 545,556 7.9 6 344,153 8.0 176,497 11.6 106,042 9.8 626,692 9.1 7 397,989 9.2 177,493 11.6 117,822 10.9 693,304 10.0 8 464,910 10.8 205,186 13.4 99,918 9.2 770,014 11.1 9 656,432 15.2 192,785 12.6 132,743 12.3 981,959 14.2
10 1,311,467 30.5 156,925 10.3 221,861 20.5 1,690,253 24.5 Total 4,304,496 100.0 1,525,557 100.0 1,082,671 100.0 6,912,725 100.0
Table 16a: Urban total annual expenditure in decile by main expenditure type (‘000)
Urban: Main expenditure type
Decile Cash % Home
Produce % Imputed
Rent % Total % 1 100,582 5.5 4,407 6.8 25,182 7.5 130,171 5.9 2 98,626 5.4 7,381 11.4 21,807 6.5 127,814 5.8 3 120,311 6.6 6,319 9.8 23,972 7.1 150,603 6.8 4 136,608 7.5 7,365 11.4 31,789 9.4 175,762 7.9 5 148,007 8.1 6,501 10.1 21,380 6.3 175,888 7.9 6 133,161 7.3 7,861 12.2 27,678 8.2 168,700 7.6 7 178,460 9.8 6,789 10.5 36,914 10.9 222,163 10.0 8 216,648 11.9 6,164 9.6 46,793 13.9 269,605 12.1 9 270,963 14.9 6,450 10.0 39,316 11.7 316,729 14.3
10 414,715 22.8 5,293 8.2 62,413 18.5 482,421 21.7 Total 1,818,081 100.0 64,529 100.0 337,245 100.0 2,219,856 100.0

43
Table 16b: Rural total annual expenditure in decile by main expenditure type (‘000)
Rural : Main expenditure type
Decile Cash % Home
Produce % Imputed
Rent % Total % 1 121,641 4.9 57,240 3.9 55,195 7.4 234,076 5.0 2 131,668 5.3 86,896 5.9 71,425 9.6 289,989 6.2 3 152,068 6.1 107,076 7.3 55,668 7.5 314,812 6.7 4 172,265 6.9 125,778 8.6 63,034 8.5 361,077 7.7 5 190,310 7.7 140,966 9.6 65,640 8.8 396,917 8.5 6 224,309 9.0 156,929 10.7 76,027 10.2 457,265 9.7 7 225,337 9.1 174,373 11.9 83,756 11.2 483,466 10.3 8 273,314 11.0 173,304 11.9 72,839 9.8 519,457 11.1 9 333,304 13.4 206,844 14.2 86,462 11.6 626,610 13.4
10 662,199 26.6 231,623 15.9 115,379 15.5 1,009,201 21.5 Total 2,486,415 100.0 1,461,028 100.0 745,426 100.0 4,692,869 100.0
The Gini coefficient is a measure of, in this case, expenditure dispersion, and is an indicator of inequality. The Gini coefficient is linked to the Lorenz curve (see Figure 37) as it measures the difference between the 45-degree line (line of perfect expenditure equality) and the total and cash-expenditure distribution curves. A Gini coefficient of 0 (i.e., no distance between the curves) represents equal expenditure distribution, while a coefficient of 1 represents maximum inequality (i.e., one person/household account for all of the expenditure). The analysis begins by highlighting the Lorenz curves that portray the cumulative distribution of expenditure throughout the household population. Figure 37 includes Lorenz curves of total expenditure distribution (excluding imputed rent) by expenditure type.6 The figures include a 45 degree line, which represents perfect expenditure distribution among the population. For example, where 10% of household population account for 10% of expenditure, there is equal distribution of expenditure across the entire household population. Figure 37: Lorenz curve for national (a), rural (b) and urban (c) areas
Figure 37 demonstrates an uneven distribution of expenditure, both in cash and total expenditure, at the national and area levels. At the national level (Figure 37a), cash-expenditure 6 The Lorenz curves does not account for adult equivalent scales as it is based on households.
0%
20%
40%
60%
80%
100%
0% 20% 40% 60% 80% 100%
(a) Cash
Total
Equity
0%
20%
40%
60%
80%
100%
0% 20% 40% 60% 80% 100%
(b) Cash
Total
Equality
0%
20%
40%
60%
80%
100%
0% 20% 40% 60% 80% 100%
(c) CashTotalEquity
Cumulative expenditure (%) Cumulative expenditure (%) Cumulative expenditure (%)
Cum
ulat
ive
hhol
ds (%
)
Cum
ulat
ive
hhol
ds (%
)
Cum
ulat
ive
hhol
ds (%
)

44
is less evenly distributed than total expenditure but neither are evenly distributed. For example, the top 20% of household population (the highest spenders) account for nearly 50% of total expenditure and 60% of cash-expenditure. Conversely, approximately 45% and 60% of the household population account for 20% of total and cash-expenditure, respectively.
In rural areas, expenditure distribution follows a similar trend to that of the national level, with the top 20% of the population accounting for approximately 40% of total expenditure and 50% of cash-expenditure (see Figure 37b). The lowest 40% of the spending population accounts for only 20% and 15% of total and cash-expenditure, respectively.
In urban areas, the distribution of total and cash-expenditure appear similar. Close to half of both expenditures contribute 20% of the expenditure of the highest spending population. Conversely, 40% of the lower spending population account for 20% of total expenditure.
The Gini coefficient is calculated using the expenditure data as a function or proxy of income. Table 17 shows the national expenditure inequality by urban and rural areas, and by cash-expenditure. Income inequality is relatively higher in urban areas than in rural areas. In terms of cash-expenditure, inequality is relatively high in rural areas than in urban areas.
Table 17: Gini coefficient by expenditure type and area
Gini coefficient
Cash Total Expenditure (excl. imputed rent) National 0.541 0.408 Rural 0.484 0.357 Urban 0.414 0.400
EXPENDITURE BY HOUSEHOLD HEAD CHARACTERISTICS
Overall, 90% of total households have a male as the head of the household, and 92% of them are aged between 25 and 64 years old (see Table 18).
Table 18: Distribution of household heads 15years and over by gender and age
Age Total H/holds Household heads (#) Household heads (%)
Male H/head Female H/head Male H/head Female H/head 15-24 2,569 2,223 346 2.3% 3.2% 25-34 25,077 23,009 2,068 23.7% 18.9% 35-44 33,446 31,142 2,304 32.1% 21.1% 45-54 24,847 21,693 3,154 22.3% 28.9% 55-64 15,853 13,753 2,100 14.2% 19.2% 65-74 3,800 3,111 688 3.2% 6.3% >75 2,450 2,197 253 2.3% 2.3% Total 108,041 97,127 10,914 100.0% 100.0% % 100.0% 89.9% 10.1% Table 19 below shows that in terms of total expenditure by head of household, and noting the high proportion of male heads of households, total expenditure is highly skewed (91%) towards male households as expected. In terms of average expenditure per household, households with a male head spent 18% more than households with a female head. Household heads between 24-35 years are the only exception, with female headed households in this age range spending, on average, 4% more than the male headed households.
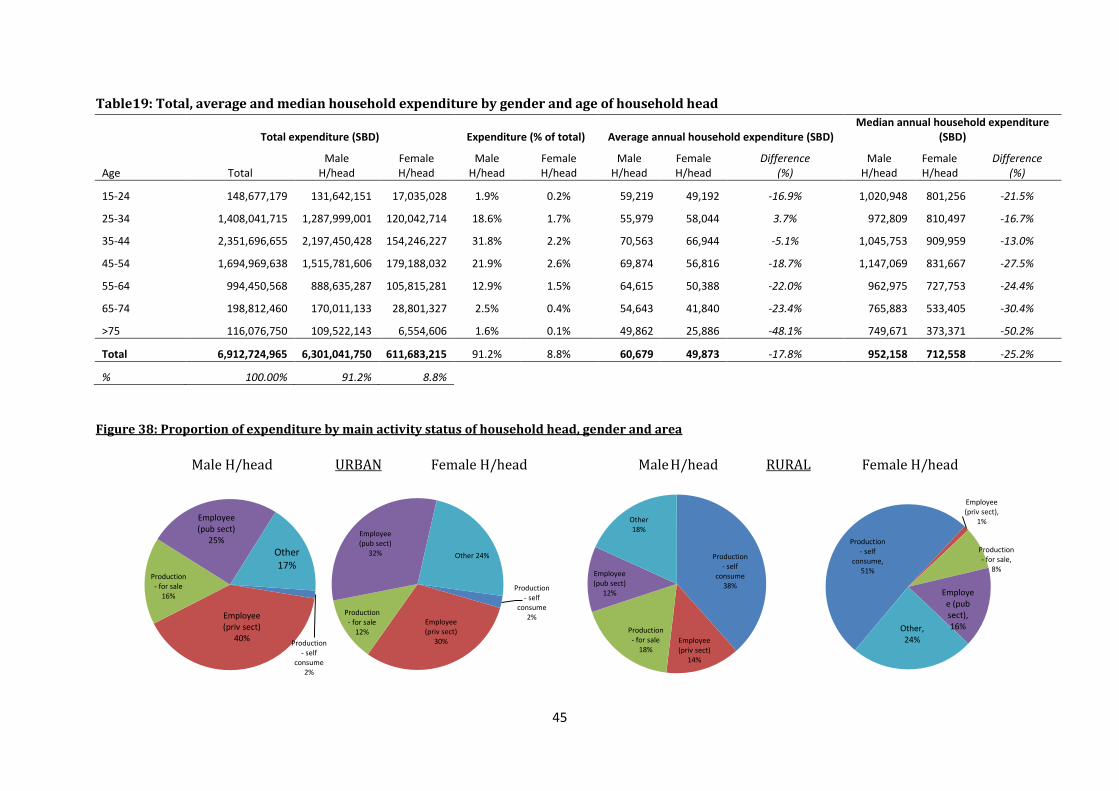
45
Table19: Total, average and median household expenditure by gender and age of household head
Total expenditure (SBD) Expenditure (% of total) Average annual household expenditure (SBD)
Median annual household expenditure (SBD)
Age Total Male
H/head Female H/head
Male H/head
Female H/head
Male H/head
Female H/head
Difference (%)
Male H/head
Female H/head
Difference (%)
15-24 148,677,179 131,642,151 17,035,028 1.9% 0.2% 59,219 49,192 -16.9% 1,020,948 801,256 -21.5%
25-34 1,408,041,715 1,287,999,001 120,042,714 18.6% 1.7% 55,979 58,044 3.7% 972,809 810,497 -16.7%
35-44 2,351,696,655 2,197,450,428 154,246,227 31.8% 2.2% 70,563 66,944 -5.1% 1,045,753 909,959 -13.0%
45-54 1,694,969,638 1,515,781,606 179,188,032 21.9% 2.6% 69,874 56,816 -18.7% 1,147,069 831,667 -27.5%
55-64 994,450,568 888,635,287 105,815,281 12.9% 1.5% 64,615 50,388 -22.0% 962,975 727,753 -24.4%
65-74 198,812,460 170,011,133 28,801,327 2.5% 0.4% 54,643 41,840 -23.4% 765,883 533,405 -30.4%
>75 116,076,750 109,522,143 6,554,606 1.6% 0.1% 49,862 25,886 -48.1% 749,671 373,371 -50.2%
Total 6,912,724,965 6,301,041,750 611,683,215 91.2% 8.8% 60,679 49,873 -17.8% 952,158 712,558 -25.2%
% 100.00% 91.2% 8.8%
Figure 38: Proportion of expenditure by main activity status of household head, gender and area Male H/head URBAN Female H/head Male H/head RURAL Female H/head
Production - self
consume 2%
Employee (priv sect)
40%
Production - for sale
16%
Employee (pub sect)
25% Other 17%
Production - self
consume 2% Employee
(priv sect) 30%
Production - for sale
12%
Employee (pub sect)
32% Other 24% Production - self
consume 38%
Employee (priv sect)
14%
Production - for sale
18%
Employee (pub sect)
12%
Other 18%
Production - self
consume, 51%
Employee (priv sect),
1%
Production - for sale,
8%
Employee (pub sect), 16% Other,
24%

46
In urban areas, both male and female heads of households are predominantly engaged in employment activity in the private and public sectors. In rural areas, the distribution of the main activity status of heads of households shows that more than half of the female heads are engaged in production activities for self-consumption as their main activity status (see Figure 38). Interestingly, female heads of households are neither employers nor full time students.
EXPENDITURE DISTRIBUTION BY GENDER
The survey findings also shed light on expenditure by gender of head of household as presented in Table 20 and Table 21.
Table 20: Distribution (%) of consumption & non-consumption expenditure by gender of household head
Main expenditure category/COICOP Total annual expenditure Male H/head Female H/head Total
Food and non-alcoholic beverages 42.4% 40.3% 42.2% Alcoholic beverages, tobacco & narcotics 8.2% 6.8% 8.1% Clothing and footwear 1.9% 1.9% 1.9% Housing and utilities 20.4% 24.3% 20.8% Furnishings, equipment & maintenance 2.3% 2.3% 2.3% Health 0.2% 0.4% 0.2% Transportation 9.6% 10.8% 9.7% Communication 2.8% 2.9% 2.8% Recreation & culture 1.3% 0.7% 1.2% Education 1.4% 1.7% 1.5% Restaurants & hotels 0.6% 0.5% 0.6% Miscellaneous good & services 0.8% 0.8% 0.8% Non-consumption expenditure 8.0% 6.8% 7.9% Total 100.0% 100.0% 100.0% There are less significant differences in consumption and non-consumption expenditure, mainly at the national level between male and female headed households.
Table 21 reveals that the main notable difference between female and male heads of households appears in rural areas, where male-headed households spent a higher proportion of their expenditure on alcoholic beverages and tobacco, while the female-headed households spent more on housing and utilities, and transportation.

47
Table 21: Percent of total expenditure (consumption/non-consumption) by gender of household head
Main expenditure category /COICOP
Rural Urban
Male H/head
Female H/head Total
Male Female Total
H/head H/head
Food and non-alcoholic beverages 49.30% 48.20% 49.20% 27.40% 28.40% 27.50% Alcoholic bev., tobacco & narcotics 7.70% 4.60% 7.40% 9.40% 10.10% 9.50%
Clothing and footwear 2.00% 1.80% 2.00% 1.80% 2.10% 1.90%
Housing and utilities 17.40% 22.50% 17.80% 27.00% 26.90% 27.00%
Furnishings, equipment & maint. 2.30% 2.40% 2.30% 2.40% 2.10% 2.40%
Health 0.20% 0.50% 0.20% 0.20% 0.10% 0.20%
Transportation 7.50% 9.30% 7.60% 14.20% 13.00% 14.10%
Communication 2.10% 2.00% 2.10% 4.30% 4.30% 4.30%
Recreation & culture 1.30% 0.50% 1.30% 1.10% 1.00% 1.10%
Education 1.30% 1.20% 1.30% 1.80% 2.60% 1.90%
Restaurants & hotels 0.50% 0.30% 0.40% 1.00% 0.70% 1.00%
Miscellaneous good & services 0.60% 0.60% 0.60% 1.20% 1.10% 1.20%
Non consumption expenditure 8.00% 6.20% 7.80% 8.10% 7.70% 8.00%
Total 100.00% 100.00% 100.00% 100.00% 100.00% 100.00%
EXPENDITURE BY PROVINCE
This section provides a brief overview of expenditure by province. A more detailed provincial analysis will be covered by the provincial analysis report. Below is a brief summary of expenditure by province, including Honiara.
Figure 39: Total expenditure by province and category
Malaita, Honiara, Guadalcanal and Western province account for 78% of total expenditure. Across all provinces, consumption expenditure is the most significant household budget category representing 92% of total expenditure (see Figure 39).
0200400600800
1,0001,2001,4001,600
Expe
nditu
re (S
BD)
Mill
ions
Province
Consumption expenditure Non-consumption expenditure Investment expenditure

48
Figure 40: Expenditure distribution by type and province
Figure 40 shows expenditure distribution by expenditure type. For Honiara households, 84% of consumption expenditure was in cash, the highest among all provinces, while Malaita Province recorded the lowest (46%) cash-expenditure.
46%
84% 68%
56% 59% 58% 52% 52% 55% 51%
35%
1% 19%
24% 29%
22% 34% 35% 34% 34%
19% 14% 12% 20% 12% 21% 14% 12% 11% 14%
0%
20%
40%
60%
80%
100%
Cash Home produced Imputed rents

49
SECTION 4: INCOME ANALYSIS
This section presents the estimates and analysis of household income in nominal terms. In a similar structure to the expenditure analysis, this section consists of two main components, namely the definitions and sectional income analysis covering the national, urban and rural areas.
The definitions section covers income definitions relating to the main income categories, sub-categories of main incomes, and types of income. The income analysis segment discusses the findings and analysis regarding national and average income by area, income by major category, income by category and type, employment income, income deciles/quintiles, income distribution and inequality, individual wage and salary, and head of household related characteristics.
INCOME DEFINITIONS
As noted in the expenditure analysis, statistically accepted concepts and definitions of specific income categories, sub-categories, divisions and types are explained to facilitate interpretation of the income information, data tables and variables used in this analysis. Consistent with the expenditure analysis section, the concepts and definitions employed in this section follow the International Labour Organisation’s (ILO) resolution 1 of the Seventeenth International Conference of Labour Statisticians. In addition, other universally accepted statistical concepts and definitions are used such as the SNA and the Solomon Islands-based COICOP harmonised from the United Nations COICOP and the Pacific regional COICOP classifications.
MAIN INCOME CATEGORIES
The categorisation of the main sources of income and related receipts adopts the ILO’s resolution with linkages to the related SNA definitions as follows: 1. Income from Employment: Comprises receipts for participation in economic activities in a
strictly employment related capacity. It consists of two components:
1.1 Employee Income: This comprises of direct wages and salaries, cash bonuses and gratuities, commissions and tips, directors’ fees, profit-sharing bonuses and other forms of profit-related pay, remuneration for time not worked (e.g., as sick leave) as well as free or subsidized goods, and services from an employer. It includes severance and termination pay as well as employers’ social insurance contributions. These items should be reported separately, when included. Employee income may be received in cash (monetary) or in kind in the form of as goods or services.
1.2 Self-Employment Income: This refers to income received by individuals for
themselves or in respect of their family members, over a given reference period, as a result of their or a member of their family’s involvement in self-employment related activities/jobs. In addition, income from self-employment is restricted to owners of unincorporated business enterprises who work in these enterprises. It excludes profits from capital investment of partners who do not work in these

50
enterprises, dividends and directors’ fees paid to owners of incorporated enterprises. Income from self-employment can be non-monetary, in-kind or valued from home production.
2. Property Income: This consists of receipts obtained as a result of ownership of assets that
are provided to others for their use. These are returns, usually monetary, from financial assets (interests, dividends), from non-financial assets such as land where rent is received for use, and from royalties. Interest receipts are payments received from accounts with banks, building societies, credit unions and other financial institutions, certificates of deposit, government bonds/loans, securities, debentures and loans to non-household members. Dividends are receipts from investment in an enterprise in which the investor does not work. Pensions and annuities in the form of dividends from voluntary private insurance schemes are also included. Rents are payments received for the use of both unproduced assets (i.e. natural resources), such as land, and for produced assets, such as houses. Rents should be recorded net of expenses. Royalties are receipts from writings, right to make use of inventions etc., that are patented or copyrighted.
4. Transfer Income: Transfers are receipts for which the recipient does not give anything
tangible to the donor in direct return for the receipts. Transfers consist of cash (monetary), or goods or services in other cases. Current or regular transfers are those that usually recur regularly and are mostly available for use during the reference period. Current or regular transfers received in cash and goods are as follows:
(a) Remittances or support received from the family (of other households) whether they live in the Solomon Islands or overseas;
(b) Social security pensions, insurance benefits and allowances generated from government sponsored social insurance schemes (compulsory/legal schemes) such as unemployment benefits, sickness benefits and security pensions;
(c) Pensions and other insurance benefits from employer-sponsored social insurance schemes not covered by social security legislation (both funded and unfunded) such as education allowance and medical expenses;
(d) Social assistance benefits from governments which provide the same benefits as social security schemes but are not covered by such schemes;
(e) Current transfers from non-profit institutions (e.g. charities, trade unions, religious bodies) in the form of regular gifts and financial support such as scholarships, union strike pay, union’s sickness benefits, and relief payments.
5. Irregular Gifts Received & Casual income: As stated above, household income covers all receipts which are received by the household or by individual members of the household referenced on an annual or more frequent interval. In the Solomon Islands and the pacific region, many gifts are received by households whether it is from other households or community groups etc., on an ad-hoc irregular basis. For this reason, a section in the tabulations has been included to cover such receipts due to their significance for a country such as the Solomon Islands. Other related receipts the household may receive will also be covered in this section and include receipts such as ‘birth allowance’, ‘funeral allowance’, ‘inheritances’ etc.
6. Imputed Rent: Refers to the same definition in the expenditure analysis. The value of imputed rents as income is equal to the value of expenditure on imputed rents.

51
7. Income from Household Production for Services of Own Consumption: This refers to services produced within the same household for the household’s consumption and not for the market. This include services from owner occupied dwellings and services from consumer durable goods owned (e.g., washing machines, cookers etc) as well as from own-produced domestic services such as housekeeping. Given the limited data in this area, and the quality of the data, it is less feasible to construct this measure and thus it is excluded from the overall analysis. Users of the data can make necessary adjustments based on this limitation and their analysis needs.
SUB-CATEGORIES OF MAIN INCOMES
For each main income category, a further breakdown or sub-category of income is specified to support a more detailed level of analysis. 1.1 Income from Employment: The main sub-categories included are:
1. Wage & Salary Income 2. Income from own household business (non-subsistence)
This includes self-employed business income. Household business (non-subsistence) income is also referred to as ‘non-subsistence business income’ in some cases.
3. Subsistence Income (Agriculture, including forestry) This also includes cash crops, betel-nuts, fruit & vegetables, firewood and flowers
4. Subsistence Income (Handicraft, including home processed food) 5. Subsistence Income (Livestock). 6. Subsistence Income (Fishing). 7. Home Production consumed
Employment income from own household-based business enterprises and subsistence income: Specific efforts have been made to separate out the income from households engaged in business/self-employed related activities and subsistence-based monetary activities. Income from the latter activities comes from active participation through the four main activities identified: agriculture, fisheries, livestock and handicraft and food processing. Whilst noting conceptual issues, incomes received from such subsistence-based market-oriented activities can be seen as secondary because the primary purpose of such activities is self-sufficiency/home production. It is evident from the survey that certain household members engaged primarily in subsistence activities are now seen to be participating, to some degree, in some form of subsistence-based monetary trade (e.g., selling of excess fish stock) where income is received or paid to household members involved. These kinds of activities do not necessarily conform to similar market and labour conditions where fully competitive forces of supply and demand are at play, and thus can also be seen as non-market in nature. While it will be seen from this analysis that income obtained is relatively lower in these activities, these activities play a significant role in the livelihood of many Solomon Island households especially in the agriculture and fisheries sector. In addition, for the purpose of computing net income, intermediate consumption (operating costs) which includes the cost of goods and services used purposely for generating the outputs of the mentioned subsistence activities are subtracted. 1.2 Property Income: as discussed earlier, property income is income that arises from the ownership of assets. This category has been split in to the major types of property income which include:
1. Home Rental

52
2. Other income from capital (dividends, interests, royalties) In the questionnaire on income (module 4), land lease data was actually collected under ‘Other property income’ whereas in the tabulations to follow, ‘Other Property Income’ includes interest from financial institutions overseas, interest from money lending and dividends. 1.3 Transfer Income: Transfer income is further classified in to four sub-categories:
1. Remittances 2. Pensions 3. Scholarship 4. Other transfers (Solomon Islands and overseas)
Irregular Gifts Received & casual income As stated above, this section addresses cash and gifts received by households, whether from another household or other community groups, on an ad-hoc irregular basis. The categories of most relevance to the Solomon Islands covered in this section are as follows:
1. Casual income (e.g., sale of assets, inheritance etc) 2. Items received for free as a gift (home produced or bought)
TYPE OF INCOME
A further specification in terms of the types of income received includes:
1. Cash-income 2. Home production consumed 3. In-kind receipts – goods (received from another household) 4. In-kind receipts – home production received 5. Imputed rents 6. In-kind income
Cash-Income Cash (monetary) income accounts for wage and salaries, household-based business income, and sales of home production. All cash receipts from property income and cash transfer income will also be classified as cash-income. Home production consumed Home production income covers the estimated value of final home production that the household produces and then consumes. Using their (household/member) combined labour, goods are initially acquired, grown, or gathered, often uncultivated, and further processed from predominantly subsistence activities for final household consumption. If a household sells home produce, it is treated as cash-income, as cash was generated from the sale. In the context of this meaning and computation, the total net value of home production income is the difference between the gross value of home production consumed and associated intermediate expenses. Home production consumed is classified treated as employment income. In kind receipts/gift This type of income is similar to that described in the expenditure analysis section. All goods and services received as gifts in the form of cash or home produced in the income side have the same value from the expenditure side of the donating household.

53
Imputed rents Treated also as a type of income and already defined above. In-kind income In-kind income covers any income received by the household that is not in the form of cash. For wage and salary, this would entail the employer paying the household member, in full or partially, with a gift in-kind instead of cash. For the section in the tables addressing ‘Irregular Gifts Received & Other Receipts’, the component ‘ad-hoc gifts received’ will also be treated and categorized as a form of in-kind income. NB: As stated in Section 3 (expenditure analysis), the definitions, treatment and categorising of income data and related variables may vary with other international conceptual and compilation frameworks, and standards. Hence, depending on the user’s specific data needs and analytical interests, the HIES data and tables provides flexibility to meet these and related demands.
INCOME ANALYSIS BY AREA
Total annual household income is estimated at SBD$7.282 billion inclusive of imputed rental income. Table 22 shows that total annual income excluding imputed rent amounts to SBD$ 6.199 billion. By area, rural households account for 65% of total expenditure excluding imputed rent. As stated in the expenditure analysis section, imputed rental charges will be excluded from total income in some areas of analysis given that it is indirectly estimated. This will allow for a more in-depth assessment of the underlying annual expenditure.
Table 22: Annual total, average and median income (excluding imputed rents) by area
Area Hholds Pop
-ulation
Av. HHold
size Total income
(SBD)
Average income (SBD)
Median income (SBD)
Per hhold
Per capita
Per hhold
Per capita
Urban 19,015 114,451 6 2,182,783,139 114,793 19,072 58,791 10,508 Rural 89,026 501,353 5.6 4,016,479,028 45,116 8,011 29,928 5,104 Total 108,041 615,804 5.7 6,199,262,166 57,379 10,067 33,131 5,798 Although households earned on average SBD$57,379 annually excluding imputed rent, they spent less than what they earned (SBD$53,961) on average by 6%. This amount varies significantly among urban households which spent 16% more on average than what they earned. However, the scenario changes when median expenditure is compared with median income. We find that median expenditure exceeds median income by 19%.
From Table 22, it is found that the median income is lower than average income by 73%. It is also found that urban households earn close to three times the average income of rural households, and twice the median and per-capita income, suggesting significant uneven income distribution among households and persons in urban and rural areas.
The above variations show the skewed distribution of income (expenditure) and the impact of higher and extremely lower incomes on average income. As observed from the expenditure side analysis, this implies that the median income (or expenditure) would be a more representative average income of the middle class.

54
An interesting and unexpected survey finding shows that total income was greater than total expenditure. It can be argued that the aggregated income surplus (i.e. income greater than expenditure) of the highest income households outweighs the aggregated losses of the lowest income households. This argument is represented below, drawing from Table 23 where net average income is a surplus, while net median income is a deficit in all areas. See further discussion in section 6.
Table 23: Comparison of household and per capita net average and median income (excluding imputed rent)
Average (SBD) Median (SBD)
Area Per household Per capita Per household Per
capita Urban Income 114,793 19,072 58,791 10,508 Expenditure 99,007 16,449 73,147 12,443 Net urban 15,786 2,623 -14,356 -1,935 Rural Income 45,116 8,011 29,928 5,104 Expenditure 44,340 7,874 35,772 6,152 Net rural 776 137 -5,844 -1,048 National Income 57,379 10,067 33,131 5,798 Expenditure 53,961 9,467 39,546 6,856 Net national 3,418 600 -6,415 -1,058
INCOME BY MAJOR CATEGORY
Total income consists of five main categories or sources namely employment income, property income, home production consumed, transfers, and casual income. The survey findings show that employment income accounts for 77% of total income, followed by imputed rents (15%), while transfers (1%) is found to be the lowest source of household income.
The results from Figure 41 show the distribution of household income across each of the major categories. The analysis clearly shows that income from employment is the most important source of income. Income from employment includes wages and salaries (cash and in-kind) (31%), own business income (28%), home production (25%), and income from subsistence-based market activities that make up the remaining 16% (agriculture/forestry, fishing, livestock and handicraft/home food processing) (see also Table 25). The category ‘income from property’, ranked third, is mostly made up of royalties and house rentals. The ‘other casual income’ includes all goods given away (purchased and home produced) and some irregular cash-income, such as casual sales and inheritance. Although income distribution across the five income categories (see Figure 42) appears similar for urban and rural areas, property income appears relatively higher in urban areas (7%).

55
Figure 41: Total household income by major category and area (’million)
Figure 42: Distribution of total household income by major category and area (%)
Figure 43 and Figure 44 below present the breakdown of total household income by income type and area. Cash-income is the main income type accounting for 63% of total household income at the national level and by area (80% in urban; 53% in rural). The estimated income value of home production comes next, accounting for 19% of total income. There are obvious differences in income valued as home production consumed between urban and rural areas given the dominance of home production in rural areas. In rural areas, home production income is the second main type of income among households, in contrast to urban households where it is relatively the lowest type of income. Furthermore, imputed rents account for 15% of total income, while gifts and in-kind income from employers accounts for only 5%.
0
1,000
2,000
3,000
4,000
5,000
6,000
Income fromemployment
Income from property Imputed rents Transfers Casual income
Inco
me
(SBD
'000
,000
)
National
Urban
Rural
0%10%20%30%40%50%60%70%80%90%
100%
National Urban Rural
Income from employment Income from property Imputed rents Transfers Casual income

56
Figure 43: Total household income by type and area (’million)
Figure 44: Distribution of total household income by type and area (%)
Figure 45 below focuses only on cash-income. Wages and salaries, and income from household-based businesses contribute the highest share of cash-income, about 34% and 35%, respectively. Cash-income from subsistence-based activities (mainly the sale of agricultural products etc.,) follows suit, accounting for 10%. Following closely is the combined income of the other subsistence activities (fishing, livestock and handicraft activities). The remaining percent of cash-income consists mainly of property income, remittances, casual income and other transfers.
0
500
1000
1500
2000
2500
3000
3500
4000
4500
5000
Cash income Income in kind fromemployer
Home production Gifts Imputed rents
Inco
me
(SBD
'000
,000
)
National
Urban
Rural
61.5% 2.7% 19.1% 1.8% 14.9%
78.9% 4.9%
1.9% 1.0% 13.4%
52.4% 1.5%
28.2% 2.3% 15.7%
0%
20%
40%
60%
80%
100%
Cash income Income in kind fromemployer
Home production Gifts Imputed rents
National Urban Rural

57
Figure 45: Distribution of cash-income by major sub - category (%) – national level
Figure 46 highlights the difference in the composition of cash-income by urban and rural areas. Wages/salaries and business incomes are higher in urban areas accounting for 83% of the total cash-income compared with 59% in rural areas. As expected, the third highest cash-income of rural households comes from subsistence-based activities (mainly agriculture), while urban households show higher receipts from property income. Figure 46: Distribution of cash-income by major sub - category (%) – urban and rural area
INCOME BY CATEGORY & TYPE
This section provides an analysis of the findings on income received by Solomon Islands households by sub-categories and types of income by area. Table 24 below shows that the main sub-categories of total income includes wages and salaries (cash and in-kind) that account for 24% of total income, followed by household-based business/self-employment income (22%), income value of home production consumed (19%) and imputed rentals (15%). As noted earlier, wages and salaries, and business income are higher in urban areas, accounting for 35% and 30% of total urban income whilst income valued from home production is highly dominant in rural areas, accounting for 28% of total rural income.
Wage & salary 34%
Business income 35%
Subsistence - agriculture
10%
Subsistence - fishing
3%
Subsistence - livestock
4%
Subsistence - handicraft
3%
Property 6%
Remittances 2%
Other transfers 1%
Casual cash income 2%
National
Wage & salary 45% Business
income 37%
Subsist.- agriculture
2%
Subsist. - fishing
Subsist. - livestock
1%
Subsist. - handicraft
3%
Property 9%
Remittance 1%
Other transfers
1% Casual cash income
1%
Urban
Wage & salary 26%
Business income
33%
Subsist. - agriculture
16%
Subsist. - fishing
5%
Subsistence - livestock
7% Subsistence -
handicraft 4%
Property 5%
Remittances 2% Other
transfers
Casual cash income
2%
Rural

58
Table 24: Household income by income sub-categories and area (‘000, %) Income categories /
sub categories Income type Urban Rural National
SBD % SBD % SBD % Wages & salaries
Cash
889,747
35.3
647,434
13.6
1,537,181
21.1
Wages & salaries (in-kind) In-kind income 123,561 4.9 72,815 1.5 196,376 2.7 Non-subsistence business Cash 744,042 29.5 823,025 17.3 1,567,067 21.5 Subsistence Income: Agriculture & forestry Cash 48,195 1.9 411,016 8.6 459,211 6.3 Fishing Cash 9,184 0.4 128,767 2.7 137,951 1.9 Livestock Cash 11,988 0.5 164,252 3.4 176,240 2.4 Handicraft Cash 53,426 2.1 91,430 1.9 144,856 2.0 Home production consumed Home produce 47,771 1.9 1,341,067 28.2 1,388,838 19.1
Total employment income 1,927,914 76.5 3,679,806 77.3 5,607,720 77.0
Rentals Cash 76,747 3.0 19,109 0.4 95,856 1.3 Royalties Cash 13,620 0.5 88,658 1.9 102,278 1.4 Other property income Cash 79,775 3.2 5,666 0.1 85,441 1.2 Total property income 170,142 6.8 113,433 2.4 283,575 3.9 Remittances from Solomon Cash 9,299 0.4 41,048 0.9 50,347 0.7 Remittances from overseas Cash 5,529 0.2 8,041 0.2 13,570 0.2 Pension Cash 21,557 0.9 8,203 0.2 29,760 0.4 Other transfers Cash 361 0.0 1,564 0.0 1,925 0.0 Total transfers income 36,746 1.5 58,856 1.2 95,602 1.3
Casual cash-income cash 23,720 0.9 54,946 1.2 78,666 1.1 Bought goods received In-kind receipt 19,673 0.8 52,337 1.1 72,010 1.0 Home produced received In-kind receipt 4,588 0.2 57,102 1.2 61,690 0.8 Total casual income 47,981 1.9 164,385 3.5 212,366 2.9
Imputed Rent imputed 337,245 13.4 745,426 15.7 1,082,671 14.9
Total income 2,520,028 100.0 4,761,906 100.0 7,281,934 100.0
In terms of the relative share of the types of sub-category incomes to their respective totals, Table 25 below shows that income from employment that includes wages and salary (cash and in-kind) accounts for 31% of employment income, followed by business/self-employment income (non-subsistence) (28%), and income estimated from home production (25%). Income from subsistence-based activities (agriculture, fishing, livestock and handicraft and food processing) accounts for the remaining 16%. Table 25 further shows that urban wages and salaries (cash) of SBD$889.7 million account for the highest proportion (46%) of total urban employment income. This is followed by the household-based business income (39%). The opposite trend is observed in rural areas, where business income shows relatively the highest share (22%) of employment income, followed by wages and salaries (cash) (18%). The predominant sub-categories of property income at the national level include royalties, rentals and other property income, all sharing about a third, or slightly more, of total property income. However, income from royalties is relatively the highest, accounting for 36%, and driven by a higher rural share of income of 78%.

59
Table 25: Percent (%) of total annual income sub-categories by area
Income categories /sub-categories Income type
Urban Rural National
% % %
Wages & salaries cash 46.2 17.6 27.4 Wages & salaries (in kind) In-kind income 6.4 2.0 3.5 Non-subsistence business cash 38.6 22.4 27.9 Subsistence income Agriculture & forestry cash 2.5 11.2 8.2 Fishing cash 0.5 3.5 2.5 Livestock cash 0.6 4.5 3.1 Handicraft cash 2.8 2.5 2.6 Home production consumed Home produce 2.5 36.4 24.8 Total employment income 100.0 100.0 100.0 Rentals cash 45.1 16.8 33.8 Royalties cash 8.0 78.2 36.1 Other property income cash 46.9 5.0 30.1 Total property income 100.0 100.0 100.0 Remittances from Solomon cash 25.3 69.7 52.7 Remittances from overseas cash 15.0 13.7 14.2 Pension cash 58.7 13.9 31.1 Other transfers 1.0 2.7 2.0 Total transfers income 100.0 100.0 100.0 Casual cash-income cash 49.4 33.4 37.0 Bought goods received In-kind receipt 41.0 31.8 33.9 Home produced items received In-kind receipt 9.6 34.7 29.0 Total casual income 100.0 100.0 100.0 Imputed Rent Imputed 31.1 68.9 100.0 Total income 34.6 65.4 100.0
In terms of income from transfers, remittance from within the Solomon Islands amounts to slightly more than SBD$50 million, about 53% of all regular transfers. This is driven by the contribution of rural households who are the frequent receivers, accounting for 70% (SBD$41 million) of total transfers in rural areas. Remittances from overseas are relatively low, about four times lower than the amount received from within Solomon Islands. There are significant differences between urban and rural areas regarding casual cash-income or irregular gifts received (see Table 24 earlier). However, in terms of their respective percentage differences, Table 25 shows less significant differences. However, the share of home produced items received is significantly higher in rural areas. With regard to the average household income by main category and income type, Table 26 below shows that a household earns on average close to SBD$52,000 in employment income annually. The urban household earns on average more than twice the average employment

60
income of the rural household. As seen from the table, cash-income is the dominant type of income in both urban and rural areas, given the higher share of total income consisting of employment cash-income.
A further disaggregation of average household income by category shows differences between urban and rural areas. Apart from subsistence, home production and royalties, all average annual incomes are higher among urban households than rural households. For example, urban households earn six times more in annual wage and salaries (cash) than rural households; house rental income is eighteen times higher in urban areas than in rural areas, while household based-business income is about four times higher in urban areas than in rural areas.
Table 26: Average annual income by main type and category/source
Main income type and category
National Urban Rural
SBD % SBD % SBD %
Average Annual Income 67,395 100 132,532 100 53,489 100 Income type
Cash 42,133 63 105,543 80 28,593 53 Home produced 13,425 20 2,756 2 15,706 29 Imputed rents 10,020 15 17,733 13 8,373 16 Income in kind 1,816 3 6,500 5 818 2
Income category Employment 51,903 77 101,388 77 41,334 77 Property 2,625 4 8,946 7 1,274 2 Regular transfers 885 1 1,930 1 662 1 Casual income 1,965 3 2,524 2 1,847 3 Imputed rents 10,020 15 17,733 13 8,373 16

61
Table 27: Average annual household income by sub-category, type and area
Income categories / sub categories Urban Rural National
SBD SBD SBD
Employment income 101,388 41,334 51,903 Wages & salaries (cash) 46,792 7,272 14,228 Wages & salaries (in-kind income) 6,498 818 1,818 Non-subsistence business 39,129 9,245 14,504 Subsistence income 6,458 8,935 8,499 Home production consumed 2,512 15,064 12,855 Property income 8,946 1,274 2,625 Rentals 4,036 215 887 Royalties 716 996 947 Others 4,195 64 791 Transfers 1,930 662 885 Remittances from Solomon 489 461 466 Remittances from overseas 291 90 126 Pension 1,134 92 275 Other transfers 19 18 18 Casual Income 2,524 1,847 1,965 Cash-income 1,247 617 728 In-kind receipts (gifts) 1,276 1,229 1,237
Imputed rents 17,733 8,373 10,020
Average total Income 132,532 53,489 67,395 Note: Slight variations in averages are due to rounding.
EMPLOYMENT INCOME BY SUB-CATEGORY
Expanding from the earlier discussion, this section analyses the distribution of employment income by main sources or sub-categories of employment income. Employment Income: Total annual employment income: SBD$5,607 million. Contribution to household income: 77%. Figure 47: Percent distribution of total employment income by main category
27%
4%
28% 8% 2%
3% 3%
25%
Wages & salariesWages & salaries (in kind)Non-subsistence business Agriculture & forestry Fishing Livestock HandicraftHome production consumed

62
Home production consumed Total annual gross home production consumed income: SBD$1,464 million Total annual intermediate inputs/expenditure related to subsistence activities: SBD$75 million Total value of net home production consumed: SBD$1,388 million Percentage contribution to total employment income: 25% Percentage contribution to total household income: 19% Figure 48: Percent (%) contribution of the estimated value of subsistence home production to total home production consumed
Wage & salary by main industry (cash and in-kind) Percentage contribution to total employment income: 30.9% Percentage contribution to total household income: 23.8% Table 28 presents the total, average and median wages and salaries from individuals 10 years and over earning these incomes. Although 63,171 persons declared involvement in wage and salary jobs, a number of them were required to be involved in another main wage job and thus by type of industry of employment, the specific number of persons employed is 64,672. Individuals engaged in the education industry earn close to SBD$345 million, the highest (20%) of all industry wages and salaries. The industry employs 14,106 persons, more than twice that of any other industry. However, persons engaged in the quarry industry earn the highest average and median wages and salaries, even though the industry accounts for only 4% of total wages and salaries. It should be noted that due to the limited scope and focus of the sampling design of the survey, it was not feasible to accurately target all individuals engaged in all economic activities. Hence, individuals engaged in some industries (e.g., mining) could not be interviewed.
Betel nuts & leaf 5%
Fish & sea food 19%
Fruits & nuts 16%
Meat - livestock 3%
Other
Vegetables & crops 57%

63
Table 28: Total annual ('000), average and median wage and salary by industry
Industry Total Amount Average Median Persons SBD % SBD SBD #
Education 344,616 19.9 24,431 22,620 14,106 Public administration 248,674 14.3 37,228 31,200 6,680 Other service activities 136,245 7.9 19,773 7,900 6,890 Transport 122,200 7.0 30,451 22,750 4,013 Construction 114,193 6.6 22,567 13,000 5,060 Support service activities 105,762 6.1 27,652 21,000 3,825 Manufacturing 98,805 5.7 20,684 10,800 4,777 General wholesale and retail trade 86,671 5.0 16,261 12,000 5,330 Forestry & Logging 86,517 5.0 19,749 14,400 4,381 Professional and technical activities 79,080 4.6 66,259 39,400 1,193 Human health and social work activities 69,712 4.0 27,763 23,100 2,511 Quarrying 66,509 3.8 65,385 64,000 1,017 Information and communication 51,126 2.9 60,887 37,910 840 Financial activities 33,896 2.0 44,989 38,600 753 Accommodation and food service activities 22,196 1.3 23,509 15,600 944 Electricity water sewage and waste 19,297 1.1 46,045 29,240 419 Fishing 13,687 0.8 43,764 14,900 313 Retail & repair of motor vehicles, motor cycles 11,286 0.7 39,922 21,500 283 Arts, entertainment and recreation 9,653 0.6 27,750 26,000 348 Food service activities 6,594 0.4 15,571 9,400 423 Agriculture 5,224 0.3 10,185 10,400 513 Real estate activities 1,614 0.1 30,726 32,500 53 Total 1,733,557 100.0 26,805 18,940 64,672 Note: Minor discrepancies in totals, averages, medians are due to rounding based on computations of totals expressed in ‘000’; also note that some households/persons engaged in other industries not mentioned above could not be interviewed due to the limited scope of the sample design targeting all detailed economic activities. The HIES is not a formal employment/labour force survey with specific focus on employment/economic activities.
INCOME DECILES/QUINTILES
The total annual household income distribution by national, urban and rural areas is presented in Tables 29a, 29b and 29c below. It is evident that the highest 10% of households (decile 10) earn more than a third (42%) of all income in the country and more than half (55%) of all cash-income in the country. Compared with earlier expenditure analysis, the same richest group of households in decile 10 spent 25% of total expenditure, and 30% of total cash-expenditure. In addition, the households in this decile earn 89 times the amount earned by the lowest 10%.
When assessed in terms of the ratio of the income of the highest 20% of households over the lowest 20%, the highest 20% account for 34 times the income of the lowest 20% of households. This indicates the significant unequal distribution of income in the country. This pattern shows significant variations in the level and relative share of incomes when compared with the spending patterns of similar deciles.

64
Table 29: Total annual household income in decile by main type of income ('000)
Similar behaviour of income distribution is observed in both urban and rural areas impacting on the national estimates. In both urban and rural areas, half of total cash-income comes from the top 10% of all households (decile 10) (see Tables 29a, 29b). The relative share of total income is impacted by the cash-income of these top highest income earning households. Table 29a: Urban annual household income in decile by main type of income ('000)
Decile Cash % Home Produce
% Imputed Rent
% Income in kind
% Total %
Decile 1 28,154 0.6 55,149 3.8 35,277 3.3 215 0.1 118,794 1.6Decile 2 63,383 1.4 105,638 7.3 45,669 4.2 651 0.3 215,342 3.0Decile 3 88,999 2.0 134,920 9.3 55,894 5.2 465 0.2 280,278 3.9Decile 4 127,748 2.8 146,159 10.1 67,527 6.2 758 0.4 342,192 4.7Decile 5 172,905 3.8 153,686 10.6 80,309 7.4 1,859 1.0 408,758 5.6Decile 6 229,362 5.0 178,118 12.3 82,994 7.7 2,755 1.4 493,230 6.8Decile 7 306,259 6.7 180,641 12.5 110,138 10.2 4,690 2.4 601,727 8.3Decile 8 411,845 9.1 186,822 12.9 133,211 12.3 15,455 7.9 747,333 10.3Decile 9 627,263 13.8 192,376 13.3 158,721 14.7 28,044 14.3 1,006,403 13.8Decile 10 2,496,440 54.8 117,019 8.1 312,931 28.9 141,484 72.1 3,067,875 42.1Total 4,552,359 100 1,450,528 100 1,082,671 100.0 196,375 100.0 7,281,934 100.0
Main income type
Decile Cash % Home Produce
% Imputed Rent
% Income in kind
% Total %
Decile 1 22,284 1.1 656 1.3 9,686 2.9 414 0.3 33,041 1.3Decile 2 44,505 2.2 4,149 7.9 13,018 3.9 968 0.8 62,641 2.5Decile 3 60,128 3.0 5,829 11.1 14,713 4.4 1,969 1.6 82,639 3.3Decile 4 72,352 3.6 9,072 17.3 19,635 5.8 2,127 1.7 103,186 4.1Decile 5 95,036 4.7 5,399 10.3 19,875 5.9 3,456 2.8 123,767 4.9Decile 6 109,953 5.5 7,315 14.0 26,456 7.8 3,774 3.1 147,498 5.9Decile 7 137,486 6.9 7,820 14.9 35,299 10.5 11,702 9.5 192,308 7.6Decile 8 182,437 9.1 4,933 9.4 51,226 15.2 15,053 12.2 253,649 10.1Decile 9 272,021 13.6 4,729 9.0 62,634 18.6 27,465 22.2 366,849 14.6Decile 10 1,010,661 50.4 2,456 4.7 84,703 25.1 56,632 45.8 1,154,451 45.8Total 2,006,863 100 52,360 100 337,245 100 123,561 100 2,520,029 100
Urban: Main income type

65
Table 29b: Rural annual household income in decile by main type of income ('000)
In terms of the analysis based on average incomes, one can further diagnose the extent of the behaviour of income distributions. It is seen from Table 30 below that households belonging to the lowest 10% (decile 1) earn on average SBD$11,034 annually, while the highest income households (decile 10) earns on average 26 times (SBD$283,774) the average income of the lowest 10%. Moreover, similar ratios for the top 20% quintile and lowest 20% show that the highest 20% earn 12 times the average income of the lowest 20%.7 The cumulative total income share shows that 50% of households earn only 19% of the total income, while the remaining 20% earn slightly more than half (58%) of the total income. Table 30: Total (‘000) and average income in deciles/quintiles – including imputed rent
Note: Minor variations in average and medians are due to rounding from total amounts expressed in thousands (‘000).
7 Further analysis using the median income distributions could show further insight on income distribution.
Decile Cash % Home Produce
% Imputed Rent
% Income in kind
% Total %
Decile 1 19,747 0.8 45,273 3.2 27,411 3.7 177 0.2 92,608 1.9Decile 2 41,002 1.6 89,311 6.4 36,240 4.9 366 0.5 166,918 3.5Decile 3 60,770 2.4 110,399 7.9 44,782 6.0 188 0.3 216,140 4.5Decile 4 89,846 3.5 120,197 8.6 49,914 6.7 162 0.2 260,120 5.5Decile 5 109,437 4.3 139,671 10.0 59,972 8.1 357 0.5 309,437 6.5Decile 6 136,559 5.4 157,465 11.3 69,015 9.3 865 1.2 363,905 7.6Decile 7 201,628 7.9 162,836 11.7 73,836 9.9 1,428 2.0 439,727 9.2Decile 8 246,866 9.7 191,394 13.7 98,652 13.2 3,070 4.2 539,983 11.3Decile 9 378,148 14.9 178,516 12.8 121,134 16.3 14,254 19.6 692,052 14.5Decile 10 1,261,492 49.6 203,107 14.5 164,470 22.1 51,947 71.3 1,681,016 35.3Total 2,545,496 100 1,398,168 100 745,426 100 72,815 100 4,761,905 100
Rural: Main income type
Decile Total income
Cum share of total income
Average annual income
Quintile Total income
Cum share of total income
Average annual income
Decile 1 118,794 1.6 11,034Decile 2 215,342 4.6 19,874Decile 3 280,278 8.4 26,023Decile 4 342,192 13.1 31,690Decile 5 408,758 18.8 37,858Decile 6 493,230 25.5 45,549Decile 7 601,727 33.8 56,052Decile 8 747,333 44 68,648Decile 9 1,006,403 57.9 93,075Decile 10 3,067,875 100 283,774Total 7,281,934 67,400 7,281,934 67,400Median 41,300 Median 41,300
Quintile 4 1,349,060 44 62,394
Quintile 5 4,074,278 100 188,417
Quintile 2 622,470 13.1 28,860
Quintile 3 901,988 25.5 41,709
Quintile 1 334,137 4.6 15,468

66
When analysing average income distribution, excluding imputed rents, it is found that the average income of the highest 20% (quintile 5) exceeds the average income of the lowest quintile by 16%. It is also evident that urban households within quintile 5 earn 21 times the average income of the lowest 20% (quintile 1). This further reveals the extent of the unequal distribution of income in the country.
Table 31: Average annual income (excluding imputed rent) in quintiles by area
Average annual household income Urban Rural National
Quintile 1 17,380 10,174 10,718 Quintile 2 38,029 20,726 22,340 Quintile 3 58,413 30,164 33,482 Quintile 4 95,325 44,445 51,393 Quintile 5 364,816 120,070 168,960
Total 114,793 45,116 57,379
Median 58,791 29,928 33,131
INCOME DISTRIBUTION AND INEQUALITY
The distribution of income throughout the household population demonstrates a high degree of income inequality, with the poorest 50% of households in the Solomon Islands earning 19% of total household income. As illustrated in Figure 49, the Lorenz curve shows the distribution of the total income among households population in relation to equal income distribution, which is portrayed by the straight diagonal line of equality.
Figure 49: Lorenz curve – distribution of total income and cash-income – national
The cash-income Lorenz curve shows even higher differences as the poorest half of the households only received about 7% of total cash-income, consistent with the earlier discussion on income distribution by deciles. Figure 50 presents the situation in urban and rural areas regarding total and cash-income distribution.
0%
20%
40%
60%
80%
100%
0% 20% 40% 60% 80% 100%
Cum
ulat
ive
hous
ehol
ds (%
)
Cumulative income (%)
Equality Total income Cash income

67
Figure 50: Lorenz curve – distribution of total income and cash-income – urban / rural areas
Figure 50 shows that income distribution, in particular total income in the rural areas, narrows towards the equality line, while cash-income remains similar to the urban cash distribution. This indicates the dominance of cash-income influencing total income in urban areas, whilst in rural areas income from home production appears more prominent.
Table 32 below presents the Gini coefficient of total income and cash-income by urban and rural areas. The table also shows the Gini coefficient derived from the expenditure data.
Table 32: Gini coefficient of total annual income (excl. imputed rents) and cash-income Income National Urban Rural
Total income 0.539 0.588 0.475 Cash-income 0.694 0.607 0.665
Expenditure Total Expenditure 0.408 0.400 0.357
Cash-Expenditure 0.541 0.414 0.484 Table 32 shows that the distribution of income demonstrates a high degree of inequality at the country level, and by urban and rural areas, respectively. Inequality in total income is higher in urban areas, exceeding the national average. It is also seen that cash-income inequality is very high in all areas, especially in the rural areas. Again, it should be noted that, although both Gini coefficients from the income and expenditure sides cannot be compared directly, very general observations are made. It is observed that Gini coefficients from the expenditure data, although inequality is high in all areas, appear lower than the coefficients derived from the income data. This generally reflects the extent of distribution within both income and expenditure data, respectively.
INDIVIDUAL WAGE AND SALARY INCOME ANALYSIS
This sub-section provides a basic summary of key individual incomes by area, gender, sector and industry. The survey is only able to provide key information, mainly on wages and salaries at the person level, given that the survey is household (not individual) based and noting sample size implications.
0
20
40
60
80
100
0 20 40 60 80 100
Cum
ulat
ive
hous
ehol
ds (%
)
Cumulative income (%)
Urban
Equality Total incomeCash income
0
20
40
60
80
100
0 20 40 60 80 100
Cum
ulat
ive
hous
ehol
ds (%
)
Cumulative income (%)
Rural
Equality Total incomeCash income

68
According to Table 33 below, 14% of total population aged 10 years and over was involved in wage and salary-based jobs in 2012/13. This represents almost 20% of males and 8% of females. In urban areas, over two thirds of males aged between 25 years and 55 years were employed in wages/salary jobs, compared to slightly more than a third of women. There is a similar behaviour in the rural areas but with lesser women in wage/salary jobs.
Table 33: Proportion (%) of the population 10 years and over involved in wage/salary jobs by area and gender
Age group URBAN RURAL TOTAL
Male Female Total Male Female Total Male Female Total 10-14 0.8% 0.8% 0.8% 0.3% 0.0% 0.1% 0.3% 0.1% 0.2% 15-24 16.8% 14.9% 15.8% 4.4% 3.4% 3.9% 7.2% 6.1% 6.6% 25-34 62.6% 34.5% 48.7% 21.2% 9.6% 15.2% 31.4% 15.3% 23.1% 35-44 72.5% 35.7% 54.8% 32.7% 6.1% 19.1% 41.4% 12.0% 26.6% 45-54 66.0% 35.2% 52.0% 26.6% 7.8% 17.4% 33.4% 12.0% 23.0% 55-64 45.5% 15.3% 31.9% 18.6% 2.9% 11.8% 22.0% 4.5% 14.4% 64+ 21.5% 7.0% 15.5% 7.8% 0.5% 4.3% 9.5% 1.1% 5.6%
Total 41.2% 22.8% 32.1% 14.6% 4.9% 9.8% 19.8% 8.4% 14.3% It is evident from Table 33 that there are slightly more than twice the number of males than females in wage and salary jobs. Although their respective annual wage/salaries are three times apart (males, 75%; females, 25%) in amount, their average wages per capita reduces by about a third in median per capita wages/salaries, respectively (see Table 34).
Note that in the earlier discussions on wage/salary by industry, the survey captured one person doing more than one job in more than one industry. Hence, this meant that a total of 64,672 industry specific persons were engaged. However, the following tables show the total number of persons who had an income from a job(s), irrespective of the number of jobs/industries engaged in.
Table 34: Persons in wage/salary jobs by income (total, average, median) and gender
Gender Total population involved in wage
jobs (#)
Total annual income made
from wage jobs Contribution
Average annual
amount per capita
Median annual wage
per capita
SBD’ 000 % SBD SBD
Male 44,869 1,299,105 74.90% 28,953 19,700
Female 18,302 434,452 25.10% 23,737 17,680
Total 63,172 1,733,557 100.00% 27,442 19,200
Note: Slight variations in averages and medians are due to rounding. It is observed from Table 35 that although there are similar wage/salary distributions among males and females, particularly among the first three quintiles, there is generally a higher unequal distribution of wage/salary among males and females in the higher income groups. Among the males, those in the highest 20% of income group (quantile 5) earn, on average, 22% more than their lowest quintile group. Among the females, the highest quintile earns 16% more than their lowest quintile.

69
Table 35: Average annual wage and salary income by quintile and gender Quintiles Male Female Total
SBD SBD SBD Quintile1 3,501 3,793 3,585 Quintile2 11,812 10,258 11,362 Quintile3 19,767 17,335 19,062 Quintile4 31,710 25,498 29,908 Quintile5 77,647 61,547 72,986
Total 28,953 23,737 27,442
Median 19,700 17,680 19,200 Note: Slight variations in averages and medians are due to rounding. As shown in Table 36, males earn on average 62% more in the private sector than females, and 12% more in the public sector. In other sectors (mainly NGOs and the Church), females earn 60% more than males. As one would expect, the median amounts are relatively lower with total public sector (SBD$26,000), total private sector (SBD$15,600) and total others (SBD$7,100).
Table 36: Average annual wage and salary income by sector and gender
Sector Male Female Total
Public 34,667 31,050 33,354 Private 28,451 17,602 25,693 Others 12,588 20,912 14,370
Total 28,953 23,737 27,442
Figure 51: Distribution of annual wages/salary by sector
Figure 51 illustrates the high level of income in the public sector and shows that 20% of wage/salary earners in the public sector earn less than SBD$15,600. It is noted that half of wage/salary earners from the private sector receive this level of salary as their maximum wage/ salary.
0
10000
20000
30000
40000
50000
quintile4 median quintile1
SBD
Public Private Other

70
Table 37: Distribution of population aged 10+ by activity status, gender and area (%)
URBAN RURAL NATIONAL
Activity Status Male Female Total Male Female Total Male Female Total
Employer 1.5% 0.2% 0.8% 0.3% 0.1% 0.2% 0.5% 0.1% 0.3%
Employee 39.3% 23.4% 31.5% 12.9% 4.8% 8.9% 18.1% 8.5% 13.4%
Self-emp (o/buss) 8.1% 7.2% 7.7% 10.0% 5.7% 7.9% 9.6% 6.0% 7.8%
Self-emp (o/cons.) 2.1% 2.0% 2.1% 30.5% 39.7% 35.1% 24.9% 32.2% 28.5%
Unpaid wrkrs/vol. 1.6% 0.9% 1.2% 6.1% 1.6% 3.9% 5.2% 1.5% 3.4%
Student 33.1% 29.9% 31.6% 31.9% 26.9% 29.4% 32.1% 27.5% 29.9%
Home duties 12.1% 34.5% 23.1% 5.4% 18.7% 11.9% 6.7% 21.8% 14.1%
Retired 1.1% 0.9% 1.0% 0.6% 1.1% 0.8% 0.7% 1.1% 0.9%
No act/other 1.2% 0.9% 1.0% 2.3% 1.3% 1.8% 2.1% 1.2% 1.7%
Total 100.0% 100.0% 100.0% 100.0% 100.0% 100.0% 100.0% 100.0% 100.0%
The highest proportion of the population aged more than 10 are students (29.9%) followed closely by those that are self-employed in subsistence activities for own consumption (28.5%). By gender, a higher proportion of females are involved in subsistence activities for own consumption at the national level (32.2%, females; 24.9%, males) and this is more predominant in rural areas. There are more males than females engaged as employees in wage/salary jobs and also as employers in all areas.
HOUSEHOLD HEAD AND RELATED CHARACTERISTICS
As recorded in Table 38, males make up the highest proportion of heads of households at the national level and in urban and rural areas (92%, national; 93%, urban; 90%, rural). Female heads of households contribute only 8% to the total household income. This further confirms the extent of unequal distribution of income by male and female heads of households throughout the country. Table38: Distribution of households, contribution to total income and annual average income (excluding imputed rents) by gender of the head of households and area
Area and gender of the household head # HHs
Contribution to total income Annual average total income
SBD’ 000 % SBD Urban
Male 16,497 1,970,534 90.30% 119,450 Female 2,519 212,249 9.70% 84,273 Total 19,015 2,182,783 100.00% 114,793
Rural Male 80,630 3,737,884 93.10% 46,358
Female 8,395 278,595 6.90% 33,184 Total 89,026 4,016,479 100.00% 45,116
National Male 97,127 5,708,418 92.10% 58,773
Female 10,914 490,844 7.90% 44,974 Total 108,041 6,199,262 100.00% 57,379

71
It is seen from Figure 51 and Table 39 that as the age of the household head increases from 15-44 years, total income also increases. As the age increases beyond 44 years, total income decreases. However, in terms of the average incomes, the pattern of income declining becomes obvious from ages 55 years and over. As presented in Figure 52, female-headed households from age 15 years and over by income group earn less than males, and the difference increases up to ages 45-54 years and then declines as age continues to increase.
Figure 52: Average annual total income by age and gender of the household head
Table39: Distribution of households, contribution to total income and annual average income (excluded imputed rents) by age of the head of households and area
Area and age of the household head
# HHs Contribution to total income Annual average total
income SBD’ 000 % SBD
Urban 15-24 357 27,609 1.3% 77,229
25-34 5,177 481,653 22.1% 93,035 35-44 7,008 746,390 34.2% 106,513 45-54 4,124 572,219 26.2% 138,742 55-64 1,817 282,061 12.9% 155,211 64+ 532 72,850 3.3% 137,038 Total 19,015 2,182,783 100.0% 114,793
Rural 15-24 2,212 91,564 2.3% 41,399
25-34 19,900 832,285 20.7% 41,824 35-44 26,438 1,297,198 32.3% 49,065 45-54 20,723 961,151 23.9% 46,382 55-64 14,036 626,927 15.6% 44,667 64+ 5,718 207,354 5.2% 36,265 Total 89,026 4,016,479 100.0% 45,116
010,00020,00030,00040,00050,00060,00070,000
15-24 25-34 35-44 45-54 55-64 64+
SBD
Age of household head
Male Female

72
Cont…Table 39 National
15-24 2,569 119,173 1.9% 46,384 25-34 25,077 1,313,938 21.2% 52,397 35-44 33,446 2,043,588 33.0% 61,102 45-54 24,847 1,533,371 24.7% 61,713 55-64 15,853 908,988 14.7% 57,339 64+ 6,249 280,204 4.5% 44,837
Total 108,041 6,199,262 100.0% 57,379 Note: Slight variations in totals and averages are due to rounding Table 40: Distribution (%) of total annual income groups (excluding imputed rents) by gender of the head of household
Annual total income group (SBD) Male hh head Female hh head Total < 10,000 6.7% 12.8% 7.3%
10,000 - 29,999 37.3% 40.2% 37.6% 30,000 - 49,999 25.3% 22.2% 25.0% 50,000 - 99,999 20.9% 17.5% 20.6%
> 100,000 9.9% 7.3% 9.6% total 100.0% 100.0% 100.0%
The percentage of households that earn less than SBD$10,000 per annum is twice as high for female household heads then the male heads of households. However, female heads of households earn more than their male counterparts in the income group between SBD$10,000 and SBD$30,000. Male heads of households dominate in the three highest income groups. Table 41: Income generation by gender of household head (%)
Gender of the hhold head Cash Home production Gift Imputed
rents Income in kind Total
Male hh head 61.5% 19.6% 1.8% 14.4% 2.7% 100.0% Female hh head 58.6% 18.3% 2.1% 18.7% 2.3% 100.0%
Table 41 above shows the types of sources/categories of income by gender of head of household. There are less significant differences in income distribution by income types according to the gender of the head of household. Table 42: Average annual total household income in activity status and distribution of total income by cash and non-cash (excluding imputed rents, %)
Activity status of household head Average annual total income (SBD)
Type of income Cash (%) Non cash (%)
Work for money - employee 70,862 79.2% 20.8% Work for money - other 106,493 84.5% 15.5% Work no money 34,529 48.9% 51.1% Retired 41,372 71.8% 28.2% Home duties 37,765 64.5% 35.5% No work - other 40,746 74.4% 25.6% Total 57,379 71.9% 28.1%

73
Following from earlier discussion, it is evident that households in the country depend a lot on cash-income. However, given that 82% of all the households are located in rural areas, it is seen from Table 43 that a majority (40%) of the heads of households who work for no money are those that are engaged in subsistence activities for own consumption. It is also seen that a high proportion (46%) of these heads of households are females. Table 43: Distribution (%) of households by gender and activity status of the head of household
Activity status Male Female Total Work for money – employee 16.7% 9.3% 16.0% Work for money – other 30.7% 24.4% 30.1% Work for no money 45.9% 47.1% 46.0%
incl. subsistence for own consumption 39.2% 45.6% 39.8% Retired 0.8% 1.7% 0.9% Home duties 4.4% 16.6% 5.7% No work – other 1.4% 0.9% 1.4% Total 100% 100% 100%

74
SECTION 5: HOUSEHOLD BUSINESS RELATED INCOME/EXPENDITURE This section extends the analysis of household income and expenditure to cover income and expenditure (intermediate consumption/operational expenses) from household-based businesses (non-subsistence), and subsistence-based income earning activities. The net incomes from engagement of labour in these income earning activities are categorised as part of employment income.
As observed in the earlier analysis on employment income, income (cash) generated from household businesses/self-employed activities account for 22% of total household income, and 28% of employment income. In urban areas, income from business accounts for 39% of all employment income while in rural areas, this it is about 28%. Family household businesses (non-subsistence) are predominantly self-employed/sole-trading (e.g., adjacent retail shop/outlets) in nature, while subsistence-based income earning activities are dominated by household members engaged individually or collectively, where some form of income is generated from the outputs of their subsistence activities. Income made from subsistence activities originate mainly through the participation of labour (household/member) in the sale or trading of locally produced, acquired or processed goods from the main specific activities: agriculture, fishing, livestock, handicraft/processing of food. Table 44: Percent of households involved in subsistence and business activities by area
Household business
(non-subsistence)
% of households in subsistence activities
Area Agriculture, forestry Fishing Livestock
Handicraft & home
processed food
Total Hh participation
Urban 28.9% 31.8% 6.3% 14.8% 15.2% 46.8% Rural 16.2% 92.5% 57.4% 63.5% 27.6% 97.1% National 18.4% 81.8% 48.4% 54.9% 25.4% 88.2% As shown in Table 44, 88.2% of total households were involved in at least one subsistence activity generally classified within: agriculture and forestry, fishing, livestock, handicraft and home processed food. Agriculture is the most common activity with 82% of households reported generating some form of income from it.
However, as shown in Table 45 below, 75.6% of households generated income mainly from their involvement in subsistence-based market oriented activities for cash.
Table 45: Percent of households earning income from subsistence and business activities by area
Area Household
business (non- subsistence)
% of households in subsistence activities for cash
Agriculture, forestry
Handicraft & home processed food Livestock Fishing
All Subsistence for cash
Urban 28.9% 13.6% 14.8% 5.9% 4.3% 30.6% Rural 16.2% 68.7% 24.8% 30.3% 35.3% 85.2% National 18.4% 59.0% 23.0% 26.0% 29.8% 75.6%

75
Income generated from the sale of agriculture goods is the most important source of cash-income, representing the involvement of 59% of households. At the national level, agriculture activities account for half the total income generated from all subsistence activities. As observed earlier in the discussion regarding employment income, the total income generated from subsistence activities accounts for 12.6% of total household income, and 14.8% of the total household income (excluding imputed rent). To improve the quality of the net-income measure, expenditure on intermediate consumption (operational/overhead costs) from household business and subsistence-based activities have been collected from the survey, such as amounts spent on fuel for fishing, animal feed for livestock etc. Households involved in subsistence activities primarily for home consumption also incurred some of these costs. These operating and overhead costs are deducted from gross income excluding equipment expenditure (capital expenditure). In total, operating and overhead costs of SBD$764 million were incurred by household businesses and households participating in subsistence activities for cash purposes (see Table 46). Household businesses accounted for 72% of those costs, mainly from household-based retail store activities, construction and transport services. Table 46: Operating/overhead costs by type of subsistence and business activities (‘000, %)
Subsistence activities Annual amount SBD %
Household business (non-subsistence) 550,095 72.0% Subsistence for cash 138,664 18.1%
incl. Agriculture/forestry 16,380 2.1% Fishing 80,167 10.5% Livestock 10,956 1.4% Handicraft & home processed food 31,161 4.1% Subsistence for family consumption 75,040 9.8%
Total operating costs 763,799 100% Table 47 below presents a breakdown of the different kinds of operating costs that business/self-employment and subsistence activities incur during operations. ‘Goods for resale’ (i.e. costs of goods sold) is the highest operating cost as most of the non-subsistence businesses are small adjutant retail outlets.
In terms of the subsistence activities for cash purposes:
- 86% of total operational costs are related to fuel for fishing activities (SBD$69 million) - Out of SBD$31 million spent on the handicraft and home processed food, the purchase of
raw materials accounts for 94% - The agriculture activities are dominated by the transportation for agriculture products
(39%) and related wages (34%) - In terms of livestock-related business, animal feed totalled 72% of operating costs for
livestock activity - Fuel expenditure for non-subsistence businesses totalled SBD$48 million)
Finally. Table 48 presents the aggregated amount of gross and net operating income by type of own employment activities. Deducting the costs allows the estimation of net income.

76
Table 47: Details of annual total operating and overhead costs by type of subsistence and business activities
Operating and overhead costs Household business (non-subsistence)
Subsistence based activities for cash/own-consumption Total Agriculture
& forestry Fishing Livestock Handicraft & home processed food
Subsistence for consumption
Goods for resale 248,184,585
248,184,585 Fuel 48,165,104
69,012,808
61,064,969 178,242,881
Salaries 96,347,983 5,507,185 3,342,314 389,110 293,649 2,682,102 108,562,343 Raw materials 43,476,942
29,283,488 182,192 72,942,623
Transportation 27,411,843 6,411,400 371,824 577,944 940,187 1,273,776 36,986,974 Purchase of equipment 21,703,767 1,138,056 893,807
406,552 24,142,181
Repair and maintenance 15,662,760
702,916
63,227 16,428,903 Fodder / food for animals
7,863,716
5,633,572 13,497,287
Taxes 11,312,543
11,312,543 Registration, licenses and fees 10,275,198
10,275,198
Rental of buildings and stalls 10,187,357
10,187,357 Other 2,949,348 2,539,322 303,962 40,042 643,382 801,783 7,277,838 Communication (phone and internet) 5,677,943
5,677,943
Purchase of fishing equipment
4,337,408
1,178,817 5,516,225 Water and electricity 5,322,692
5,322,692
Rental of equipment 3,416,462 784,143
86,374 4,286,979 Purchase of animals
1,290,155
1,278,650 2,568,805
Ice
1,202,116
9,907 1,212,023 Fencing and enclosures
738,404
377,158 1,115,563
Veterinary services
56,496
550 57,047 Total 550,094,526 16,380,105 80,167,153 10,955,867 31,160,706 75,039,630 763,797,987

77
Table 48: Gross income, operating/overhead costs and net income of subsistence and business activities (‘000)
Gross amount Operating &
overhead costs
Net amount
Cash-income Home production Cash-income Home production
SBD’000 SBD’000 SBD’000 SBD’000 SBD’000 Household business (non-subsistence) 2,117,161 - 550,095 1,567,066 - Subsistence activities cash oriented:
Agriculture & forestry 475,591 - 16,380 459,211 - Fishing 218,119 - 80,167 137,952 - Livestock 187,196 - 10,956 176,240 - handicraft & home processed food 176,018 - 31,161 144,857 -
Subsistence - own consumption oriented - 1,463,877 75,040 - 1,388,838 Total self-employment 3,174,085 1,463,877 763,799 2,485,326 1,388,838 Note: Net income (gross income less costs) figures presented above match the tables presented in section 4 (income analysis). Regarding home production, section 3 (expenditure analysis) presents the amount SBD$ 1,463,867. The expenditure tables present the estimated value of home production consumed if it were to be purchased. The income section shows net amounts (SBD$1,388,838), which match with the above analysis of cost and net income.

78
SECTION 6: COMPARING EXPENDITURE AND INCOME
In the Solomon Islands 2012/13 HIES, it was found that total income was greater than total expenditure. In HIEs conducted across the region, including the previous two HIES conducted in the country, it is not often found that income is greater than expenditure. However, at the provincial level, a number of provinces recorded their total expenditures higher than their corresponding total incomes. This is discussed in the provincial HIES report. The main argument is that households typically underreport income but the same argument could also be made for expenditure.
In terms of the relative contributions of total expenditure over total income, expenditure is less than income by 5%. When imputed rent is excluded, income exceeds expenditure by 6%, and by urban area, income is higher by 14% while in rural areas, income exceeds expenditure by 2%. In rural areas, the gap between income and expenditure is smaller than in urban areas.
As seen in the earlier analysis regarding income and expenditure by deciles, it was found that income was relatively higher for households in deciles 9 and 10, the wealthiest income deciles. Lower income deciles reported expenditure in excess of income which is in line with the expectation that households typically underreport their incomes. In addition, the survey findings from Table 49 reveal that 40% of households reported expenditure higher than income (ratio of 1.26 to 2.0+), a third reported income greater than expenditure (ratio of 0 to 1) and a quarter reported their expenditure about equalled their income (ratio 1.01 to 1.25). These suggest that households are willing to report expenses more openly than income.
Table 49: Ratio of total annual expenditure over total annual income among households
Ratio (Expend/Income
Urban Rural National number % number % number %
0 - 0.25 403 2.1% 620 0.7% 1,023 0.9% 0.26 - 0.5 1,128 5.9% 4,024 4.5% 5,151 4.8%
0.51 - 0.75 2,617 13.8% 9,506 10.7% 12,123 11.2% 0.76 - 1.00 3,049 16.0% 17,795 20.0% 20,844 19.3% 1.01 - 1.25 3,077 16.2% 23,211 26.1% 26,288 24.3% 1.26 - 1.5 2,505 13.2% 13,588 15.3% 16,093 14.9%
1.51 - 1.75 1,894 10.0% 8,038 9.0% 9,932 9.2% 1.76 - 2.00 1,338 7.0% 5,135 5.8% 6,473 6.0%
2.00 + 3,007 15.8% 7,108 8.0% 10,115 9.4% Total 19,015 100.0% 89,026 100.0% 108,041 100.0%
Household income and expenditure surveys conducted in other countries and in the past two Solomon Islands HIES shows that expenditure data appeared to be more reliable and was often used as the proxy for income. However, the quality of the income and expenditure data is limited by a number of factors where practical biases are often experienced by the interviewer and respondents during enumeration such as unsatisfactory recall by the household respondents, underreporting of income for fear of taxation purposes, overstating of consumption of certain luxury items and services, and understating consumption of alcohol, tobacco or illicit substances etc. It is noted that the conceptual treatment and definitions of certain variables and the questionnaire design can also have implications on the quality of the data. These factors have been mentioned earlier in section one (error measurement and limitations). These are unfortunate circumstances but are practical realities of any complex

79
survey operation and thus caution must be taken in the direct comparisons and treatment of income and expenditure data.
In this report, results are presented even with similar indicators produced from the expenditure side as well as the income side of analysis, such as the income deciles and Gini coefficient etc. Unlike previous HIES reports, this is an attempt to disseminate as much information as feasible, and to also allow the user to decide on a preferred measure or information depending on their specific interest.

80
APPENDIX 1: SELECTED DEMOGRAPHIC AND HOUSEHOLD STATISTICAL TABLES

81
Table X1: Total population by province, area and gender (2012/13 HIES and 2009 census)
Province Population - 2012/13 HIES
2009 census
Annual pop. growth rate
(%)*
National Urban Rural
Population Total Male Female Total Male Female Total Male Female
Total Male Female
Total 615,804 317,205 298,598 114,451 58,953 55,498 501,353 258,252 243,100
515,870 264,455 251,415
(3.8) (5.3) ** Choiseul 31,433 16,418 15,015 990 533 456 30,443 15,885 14,558
26,372 13,532 12,840
5.2%
Western 91,033 46,567 44,467 12,832 6,784 6,048 78,201 39,783 38,418
76,649 39,926 36,723
5.1% Isabel 27,610 14,624 12,986 976 500 476 26,633 14,124 12,510
26,158 13,328 12,830
1.6%
Central 31,172 16,104 15,068 1,849 978 871 29,323 15,126 14,197
26,051 13,261 12,790
5.3% Rennell-Bellona 4,650 2,232 2,418 - - - 4,650 2,232 2,418
3,041 1,549 1,492
12.6%
Guadalcanal 108,663 55,934 52,729 17,924 9,172 8,752 90,739 46,762 43,977
93,613 48,283 45,330
4.4% Malaita 170,883 86,935 83,948 5,946 2,893 3,053 164,937 84,042 80,895
137,596 69,232 68,364
6.4%
Makira 53,199 28,251 24,949 2,997 1,432 1,564 50,203 26,818 23,384
40,419 20,789 19,630
8.2% Temotu 28,509 14,620 13,889 2,287 1,140 1,147 26,222 13,480 12,742
21,362 10,466 10,896
8.6%
Honiara 68,651 35,521 33,130 68,651 35,521 33,130 - - -
64,609 34,089 30,520
1.8% *Population growth rate calculated from 2009 census (22 November 2009) to midpoint of 2012/13 HIES (1 April 2013) - 3.36 years.
** The annual national population growth rate between the 2009 census (22 November 2009) was adjusted for an undercount of 8.3% in 2009 at the national level only. Hence, the estimated annual growth rate is 3.8%. See Census National report for further information. Caution should be taken when undertaking population projections especially at the provincial levels.

82
Table X2: Population distribution (%) by province, area and gender (2012/13 HIES and 2009 census)
Province Population - 2012/13 HIES
2009 census
National Urban Rural
Population Total Male Female Total Male Female Total Male Female
Total Male Female
Total 100.0% 100.0% 100.0% 100.0% 100.0% 100.0% 100.0% 100.0% 100.0%
100.0% 100.0% 100.0% Choiseul 5.1% 5.2% 5.0% 0.9% 0.9% 0.8% 6.1% 6.2% 6.0%
5.1% 5.1% 5.1%
Western 14.8% 14.7% 14.9% 11.2% 11.5% 10.9% 15.6% 15.4% 15.8%
14.9% 15.1% 14.6% Isabel 4.5% 4.6% 4.3% 0.9% 0.8% 0.9% 5.3% 5.5% 5.1%
5.1% 5.0% 5.1%
Central 5.1% 5.1% 5.0% 1.6% 1.7% 1.6% 5.8% 5.9% 5.8%
5.0% 5.0% 5.1% Rennell-Bellona 0.8% 0.7% 0.8% 0.0% 0.0% 0.0% 0.9% 0.9% 1.0%
0.6% 0.6% 0.6%
Guadalcanal 17.6% 17.6% 17.7% 15.7% 15.6% 15.8% 18.1% 18.1% 18.1%
18.1% 18.3% 18.0% Malaita 27.7% 27.4% 28.1% 5.2% 4.9% 5.5% 32.9% 32.5% 33.3%
26.7% 26.2% 27.2%
Makira 8.6% 8.9% 8.4% 2.6% 2.4% 2.8% 10.0% 10.4% 9.6%
7.8% 7.9% 7.8% Temotu 4.6% 4.6% 4.7% 2.0% 1.9% 2.1% 5.2% 5.2% 5.2%
4.1% 4.0% 4.3%
Honiara 11.1% 11.2% 11.1% 60.0% 60.3% 59.7% 0.0% 0.0% 0.0%
12.5% 12.9% 12.1%

83
Table X3: Population currently living in household by province, area and gender (2012/13 HIES and 2009 census)
Province
Population - 2012/13 HIES
2009 census
Annual pop.
growth rate (%)*
National Urban Rural
Population
Total Male Female Total Male Female Total Male Female
Total Male Female Total 610,077 314,147 295,929 113,293 58,394 54,899 496,784 255,753 241,031
515,870 264,455 251,415
5.0%
Choiseul 30,846 16,088 14,758 990 533 456 29,856 15,554 14,301
26,372 13,532 12,840
4.7% Western 90,550 46,277 44,272 12,782 6,750 6,032 77,768 39,528 38,240
76,649 39,926 36,723
5.0%
Isabel 27,568 14,598 12,970 976 500 476 26,591 14,098 12,494
26,158 13,328 12,830
1.6% Central 30,884 15,910 14,974 1,849 978 871 29,035 14,932 14,103
26,051 13,261 12,790
5.1%
Rennell-Bellona 4,612 2,211 2,401 - - - 4,612 2,211 2,401
3,041 1,549 1,492
12.4% Guadalcanal 108,354 55,741 52,612 17,871 9,132 8,739 90,482 46,609 43,873
93,613 48,283 45,330
4.4%
Malaita 170,259 86,716 83,543 5,861 2,860 3,001 164,397 83,856 80,541
137,596 69,232 68,364
6.3% Makira 50,875 27,090 23,785 2,728 1,382 1,346 48,148 25,708 22,439
40,419 20,789 19,630
6.8%
Temotu 28,159 14,398 13,761 2,265 1,140 1,125 25,894 13,258 12,636
21,362 10,466 10,896
8.2% Honiara 67,971 35,119 32,853 67,971 35,119 32,853 - - -
64,609 34,089 30,520
1.5%
*Population growth rate calculated from 2009 census (22 November 2009) to midpoint of 2012/13 HIES (1 April 2013) - 3.36 years

84
Table X4 : Percent of Population currently living in household by province, area and gender (2012/13 HIES and 2009 census)
Province Population - 2012/13 HIES
2009 census
National Urban Rural
Population Total Male Female Total Male Female Total Male Female
Total Male Female
Total 100.0% 100.0% 100.0% 100.0% 100.0% 100.0% 100.0% 100.0% 100.0% 100.0% 100.0% 100.0% Choiseul 5.1% 5.1% 5.0% 0.9% 0.9% 0.8% 6.0% 6.1% 5.9%
5.1% 5.1% 5.1%
Western 14.8% 14.7% 15.0% 11.3% 11.6% 11.0% 15.7% 15.5% 15.9%
14.9% 15.1% 14.6% Isabel 4.5% 4.6% 4.4% 0.9% 0.9% 0.9% 5.4% 5.5% 5.2%
5.1% 5.0% 5.1%
Central 5.1% 5.1% 5.1% 1.6% 1.7% 1.6% 5.8% 5.8% 5.9%
5.0% 5.0% 5.1% Rennell-Bellona 0.8% 0.7% 0.8% 0.0% 0.0% 0.0% 0.9% 0.9% 1.0%
0.6% 0.6% 0.6%
Guadalcanal 17.8% 17.7% 17.8% 15.8% 15.6% 15.9% 18.2% 18.2% 18.2%
18.1% 18.3% 18.0% Malaita 27.9% 27.6% 28.2% 5.2% 4.9% 5.5% 33.1% 32.8% 33.4%
26.7% 26.2% 27.2%
Makira 8.3% 8.6% 8.0% 2.4% 2.4% 2.5% 9.7% 10.1% 9.3%
7.8% 7.9% 7.8% Temotu 4.6% 4.6% 4.7% 2.0% 2.0% 2.0% 5.2% 5.2% 5.2%
4.1% 4.0% 4.3%
Honiara 11.1% 11.2% 11.1% 60.0% 60.1% 59.8% 0.0% 0.0% 0.0% 12.5% 12.9% 12.1%

85
Table X5: Population (number) age structure by age class and gender (2012/13 HIES and 2009 census)
2012/13 HIES
2009 census
National
Urban
Rural
Total Male Female
Total Male Female
Total Male
Total Male Female Total 615,806 317,193 298,578 114,451 58,953 55,498 501,320 258,240 515,870 264,455 251,415 0 - 4 years 86,223 44,958 41,265
13,700 7,382 6,318
72,523 37,575
76,500 39,881 36,619
5 - 9 years 86,296 46,175 40,122
12,894 6,873 6,021
73,402 39,301
71,071 36,945 34,126 10 - 14 years 82,334 44,681 37,653
12,884 6,716 6,169
69,450 37,965
61,892 32,540 29,352
15 - 19 years 64,133 33,028 31,105
13,168 6,503 6,665
50,965 26,525
51,171 26,168 25,003 20 - 24 years 46,698 22,050 24,648
12,594 5,859 6,736
34,103 16,191
45,371 22,369 23,002
25 - 29 years 50,526 23,906 26,620
12,630 6,605 6,025
37,897 17,301
42,646 20,774 21,872 30 - 34 years 39,783 19,873 19,910
8,708 4,147 4,562
31,074 15,726
37,572 18,795 18,777
35 - 39 years 40,984 19,762 21,221
8,806 4,587 4,220
32,177 15,176
33,141 17,005 16,136 40 - 44 years 31,793 16,401 15,391
6,450 3,324 3,125
25,343 13,077
23,634 12,070 11,564
45 - 49 years 26,014 13,596 12,418
4,631 2,455 2,175
21,383 11,141
19,709 10,186 9,523 50 - 54 years 21,018 10,570 10,447
3,018 1,709 1,309
18,000 8,861
14,330 7,494 6,836
55 - 59 years 14,284 8,088 6,196
2,175 1,206 969
12,108 6,881
11,784 6,110 5,674 60 - 64 years 12,404 6,992 5,412
1,296 703 594
11,108 6,289
8,911 4,532 4,379
65 - 69 years 5,809 2,845 2,964
620 328 292
5,189 2,517
7,016 3,691 3,325 70 - 74 years 3,154 2,146 1,008
437 279 159
2,716 1,867
4,697 2,402 2,295
75 - 79 years 2,097 1,070 1,027
273 189 84
1,824 881
3,374 1,784 1,590 80 - 80 years 2,224 1,053 1,171
165 88 77
2,059 965
3,051 1,709 1,342
N/A 32

86
Table X6: Population (%) by age structure and age group, and gender (2012/13 HIES and 2009 census)
2012/13 HIES
2009 census
National
Urban
Rural
Total Male Female
Total Male Female
Total Male
Total Male Female Total 100.0% 100.0% 100.0%
100.0% 100.0% 100.0% 100.0% 100.0%
100.0% 100.0% 100.0%
0 - 4 years 14.0% 14.2% 13.8%
12.0% 12.5% 11.4%
14.5% 14.6%
15.1% 14.6% 14.8% 5 - 9 years 14.0% 14.6% 13.4%
11.3% 11.7% 10.8%
14.6% 15.2%
14.0% 13.6% 13.8%
10 - 14 years 13.4% 14.1% 12.6%
11.3% 11.4% 11.1%
13.9% 14.7%
12.3% 11.7% 12.0% 15 - 19 years 10.4% 10.4% 10.4%
11.5% 11.0% 12.0%
10.2% 10.3%
9.9% 9.9% 9.9%
20 - 24 years 7.6% 7.0% 8.3%
11.0% 9.9% 12.1%
6.8% 6.3%
8.5% 9.1% 8.8% 25 - 29 years 8.2% 7.5% 8.9%
11.0% 11.2% 10.9%
7.6% 6.7%
7.9% 8.7% 8.3%
30 - 34 years 6.5% 6.3% 6.7%
7.6% 7.0% 8.2%
6.2% 6.1%
7.1% 7.5% 7.3% 35 - 39 years 6.7% 6.2% 7.1%
7.7% 7.8% 7.6%
6.4% 5.9%
6.4% 6.4% 6.4%
40 - 44 years 5.2% 5.2% 5.2%
5.6% 5.6% 5.6%
5.1% 5.1%
4.6% 4.6% 4.6% 45 - 49 years 4.2% 4.3% 4.2%
4.0% 4.2% 3.9%
4.3% 4.3%
3.9% 3.8% 3.8%
50 - 54 years 3.4% 3.3% 3.5%
2.6% 2.9% 2.4%
3.6% 3.4%
2.8% 2.7% 2.8% 55 - 59 years 2.3% 2.5% 2.1%
1.9% 2.0% 1.7%
2.4% 2.7%
2.3% 2.3% 2.3%
60 - 64 years 2.0% 2.2% 1.8%
1.1% 1.2% 1.1%
2.2% 2.4%
1.7% 1.7% 1.7% 65 - 69 years 0.9% 0.9% 1.0%
0.5% 0.6% 0.5%
1.0% 1.0%
1.4% 1.3% 1.4%
70 - 74 years 0.5% 0.7% 0.3%
0.4% 0.5% 0.3%
0.5% 0.7%
0.9% 0.9% 0.9% 75 - 79 years 0.3% 0.3% 0.3%
0.2% 0.3% 0.2%
0.4% 0.3%
0.7% 0.6% 0.7%
80 - 80 years 0.4% 0.3% 0.4%
0.1% 0.1% 0.1%
0.4% 0.4%
0.6% 0.5% 0.6% N/A 0.0% 0.0% 0.0%
0.0% 0.0% 0.0% 0.0% 0.0%
0.0% 0.0% 0.0%
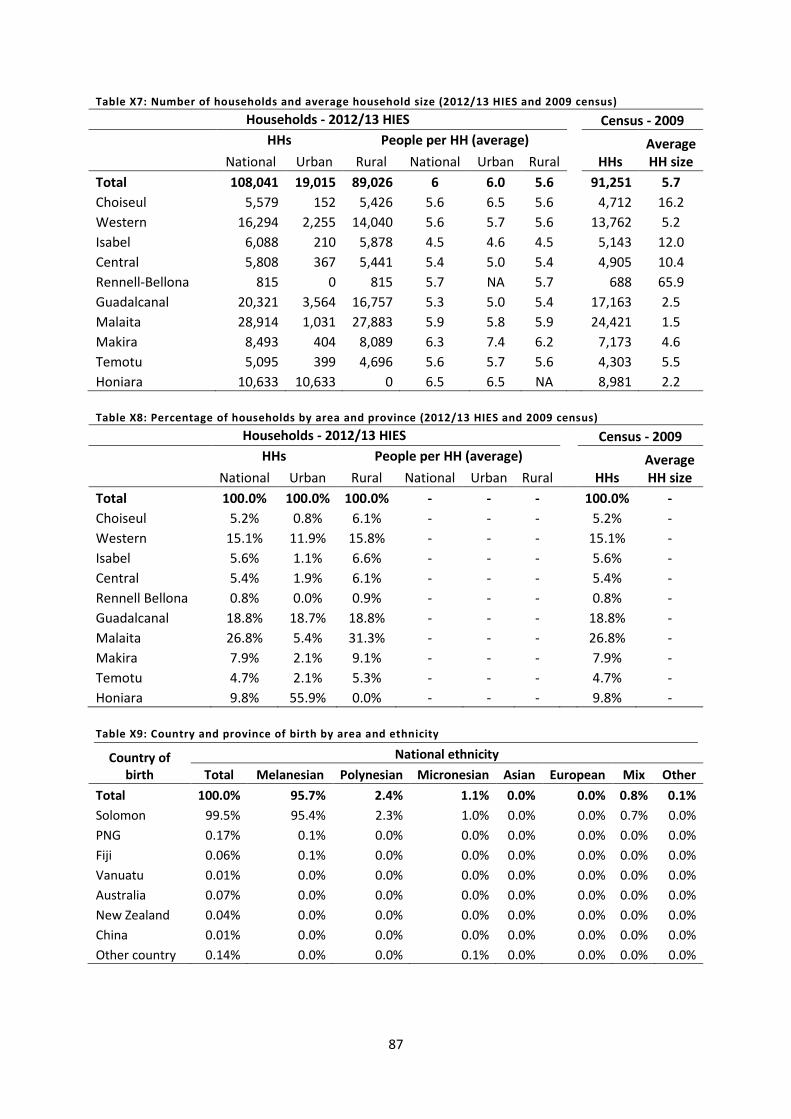
87
Table X7: Number of households and average household size (2012/13 HIES and 2009 census) Households - 2012/13 HIES Census - 2009
HHs People per HH (average)
HHs Average HH size
National Urban Rural National Urban Rural
Total 108,041 19,015 89,026 6 6.0 5.6
91,251 5.7 Choiseul 5,579 152 5,426 5.6 6.5 5.6
4,712 16.2
Western 16,294 2,255 14,040 5.6 5.7 5.6
13,762 5.2 Isabel 6,088 210 5,878 4.5 4.6 4.5
5,143 12.0
Central 5,808 367 5,441 5.4 5.0 5.4
4,905 10.4 Rennell-Bellona 815 0 815 5.7 NA 5.7
688 65.9
Guadalcanal 20,321 3,564 16,757 5.3 5.0 5.4
17,163 2.5 Malaita 28,914 1,031 27,883 5.9 5.8 5.9
24,421 1.5
Makira 8,493 404 8,089 6.3 7.4 6.2
7,173 4.6 Temotu 5,095 399 4,696 5.6 5.7 5.6
4,303 5.5
Honiara 10,633 10,633 0 6.5 6.5 NA
8,981 2.2 Table X8: Percentage of households by area and province (2012/13 HIES and 2009 census)
Households - 2012/13 HIES Census - 2009
HHs People per HH (average)
HHs Average HH size
National Urban Rural National Urban Rural
Total 100.0% 100.0% 100.0% - - - 100.0% - Choiseul 5.2% 0.8% 6.1% - - -
5.2% -
Western 15.1% 11.9% 15.8% - - -
15.1% - Isabel 5.6% 1.1% 6.6% - - -
5.6% -
Central 5.4% 1.9% 6.1% - - -
5.4% - Rennell Bellona 0.8% 0.0% 0.9% - - -
0.8% -
Guadalcanal 18.8% 18.7% 18.8% - - -
18.8% - Malaita 26.8% 5.4% 31.3% - - -
26.8% -
Makira 7.9% 2.1% 9.1% - - -
7.9% - Temotu 4.7% 2.1% 5.3% - - -
4.7% -
Honiara 9.8% 55.9% 0.0% - - - 9.8% - Table X9: Country and province of birth by area and ethnicity
Country of birth
National ethnicity Total Melanesian Polynesian Micronesian Asian European Mix Other
Total 100.0% 95.7% 2.4% 1.1% 0.0% 0.0% 0.8% 0.1% Solomon 99.5% 95.4% 2.3% 1.0% 0.0% 0.0% 0.7% 0.0% PNG 0.17% 0.1% 0.0% 0.0% 0.0% 0.0% 0.0% 0.0% Fiji 0.06% 0.1% 0.0% 0.0% 0.0% 0.0% 0.0% 0.0% Vanuatu 0.01% 0.0% 0.0% 0.0% 0.0% 0.0% 0.0% 0.0% Australia 0.07% 0.0% 0.0% 0.0% 0.0% 0.0% 0.0% 0.0% New Zealand 0.04% 0.0% 0.0% 0.0% 0.0% 0.0% 0.0% 0.0% China 0.01% 0.0% 0.0% 0.0% 0.0% 0.0% 0.0% 0.0% Other country 0.14% 0.0% 0.0% 0.1% 0.0% 0.0% 0.0% 0.0%

88
Table X10: Marital status by 5-year age group and gender
Age Group
<15 15 - 19 20 - 24 25 - 29 30 - 34 35 - 39 40 - 44 45 - 49 50 - 54 55 - 59 60 - 64 65 - 69 70 - 74 75 +
National Never married 100.0% 94.2% 69.1% 35.2% 15.2% 6.8% 4.5% 2.9% 2.9% 2.8% 4.0% 3.9% 5.7% 8.6% Legally married 0.0% 3.1% 19.5% 44.1% 63.6% 75.0% 79.9% 78.3% 72.9% 75.2% 74.1% 59.0% 63.2% 29.2% Custom married 0.0% 2.1% 9.4% 16.2% 17.2% 15.2% 11.6% 12.7% 11.6% 9.3% 6.2% 9.5% 7.7% 9.6% Defacto 0.0% 0.6% 1.5% 2.7% 1.9% 0.9% 1.0% 0.5% 2.6% 0.1% 0.2% 1.4% 0.9% 1.4% Divorced 0.0% 0.0% 0.1% 0.2% 0.6% 0.4% 0.4% 0.8% 0.3% 1.1% 0.3% 0.0% 0.0% 0.0% Separated 0.0% 0.0% 0.3% 1.2% 1.0% 0.8% 1.2% 1.1% 0.7% 1.7% 0.3% 2.0% 1.4% 0.0% Widowed 0.0% 0.0% 0.0% 0.3% 0.5% 0.9% 1.4% 3.6% 9.1% 9.9% 14.9% 24.2% 21.1% 51.2% Male Never married 100.0% 96.7% 83.1% 45.9% 18.6% 8.5% 3.8% 2.7% 1.4% 2.2% 4.1% 4.1% 3.8% 8.0% Legally married 0.0% 1.8% 10.4% 35.4% 61.2% 73.8% 80.8% 80.2% 78.8% 80.7% 85.4% 72.6% 71.6% 43.8% Custom married 0.0% 1.2% 5.4% 16.1% 17.6% 15.8% 13.7% 15.1% 11.8% 12.3% 5.6% 10.6% 7.6% 15.8% Defacto 0.0% 0.2% 0.9% 2.1% 1.7% 0.8% 1.1% 0.4% 2.4% 0.1% 0.4% 0.4% 1.4% 2.8% Divorced 0.0% 0.0% 0.1% 0.1% 0.4% 0.4% 0.2% 0.7% 0.1% 0.2% 0.3% 0.0% 0.0% 0.0% Separated 0.0% 0.0% 0.0% 0.4% 0.5% 0.1% 0.2% 0.3% 0.4% 0.8% 0.1% 1.9% 2.1% 0.0% Widowed 0.0% 0.0% 0.1% 0.1% 0.1% 0.5% 0.2% 0.5% 5.0% 3.7% 4.1% 10.5% 13.4% 29.7% Female Never married 100.0% 91.5% 56.7% 25.6% 11.8% 5.2% 5.2% 3.1% 4.3% 3.5% 3.9% 3.6% 9.4% 9.2% Legally married 0.0% 4.4% 27.6% 52.0% 65.9% 76.1% 78.9% 76.2% 66.8% 68.0% 59.4% 45.6% 45.9% 14.9% Custom married 0.0% 3.0% 12.9% 16.4% 16.8% 14.5% 9.4% 10.0% 11.3% 5.4% 6.9% 8.4% 7.8% 3.5% Defacto 0.0% 1.0% 2.1% 3.2% 2.1% 1.0% 1.0% 0.5% 2.9% 0.0% 0.0% 2.5% 0.0% 0.0% Divorced 0.0% 0.0% 0.1% 0.3% 0.9% 0.5% 0.6% 1.0% 0.4% 2.1% 0.3% 0.0% 0.0% 0.0% Separated 0.0% 0.0% 0.6% 2.0% 1.5% 1.4% 2.2% 2.1% 1.1% 2.9% 0.5% 2.2% 0.0% 0.0% Widowed 0.0% 0.0% 0.0% 0.5% 1.0% 1.3% 2.7% 7.0% 13.1% 18.0% 29.0% 37.7% 36.8% 72.5%
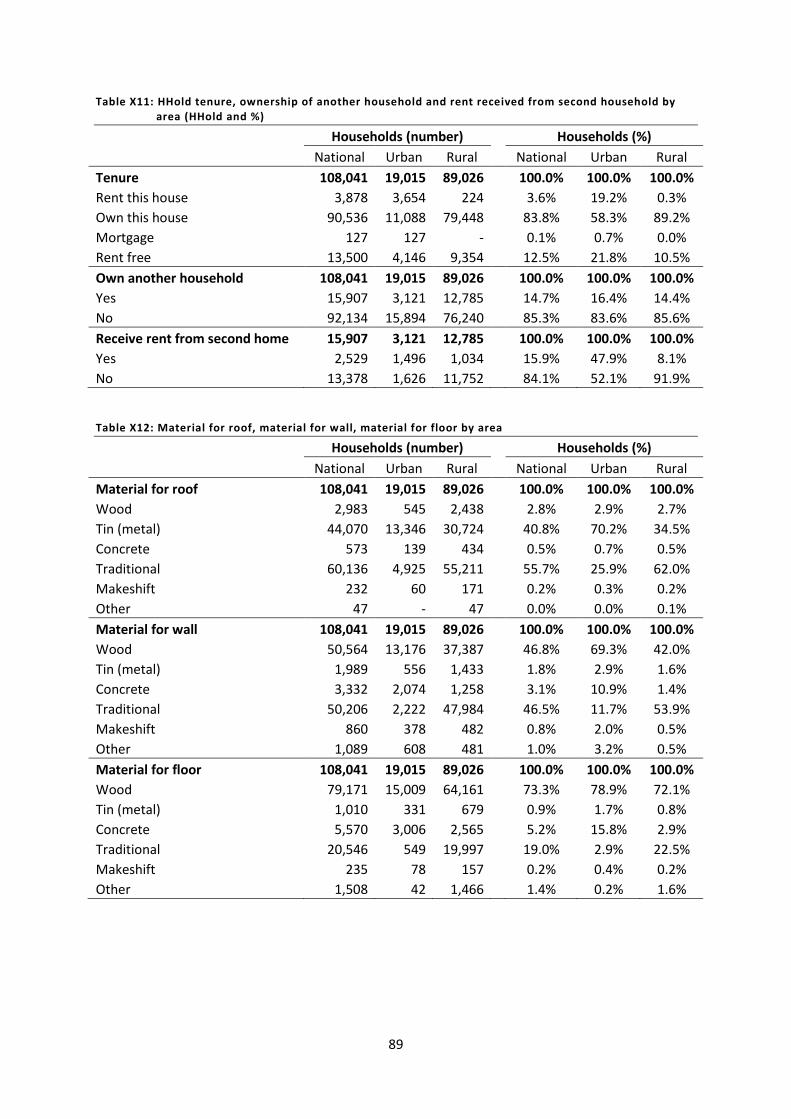
89
Table X11: HHold tenure, ownership of another household and rent received from second household by area (HHold and %)
Households (number)
Households (%)
National Urban Rural
National Urban Rural
Tenure 108,041 19,015 89,026
100.0% 100.0% 100.0% Rent this house 3,878 3,654 224
3.6% 19.2% 0.3%
Own this house 90,536 11,088 79,448
83.8% 58.3% 89.2% Mortgage 127 127 -
0.1% 0.7% 0.0%
Rent free 13,500 4,146 9,354
12.5% 21.8% 10.5% Own another household 108,041 19,015 89,026
100.0% 100.0% 100.0%
Yes 15,907 3,121 12,785
14.7% 16.4% 14.4% No 92,134 15,894 76,240
85.3% 83.6% 85.6%
Receive rent from second home 15,907 3,121 12,785
100.0% 100.0% 100.0% Yes 2,529 1,496 1,034
15.9% 47.9% 8.1%
No 13,378 1,626 11,752
84.1% 52.1% 91.9%
Table X12: Material for roof, material for wall, material for floor by area
Households (number)
Households (%)
National Urban Rural
National Urban Rural
Material for roof 108,041 19,015 89,026
100.0% 100.0% 100.0% Wood 2,983 545 2,438
2.8% 2.9% 2.7%
Tin (metal) 44,070 13,346 30,724
40.8% 70.2% 34.5% Concrete 573 139 434
0.5% 0.7% 0.5%
Traditional 60,136 4,925 55,211
55.7% 25.9% 62.0% Makeshift 232 60 171
0.2% 0.3% 0.2%
Other 47 - 47
0.0% 0.0% 0.1% Material for wall 108,041 19,015 89,026
100.0% 100.0% 100.0%
Wood 50,564 13,176 37,387
46.8% 69.3% 42.0% Tin (metal) 1,989 556 1,433
1.8% 2.9% 1.6%
Concrete 3,332 2,074 1,258
3.1% 10.9% 1.4% Traditional 50,206 2,222 47,984
46.5% 11.7% 53.9%
Makeshift 860 378 482
0.8% 2.0% 0.5% Other 1,089 608 481
1.0% 3.2% 0.5%
Material for floor 108,041 19,015 89,026
100.0% 100.0% 100.0% Wood 79,171 15,009 64,161
73.3% 78.9% 72.1%
Tin (metal) 1,010 331 679
0.9% 1.7% 0.8% Concrete 5,570 3,006 2,565
5.2% 15.8% 2.9%
Traditional 20,546 549 19,997
19.0% 2.9% 22.5% Makeshift 235 78 157
0.2% 0.4% 0.2%
Other 1,508 42 1,466
1.4% 0.2% 1.6%

90
Table X13: Type of living quarters, kitchen type, professional room, bathing and toilet facilities by area
Households (number)
Households (%)
National Urban Rural
National Urban Rural
Type of living quarters 108,041 19,015 89,026
100.0% 100.0% 100.0%
Individual house (not attached) 101,583 15,815 85,768
94.0% 83.2% 96.3%
One family house attached to another house 3,956 2,157 1,798
3.7% 11.3% 2.0%
Building with two or more apartments/flats 1,790 959 831
1.7% 5.0% 0.9%
Household attached to non-residential building 500 84 416
0.5% 0.4% 0.5%
Other 212 - 212
0.2% 0.0% 0.2%
Kitchen type 108,041 19,015 89,026
100.0% 100.0% 100.0%
Both inside and outside kitchen 7,826 4,930 2,896
7.2% 25.9% 3.3%
Kitchen inside the house 8,749 3,207 5,542
8.1% 16.9% 6.2%
Kitchen outside the house (not attached) 89,826 10,232 79,594
83.1% 53.8% 89.4%
Place to cook inside the house 763 253 509
0.7% 1.3% 0.6%
No place to cook 468 212 257
0.4% 1.1% 0.3%
Other 408 181 227
0.4% 1.0% 0.3%
Have a professional room 108,041 19,015 89,026
100.0% 100.0% 100.0%
Yes 16,112 3,418 12,694
14.9% 18.0% 14.3%
No 91,929 15,598 76,332
85.1% 82.0% 85.7%
Bathing facilities 108,041 19,015 89,026
100.0% 100.0% 100.0%
Private bathroom 11,273 8,930 2,344
10.4% 47.0% 2.6%
Shared bathroom 2,814 2,315 499
2.6% 12.2% 0.6%
Household or community tank 3,102 684 2,418
2.9% 3.6% 2.7%
Household or community standpipe 43,902 3,233 40,668
40.6% 17.0% 45.7%
Household or community well 12,736 2,070 10,667
11.8% 10.9% 12.0%
Sea 2,685 81 2,603
2.5% 0.4% 2.9%
River / Stream 30,023 1,309 28,714
27.8% 6.9% 32.3%
Other 1,506 393 1,113
1.4% 2.1% 1.3%
Main toilet facility 108,041 19,015 89,026
100.0% 100.0% 100.0%
Flush toilet (private) 11,226 8,211 3,015
10.4% 43.2% 3.4%
Flush toilet (community) 1,610 1,172 438
1.5% 6.2% 0.5%
Slab toilet (private) 13,449 4,614 8,835
12.4% 24.3% 9.9%
Slab toilet (community) 2,663 1,719 944
2.5% 9.0% 1.1%
Seaside mangrove 45,098 1,210 43,888
41.7% 6.4% 49.3%
Pit latrine (private) 11,339 1,044 10,295
10.5% 5.5% 11.6%
Pit latrine (community) 4,149 485 3,664
3.8% 2.6% 4.1%
River / Stream 3,178 319 2,859
2.9% 1.7% 3.2%
Other 15,329 241 15,088
14.2% 1.3% 16.9%

91
Table X14: Main source of lighting and electricity provider by area
Households (number)
Households (%)
National Urban Rural
National Urban Rural
Main source of lighting 108,041 19,015 89,026
100.0% 100.0% 100.0% Electricity 48,243 11,493 36,750
44.7% 60.4% 41.3%
Gas 229 11 218
0.2% 0.1% 0.2% Butterfly lamp / Coleman lamp 517 89 428
0.5% 0.5% 0.5%
Solar lamp 43,008 3,517 39,491
39.8% 18.5% 44.4% Kerosene lamp 12,064 2,789 9,275
11.2% 14.7% 10.4%
Candle 220 81 139
0.2% 0.4% 0.2% Wood / Coconut shells 329 85 244
0.3% 0.4% 0.3%
Other 3,432 951 2,482
3.2% 5.0% 2.8% Electricity provider 108,041 19,015 89,026
100.0% 100.0% 100.0%
SIEA 9,711 9,513 197
9.0% 50.0% 0.2% Generator (household owned) 481 84 397
0.4% 0.4% 0.4%
Generator (community owned) 1,995 130 1,866
1.8% 0.7% 2.1% Solar unit (household owned) 33,677 1,706 31,971
31.2% 9.0% 35.9%
Solar unit (community owned) 590 37 553
0.5% 0.2% 0.6% Other 1,789 23 1,766
1.7% 0.1% 2.0%
na 59,798 7,522 52,275
55.3% 39.6% 58.7%
Table X15: Main source of cooking fuel and time to reach firewood by area
Households (number)
Households (%)
National Urban Rural
National Urban Rural
Main cooking fuel 108,041 19,015 89,026
100.0% 100.0% 100.0% Wood / coconut shells 97,341 10,782 86,559
90.1% 56.7% 97.2%
Electricity 551 221 330
0.5% 1.2% 0.4% Gas 7,251 6,191 1,060
6.7% 32.6% 1.2%
Sawdust / charcoal 2,209 1,408 801
2.0% 7.4% 0.9% Kerosene 462 320 142
0.4% 1.7% 0.2%
Other 227 93 134
0.2% 0.5% 0.2% Time to reach firewood (one way) 97,341 10,782 86,559
100.0% 100.0% 100.0%
Less than 15 min 33,146 2,665 30,480
34.1% 24.7% 35.2% 15 - 30 min 34,780 2,581 32,199
35.7% 23.9% 37.2%
30 min to 1 hour 19,140 1,492 17,648
19.7% 13.8% 20.4% More than 1 hour 6,435 652 5,783
6.6% 6.0% 6.7%
Pay for firewood 3,068 2,794 273
3.2% 25.9% 0.3% Other 773 598 175
0.8% 5.5% 0.2%

92
Table X16: Main source of drinking and cooking water and travel for water by area (households)
National (HH number)
Urban (HH number)
Rural (HH number)
Travel for water
Travel for water
Travel for water
Total Yes No
Total Yes No
Total Yes No
Main source of drinking water 108,041 62,964 45,077
19,015 4,034 14,981
89,026 58,930 30,096 Metered SIWA 11,606 1,087 10,519
10,801 768 10,033
805 319 486
Communal standpipe 41,765 24,310 17,455
1,724 881 843
40,041 23,429 16,613 Household tank 14,472 4,121 10,351
3,049 394 2,655
11,423 3,727 7,696
Community tank 10,951 6,429 4,522
861 376 485
10,090 6,054 4,037 Protected well 1,940 1,797 143
256 132 124
1,684 1,665 19
Unprotected well 1,347 1,176 171
327 155 171
1,020 1,020 - River / Spring 23,330 22,284 1,045
853 777 76
22,476 21,507 969
Pay for bottled water 226 106 120
207 87 120
19 19 - Other 2,404 1,654 749
939 465 474
1,465 1,189 276
Same source of cooking water 108,041 62,964 45,077
19,015 4,034 14,981
89,026 58,930 30,096 Yes 98,900 57,641 41,259
16,991 3,529 13,462
81,909 54,112 27,796
No 9,141 5,322 3,819
2,024 505 1,519
7,117 4,817 2,300 Main source of cooking water 9,141 5,322 3,819
2,024 505 1,519
7,117 4,817 2,300
Piped water (inside the house) 926 229 697
565 54 511
361 175 186 Piped water (outside the house) 1,286 538 747
277 100 177
1,009 438 571
Standpipe (private) 698 170 527
143 17 126
555 153 401 Standpipe (community) 1,872 1,070 802
35 31 3
1,837 1,038 799
Household tank 535 524 11
26 15 11
509 509 - Community tank 244 177 67
67 - 67
177 177 -
Well 1,894 1,217 677
626 142 484
1,268 1,075 193 Spring / River 1,479 1,295 184
181 146 35
1,297 1,149 149
Sea water 30 30 -
- - -
30 30 - Other 177 72 105
105 - 105
72 72 -

93
Table X17: Main source of household drinking and cooking water and travel for water by area (% of households)
Travel for water
Travel for water
Travel for water
National Yes No
National Yes No
National Yes No
Main source of drinking water 100.0% 58.3% 41.7%
100.0% 21.2% 78.8%
100.0% 66.2% 33.8% Metered SIWA 10.7% 1.0% 9.7%
56.8% 4.0% 52.8%
0.9% 0.4% 0.5%
Communal standpipe 38.7% 22.5% 16.2%
9.1% 4.6% 4.4%
45.0% 26.3% 18.7% Household tank 13.4% 3.8% 9.6%
16.0% 2.1% 14.0%
12.8% 4.2% 8.6%
Community tank 10.1% 6.0% 4.2%
4.5% 2.0% 2.6%
11.3% 6.8% 4.5% Protected well 1.8% 1.7% 0.1%
1.3% 0.7% 0.7%
1.9% 1.9% 0.0%
Unprotected well 1.2% 1.1% 0.2%
1.7% 0.8% 0.9%
1.1% 1.1% 0.0% River / Spring 21.6% 20.6% 1.0%
4.5% 4.1% 0.4%
25.2% 24.2% 1.1%
Pay for bottled water 0.2% 0.1% 0.1%
1.1% 0.5% 0.6%
0.0% 0.0% 0.0% Other 2.2% 1.5% 0.7%
4.9% 2.4% 2.5%
1.6% 1.3% 0.3%
Same source of cooking water 100.0% 100.0% 100.0%
100.0% 100.0% 100.0%
100.0% 100.0% 100.0% Yes 91.5% 91.5% 91.5%
89.4% 87.5% 89.9%
92.0% 91.8% 92.4%
No 8.5% 8.5% 8.5%
10.6% 12.5% 10.1%
8.0% 8.2% 7.6% Main source of cooking water 100.0% 100.0% 100.0%
100.0% 100.0% 100.0%
100.0% 100.0% 100.0%
Piped water (inside the house) 10.1% 4.3% 18.3%
27.9% 10.7% 33.6%
5.1% 3.6% 8.1% Piped water (outside the house) 14.1% 10.1% 19.6%
13.7% 19.8% 11.7%
14.2% 9.1% 24.8%
Standpipe (private) 7.6% 3.2% 13.8%
7.1% 3.4% 8.3%
7.8% 3.2% 17.4% Standpipe (community) 20.5% 20.1% 21.0%
1.7% 6.1% 0.2%
25.8% 21.5% 34.7%
Household tank 5.9% 9.8% 0.3%
1.3% 3.0% 0.7%
7.2% 10.6% 0.0% Community tank 2.7% 3.3% 1.8%
3.3% 0.0% 4.4%
2.5% 3.7% 0.0%
Well 20.7% 22.9% 17.7%
30.9% 28.1% 31.9%
17.8% 22.3% 8.4% Spring / River 16.2% 24.3% 4.8%
8.9% 28.9% 2.3%
18.2% 23.9% 6.5%
Sea water 0.3% 0.6% 0.0%
0.0% 0.0% 0.0%
0.4% 0.6% 0.0% Other 1.9% 1.4% 2.7%
5.2% 0.0% 6.9%
1.0% 1.5% 0.0%

94
Table X18: Time to reach water source (1 way) by area (number and % of households)
Households (number)
Households (%)
National Urban Rural
National Urban Rural Time to reach water source 62,964 4,034 58,930
100.0% 100.0% 100.0%
0 - 4 mins 29,439 883 28,556
46.8% 21.9% 48.5% 5 - 9 mins 13,341 1,197 12,144
21.2% 29.7% 20.6%
10 - 14 mins 7,031 784 6,247
11.2% 19.4% 10.6% 15 - 19 mins 3,537 363 3,174
5.6% 9.0% 5.4%
20 - 24 mins 2,522 257 2,265
4.0% 6.4% 3.8% 25 - 29 mins 717 35 682
1.1% 0.9% 1.2%
30 - 34 mins 2,915 92 2,823
4.6% 2.3% 4.8% >35 mins 3,462 423 3,039
5.5% 10.5% 5.2%
Trips for water per day 62,964 4,034 58,930 100.0% 100.0% 100.0% 1 trips per day 11,240 1,129 10,111
17.9% 28.0% 17.2%
2 trips per day 27,341 1,530 25,812
43.4% 37.9% 43.8% 3 trips per day 17,404 1,059 16,345
27.6% 26.3% 27.7%
4 trips per day 3,641 165 3,476
5.8% 4.1% 5.9% 5 trips per day 2,249 58 2,191
3.6% 1.4% 3.7%
6 trips per day 853 69 784
1.4% 1.7% 1.3% 7 trips per day 110 0 110
0.2% 0.0% 0.2%
8 trips per day 107 6 101
0.2% 0.1% 0.2% 9 trips per day 18 18 0
0.0% 0.4% 0.0%
Table X19: Primary health care facility, main mode of transportation and travel time to health care facility by area
Households (number)
Households (%)
National Urban Rural
National Urban Rural
Primary health care facility 108,041 19,015 89,026
100.0% 100.0% 100.0% NHR 3,025 1,364 1,661
2.8% 7.2% 1.9%
Province centre 16,532 2,964 13,568
15.3% 15.6% 15.2% HTC clinic 16,227 12,485 3,742
15.0% 65.7% 4.2%
Aid post 27,678 764 26,915
25.6% 4.0% 30.2% Rural aid centre 40,451 - 40,451
37.4% 0.0% 45.4%
Other 4,129 1,438 2,689
3.8% 7.6% 3.0% Main mode of transportation to HC facility 108,041 19,015 89,026
100.0% 100.0% 100.0%
Walk 72,874 10,687 62,187
67.5% 56.2% 69.9% Canoe 14,304 383 13,922
13.2% 2.0% 15.6%
Vehicle 16,568 7,811 8,757
15.3% 41.1% 9.8% Boat (OBM) 3,770 101 3,669
3.5% 0.5% 4.1%
Other 525 34 491
0.5% 0.2% 0.6% Travel time to health care facility 108,041 19,015 89,026 100.0% 100.0% 100.0% 0 - 14 mins 29,326 6,913 22,413
27.1% 36.4% 25.2%
15 - 29 mins 16,015 4,827 11,188
14.8% 25.4% 12.6% 30 - 44 mins 20,376 4,211 16,164
18.9% 22.1% 18.2%
45 - 59 mins 4,910 744 4,166
4.5% 3.9% 4.7% 60 - 74 mins 12,755 874 11,881
11.8% 4.6% 13.3%
>74 mins 24,659 1,445 23,213 22.8% 7.6% 26.1%
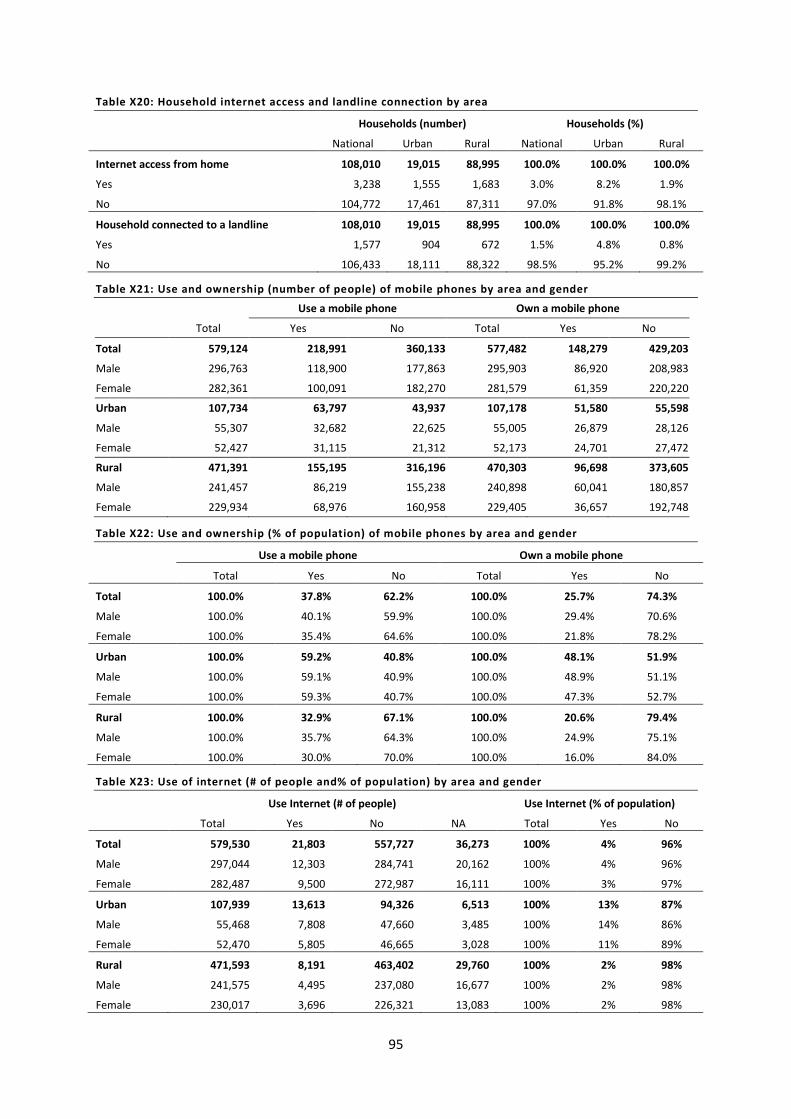
95
Table X20: Household internet access and landline connection by area
Households (number) Households (%)
National Urban Rural National Urban Rural
Internet access from home 108,010 19,015 88,995 100.0% 100.0% 100.0%
Yes 3,238 1,555 1,683 3.0% 8.2% 1.9%
No 104,772 17,461 87,311 97.0% 91.8% 98.1%
Household connected to a landline 108,010 19,015 88,995 100.0% 100.0% 100.0%
Yes 1,577 904 672 1.5% 4.8% 0.8%
No 106,433 18,111 88,322 98.5% 95.2% 99.2% Table X21: Use and ownership (number of people) of mobile phones by area and gender
Use a mobile phone Own a mobile phone
Total Yes No Total Yes No Total 579,124 218,991 360,133 577,482 148,279 429,203 Male 296,763 118,900 177,863 295,903 86,920 208,983 Female 282,361 100,091 182,270 281,579 61,359 220,220 Urban 107,734 63,797 43,937 107,178 51,580 55,598 Male 55,307 32,682 22,625 55,005 26,879 28,126 Female 52,427 31,115 21,312 52,173 24,701 27,472 Rural 471,391 155,195 316,196 470,303 96,698 373,605 Male 241,457 86,219 155,238 240,898 60,041 180,857 Female 229,934 68,976 160,958 229,405 36,657 192,748
Table X22: Use and ownership (% of population) of mobile phones by area and gender
Use a mobile phone Own a mobile phone
Total Yes No Total Yes No
Total 100.0% 37.8% 62.2% 100.0% 25.7% 74.3%
Male 100.0% 40.1% 59.9% 100.0% 29.4% 70.6%
Female 100.0% 35.4% 64.6% 100.0% 21.8% 78.2%
Urban 100.0% 59.2% 40.8% 100.0% 48.1% 51.9%
Male 100.0% 59.1% 40.9% 100.0% 48.9% 51.1%
Female 100.0% 59.3% 40.7% 100.0% 47.3% 52.7%
Rural 100.0% 32.9% 67.1% 100.0% 20.6% 79.4%
Male 100.0% 35.7% 64.3% 100.0% 24.9% 75.1%
Female 100.0% 30.0% 70.0% 100.0% 16.0% 84.0% Table X23: Use of internet (# of people and% of population) by area and gender
Use Internet (# of people) Use Internet (% of population)
Total Yes No NA Total Yes No
Total 579,530 21,803 557,727 36,273 100% 4% 96%
Male 297,044 12,303 284,741 20,162 100% 4% 96%
Female 282,487 9,500 272,987 16,111 100% 3% 97%
Urban 107,939 13,613 94,326 6,513 100% 13% 87%
Male 55,468 7,808 47,660 3,485 100% 14% 86%
Female 52,470 5,805 46,665 3,028 100% 11% 89%
Rural 471,593 8,191 463,402 29,760 100% 2% 98%
Male 241,575 4,495 237,080 16,677 100% 2% 98%
Female 230,017 3,696 226,321 13,083 100% 2% 98%

96
Table X24: Internet source (# of people) by area and gender
Internet source 1
Total Home Work Café School
Another HH
Mobile phone USB Other
Total 21,723 2,162 10,274 1,898 3,266 20 3,865 223 15 Male 12,290 1,215 5,470 1,308 1,976 20 2,195 90 15 Female 9,433 947 4,804 590 1,289 - 1,669 133 - Urban 13,532 1,995 5,408 1,225 2,035 20 2,626 208 15 Male 7,795 1,163 3,166 742 1,183 20 1,416 90 15 Female 5,737 832 2,243 483 852 - 1,210 118 - Rural 8,191 168 4,866 673 1,231 - 1,238 15 - Male 4,495 52 2,305 566 793 - 779 - - Female 3,696 116 2,561 107 438 - 459 15 -
Internet source 2
Total Home Work Café School
Another HH
Mobile phone USB Other
Total 8,532 220 6,576 640 551 24 408 107 6 Male 4,614 159 3,328 410 400 24 250 37 6 Female 3,918 61 3,248 230 150 - 158 71 - Urban 3,098 220 1,787 363 278 - 366 84 0 Male 1,927 159 1,060 247 174 - 250 37 0 Female 1,173 61 727 116 105 - 116 48 0 Rural 5,432 0 4,788 277 272 24 42 23 6 Male 2,686 0 2,267 162 227 24 - - 6 Female 2,746 0 2,521 114 46 - 42 23 -
Internet source 3
Total Home Work Café School
Another HH
Mobile phone USB Other
Total 7,196 254 5,936 137 181 - 515 92 81 Male 3,771 152 2,867 85 181 - 358 66 62 Female 3,423 101 3,068 52 - - 157 26 19 Urban 2,090 192 1,220 111 116 - 359 92 - Male 1,265 129 643 72 116 - 239 66 - Female 828 64 578 40 - - 120 26 - Rural 5,104 61 4,716 26 65 - 155 - 81 Male 2,507 23 2,225 13 65 - 119 - 62 Female 2,597 38 2,491 13 - - 36 - 19

97
Table X25: Households with a vegetable garden its location by area
Households (number)
Households (%)
National Urban Rural
National Urban Rural
Have a vegetable garden 108,041 19,015 89,026
100.0% 100.0% 100.0%
Yes 96,253 8,480 87,774
89.1% 44.6% 98.6%
No 11,787 10,535 1,252
10.9% 55.4% 1.4%
Location of garden 96,253 8,480 87,774
100.0% 100.0% 100.0%
Near the residence 19,910 4,678 15,232
20.7% 55.2% 17.4%
Elsewhere 75,407 3,775 71,632
78.3% 44.5% 81.6%
Community 886 27 859
0.9% 0.3% 1.0%
Other 50 - 50
0.1% 0.0% 0.1% Table X26: Type of produce grown for households with gardens by area
Households (number)
Households (%)
National Urban Rural
National Urban Rural
Slippery cabbage 96,253 8,480 87,774
100.0% 100.0% 100.0%
Yes 82,682 5,536 77,146
85.9% 65.3% 87.9%
No 13,572 2,944 10,628
14.1% 34.7% 12.1%
Chinese cabbage 96,253 8,480 87,774
100.0% 100.0% 100.0%
Yes 19,794 1,989 17,805
20.6% 23.5% 20.3%
No 76,459 6,491 69,968
79.4% 76.5% 79.7%
Tomato 96,253 8,480 87,774
100.0% 100.0% 100.0%
Yes 55,698 3,956 51,742
57.9% 46.7% 58.9%
No 40,555 4,524 36,031
42.1% 53.3% 41.0%
Kumara 96,253 8,480 87,774
100.0% 100.0% 100.0%
Yes 91,628 5,633 85,994
95.2% 66.4% 98.0%
No 4,626 2,846 1,779
4.8% 33.6% 2.0%
Cucumber 96,253 8,480 87,774
100.0% 100.0% 100.0%
Yes 26,160 994 25,166
27.2% 11.7% 28.7%
No 70,094 7,486 62,608
72.8% 88.3% 71.3%
Yam 96,253 8,480 87,774
100.0% 100.0% 100.0%
Yes 62,308 1,895 60,413
64.7% 22.3% 68.8%
No 33,946 6,585 27,361
35.3% 77.7% 31.2%
Cassava 96,253 8,480 87,774
100.0% 100.0% 100.0%
Yes 93,223 7,477 85,746
96.9% 88.2% 97.7%
No 3,030 1,003 2,028
3.1% 11.8% 2.3%
Taro 96,253 8,480 87,774
100.0% 100.0% 100.0%
Yes 72,279 2,490 69,789
75.1% 29.4% 79.5%
No 23,974 5,990 17,984
24.9% 70.6% 20.5%
Pumpkin 96,253 8,480 87,774
100.0% 100.0% 100.0%
Yes 50,568 3,076 47,492
52.5% 36.3% 54.1%
No 45,685 5,404 40,281
47.5% 63.7% 45.9%
Eggplant 96,253 8,480 87,774
100.0% 100.0% 100.0%
Yes 60,943 4,568 56,375
63.3% 53.9% 64.2%
No 35,310 3,912 31,398
36.7% 46.1% 35.8%
Banana 96,253 8,480 87,774
100.0% 100.0% 100.0%

98
Yes 90,890 7,136 83,754
94.4% 84.2% 95.4%
No 5,364 1,344 4,020
5.6% 15.8% 4.6%
Pawpaw 96,253 8,480 87,774
100.0% 100.0% 100.0%
Yes 80,835 6,302 74,533
84.0% 74.3% 84.9%
No 15,418 2,178 13,240
16.0% 25.7% 15.1%
Long beans 96,253 8,480 87,774
100.0% 100.0% 100.0%
Yes 78,682 4,992 73,690
81.7% 58.9% 84.0%
No 17,572 3,488 14,084
18.3% 41.1% 16.0%
Other 96,107 8,463 87,644
100.0% 100.0% 100.0%
Yes 46,574 1,851 44,723
48.5% 21.9% 51.0%
No 49,533 6,612 42,920
51.5% 78.1% 49.0%
Table X27: Education attendance by area and gender (# of people)
Attended formal education (#)
Total
Never attended
Already left school
Currently attending N/A*
National 615,804 88,472 269,408 219,962 37,962 Male 317,205 39,901 138,872 117,393 21,039 Female 298,598 48,571 130,536 102,569 16,922 Urban 114,452 12,697 56,327 38,937 6,491 Male 58,953 6,539 28,508 20,476 3,430 Female 55,498 6,158 27,819 18,460 3,061 Rural 501,352 75,775 213,081 181,025 31,471 Male 258,252 33,362 110,364 96,916 17,610 Female 243,100 42,413 102,717 84,109 13,861 * N/A (not applicable) refers to population that is < 2 years old and household members who use to live in each household, however no longer do so.
Table X28: Education attendance by area and gender (% of population)
Attended formal education (%)
Total
Never attended
Already left school
Currently attending N/A*
National 100.0% 14.4% 43.7% 35.7% 6.2% Male 100.0% 12.6% 43.8% 37.0% 6.6% Female 100.0% 16.3% 43.7% 34.4% 5.7% Urban 100.0% 11.1% 49.2% 34.0% 5.7% Male 100.0% 11.1% 48.4% 34.7% 5.8% Female 100.0% 11.1% 50.1% 33.3% 5.5% Rural 100.0% 15.1% 42.5% 36.1% 6.3% Male 100.0% 12.9% 42.7% 37.5% 6.8% Female 100.0% 17.4% 42.3% 34.6% 5.7%

99
Table X29: Reason for never attending school by area and gender (# of people)
Reason for never attending school (#)
Total Too young School fees
Travel distance
Family problems Disability
Parents not want No school
Refused to go Other
National 88,472 43,739 2,385 7,395 1,473 3,201 11,529 2,911 14,379 1,460 Male 39,900 23,295 1,203 3,505 752 1,656 1,766 1,093 5,907 723 Female 48,571 20,443 1,182 3,890 721 1,545 9,763 1,818 8,472 737 Urban 12,697 6,745 809 352 358 396 1,172 276 2,395 194 Male 6,539 3,873 487 142 182 237 134 99 1,335 50 Female 6,157 2,872 322 210 176 159 1,037 177 1,060 144 Rural 75,774 36,993 1,576 7,043 1,115 2,806 10,357 2,635 11,984 1,265 Male 33,361 19,423 716 3,362 570 1,420 1,631 994 4,572 673 Female 42,413 17,571 860 3,680 545 1,386 8,726 1,641 7,412 592 Table X30: Reason for never attending school by area and gender (% of population)
Reason for never attending school (%)
Total Too young School fees
Travel distance
Family problems Disability
Parents not want No school
Refused to go Other
National 100.0% 49.4% 2.7% 8.4% 1.7% 3.6% 13.0% 3.3% 16.3% 1.7% Male 100.0% 58.4% 3.0% 8.8% 1.9% 4.2% 4.4% 2.7% 14.8% 1.8% Female 100.0% 42.1% 2.4% 8.0% 1.5% 3.2% 20.1% 3.7% 17.4% 1.5% Urban 100.0% 53.1% 6.4% 2.8% 2.8% 3.1% 9.2% 2.2% 18.9% 1.5% Male 100.0% 59.2% 7.4% 2.2% 2.8% 3.6% 2.0% 1.5% 20.4% 0.8% Female 100.0% 46.6% 5.2% 3.4% 2.9% 2.6% 16.8% 2.9% 17.2% 2.3% Rural 100.0% 48.8% 2.1% 9.3% 1.5% 3.7% 13.7% 3.5% 15.8% 1.7% Male 100.0% 58.2% 2.1% 10.1% 1.7% 4.3% 4.9% 3.0% 13.7% 2.0% Female 100.0% 41.4% 2.0% 8.7% 1.3% 3.3% 20.6% 3.9% 17.5% 1.4%
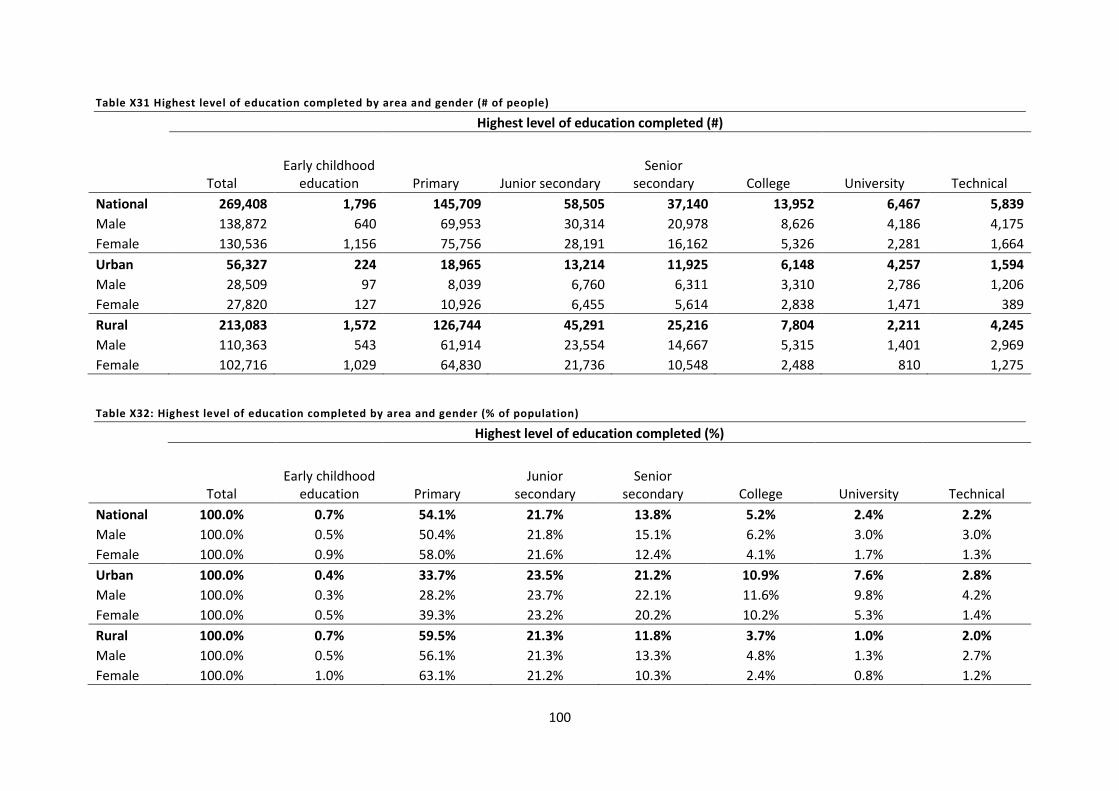
100
Table X31 Highest level of education completed by area and gender (# of people)
Highest level of education completed (#)
Total
Early childhood education Primary Junior secondary
Senior secondary College University Technical
National 269,408 1,796 145,709 58,505 37,140 13,952 6,467 5,839 Male 138,872 640 69,953 30,314 20,978 8,626 4,186 4,175 Female 130,536 1,156 75,756 28,191 16,162 5,326 2,281 1,664 Urban 56,327 224 18,965 13,214 11,925 6,148 4,257 1,594 Male 28,509 97 8,039 6,760 6,311 3,310 2,786 1,206 Female 27,820 127 10,926 6,455 5,614 2,838 1,471 389 Rural 213,083 1,572 126,744 45,291 25,216 7,804 2,211 4,245 Male 110,363 543 61,914 23,554 14,667 5,315 1,401 2,969 Female 102,716 1,029 64,830 21,736 10,548 2,488 810 1,275
Table X32: Highest level of education completed by area and gender (% of population)
Highest level of education completed (%)
Total
Early childhood education Primary
Junior secondary
Senior secondary College University Technical
National 100.0% 0.7% 54.1% 21.7% 13.8% 5.2% 2.4% 2.2% Male 100.0% 0.5% 50.4% 21.8% 15.1% 6.2% 3.0% 3.0% Female 100.0% 0.9% 58.0% 21.6% 12.4% 4.1% 1.7% 1.3% Urban 100.0% 0.4% 33.7% 23.5% 21.2% 10.9% 7.6% 2.8% Male 100.0% 0.3% 28.2% 23.7% 22.1% 11.6% 9.8% 4.2% Female 100.0% 0.5% 39.3% 23.2% 20.2% 10.2% 5.3% 1.4% Rural 100.0% 0.7% 59.5% 21.3% 11.8% 3.7% 1.0% 2.0% Male 100.0% 0.5% 56.1% 21.3% 13.3% 4.8% 1.3% 2.7% Female 100.0% 1.0% 63.1% 21.2% 10.3% 2.4% 0.8% 1.2%

101
Table X33: Reason for leaving school by area and gender (# of people)
Reason for leaving school (#)
Total
Completed desired
schooling
Poor academic progress
Further schooling not
available Too
expensive Too far away
Had to find a job
Help home /business Pregnant
Teacher absent
Does not see value in
education
Cannot afford
lunch cost Other
National 269,409 76,342 77,541 13,992 28,357 10,818 15,478 9,454 6,484 1,178 23,781 372 5,612
Male 138,872 42,919 38,735 7,624 14,884 4,783 10,779 2,325 553 353 12,812 110 2,995
Female 130,537 33,423 38,806 6,368 13,473 6,035 4,699 7,129 5,932 825 10,968 262 2,617
Urban 56,326 19,120 16,414 2,621 4,554 774 6,226 1,768 699 51 2,940 65 1,094
Male 28,509 10,789 7,635 1,405 2,085 322 3,788 486 11 0 1,445 0 543
Female 27,818 8,331 8,778 1,216 2,470 452 2,438 1,283 688 51 1,495 65 551
Rural 213,081 57,222 61,127 11,370 23,803 10,044 9,252 7,685 5,785 1,127 20,841 307 4,518
Male 110,364 32,130 31,099 6,219 12,800 4,461 6,991 1,840 541 353 11,368 110 2,452
Female 102,718 25,093 30,028 5,152 11,003 5,583 2,261 5,846 5,243 774 9,473 196 2,066
Table X34: Reason for leaving school by area and gender (% of population)
Reason for leaving school (%)
Total
Completed desired
schooling
Poor academic progress
Further schooling
not available
Too expensive
Too far away
Had to find a job
Help home /business Pregnancy
Teacher absenteeism
Does not see value
in education
Cannot afford
lunch cost Other
National 100.0% 28.3% 28.8% 5.2% 10.5% 4.0% 5.7% 3.5% 2.4% 0.4% 8.8% 0.1% 2.1%
Male 100.0% 30.9% 27.9% 5.5% 10.7% 3.4% 7.8% 1.7% 0.4% 0.3% 9.2% 0.1% 2.2%
Female 100.0% 25.6% 29.7% 4.9% 10.3% 4.6% 3.6% 5.5% 4.5% 0.6% 8.4% 0.2% 2.0%
Urban 100.0% 33.9% 29.1% 4.7% 8.1% 1.4% 11.1% 3.1% 1.2% 0.1% 5.2% 0.1% 1.9%
Male 100.0% 37.8% 26.8% 4.9% 7.3% 1.1% 13.3% 1.7% 0.0% 0.0% 5.1% 0.0% 1.9%
Female 100.0% 29.9% 31.6% 4.4% 8.9% 1.6% 8.8% 4.6% 2.5% 0.2% 5.4% 0.2% 2.0%
Rural 100.0% 26.9% 28.7% 5.3% 11.2% 4.7% 4.3% 3.6% 2.7% 0.5% 9.8% 0.1% 2.1%
Male 100.0% 29.1% 28.2% 5.6% 11.6% 4.0% 6.3% 1.7% 0.5% 0.3% 10.3% 0.1% 2.2%
Female 100.0% 24.4% 29.2% 5.0% 10.7% 5.4% 2.2% 5.7% 5.1% 0.8% 9.2% 0.2% 2.0%

102
Table X35: Current level of education by area and gender (# of people)
Current level of education (#)
Total
Early childhood education Primary
Junior secondary
Senior secondary College University Technical
National 219,962 43,051 119,186 32,023 15,478 3,614 4,209 2,401 Male 117,391 20,591 64,617 16,820 8,872 2,038 2,742 1,711 Female 102,569 22,459 54,569 15,203 6,606 1,576 1,467 689 Urban 38,937 6,188 16,245 6,047 5,588 2,042 2,272 555 Male 20,475 3,103 8,687 2,850 2,990 1,214 1,334 297 Female 18,460 3,085 7,557 3,197 2,597 828 938 258 Rural 181,026 36,863 102,942 25,976 9,891 1,572 1,937 1,845 Male 96,916 17,488 55,930 13,970 5,882 824 1,408 1,414 Female 84,109 19,374 47,012 12,006 4,009 748 529 431
Table X36: Current level of education by area and gender (% of population)
Current level of education (%)
Total
Early childhood education Primary
Junior secondary
Senior secondary College University Technical
National 100.0% 19.6% 54.2% 14.6% 7.0% 1.6% 1.9% 1.1% Male 100.0% 17.5% 55.0% 14.3% 7.6% 1.7% 2.3% 1.5% Female 100.0% 21.9% 53.2% 14.8% 6.4% 1.5% 1.4% 0.7% Urban 100.0% 15.9% 41.7% 15.5% 14.4% 5.2% 5.8% 1.4% Male 100.0% 15.2% 42.4% 13.9% 14.6% 5.9% 6.5% 1.5% Female 100.0% 16.7% 40.9% 17.3% 14.1% 4.5% 5.1% 1.4% Rural 100.0% 20.4% 56.9% 14.3% 5.5% 0.9% 1.1% 1.0% Male 100.0% 18.0% 57.7% 14.4% 6.1% 0.9% 1.5% 1.5% Female 100.0% 23.0% 55.9% 14.3% 4.8% 0.9% 0.6% 0.5%

103
Table X37: School location (for current attendees) relative to household by area and gender (# of people)
School location relative to the household (#)
Total Same village Within 30mn walk
More than 30mn walk Boarding school
Elsewhere in the Solomon Islands Overseas
National 219,962 89,857 60,559 44,138 13,300 11,206 902
Male 117,393 46,398 32,379 23,483 7,822 6,689 622
Female 102,569 43,459 28,180 20,655 5,478 4,517 280
Urban 38,937 19,041 7,999 7,569 1,540 2,304 484
Male 20,476 9,740 4,206 4,124 767 1,347 292
Female 18,460 9,300 3,793 3,445 773 957 192
Rural 181,025 70,816 52,560 36,569 11,760 8,901 419
Male 96,916 36,657 28,174 19,359 7,055 5,341 330
Female 84,108 34,159 24,386 17,210 4,705 3,560 88 Table X37a: School location (for current attendees) relative to household by area and gender (% of population)
School location relative to the household (%)
Total Same village Within 30mn walk
More than 30mn walk Boarding school
Elsewhere in the Solomon Islands Overseas
National 100.0% 40.9% 27.5% 20.1% 6.0% 5.1% 0.4%
Male 100.0% 39.5% 27.6% 20.0% 6.7% 5.7% 0.5%
Female 100.0% 42.4% 27.5% 20.1% 5.3% 4.4% 0.3%
Urban 100.0% 48.9% 20.5% 19.4% 4.0% 5.9% 1.2%
Male 100.0% 47.6% 20.5% 20.1% 3.7% 6.6% 1.4%
Female 100.0% 50.4% 20.5% 18.7% 4.2% 5.2% 1.0%
Rural 100.0% 39.1% 29.0% 20.2% 6.5% 4.9% 0.2%
Male 100.0% 37.8% 29.1% 20.0% 7.3% 5.5% 0.3%
Female 100.0% 40.6% 29.0% 20.5% 5.6% 4.2% 0.1%

104
Table X38: Location of school lunch (for current attendees) by area and gender (# of people)
Location of school lunch (#)
Total Buys lunch
Lunch provided at school At home
Bring food to school
No lunch Other
National 219,962 51,537 21,453 110,293 24,814 10,094 1,771 Male 117,393 26,143 12,440 59,474 12,863 5,507 966 Female 102,569 25,394 9,013 50,819 11,951 4,587 805 Urban 38,937 25,863 3,547 7,101 1,857 400 169 Male 20,476 13,451 1,921 3,772 975 283 76 Female 18,460 12,413 1,626 3,329 882 118 94 Rural 181,025 25,674 17,906 103,192 22,957 9,693 1,602 Male 96,916 12,693 10,519 55,702 11,888 5,224 890 Female 84,109 12,981 7,387 47,490 11,069 4,469 712
Table X39: Location of school lunch (for current attendees) by area and gender (% of population)
Location of school lunch (%)
Total Buys lunch
Lunch provided at
school At home Bring food to school No lunch Other
National 100.0% 23.4% 9.8% 50.1% 11.3% 4.6% 0.8% Male 100.0% 22.3% 10.6% 50.7% 11.0% 4.7% 0.8% Female 100.0% 24.8% 8.8% 49.5% 11.7% 4.5% 0.8% Urban 100.0% 66.4% 9.1% 18.2% 4.8% 1.0% 0.4% Male 100.0% 65.7% 9.4% 18.4% 4.8% 1.4% 0.4% Female 100.0% 67.2% 8.8% 18.0% 4.8% 0.6% 0.5% Rural 100.0% 14.2% 9.9% 57.0% 12.7% 5.4% 0.9% Male 100.0% 13.1% 10.9% 57.5% 12.3% 5.4% 0.9% Female 100.0% 15.4% 8.8% 56.5% 13.2% 5.3% 0.8%
Table X40: Residence (for current attendees) during school week (# of people)
Residence during the school week (#)
Total
At school (boarding school)
At home (current residence)
In another household Other
National 219,962 20,789 187,751 10,815 607 Male 117,393 12,023 99,050 5,964 356 Female 102,569 8,766 88,701 4,851 251 Urban 38,937 3,224 34,228 1,422 63 Male 20,476 1,769 17,782 901 25 Female 18,460 1,455 16,446 521 38 Rural 181,025 17,565 153,523 9,393 544 Male 96,916 10,254 81,268 5,063 331 Female 84,109 7,311 72,254 4,330 213

105
Table X41: Residence (for current attendees) during school week (% of population)
Residence during the school week (%)
Total
At school (boarding
school)
At home (current
residence) In another household Other
National 100.0% 9.5% 85.4% 4.9% 0.3% Male 100.0% 10.2% 84.4% 5.1% 0.3% Female 100.0% 8.5% 86.5% 4.7% 0.2% Urban 100.0% 8.3% 87.9% 3.7% 0.2% Male 100.0% 8.6% 86.8% 4.4% 0.1% Female 100.0% 7.9% 89.1% 2.8% 0.2% Rural 100.0% 9.7% 84.8% 5.2% 0.3% Male 100.0% 10.6% 83.9% 5.2% 0.3% Female 100.0% 8.7% 85.9% 5.1% 0.3%
Table X42: Main transport (for current attendees) to school (# of people)
Main transportation to school (#)
Total Walking
Public transport
Private vehicle Boat Plane Other
National 219,962 185,658 17,053 4,019 6,301 532 6,398 Male 117,393 97,979 9,729 2,308 3,861 313 3,202 Female 102,569 87,678 7,324 1,712 2,440 220 3,196 Urban 38,937 23,460 11,023 3,008 574 322 550 Male 20,476 12,230 5,780 1,669 361 188 248 Female 18,460 11,230 5,243 1,339 213 134 302 Rural 181,025 162,198 6,030 1,011 5,728 210 5,848 Male 96,916 85,749 3,949 639 3,501 124 2,954 Female 84,109 76,449 2,081 372 2,227 86 2,894
Table X43: Main transport (for current attendees) to school (% of population)
Main transportation to school (%)
Total Walking
Public transport
Private vehicle Boat Plane Other
National 100.0% 84.4% 7.8% 1.8% 2.9% 0.2% 2.9% Male 100.0% 83.5% 8.3% 2.0% 3.3% 0.3% 2.7% Female 100.0% 85.5% 7.1% 1.7% 2.4% 0.2% 3.1%
Urban 100.0% 60.3% 28.3% 7.7% 1.5% 0.8% 1.4% Male 100.0% 59.7% 28.2% 8.2% 1.8% 0.9% 1.2% Female 100.0% 60.8% 28.4% 7.3% 1.2% 0.7% 1.6%
Rural 100.0% 89.6% 3.3% 0.6% 3.2% 0.1% 3.2% Male 100.0% 88.5% 4.1% 0.7% 3.6% 0.1% 3.0% Female 100.0% 90.9% 2.5% 0.4% 2.6% 0.1% 3.4%

106
Table X44: Number of hours (for current attendees) in a school week (# of people)
Number of hours in a school week (#)
Total < 10 10 to 19 20 to 29 30 to 39 40 +
National 219,962 27,190 35,900 94,894 56,630 5,348 Male 117,393 14,147 17,425 52,513 30,271 3,037 Female 102,569 13,043 18,475 42,381 26,359 2,311 Urban 38,937 5,243 4,568 14,193 13,520 1,413 Male 20,476 2,764 2,488 7,466 6,852 907 Female 18,460 2,480 2,079 6,728 6,668 506 Rural 181,025 21,947 31,333 80,700 43,110 3,935 Male 96,916 11,384 14,937 45,047 23,419 2,130 Female 84,109 10,563 16,396 35,653 19,691 1,806
Table X45: Number of hours (for current attendees) in a school week (% of population)
Number of hours in a school week (%)
Total < 10 10 to 19 20 to 29 30 to 39 40 +
National 100.0% 12.4% 16.3% 43.1% 25.7% 2.4% Male 100.0% 12.1% 14.8% 44.7% 25.8% 2.6% Female 100.0% 12.7% 18.0% 41.3% 25.7% 2.3% Urban 100.0% 13.5% 11.7% 36.5% 34.7% 3.6% Male 100.0% 13.5% 12.2% 36.5% 33.5% 4.4% Female 100.0% 13.4% 11.3% 36.4% 36.1% 2.7% Rural 100.0% 12.1% 17.3% 44.6% 23.8% 2.2% Male 100.0% 11.7% 15.4% 46.5% 24.2% 2.2% Female 100.0% 12.6% 19.5% 42.4% 23.4% 2.1%

107
Table X46: Main activity status last week by area and gender (number of people)
National Urban Rural
Total Male Female Total Male Female Total Male Female
Main activity status last week 438,802 223,649 215,157 87,214 44,428 42,785 351,588 179,220 172,369 Employer 1,411 1,126 285 735 646 89 676 480 197 Employee (public sector) 22,346 13,588 8,758 8,259 4,882 3,377 14,087 8,707 5,381 Employee (private sector) 31,082 22,899 8,184 18,032 11,970 6,062 13,050 10,929 2,121 Employee (NGO) 1,516 980 537 646 339 307 870 640 230 Employee ( Church) 3,835 3,041 794 547 258 289 3,288 2,783 505 Producing goods for sale 34,363 21,446 12,917 6,656 3,578 3,078 27,707 17,868 9,839 Producing goods for self-consumption 124,936 55,682 69,254 1,837 972 865 123,098 54,710 68,388 Unpaid family worker in a business or plantation 9,211 6,995 2,216 699 386 313 8,512 6,610 1,903 Unpaid family worker (household domestic work) 36,161 10,688 25,473 8,460 2,774 5,686 27,701 7,914 19,787 Voluntary / Community work 5,687 4,687 1,000 379 307 71 5,309 4,380 929 Student (full time) 123,123 67,156 55,967 25,902 13,867 12,035 97,220 53,288 43,932 Student (part time) 7,992 4,721 3,272 1,598 838 760 6,394 3,883 2,511 Homemaker 25,939 4,425 21,514 11,664 2,591 9,074 14,275 1,834 12,440 Retired / too old 3,829 1,531 2,299 871 488 382 2,959 1,042 1,916 Did not pursue any activity 7,371 4,684 2,687 929 532 397 6,442 4,152 2,290

108
Table X47: Main activity status last week by area and gender (% of population)
National Urban Rural
Total Male Female Total Male Female Total Male Female
Main activity status last week 100.0% 100.0% 100.0% 100.0% 100.0% 100.0% 100.0% 100.0% 100.0% Employer 0.3% 0.5% 0.1% 0.8% 1.5% 0.2% 0.2% 0.3% 0.1% Employee (public sector) 5.1% 6.1% 4.1% 9.5% 11.0% 7.9% 4.0% 4.9% 3.1% Employee (private sector) 7.1% 10.2% 3.8% 20.7% 26.9% 14.2% 3.7% 6.1% 1.2% Employee (NGO) 0.3% 0.4% 0.2% 0.7% 0.8% 0.7% 0.2% 0.4% 0.1% Employee ( Church) 0.9% 1.4% 0.4% 0.6% 0.6% 0.7% 0.9% 1.6% 0.3% Producing goods for sale 7.8% 9.6% 6.0% 7.6% 8.1% 7.2% 7.9% 10.0% 5.7% Producing goods for self-consumption 28.5% 24.9% 32.2% 2.1% 2.2% 2.0% 35.0% 30.5% 39.7% Unpaid family worker in a business or plantation 2.1% 3.1% 1.0% 0.8% 0.9% 0.7% 2.4% 3.7% 1.1% Unpaid family worker (household domestic work) 8.2% 4.8% 11.8% 9.7% 6.2% 13.3% 7.9% 4.4% 11.5% Voluntary / Community work 1.3% 2.1% 0.5% 0.4% 0.7% 0.2% 1.5% 2.4% 0.5% Student (full time) 28.1% 30.0% 26.0% 29.7% 31.2% 28.1% 27.7% 29.7% 25.5% Student (part time) 1.8% 2.1% 1.5% 1.8% 1.9% 1.8% 1.8% 2.2% 1.5% Homemaker 5.9% 2.0% 10.0% 13.4% 5.8% 21.2% 4.1% 1.0% 7.2% Retired / too old 0.9% 0.7% 1.1% 1.0% 1.1% 0.9% 0.8% 0.6% 1.1% Did not pursue any activity 1.7% 2.1% 1.2% 1.1% 1.2% 0.9% 1.8% 2.3% 1.3%
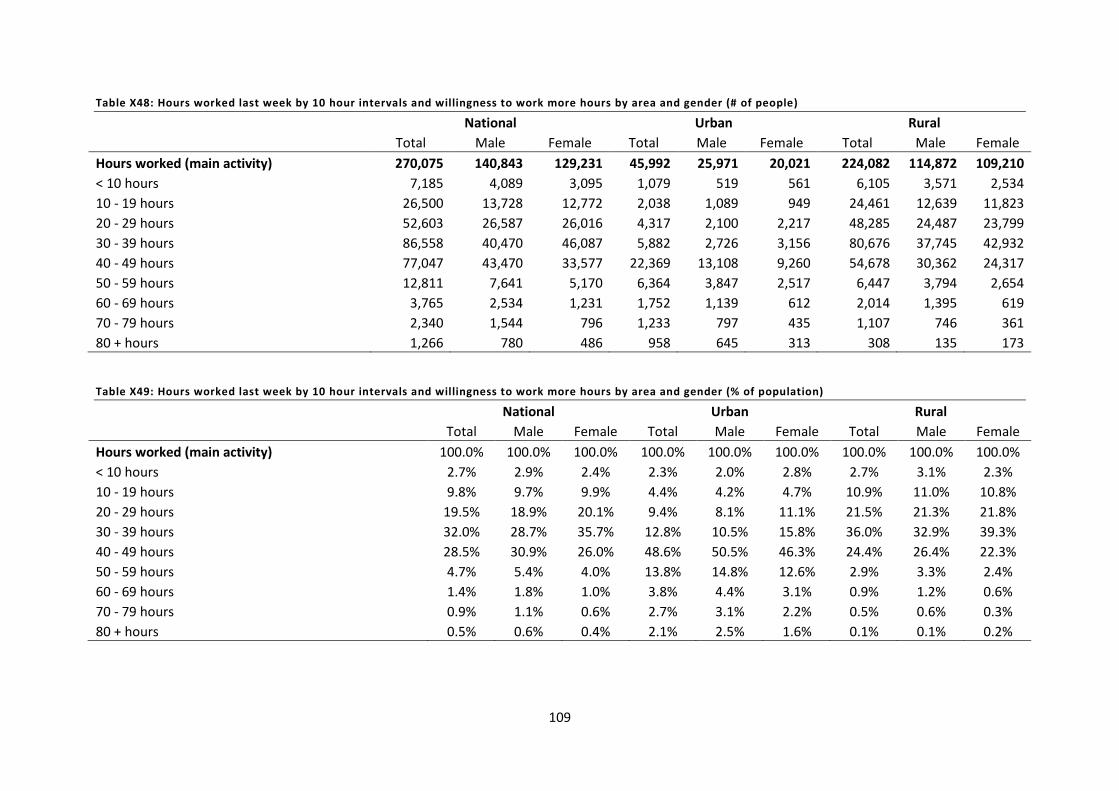
109
Table X48: Hours worked last week by 10 hour intervals and willingness to work more hours by area and gender (# of people)
National Urban Rural
Total Male Female Total Male Female Total Male Female
Hours worked (main activity) 270,075 140,843 129,231 45,992 25,971 20,021 224,082 114,872 109,210 < 10 hours 7,185 4,089 3,095 1,079 519 561 6,105 3,571 2,534 10 - 19 hours 26,500 13,728 12,772 2,038 1,089 949 24,461 12,639 11,823 20 - 29 hours 52,603 26,587 26,016 4,317 2,100 2,217 48,285 24,487 23,799 30 - 39 hours 86,558 40,470 46,087 5,882 2,726 3,156 80,676 37,745 42,932 40 - 49 hours 77,047 43,470 33,577 22,369 13,108 9,260 54,678 30,362 24,317 50 - 59 hours 12,811 7,641 5,170 6,364 3,847 2,517 6,447 3,794 2,654 60 - 69 hours 3,765 2,534 1,231 1,752 1,139 612 2,014 1,395 619 70 - 79 hours 2,340 1,544 796 1,233 797 435 1,107 746 361 80 + hours 1,266 780 486 958 645 313 308 135 173
Table X49: Hours worked last week by 10 hour intervals and willingness to work more hours by area and gender (% of population)
National Urban Rural
Total Male Female Total Male Female Total Male Female
Hours worked (main activity) 100.0% 100.0% 100.0% 100.0% 100.0% 100.0% 100.0% 100.0% 100.0% < 10 hours 2.7% 2.9% 2.4% 2.3% 2.0% 2.8% 2.7% 3.1% 2.3% 10 - 19 hours 9.8% 9.7% 9.9% 4.4% 4.2% 4.7% 10.9% 11.0% 10.8% 20 - 29 hours 19.5% 18.9% 20.1% 9.4% 8.1% 11.1% 21.5% 21.3% 21.8% 30 - 39 hours 32.0% 28.7% 35.7% 12.8% 10.5% 15.8% 36.0% 32.9% 39.3% 40 - 49 hours 28.5% 30.9% 26.0% 48.6% 50.5% 46.3% 24.4% 26.4% 22.3% 50 - 59 hours 4.7% 5.4% 4.0% 13.8% 14.8% 12.6% 2.9% 3.3% 2.4% 60 - 69 hours 1.4% 1.8% 1.0% 3.8% 4.4% 3.1% 0.9% 1.2% 0.6% 70 - 79 hours 0.9% 1.1% 0.6% 2.7% 3.1% 2.2% 0.5% 0.6% 0.3% 80 + hours 0.5% 0.6% 0.4% 2.1% 2.5% 1.6% 0.1% 0.1% 0.2%

110
Table X50: Actively looked for work or another job last week, reason for not looking and available to work or take another job last week by area and sex (#, people)
National Urban Rural
Total Male Female Total Male Female Total Male Female
Actively looked for work or another job last week 437,895 223,158 214,737 86,994 44,280 42,713 350,902 178,878 172,024 Yes 17,544 11,345 6,199 5,858 3,510 2,348 11,686 7,835 3,851 No 420,351 211,813 208,538 81,136 40,770 40,365 339,216 171,043 168,173 Reason for not looking 420,530 211,978 208,550 81,136 40,770 40,367 339,394 171,207 168,187 Student 118,690 64,843 53,846 26,361 14,084 12,277 92,329 50,759 41,570 Not interested in working - content with current situation 148,082 72,811 75,271 14,182 6,464 7,719 133,900 66,347 67,553 Not interested seeking job - content with current job 87,348 48,147 39,201 25,698 15,510 10,188 61,650 32,637 29,013 Not interested in working more hours 10,006 4,997 5,009 1,307 766 541 8,700 4,231 4,469 Believe no paid work available 11,416 6,735 4,681 1,684 831 853 9,732 5,904 3,828 Discouraged 4,138 2,248 1,890 733 398 335 3,405 1,850 1,555 Weather 460 389 71 0 0 0 460 389 71 Disabled 2,202 1,372 830 441 292 149 1,761 1,080 681 Too old 11,428 5,085 6,342 2,061 984 1,077 9,367 4,101 5,266 Homemaker 21,662 3,045 18,618 7,719 1,062 6,657 13,943 1,982 11,961 Other 5,098 2,306 2,791 950 379 571 4,147 1,927 2,220 Available to work or take another job last week 437,619 223,020 214,597 86,702 44,115 42,587 350,916 178,906 172,010 Yes 29,769 17,577 12,191 8,722 4,833 3,889 21,046 12,744 8,302 No 407,850 205,443 202,406 77,980 39,282 38,698 329,870 166,162 163,708

111
Table X51: Actively looked for work or another job last week, reason for not looking and available to work or take another job last week by area and sex (% of population)
National Urban Rural
Total Male Female Total Male Female Total Male Female
Actively looked for work or another job last week 100.0% 100.0% 100.0% 100.0% 100.0% 100.0% 100.0% 100.0% 100.0% Yes 4.0% 5.1% 2.9% 6.7% 7.9% 5.5% 3.3% 4.4% 2.2% No 96.0% 94.9% 97.1% 93.3% 92.1% 94.5% 96.7% 95.6% 97.8% Reason for not looking 100.0% 100.0% 100.0% 100.0% 100.0% 100.0% 100.0% 100.0% 100.0% Student 28.2% 30.6% 25.8% 32.5% 34.5% 30.4% 27.2% 29.6% 24.7% Not interested in working - content with current situation 35.2% 34.3% 36.1% 17.5% 15.9% 19.1% 39.5% 38.8% 40.2% Not interested seeking job - content with current job 20.8% 22.7% 18.8% 31.7% 38.0% 25.2% 18.2% 19.1% 17.3% Not interested in working more hours 2.4% 2.4% 2.4% 1.6% 1.9% 1.3% 2.6% 2.5% 2.7% Believe no paid work available 2.7% 3.2% 2.2% 2.1% 2.0% 2.1% 2.9% 3.4% 2.3% Discouraged 1.0% 1.1% 0.9% 0.9% 1.0% 0.8% 1.0% 1.1% 0.9% Weather 0.1% 0.2% 0.0% 0.0% 0.0% 0.0% 0.1% 0.2% 0.0% Disabled 0.5% 0.6% 0.4% 0.5% 0.7% 0.4% 0.5% 0.6% 0.4% Too old 2.7% 2.4% 3.0% 2.5% 2.4% 2.7% 2.8% 2.4% 3.1% Homemaker 5.2% 1.4% 8.9% 9.5% 2.6% 16.5% 4.1% 1.2% 7.1% Other 1.2% 1.1% 1.3% 1.2% 0.9% 1.4% 1.2% 1.1% 1.3% Available to work or take another job last week 100.0% 100.0% 100.0% 100.0% 100.0% 100.0% 100.0% 100.0% 100.0% Yes 6.8% 7.9% 5.7% 10.1% 11.0% 9.1% 6.0% 7.1% 4.8% No 93.2% 92.1% 94.3% 89.9% 89.0% 90.9% 94.0% 92.9% 95.2%

112
Table X52: Drink alcohol, chew betel-nut, drink kava, smoke by area and gender (% of population)
National
Urban
Rural
Total Male Female Total Male Female Total Male Female
Drink alcohol 100.0% 100.0% 100.0% 100.0% 100.0% 100.0% 100.0% 100.0% 100.0% Yes 7.1% 12.8% 1.1% 10.9% 18.9% 2.5% 6.1% 11.3% 0.8% No 92.9% 87.2% 98.9% 89.1% 81.1% 97.5% 93.9% 88.7% 99.2% Chew betel-nut 100.0% 100.0% 100.0% 100.1% 100.1% 100.2% 100.0% 100.0% 100.0% Yes 45.3% 49.2% 41.4% 42.9% 47.5% 38.2% 45.9% 49.6% 42.1% No 54.7% 50.8% 58.7% 57.2% 52.6% 62.0% 54.1% 50.4% 57.9% Drink kava 100.0% 100.0% 100.0% 99.9% 100.0% 99.9% 100.0% 100.0% 100.0% Yes 0.6% 1.0% 0.1% 0.4% 0.6% 0.1% 0.6% 1.0% 0.1% No 99.4% 99.0% 99.9% 99.6% 99.3% 99.8% 99.4% 98.9% 99.9% Smoke 99.9% 99.9% 100.0% 100.0% 99.9% 100.1% 99.9% 99.9% 100.0% Yes 21.8% 34.1% 9.0% 24.2% 35.5% 12.5% 21.2% 33.7% 8.1% No 78.2% 65.8% 91.0% 75.8% 64.4% 87.6% 78.7% 66.2% 91.8%

113
APPENDIX 2: SELECTED EXPENDITURE TABLES

114
Table X53: Total household expenditure (SBD$ 000)
NATIONAL
Expenditure category and sub-categories This household
Another household Imputed Rent TOTAL
Cash Home produced
Cash and bought goods Gift (home produced)
Food and non-alcoholic beverages 1,425,185 1,399,809
38,198 56,701
-
2,919,894 Alcoholic beverages, tobacco and illicit substances 489,834 63,722
1,664 4,883
-
560,103
Clothing and footwear 133,592 -
1,069 -
-
134,661 Housing and utilities 349,575 216
2,029 -
1,082,671
1,434,491
Furnishings, equipment & maintenance 151,857 119
9,358 106
-
161,440 Health 11,297 -
3,092 -
-
14,390
Transportation 659,441 -
9,638 -
-
669,079 Communication 192,595 -
29 -
-
192,623
Recreation & culture 82,327 -
1,135 -
-
83,463 Education 98,932 -
1,746 -
-
100,678
Restaurants & hotels 42,184 -
722 -
-
42,906 Miscellaneous good & services 49,925 -
3,330 -
-
53,254
Total consumption expenditure COICOP 3,686,744 1,463,867
72,010 61,690
1,082,671
6,366,983 Ceremonies 113,051 -
- -
-
113,051
Cash donations to households 105,033 -
- -
-
105,033 Cash donations to church 83,568 -
- -
-
83,568
Cash donations to village 7,116 -
- -
-
7,116 Taxes and fines 14,085 -
- -
-
14,085
Cash donations to associations 1,091 -
- -
-
1,091 Other charitable 15,142 -
- -
-
15,142
Total non-consumption expenditure 339,086 -
- -
-
339,086 Purchase of land or house 15,388 -
- -
-
15,388
House construction 110,906 -
- -
-
110,906 Major improvements to house 12,395 -
- -
-
12,395
Plant or equipment 46,945 -
- -
-
46,945 Mortgage payment 21,022 -
- -
-
21,022
Total household investment expenditure 206,656 -
- -
-
206,656 TOTAL EXPENDITURE 4,232,486 1,463,867 72,010 61,690 1,082,671 6,912,725 Note: As data is being disaggregated at lower or detail levels, caution should be taken in interpreting some results due to sample size to limitations; minor variations in totals due to rounding

115
Table X54: Total urban household expenditure (SBD$ 000)
URBAN
Expenditure category and sub-categories This household
Another household
Imputed Rent
TOTAL Cash Home produced
Cash and bought goods
Gift -home produced
Food and non-alcoholic beverages 539,355 57,863
8,031 4,458
-
609,707 Alcoholic beverages, tobacco and illicit substances 208,765 2,065
311 130
-
211,271
Clothing and footwear 40,812 -
637 -
-
41,449 Housing and utilities 261,091 -
1,554 -
337,245
599,890
Furnishings, equipment & maintenance 49,213 13
3,779 -
-
53,005 Health 3,831 -
15 -
-
3,846
Transportation 309,880 -
2,759 -
-
312,639 Communication 94,925 -
26 -
-
94,951
Recreation & culture 24,066 -
604 -
-
24,670 Education 40,625 -
794 -
-
41,419
Restaurants & hotels 21,644 -
448 -
-
22,092 Miscellaneous good & services 25,864 -
717 -
-
26,581
Total consumption expenditure COICOP 1,620,071 59,941
19,673 4,588
337,245
2,041,519 Ceremonies 27,707 -
- -
-
27,707
Cash donations to households 40,332 -
- -
-
40,332 Cash donations to church 21,754 -
- -
-
21,754
Cash donations to village 1,161 -
- -
-
1,161 Taxes and fines 5,005 -
- -
-
5,005
Cash donations to associations 526 -
- -
-
526 Other charitable 4,776 -
- -
-
4,776
Total non-consumption expenditure 101,260 -
-
-
101,260 Purchase of land or house 3,870 -
- -
-
3,870
House construction 30,104 -
- -
-
30,104 Major improvements to house 6,276 -
- -
-
6,276
Plant or equipment 21,205 -
- -
-
21,205 Mortgage payment 15,623 -
- -
-
15,623
Total household investment expenditure 77,077 -
- -
-
77,077 TOTAL EXPENDITURE 1,798,408 59,941
19,673 4,588
337,245
2,219,856
Note: As data is being disaggregated at lower or detail levels, caution should be taken in interpreting some results due to sample size to limitations. minor variations in totals due to rounding

116
Table X55: Total rural household expenditure (SBD$ 000)
RURAL
Expenditure category and sub-categories This household
Another household
Imputed Rent TOTAL Cash Home produced
Cash and bought goods Gift -home produced
Consumption expenditure (COICOP)
Food and non-alcoholic beverages 885,831 1,341,947
30,167 52,243
-
2,310,188
Alcoholic beverages, tobacco and illicit substances 281,069 61,658
1,353 4,753
-
348,833 Clothing and footwear 92,779 -
432 -
-
93,211
Housing and utilities 88,484 216
475 -
745,426
834,601 Furnishings, equipment & maintenance 102,644 106
5,579 106
-
108,435
Health 7,467 -
3,077 -
-
10,544 Transportation 349,561 -
6,879 -
-
356,440
Communication 97,670 -
3 -
-
97,673 Recreation & culture 58,261 -
532 -
-
58,793
Education 58,307 -
952 -
-
59,259 Restaurants & hotels 20,541 -
275 -
-
20,816
Miscellaneous good & services 24,061 -
2,613 -
-
26,674 Total consumption expenditure 2,066,674 1,403,926
52,337 57,102
745,426
4,325,465
Non-consumption expenditure*
Ceremonies 85,344 -
- -
-
85,344
Cash donations to households 64,701 -
- -
-
64,701 Cash donations to church 61,814 -
- -
-
61,814
Cash donations to village 5,955 -
- -
-
5,955 Taxes and fines 9,080 -
- -
-
9,080
Cash donations to associations 565 -
- -
-
565 Other charitable 10,366 -
- -
-
10,366
Total non-consumption expenditure 237,825 -
-
-
237,825 Household investment expenditure
Purchase of land or house 11,518 -
- -
-
11,518 House construction 80,802 -
- -
-
80,802
Major improvements to house 6,120 -
- -
-
6,120 Plant or equipment 25,740 -
- -
-
25,740
Mortgage payment 5,399 -
- -
-
5,399 Total household investment expenditure 129,579 -
- -
-
129,579
TOTAL EXPENDITURE 2,434,078 1,403,926
52,337 57,102
745,426
4,692,869 Note: As data is being disaggregated at lower or detail levels, caution should be taken in interpreting some results due to sample size to limitations; variations in totals are due to rounding

117
Table X56: Average national household expenditure (SBD$)
NATIONAL
Expenditure category and sub-categories This household
Another household
Imputed Rent TOTAL Cash Home produced
Cash and bought goods Gift -home produced
Consumption expenditure (COICOP)
Food and non-alcoholic beverages 13,191 12,956
354 525
-
27,026
Alcoholic beverages, tobacco and illicit substances 4,534 590
15 45
-
5184 Clothing and footwear 1,236 -
10 -
-
1,246
Housing and utilities 3,236 2
19 -
10,021
13,277 Furnishings, equipment & maintenance 1,406 1
87 1
-
1,494
Health 105 -
29 -
-
133 Transportation 6,104 -
89 -
-
6,193
Communication 1,783 -
- -
-
1,783 Recreation & culture 762 -
11 -
-
773
Education 916 -
16 -
-
932 Restaurants & hotels 390 -
7 -
-
397
Miscellaneous good & services 462 -
31 -
-
493 Average household consumption expenditure 34,124 13,549
667 571
10021
58,931
Non-consumption expenditure* Ceremonies 1,046 -
- -
-
1,046
Cash donations to households 972 -
- -
-
972 Cash donations to church 773 -
- -
-
773
Cash donations to village 66 -
- -
-
66 Taxes and fines 130 -
- -
-
130
Cash donations to associations 10 -
- -
-
10 Other charitable 140 -
- -
-
140
Average household non-consumption expenditure 3,138 -
- -
-
3,138 Household investment expenditure
Purchase of land or house 142 -
- -
-
142 House construction 1,027 -
- -
-
1,027
Major improvements to house 115 -
- -
-
115 Plant or equipment 435 -
- -
-
435
Mortgage payment 195 -
- -
-
195 Average household investment expenditure 1,913 -
- -
-
1,913
AVERAGE HOUSEHOLD EXPENDITURE 39,175 13,549
667 571
10,021
63,982 Note: As data is being disaggregated at lower or detail levels, caution should be taken in interpreting some results due to sample size to limitations.

118
Table X57: Average urban household expenditure (SBD$)
URBAN
Expenditure category and sub-categories This household
Another household
Imputed Rent TOTAL Cash Home produced
Cash and bought goods Gift -home produced
Consumption expenditure (COICOP)
Food and non-alcoholic beverages 28,365 3,043
422 234
-
32,065
Alcoholic beverages, tobacco and illicit substances 10,979 109
16 7
-
11,111 Clothing and footwear 2,146 -
34 -
-
2,180
Housing and utilities 13,731 -
82 -
17,736
31,548 Furnishings, equipment & maintenance 2,588 1
199 -
-
2,788
Health 201 -
1 -
-
202 Transportation 16,297 -
145 -
-
16,442
Communication 4,992 -
1 -
-
4,993 Recreation & culture 1,266 -
32 -
-
1,297
Education 2,136 -
42 -
-
2,178 Restaurants & hotels 1,138 -
24 -
-
1,162
Miscellaneous good & services 1,360 -
38 -
-
1,398 Average household consumption expenditure 85,200 3,152
1,035 241
17,736
107,364
Non-consumption expenditure* Ceremonies 1,457 -
- -
-
1,457
Cash donations to households 2,121 -
- -
-
2,121 Cash donations to church 1,144 -
- -
-
1,144
Cash donations to village 61 -
- -
-
61 Taxes and fines 263 -
- -
-
263
Cash donations to associations 28 -
- -
-
28 Other charitable 251 -
- -
-
251
Average household non-consumption expenditure 5,325 -
- -
-
5,325 Household investment expenditure
Purchase of land or house 204 -
- -
-
204 House construction 1,583 -
- -
-
1,583
Major improvements to house 330 -
- -
-
330 Plant or equipment 1,115 -
- -
-
1,115
Mortgage payment 822 -
- -
-
822 Average household investment expenditure 4,053 -
- -
-
4,053
AVERAGE HOUSEHOLD EXPENDITURE 94,578 3,152
1,035 241
17,736
116,742 Note: As data is being disaggregated at lower or detail levels, caution should be taken in interpreting some results due to sample size to limitations

119
Table X58: Average rural household expenditure (SBD$)
RURAL
Expenditure category and sub-categories This household
Another household
Imputed Rent TOTAL Cash Home produced
Cash and bought goods Gift -home produced
Consumption expenditure (COICOP)
Food and non-alcoholic beverages 9,950 15,074
339 587
-
25,950
Alcoholic beverages, tobacco and illicit substances 3,157 693
15 53
-
3,918 Clothing and footwear 1,042 -
5 -
-
1,047
Housing and utilities 994 2
5 -
8,373
9,375 Furnishings, equipment & maintenance 1,153 1
63 1
-
1,218
Health 84 -
35 -
-
118 Transportation 3,927 -
77 -
-
4,004
Communication 1,097 -
- -
-
1,097 Recreation & culture 654 -
6 -
-
660
Education 655 -
11 -
-
666 Restaurants & hotels 231 -
3 -
-
234
Miscellaneous good & services 270 -
29 -
-
300 Average household consumption expenditure 23,214 15,770
588 641
8,373
48,587
Non-consumption expenditure* Ceremonies 959 -
- -
-
959
Cash donations to households 727 -
- -
-
727 Cash donations to church 694 -
- -
-
694
Cash donations to village 67 -
- -
-
67 Taxes and fines 102 -
- -
-
102
Cash donations to associations 6 -
- -
-
6 Other charitable 116 -
- -
-
116
Average household non-consumption expenditure 2,671 -
- -
-
2,671 Household investment expenditure
Purchase of land or house 129 -
- -
-
129 House construction 908 -
- -
-
908
Major improvements to house 69 -
- -
-
69 Plant or equipment 289 -
- -
-
289
Mortgage payment 61 -
- -
-
61 Average household investment expenditure 1,456 -
- -
-
1,456
AVERAGE HOUSEHOLD EXPENDITURE 27,341 15,770
588 641
8,373
52,713 Note: As data is being disaggregated at lower or detail levels, caution should be taken in interpreting some results due to sample size to limitations

120
Table X59: Average national per capita expenditure (SBD$)
NATIONAL
Expenditure category and sub-categories This household
Another household
Imputed Rent TOTAL Cash Home produced
Cash and bought goods Gift -home produced
Consumption expenditure (COICOP)
Food and non-alcoholic beverages 2,314 2,273
62 92
-
4,742
Alcoholic beverages, tobacco and illicit substances 795 103
3 8
-
910 Clothing and footwear 217 -
2 -
-
219
Housing and utilities 568 -
3 -
1,758
2,329 Furnishings, equipment & maintenance 247 -
15 -
-
262
Health 18 -
5 -
-
23 Transportation 1,071 -
16 -
-
1,087
Communication 313 -
0 -
-
313 Recreation & culture 134 -
2 -
-
136
Education 161 -
3 -
-
163 Restaurants & hotels 69 -
1 -
-
70
Miscellaneous good & services 81 -
5 -
-
86 Average per capita consumption expenditure 5,987 2,377
117 100
1,758
10,339
Non-consumption expenditure* - -
- -
-
0 Ceremonies 184 -
- -
-
184
Cash donations to households 171 -
- -
-
171 Cash donations to church 136 -
- -
-
136
Cash donations to village 12 -
- -
-
12 Taxes and fines 23 -
- -
-
23
Cash donations to associations 2 -
- -
-
2 Other charitable 25 -
- -
-
25
Average per capita non-consumption expenditure 551 -
- -
-
551 Household investment expenditure
Purchase of land or house 25 -
- -
-
25 House construction 180 -
- -
-
180
Major improvements to house 20 -
- -
-
20 Plant or equipment 76 -
- -
-
76
Mortgage payment 34 -
- -
-
34 Average per capita investment expenditure 336 -
- -
-
336
AVERAGE PER CAPITA EXPENDITURE 6,873 2,377
117 100
1,758
11,226 Note: As data is being disaggregated at lower or detail levels, caution should be taken in interpreting some results due to sample size to limitations.

121
Table X60: Average urban per capita expenditure (SBD$)
URBAN
Expenditure category and sub-categories This household
Another household
Imputed Rent TOTAL Cash Home produced
Cash and bought goods Gift -home produced
Consumption expenditure (COICOP)
Food and non-alcoholic beverages 4,713 506
70 39
-
5,327
Alcoholic beverages, tobacco and illicit substances 1,824 18
3 1
-
1,846 Clothing and footwear 357 -
6 -
-
362
Housing and utilities 2,281 -
14 -
2,947
5,241 Furnishings, equipment & maintenance 430 -
33 -
-
463
Health 33 -
- -
-
34 Transportation 2,708 -
24 -
-
2,732
Communication 829 -
0 -
-
830 Recreation & culture 210 -
5 -
-
216
Education 355 -
7 -
-
362 Restaurants & hotels 189 -
4 -
-
193
Miscellaneous good & services 226 -
6 -
-
232 Average per capita consumption expenditure 14,155 524
172 40
2,947
17,837
Non-consumption expenditure* - -
- -
-
- Ceremonies 242 -
- -
-
242
Cash donations to households 352 -
- -
-
352 Cash donations to church 190 -
- -
-
190
Cash donations to village 10 -
- -
-
10 Taxes and fines 44 -
- -
-
44
Cash donations to associations 5 -
- -
-
5 Other charitable 42 -
- -
-
42
Average per capita non-consumption expenditure 885 -
- -
-
885 Household investment expenditure 0 -
- -
-
-
Purchase of land or house 34 -
- -
-
34 House construction 263 -
- -
-
263
Major improvements to house 55 -
- -
-
55 Plant or equipment 185 -
- -
-
185
Mortgage payment 137 -
- -
-
137 Average per capita investment expenditure 673 -
- -
-
673
AVERAGE PER CAPITA EXPENDITURE 15,713 524
172 40
2,947
19,396 Note: As data is being disaggregated at lower or detail levels, caution should be taken in interpreting some results due to sample size to limitations.

122
Table X61: Average rural per capita expenditure (SBD$)
RURAL
Expenditure category and sub-categories This household
Another household
Imputed Rent TOTAL Cash Home produced
Cash and bought goods Gift -home produced
Consumption expenditure (COICOP)
Food and non-alcoholic beverages 1,767 2,677
60 104
-
4,608
Alcoholic beverages, tobacco and illicit substances 561 123
3 9
-
696 Clothing and footwear 185 -
1 -
-
186
Housing and utilities 176 -
1 -
1,487
1,665 Furnishings, equipment & maintenance 205 -
11 -
-
216
Health 15 -
6 -
-
21 Transportation 697 -
14 -
-
711
Communication 195 -
0 -
-
195 Recreation & culture 116 -
1 -
-
117
Education 116 -
2 -
-
118 Restaurants & hotels 41 -
1 -
-
42
Miscellaneous good & services 48 -
5 -
-
53 Average per capita consumption expenditure 4,122 2,800
104 114
1,487
8,628
Non-consumption expenditure* - -
- -
-
0 Ceremonies 170 -
- -
-
170
Cash donations to households 129 -
- -
-
129 Cash donations to church 123 -
- -
-
123
Cash donations to village 12 -
- -
-
12 Taxes and fines 18 -
- -
-
18
Cash donations to associations 1 -
- -
-
1 Other charitable 21 -
- -
-
21
Average per capita non-consumption expenditure 474 -
- -
-
474 Household investment expenditure 0 -
- -
-
0
Purchase of land or house 23 -
- -
-
23 House construction 161 -
- -
-
161
Major improvements to house 12 -
- -
-
12 Plant or equipment 51 -
- -
-
51
Mortgage payment 11 -
- -
-
11 Average per capita investment expenditure 258 -
- -
-
258
AVERAGE PER CAPITA EXPENDITURE 4,855 2,800
104 114
1,487
9,360 Note: As data is being disaggregated at lower or detail levels, caution should be taken in interpreting some results due to sample size to limitations

123
Table X62: National distribution of household expenditure (%)
NATIONAL
Expenditure category and sub-categories This household
Another household
Imputed Rent TOTAL Cash Home produced
Cash and bought goods Gift -home produced
Consumption expenditure (COICOP)
Food and non-alcoholic beverages 20.6% 20.2%
0.6% 0.8%
0.0%
42.2%
Alcoholic beverages, tobacco and illicit substances 7.1% 0.9%
0.0% 0.1%
0.0%
8.1% Clothing and footwear 1.9% 0.0%
0.0% 0.0%
0.0%
1.9%
Housing and utilities 5.1% 0.0%
0.0% 0.0%
15.7%
20.8% Furnishings, equipment & maintenance 2.2% 0.0%
0.1% 0.0%
0.0%
2.3%
Health 0.2% 0.0%
0.0% 0.0%
0.0%
0.2% Transportation 9.5% 0.0%
0.1% 0.0%
0.0%
9.7%
Communication 2.8% 0.0%
0.0% 0.0%
0.0%
2.8% Recreation & culture 1.2% 0.0%
0.0% 0.0%
0.0%
1.2%
Education 1.4% 0.0%
0.0% 0.0%
0.0%
1.5% Restaurants & hotels 0.6% 0.0%
0.0% 0.0%
0.0%
0.6%
Miscellaneous good & services 0.7% 0.0%
0.0% 0.0%
0.0%
0.8% Total consumption expenditure 53.3% 21.2%
1.0% 0.9%
15.7%
92.1%
Non-consumption expenditure*
Ceremonies 1.6% 0.0%
0.0% 0.0%
0.0%
1.6%
Cash donations to households 1.5% 0.0%
0.0% 0.0%
0.0%
1.5% Cash donations to church 1.2% 0.0%
0.0% 0.0%
0.0%
1.2%
Cash donations to village 0.1% 0.0%
0.0% 0.0%
0.0%
0.1% Taxes and fines 0.2% 0.0%
0.0% 0.0%
0.0%
0.2%
Cash donations to associations 0.0% 0.0%
0.0% 0.0%
0.0%
0.0% Other charitable 0.2% 0.0%
0.0% 0.0%
0.0%
0.2%
Total non-consumption expenditure 4.9% 0.0%
0.0% 0.0%
0.0%
4.9% Household investment expenditure
Purchase of land or house 0.2% 0.0%
0.0% 0.0%
0.0%
0.2% House construction 1.6% 0.0%
0.0% 0.0%
0.0%
1.6%
Major improvements to house 0.2% 0.0%
0.0% 0.0%
0.0%
0.2% Plant or equipment 0.7% 0.0%
0.0% 0.0%
0.0%
0.7%
Mortgage payment 0.3% 0.0%
0.0% 0.0%
0.0%
0.3% Total household investment expenditure 3.0% 0.0%
0.0% 0.0%
0.0%
3.0%
TOTAL EXPENDITURE 61.2% 21.2%
1.0% 0.9%
15.7%
100.0%

124
Table X63: Urban distribution of household expenditure (%)
URBAN
Expenditure category and sub-categories This household
Another household
Imputed Rent TOTAL Cash Home produced
Cash and bought goods Gift -home produced
Consumption expenditure (COICOP)
Food and non-alcoholic beverages 24.3% 2.6%
0.4% 0.2%
0.0%
27.5%
Alcoholic beverages, tobacco and illicit substances 9.4% 0.1%
0.0% 0.0%
0.0%
9.5% Clothing and footwear 1.8% 0.0%
0.0% 0.0%
0.0%
1.9%
Housing and utilities 11.8% 0.0%
0.1% 0.0%
15.2%
27.0% Furnishings, equipment & maintenance 2.2% 0.0%
0.2% 0.0%
0.0%
2.4%
Health 0.2% 0.0%
0.0% 0.0%
0.0%
0.2% Transportation 14.0% 0.0%
0.1% 0.0%
0.0%
14.1%
Communication 4.3% 0.0%
0.0% 0.0%
0.0%
4.3% Recreation & culture 1.1% 0.0%
0.0% 0.0%
0.0%
1.1%
Education 1.8% 0.0%
0.0% 0.0%
0.0%
1.9% Restaurants & hotels 1.0% 0.0%
0.0% 0.0%
0.0%
1.0%
Miscellaneous good & services 1.2% 0.0%
0.0% 0.0%
0.0%
1.2% Total consumption expenditure 73.0% 2.7%
0.9% 0.2%
15.2%
92.0%
Non-consumption expenditure* 0.0% 0.0%
0.0% 0.0%
0.0%
0.0% Ceremonies 1.2% 0.0%
0.0% 0.0%
0.0%
1.2%
Cash donations to households 1.8% 0.0%
0.0% 0.0%
0.0%
1.8% Cash donations to church 1.0% 0.0%
0.0% 0.0%
0.0%
1.0%
Cash donations to village 0.1% 0.0%
0.0% 0.0%
0.0%
0.1% Taxes and fines 0.2% 0.0%
0.0% 0.0%
0.0%
0.2%
Cash donations to associations 0.0% 0.0%
0.0% 0.0%
0.0%
0.0% Other charitable 0.2% 0.0%
0.0% 0.0%
0.0%
0.2%
Total non-consumption expenditure 4.6% 0.0%
0.0% 0.0%
0.0%
4.6% Household investment expenditure
Purchase of land or house 0.2% 0.0%
0.0% 0.0%
0.0%
0.2% House construction 1.4% 0.0%
0.0% 0.0%
0.0%
1.4%
Major improvements to house 0.3% 0.0%
0.0% 0.0%
0.0%
0.3% Plant or equipment 1.0% 0.0%
0.0% 0.0%
0.0%
1.0%
Mortgage payment 0.7% 0.0%
0.0% 0.0%
0.0%
0.7% Total household investment expenditure 3.5% 0.0%
0.0% 0.0%
0.0%
3.5%
TOTAL EXPENDITURE 81.0% 2.7%
0.9% 0.2%
15.2%
100.0%

125
Table X64: Rural distribution of household expenditure (%)
RURAL
Expenditure category and sub-categories This household
Another household
Imputed Rent TOTAL Cash Home produced
Cash and bought goods Gift -home produced
Consumption expenditure (COICOP)
Food and non-alcoholic beverages 18.9% 28.6%
0.6% 1.1%
0.0%
49.2%
Alcoholic beverages, tobacco and illicit substances 6.0% 1.3%
0.0% 0.1%
0.0%
7.4% Clothing and footwear 2.0% 0.0%
0.0% 0.0%
0.0%
2.0%
Housing and utilities 1.9% 0.0%
0.0% 0.0%
15.9%
17.8% Furnishings, equipment & maintenance 2.2% 0.0%
0.1% 0.0%
0.0%
2.3%
Health 0.2% 0.0%
0.1% 0.0%
0.0%
0.2% Transportation 7.4% 0.0%
0.1% 0.0%
0.0%
7.6%
Communication 2.1% 0.0%
0.0% 0.0%
0.0%
2.1% Recreation & culture 1.2% 0.0%
0.0% 0.0%
0.0%
1.3%
Education 1.2% 0.0%
0.0% 0.0%
0.0%
1.3% Restaurants & hotels 0.4% 0.0%
0.0% 0.0%
0.0%
0.4%
Miscellaneous good & services 0.5% 0.0%
0.1% 0.0%
0.0%
0.6% Total consumption expenditure 44.0% 29.9%
1.1% 1.2%
15.9%
92.2%
Non-consumption expenditure*
Ceremonies 1.8% 0.0%
0.0% 0.0%
0.0%
1.8%
Cash donations to households 1.4% 0.0%
0.0% 0.0%
0.0%
1.4% Cash donations to church 1.3% 0.0%
0.0% 0.0%
0.0%
1.3%
Cash donations to village 0.1% 0.0%
0.0% 0.0%
0.0%
0.1% Taxes and fines 0.2% 0.0%
0.0% 0.0%
0.0%
0.2%
Cash donations to associations 0.0% 0.0%
0.0% 0.0%
0.0%
0.0% Other charitable 0.2% 0.0%
0.0% 0.0%
0.0%
0.2%
Total non-consumption expenditure 5.1% 0.0%
0.0% 0.0%
0.0%
5.1% Household investment expenditure
Purchase of land or house 0.2% 0.0%
0.0% 0.0%
0.0%
0.2% House construction 1.7% 0.0%
0.0% 0.0%
0.0%
1.7%
Major improvements to house 0.1% 0.0%
0.0% 0.0%
0.0%
0.1% Plant or equipment 0.5% 0.0%
0.0% 0.0%
0.0%
0.5%
Mortgage payment 0.1% 0.0%
0.0% 0.0%
0.0%
0.1% Total household investment expenditure 2.8% 0.0%
0.0% 0.0%
0.0%
2.8%
TOTAL EXPENDITURE 51.9% 29.9%
1.1% 1.2%
15.9%
100.0%

126
Table X65: National distribution of household expenditure by expenditure category (%)
NATIONAL
Expenditure category and sub-categories This household
Another household
Imputed Rent TOTAL Cash Home produced
Cash and bought goods Gift (home produced)
Consumption expenditure (COICOP)
Food and non-alcoholic beverages 22.4% 22.0%
0.6% 0.9%
0.0%
45.9%
Alcoholic beverages, tobacco and illicit substances 7.7% 1.0%
0.0% 0.1%
0.0%
8.8% Clothing and footwear 2.1% 0.0%
0.0% 0.0%
0.0%
2.1%
Housing and utilities 5.5% 0.0%
0.0% 0.0%
17.0%
22.5% Furnishings, equipment & maintenance 2.4% 0.0%
0.1% 0.0%
0.0%
2.5%
Health 0.2% 0.0%
0.0% 0.0%
0.0%
0.2% Transportation 10.4% 0.0%
0.2% 0.0%
0.0%
10.5%
Communication 3.0% 0.0%
0.0% 0.0%
0.0%
3.0% Recreation & culture 1.3% 0.0%
0.0% 0.0%
0.0%
1.3%
Education 1.6% 0.0%
0.0% 0.0%
0.0%
1.6% Restaurants & hotels 0.7% 0.0%
0.0% 0.0%
0.0%
0.7%
Miscellaneous good & services 0.8% 0.0%
0.1% 0.0%
0.0%
0.8% Total consumption expenditure 57.9% 23.0%
1.1% 1.0%
17.0%
100.0%
Non-consumption expenditure*
Ceremonies 33.3% 0.0%
0.0% 0.0%
0.0%
33.3%
Cash donations to households 31.0% 0.0%
0.0% 0.0%
0.0%
31.0% Cash donations to church 24.6% 0.0%
0.0% 0.0%
0.0%
24.6%
Cash donations to village 2.1% 0.0%
0.0% 0.0%
0.0%
2.1% Taxes and fines 4.2% 0.0%
0.0% 0.0%
0.0%
4.2%
Cash donations to associations 0.3% 0.0%
0.0% 0.0%
0.0%
0.3% Other charitable 4.5% 0.0%
0.0% 0.0%
0.0%
4.5%
Total non-consumption expenditure 100.0% 0.0%
0.0% 0.0%
0.0%
100.0% Household investment expenditure
Purchase of land or house 7.4% 0.0%
0.0% 0.0%
0.0%
7.4% House construction 53.7% 0.0%
0.0% 0.0%
0.0%
53.7%
Major improvements to house 6.0% 0.0%
0.0% 0.0%
0.0%
6.0% Plant or equipment 22.7% 0.0%
0.0% 0.0%
0.0%
22.7%
Mortgage payment 10.2% 0.0%
0.0% 0.0%
0.0%
10.2% Total household investment expenditure 100.0% 0.0%
0.0% 0.0%
0.0%
100.0%
TOTAL EXPENDITURE 61.2% 61.2%
61.2% 61.2%
61.2%
61.2%

127
Table X66: Urban distribution of household expenditure by expenditure category (%)
URBAN
Expenditure category and sub-categories This household
Another household
Imputed Rent TOTAL Cash Home produced
Cash and bought goods Gift (home produced)
Consumption expenditure (COICOP)
Food and non-alcoholic beverages 26.4% 2.8%
0.4% 0.2%
0.0%
29.9%
Alcoholic beverages, tobacco and illicit substances 10.2% 0.1%
0.0% 0.0%
0.0%
10.3% Clothing and footwear 2.0% 0.0%
0.0% 0.0%
0.0%
2.0%
Housing and utilities 12.8% 0.0%
0.1% 0.0%
16.5%
29.4% Furnishings, equipment & maintenance 2.4% 0.0%
0.2% 0.0%
0.0%
2.6%
Health 0.2% 0.0%
0.0% 0.0%
0.0%
0.2% Transportation 15.2% 0.0%
0.1% 0.0%
0.0%
15.3%
Communication 4.6% 0.0%
0.0% 0.0%
0.0%
4.7% Recreation & culture 1.2% 0.0%
0.0% 0.0%
0.0%
1.2%
Education 2.0% 0.0%
0.0% 0.0%
0.0%
2.0% Restaurants & hotels 1.1% 0.0%
0.0% 0.0%
0.0%
1.1%
Miscellaneous good & services 1.3% 0.0%
0.0% 0.0%
0.0%
1.3% Total consumption expenditure 79.4% 2.9%
1.0% 0.2%
16.5%
100.0%
Non-consumption expenditure*
Ceremonies 27.4% 0.0%
0.0% 0.0%
0.0%
27.4%
Cash donations to households 39.8% 0.0%
0.0% 0.0%
0.0%
39.8% Cash donations to church 21.5% 0.0%
0.0% 0.0%
0.0%
21.5%
Cash donations to village 1.1% 0.0%
0.0% 0.0%
0.0%
1.1% Taxes and fines 4.9% 0.0%
0.0% 0.0%
0.0%
4.9%
Cash donations to associations 0.5% 0.0%
0.0% 0.0%
0.0%
0.5% Other charitable 4.7% 0.0%
0.0% 0.0%
0.0%
4.7%
Total non-consumption expenditure 100.0% 0.0%
0.0% 0.0%
0.0%
100.0% Household investment expenditure
Purchase of land or house 5.0% 0.0%
0.0% 0.0%
0.0%
5.0% House construction 39.1% 0.0%
0.0% 0.0%
0.0%
39.1%
Major improvements to house 8.1% 0.0%
0.0% 0.0%
0.0%
8.1% Plant or equipment 27.5% 0.0%
0.0% 0.0%
0.0%
27.5%
Mortgage payment 20.3% 0.0%
0.0% 0.0%
0.0%
20.3% Total household investment expenditure 100.0% 0.0%
0.0% 0.0%
0.0%
100.0%
TOTAL EXPENDITURE 81.0% 2.7%
0.9% 0.2%
15.2%
100.0%

128
Table X67: Rural distribution of household expenditure by expenditure category (%)
RURAL
Expenditure category and sub-categories This household
Another household
Imputed Rent TOTAL Cash Home produced
Cash and bought goods Gift (home produced)
Consumption expenditure (COICOP)
Food and non-alcoholic beverages 20.5% 31.0%
0.7% 1.2%
0.0%
53.4%
Alcoholic beverages, tobacco and illicit substances 6.5% 1.4%
0.0% 0.1%
0.0%
8.1% Clothing and footwear 2.1% 0.0%
0.0% 0.0%
0.0%
2.2%
Housing and utilities 2.0% 0.0%
0.0% 0.0%
17.2%
19.3% Furnishings, equipment & maintenance 2.4% 0.0%
0.1% 0.0%
0.0%
2.5%
Health 0.2% 0.0%
0.1% 0.0%
0.0%
0.2% Transportation 8.1% 0.0%
0.2% 0.0%
0.0%
8.2%
Communication 2.3% 0.0%
0.0% 0.0%
0.0%
2.3% Recreation & culture 1.3% 0.0%
0.0% 0.0%
0.0%
1.4%
Education 1.3% 0.0%
0.0% 0.0%
0.0%
1.4% Restaurants & hotels 0.5% 0.0%
0.0% 0.0%
0.0%
0.5%
Miscellaneous good & services 0.6% 0.0%
0.1% 0.0%
0.0%
0.6% Total consumption expenditure 47.8% 32.5%
1.2% 1.3%
17.2%
100.0%
Non-consumption expenditure*
Ceremonies 35.9% 0.0%
0.0% 0.0%
0.0%
35.9%
Cash donations to households 27.2% 0.0%
0.0% 0.0%
0.0%
27.2% Cash donations to church 26.0% 0.0%
0.0% 0.0%
0.0%
26.0%
Cash donations to village 2.5% 0.0%
0.0% 0.0%
0.0%
2.5% Taxes and fines 3.8% 0.0%
0.0% 0.0%
0.0%
3.8%
Cash donations to associations 0.2% 0.0%
0.0% 0.0%
0.0%
0.2% Other charitable 4.4% 0.0%
0.0% 0.0%
0.0%
4.4%
Total non-consumption expenditure 100.0% 0.0%
0.0% 0.0%
0.0%
100.0% Household investment expenditure
Purchase of land or house 8.9% 0.0%
0.0% 0.0%
0.0%
8.9% House construction 62.4% 0.0%
0.0% 0.0%
0.0%
62.4%
Major improvements to house 4.7% 0.0%
0.0% 0.0%
0.0%
4.7% Plant or equipment 19.9% 0.0%
0.0% 0.0%
0.0%
19.9%
Mortgage payment 4.2% 0.0%
0.0% 0.0%
0.0%
4.2% Total household investment expenditure 100.0% 0.0%
0.0% 0.0%
0.0%
100.0%
TOTAL EXPENDITURE 51.9% 29.9%
1.1% 1.2%
15.9%
100.0%

129
Table X68: National expenditure by expenditure category and COICOP class (SBD$)
NATIONAL
Expenditure category and sub-categories
This household
Another household Imputed Rent
TOTAL
Cash Home
produced
Cash and bought goods
Gift (home produced)
Food and non-alcoholic beverages
Bread and cereals 760,144,302 305,368
25,471,071 77,906
785,998,646
Coffee, tea and cocoa 39,468,106 2,053,122
468,974 22,352
42,012,553 Fish and sea food 222,014,104 280,684,665
2,916,163 15,519,727
521,134,659
Food products nec 18,793,467 87,349
288,927
19,169,742 Fruit 41,551,403 234,767,264
1,269,605 7,385,473
284,973,745
Meat 90,458,222 41,326,412
1,744,066 9,928,152
143,456,852 Milk, cheese and eggs 9,649,747 4,110,363
195,756 50,535
14,006,401
Mineral water, soft drinks, fruit and vegetable juices 17,680,787
207,918
17,888,705 Oils and fats 20,208,229
163,019 20,616
20,391,864
Sugar, jam, honey, chocolate and confectionery 73,070,327 79,337
1,983,674 20,986
75,154,323 Vegetables 132,146,730 836,395,488
3,488,863 23,675,235
995,706,315
Total food and non-alcoholic beverages 1,425,185,423 1,399,809,367
38,198,035 56,700,980
-
2,919,893,806 Alcoholic beverages, tobacco and illicit substances
Beer 165,091,043
-
165,091,043 Narcotics 56,950,212 63,722,287
1,640,507 4,883,174
127,196,180
Spirits 3,109,419
-
3,109,419 Tobacco 263,831,522
23,506
263,855,028
Wine 851,658
-
851,658 Total alcoholic beverages, tobacco and illicit substances 489,833,854 63,722,287
1,664,013 4,883,174
-
560,103,328
Clothing and footwear
Cleaning, repair and hire of clothing 211,402
12,042
223,444
Clothing materials 5,905,664
97,974
6,003,637 Garments 110,302,264
623,577
110,925,842
Other articles of clothing and clothing accessories 1,516,049
19,481
1,535,530 Shoes and other footwear 15,656,222
316,356
15,972,577
Total clothing and footwear 133,591,600 -
1,069,430 -
-
134,661,030 Housing and utilities
Actual rentals paid by tenants 103,833,578
637,964
104,471,542 Electricity 44,304,524
129,689
44,434,213
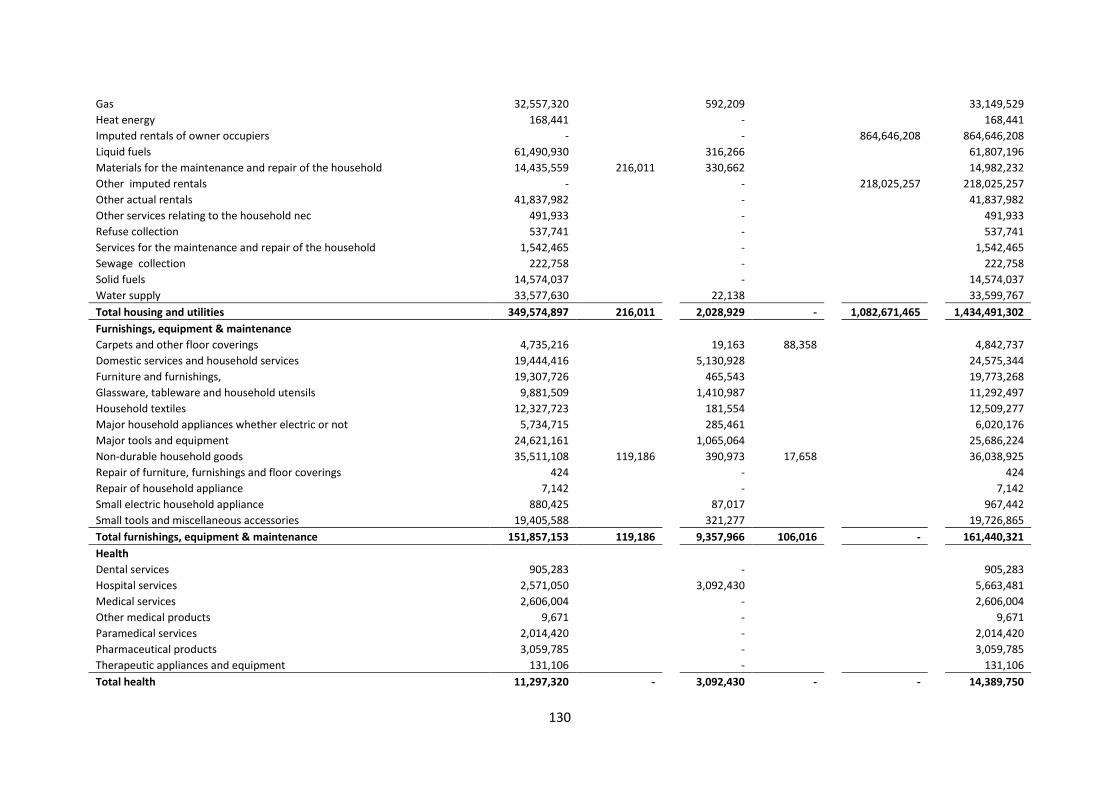
130
Gas 32,557,320
592,209
33,149,529 Heat energy 168,441
-
168,441
Imputed rentals of owner occupiers -
-
864,646,208
864,646,208 Liquid fuels 61,490,930
316,266
61,807,196
Materials for the maintenance and repair of the household 14,435,559 216,011
330,662
14,982,232 Other imputed rentals -
-
218,025,257
218,025,257
Other actual rentals 41,837,982
-
41,837,982 Other services relating to the household nec 491,933
-
491,933
Refuse collection 537,741
-
537,741 Services for the maintenance and repair of the household 1,542,465
-
1,542,465
Sewage collection 222,758
-
222,758 Solid fuels 14,574,037
-
14,574,037
Water supply 33,577,630
22,138
33,599,767 Total housing and utilities 349,574,897 216,011
2,028,929 -
1,082,671,465
1,434,491,302
Furnishings, equipment & maintenance
Carpets and other floor coverings 4,735,216
19,163 88,358
4,842,737
Domestic services and household services 19,444,416
5,130,928
24,575,344 Furniture and furnishings, 19,307,726
465,543
19,773,268
Glassware, tableware and household utensils 9,881,509
1,410,987
11,292,497 Household textiles 12,327,723
181,554
12,509,277
Major household appliances whether electric or not 5,734,715
285,461
6,020,176 Major tools and equipment 24,621,161
1,065,064
25,686,224
Non-durable household goods 35,511,108 119,186
390,973 17,658
36,038,925 Repair of furniture, furnishings and floor coverings 424
-
424
Repair of household appliance 7,142
-
7,142 Small electric household appliance 880,425
87,017
967,442
Small tools and miscellaneous accessories 19,405,588
321,277
19,726,865 Total furnishings, equipment & maintenance 151,857,153 119,186
9,357,966 106,016
-
161,440,321
Health
Dental services 905,283
-
905,283
Hospital services 2,571,050
3,092,430
5,663,481 Medical services 2,606,004
-
2,606,004
Other medical products 9,671
-
9,671 Paramedical services 2,014,420
-
2,014,420
Pharmaceutical products 3,059,785
-
3,059,785 Therapeutic appliances and equipment 131,106
-
131,106
Total health 11,297,320 -
3,092,430 -
-
14,389,750

131
Transportation
Bicycles 1,813,257
-
1,813,257
Combined passenger transport 214,524
1,106
215,630 Fuels and lubricants for personal transport equipment 146,017,244
5,515,827
151,533,071
Maintenance and repair of personal transport equipment 3,752,341
-
3,752,341 Motor cars 58,341,921
-
58,341,921
Motor cycles 291,250
-
291,250 Other purchased transport services 100,344
-
100,344
Other services in respect of personal transport equipment 693,665
2,278
695,943 Passenger transport by air 73,475,929
2,555
73,478,484
Passenger transport by road 189,322,964
3,064,653
192,387,617 Passenger transport by sea and inland waterway 182,603,454
1,051,120
183,654,574
Spare parts and accessories for personal transport equipment 2,814,513
-
2,814,513 Total transportation 659,441,407 -
9,637,539 -
-
669,078,946
Communication
Postal services 640,243
-
640,243
Telephone and telefax equipment 11,197,334
-
11,197,334 Telephone and telefax services 180,757,371
28,509
180,785,880
Total communication 192,594,948 -
28,509 -
-
192,623,457 Recreation & culture
Books 1,996,466
54,639
2,051,105 Cultural services 1,153,555
91,379
1,244,934
Equipment for sport, camping and open air recreation 3,559,386
54,819
3,614,205 Equipment for the reception, recording and reproduction of sound and pictures 12,689,030
95,531
12,784,560
Games of chance 1,373,795
13,016
1,386,810 Games, toys and hobbies 2,161,880
158,616
2,320,496
Gardens, plants and flowers 396,542
341,847
738,389 Information processing equipment 13,630,372
53,147
13,683,519
Maintenance and repair of other major durables for recreation and culture 544,048
-
544,048 Major durables for outdoor recreation 19,161,631
29,585
19,191,216
Miscellaneous printed matter 15,743
-
15,743 Musical instruments and major durables for indoor recreation 332,463
-
332,463
Newspapers and periodicals 241,648
-
241,648 Pets and related products 12,173,363
24,072
12,197,436
Photographic and cinematographic equipment and optical instrument 1,606,583
-
1,606,583 Recording media 903,472
-
903,472
Recreational and sporting services 991,742
115,016
1,106,757
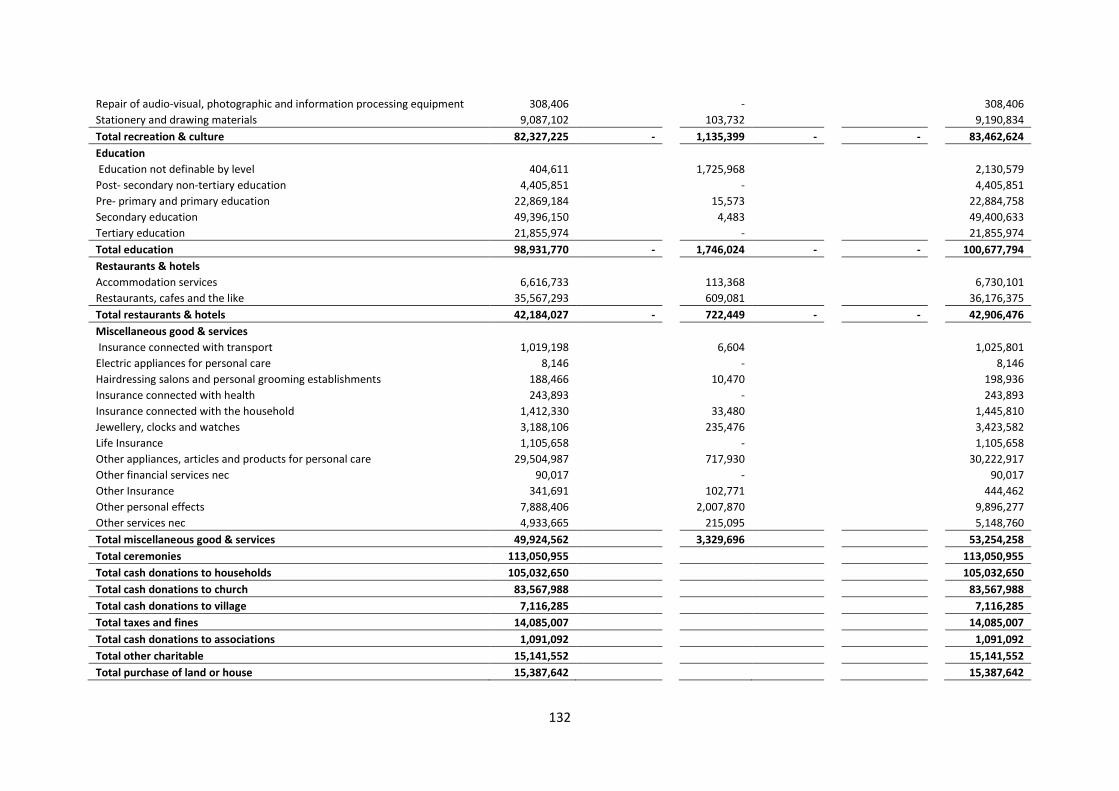
132
Repair of audio-visual, photographic and information processing equipment 308,406
-
308,406 Stationery and drawing materials 9,087,102
103,732
9,190,834
Total recreation & culture 82,327,225 -
1,135,399 -
-
83,462,624 Education
Education not definable by level 404,611
1,725,968
2,130,579 Post- secondary non-tertiary education 4,405,851
-
4,405,851
Pre- primary and primary education 22,869,184
15,573
22,884,758 Secondary education 49,396,150
4,483
49,400,633
Tertiary education 21,855,974
-
21,855,974 Total education 98,931,770 -
1,746,024 -
-
100,677,794
Restaurants & hotels
Accommodation services 6,616,733
113,368
6,730,101
Restaurants, cafes and the like 35,567,293
609,081
36,176,375 Total restaurants & hotels 42,184,027 -
722,449 -
-
42,906,476
Miscellaneous good & services
Insurance connected with transport 1,019,198
6,604
1,025,801
Electric appliances for personal care 8,146
-
8,146 Hairdressing salons and personal grooming establishments 188,466
10,470
198,936
Insurance connected with health 243,893
-
243,893 Insurance connected with the household 1,412,330
33,480
1,445,810
Jewellery, clocks and watches 3,188,106
235,476
3,423,582 Life Insurance 1,105,658
-
1,105,658
Other appliances, articles and products for personal care 29,504,987
717,930
30,222,917 Other financial services nec 90,017
-
90,017
Other Insurance 341,691
102,771
444,462 Other personal effects 7,888,406
2,007,870
9,896,277
Other services nec 4,933,665
215,095
5,148,760 Total miscellaneous good & services 49,924,562
3,329,696
53,254,258
Total ceremonies 113,050,955
113,050,955 Total cash donations to households 105,032,650
105,032,650
Total cash donations to church 83,567,988
83,567,988 Total cash donations to village 7,116,285
7,116,285
Total taxes and fines 14,085,007
14,085,007 Total cash donations to associations 1,091,092
1,091,092
Total other charitable 15,141,552
15,141,552 Total purchase of land or house 15,387,642
15,387,642

133
Total house construction 110,906,291
110,906,291 Total major improvements to house 12,395,447
12,395,447
Plant or equipment
Carpets and other floor coverings 6,088
6,088
Furniture and furnishings, 202,339
202,339 Information processing equipment 769,702
769,702
Major durables for outdoor recreation 1,048,721
1,048,721 Major household appliances whether electric or not 18,510,449
18,510,449
Major tools and equipment 762,403
762,403 Materials for the maintenance and repair of the household 6,164
6,164
Motor cars 17,029,942
17,029,942 Other services in respect of personal transport equipment 449,568
449,568
Other services nec 8,159,403
8,159,403 Total plant or equipment 46,944,779
46,944,779
Total mortgage payment 21,022,184
21,022,184 TOTAL 4,232,486,058 1,463,866,851 72,010,420 61,690,171 1,082,671,465 6,912,724,965 Note: As data is being disaggregated at lower or detail levels, caution should be taken in interpreting some results due to sample size to limitations
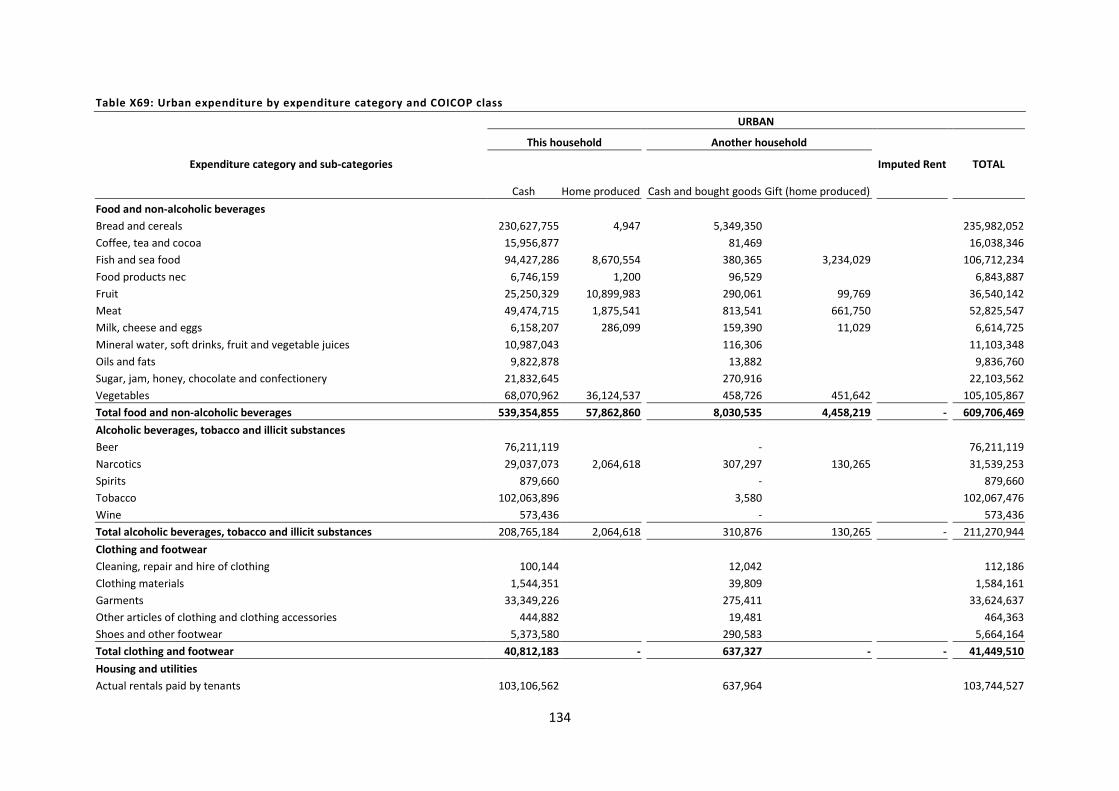
134
Table X69: Urban expenditure by expenditure category and COICOP class
URBAN
Expenditure category and sub-categories
This household
Another household Imputed Rent
TOTAL
Cash Home produced Cash and bought goods Gift (home produced)
Food and non-alcoholic beverages
Bread and cereals 230,627,755 4,947
5,349,350
235,982,052 Coffee, tea and cocoa 15,956,877
81,469
16,038,346
Fish and sea food 94,427,286 8,670,554
380,365 3,234,029
106,712,234 Food products nec 6,746,159 1,200
96,529
6,843,887
Fruit 25,250,329 10,899,983
290,061 99,769
36,540,142 Meat 49,474,715 1,875,541
813,541 661,750
52,825,547
Milk, cheese and eggs 6,158,207 286,099
159,390 11,029
6,614,725 Mineral water, soft drinks, fruit and vegetable juices 10,987,043
116,306
11,103,348
Oils and fats 9,822,878
13,882
9,836,760 Sugar, jam, honey, chocolate and confectionery 21,832,645
270,916
22,103,562
Vegetables 68,070,962 36,124,537
458,726 451,642
105,105,867
Total food and non-alcoholic beverages 539,354,855 57,862,860
8,030,535 4,458,219
-
609,706,469 Alcoholic beverages, tobacco and illicit substances
Beer 76,211,119
-
76,211,119 Narcotics 29,037,073 2,064,618
307,297 130,265
31,539,253
Spirits 879,660
-
879,660 Tobacco 102,063,896
3,580
102,067,476
Wine 573,436
-
573,436
Total alcoholic beverages, tobacco and illicit substances 208,765,184 2,064,618
310,876 130,265
-
211,270,944 Clothing and footwear
Cleaning, repair and hire of clothing 100,144
12,042
112,186 Clothing materials 1,544,351
39,809
1,584,161
Garments 33,349,226
275,411
33,624,637 Other articles of clothing and clothing accessories 444,882
19,481
464,363
Shoes and other footwear 5,373,580
290,583
5,664,164
Total clothing and footwear 40,812,183 -
637,327 -
-
41,449,510 Housing and utilities
Actual rentals paid by tenants 103,106,562
637,964
103,744,527

135
Electricity 43,243,960
127,952
43,371,912 Gas 22,204,330
592,209
22,796,539
Heat energy 159,223
-
159,223 Imputed rentals of owner occupiers -
-
224,801,296
224,801,296 Liquid fuels 8,183,795
-
8,183,795 Materials for the maintenance and repair of the household 9,610,918
174,033
9,784,951
Other imputed rentals -
-
112,444,178
112,444,178 Other actual rentals 25,241,317
-
25,241,317 Other services relating to the household nec 418,679
-
418,679 Refuse collection 537,741
-
537,741 Services for the maintenance and repair of the household 781,881
-
781,881 Sewage collection 222,758
-
222,758 Solid fuels 14,029,897
-
14,029,897 Water supply 33,350,292
22,138
33,372,429
Total housing and utilities 261,091,352 -
1,554,297 -
337,245,475
599,891,124 Furnishings, equipment & maintenance
Carpets and other floor coverings 1,973,855
19,163
1,993,018 Domestic services and household services 8,500,806
1,660,146
10,160,952
Furniture and furnishings, 5,974,216
311,030
6,285,246 Glassware, tableware and household utensils 4,952,492
643,596
5,596,088
Household textiles 4,424,889
82,552
4,507,441 Major household appliances whether electric or not 3,883,138
234,119
4,117,257
Major tools and equipment 2,400,616
484,171
2,884,787 Non-durable household goods 11,311,121 13,235
76,889
11,401,245
Repair of furniture, furnishings and floor coverings 424
-
424 Repair of household appliance 7,142
-
7,142 Small electric household appliance 433,440
87,017
520,457
Small tools and miscellaneous accessories 5,351,319
180,107
5,531,427
Total furnishings, equipment & maintenance 49,213,461 13,235
3,778,789 -
-
53,005,485 Health
Dental services 368,502
-
368,502 Hospital services 89,873
15,045
104,918
Medical services 1,565,059
-
1,565,059 Other medical products 5,562
-
5,562 Paramedical services 655,124
-
655,124

136
Pharmaceutical products 1,061,619
-
1,061,619 Therapeutic appliances and equipment 84,934
-
84,934
Total health 3,830,673 -
15,045 -
-
3,845,718 Transportation
Bicycles 345,457
-
345,457 Combined passenger transport -
1,106
1,106
Fuels and lubricants for personal transport equipment 81,870,014
565,207
82,435,221 Maintenance and repair of personal transport equipment 1,626,544
-
1,626,544 Motor cars 41,681,140
-
41,681,140 Motor cycles 120,064
-
120,064 Other purchased transport services 100,344
-
100,344 Other services in respect of personal transport equipment 253,105
-
253,105 Passenger transport by air 36,437,386
1,863
36,439,249
Passenger transport by road 106,294,332
1,455,933
107,750,265 Passenger transport by sea and inland waterway 39,426,433
734,677
40,161,109
Spare parts and accessories for personal transport equipment 1,725,353
-
1,725,353
Total transportation 309,880,171 -
2,758,786 -
-
312,638,957 Communication
Postal services 147,500
-
147,500 Telephone and telefax equipment 5,669,129
-
5,669,129 Telephone and telefax services 89,108,056
25,684
89,133,740
Total communication 94,924,684 -
25,684 -
-
94,950,369 Recreation & culture
Books 1,093,078
35,383
1,128,461 Cultural services 894,120
3,573
897,693
Equipment for sport, camping and open air recreation 752,028
-
752,028 Equipment for the reception, recording and reproduction of sound and pictures 4,789,088
67,570
4,856,658
Games of chance 144,013
-
144,013 Games, toys and hobbies 1,139,675
36,467
1,176,142
Gardens, plants and flowers 391,555
341,847
733,403 Information processing equipment 5,266,226
29,129
5,295,355
Maintenance and repair of other major durables for recreation and culture 169,983
-
169,983 Major durables for outdoor recreation 1,716,644
-
1,716,644 Miscellaneous printed matter 15,743
-
15,743 Musical instruments and major durables for indoor recreation

137
Newspapers and periodicals 211,811
-
211,811 Pets and related products 1,717,869
24,072
1,741,941
Photographic and cinematographic equipment and optical instrument 824,709
-
824,709 Recording media 769,330
-
769,330 Recreational and sporting services 516,291
8,500
524,791
Repair of audio-visual, photographic and information processing equipment 308,406
-
308,406 Stationery and drawing materials 3,345,739
57,185
3,402,924
Total recreation & culture 24,066,308 -
603,727 -
-
24,670,034 Education
Education not definable by level 359,762
792,598
1,152,360 Post- secondary non-tertiary education 1,045,490
-
1,045,490 Pre- primary and primary education 13,066,318
-
13,066,318 Secondary education 17,220,801
1,070
17,221,871
Tertiary education 8,932,241
-
8,932,241
Total education 40,624,611 -
793,668 -
-
41,418,279 Restaurants & hotels
Accommodation services 2,037,909
67,763
2,105,672 Restaurants, cafes and the like 19,605,594
379,831
19,985,425
Total restaurants & hotels 21,643,503 -
447,595 -
-
22,091,097 Miscellaneous good & services
Insurance connected with transport 772,104
6,604
778,707 Electric appliances for personal care
Hairdressing salons and personal grooming establishments 181,838
10,470
192,308 Insurance connected with health 229,874
-
229,874 Insurance connected with the household 1,313,199
33,480
1,346,679
Jewellery, clocks and watches 881,509
-
881,509 Life Insurance 480,225
-
480,225 Other appliances, articles and products for personal care 14,920,411
114,457
15,034,868
Other financial services nec 90,017
-
90,017 Other Insurance 240,362
102,771
343,133
Other personal effects 3,569,663
324,612
3,894,274 Other services nec 3,184,351
124,626
3,308,978
Total miscellaneous good & services 25,863,552 -
717,021 -
-
26,580,573 Total ceremonies 27,706,691
27,706,691
Total cash donations to households 40,331,574
40,331,574

138
Total cash donations to church 21,753,763
21,753,763
Total cash donations to village 1,161,256
1,161,256
Total taxes and fines 5,005,465
5,005,465
Total cash donations to associations 525,617
525,617
Total other charitable 4,776,049
4,776,049
Total purchase of land or house 3,869,947
3,869,947
Total house construction 30,103,831
30,103,831
Total major improvements to house 6,275,521
6,275,521
Plant or equipment
Carpets and other floor coverings 6,088
6,088 Furniture and furnishings, 167,436
167,436
Information processing equipment 758,932
758,932 Major durables for outdoor recreation 274,330
274,330
Major household appliances whether electric or not 2,947,208
2,947,208 Major tools and equipment 750,235
750,235
Materials for the maintenance and repair of the household Motor cars 12,379,649
12,379,649
Other services in respect of personal transport equipment 449,568
449,568 Other services nec 3,471,254
3,471,254
Total plant or equipment 21,204,702
21,204,702 Total mortgage payment 15,622,967
15,622,967
TOTAL 1,798,407,921 59,940,713 19,673,350 4,588,484 337,245,475 2,219,855,943 Note: As data is being disaggregated at lower or detail levels, caution should be taken in interpreting some results due to sample size to limitations

139
Table X70: Rural expenditure by expenditure category and COICOP class
RURAL
This household
Another household
Imputed Rent
TOTAL
Expenditure category and sub-categories Cash Home
produced
Cash and bought goods
Gift (home produced)
Food and non-alcoholic beverages
Bread and cereals 529,516,546 300,421
20,121,721 77,906
550,016,594
Coffee, tea and cocoa 23,511,230 2,053,122
387,505 22,352
25,974,208 Fish and sea food 127,586,818 272,014,111
2,535,798 12,285,698
414,422,426
Food products nec 12,047,308 86,149
192,398
12,325,855 Fruit 16,301,074 223,867,281
979,544 7,285,705
248,433,603
Meat 40,983,507 39,450,871
930,525 9,266,402
90,631,304 Milk, cheese and eggs 3,491,541 3,824,264
36,365 39,505
7,391,676
Mineral water, soft drinks, fruit and vegetable juices 6,693,744
91,612
6,785,356 Oils and fats 10,385,351
149,137 20,616
10,555,104
Sugar, jam, honey, chocolate and confectionery 51,237,681 79,337
1,712,757 20,986
53,050,762 Vegetables 64,075,768 800,270,951
3,030,137 23,223,592
890,600,448
Total food and non-alcoholic beverages 885,830,568 1,341,946,507
30,167,500 52,242,762
-
2,310,187,337 Alcoholic beverages, tobacco and illicit substances
Beer 88,879,924
-
88,879,924 Narcotics 27,913,139 61,657,669
1,333,210 4,752,909
95,656,927
Spirits 2,229,759
-
2,229,759 Tobacco 161,767,626
19,926
161,787,552
Wine 278,223
-
278,223 Total alcoholic beverages, tobacco and illicit substances 281,068,670 61,657,669
1,353,136 4,752,909
-
348,832,384
Clothing and footwear
Cleaning, repair and hire of clothing 111,258
-
111,258
Clothing materials 4,361,312
58,164
4,419,477 Garments 76,953,039
348,166
77,301,205
Other articles of clothing and clothing accessories 1,071,167
-
1,071,167 Shoes and other footwear 10,282,642
25,772
10,308,414
Total clothing and footwear 92,779,417 -
432,103 -
-
93,211,520 Housing and utilities
Actual rentals paid by tenants 727,015
-
727,015 Electricity 1,060,564
1,737
1,062,301

140
Gas 10,352,990
-
10,352,990 Heat energy 9,217
-
9,217
Imputed rentals of owner occupiers -
-
639,844,912
639,844,912 Liquid fuels 53,307,135
316,266
53,623,401
Materials for the maintenance and repair of the household 4,824,642 216,011
156,629
5,197,281 Other imputed rentals -
-
105,581,079
105,581,079
Other actual rentals 16,596,665
-
16,596,665 Other services relating to the household nec 73,254
-
73,254
Refuse collection Services for the maintenance and repair of the household 760,585
-
760,585
Sewage collection Solid fuels 544,140
-
544,140
Water supply 227,338
-
227,338 Total housing and utilities 88,483,545 216,011
474,632 -
745,425,991
834,600,178
Furnishings, equipment & maintenance
Carpets and other floor coverings 2,761,361
- 88,358
2,849,719
Domestic services and household services 10,943,610
3,470,781
14,414,392 Furniture and furnishings, 13,333,509
154,513
13,488,022
Glassware, tableware and household utensils 4,929,017
767,391
5,696,409 Household textiles 7,902,834
99,002
8,001,836
Major household appliances whether electric or not 1,851,576
51,343
1,902,919 Major tools and equipment 22,220,544
580,893
22,801,437
Non-durable household goods 24,199,987 105,951
314,084 17,658
24,637,679 Repair of furniture, furnishings and floor coverings
Repair of household appliance Small electric household appliance 446,985
-
446,985
Small tools and miscellaneous accessories 14,054,268
141,170
14,195,438 Total furnishings, equipment & maintenance 102,643,691 105,951
5,579,177 106,016
-
108,434,836
Health
Dental services 536,781
-
536,781
Hospital services 2,481,178
3,077,385
5,558,563 Medical services 1,040,944
-
1,040,944
Other medical products 4,110
-
4,110 Paramedical services 1,359,296
-
1,359,296
Pharmaceutical products 1,998,166
-
1,998,166 Therapeutic appliances and equipment 46,172
-
46,172
Total health 7,466,647 -
3,077,385 -
-
10,544,032

141
Transportation
Bicycles 1,467,800
-
1,467,800
Combined passenger transport 214,524
-
214,524 Fuels and lubricants for personal transport equipment 64,147,230
4,950,620
69,097,850
Maintenance and repair of personal transport equipment 2,125,798
-
2,125,798 Motor cars 16,660,781
-
16,660,781
Motor cycles 171,186
-
171,186 Other purchased transport services 440,560
2,278
442,838
Other services in respect of personal transport equipment Passenger transport by air 37,038,542
692
37,039,235 Passenger transport by road 83,028,632
1,608,720
84,637,352
Passenger transport by sea and inland waterway 143,177,021
316,443
143,493,465 Spare parts and accessories for personal transport equipment 1,089,160
-
1,089,160
Total transportation 349,561,235 -
6,878,754 -
-
356,439,989 Communication
Postal services 492,743
-
492,743 Telephone and telefax equipment 5,528,205
-
5,528,205
Telephone and telefax services 91,649,315
2,825
91,652,140 Total communication 97,670,263 -
2,825 -
-
97,673,088
Recreation & culture
Books 903,388
19,256
922,645
Cultural services 259,434
87,806
347,240 Equipment for sport, camping and open air recreation 2,807,358
54,819
2,862,177
Equipment for the reception, recording and reproduction of sound and pictures 7,899,941
27,961
7,927,903 Games of chance 1,229,781
13,016
1,242,797
Games, toys and hobbies 1,022,205
122,149
1,144,353 Gardens, plants and flowers 4,986
-
4,986
Information processing equipment 8,364,146
24,018
8,388,164 Maintenance and repair of other major durables for recreation and culture 374,066
-
374,066
Major durables for outdoor recreation 17,444,987
29,585
17,474,573 Miscellaneous printed matter
Musical instruments and major durables for indoor recreation 332,463
-
332,463 Newspapers and periodicals 29,837
-
29,837
Pets and related products 10,455,494
-
10,455,494 Photographic and cinematographic equipment and optical instrument 781,874
-
781,874
Recording media 134,142
-
134,142 Recreational and sporting services 475,451
106,516
581,967

142
Repair of audio-visual, photographic and information processing equipment Stationery and drawing materials 5,741,363
46,547
5,787,910 Total recreation & culture 58,260,917 -
531,672 -
-
58,792,590
Education
Education not definable by level 44,849
933,369
978,219
Post- secondary non-tertiary education 3,360,362
-
3,360,362 Pre- primary and primary education 9,802,866
15,573
9,818,440
Secondary education 32,175,349
3,413
32,178,762 Tertiary education 12,923,732
-
12,923,732
Total education 58,307,159 -
952,356 -
-
59,259,515 Restaurants & hotels
Accommodation services 4,578,824
45,605
4,624,429 Restaurants, cafes and the like 15,961,700
229,250
16,190,950
Total restaurants & hotels 20,540,524 -
274,855 -
-
20,815,379 Miscellaneous good & services
Insurance connected with transport 247,094
-
247,094 Electric appliances for personal care 8,146
-
8,146
Hairdressing salons and personal grooming establishments 6,628
-
6,628 Insurance connected with health 14,019
-
14,019
Insurance connected with the household 99,131
-
99,131 jewellery, clocks and watches 2,306,597
235,476
2,542,073
Life Insurance 625,433
-
625,433 Other appliances, articles and products for personal care 14,584,576
603,472
15,188,049
Other financial services nec Other Insurance 101,329
-
101,329
Other personal effects 4,318,744
1,683,259
6,002,002 Other services nec 1,749,314
90,469
1,839,783
Total miscellaneous good & services 24,061,010 -
2,612,675 -
-
26,673,686 Total ceremonies 85,344,264
85,344,264
Total cash donations to households 64,701,076
64,701,076 Total cash donations to church 61,814,225
61,814,225
Total cash donations to village 5,955,029
5,955,029 Total taxes and fines 9,079,543
9,079,543
Total cash donations to associations 565,476
565,476 Total other charitable 10,365,503
10,365,503
Total purchase of land or house 11,517,695
11,517,695

143
Total house construction 80,802,459
80,802,459 Total major improvements to house 6,119,926
6,119,926
Plant or equipment
Carpets and other floor coverings
Furniture and furnishings, 34,903
-
34,903 Information processing equipment 10,770
-
10,770
Major durables for outdoor recreation 774,390
-
774,390 Major household appliances whether electric or not 15,563,242
-
15,563,242
Major tools and equipment 12,167
-
12,167 Materials for the maintenance and repair of the household 6,164
-
6,164
Motor cars 4,650,292
-
4,650,292 Other services in respect of personal transport equipment
Other services nec 4,688,148
-
4,688,148 Total plant or equipment 25,740,077 -
- -
-
25,740,077
Total mortgage payment 5,399,217
-
5,399,217 TOTAL 2,434,078,137 1,403,926,138 52,337,070 57,101,687 745,425,991 4,692,869,022 Note: As data is being disaggregated at lower or detail levels, caution should be taken in interpreting some results due to sample size to limitations

144
Table X71: National percentage of households with expenditure by expense category and expense type
This household Another household
Imputed Rent
TOTAL Expenditure category and sub-categories Cash Home
produced Cash and
bought goods Gift (home produced)
Consumption expenditure (COICOP) Food and non-alcoholic beverages 98.9% 91.1% 16.4% 20.1% 0.0% 100.0% Alcoholic beverages, tobacco and illicit substances 70.4% 38.3% 2.7% 4.2% 0.0% 78.0% Clothing and footwear 81.3% 0.0% 0.9% 0.0% 0.0% 81.4% Housing and utilities 33.8% 0.1% 0.3% 0.0% 96.4% 100.0% Furnishings, equipment & maintenance 89.3% 0.2% 9.5% 0.1% 0.0% 89.8% Health 21.2% 0.0% 0.2% 0.0% 0.0% 21.4% Transportation 64.1% 0.0% 4.7% 0.0% 0.0% 64.9% Communication 67.7% 0.0% 0.0% 0.0% 0.0% 67.7% Recreation & culture 60.8% 0.0% 1.4% 0.0% 0.0% 61.2% Education 72.9% 0.0% 1.6% 0.0% 0.0% 74.2% Restaurants & hotels 26.9% 0.0% 0.7% 0.0% 0.0% 27.1% Miscellaneous good & services 70.3% 0.0% 2.4% 0.0% 0.0% 70.8% Total consumption expenditure 99.9% 91.2% 28.9% 21.2% 96.4% 100.0% Non-consumption expenditure*
Ceremonies 60.5% 0.0% 0.0% 0.0% 0.0% 60.5% Cash donations to households 24.2% 0.0% 0.0% 0.0% 0.0% 24.2% Cash donations to church 80.9% 0.0% 0.0% 0.0% 0.0% 80.9% Cash donations to village 29.2% 0.0% 0.0% 0.0% 0.0% 29.2% Taxes and fines 10.4% 0.0% 0.0% 0.0% 0.0% 10.4% Cash donations to associations 2.1% 0.0% 0.0% 0.0% 0.0% 2.1% Other charitable 50.1% 0.0% 0.0% 0.0% 0.0% 50.1% Total non-consumption expenditure 93.4% 0.0% 0.0% 0.0% 0.0% 93.4% Household investment expenditure 0.7% Purchase of land or house 0.7% 0.0% 0.0% 0.0% 0.0% 0.7% House construction 10.1% 0.0% 0.0% 0.0% 0.0% 10.1% Major improvements to house 10.3% 0.0% 0.0% 0.0% 0.0% 10.3% Plant or equipment 14.9% 0.0% 0.0% 0.0% 0.0% 14.9% Mortgage payment 1.1% 0.0% 0.0% 0.0% 0.0% 1.1% Total investment 31.9% 0.0% 0.0% 0.0% 0.0% 31.9%

145
Table X72: Urban percentage of households with expenditure by expense category and expense type
This household Another household
Imputed Rent
TOTAL Expenditure category and sub-categories Cash Home
produced
Cash and
bought goods
Gift (home produced)
Consumption expenditure (COICOP) Food and non-alcoholic beverages 99.9% 54.0% 15.8% 3.7% 0.0% 99.9% Alcoholic beverages, tobacco and illicit substances 84.7% 7.5% 1.8% 0.8% 0.0% 84.9% Clothing and footwear 94.3% 0.0% 2.0% 0.0% 0.0% 94.4% Housing and utilities 87.1% 0.0% 0.8% 0.0% 80.8% 100.0% Furnishings, equipment & maintenance 96.3% 0.1% 11.4% 0.0% 0.0% 96.7% Health 24.4% 0.0% 0.1% 0.0% 0.0% 24.5% Transportation 94.0% 0.0% 11.0% 0.0% 0.0% 94.5% Communication 93.9% 0.0% 0.1% 0.0% 0.0% 93.9% Recreation & culture 73.4% 0.0% 2.8% 0.0% 0.0% 74.0% Education 71.2% 0.0% 2.7% 0.0% 0.0% 73.1% Restaurants & hotels 53.1% 0.0% 1.4% 0.0% 0.0% 53.6% Miscellaneous good & services 91.9% 0.0% 3.8% 0.0% 0.0% 92.2% Total consumption expenditure 100.0% 54.4% 35.5% 4.2% 80.8% 100.0% Non-consumption expenditure*
Ceremonies 60.9% 0.0% 0.0% 0.0% 0.0% 60.9% Cash donations to households 28.1% 0.0% 0.0% 0.0% 0.0% 28.1% Cash donations to church 75.8% 0.0% 0.0% 0.0% 0.0% 75.8% Cash donations to village 19.5% 0.0% 0.0% 0.0% 0.0% 19.5% Taxes and fines 17.8% 0.0% 0.0% 0.0% 0.0% 17.8% Cash donations to associations 2.8% 0.0% 0.0% 0.0% 0.0% 2.8% Other charitable 46.2% 0.0% 0.0% 0.0% 0.0% 46.2% Total non-consumption expenditure 95.0% 0.0% 0.0% 0.0% 0.0% 95.0% Household investment expenditure
Purchase of land or house 1.2% 0.0% 0.0% 0.0% 0.0% 1.2% House construction 9.7% 0.0% 0.0% 0.0% 0.0% 9.7% Major improvements to house 8.0% 0.0% 0.0% 0.0% 0.0% 8.0% Plant or equipment 13.9% 0.0% 0.0% 0.0% 0.0% 13.9% Mortgage payment 3.3% 0.0% 0.0% 0.0% 0.0% 3.3% Total investment 28.5% 0.0% 0.0% 0.0% 0.0% 28.5%

146
Table X73: Rural percentage of households with expenditure by expense category and expense type
This household Another household
Imputed Rent
TOTAL Expenditure category and sub-categories Cash Home
produced Cash and bought
goods Gift (home produced)
Consumption expenditure (COICOP) Food and non-alcoholic beverages 98.7% 99.0% 16.5% 23.5% 0.0% 100.0% Alcoholic beverages, tobacco and illicit substances 67.4% 44.8% 2.9% 4.9% 0.0% 76.6% Clothing and footwear 78.5% 0.0% 0.7% 0.0% 0.0% 78.7% Housing and utilities 22.5% 0.2% 0.2% 0.0% 99.7% 100.0% Furnishings, equipment & maintenance 87.9% 0.3% 9.1% 0.1% 0.0% 88.4% Health 20.5% 0.0% 0.3% 0.0% 0.0% 20.7% Transportation 57.7% 0.0% 3.4% 0.0% 0.0% 58.6% Communication 62.1% 0.0% 0.0% 0.0% 0.0% 62.1% Recreation & culture 58.1% 0.0% 1.1% 0.0% 0.0% 58.5% Education 73.3% 0.0% 1.4% 0.0% 0.0% 74.4% Restaurants & hotels 21.3% 0.0% 0.5% 0.0% 0.0% 21.5% Miscellaneous good & services 65.6% 0.0% 2.1% 0.0% 0.0% 66.2% Total consumption expenditure 99.9% 99.0% 27.4% 24.8% 99.7% 100.0% Non-consumption expenditure*
Ceremonies 60.4% 0.0% 0.0% 0.0% 0.0% 60.4% Cash donations to households 23.3% 0.0% 0.0% 0.0% 0.0% 23.3% Cash donations to church 82.0% 0.0% 0.0% 0.0% 0.0% 82.0% Cash donations to village 31.2% 0.0% 0.0% 0.0% 0.0% 31.2% Taxes and fines 8.9% 0.0% 0.0% 0.0% 0.0% 8.9% Cash donations to associations 2.0% 0.0% 0.0% 0.0% 0.0% 2.0% Other charitable 50.9% 0.0% 0.0% 0.0% 0.0% 50.9% Total non-consumption expenditure 93.0% 0.0% 0.0% 0.0% 0.0% 93.0% Household investment expenditure
Purchase of land or house 0.6% 0.0% 0.0% 0.0% 0.0% 0.6% House construction 10.2% 0.0% 0.0% 0.0% 0.0% 10.2% Major improvements to house 10.8% 0.0% 0.0% 0.0% 0.0% 10.8% Plant or equipment 15.1% 0.0% 0.0% 0.0% 0.0% 15.1% Mortgage payment 0.6% 0.0% 0.0% 0.0% 0.0% 0.6% Total investment 32.6% 0.0% 0.0% 0.0% 0.0% 32.6%

147
Table X74: Expenditure by main type of activity status and gender of household head and area
Urban Rural
Total Urban Rural
Total Main activity status Male Female Male Female Male Female Male Female Producing goods for self-consumption 29,613,248 5,517,899 1,662,694,510 186,725,194 1,884,550,851 0.4% 0.1% 24.1% 2.7% 27.3% Employee (private sector) 787,503,713 74,080,400 581,755,821 3,694,206 1,447,034,140 11.4% 1.1% 8.4% 0.1% 20.9% Producing goods for sale 324,732,209 29,627,459 779,778,107 30,679,755 1,164,817,530 4.7% 0.4% 11.3% 0.4% 16.9% Employee (public sector) 493,960,460 77,367,603 513,054,892 57,915,319 1,142,298,273 7.1% 1.1% 7.4% 0.8% 16.5% Unpaid family worker in a business or plantation 10,916,721 1,024,160 242,376,315 9,146,932 263,464,128 0.2% 0.0% 3.5% 0.1% 3.8% Unpaid family worker (household domestic work) 50,375,184 9,492,242 121,514,096 34,770,103 216,151,625 0.7% 0.1% 1.8% 0.5% 3.1% Employee (Church) 23,664,192 8,104,030 130,909,408 2,097,913 164,775,543 0.3% 0.1% 1.9% 0.0% 2.4% Voluntary / Community work 9,929,973 2,085,263 143,663,304 608,571 156,287,111 0.1% 0.0% 2.1% 0.0% 2.3% Homemaker 58,227,462 23,761,118 32,702,155 32,993,422 147,684,157 0.8% 0.3% 0.5% 0.5% 2.1% Employer 93,231,994
18,064,741
111,296,736 1.3% 0.0% 0.3% 0.0% 1.6%
Employee (NGO) 25,803,647 7,921,453 31,302,590
65,027,690 0.4% 0.1% 0.5% 0.0% 0.9% Did not pursue any activity 16,623,900 2,222,733 37,256,728 1,618,390 57,721,750 0.2% 0.0% 0.5% 0.0% 0.8% Retired / too old 27,557,125 1,967,492 21,410,352 6,121,539 57,056,508 0.4% 0.0% 0.3% 0.1% 0.8% Student (full time) 14,919,216
5,791,929
20,711,144 0.2% 0.0% 0.1% 0.0% 0.3%
Student (part time) 8,461,564 1,163,485 3,246,194 976,537 13,847,779 0.1% 0.0% 0.0% 0.0% 0.2% Grand Total 1,975,520,607 244,335,336 4,325,521,143 367,347,879 6,912,724,965 28.6% 3.5% 62.6% 5.3% 100.0%

148
Table X75: Expenditure by main activity status and gender of household head
Annual expenditure range
Total
0-500k 500k-1,000k 1,000k-1,500k 1,500k-2,000k 2,000k-2,500k 2,500k-3,000k >3,000k Male Producing goods for self-consumption 2.1% 4.6% 3.8% 2.4% 1.8% 2.1% 7.8% 24.5% Employee (private sector) 0.4% 2.2% 2.7% 1.7% 2.2% 1.5% 9.1% 19.8% Producing goods for sale 0.3% 1.6% 2.1% 1.8% 1.8% 1.4% 7.0% 16.0% Employee (public sector) 0.3% 1.4% 2.0% 1.8% 1.4% 1.5% 6.2% 14.6% Unpaid family worker - business or farm 0.1% 0.4% 0.4% 0.5% 0.3% 0.2% 1.9% 3.7% Unpaid family worker - household domestic work 0.1% 0.5% 0.5% 0.4% 0.3% 0.4% 0.3% 2.5% Employee (Church) 0.1% 0.3% 0.3% 0.3% 0.2% 0.4% 0.6% 2.2% Voluntary / community work 0.1% 0.4% 0.2% 0.1% 0.1% 0.2% 1.1% 2.2% Employer 0.0% 0.2% 0.1% 0.1% 0.1% 0.1% 1.0% 1.6% Homemaker 0.0% 0.1% 0.2% 0.1% 0.1% 0.2% 0.6% 1.3% Employee (NGO) 0.0% 0.1% 0.2% 0.0% 0.1% 0.1% 0.4% 0.8% Did not pursue any activity 0.0% 0.1% 0.1% 0.1% 0.0% 0.0% 0.3% 0.8% Retired / too old 0.1% 0.1% 0.1% 0.1% 0.0% 0.2% 0.1% 0.7% Student (full time) 0.0% 0.1% 0.1% 0.0% 0.0% 0.1% 0.0% 0.3% Student (part time) 0.0% 0.0% 0.1% 0.0% 0.0% 0.0% 0.0% 0.2% Total Sum of Male 3.8% 11.9% 12.8% 9.5% 8.5% 8.3% 36.4% 91.2% Female Producing goods for self-consumption 0.4% 0.5% 0.3% 0.2% 0.1% 0.3% 1.0% 2.8% Employee (public sector) 0.0% 0.3% 0.4% 0.2% 0.3% 0.3% 0.5% 2.0% Employee (private sector) 0.0% 0.3% 0.2% 0.1% 0.1% 0.0% 0.3% 1.1% Producing goods for sale 0.0% 0.1% 0.2% 0.1% 0.0% 0.1% 0.4% 0.9% Homemaker 0.0% 0.2% 0.2% 0.1% 0.0% 0.2% 0.1% 0.8% Unpaid family worker - household domestic work 0.1% 0.1% 0.1% 0.1% 0.1% 0.1% 0.1% 0.6% Employee (Church) 0.0% 0.0% 0.0% 0.0% 0.0% 0.0% 0.1% 0.1% Unpaid family worker - business or farm 0.0% 0.0% 0.0% 0.0% 0.0% 0.0% 0.0% 0.1% Retired / too old 0.0% 0.0% 0.0% 0.0% 0.0% 0.0% 0.0% 0.1% Employee (NGO) 0.0% 0.0% 0.0% 0.0% 0.0% 0.0% 0.0% 0.1% Did not pursue any activity 0.0% 0.0% 0.0% 0.0% 0.0% 0.0% 0.0% 0.1% Voluntary / community work 0.0% 0.0% 0.0% 0.0% 0.0% 0.0% 0.0% 0.0% Student (part time) 0.0% 0.0% 0.0% 0.0% 0.0% 0.0% 0.0% 0.0% Total Sum of Female 0.6% 1.5% 1.4% 0.9% 0.8% 1.0% 2.5% 8.8%
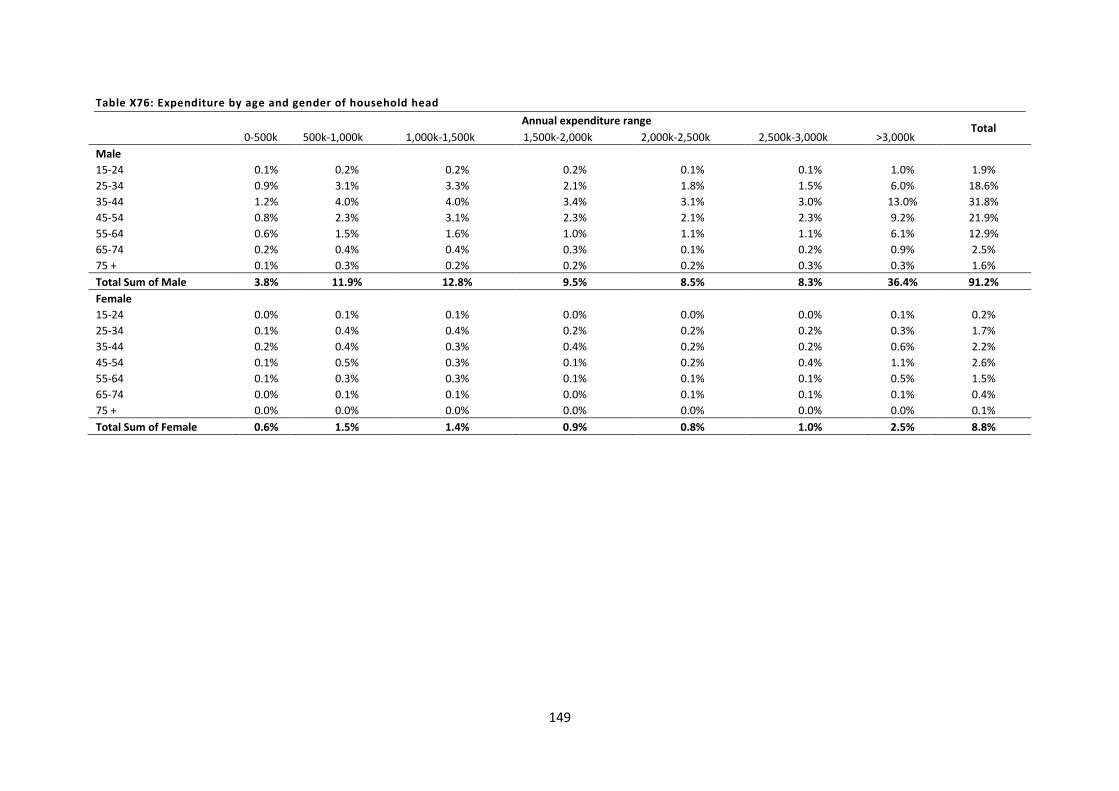
149
Table X76: Expenditure by age and gender of household head
Annual expenditure range Total
0-500k 500k-1,000k 1,000k-1,500k 1,500k-2,000k 2,000k-2,500k 2,500k-3,000k >3,000k
Male 15-24 0.1% 0.2% 0.2% 0.2% 0.1% 0.1% 1.0% 1.9% 25-34 0.9% 3.1% 3.3% 2.1% 1.8% 1.5% 6.0% 18.6% 35-44 1.2% 4.0% 4.0% 3.4% 3.1% 3.0% 13.0% 31.8% 45-54 0.8% 2.3% 3.1% 2.3% 2.1% 2.3% 9.2% 21.9% 55-64 0.6% 1.5% 1.6% 1.0% 1.1% 1.1% 6.1% 12.9% 65-74 0.2% 0.4% 0.4% 0.3% 0.1% 0.2% 0.9% 2.5% 75 + 0.1% 0.3% 0.2% 0.2% 0.2% 0.3% 0.3% 1.6% Total Sum of Male 3.8% 11.9% 12.8% 9.5% 8.5% 8.3% 36.4% 91.2% Female
15-24 0.0% 0.1% 0.1% 0.0% 0.0% 0.0% 0.1% 0.2% 25-34 0.1% 0.4% 0.4% 0.2% 0.2% 0.2% 0.3% 1.7% 35-44 0.2% 0.4% 0.3% 0.4% 0.2% 0.2% 0.6% 2.2% 45-54 0.1% 0.5% 0.3% 0.1% 0.2% 0.4% 1.1% 2.6% 55-64 0.1% 0.3% 0.3% 0.1% 0.1% 0.1% 0.5% 1.5% 65-74 0.0% 0.1% 0.1% 0.0% 0.1% 0.1% 0.1% 0.4% 75 + 0.0% 0.0% 0.0% 0.0% 0.0% 0.0% 0.0% 0.1% Total Sum of Female 0.6% 1.5% 1.4% 0.9% 0.8% 1.0% 2.5% 8.8%

150
Table X77: Expenditure by category, area and gender of household head (#, %)
Total Rural Urban
Male Female Total Male Female Total Male Female Total
Food and non-alcoholic beverages 2,673,452,508 246,441,298 2,919,893,806 2,133,085,951 177,101,386 2,310,187,337 540,366,556 69,339,913 609,706,469 Alcoholic beverages, tobacco, narcotics 518,604,096 41,499,233 560,103,328 331,949,551 16,882,833 348,832,384 186,654,544 24,616,400 211,270,944 Clothing and footwear 122,851,552 11,809,478 134,661,030 86,538,592 6,672,928 93,211,520 36,312,961 5,136,550 41,449,510 Housing and utilities 1,286,148,229 148,343,073 1,434,491,302 751,917,554 82,682,624 834,600,178 534,230,674 65,660,449 599,891,124 Furnishings, equipment & maintenance 147,481,743 13,958,578 161,440,321 99,622,883 8,811,953 108,434,836 47,858,860 5,146,625 53,005,485 Health 12,198,624 2,191,126 14,389,750 8,554,372 1,989,660 10,544,032 3,644,252 201,466 3,845,718 Transportation 603,191,961 65,886,985 669,078,946 322,405,322 34,034,667 356,439,989 280,786,638 31,852,319 312,638,957 Communication 175,036,073 17,587,383 192,623,457 90,494,197 7,178,891 97,673,088 84,541,876 10,408,492 94,950,369 Recreation & culture 79,082,427 4,380,197 83,462,624 56,832,376 1,960,214 58,792,590 22,250,051 2,419,983 24,670,034 Education 90,125,389 10,552,405 100,677,794 55,018,562 4,240,953 59,259,515 35,106,828 6,311,452 41,418,279 Restaurants & hotels 40,133,460 2,773,016 42,906,476 19,746,299 1,069,080 20,815,379 20,387,161 1,703,936 22,091,097 Miscellaneous good & services 48,543,107 4,711,151 53,254,258 24,589,902 2,083,784 26,673,686 23,953,205 2,627,367 26,580,573 Non consumption expenditure 504,192,581 41,549,292 545,741,873 344,765,582 22,638,907 367,404,489 159,426,998 18,910,385 178,337,384 Grand Total 6,301,041,750 611,683,215 6,912,724,965 4,325,521,143 367,347,879 4,692,869,022 1,975,520,607 244,335,336 2,219,855,943
Total Rural Urban
Male Female Total Male Female Total Male Female Total
Food and non-alcoholic beverages 42.4% 40.3% 42.2% 49.3% 48.2% 49.2% 27.4% 28.4% 27.5% Alcoholic beverages, tobacco and illicit substances 8.2% 6.8% 8.1% 7.7% 4.6% 7.4% 9.4% 10.1% 9.5% Clothing and footwear 1.9% 1.9% 1.9% 2.0% 1.8% 2.0% 1.8% 2.1% 1.9% Housing and utilities 20.4% 24.3% 20.8% 17.4% 22.5% 17.8% 27.0% 26.9% 27.0% Furnishings, equipment & maintenance 2.3% 2.3% 2.3% 2.3% 2.4% 2.3% 2.4% 2.1% 2.4% Health 0.2% 0.4% 0.2% 0.2% 0.5% 0.2% 0.2% 0.1% 0.2% Transportation 9.6% 10.8% 9.7% 7.5% 9.3% 7.6% 14.2% 13.0% 14.1% Communication 2.8% 2.9% 2.8% 2.1% 2.0% 2.1% 4.3% 4.3% 4.3% Recreation & culture 1.3% 0.7% 1.2% 1.3% 0.5% 1.3% 1.1% 1.0% 1.1% Education 1.4% 1.7% 1.5% 1.3% 1.2% 1.3% 1.8% 2.6% 1.9% Restaurants & hotels 0.6% 0.5% 0.6% 0.5% 0.3% 0.4% 1.0% 0.7% 1.0% Miscellaneous good & services 0.8% 0.8% 0.8% 0.6% 0.6% 0.6% 1.2% 1.1% 1.2% Non consumption expenditure 8.0% 6.8% 7.9% 8.0% 6.2% 7.8% 8.1% 7.7% 8.0% Grand Total 100.0% 100.0% 100.0% 100.0% 100.0% 100.0% 100.0% 100.0% 100.0%

151
Table X78: Provincial expenditure by category (SBD '000)
Central Choiseul Guadalcanal Honiara Isabel Makira Malaita Rennell-Bel Temotu Western Total Consumption expenditure Food and non-alcoholic beverages 144,107 110,636 558,248 373,954 141,394 159,613 826,734 21,588 126,691 456,930 2,919,894 Alcoholic beverages, tobacco, narcotics 27,027 24,754 126,397 145,767 23,580 34,521 67,447 2,148 35,534 72,929 560,103 Clothing and footwear 7,232 7,208 34,650 27,935 5,600 9,076 19,905 320 5,926 16,809 134,661 Housing and utilities 41,717 66,429 226,634 399,402 51,720 58,949 310,148 6,549 32,054 240,890 1,434,491 Furnishings, equipment & maintenance 4,766 11,959 32,334 34,010 7,452 12,073 23,314 931 10,317 24,284 161,440 Health 144 510 3,500 3,061 278 256 4,706 76 211 1,647 14,390 Transportation 18,410 27,910 134,710 229,392 23,295 63,365 64,572 8,919 22,690 75,815 669,079 Communication 5,879 5,694 47,549 66,495 4,231 8,667 22,565 600 5,174 25,770 192,623 Recreation & culture 2,642 3,602 21,711 14,827 3,086 4,511 10,474 223 3,715 18,673 83,463 Education 3,664 4,507 20,653 28,904 3,953 6,341 16,734 323 2,451 13,148 100,678 Restaurants & hotels 815 1,586 13,572 15,504 385 3,949 2,858 106 1,016 3,115 42,906 Miscellaneous good & services 1,383 1,882 9,452 19,487 1,472 2,678 7,902 212 1,853 6,933 53,254 Total consumption expenditure 257,784 266,676 1,229,410 1,358,737 266,447 363,998 1,377,360 41,995 247,634 956,942 6,366,983 Non-consumption expenditure Ceremonies 3,453 2,632 26,528 17,427 2,120 4,904 43,860 39 4,739 7,347 113,051 Cash donations to households 3,940 5,772 15,339 30,614 2,894 6,182 18,518 336 4,948 16,490 105,033 Cash donations to church 3,104 5,773 20,608 11,608 4,142 4,931 11,988 395 2,391 18,629 83,568 Cash donations to village 265 338 2,203 558 490 756 968 11 394 1,133 7,116 Taxes and fines 236 301 1,980 1,875 195 1,135 820 176 288 7,080 14,085 Cash donations to associations 23 83 237 128 - 113 109 1 59 338 1,091 Other charitable 673 388 4,084 2,769 763 1,798 1,678 6 1,288 1,692 15,142 Total non-consumption expenditure 11,694 15,287 70,981 64,980 10,604 19,818 77,942 964 14,108 52,708 339,086 Investment expenditure Purchase of land or house 525 1,250 9,804 2,651 - 279 - - 7 872 15,388 House construction 541 5,891 31,957 22,048 6,262 5,934 24,807 310 1,672 11,484 110,906 Major improvements to house 469 550 357 4,506 496 927 4,091 203 189 608 12,395 Plant or equipment 1,301 2,280 11,649 15,334 3,289 3,284 4,459 47 1,579 3,723 46,945 Mortgage payment 119 113 403 13,854 97 326 4,352 12 153 1,592 21,022 Total investment expenditure 2,955 10,084 54,170 58,393 10,144 10,751 37,709 572 3,600 18,280 206,656 Total expenditure 272,433 292,047 1,354,561 1,482,110 287,194 394,567 1,493,011 43,530 265,342 1,027,929 6,912,725 Note: As data is being disaggregated at lower or detail levels, caution should be taken in interpreting some results due to sample size to limitations

152
Table X79: Provincial expenditure by category (% of total provincial expenditure)
Central Choiseul Guadalcanal Honiara Isabel Makira Malaita Rennell Bellona Temotu Western Total
Consumption expenditure Food and non-alcoholic beverages 52.9% 37.9% 41.2% 25.2% 49.2% 40.5% 55.4% 49.6% 47.7% 44.5% 42.2% Alcoholic beverages, tobacco, illicit substances 9.9% 8.5% 9.3% 9.8% 8.2% 8.7% 4.5% 4.9% 13.4% 7.1% 8.1% Clothing and footwear 2.7% 2.5% 2.6% 1.9% 1.9% 2.3% 1.3% 0.7% 2.2% 1.6% 1.9% Housing and utilities 15.3% 22.7% 16.7% 26.9% 18.0% 14.9% 20.8% 15.0% 12.1% 23.4% 20.8% Furnishings, equipment & maintenance 1.7% 4.1% 2.4% 2.3% 2.6% 3.1% 1.6% 2.1% 3.9% 2.4% 2.3% Health 0.1% 0.2% 0.3% 0.2% 0.1% 0.1% 0.3% 0.2% 0.1% 0.2% 0.2% Transportation 6.8% 9.6% 9.9% 15.5% 8.1% 16.1% 4.3% 20.5% 8.6% 7.4% 9.7% Communication 2.2% 1.9% 3.5% 4.5% 1.5% 2.2% 1.5% 1.4% 2.0% 2.5% 2.8% Recreation & culture 1.0% 1.2% 1.6% 1.0% 1.1% 1.1% 0.7% 0.5% 1.4% 1.8% 1.2% Education 1.3% 1.5% 1.5% 2.0% 1.4% 1.6% 1.1% 0.7% 0.9% 1.3% 1.5% Restaurants & hotels 0.3% 0.5% 1.0% 1.0% 0.1% 1.0% 0.2% 0.2% 0.4% 0.3% 0.6% Miscellaneous good & services 0.5% 0.6% 0.7% 1.3% 0.5% 0.7% 0.5% 0.5% 0.7% 0.7% 0.8% Total consumption expenditure 94.6% 91.3% 90.8% 91.7% 92.8% 92.3% 92.3% 96.5% 93.3% 93.1% 92.1% Non-consumption expenditure Ceremonies 1.3% 0.9% 2.0% 1.2% 0.7% 1.2% 2.9% 0.1% 1.8% 0.7% 1.6% Cash donations to households 1.4% 2.0% 1.1% 2.1% 1.0% 1.6% 1.2% 0.8% 1.9% 1.6% 1.5% Cash donations to church 1.1% 2.0% 1.5% 0.8% 1.4% 1.2% 0.8% 0.9% 0.9% 1.8% 1.2% Cash donations to village 0.1% 0.1% 0.2% 0.0% 0.2% 0.2% 0.1% 0.0% 0.1% 0.1% 0.1% Taxes and fines 0.1% 0.1% 0.1% 0.1% 0.1% 0.3% 0.1% 0.4% 0.1% 0.7% 0.2% Cash donations to associations 0.0% 0.0% 0.0% 0.0% 0.0% 0.0% 0.0% 0.0% 0.0% 0.0% 0.0% Other charitable 0.2% 0.1% 0.3% 0.2% 0.3% 0.5% 0.1% 0.0% 0.5% 0.2% 0.2% Total non-consumption expenditure 4.3% 5.2% 5.2% 4.4% 3.7% 5.0% 5.2% 2.2% 5.3% 5.1% 4.9% Investment expenditure Purchase of land or house 0.2% 0.4% 0.7% 0.2% 0.0% 0.1% 0.0% 0.0% 0.0% 0.1% 0.2% House construction 0.2% 2.0% 2.4% 1.5% 2.2% 1.5% 1.7% 0.7% 0.6% 1.1% 1.6% Major improvements to house 0.2% 0.2% 0.0% 0.3% 0.2% 0.2% 0.3% 0.5% 0.1% 0.1% 0.2% Plant or equipment 0.5% 0.8% 0.9% 1.0% 1.1% 0.8% 0.3% 0.1% 0.6% 0.4% 0.7% Mortgage payment 0.0% 0.0% 0.0% 0.9% 0.0% 0.1% 0.3% 0.0% 0.1% 0.2% 0.3% Total investment expenditure 1.1% 3.5% 4.0% 3.9% 3.5% 2.7% 2.5% 1.3% 1.4% 1.8% 3.0% Total expenditure 100.0% 100.0% 100.0% 100.0% 100.0% 100.0% 100.0% 100.0% 100.0% 100.0% 100.0%

153
Table X80: Provincial expenditure by category (% of total expenditure)
Central Choiseul Guadalcanal Honiara Isabel Makira Malaita Rennell Bellona Temotu Western Total
Consumption expenditure Food and non-alcoholic beverages 2.1% 1.6% 8.1% 5.4% 2.0% 2.3% 12.0% 0.3% 1.8% 6.6% 42.2% Alcoholic beverages, tobacco, illicit substances 0.4% 0.4% 1.8% 2.1% 0.3% 0.5% 1.0% 0.0% 0.5% 1.1% 8.1% Clothing and footwear 0.1% 0.1% 0.5% 0.4% 0.1% 0.1% 0.3% 0.0% 0.1% 0.2% 1.9% Housing and utilities 0.6% 1.0% 3.3% 5.8% 0.7% 0.9% 4.5% 0.1% 0.5% 3.5% 20.8% Furnishings, equipment & maintenance 0.1% 0.2% 0.5% 0.5% 0.1% 0.2% 0.3% 0.0% 0.1% 0.4% 2.3% Health 0.0% 0.0% 0.1% 0.0% 0.0% 0.0% 0.1% 0.0% 0.0% 0.0% 0.2% Transportation 0.3% 0.4% 1.9% 3.3% 0.3% 0.9% 0.9% 0.1% 0.3% 1.1% 9.7% Communication 0.1% 0.1% 0.7% 1.0% 0.1% 0.1% 0.3% 0.0% 0.1% 0.4% 2.8% Recreation & culture 0.0% 0.1% 0.3% 0.2% 0.0% 0.1% 0.2% 0.0% 0.1% 0.3% 1.2% Education 0.1% 0.1% 0.3% 0.4% 0.1% 0.1% 0.2% 0.0% 0.0% 0.2% 1.5% Restaurants & hotels 0.0% 0.0% 0.2% 0.2% 0.0% 0.1% 0.0% 0.0% 0.0% 0.0% 0.6% Miscellaneous good & services 0.0% 0.0% 0.1% 0.3% 0.0% 0.0% 0.1% 0.0% 0.0% 0.1% 0.8% Total consumption expenditure 3.7% 3.9% 17.8% 19.7% 3.9% 5.3% 19.9% 0.6% 3.6% 13.8% 92.1% Non-consumption expenditure Ceremonies 0.0% 0.0% 0.4% 0.3% 0.0% 0.1% 0.6% 0.0% 0.1% 0.1% 1.6% Cash donations to households 0.1% 0.1% 0.2% 0.4% 0.0% 0.1% 0.3% 0.0% 0.1% 0.2% 1.5% Cash donations to church 0.0% 0.1% 0.3% 0.2% 0.1% 0.1% 0.2% 0.0% 0.0% 0.3% 1.2% Cash donations to village 0.0% 0.0% 0.0% 0.0% 0.0% 0.0% 0.0% 0.0% 0.0% 0.0% 0.1% Taxes and fines 0.0% 0.0% 0.0% 0.0% 0.0% 0.0% 0.0% 0.0% 0.0% 0.1% 0.2% Cash donations to associations 0.0% 0.0% 0.0% 0.0% 0.0% 0.0% 0.0% 0.0% 0.0% 0.0% 0.0% Other charitable 0.0% 0.0% 0.1% 0.0% 0.0% 0.0% 0.0% 0.0% 0.0% 0.0% 0.2% Total non-consumption expenditure 0.2% 0.2% 1.0% 0.9% 0.2% 0.3% 1.1% 0.0% 0.2% 0.8% 4.9% Investment expenditure Purchase of land or house 0.0% 0.0% 0.1% 0.0% 0.0% 0.0% 0.0% 0.0% 0.0% 0.0% 0.2% House construction 0.0% 0.1% 0.5% 0.3% 0.1% 0.1% 0.4% 0.0% 0.0% 0.2% 1.6% Major improvements to house 0.0% 0.0% 0.0% 0.1% 0.0% 0.0% 0.1% 0.0% 0.0% 0.0% 0.2% Plant or equipment 0.0% 0.0% 0.2% 0.2% 0.0% 0.0% 0.1% 0.0% 0.0% 0.1% 0.7% Mortgage payment 0.0% 0.0% 0.0% 0.2% 0.0% 0.0% 0.1% 0.0% 0.0% 0.0% 0.3% Total investment expenditure 0.0% 0.1% 0.8% 0.8% 0.1% 0.2% 0.5% 0.0% 0.1% 0.3% 3.0% Total expenditure 3.9% 4.2% 19.6% 21.4% 4.2% 5.7% 21.6% 0.6% 3.8% 14.9% 100.0%

154
APPENDIX 3: SELECTED INCOME TABLES

155
Table X81: Average annual national income by income sub categories (SBD)
National Net cash
Home production consumed
In kind receipts Imputed
rents
Income in kind
Total Purchase Home
produced (wage jobs)
Wages & salaries 14,228 - - - - 1,818 16,045 Business income 14,504 - - - - - 14,504 Subsistence – agriculture 4,250 - - - - - 4,250 Subsistence – handicraft 1,277 - - - - - 1,277 Subsistence – livestock 1,631 - - - - - 1,631 Subsistence – fisheries 1,341 - - - - - 1,341 Home production consumed - 12,855 - - - - 12,855 EMPLOYMENT INCOME 37,231 12,855 - - - 1,818 51,904
Rental 887 - - - - - 887 Royalties 947 - - - - - 947 Other property income 791 - - - - - 791 PROPERTY INCOME 2,625 - - - - - 2,625
Remittances from Solomon 466 - - - - - 466 Remittances from overseas 126 - - - - - 126 Pension 275 - - - - - 275 Other transfers 18 - - - - - 18 REGULAR TRANSFERS 885 - - - - - 885
Casual cash-income 728 - - - - - 728 Bought goods given away - - 667 - - - 667 Home produced items given away - - 571 571
CASUAL INCOME 728 - 667 571 - - 1,966
TOTAL HHOLD INCOME excluded imputed rents 41,469 12,855 667 571 - 1,818 57,379
IMPUTED RENTS - - - 10,021 - 10,021
TOTAL HHOLD INCOME
41,469 12,855 667 571 10,021 1,818 67,400 (incl. Imputed rents) Note: slight discrepancies in average due to rounding and from using of total amounts expressed in (‘000); also note that as data is being disaggregated at lower or detail levels, caution should be taken in interpreting some results due to sample size to limitations

156
Table X82: Average annual urban income by income sub categories (SBD)
Urban Net cash
Home production consumed
In kind receipts Imputed
rents
Income in kind
Total Purchased Home
produced (wage jobs)
Wages & salaries 46,792 - - - - 6,498 53,290 Business income 39,129 - - - - - 39,129 Subsistence – agriculture 2,535 - - - - - 2,535 Subsistence – handicraft 483 - - - - - 483 Subsistence – livestock 630 - - - - - 630 Subsistence – fisheries 2,810 - - - - - 2,810 Home production consumed - 2,512 - - - - 2,512
EMPLOYMENT INCOME 92,379 2,512 - - - 6,498 101,389
Rental 4,036 - - - - - 4,036 Royalties 716 - - - - - 716 Other property income 4,195 - - - - - 4,195 PROPERTY INCOME 8,948 - - - - - 8,948
Remittances from Solomon 489 - - - - - 489
Remittances from overseas 291 - - - - - 291
Pension 1,134 - - - - - 1,134 Other transfers 19 - - - - - 19 REGULAR TRANSFERS 1,932 - - - - - 1,932
Casual cash-income 1,247 - - - - - 1,247 Bought goods given away - - 1,035 - - - 1,035
Home produced items given away - - 241 241
CASUAL INCOME 1,247 - 1,035 241 - - 2,523
TOTAL HHOLD INCOME excluded imputed rents 104,506 2,512 1,035 241 - 6,498 114,793
IMPUTED RENTS - - - 17,736 - 17,736
TOTAL HHOLD INCOME
104,506 2,512 1,035 241 17,736 6,498 132,528 (incl. Imputed rents) Note: As data is being disaggregated at lower or detail levels, caution should be taken in interpreting some results due to sample size to limitations

157
Table X83: Average annual rural income by income sub categories (SBD)
Rural Net cash
Home production consumed
In kind receipts Imputed
rents
Income in kind
Total Purchase Home
produced (wage jobs)
Wages & salaries 7,272 - - - - 818 8,090
Business income 9,245 - - - - - 9,245
Subsistence – agriculture 4,617 - - - - - 4,617
Subsistence – handicraft 1,446 - - - - - 1,446
Subsistence – livestock 1,845 - - - - - 1,845
Subsistence – fisheries 1,027 - - - - - 1,027
Home production consumed - 15,064 - - - - 15,064
EMPLOYMENT INCOME 25,452 15,064 - - - 818 41,334
Rental 215 - - - - - 215
Royalties 996 - - - - - 996
Other property income 64 - - - - - 64
PROPERTY INCOME 1,274 - - - - - 1,274
Remittances from Solomon 461 - - - - - 461
Remittances from overseas 90 - - - - - 90
Pension 92 - - - - - 92
Other transfers 18 - - - - - 18
REGULAR TRANSFERS 661 - - - - - 661
Casual cash-income 617 - - - - - 617
Bought goods given away - - 588 - - - 588 Home produced items given away - - - 641 - - 641
CASUAL INCOME 617 - 588 641 - 1,846
TOTAL HHOLD INCOME excluded imputed rents 28,005 15,064 588 641 - 818 45,116
IMPUTED RENTS - - - - 8,373 - 8,373
TOTAL HHOLD INCOME 28,005 15,064 588 641 8,373 818 53,489
(incl. Imputed rents) Note: As data is being disaggregated at lower or detail levels, caution should be taken in interpreting some results due to sample size to limitations

158
Table X84: Percentage of households with income by income sub category and income type - urban
Urban Net cash
Home production consumed
In kind receipts Imputed
rents
Income in kind
Total Purchase Home
produced (wage jobs)
Wages & salaries 86.1% - - - - 29.3% 86.1% Business income 28.9% - - - - - 28.9% Subsistence – agriculture 13.6% - - - - - 13.6%
Subsistence – handicraft 4.3% - - - - - 4.3%
Subsistence – livestock 5.9% - - - - - 5.9% Subsistence – fisheries 14.8% - - - - - 14.8% Home production consumed - 54.4% - - - - 54.4%
EMPLOYMENT INCOME 97.9% 54.4% 0.0% 0.0% 0.0% 29.3% 99.4%
Rental 8.2% - - - - - 8.2% Royalties 3.7% - - - - - 3.7% Other property income 0.9% - - - - - 0.9% PROPERTY INCOME 12.3% 0.0% 0.0% 0.0% 0.0% 0.0% 12.3%
Remittances from Solomon 8.9% - - - - - 8.9%
Remittances from overseas 3.3% - - - - - 3.3%
Pension 1.7% - - - - - 1.7% Other transfers 0.1% - - - - - 0.1% REGULAR TRANSFERS 11.2% 0.0% 35.5% 4.2% 0.0% 0.0% 43.4%
Casual cash-income 11.2% - - - - - 11.2% Bought goods given away - - 35.5% - - - 35.5%
Home produced items given away - - 4.2% 4.2%
CASUAL INCOME 11.2% 0.0% 35.5% 4.2% 0.0% 0.0% 43.4% IMPUTED RENTS - - - 80.8% - 80.8% TOTAL HHOLD INCOME 98.7% 54.4% 35.5% 4.2% 80.8% 29.3% 100.0% (incl. Imputed rents)
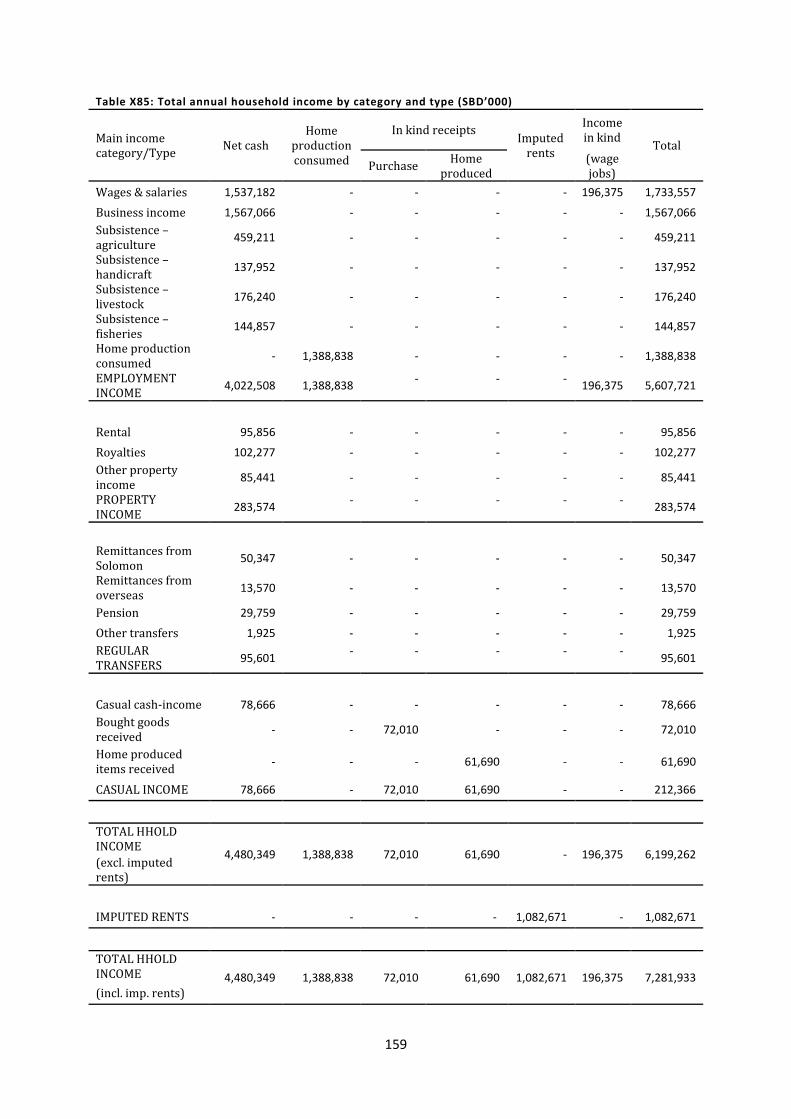
159
Table X85: Total annual household income by category and type (SBD’000)
Main income category/Type Net cash
Home production consumed
In kind receipts Imputed rents
Income in kind Total
Purchase Home produced
(wage jobs)
Wages & salaries 1,537,182 - - - - 196,375 1,733,557
Business income 1,567,066 - - - - - 1,567,066 Subsistence – agriculture 459,211 - - - - - 459,211
Subsistence – handicraft 137,952 - - - - - 137,952
Subsistence – livestock 176,240 - - - - - 176,240
Subsistence – fisheries 144,857 - - - - - 144,857
Home production consumed - 1,388,838 - - - - 1,388,838
EMPLOYMENT INCOME 4,022,508 1,388,838 - - - 196,375 5,607,721
Rental 95,856 - - - - - 95,856
Royalties 102,277 - - - - - 102,277 Other property income 85,441 - - - - - 85,441
PROPERTY INCOME 283,574 - - - - - 283,574
Remittances from Solomon 50,347 - - - - - 50,347
Remittances from overseas 13,570 - - - - - 13,570
Pension 29,759 - - - - - 29,759
Other transfers 1,925 - - - - - 1,925 REGULAR TRANSFERS 95,601 - - - - - 95,601
Casual cash-income 78,666 - - - - - 78,666 Bought goods received - - 72,010 - - - 72,010
Home produced items received - - - 61,690 - - 61,690
CASUAL INCOME 78,666 - 72,010 61,690 - - 212,366
TOTAL HHOLD INCOME
4,480,349 1,388,838 72,010 61,690 - 196,375 6,199,262 (excl. imputed rents)
IMPUTED RENTS - - - - 1,082,671 - 1,082,671
TOTAL HHOLD INCOME 4,480,349 1,388,838 72,010 61,690 1,082,671 196,375 7,281,933 (incl. imp. rents)

160
Table X86: Distribution of household Income within category by type (%)
Net cash Home
production consumed
In kind receipts Imputed rents
Income in kind Total
Purchase Home produced
(wage jobs)
Wages & salaries 27.40% - - - - 3.50% 30.90% Business income 27.90% - - - - - 27.90% Subsistence – agriculture 8.20% - - - - - 8.20%
Subsistence – handicraft 2.50% - - - - - 2.50%
Subsistence – livestock 3.10% - - - - - 3.10%
Subsistence – fisheries 2.60% - - - - - 2.60%
Home production consumed - 24.80% - - - - 24.80%
EMPLOYMENT INCOME 71.70% 24.80% - - - 3.50% 100.00%
Rental 33.80% - - - - - 33.80% Royalties 36.10% - - - - - 36.10% Other property income 30.10% - - - - - 30.10%
PROPERTY INCOME 100.00% - - - - - 100.00%
Remittances from Solomon 52.70% - - - - - 52.70%
Remittances from overseas 14.20% - - - - - 14.20%
Pension 31.10% - - - - - 31.10% Other transfers 2.00% - - - - - 2.00% REGULAR TRANSFERS 100.00% - - - - - 100.00%
Casual cash 37.00% - - - - - 37.00% Bought goods received - - 33.90% - - - 33.90%
Home produced items received away
- - - 29.00% - - 29.00%
CASUAL INCOME 37.00% - 33.90% 29.00% - - 100.00%
TOTAL HHOLD INCOME
72.30% 22.40% 1.20% 1.00% 0.00% 3.20% 100.00% excluded imputed rents
IMPUTED RENTS - - - 100.00% - 100.00%

161
Table X87: Percentage of households with income by income sub category and income type - rural
Rural Net cash
Home production consumed
In kind receipts Imputed
rents
Income in kind
Total Purchase Home
produced (wage jobs)
Wages & salaries 33.0% - - - - 5.8% 33.4%
Business income 16.2% - - - - - 16.2%
Subsistence – agriculture 68.7% - - - - - 68.7%
Subsistence – handicraft 35.3% - - - - - 35.3%
Subsistence – livestock 30.3% - - - - - 30.3%
Subsistence – fisheries 24.8% - - - - - 24.8%
Home production consumed - 99.0% - - - - 99.0%
EMPLOYMENT INCOME 94.9% 99.0% 0.0% 0.0% 0.0% 5.8% 100.0%
Rental 1.0% - - - - - 1.0%
Royalties 11.2% - - - - - 11.2%
Other property income 1.8% - - - - - 1.8%
PROPERTY INCOME 13.4% 0.0% 0.0% 0.0% 0.0% 0.0% 13.4%
Remittances from Solomon 26.7% - - - - - 26.7%
Remittances from overseas 1.4% - - - - - 1.4%
Pension 0.5% - - - - - 0.5%
Other transfers 0.4% - - - - - 0.4%
REGULAR TRANSFERS 28.4% 0.0% 0.0% 0.0% 0.0% 0.0% 28.4%
Casual cash-income 22.6% - - - - - 22.6%
Bought goods given away - - 27.4% - - - 27.4% Home produced items given away - - 24.8% 24.8%
CASUAL INCOME 22.6% 0.0% 27.4% 24.8% 0.0% 0.0% 55.1%
IMPUTED RENTS - - - 99.7% - 99.7%
TOTAL HHOLD INCOME 97.1% 99.0% 27.4% 24.8% 99.7% 5.8% 100.0%
(incl. Imputed rents)

162
APPENDIX 4: FURTHER REFERENCES AND INFORMATION
The soft copies of the national and provincial analytical reports, including copies of the questionnaire and methodology reports can be downloaded from:
http://www.spc.int/prism/solomons/
http://www.mof.gov.sb
Other national and regional development indicators can be found at:
http://www.spc.int/nmdi/
Further information of the regional standardized HIES can be found at:
http://www.spc.int/sdd/index.php/en/hies
For further information, please contact the Solomon Islands National Statistics Office:
Email: [email protected] Tel: +677 27835 or +677 23951 Post: National Statistics Office
Ministry of Finance & Treasury P.O. Box G6 Honiara Solomon Islands
Contact Staff: Mr. Douglas Kimi
Government Statistician Email: [email protected]
Mr. Michael Dimola Chief Statistician – Surveys and Operations Email: [email protected]
Mr. Joachim Gaiafuna Chief Statistician- Economics Email: [email protected] Ms. Irene Kalauma Chief Statistician - Social and Demographic Email: [email protected]