solution to chapter 8 case study exercise (biotekno)
TRANSCRIPT

IE5203 (2021) soln-8-1
IE5203 Decision Analysis Solutions to Chapter 8 Case Study Exercise (Biotekno)
Decision Basis Development Decision Variables: 1. Partnership?
a) No partner b) Joint venture Partnership c) Royalty partnership
2. Build new plant?
a) Build new plant b) Don't build new plant
Business Strategies: I. No partner, build new plant II. No partner, don’t build new plant III. Joint venture partner, build new plant IV. Royalty partnership, don’t build new plant Uncertain Variables • nB: number of units sold, if marketed by Biotekno (million) • nN: number of units sold, if marketed by National Diagnostics (million) • g: annual growth rate, %. • c: cost of production (million $) • p: plant cost (million $) Decision Diagram and Tree Influence Diagram
Business Strategy
# sold if marketed by ND nN
# sold if marketed by Bio nB
Plant cost p
Sales growth rate g
Unit cost c
Sales
Profit

IE5203 (2021) soln-8-2
The Generic Decision Tree
Value (Business) Model Alternative I: No partner, Build new plant:
pgncpgnnc
B
BB
−+−=−++−=
)2()20()]1()[20(1π
Alternative II: No partner, No new plant:
)]4,)1min(()4,)[min(20(2 BB ngnc ++−=π Alternative III: Joint venture partner, Build new plant:
)2()20(5.0)]1()[20(5.03
gncgnnc
N
NN
+−=++−=π
Alternative IV: Royalty partner, No new plant:
)2()20(02.0)]1()[20(02.04
gngnn
N
NN
+=++=π
nB g c p π1
nB g c π2
nN g c π3
nN g π4
No new partner, Build new plant
No new partner, No new plant
Joint venture partner, Build new plant
Royalty partner, No new plant

IE5203 (2021) soln-8-3
Deterministic Structuring Deterministic Base Case Analysis • The base values for all the variable are: • The 2-year profit for the four alternatives are:
Alternative 2-year profit ($million) I No partner, new plant 57.600 II No partner, no plant 72.600 III Joint venture partner, new plant 48.400 IV Royalty partner, no plant 3.520
One-Way Range Sensitivity Analysis • The low, base, and high values based on 5, 50, and 95 percentiles are:
Variables Symbol Low Base High Plant construction cost (million $) p 10 15 20 Sales growth rate (%) g -10 20 50 Sales, 1st year, Biotekno (million $) nB 1 3 5 Sales, 1st year, National Diagnostics (million $) nN 1 4 7 Unit production cost ($) c 7 9 11
Variables Symbol Base Value Plant construction cost (million $) p 15 Sales growth rate (%) g 20 Sales, 1st year, Biotekno (million $) nB 3 Sales, 1st year, National Diagnostics (million $) nN 4 Unit production cost ($) c 9
IE5203 (2021) soln-8-4
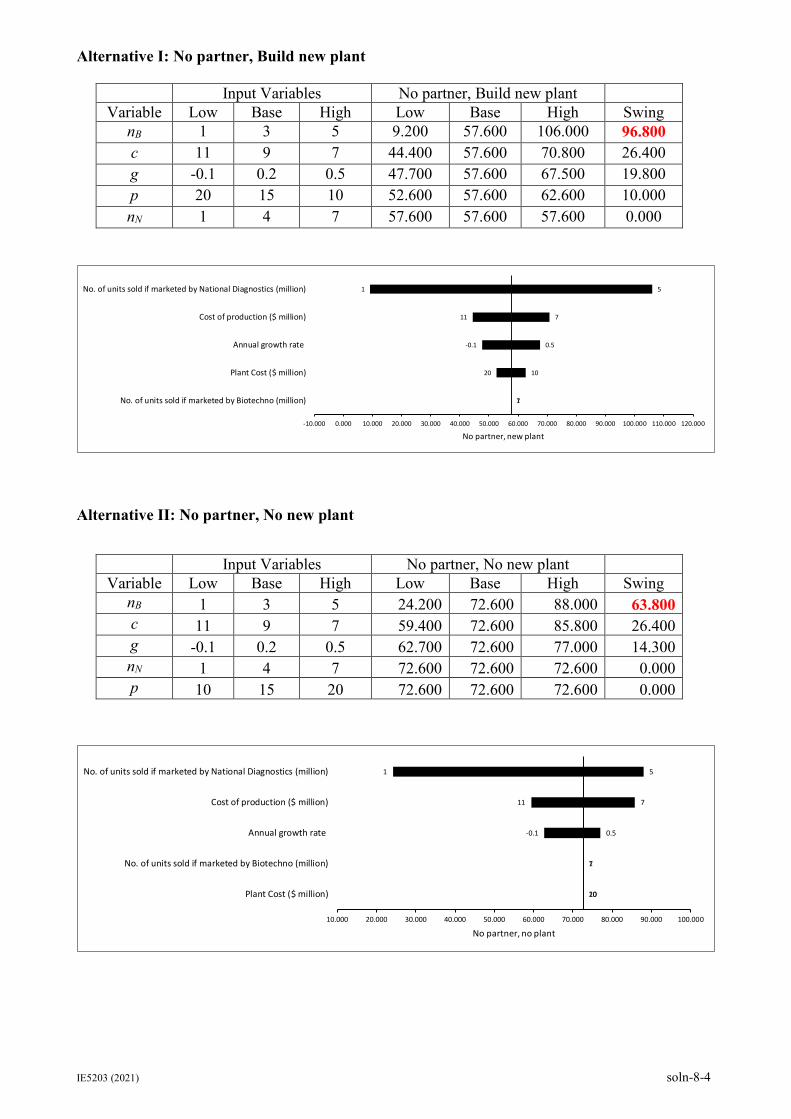
Alternative I: No partner, Build new plant
Input Variables No partner, Build new plant Variable Low Base High Low Base High Swing
nB 1 3 5 9.200 57.600 106.000 96.800 c 11 9 7 44.400 57.600 70.800 26.400 g -0.1 0.2 0.5 47.700 57.600 67.500 19.800 p 20 15 10 52.600 57.600 62.600 10.000 nN 1 4 7 57.600 57.600 57.600 0.000
Alternative II: No partner, No new plant
Input Variables No partner, No new plant Variable Low Base High Low Base High Swing
nB 1 3 5 24.200 72.600 88.000 63.800 c 11 9 7 59.400 72.600 85.800 26.400 g -0.1 0.2 0.5 62.700 72.600 77.000 14.300 nN 1 4 7 72.600 72.600 72.600 0.000 p 10 15 20 72.600 72.600 72.600 0.000
1
11
-0.1
20
1
5
7
0.5
10
7
-10.000 0.000 10.000 20.000 30.000 40.000 50.000 60.000 70.000 80.000 90.000 100.000 110.000 120.000
No. of units sold if marketed by National Diagnostics (million)
Cost of production ($ million)
Annual growth rate
Plant Cost ($ million)
No. of units sold if marketed by Biotechno (million)
No partner, new plant
1
11
-0.1
1
10
5
7
0.5
7
20
10.000 20.000 30.000 40.000 50.000 60.000 70.000 80.000 90.000 100.000
No. of units sold if marketed by National Diagnostics (million)
Cost of production ($ million)
Annual growth rate
No. of units sold if marketed by Biotechno (million)
Plant Cost ($ million)
No partner, no plant

IE5203 (2021) soln-8-5
Alternative III: Joint venture partner, Build new plant
Input Variables Joint venture partner, New plant Variable Low Base High Low Base High Swing
nN 1 4 7 12.100 48.400 84.700 72.600 c 11 9 7 39.600 48.400 57.200 17.600 g -0.1 0.2 0.5 41.800 48.400 55.000 13.200 nB 1 3 5 48.400 48.400 48.400 0.000 p 10 15 20 48.400 48.400 48.400 0.000
Alternative IV: Royalty partner, No new plant
Input Variables Joint venture partner, New plant Variable Low Base High Low Base High Swing
nN 1 4 7 0.880 3.520 6.160 5.280 g -0.1 0.2 0.5 3.040 3.520 4.000 0.960 nB 1 3 5 3.520 3.520 3.520 0.000 c 7 9 11 3.520 3.520 3.520 0.000 p 10 15 20 3.520 3.520 3.520 0.000
1
11
-0.1
1
10
7
7
0.5
5
20
0.000 10.000 20.000 30.000 40.000 50.000 60.000 70.000 80.000 90.000 100.000
No. of units sold if marketed by Biotechno (million)
Cost of production ($ million)
Annual growth rate
No. of units sold if marketed by National Diagnostics (million)
Plant Cost ($ million)
Joint venture parnter, new plant
1
-0.1
1
7
10
7
0.5
5
11
20
-1.000 0.000 1.000 2.000 3.000 4.000 5.000 6.000 7.000 8.000
No. of units sold if marketed by Biotechno (million)
Annual growth rate
No. of units sold if marketed by National Diagnostics (million)
Cost of production ($ million)
Plant Cost ($ million)
Royalty partner, no plant

IE5203 (2021) soln-8-6
Combined Tornado Diagrams
Results of Deterministic Sensitivity • The sales variables are much more sensitive than the other variables. • Sensitive variables: nN and nB. Tornado Dominance • The best outcomes for alternative IV are always worse than the worst outcomes for alternatives
I, II and III. • Hence alternative IV can be dropped from further consideration.
0 10 20 30 40 50 60 70 80 90 100 110 120
No. of units sold if marketed by National Diagnostics (million)
Annual growth rate
Cost of production ($ million)
Plant Cost ($ million)
No. of units sold if marketed by Biotechno (million)
No. of units sold if marketed by National Diagnostics (million)
Cost of production ($ million)
Annual growth rate
No. of units sold if marketed by Biotechno (million)
Plant Cost ($ million)
No. of units sold if marketed by Biotechno (million)
Annual growth rate
Cost of production ($ million)
No. of units sold if marketed by National Diagnostics (million)
Plant Cost ($ million)
No. of units sold if marketed by Biotechno (million)
Annual growth rate
No. of units sold if marketed by National Diagnostics (million)
Cost of production ($ million)
Plant Cost ($ million)
57.6
72.6
48.4
3.52 1st year by Biotekno
Production Cost
Sales Growth Rate
1st year by Nat Diag
Plant Construction Cost
-9 -6 -3 0 3 6 9 12 15 18 21 24 27 30 33 36 39 42 45 48 51 54 57 60 63 66 69 72 75 78 81 84 87 90 93 96 99 102 105 108 111 114
Investment Strategy: No partner New plant Investment Strategy: No partner No new plant Investment Strategy: New partner New plant Investment Strategy: Royalty partner
Initial Decision Alternatives Tornado

IE5203 (2021) soln-8-7
Probabilistic Evaluation The Reduced Decision Model
The Reduced Value Model
152.2415)2.02()920(1
−=−+−=
B
B
nnπ
))4,2.1min()4,(min(11))3,2.1min()3,)(min(920(2
BB
BB
nnnn
+=+−=π
N
N
nn
1.12)2.02()920(5.03
=+−=π
Business Strategy
nN
Sales Profit
NB
nB π1
nB π2
nN π3
No new partner, Build new plant
No new partner, No new plant
Joint venture partner, Build new plant

IE5203 (2021) soln-8-8
Assessing Probability Distributions for nB and nN Using the 5, 50, and 95 percentiles: • nB may be represented by a Normal distribution with
Mean = 3 Standard deviation = 1.216
• nN may be represented by a Normal distribution with
Mean = 4 Standard deviation = 1.824
Using moments matching method, the 3-branch discrete approximations for the two variables are:
nB nN Value Probability Value Probability 0.8938 1/6 0.8407 1/6 3.0000 2/3 4.0000 2/3 5.1062 1/6 7.1593 1/6
The Decision Tree and Optimal Decision Policy
The best decision is: Alternative II: No Partner, No new plant.
6.6306 .1667 [6.6306] Low
57.6000 .6667 [57.6000] Nominal
108.5694 .1667 [108.5694] High
Sales 1st year by Biotekno [57.6000] No partner N …
21.6306 .1667 [21.6306] Low
72.6000 .6667 [72.6000] Nominal
88.0000 .1667 [88.0000] High
Sales 1st year by Biotekno [66.6718] No partner N …
10.1729 .1667 [10.1729] Low
48.4000 .6667 [48.4000] Nominal
86.6271 .1667 [86.6271] High
Sales 1st year by Nat Diag [48.4000] New partner …
Investment Strategy [66.6718]

IE5203 (2021) soln-8-9
Risk Profiles and Stochastic Dominance Analysis
Observation: • Alt II first order stochastically dominates Alt III • Alt II second order stochastically dominates Alt I Alternative III will never be chosen under all attitudes (risk advise and risk seeking) Alternative I will never be chosen under all risk averse consideration. Recommendation: Chose Alternative II - Do not go with partner, do not build plant. Expected Profit under 2-year study period = $66.6718 million
5 10 15 20 25 30 35 40 45 50 55 60 65 70 75 80 85 90 95 100 105
Value of Objective Function
0
0.1
0.2
0.3
0.4
0.5
0.6
0.7
0.8
0.9
1
Prob
abilit
y of
Exc
eedi
ng
No partner New plantNo partner No new plantNew partner New plant

IE5203 (2021) soln-8-10
Value of Information Analysis EVPI for nB Decision model with free perfect information on nB
Expected Value of Perfect Information for nB = 74.5616 – 66.6718 = $7.8898 million.
6.6306 [6.6306] No partner Ne …
21.6306 [21.6306] No partner N …
10.1729 .1667 [10.1729] Low
48.4000 .6667 [48.4000] Nominal
86.6271 .1667 [86.6271] High
Sales 1st year by Nat Diag [48.4000] New partner …
Investment Strategy
.1667 [48.4000] Low
57.6000 [57.6000] No partner N …
72.6000 [72.6000] No partner N …
10.1729 .1667 [10.1729] Low
48.4000 .6667 [48.4000] Nominal
86.6271 .1667 [86.6271] High
Sales 1st year by Nat Diag [48.4000] New partner …
Investment Strategy
.6667 [72.6000] Nominal
108.5694 [108.5694] No partner …
88.0000 [88.0000] No partner N …
10.1729 .1667 [10.1729] Low
48.4000 .6667 [48.4000] Nominal
86.6271 .1667 [86.6271] High
Sales 1st year by Nat Diag [48.4000] New partner …
Investment Strategy
.1667 [108.5694] High
Sales 1st year by Biotekno [74.5616]

IE5203 (2021) soln-8-11
EVPI for nN Decision model with free perfect information on nN
Expected Value of Perfect Information for nN = 69.9976 – 66.6718 = $3.3258 million.
6.6306 .1667 [6.6306] Low
57.6000 .6667 [57.6000] Nominal
108.5694 .1667 [108.5694] High
Sales 1st year by Biotekno [57.6000] No partner …
21.6306 .1667 [21.6306] Low
72.6000 .6667 [72.6000] Nominal
88.0000 .1667 [88.0000] High
Sales 1st year by Biotekno [66.6718] No partner …
10.1729 [10.1729] New partner …
Investment Strategy
.1667 [66.6718] Low
6.6306 .1667 [6.6306] Low
57.6000 .6667 [57.6000] Nominal
108.5694 .1667 [108.5694] High
Sales 1st year by Biotekno [57.6000] No partner …
21.6306 .1667 [21.6306] Low
72.6000 .6667 [72.6000] Nominal
88.0000 .1667 [88.0000] High
Sales 1st year by Biotekno [66.6718] No partner …
48.4000 [48.4000] New partner …
Investment Strategy
.6667 [66.6718] Nominal
6.6306 .1667 [6.6306] Low
57.6000 .6667 [57.6000] Nominal
108.5694 .1667 [108.5694] High
Sales 1st year by Biotekno [57.6000] No partner …
21.6306 .1667 [21.6306] Low
72.6000 .6667 [72.6000] Nominal
88.0000 .1667 [88.0000] High
Sales 1st year by Biotekno [66.6718] No partner …
86.6271 [86.6271] New partner …
Investment Strategy
.1667 [86.6271] High
Sales 1st year by Nat Diag [69.9976]

IE5203 (2021) soln-8-12
Joint EVPI for nN and nB Decision model with free joint perfect information on nN and nB
Expected Value of Joint Perfect Information for nN and nB = 76.4384 – 66.6718 = $9.7666 million.
6.6306 [6.6306] No partner …
21.6306 [21.6306] No partn …
10.1729 [10.1729] New part …
Investment Strategy
.1667 [21.6306] Low
57.6000 [57.6000] No partn …
72.6000 [72.6000] No partn …
10.1729 [10.1729] New part …
Investment Strategy
.6667 [72.6000] Nominal
108.5694 [108.5694] No part …
88.0000 [88.0000] No partn …
10.1729 [10.1729] New part …
Investment Strategy
.1667 [108.5694] High
Sales 1st year by Biote …
.1667 [70.1000] Low
6.6306 [6.6306] No partner …
21.6306 [21.6306] No partn …
48.4000 [48.4000] New part …
Investment Strategy
.1667 [48.4000] Low
57.6000 [57.6000] No partn …
72.6000 [72.6000] No partn …
48.4000 [48.4000] New part …
Investment Strategy
.6667 [72.6000] Nominal
108.5694 [108.5694] No part …
88.0000 [88.0000] No partn …
48.4000 [48.4000] New part …
Investment Strategy
.1667 [108.5694] High
Sales 1st year by Biote …
.6667 [74.5616] Nominal
6.6306 [6.6306] No partner …
21.6306 [21.6306] No partn …
86.6271 [86.6271] New part …
Investment Strategy
.1667 [86.6271] Low
57.6000 [57.6000] No partn …
72.6000 [72.6000] No partn …
86.6271 [86.6271] New part …
Investment Strategy
.6667 [86.6271] Nominal
108.5694 [108.5694] No part …
88.0000 [88.0000] No partn …
86.6271 [86.6271] New part …
Investment Strategy
.1667 [108.5694] High
Sales 1st year by Biote …
.1667 [90.2841] High
Sales 1st year by Nat Diag [76.4384]

IE5203 (2021) soln-8-13
Areas of Further Consideration • Why were the pricing issues fixed and not a decision variable? • Are there other ways to expand existing production capacity? • Would the partnership offer be more attractive if Biotekno explicitly considered the cost of
marketing the product? • The sales distribution seems rather tight. There may be an anchoring bias. • It doesn't seem reasonable that a small company would be risk neutral in this range of values. • The no partnership/build plant alternative might be more attractive if possible uses of the plant
beyond two years were considered. • The two-year time frame seems unrealistic, despite fast product cycles.