solutions for peak-power supply - smart energy · pdf fileload has been 5 200 mw and ... as...
TRANSCRIPT
Solutions for peak-power supply
Samuli Honkapuro1, Kimmo Ollikka2 1 Lappeenranta University of Technology, [email protected] 2 VATT Institute for Economic research, [email protected]
Challenge
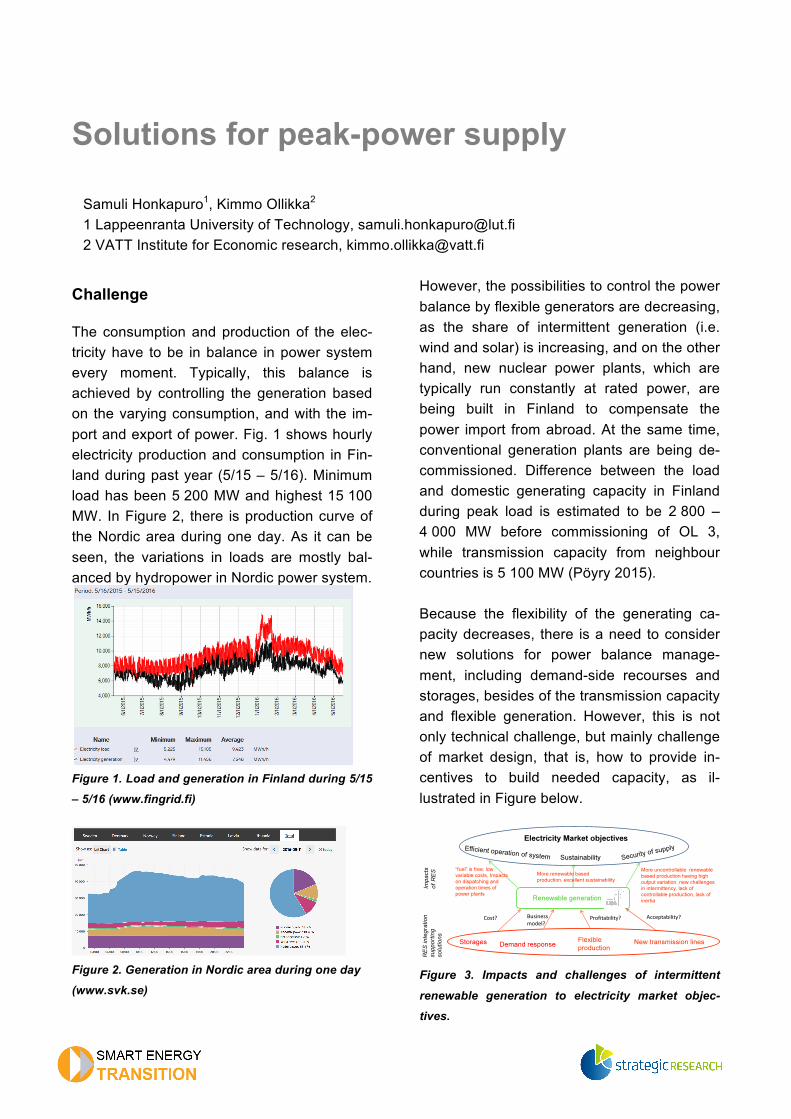
The consumption and production of the elec-tricity have to be in balance in power system every moment. Typically, this balance is achieved by controlling the generation based on the varying consumption, and with the im-port and export of power. Fig. 1 shows hourly electricity production and consumption in Fin-land during past year (5/15 – 5/16). Minimum load has been 5 200 MW and highest 15 100 MW. In Figure 2, there is production curve of the Nordic area during one day. As it can be seen, the variations in loads are mostly bal-anced by hydropower in Nordic power system.
Figure 1. Load and generation in Finland during 5/15
– 5/16 (www.fingrid.fi)
Figure 2. Generation in Nordic area during one day
(www.svk.se)
However, the possibilities to control the power balance by flexible generators are decreasing, as the share of intermittent generation (i.e. wind and solar) is increasing, and on the other hand, new nuclear power plants, which are typically run constantly at rated power, are being built in Finland to compensate the power import from abroad. At the same time, conventional generation plants are being de-commissioned. Difference between the load and domestic generating capacity in Finland during peak load is estimated to be 2 800 – 4 000 MW before commissioning of OL 3, while transmission capacity from neighbour countries is 5 100 MW (Pöyry 2015). Because the flexibility of the generating ca-pacity decreases, there is a need to consider new solutions for power balance manage-ment, including demand-side recourses and storages, besides of the transmission capacity and flexible generation. However, this is not only technical challenge, but mainly challenge of market design, that is, how to provide in-centives to build needed capacity, as il-lustrated in Figure below.
Figure 3. Impacts and challenges of intermittent
renewable generation to electricity market objec-
tives.

Solutions
Flexible generation
Typically, power balance has been maintained by conventional generating capacity. Some of the typical flexibility properties of different generator types are illustrated in Table 1. Fur-thermore, unsubsidized levelized cost of dif-ferent generating types are illustrated in Fig-ure 4. Table 1. Flexibility properties of power plants (ÅF
2012)
Figure 4. Unsubsidized levelized cost of energy
(CleanTechnica 2015). The challenge with conventional generators, which are able to follow the load, is that low marginal cost renewable energy, especially if subsidised, is brought online first, which re-
duce the marginal price of electricity and op-erating hours of conventional generators. Hence, peak generation face the uncertainty concerning the operating hours and price lev-els in energy only markets, especially if prices are capped. However, flexible generation is still seen important element to ensure the se-curity of supply in those moment, when re-newables cannot generate. To overcome above illustrated challenge, dif-ferent capacity mechanisms can be used to provide fixed compensation for generators for maintaining ready-to-use generating capacity. Also demand side resources and cross-border lines can typically participate in capacity mar-kets. However, there are several risks for market failures in design of the capacity mechanisms, as illustrated by Gore (2015). There may be poor liquidity and exercise of the market power of existing generators and mechanisms may drive to under- or overcapacity. Further-more, there might be distortions to cross-border trade, such as inefficient use of inter-connectors or welfare effects in neighbouring countries. For instance, in free-riding effect consumers in one country pay for capacity, which is partly used in another country. Transmission lines
The transmission network combines genera-tion and consumption resources in different areas, and thus enable the market integration. In figure below, there is illustrated transmis-sion capacity between Finland and neighbour countries, including estimated development to years 2020 and 2030.

Figure 5. Interconnectors between Finland and
neighbour countries and estimated development to
years 2020 and 2030 (Laitinen 2013). The price differences between bid areas occur because of the bottlenecks in transmission lines. During first four months of 2016, there has been common price in whole North-European market area in 6 % of operating hours, while in 9 % of hours Finland has been separate price area.
Figure 6. Uniformity of Nordic pricing regions, in
1.1.-30.4. 2016 (www.fingrid.fi).
Investments to remove bottlenecks by re-inforcing the transmission network have not taken place entirely as planned in recent years. Sharing of the investment costs and benefits between countries and the long licensing processes of the network construc-tion are often problematic. Hence, European-level regulation and collaboration between transmission-network operators in different countries is needed, so that not only national benefits but also regional ones are considered in the planning of the investment. Key deter-minates to guarantee transmission capacity development are illustrated in figure below (Makkonen 2015).
Figure 7. “Capacity development machine” in Nordic
electricity markets (Makkonen 2015). Storages
Energy can be stored in the form of thermal energy (e.g. water heaters), mechanical en-ergy (e.g. pumped hydro, compressed air, flywheels), or electro or electro-chemical en-ergy (e.g. batteries, hydrogen, syntehic natu-ral gas). Most common types of storages con-nected to power system are pumped hydro storages. However, as the prices of the batter-ies are falling, they will provide interesting opportunities from power system viewpoint.
From the perspective of the power system, the storage technologies differ with regard to whether the energy stored in them can be readily converted back into electricity, as is the case with batteries or pumped-storage
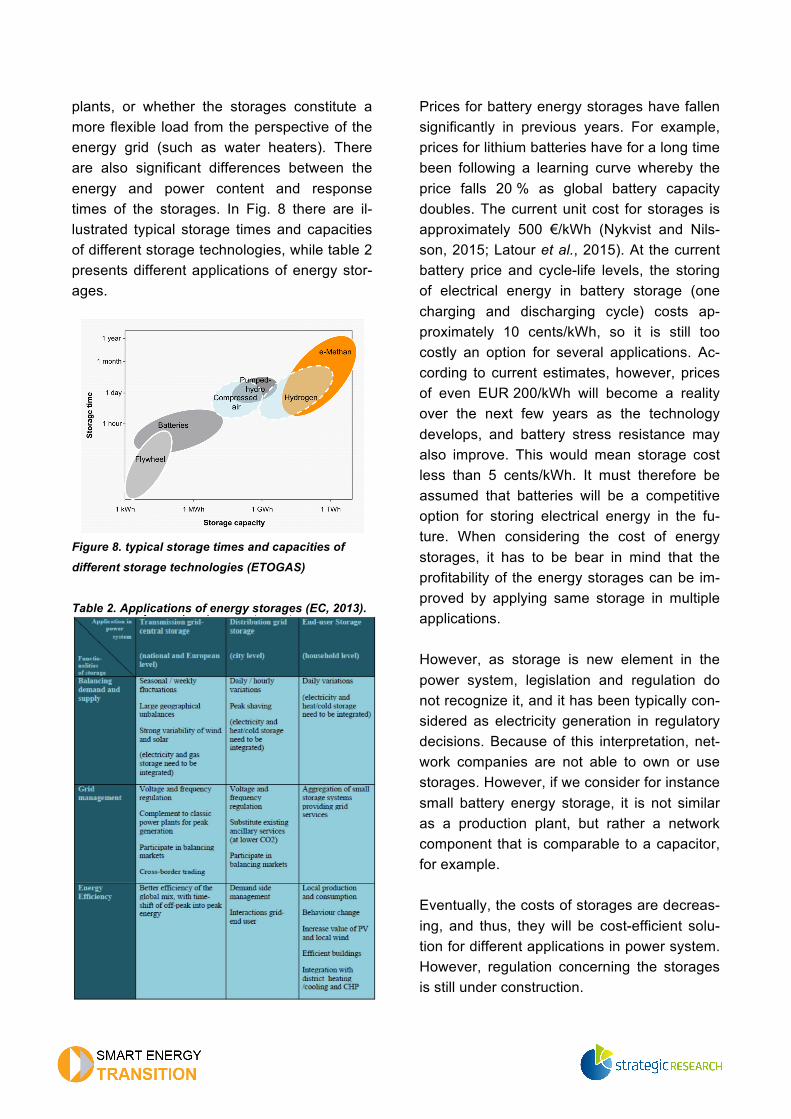
plants, or whether the storages constitute a more flexible load from the perspective of the energy grid (such as water heaters). There are also significant differences between the energy and power content and response times of the storages. In Fig. 8 there are il-lustrated typical storage times and capacities of different storage technologies, while table 2 presents different applications of energy stor-ages.
Figure 8. typical storage times and capacities of
different storage technologies (ETOGAS) Table 2. Applications of energy storages (EC, 2013).
Prices for battery energy storages have fallen significantly in previous years. For example, prices for lithium batteries have for a long time been following a learning curve whereby the price falls 20 % as global battery capacity doubles. The current unit cost for storages is approximately 500 €/kWh (Nykvist and Nils-son, 2015; Latour et al., 2015). At the current battery price and cycle-life levels, the storing of electrical energy in battery storage (one charging and discharging cycle) costs ap-proximately 10 cents/kWh, so it is still too costly an option for several applications. Ac-cording to current estimates, however, prices of even EUR 200/kWh will become a reality over the next few years as the technology develops, and battery stress resistance may also improve. This would mean storage cost less than 5 cents/kWh. It must therefore be assumed that batteries will be a competitive option for storing electrical energy in the fu-ture. When considering the cost of energy storages, it has to be bear in mind that the profitability of the energy storages can be im-proved by applying same storage in multiple applications.
However, as storage is new element in the power system, legislation and regulation do not recognize it, and it has been typically con-sidered as electricity generation in regulatory decisions. Because of this interpretation, net-work companies are not able to own or use storages. However, if we consider for instance small battery energy storage, it is not similar as a production plant, but rather a network component that is comparable to a capacitor, for example.
Eventually, the costs of storages are decreas-ing, and thus, they will be cost-efficient solu-tion for different applications in power system. However, regulation concerning the storages is still under construction.

Demand response
As illustrated above, it is assumed that in fu-ture demand side participates more in power balance management by the means of de-mand response. However, demand response have also multiple other benefits for different electricity market stakeholders, as illustrated below (Järventausta et al. 2015).
Table 3. Benefits of DR for different stakeholders. Stakeholder Key benefits of DR
Transmission System Opera-tor (TSO)
System level power balance and fre-quency control (balancing and reserve power) in normal and disturbance situa-tion.
Retailer Optimization of the procurement of the electricity (portfolio optimization), man-agement of the balance between pro-curement and sales, novel products and pricing structures, new business oppor-tunities (e.g. operating as aggregator).
Distribution System Opera-tor (DSO)
Peak cutting in normal and disturbance situation, using demand response as a substitute for back-up lines, optimizing the dimensioning of the network.
End user: Decreasing electricity purchase costs, optimizing consumption based on output of own generation, peak cutting, optimiz-ing the size of main fuse.
One of the key resource for demand response in Finland is electric heating, which has been controlled based on two-time tariff for several decades. In national level, there are about 1000 MW of heating loads, which are at the moment controlled based on day and night-time prices via AMR meters. However, the control logic of these loads can be changed, by some software changes, from day-/night-time control to control based on day-ahead market prices. Furthermore, it has been esti-mated that about same amount of heating loads (1 000 MW) can be controlled via load-reduction control relay, and hence used in intra-day markets. However, standardization of the communication interfaces is needed, to ensure fast enough transmit of the control signals between market players. Furthermore, in the case of the intra-day markets, also some modifications to customer end installa-tions are needed (Järventausta et al. 2015).
In addition to electric heating loads, there are elastic loads also in other sectors, especially in industry. It is difficult to determine exact DR potential in different sectors, but it has been estimated by Kärkkäinen (2007), that DR po-tential in Finnish industry is 1 280 MW. Although the existing smart meter infrastruc-ture and market places of the DR, there are still some hindrances for the efficient imple-mentation of the demand response resources in the markets as illustrated by Järventausta et al. (2015). At first, the roles and responsibilities of the different stakeholders in the practical imple-mentation of the DR are unclear, and hetero-geneity in ICT systems and solutions hinder the actualization of the load controls. Fur-thermore, there may appear conflicting inter-ests, as the sharing of the costs and benefits seem to be unequal in some cases, and contradicting needs for load controls between stakeholders may occur. Finally, key obstacle is also missing incentives for customer par-ticipation, as expected benefits may be quite high, and customers may consider large part of their loads as unsifhtable.
Sources
ÅF-consulting. 2012. Mistä lisäjoustoa sähkö-järjestelmään? Loppuraportti.
Laitinen, L. 2013. Tunninsisäinen tehotasa-paino Suomessa 2020 ja 2030. Diplomityö. Lappeenrannan teknillinen yliopisto 2013.
Gore, O. 2015. Impacts of capacity remunera-tive mechanisms on cross-border trading. Dissertation. LUT 2015
Makkonen, M. 2015. Cross-border transmis-sion capacity development – Experiences from the Nordic electricity markets. Disserta-tion. LUT 2015

ETOGAS smart energy conversion, “Power to Gas: Smart energy conversion and storage”
EC 2013. DG ENER Working Paper. The fu-ture role and challenges of Energy Storage.
Pöyry 2015. Suomen sähkötehon riittävyys ja kapasiteettirakenteen kehitys vuoteen 2030. Raportti 23.1.2015
Kärkkäinen. 2007. DSM experiences in Nordic countries. TAIEX Workshop on Demand Side Management in Energy Efficiency. Ankara 23/11/2007 (http://www.eie.gov.tr/verimlilik/document/SeppoKarkkainen.pdf)
Järventausta, P. et al. 2015. Demand Res-ponse – Practical Solutions and Impacts for DSOs in Finland (Kysynnän jousto - Suomeen soveltuvat käytännön ratkaisut ja vaikutukset verkkoyhtiöille). Research report. Tampere University of Technology. 2015 (In Finnish)
Nykvist B., Nilsson M. (2015), ‘Rapidly falling costs of battery packs for electric vehicles,’ Nature Climate Change, vol. 5, pp. 329–332, April 2015.
Latour Q. X., Jarry G., Laffaille D., de Beaufort R., Frizi N., Theophile D. (2015), ‘Electricity storage: how to enable its deployment?’, in Proc. 23th Int. Conf. and Exhibition on Elec-tricity Distribution, CIRED, Lyon, France, 15–18 June 2015, pp. 1–5.
CleanTechnica. 2015. Wind & Solar Cheaper Than Fossils & Nuclear Now. http://cleantechnica.com/2015/12/03/wind-solar-cheaper-than-fossils-nuclear-now/

SET-asiantuntijakyselyn 1. kierroksen tuloksia...
Energian- ja sähkönkulutuksen kehitys vuoteen 2030 mennessä
Delfoi-kyselyn ensimmäinen kierros alkoi arvioilla energiankulutuksen kehityksestä 2030 mennessä. Kysymykset olivat sektorikohtaisia, mutta antavat kuvaa myös kokonaiskysynnän muutoksesta. Vastaajat arvelivat monien sektorien energiatarpeen vähenevän, ja ainoastaan palvelualan ja ICT palveluiden energiatarpeen kasvavan. Sähkönkulutuksen arveltiin kasvavan merkittävästi liikenteessä ja ICT-palveluissa.
Primäärienergiankulutus Suomessa vuonna 2030:
Sähkönkulutus Suomessa vuonna 2030:
Energiankäytön muutoksia koskevia arvioita on perusteltu eri tavoin. Yleisemmällä tasolla perusteltiin alhaisen talouskasvun ja teknologian kehityksen johtavan siihen, että kokonaisenergiankulutus ei ainakaan lisäänny. Energia-intensiivisen teollisuuden kulutuksen oletettiin myöskin pysyvän enintään samana ja usein jopa laskevan.
"Uskon että julkisten rakennusten lukumäärä vähenee ja koko kasvaa, jolloin energiatehokkuustoimet purevat. Myös julkisten palvelujen sijoittaminen muiden palvelujen yhteyteen vähentää energian kulutusta. Asuinrakennusten kulutus pienenee sekä energiatehokkuustoimien että rakennemuutoksen kautta: yhä useampi asuu kaupungissa/taajamassa kerrostalossa. Energiaintensiivisen teollisuuden odotan kokonaisuutena pysyvän samana ja energiatehokkuus vähentää kulutusta siellä. [...] Palvelut kasvavat ja maatalous pysyy samana tai kasvaa hiukan, koneellistuu mutta myös muuttuu energiatehokkaammaksi. ICT palvelut kasvavat niin paljon, ettei energiatehokkuus pure niiden primäärienergian kulutukseen. Katsoin OECD:n pitkän aikavälin euromaiden kasvuennusteen ja se on n. 2% vuodessa, sekin voi olla vähän optimistinen. Ei tarvita kovin kummoista energiaintensiteetin vähenemistä, että se kumoaa tuon vaatimattoman kasvun."

Eri energiateknologioiden merkitys vuonna 2030 Suomen energiajärjestelmässä
Ensimmäisellä kierroksella kysyimme myös vastaajien näkemyksiä teknologioiden käyttöönottoon Suomessa ja niiden vientimahdollisuuksiin. Teknologioista kaikkein merkittävimpinä tai selvimpinä tulokkaina pidettiin lämpöpumppuja, tuulivoimaa ja automatisoitua kysyntäjoustojärjestelmää. Myös aurinkosähkön ennakoitiin syrjäyttävän muita tuotantomuotoja.
Eri teknologioiden merkitys Suomen energiajärjestelmässä vuonna 2030:
Teknologioiden vientipotentiaali vuonna 2030:
Ensimmäisen kierroksen teknologiakohtaisia tuloksia ja huomioita esitellään kunkin teeman ensimmäisellä sivulla.!

SET WP1 Delphi R2 diagrams 6/8
F: Huipputeho ja varavoiman hallinta
!""#$%---$FR!%($!
%---+.---$FR!%%$!
.---+C---$FR!",$!
C---+A---$FR!%#$!
/")$,---$FR!*$!
O"#P$&;;$(+50-'#2&(2&'1'#0$)'B#67873#0)$1#23)4565!
,$! 78)*$6595*$
1#23):;<:5!&$!
=(*3)*$6#228*$
1#23):;<:5!",$!
>8"?(*$1#23):;<:5!
''$!
02)45)*$1#23)4565!%($!
O"#P$&;;$01,)'#,2//&''2'#41%(&05*#67873#
A'
?'
?'
?'
AC'
CD'
CA'
CA'
BK'
>C'
AB'
='
B>'
B>'
C='
A@'
C>'
CD'
AE'
>@'
&$! %&$! '&$! *&$! (&$! "&&$!
J$0*1#&9&*&(.).'
!):7&#$0$'9&*&9)#7&'
L&,9&.'(##*.)3,.0320.'
!3(3$$+$',&66#$.&'M'%3(3$.+5)"(.)'
K%(&<-&I1'#(1*(1&*55*#01,)02*2;2&')'#,2//&''2**23#
J#')660$%&&$''%0(%0#$0$'G'
G'
G'
!0(%0#$0$'
D' AD' AD' C@' >'
&$! #&$! "&&$!
F1('&*02/)$I1//&*1*B#2<201//1'#*+,(-'#?2%2*0)&'B##)'#?$)''2#6787#*&<)&@$'$0Q#
N&5&".04"$&'6+,0660''%+34-/#(.0#.+'G'
G'
G'
!0(%#.0.3(:'(""*##$''9&*&(.)#,#$'
D' A?' BA' B?' B?'
&$! %&$! '&$! *&$! (&$! "&&$!
=$)''2#6787#,$&;;$01,)0$)02'0)R?2%2?)&42##)'#;++)*&'Q#
F++$$06.3+'
G'
G'
G'
O&*%%#$&G'/0*"(.0#(.&'
Huipputeho
Kuinka paljon Tehovaje on arvioitua suurempi johtuen yhteisvaikutuksesta, joka tulee lämpöpumppujen lisääntymisestä ja uusiutuva tuotannon (aurinko ja tuuli) kasvusta sekä näiden tukijärjestelmien vuoksi kannattamattomana pysähtyvän vanhan perustuotannon vaikutuksesta.
Miksi käynnistää fossiilinen varavoimalaitos ja tuottaa kallista sähköä, jos kaapelin kautta saa halvempaa norjalaista vesivoimaa? Miten Sähkön vähänkään laajempaan ja pitkäaikaisempaan varastointin ainoa ratkaisu on tällä hetkellä pumped hydro eli varastoiminen veden potentiaalienergiaksi…sähkön varastointia polttoaineeksi (polttokennoteknologioita etc) tulisi mielestäni tutkia selvästi voimakkaammin ja laajemmalla rintamalla kuin mitä nyt näyttää tapahtuvan. Asiakkaille alettava muudä sähköä "tehoputkena" jossa määritetään kuluttajakohtainen maksimiteho. Tekninen toteutus on jo nyt mahdollista kuluttajalle. Suomessa ei vieläkään käydä käytännössä lainkaan keskustelua siitä, miten välttämättömiä kulutuspiikit ylipäänsä ovat. Mikä kulutus on järkevää hetkellä, jolloin sähkön hinta on 3000 euroa megawattitunnilta? Huipputeho menee Suomessa lainsäädännön kautta, koska tehon loppuminen "yllättää yhteiskunnan". Seuraava normaalia kylmempi talvikuukausi saa eduskunnan rakentamaan "huipputeholain", joka lienee yhtä hölmö kuin "säävarma verkko" takavuosien myrskyjen jälkeen.