solutions mvt certified fuel economy test - home -...
TRANSCRIPT

This report may not be copied or published without the written consent of Mesilla Valley Transportation Solutions, LLC
MVT SOLUTIONS CERTIFIEDTM
FUEL ECONOMY TEST
EKOSTINGER
FULL SYSTEM
4.20 gal/1000 miles
0.37 MPG
3.85%
UNDERCARRIAGE ONLY
1.95 gal/1000 miles
0.17 MPG
1.79%
TEST REPORT
1
Fuel Economy Test: EkoStinger
1.0: Introduction Mesilla Valley Transportation Solutions (MVTS) certifies the fuel savings from this product were as described in this report. Note that this report was designed for carriers and providing information relevant to their needs. Therefore, the format varies to traditional fuel economy and technical reports. The report Summary provides the reader a quick synopsis of the product’s fuel savings. Following that is the body of the report and further details on the subjects. This fuel economy test was performed using MVTS proprietary fuel economy test methods. These test methods were developed from race car engineering and advanced vehicle test methods, which Mesilla Valley Transportation (fleet) has relied on since 2012 to identify substantial fuel savings. The MVTS methods provide highly accurate and reliable answers on real-world fuel savings in comparison to other test methods, which enables carriers to make the best decisions for their company. Contact MVTS with any questions regarding the product or test. As part of an MVTS CertifiedTM test, MVTS supports product inquiries, which we encourage carriers to utilize. Note: blue text indicates a link to the topic. Click to follow. Alt + returns the reader to the initial location.
2.0: Test Summary EkoStinger showed a total fuel savings of 4.20 gallons/1000 miles and 3.85% on a modern Class-8 truck and 53’ van trailer. The EkoStinger undercarriage saved 1.95 gal/1000 miles and 1.79%. The Arrow was not tested alone, therefore its standalone value is not
available. Results can be found in Table 1 below.
Table 1: Fuel Economy Test Results
2
Fuel Economy Test: EkoStinger
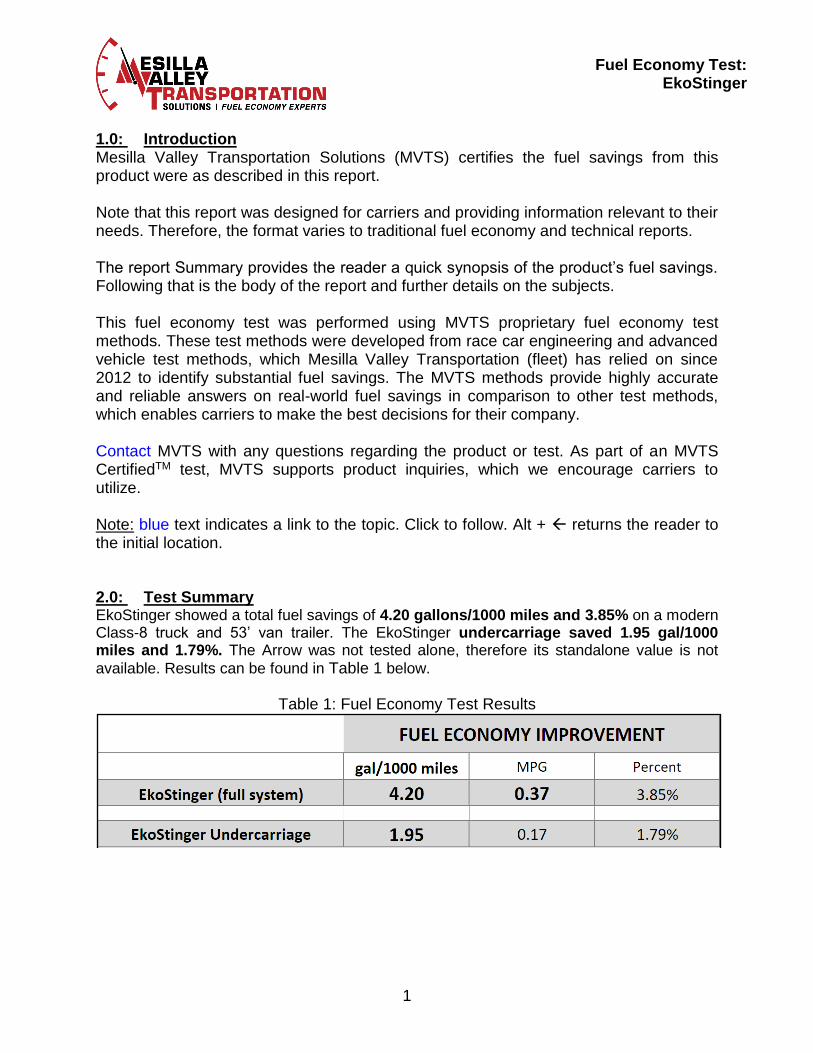
Figure 1: EkoStinger (full system), Fuel savings 4.20 gal/1000 miles (Run 1)
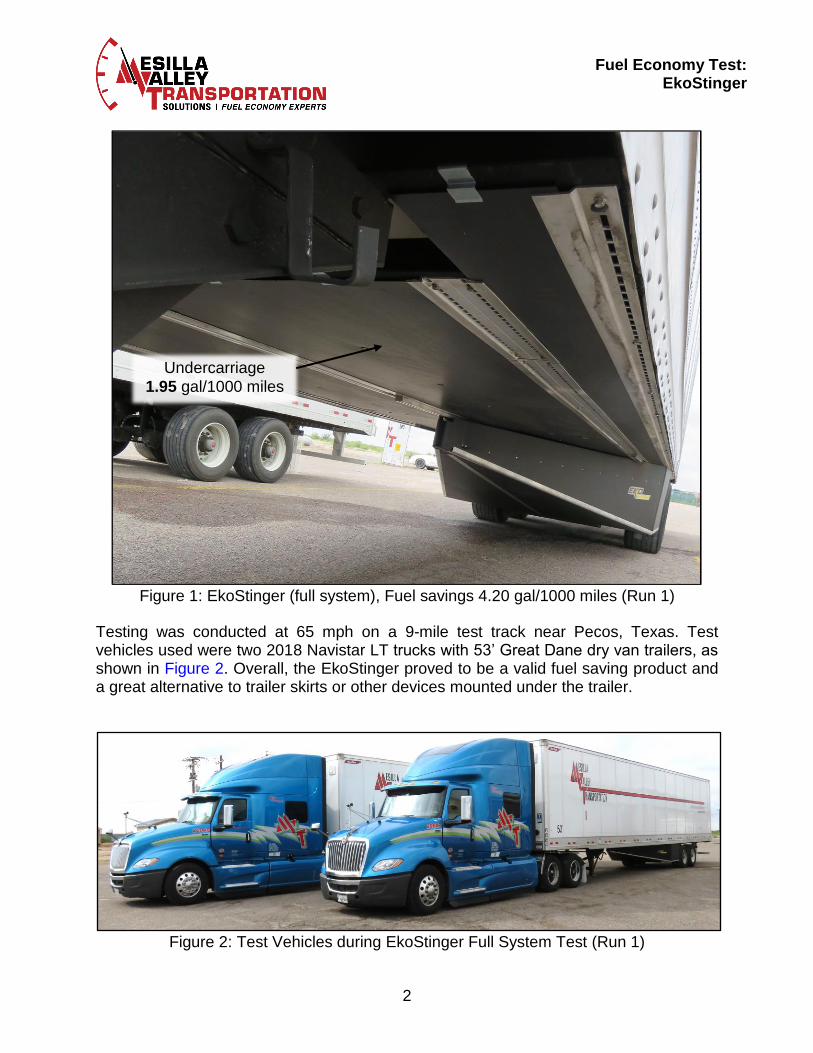
Testing was conducted at 65 mph on a 9-mile test track near Pecos, Texas. Test vehicles used were two 2018 Navistar LT trucks with 53’ Great Dane dry van trailers, as shown in Figure 2. Overall, the EkoStinger proved to be a valid fuel saving product and a great alternative to trailer skirts or other devices mounted under the trailer.
Figure 2: Test Vehicles during EkoStinger Full System Test (Run 1)
Undercarriage
1.95 gal/1000 miles

3
Fuel Economy Test: EkoStinger
Contents 1.0: Introduction ............................................................................................................ 1
2.0: Test Summary ....................................................................................................... 1
2.1: Test Procedure ................................................................................................... 5
3.0: Test Vehicles ......................................................................................................... 7
4.0: Test Results .......................................................................................................... 8
4.1: Weather Conditions ............................................................................................ 8
4.2: Measurement Accuracy ..................................................................................... 9
4.3: Units of Measurement ...................................................................................... 10
4.4: Real-world Fuel Savings .................................................................................. 11
5.0: Conclusion ........................................................................................................... 11
6.0: Appendix ............................................................................................................. 12
6.1: Compare Truck/Trailer Vehicle Details ............................................................. 12
6.2: Modified Truck/Trailer Vehicle Details (where EkoStinger installed) ................ 14
6.3: Test Route........................................................................................................ 16
6.4: Savings Calculations ........................................................................................ 16
6.4a: Fuel Savings Calculations ......................................................................... 16
6.4b: Financial Savings Calculations .................................................................. 16
6.4c: Fuel Economy Unit Conversion ................................................................. 17
6.5: Product Details ................................................................................................. 17
6.6: Weather Conditions .......................................................................................... 17
6.7: Test Personnel ................................................................................................. 19
6.7a: MVT & MVT Solutions ............................................................................... 19
6.7b: Test Vehicle Drivers .................................................................................. 19
6.8: MVT Solutions Contact Info ............................................................................. 19

4
Fuel Economy Test: EkoStinger
List of Figures Figure 1: EkoStinger (full system), Fuel savings 4.20 gal/1000 miles (Run 1) ................ 2
Figure 2: Test Vehicles during EkoStinger Full System Test (Run 1) .............................. 2
Figure 3: EkoStinger Undercarriage Only (Run 2) ........................................................... 5
Figure 4: Baseline Run, all aerodynamics removed (Run 3) ........................................... 6
Figure 5: Baseline run, no Undercarriage or Arrow (Run 3) ............................................ 6
Figure 6: “Compare” and “Test” vehicle (Run 1) .............................................................. 7
Figure 7: EkoStinger Full System Fuel Economy Accuracy Bell Curve ........................... 9
Figure 9: EkoStinger Undercarriage Fuel Economy Accuracy Graph ........................... 10
Figure 10: Compare Vehicle Details .............................................................................. 12
Figure 11: Compare Vehicle Tire Details ....................................................................... 13
Figure 12: Test Vehicle Details ..................................................................................... 14
Figure 13: Test Vehicle Tire Details .............................................................................. 15
Figure 14: Pecos Test Track Aerial Photo ..................................................................... 16
List of Tables
Table 1: Fuel Economy Test Results............................................................................... 1
Table 2: Fuel Economy Test Results with Accuracy ....................................................... 8
Table 3: Test times ........................................................................................................ 17
Table 4: Weather Data .................................................................................................. 18

5
Fuel Economy Test: EkoStinger
2.1: Test Procedure The two vehicles ran simultaneously at 65 mph on the 9-mile circle track near Pecos, Texas. The vehicles were 2 minutes apart, avoiding any aerodynamic influence on either vehicle during testing. The vehicles were termed “Compare Vehicle” and “Test Vehicle”. The Compare Vehicle remained unchanged throughout testing, it was used solely for comparison. The Test Vehicle had modifications made during the test (i.e. EkoStinger installed). The test procedure may appear similar to the SAE J1321 method traditionally used in the trucking industry, however, the MVTS methods are a much more advanced and precise form of on-road and track testing. The vehicles are equipped with sensors and data recording systems that collect data on fuel consumption, aerodynamics, rolling resistance, driver behavior and many other variables that affect fuel consumption. The data is analyzed using MVTS proprietary methods, which provide very accurate answers on fuel savings. Additionally, the test results can be scientifically translated to a carrier’s real-world daily operations and long-term savings, which is a feature unique to these methods. Overall, the MVTS test methods are a much more advanced and reliable tool for predicting fuel savings than the trucking industry has used previously. Test runs consisted of 12 to 15 laps each (108 – 135 miles). MVTS test methods are not dependent on the total travelled distance since test data is analyzed continuously. Three runs were conducted, which included the EkoStinger full system (Run 1), Arrow removed (Run 2), and Undercarriage removed (Run 3). Drivers remained the same for all runs. Run 1 configuration images are shown above. Runs 2 and 3 are shown below.
Figure 3: EkoStinger Undercarriage Only (Run 2)

6
Fuel Economy Test: EkoStinger
Figure 4: Baseline Run, all aerodynamics removed (Run 3)
Figure 5: Baseline run, no Undercarriage or Arrow (Run 3)
Viewing the bottom of the trailer and its crossmembers shows why the EkoStinger Undercarriage saves fuel by allowing for smooth airflow (Baseline configuration, Run 3).

7
Fuel Economy Test: EkoStinger
Figure 6: “Compare” and “Test” vehicle (Run 1)
3.0: Test Vehicles Test vehicles were two 2018 International LT trucks with Cummins ISX 15L engines, Eaton auto shift 10-speed transmissions, and 6x2 drive axle configurations. Trailers were 53’ Great Dane dry vans. Gross Vehicle Weight (GVW) was 45,000 lbs. Trucks utilized Michelin X-One Wide-Based-Single (WBS) tires and the trailers used Bridgestone Greatec 135 tires. Vehicle details can be found in the Appendix. Tire pressures were set at 110 psi in the morning prior to incurring any effect of daytime heat. During testing, vehicles did not include wheel covers, Flow Below kit, or trailer boat tail devices. Vehicles were configured to represent a standard vehicle in the trucking industry, as opposed to the MVT fleet standard configuration which normally includes the items listed. Vehicles were thoroughly inspected and received regular maintenance prior to testing. It should also be noted, for the reader’s piece of mind, Mesilla Valley Transportation (MVT) and MVT Solutions are 100% confident in the reliable condition of the test vehicles. MVT fleet uses the same vehicle data and test procedures for their own internal purchase decisions.
“Compare” vehicle (Runs 1-3, unchanged)
“Test” vehicle (Run 1 with EkoStinger installed)

8
Fuel Economy Test: EkoStinger
4.0: Test Results As listed in the Summary, EkoStinger saved 4.20 gal/1000 miles as a full system and the Undercarriage saved 1.95 gal/1000 miles in the vehicle configurations described. The results are shown in Table 2 and include test result accuracy and baseline fuel economy values. To convert gal/1000 miles and MPG click here.
Table 2: Fuel Economy Test Results with Accuracy
4.1: Weather Conditions Weather during testing was relatively cool for Texas summer, with overcast skies, and moderate wind. Temperatures ranged from 69°F to 59°F. Track temperatures ranged from 90.5°F to 127.0°F. Wind varied from 6.9 mph to 13.8 mph. It should be noted that the MVTS test methods account for variables and their effects on fuel savings. Therefore, the range in climate conditions did not impede the test results shown in this report. Complete weather data can be found in the Appendix.

9
Fuel Economy Test: EkoStinger
4.2: Measurement Accuracy The accuracy of fuel economy measurements is critical in determining the trustworthiness of test results. Historically, this has been a major difficulty in the trucking industry with fuel economy testing, which has led to confusion and misleading results. The MVTS test methods overcome this issue by achieving better accuracy, which is one of the ways it provides more reliable test results. Figure 7 below shows the statistical bell curves of the EkoStinger full system. The two separate bell curves show a clear difference in fuel consumption, indicating the test has valid accuracy and proves EkoStinger definitely saves fuel. The distance between the peaks of the bell curves is the test result average (a.k.a. mean) fuel savings value, which in this test was 4.20 gal/1000 miles. Note that the EkoStinger bell curve is on the left of the graph, illustrating less fuel used (fuel savings) and thereby an improvement as indicated by the arrow on the graph. The Minimum value shown in Figure 7 indicates the average value subtract the test accuracy of +/- 0.54 shown in Table 2. The Maximum value indicates the average plus the test accuracy. The Minimum and Maximum values are important since they indicate the theoretical worst-case and best-case scenarios of fuel savings in this condition. This can also be referred to as the range of savings to be expected.
Figure 7: EkoStinger Full System Fuel Economy Accuracy Bell Curve
Improvement: 4.20 gal/1000 mi.
Minimum: 3.66 gal/1000 mi.
Maximum: 4.74 gal/1000 mi.

10
Fuel Economy Test: EkoStinger
Accuracy for the tests were calculated using a 95% confidence interval, a common standard for testing measurement. 95% confidence interval indicates that if the test was repeated 100 times, values would fall within the range in 95 out of the 100 tests (i.e. the reader would be 95% confident the value would be within that range). Theoretically, there is only a 2.5% chance of achieving the minimum or maximum fuel savings. Figure 8 below illustrates the statistical bell curves for the EkoStinger Undercarriage. The clear difference in the two bell curves again illustrates a reliable test result. The fuel saved was 1.95 gal/1000 miles.
Figure 8: EkoStinger Undercarriage Fuel Economy Accuracy Graph
4.3: Units of Measurement The reader may not be familiar with units of gal/1000 miles (gallons per 1000 miles) since it is not traditionally used in the trucking industry. The following paragraphs will briefly explain the reasons for these units and how they help carriers better calculate fuel savings. Units of gal/1000 miles more reliably calculates fuel savings when compared to other units such as miles-per-gallon (MPG) and percent (%). Those units are prone to error from changing variables such as load, driver behavior, and duty cycle. For example, gal/1000 miles values are not affected by load for an aerodynamic product. An empty Class-8 unit at 34,000 lbs. will save the same gal/1000 miles in fuel as one loaded to 80,000 lbs. However, when viewed in percent (%) or MPG the values will change with load. This causes a carrier to experience varied results in real-world operation and difficulty predicting the financial benefits of the product unless units of gal/1000 miles are used.
Improvement: 1.95 gal/1000 miles
Minimum: 1.28 gal/1000 mi.
Maximum: 1.28 gal/1000 mi.

11
Fuel Economy Test: EkoStinger
Units of gal/1000 miles are the most reliable units of measurement for aerodynamic fuel savings due to its scientific and mathematical relationship to fuel consumption. Further detail is beyond the scope of this report and the reader is advised to contact MVT Solutions for further detail.
4.4: Real-world Fuel Savings The test proves that EkoStinger save fuel and that savings can be expected in a carrier’s real-world, daily operations. Fuel savings during testing vary to common daily operations, however, the two conditions are directly related by science, which can be used to predict fuel savings in long-term daily operations accurately and reliably. It should also be noted that gal/1000 miles values in this report are a valid estimate for a long-haul fleet. The main variables affecting fuel savings in testing versus real-world operations that a carrier should consider are:
• Duty Cycle • Climate • Vehicle Configuration
Driver behavior also effects fuel economy, however, it is not a factor when using units of gal/1000 miles for aerodynamic products. Reasons for this are out of the scope of this report and the reader is encouraged to contact MVTS if they require more information or values for their specific fleet. Click here to see how to calculate fuel and financial savings from the EkoStinger. 5.0: Conclusion This test proved that EkoStinger saves fuel on Class-8 tractor trailers with answers that were clear and precise. Testing was conducted in three steps:
• EkoStinger full system installed (4.20 gal/1000 miles savings)
• EkoStinger Undercarriage only (1.95 gal/1000 miles) These values can be used to estimate a carrier’s savings in real-world operations. More precision can be obtained through the use of a carrier’s vehicle information, which MVT Solutions can assist with. Overall, this testing proved that the EkoStinger is a valid fuel-saving product for the trucking industry.

12
Fuel Economy Test: EkoStinger
6.0: Appendix
6.1: Compare Truck/Trailer Vehicle Details
Figure 9: Compare Vehicle Details

13
Fuel Economy Test: EkoStinger
Figure 10: Compare Vehicle Tire Details

14
Fuel Economy Test: EkoStinger
6.2: Modified Truck/Trailer Vehicle Details (where EkoStinger installed)
Figure 11: Test Vehicle Details
15
Fuel Economy Test: EkoStinger
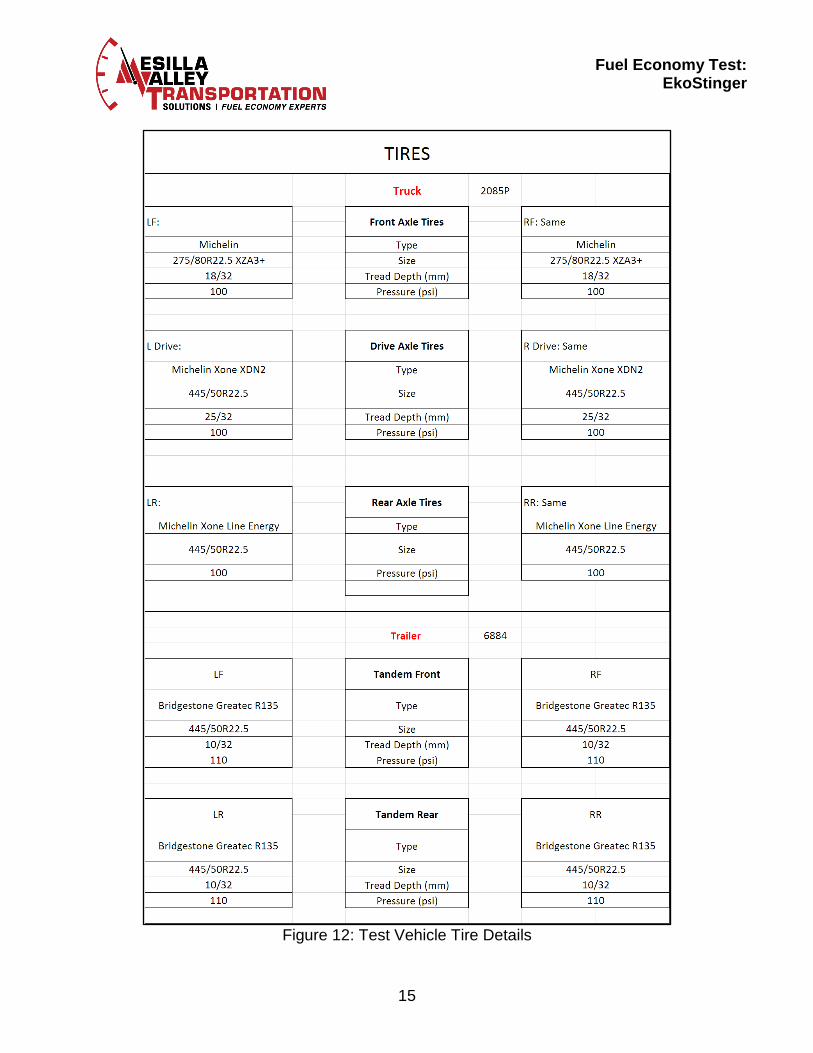
Figure 12: Test Vehicle Tire Details

16
Fuel Economy Test: EkoStinger
6.3: Test Route Pecos, Texas 9-mile circle track. Counter-clockwise direction, middle lane (of 3).
Figure 13: Pecos Test Track Aerial Photo
6.4: Savings Calculations Below is a brief outline of how to use the test results to calculate savings. For more detail or assistance contact MVT Solutions.
6.4a: Fuel Savings Calculations Fuel savings resulting from this test can be calculated as follows: Test result (gal/1000 miles) x Thousands of miles travelled per year, per vehicle Example: EkoStinger fuel savings = 4.25 gal/1000 miles. If a vehicle travels 125,000 miles per year, fuel savings are: 4.20 x 125 = 525.0 gallons annual
6.4b: Financial Savings Calculations Financial calculations can be made by multiplying the fuel saved by the fuel price. Using the 2016 U.S. average retail price of diesel fuel, $2.304 /gal:

17
Fuel Economy Test: EkoStinger
525.0 gallons/year x $2.304 /gal = $1,209.60 /year in fuel savings To calculate the net financial savings requires input of the product investment, fleet trailer to truck ratio and other pertinent variables unique to each carrier. Contact MVTS for assistance if required.
6.4c: Fuel Economy Unit Conversion
MPG = 1000 / (gal/1000 miles fuel economy) gal/1000 miles = 1000 / (MPG)
Example: 1000 / (8 mpg) = 125 gal/1000 miles 1000 / (125 gal/1000 mile) = 8 mpg
6.5: Product Details Product Company Contact: EkoStinger 33 Saginaw Drive Rochester, NY 14623 Phone: (855) 833-7940 Email: [email protected]
6.6: Weather Conditions Weather data was acquired from a local Weather Underground weather station. Source shown below. The reader should be aware that MVTS methods include instantaneous and constant weather data acquisition on each vehicle and this testing has minimal dependency on external weather data collection. MVTS test data accounts for changes in wind, temperature, and other pertinent variables instantaneously.
Table 3: Test times
Begin End
Run 1, EkoStinger full system 10:24 am 12:23 pm
Run 2, EkoStinger Arrow removed 1:48 pm 4:07 pm
Run 3, EkoStinger Undercarriage removed (Baseline) 4:40 pm 6:29 pm

18
Fuel Economy Test: EkoStinger
Table 4: Weather Data
Source: https://www.wunderground.com/history/airport/KFST/2017/8/2/DailyHistory Darkened rows pertain to the EkoStinger test periods. The wind gusts were reported in the weather data rows pertaining to 2:53 pm, 3:53 pm, and 4:53 pm did not cause any irregularities in the test data or results.

19
Fuel Economy Test: EkoStinger
6.7: Test Personnel
6.7a: MVT & MVT Solutions
• Allan Dahringer, Director of Maintenance, MVT
• Andrew Burnett, Technician, MVT
• Jose Hernandez, Technician, MVT
• Seth Knight, Shop Manager, MVT (Las Cruces)
• John Rintelin, Technician, MVT
• Daryl Bear, Lead Engineer, MVT Solutions
6.7b: Test Vehicle Drivers
• Jose Hernandez (Compare vehicle), Allan Dahringer (Modified vehicle with EkoStinger)
6.8: MVT Solutions Contact Info Test Engineer: Daryl Bear [email protected] 317-603-9325 Website: www.m-v-t-s.com