solutions to brief exercises - template.net · brief exercise 10-5 gundy company manufacturing...
TRANSCRIPT

SOLUTIONS TO BRIEF EXERCISES BRIEF EXERCISE 10-1
MARIS COMPANY Sales Budget Report
For the Quarter Ended March 31, 2014 Product Line Budget Actual Difference Garden-Tools $310,000 $305,000 $5,000 U BRIEF EXERCISE 10-2
MARIS COMPANY Sales Budget Report
For the Quarter Ended June 30, 2014 Second Quarter Year to Date Product Line Budget Actual Difference Budget Actual Difference Garden-Tools $380,000 $384,000 $4,000 F $690,000 $689,000 $1,000 U BRIEF EXERCISE 10-3 (a) PAIGE COMPANY
Static Direct Labor Budget Report For the Month Ended January 31, 2014
Budget Actual Difference Direct Labor $200,000 (10,000 X $20) $204,000 $4,000 U (b) PAIGE COMPANY
Flexible Direct Labor Budget Report For the Month Ended January 31, 2014
Budget Actual Difference Direct Labor $208,000 (10,400 X $20) $204,000 $4,000 F
)
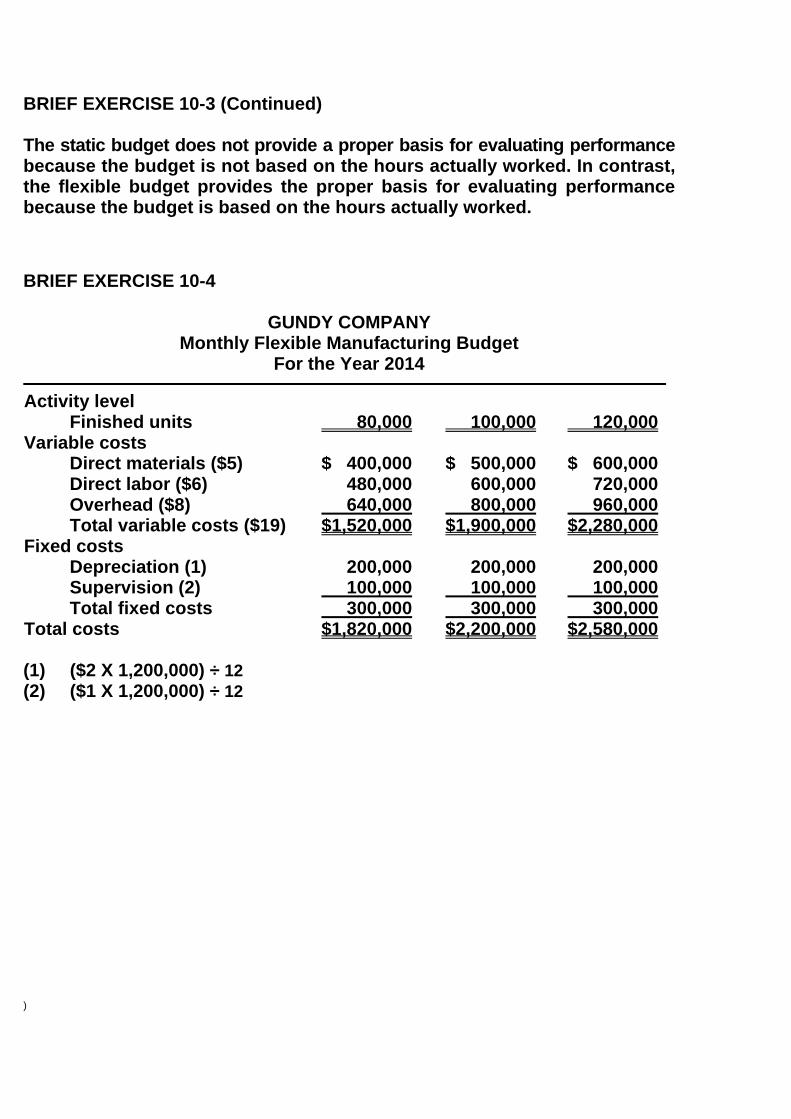
BRIEF EXERCISE 10-3 (Continued) The static budget does not provide a proper basis for evaluating performance because the budget is not based on the hours actually worked. In contrast, the flexible budget provides the proper basis for evaluating performance because the budget is based on the hours actually worked.
BRIEF EXERCISE 10-4
GUNDY COMPANY Monthly Flexible Manufacturing Budget
For the Year 2014 Activity level Finished units Variable costs Direct materials ($5) Direct labor ($6) Overhead ($8) Total variable costs ($19) Fixed costs Depreciation (1) Supervision (2) Total fixed costs Total costs
80,000
$ 400,000 480,000 640,000$1,520,000
200,000 100,000 300,000$1,820,000
100,000
$ 500,000 600,000 800,000$1,900,000
200,000 100,000 300,000$2,200,000
120,000
$ 600,000 720,000 960,000$2,280,000
200,000 100,000 300,000$2,580,000
(1) ($2 X 1,200,000) ÷ 12 (2) ($1 X 1,200,000) ÷ 12
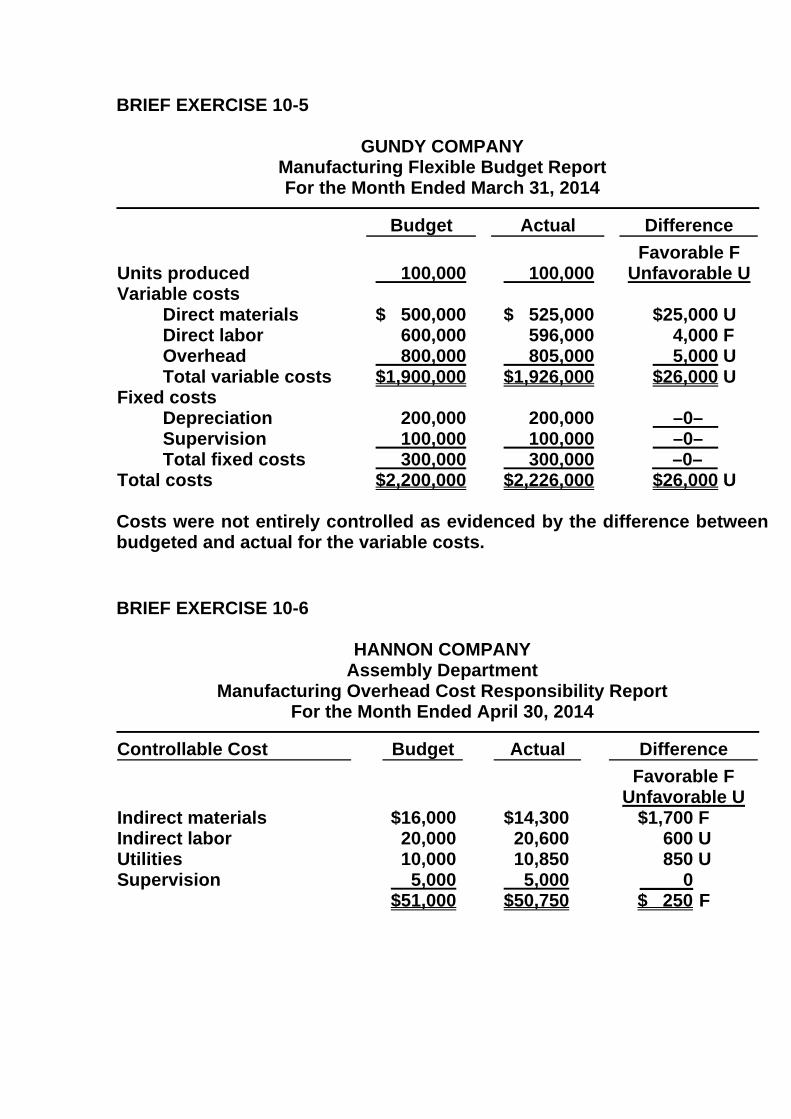
BRIEF EXERCISE 10-5
GUNDY COMPANY Manufacturing Flexible Budget Report For the Month Ended March 31, 2014
Budget Actual Difference
Units produced Variable costs Direct materials Direct labor Overhead Total variable costs Fixed costs Depreciation Supervision Total fixed costs Total costs
100,000
$ 500,000 600,000 800,000$1,900,000
200,000 100,000 300,000$2,200,000
100,000
$ 525,000 596,000 805,000 $1,926,000
200,000 100,000 300,000 $2,226,000
Favorable F Unfavorable U
$25,000 U
4,000 F 5,000 U $26,000 U
–0– –0– –0–
$26,000 U Costs were not entirely controlled as evidenced by the difference between budgeted and actual for the variable costs. BRIEF EXERCISE 10-6
HANNON COMPANY Assembly Department
Manufacturing Overhead Cost Responsibility Report For the Month Ended April 30, 2014
Controllable Cost Budget Actual Difference Indirect materials Indirect labor Utilities Supervision
$16,000 20,000 10,000 5,000$51,000
$14,300 20,600 10,850 5,000 $50,750
Favorable F Unfavorable U
$1,700 F 600 U 850 U 0 U $ 250 F
)
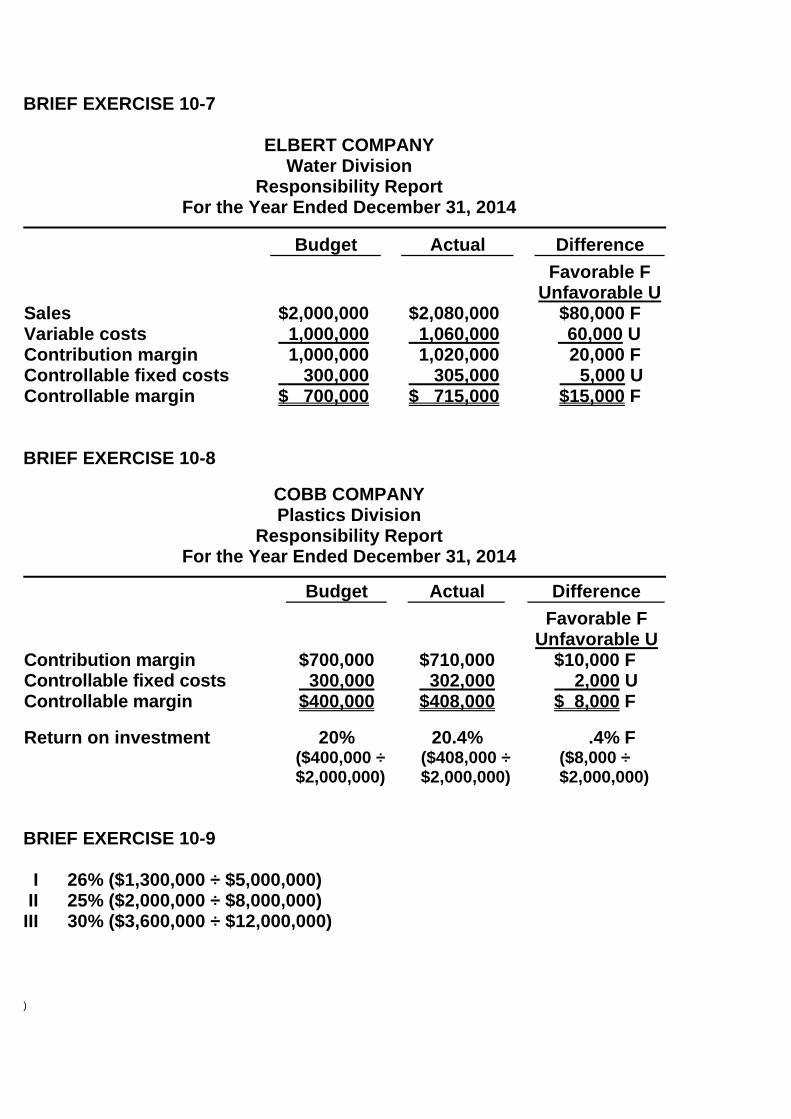
BRIEF EXERCISE 10-7
ELBERT COMPANY Water Division
Responsibility Report For the Year Ended December 31, 2014
Budget Actual Difference
Sales Variable costs Contribution margin Controllable fixed costs Controllable margin
$2,000,000 1,000,000 1,000,000 300,000 $ 700,000
$2,080,000 1,060,000 1,020,000 305,000 $ 715,000
Favorable F Unfavorable U
$80,000 F 60,000 U
20,000 F 5,000 U $15,000 F
BRIEF EXERCISE 10-8
COBB COMPANY Plastics Division
Responsibility Report For the Year Ended December 31, 2014
Budget Actual Difference
Contribution margin Controllable fixed costs Controllable margin Return on investment
$700,000 300,000 $400,000
20%
$710,000 302,000 $408,000
20.4%
Favorable F Unfavorable U
$10,000 F 2,000 U $ 8,000 F
.4% F
($400,000 ÷ $2,000,000)
($408,000 ÷ $2,000,000)
($8,000 ÷ $2,000,000)
BRIEF EXERCISE 10-9 III 26% ($1,300,000 ÷ $5,000,000) III 25% ($2,000,000 ÷ $8,000,000) III 30% ($3,600,000 ÷ $12,000,000)

BRIEF EXERCISE 10-10 III A $300,000 ($2,000,000 X .15) increase in sales will increase contribution
margin and controllable margin $210,000 ($300,000 X 70%). The new ROI is 30.2% ($1,510,000 ÷ $5,000,000).
III A decrease in costs results in a corresponding increase in controllable
margin. The new ROI is 30% ($2,400,000 ÷ $8,000,000). III A decrease in average operating assets reduces the denominator. The
new ROI is 31.3% ($3,600,000 ÷ $11,500,000). *BRIEF EXERCISE 10-11 Controllable Margin ÷ Average Operating Assets = ROI
$660,000 ÷ $3,000,000 = 22%
Controllable Margin – (Minimum Rate of Return X Average Operating Assets) = Residual Income $660,000 – (10% X $3,000,000) = Residual Income $660,000 – $300,000 = $360,000
*BRIEF EXERCISE 10-12 Controllable Margin ÷ Average Operating Assets = ROI
$800,000 ÷ $4,000,000 = 20%
Controllable Margin – (Minimum Rate of Return X Average Operating Assets) = Residual Income $800,000 – (15% X $4,000,000) = Residual Income $800,000 – $600,000 = $200,000

)
SOLUTIONS FOR DO IT! REVIEW EXERCISES DO IT! 10-1 Using the graph data, fixed costs are $90,000, and variable costs are $4.80 per direct labor hour [($330,000 – $90,000) ÷ 50,000]. Thus, at 65,000 direct labor hours, total budgeted costs are $402,000 [$90,000 + (65,000 X $4.80)]. DO IT! 10-2
Units produced
Budget 6,000 units
Actual 6,000 units
Difference
Favorable F Unfavorable U
Variable costs
Direct materials ($7) $ 42,000 $ 38,850 $3,150 F Direct labor ($13) 78,000 76,440 1,560 F Overhead ($18) 108,000 116,640 8,640 U Total variable costs 228,000 231,930 3,930 U
Fixed costs
Depreciation* 8,000 8,000 0 Supervision** 3,800 4,000 200 U Total fixed costs 11,800 12,000 200 U
Total costs $239,800 $243,930 $4,130 U
*$96,000/12 **$45,600/12 The flexible budget report indicates that actual overhead was 8.0% over budget. This cost was not well-controlled and should be examined further. The other variable costs came in under budget. The direct materials cost was 7.5% under budget; Mussatto should also investigate the cause of this difference, even though it is favorable. Finally, Mussatto also should investigate the unfavorable difference in supervision (5.3%) to determine if the budget amount is out-of-date.
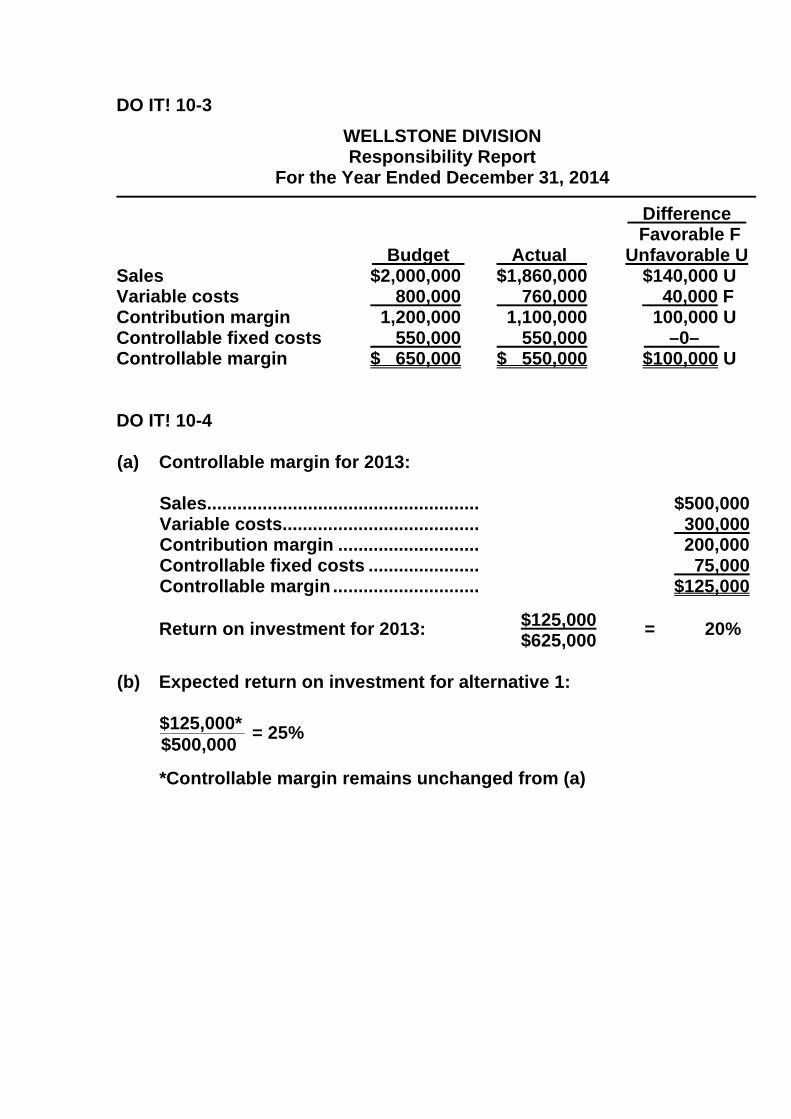
DO IT! 10-3 WELLSTONE DIVISION Responsibility Report
For the Year Ended December 31, 2014 Difference Favorable F Budget Actual Unfavorable U Sales $2,000,000 $1,860,000 $140,000 U Variable costs 800,000 760,000 40,000 F Contribution margin 1,200,000 1,100,000 100,000 U Controllable fixed costs 550,000 550,000 –0– Controllable margin $ 650,000 $ 550,000 $100,000 U DO IT! 10-4 (a) Controllable margin for 2013:
Sales...................................................... $500,000Variable costs....................................... 300,000Contribution margin ............................ 200,000Controllable fixed costs ...................... 75,000Controllable margin ............................. $125,000
$125,000 Return on investment for 2013: $625,000 = 20%
(b) Expected return on investment for alternative 1:
$125,000*$500,000 = 25%
*Controllable margin remains unchanged from (a)

)
DO IT! 10-4 (Continued)
Controllable margin for alternative 2:
Sales ($500,000 + 100,000) ........................ $600,000Variable costs ($300,000/$500,000 X $600,000) ............. 360,000Contribution margin................................... 240,000Controllable fixed costs ............................ 75,000Controllable margin ................................... $165,000
$165,000 Expected return on investment for alternative 2: $625,000 = 26.4%

SOLUTIONS TO EXERCISES EXERCISE 10-1 1. True. 2. False. Budget reports are prepared as frequently as needed. 3. True. 4. True. 5. False. Budgetary control works best when a company has a formalized
reporting system. 6. False. The primary recipients of the sales report are the sales manager
and top management. 7. True. 8. True. 9. False. Top management’s reaction to unfavorable differences is often
influenced by the materiality of the difference. 10. True. EXERCISE 10-2 (a) CREDE COMPANY Selling Expense Report For the Quarter Ending March 31 By Month Year-to-Date Month Budget Actual Difference Budget Actual Difference January $30,000 $31,200 $1,200 U $ 30,000 $ 31,200 $1,200 U February $35,000 $34,525 $ 475 F $ 65,000 $ 65,725 $ 725 U March $40,000 $46,000 $6,000 U $105,000 $111,725 $6,725 U (b) The purpose of the Selling Expense Report is to help management
control selling expenses. The primary recipient is the sales manager. (c) Most likely, when management scrutinized the results for January and
February, they would determine that the difference was insignificant (4% in January and 1.4% in February), and require no action. When the March results are examined, however, the fact that the difference is 15% of budget would probably cause management to investigate further. As a result of their investigation, management would either take corrective action or modify the amounts of budgeted selling expense for future months to reflect changing conditions.
EXERCISE 10-3
)
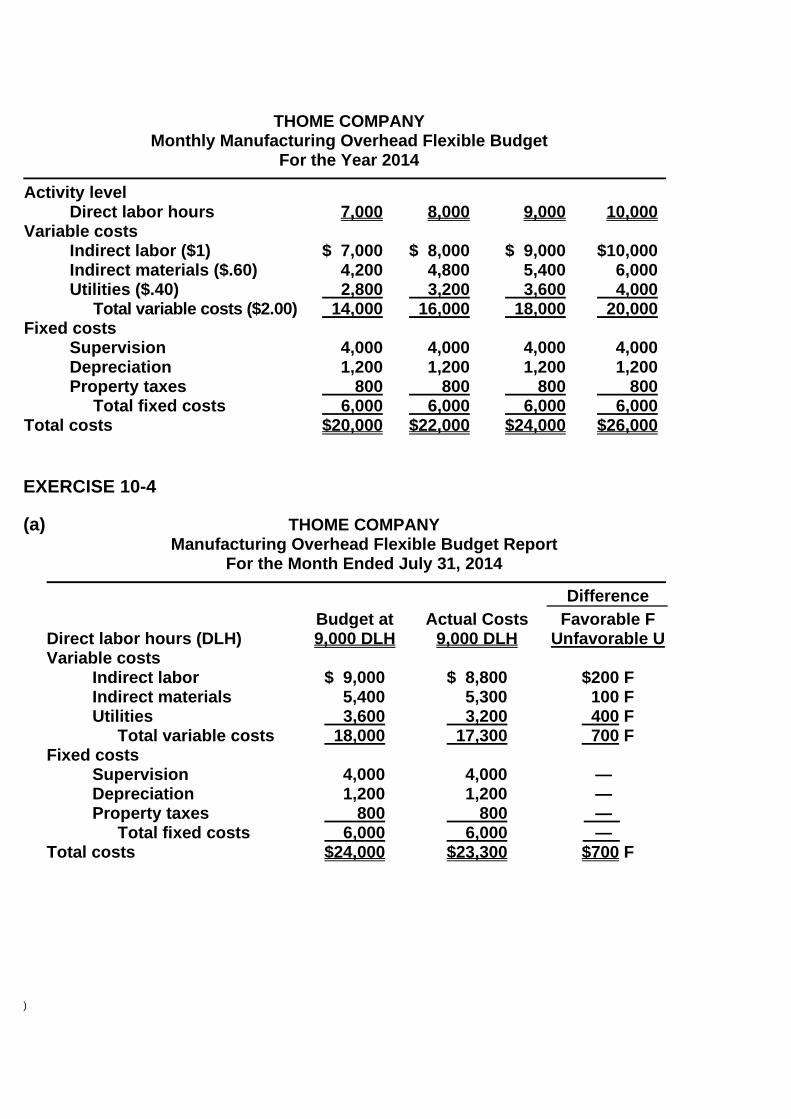
THOME COMPANY
Monthly Manufacturing Overhead Flexible Budget For the Year 2014
Activity level Direct labor hours Variable costs Indirect labor ($1) Indirect materials ($.60) Utilities ($.40) Total variable costs ($2.00) Fixed costs Supervision Depreciation Property taxes Total fixed costs Total costs
7,000
$ 7,000 4,200 2,800 14,000
4,000 1,200 800 6,000$20,000
8,000
$ 8,000 4,800 3,200 16,000
4,000 1,200 800 6,000 $22,000
9,000
$ 9,000 5,400 3,600 18,000
4,000 1,200 800 6,000 $24,000
10,000
$10,000 6,000 4,000 20,000
4,000 1,200 800 6,000 $26,000
EXERCISE 10-4 (a) THOME COMPANY Manufacturing Overhead Flexible Budget Report For the Month Ended July 31, 2014 Difference
Direct labor hours (DLH) Variable costs Indirect labor Indirect materials Utilities Total variable costs Fixed costs Supervision Depreciation Property taxes Total fixed costs Total costs
Budget at 9,000 DLH
$ 9,000 5,400 3,600 18,000
4,000 1,200 800 6,000 $24,000
Actual Costs9,000 DLH
$ 8,800 5,300 3,200 17,300
4,000 1,200 800 6,000 $23,300
Favorable F Unfavorable U
$200 F 100 F 400 F 700 F
— — — —
$700 F
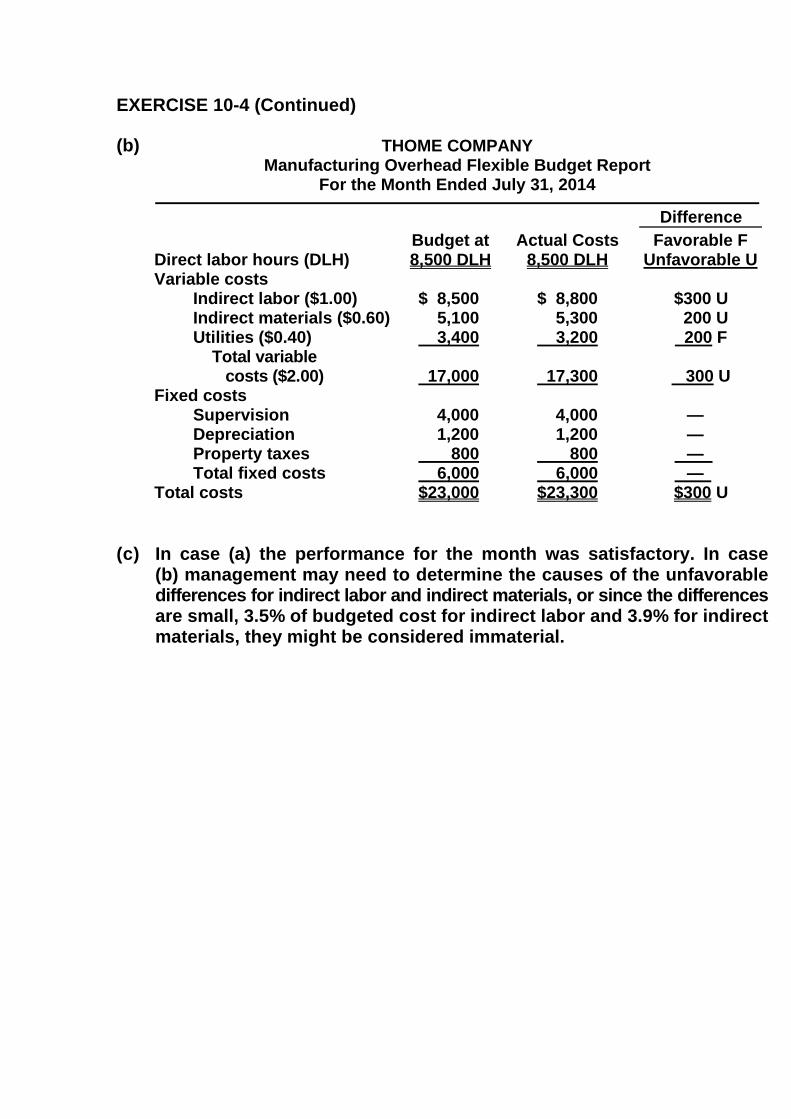
EXERCISE 10-4 (Continued) (b) THOME COMPANY Manufacturing Overhead Flexible Budget Report For the Month Ended July 31, 2014 Difference
Direct labor hours (DLH) Variable costs Indirect labor ($1.00) Indirect materials ($0.60) Utilities ($0.40) Total variable costs ($2.00) Fixed costs Supervision Depreciation Property taxes Total fixed costs Total costs
Budget at8,500 DLH
$ 8,500 5,100 3,400
17,000
4,000 1,200 800 6,000 $23,000
Actual Costs 8,500 DLH
$ 8,800 5,300 3,200
17,300
4,000 1,200 800 6,000 $23,300
Favorable F Unfavorable U
$300 U 200 U 200 F
300 U
— — — —
$300 U (c) In case (a) the performance for the month was satisfactory. In case
(b) management may need to determine the causes of the unfavorable differences for indirect labor and indirect materials, or since the differences are small, 3.5% of budgeted cost for indirect labor and 3.9% for indirect materials, they might be considered immaterial.
)
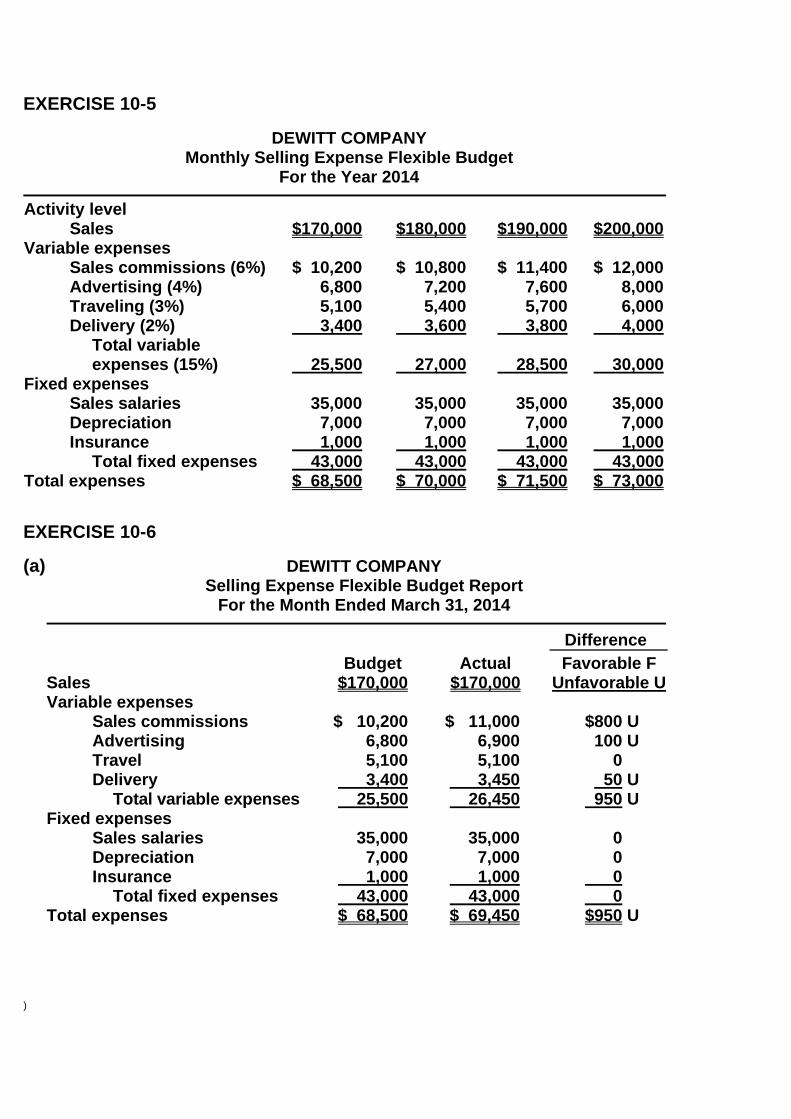
EXERCISE 10-5
DEWITT COMPANY Monthly Selling Expense Flexible Budget
For the Year 2014 Activity level Sales Variable expenses Sales commissions (6%) Advertising (4%) Traveling (3%) Delivery (2%) Total variable expenses (15%) Fixed expenses Sales salaries Depreciation Insurance Total fixed expenses Total expenses
$170,000
$ 10,200 6,800 5,100 3,400
25,500
35,000 7,000 1,000 43,000 $ 68,500
$180,000
$ 10,800 7,200 5,400 3,600
27,000
35,000 7,000 1,000 43,000 $ 70,000
$190,000
$ 11,400 7,600 5,700 3,800
28,500
35,000 7,000 1,000 43,000 $ 71,500
$200,000
$ 12,000 8,000 6,000 4,000
30,000
35,000 7,000 1,000 43,000$ 73,000
EXERCISE 10-6 (a) DEWITT COMPANY Selling Expense Flexible Budget Report For the Month Ended March 31, 2014 Difference
Sales Variable expenses Sales commissions Advertising Travel Delivery Total variable expenses Fixed expenses Sales salaries Depreciation Insurance Total fixed expenses Total expenses
Budget $170,000
$ 10,200 6,800 5,100 3,400 25,500
35,000 7,000 1,000 43,000 $ 68,500
Actual $170,000
$ 11,000 6,900 5,100 3,450 26,450
35,000 7,000 1,000 43,000 $ 69,450
Favorable F Unfavorable U
$800 U
100 U 0 U
50 U 950 U
0 U 0 U
0 U 0 U $950 U
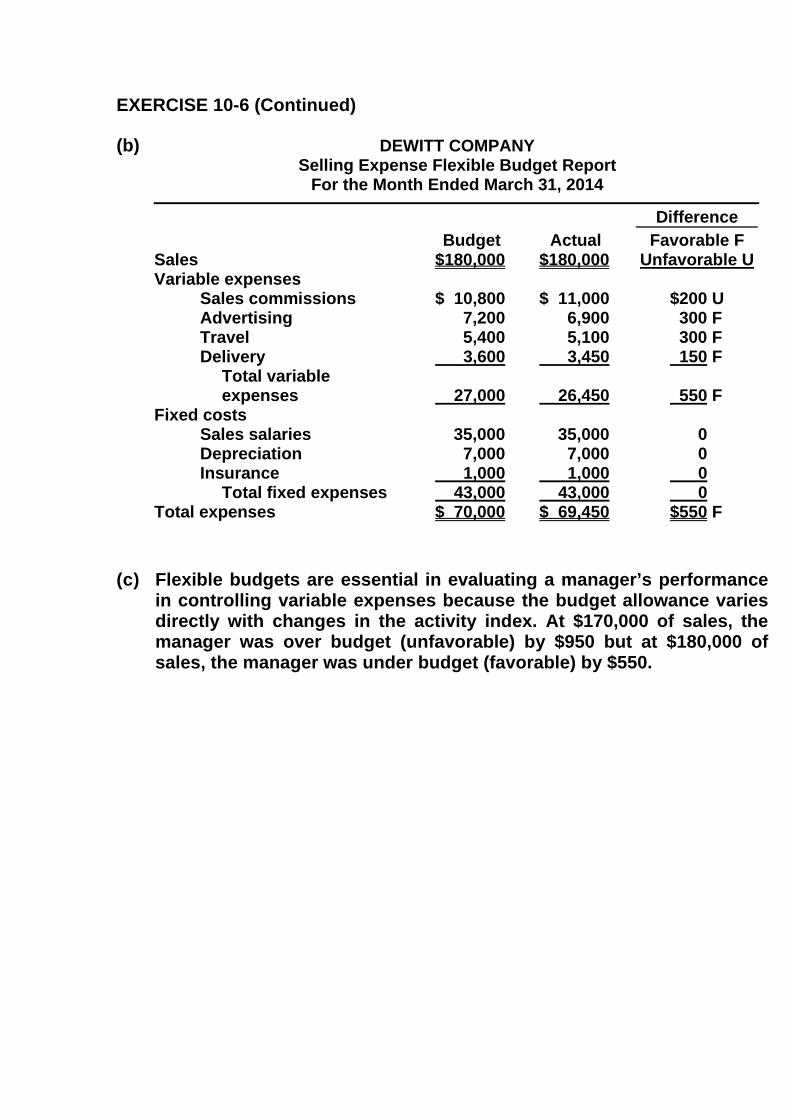
EXERCISE 10-6 (Continued) (b) DEWITT COMPANY Selling Expense Flexible Budget Report For the Month Ended March 31, 2014 Difference
Sales Variable expenses Sales commissions Advertising Travel Delivery Total variable expenses Fixed costs Sales salaries Depreciation Insurance Total fixed expenses Total expenses
Budget $180,000
$ 10,800 7,200 5,400 3,600
27,000
35,000 7,000 1,000 43,000 $ 70,000
Actual $180,000
$ 11,000 6,900 5,100 3,450
26,450
35,000 7,000 1,000 43,000 $ 69,450
Favorable F Unfavorable U
$200 U 300 F 300 F 150 F
550 F
0 U 0 U 0 U 0 U $550 F
(c) Flexible budgets are essential in evaluating a manager’s performance
in controlling variable expenses because the budget allowance varies directly with changes in the activity index. At $170,000 of sales, the manager was over budget (unfavorable) by $950 but at $180,000 of sales, the manager was under budget (favorable) by $550.
)
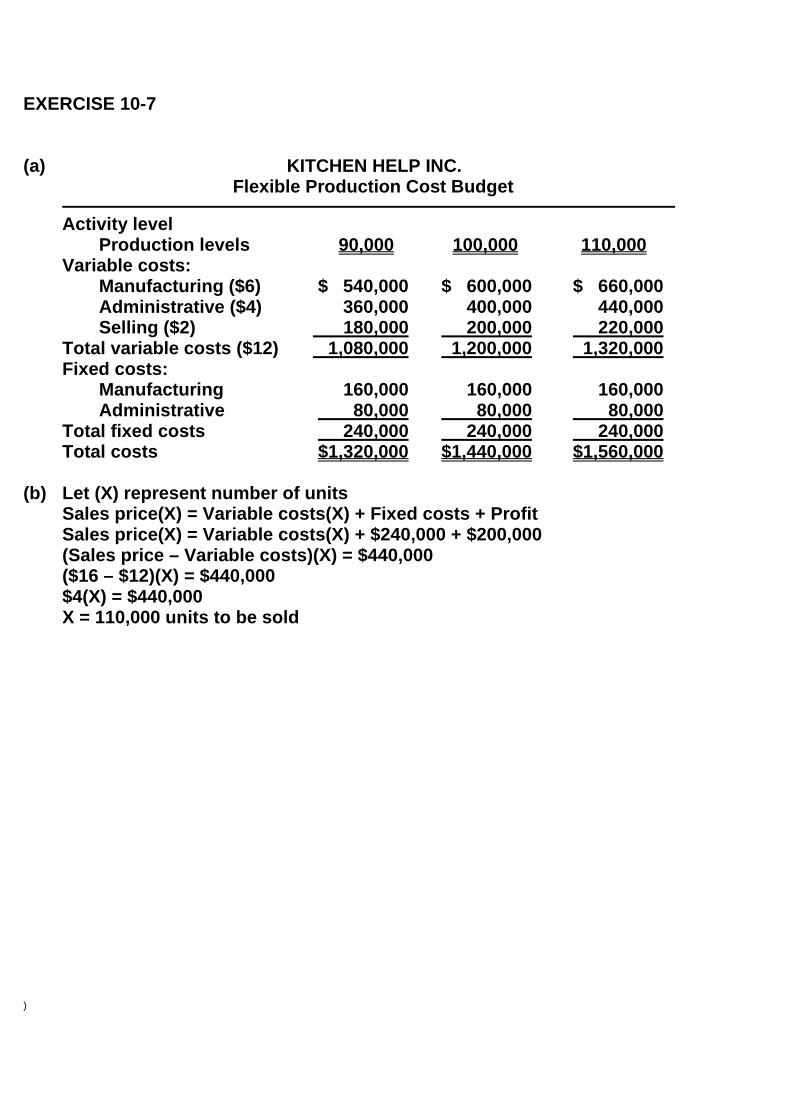
EXERCISE 10-7 (a) KITCHEN HELP INC. Flexible Production Cost Budget Activity level Production levels 90,000 100,000 110,000 Variable costs: Manufacturing ($6) $ 540,000 $ 600,000 $ 660,000 Administrative ($4) 360,000 400,000 440,000 Selling ($2) 180,000 200,000 220,000 Total variable costs ($12) 1,080,000 1,200,000 1,320,000 Fixed costs: Manufacturing 160,000 160,000 160,000 Administrative 80,000 80,000 80,000 Total fixed costs 240,000 240,000 240,000 Total costs $1,320,000 $1,440,000 $1,560,000 (b) Let (X) represent number of units Sales price(X) = Variable costs(X) + Fixed costs + Profit Sales price(X) = Variable costs(X) + $240,000 + $200,000 (Sales price – Variable costs)(X) = $440,000 ($16 – $12)(X) = $440,000 $4(X) = $440,000 X = 110,000 units to be sold

EXERCISE 10-8 (a) RENSING GROOMERS Flexible Budget Activity level Direct labor hours 550 600 700 Variable costs: Grooming supplies ($5) $ 2,750 $ 3,000 $ 3,500 Direct labor ($14) 7,700 8,400 9,800 Overhead ($1) 550 600 700 Total variable costs ($20) 11,000 12,000 14,000 Fixed costs: Overhead 10,000 10,000 10,000 Total fixed costs 10,000 10,000 10,000 Total costs $21,000 $22,000 $24,000 (b) A flexible budget presents expected costs at various levels of produc-
tion volume, not just one, so that comparisons can be made between actual costs and budgeted costs at the same volume. This allows the person to determine whether a difference between the actual results and budget is due to better or worse cost control than expected or due to achieving a different volume than that upon which the fixed budget was predicated.
(c) $21,000 ÷ 550 = $38.18 $22,000 ÷ 600 = $36.67 $24,000 ÷ 700 = $34.29 (d) Cost formula is $10,000 + $20(X), where (X) = direct labor hours Total cost = $10,000 + ($20 X 650) = $23,000. Number of clients = 650 hrs ÷ 1.30 hrs/client = 500 Cost per client = $23,000 ÷ 500 = $46.00 Charge per client = $46.00 X 1.40 = $64.40

)
EXERCISE 10-9 (a) LOWELL COMPANY Manufacturing Overhead Flexible Budget Report For the Quarter Ended March 31, 2014 Difference
Budget
Actual Favorable F
Unfavorable U Variable costs
Indirect materials Indirect labor Utilities Maintenance Total variable costs Fixed costs Supervisory salaries Depreciation Property taxes and insurance Maintenance Total fixed costs Total costs
$12,000 10,000 8,000 6,000 36,000
36,000 7,000
8,000 5,000 56,000 $92,000
$13,900 9,500 8,700 5,000 37,100
36,000 7,000
8,400 5,000 56,400$93,500
$1,900 U 500 F 700 U 1,000 F 1,100 U
0 U 0 U
400 U 0 U 400 U $1,500 U
(b) LOWELL COMPANY Manufacturing Overhead Responsibility Report For the Quarter Ended March 31, 2014 Difference
Controllable Costs
Budget
Actual Favorable F
Unfavorable U Indirect materials
Indirect labor Utilities Maintenance* Supervisory salaries
$12,000 10,000 8,000 11,000 36,000$77,000
$13,900 9,500 8,700 10,000 36,000$78,100
$1,900 U 500 F 700 U 1,000 F 0 U $1,100 U
*Includes variable and fixed costs

EXERCISE 10-10 (a) SORIA COMPANY Selling Expense Flexible Budget Report Clothing Department For the Month Ended October 31, 2014 Difference
Sales in units Variable expenses Sales commissions ($.30) Advertising expense ($.09) Travel expense ($.45) Free samples ($.20) Total variable expenses ($1.04) Fixed expenses Rent Sales salaries Office salaries Depreciation—sale staff autos Total fixed expenses Total expenses
Budget 10,000
$ 3,000 900 4,500 2,000
10,400
1,500 1,200 800 500 4,000 $14,400
Actual 10,000
$ 2,600 850 4,100 1,400
8,950
1,500 1,200 800 500 4,000 $12,950
Favorable F Unfavorable U
$ 400 F 50 F 400 F 600 F
1,450 F
0 U 0 U 0 U 0 0 U $1,450 F
(b) No, Joe should not have been reprimanded. As shown in the flexible
budget report, variable costs were $1,450 below budget.
)
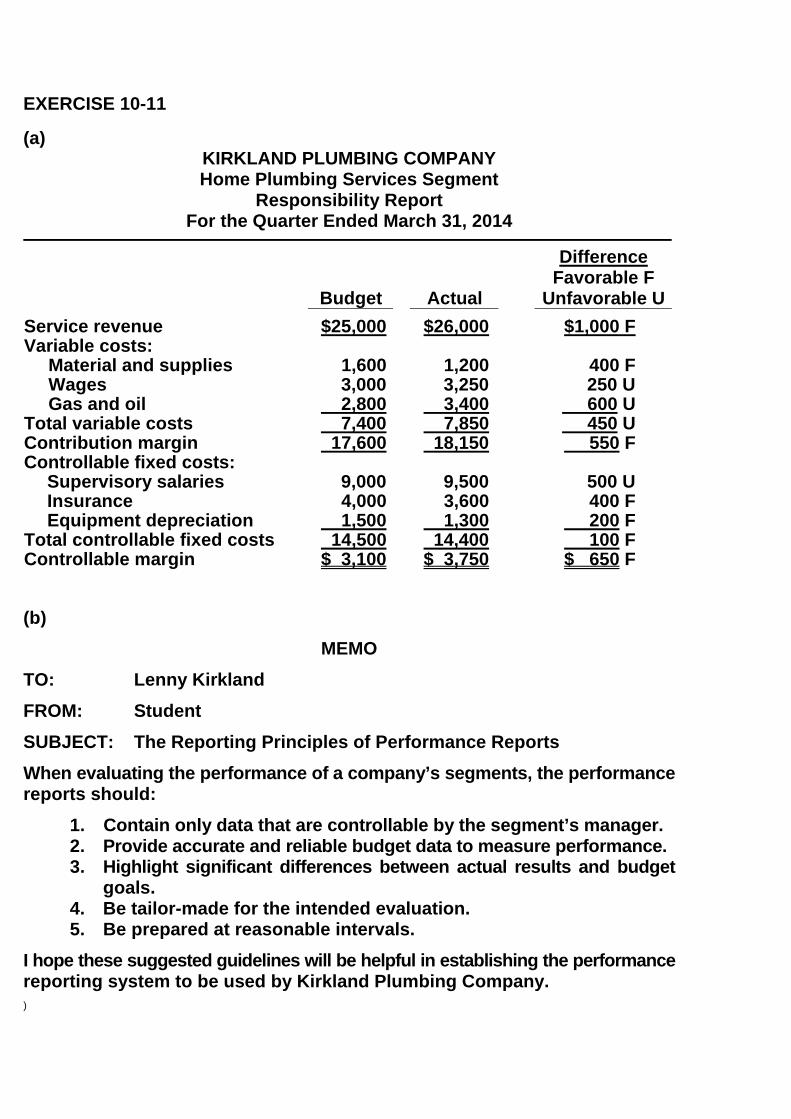
EXERCISE 10-11 (a)
KIRKLAND PLUMBING COMPANY Home Plumbing Services Segment
Responsibility Report For the Quarter Ended March 31, 2014
Budget Actual
Difference Favorable F
Unfavorable UService revenue $25,000 $26,000 $1,000 F Variable costs:
Material and supplies 1,600 1,200 400 F Wages 3,000 3,250 250 U Gas and oil 2,800 3,400 600 U
Total variable costs 7,400 7,850 450 U Contribution margin 17,600 18,150 550 F Controllable fixed costs:
Supervisory salaries 9,000 9,500 500 U Insurance 4,000 3,600 400 F Equipment depreciation 1,500 1,300 200 F
Total controllable fixed costs 14,500 14,400 100 F Controllable margin $ 3,100 $ 3,750 $ 650 F (b)
MEMO TO: Lenny Kirkland FROM: Student SUBJECT: The Reporting Principles of Performance Reports When evaluating the performance of a company’s segments, the performance reports should: 1. Contain only data that are controllable by the segment’s manager. 2. Provide accurate and reliable budget data to measure performance. 3. Highlight significant differences between actual results and budget
goals. 4. Be tailor-made for the intended evaluation. 5. Be prepared at reasonable intervals. I hope these suggested guidelines will be helpful in establishing the performance reporting system to be used by Kirkland Plumbing Company.

EXERCISE 10-12 (a) Fabricating Department = $50,000 fixed costs plus total variable costs
of $2.00 per direct labor hour [($150,000 – $50,000) ÷ 50,000].
Assembling Department = $40,000 fixed costs plus total variable costs
of $1.60 per direct labor hour [($120,000 – $40,000) ÷ 50,000].
(b) Fabricating Department = $50,000 + ($2.00 X 53,000) = $156,000. Assembling Department = $40,000 + ($1.60 X 47,000) = $115,200.
(c)
$300
Total Budgeted Cost Line
250
200
150
Budgeted Variable Costs
100
50
Cos
ts in
(000
)
Budgeted Fixed Costs
0 10 20 30 40 50 60 70 80 90 100 Direct Labor Hours in (000)
)
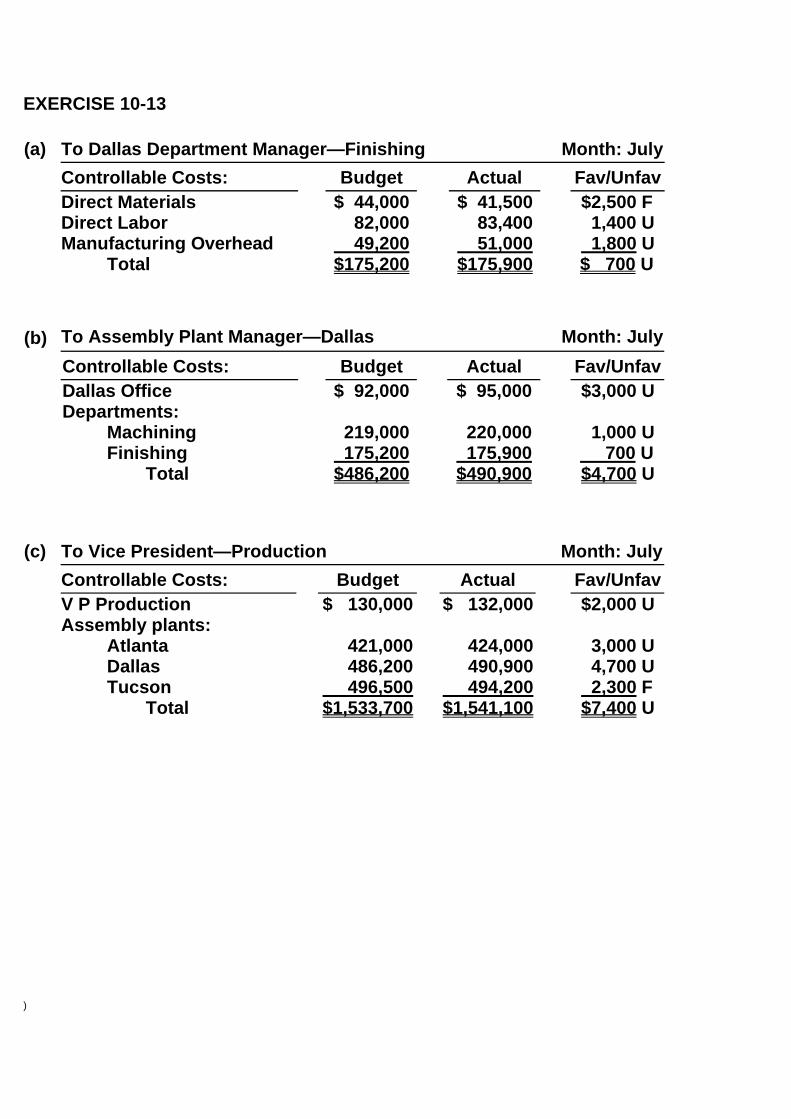
EXERCISE 10-13 (a) To Dallas Department Manager—Finishing Month: July Controllable Costs: Budget Actual Fav/Unfav Direct Materials
Direct Labor Manufacturing Overhead Total
$ 44,000 82,000 49,200$175,200
$ 41,500 83,400 51,000$175,900
$2,500 F 1,400 U 1,800 U $ 700 U
(b) To Assembly Plant Manager—Dallas Month: July Controllable Costs: Budget Actual Fav/Unfav Dallas Office
Departments: Machining Finishing Total
$ 92,000
219,000 175,200$486,200
$ 95,000
220,000 175,900$490,900
$3,000 U
1,000 U 700 U $4,700 U
(c) To Vice President—Production Month: July Controllable Costs: Budget Actual Fav/Unfav V P Production
Assembly plants: Atlanta Dallas Tucson Total
$ 130,000
421,000 486,200 496,500$1,533,700
$ 132,000
424,000 490,900 494,200$1,541,100
$2,000 U
3,000 U 4,700 U 2,300 F $7,400 U
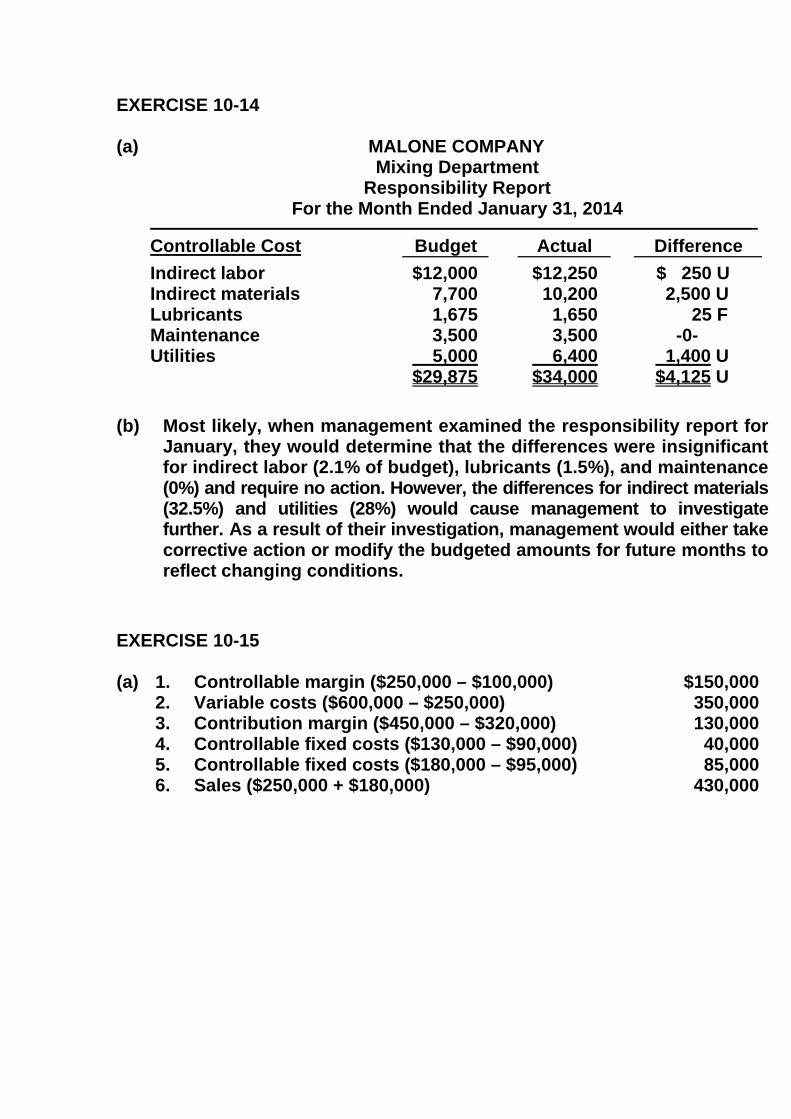
EXERCISE 10-14 (a) MALONE COMPANY Mixing Department Responsibility Report For the Month Ended January 31, 2014 Controllable Cost Budget Actual Difference Indirect labor
Indirect materials Lubricants Maintenance Utilities
$12,000 7,700 1,675 3,500
5,000 $29,875
$12,250 10,200
1,650 3,500 6,400 $34,000
$ 250 UU 2,500 U 25 F -0- 1,400 U $4,125 U
(b) Most likely, when management examined the responsibility report for
January, they would determine that the differences were insignificant for indirect labor (2.1% of budget), lubricants (1.5%), and maintenance (0%) and require no action. However, the differences for indirect materials (32.5%) and utilities (28%) would cause management to investigate further. As a result of their investigation, management would either take corrective action or modify the budgeted amounts for future months to reflect changing conditions.
EXERCISE 10-15 (a) 1. Controllable margin ($250,000 – $100,000) $150,000 2. Variable costs ($600,000 – $250,000) 350,000 3. Contribution margin ($450,000 – $320,000) 130,000 4. Controllable fixed costs ($130,000 – $90,000) 40,000 5. Controllable fixed costs ($180,000 – $95,000) 85,000 6. Sales ($250,000 + $180,000) 430,000

)
EXERCISE 10-15 (Continued) (b) DEITZ INC. Women’s Shoe Division Responsibility Report For the Month Ended June 30, 2014 Difference
Budget
Actual Favorable F
Unfavorable U Sales
Variable costs Contribution margin Controllable fixed costs Controllable margin
$600,000 340,000 260,000 100,000$160,000
$600,000 350,000 250,000 100,000$150,000
$ 0 U 10,000 U 10,000 U 0 U $10,000 U
EXERCISE 10-16 (a) HARRINGTON COMPANY Sports Equipment Division Responsibility Report 2014 Budget Actual Difference Sales $900,000 $880,000 $20,000 U Variable costs
Cost of goods sold 440,000 408,000 32,000 F Selling and administrative 60,000 61,000 1,000 U Total 500,000 469,000 31,000 F
Contribution margin 400,000 411,000 11,000 F Controllable fixed costs
Cost of goods sold 100,000 105,000 5,000 U Selling and administrative 90,000 66,000 24,000 F
Total 190,000 171,000 19,000 F Controllable margin $210,000 $240,000 $30,000 F (b) ($240,000 – $90,000)/$1,000,000 = 15%

EXERCISE 10-17 (a) Controllable margin = ($3,000,000 – $1,980,000 – $600,000) = $420,000 ROI = $420,000 ÷ $5,000,000 = 8.4% (b) 1. Contribution margin percentage is 34%, or ($1,020,000 ÷ $3,000,000) Increase in controllable margin = $320,000 X 34% = $108,800 ROI = ($420,000 + $108,800) ÷ $5,000,000 = 10.6% 2. ($420,000 + $150,000) ÷ $5,000,000 = 11.4% 3. $420,000 ÷ ($5,000,000 – $200,000) = 8.75% EXERCISE 10-18 (a)
DINKLE AND FRIZELL DENTAL CLINIC Preventive Services
Responsibility Report For the Month Ended May 31, 2014
Budget Actual
Difference Favorable F
Unfavorable UService revenue $39,000 $40,000 $1,000 F Variable costs
Filling materials 4,900 5,000 100 U Novocain 3,800 3,900 100 U Dental assistant wages 2,500 2,500 0 Supplies 2,250 1,900 350 F Utilities 390 500 110 U
Total variable costs 13,840 13,800 40 F Contribution margin 25,160 26,200 1,040 F Controllable fixed costs
Dentist salary 9,400 9,800 400 U Equipment depreciation 6,000 6,000 0
Total controllable fixed costs 15,400 15,800 400 U Controllable margin $ 9,760 $10,400 $ 640 F Return on investment* 12.2% 13.0% 0.8% F *Average investment = ($82,400 + $77,600) ÷ 2 = $80,000 Budget ROI = $9,760 ÷ $80,000 Actual ROI = $10,400 ÷ $80,000 ROI Difference = $640 ÷ $80,000

)
EXERCISE 10-18 (Continued) (b)
MEMO TO: Drs. Reese Dinkle and Anita Frizell FROM: Student SUBJECT: Deficiencies in the Current Responsibility Reporting System The current reporting system has the following deficiencies:
1. It does not clearly show both budgeted goals and actual performance. 2. It does not indicate the contribution margin generated by the center,
showing the amount available to go towards covering controllable fixed costs.
3. It does not report only those costs controllable by the manager of the center. Instead, it includes both controllable and common fixed costs. This results in the center appearing to be unprofitable.
4. It does not indicate the return on investment earned by the center. All of these deficiencies have been addressed in the recommended responsibility report attached. As can be seen from that report, the Preventive Services center is profitable. The service revenues generated in this center are adequate to cover all of its costs, both variable and controllable fixed costs, and con-tribute toward the covering of the clinic’s common fixed costs. In addition, the report indicates the return on investment earned by the center and that it exceeds the budget goal.

EXERCISE 10-19 Planes: ROI = Controllable margin ÷ Average operating assets 13% = Controllable margin ÷ $25,000,000 Controllable margin = $25,000,000 X 13% = $3,250,000 Contribution margin = Controllable margin + Controllable fixed costs = $3,250,000 + $1,500,000 = $4,750,000 Service revenue = Contribution margin + Variable costs = $4,750,000 + $5,500,000 = $10,250,000 Taxis: ROI = Controllable margin ÷ Average operating assets 10% = $80,000 ÷ Average operating assets Average operating assets = $80,000 ÷ 10% = $800,000
Controllable margin = Contribution margin – Controllable fixed costs $80,000 = $250,000 – Controllable fixed costs Controllable fixed costs = $250,000 – $80,000 = $170,000
Contribution margin = Service revenue – Variable costs $250,000 = $500,000 – Variable costs Variable costs = $500,000 – $250,000 = $250,000

)
EXERCISE 10-19 (Continued) Limos: ROI = Controllable margin ÷ Average operating assets = $240,000 ÷ $1,500,000 = 16% Controllable margin = Contribution margin – Controllable fixed costs $240,000 = $480,000 – Controllable fixed costs Controllable fixed costs = $480,000 – $240,000 = $240,000
Contribution margin = Service revenue – Variable costs $480,000 = Service revenue – $300,000 Sales = =
$480,000 + $300,000 $780,000
*EXERCISE 10-20 (a) North Division: ROI = $140,000 ÷ $1,000,000 = 14% West Division: ROI = $360,000 ÷ $2,000,000 = 18% South Division: ROI = $210,000 ÷ $1,500,000 = 14% (b) North Division: Residual Income = $140,000 – (.13 X $1,000,000) = $10,000 West Division: Residual Income = $360,000 – (.16 X $2,000,000) = $40,000 South Division: Residual Income = $210,000 – (.10 X $1,500,000) = $60,000

*EXERCISE 10-20 (Continued) (c) 1. If ROI is used to measure performance, only the North Division
(with a 14% ROI) and the South Division (with a 14% ROI) would make the additional investment that provides a 16% ROI. The West Division presently earns an 18% return ($360,000 ÷ $2,000,000), and therefore would decline the investment.
2. If residual income is used to measure performance, all three divi-sions would probably make the additional investment because each would realize an increase in residual income.
*EXERCISE 10-21 (a) ROI = Controllable margin ÷ Average operating assets 20% = $200,000 ÷ Average operating assets Average operating assets = $1,000,000
(b) Controllable margin – (Minimum rate of return X Average operating assets) = Residual income $200,000 – (Minimum rate of return X $1,000,000) = $100,000 $100,000 = Minimum rate of return X $1,000,000 Minimum rate of return = 10%
(c) Controllable margin – (Minimum rate of return X Average operating assets) = Residual income Controllable margin – (13% X $1,200,000) = $204,000 Controllable margin = $360,000
(d) ROI = Controllable margin ÷ Average operating assets 30% = $360,000 ÷ $1,200,000
)
SOLUTIONS TO PROBLEMS
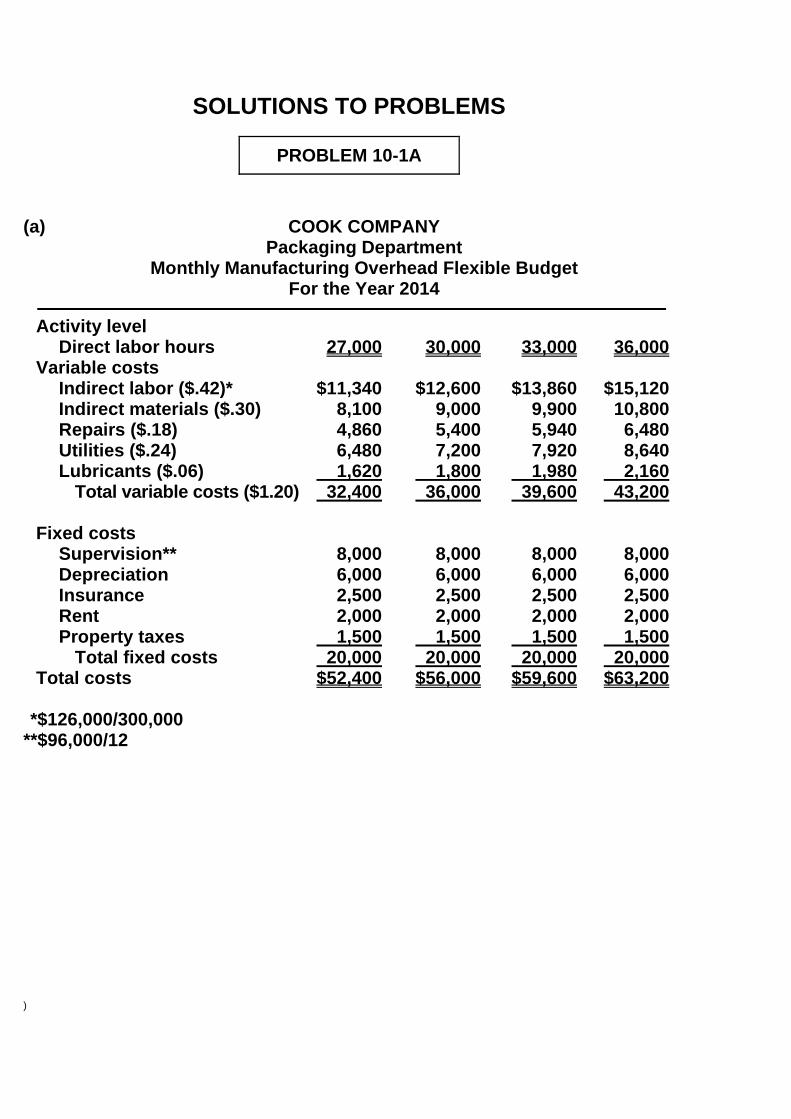
PROBLEM 10-1A (a) COOK COMPANY Packaging Department Monthly Manufacturing Overhead Flexible Budget For the Year 2014 Activity level
Direct labor hours Variable costs Indirect labor ($.42)* Indirect materials ($.30) Repairs ($.18) Utilities ($.24) Lubricants ($.06) Total variable costs ($1.20) Fixed costs Supervision** Depreciation Insurance Rent Property taxes Total fixed costs Total costs
27,000
$11,340 8,100 4,860 6,480 1,620 32,400
8,000 6,000 2,500 2,000 1,500 20,000$52,400
30,000
$12,600 9,000 5,400 7,200 1,800 36,000
8,000 6,000 2,500 2,000 1,500 20,000$56,000
33,000
$13,860 9,900 5,940 7,920 1,980 39,600
8,000 6,000 2,500 2,000 1,500 20,000 $59,600
36,000
$15,120 10,800 6,480 8,640 2,160 43,200
8,000 6,000 2,500 2,000 1,500 20,000 $63,200
*$126,000/300,000
**$96,000/12
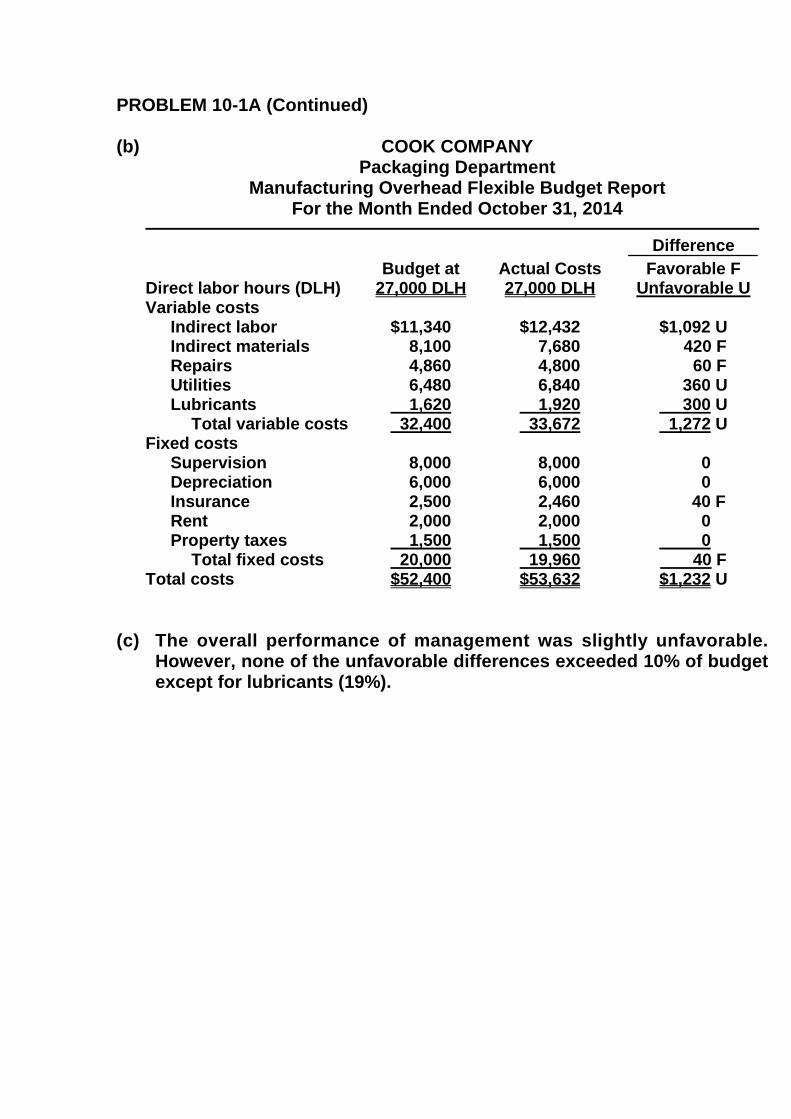
PROBLEM 10-1A (Continued) (b) COOK COMPANY Packaging Department Manufacturing Overhead Flexible Budget Report For the Month Ended October 31, 2014 Difference
Direct labor hours (DLH) Variable costs Indirect labor Indirect materials Repairs Utilities Lubricants Total variable costsFixed costs Supervision Depreciation Insurance Rent Property taxes Total fixed costs Total costs
Budget at 27,000 DLH
$11,340 8,100 4,860 6,480 1,620 32,400
8,000 6,000 2,500 2,000 1,500 20,000 $52,400
Actual Costs 27,000 DLH
$12,432 7,680 4,800 6,840 1,920 33,672
8,000 6,000 2,460 2,000 1,500 19,960 $53,632
Favorable F Unfavorable U
$1,092 U 420 F 60 F 360 U 300 U 1,272 U
0 U 0 U 40 F 0 U 0 U 40 F $1,232 U
(c) The overall performance of management was slightly unfavorable.
However, none of the unfavorable differences exceeded 10% of budget except for lubricants (19%).
)
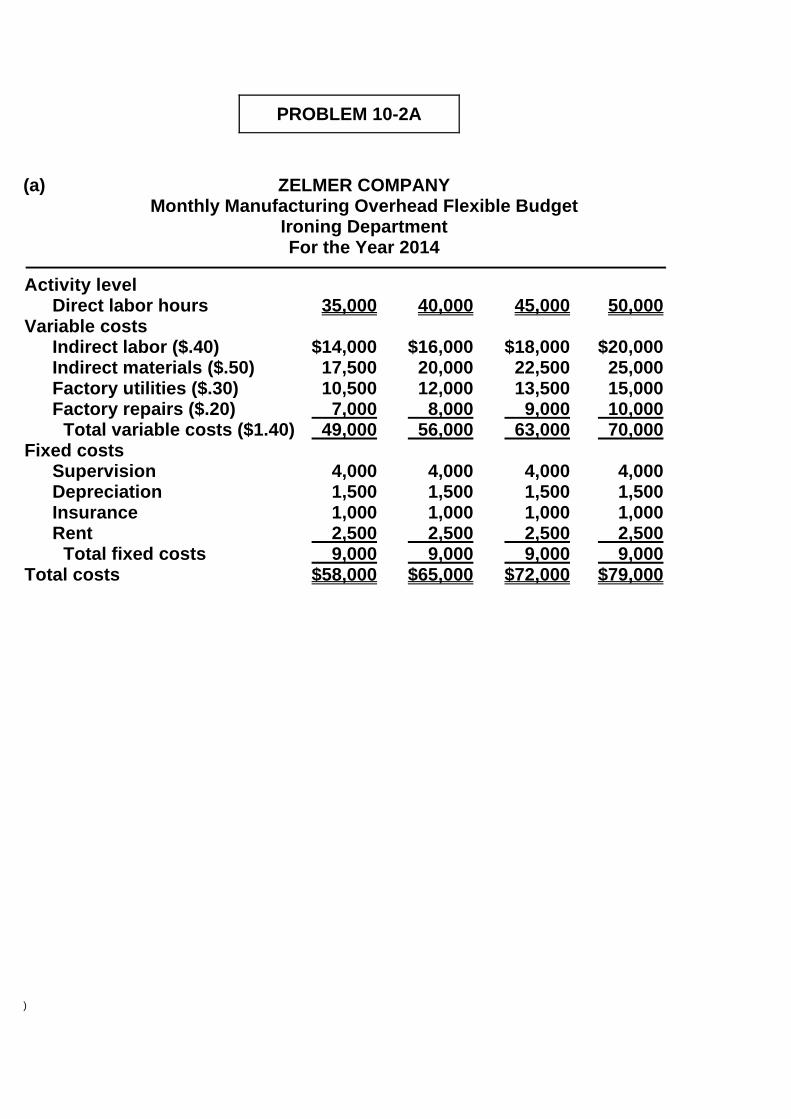
PROBLEM 10-2A (a) ZELMER COMPANY Monthly Manufacturing Overhead Flexible Budget Ironing Department For the Year 2014 Activity level Direct labor hours Variable costs Indirect labor ($.40) Indirect materials ($.50) Factory utilities ($.30) Factory repairs ($.20) Total variable costs ($1.40) Fixed costs Supervision Depreciation Insurance Rent Total fixed costs Total costs
35,000
$14,000 17,500 10,500 7,000 49,000
4,000 1,500 1,000 2,500 9,000$58,000
40,000
$16,000 20,000 12,000 8,000 56,000
4,000 1,500 1,000 2,500 9,000$65,000
45,000
$18,000 22,500 13,500 9,000 63,000
4,000 1,500 1,000 2,500 9,000 $72,000
50,000
$20,000 25,000 15,000 10,000 70,000
4,000 1,500 1,000 2,500 9,000 $79,000

PROBLEM 10-2A (Continued) (b) ZELMER COMPANY Ironing Department Manufacturing Overhead Flexible Budget Report For the Month Ended June 30, 2014 Difference
Direct labor hours (DLH)Variable costs Indirect labor Indirect materials Factory utilities Factory repairs Total variable costsFixed costs Supervision* Depreciation Insurance Rent Total fixed costs Total costs
Budget at 41,000 DLH
$16,400 (1) 20,500 (2) 12,300 (3) 8,200 (4) 57,400
4,000 1,500 1,000 2,500 9,000 $66,400
Actual Costs 41,000 DLH
$18,040 (5) 19,680 (6) 13,120 (7) 10,250 (8) 61,090
4,000 1,500 1,000 2,500 9,000 $70,090
Favorable F Unfavorable U
$1,640 U 820 F 820 U 2,050 U 3,690 U
0 U 0 U 0 U 0 U 0 U $3,690 U
(1) 41,000 X $0.40 (2) 41,000 X $0.50 (3) 41,000 X $0.30 (4) 41,000 X $0.20 (5) 41,000 X $0.44 (6) 41,000 X $0.48 (7) 41,000 X $0.32 (8) 41,000 X $0.25
*$48,000/12 (c) The manager was ineffective in controlling variable costs ($3,690 U).
Fixed costs were effectively controlled. (d) The formula is fixed costs of $9,000 plus total variable costs of $1.40 per
direct labor hour.

)
PROBLEM 10-2A (Continued) (e) $80
Total Budgeted Cost Line
70 60 50 40
Budgeted Variable Costs
30 20 10
Cos
ts in
(000
)
5 10 15 20 25 30 35 40 45 50
Budgeted Fixed Costs
Direct Labor Hours in (000)

PROBLEM 10-3A (a) The formula is fixed costs $35,000 plus variable costs of $2.75 per unit
($165,000 ÷ 60,000 units). (b) HILL COMPANY Assembling Department Flexible Budget Report For the Month Ended August 31, 2014
Difference
Units Variable costs* Direct materials ($.80 X 58,000) Direct labor ($.90 X 58,000) Indirect materials ($.40 X 58,000) Indirect labor ($.30 X 58,000) Utilities ($.25 X 58,000) Maintenance ($.10 X 58,000) Total variable ($2.75 X 58,000)Fixed costs Rent Supervision Depreciation Total fixed Total costs
Budget at 58,000 Units
$ 46,400 52,200 23,200 17,400 14,500 5,800 159,500
12,000 17,000 6,000 35,000 $194,500
Actual Costs 58,000 Units
$ 47,000 51,200 24,200 17,500 14,900 6,200 161,000
12,000 17,000 6,000 35,000 $196,000
Favorable F Unfavorable U
$ 600 U 1,000 F 1,000 U 100 U 400 U 400 U 1,500 U
0 U 0 U 0 U 0 U $1,500 U
*Note that the per unit variable costs are computed by taking the
budget amount at 60,000 units and dividing it by 60,000. For example, direct materials per unit is therefore $0.80 or $48,000
60,000.
This report provides a better basis for evaluating performance because the budget is based on the level of activity actually achieved. The manager should be criticized because every variable cost was over budget except for direct labor.
)
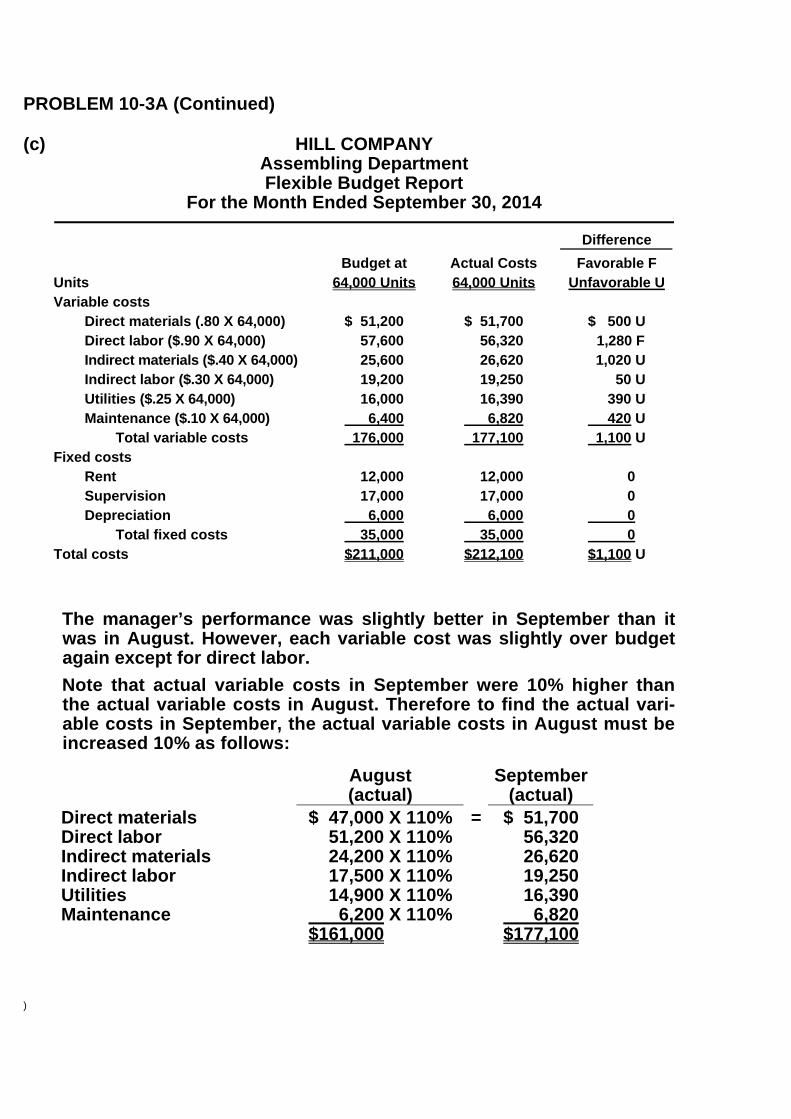
PROBLEM 10-3A (Continued) (c) HILL COMPANY Assembling Department Flexible Budget Report For the Month Ended September 30, 2014 Difference
Units Variable costs Direct materials (.80 X 64,000) Direct labor ($.90 X 64,000) Indirect materials ($.40 X 64,000) Indirect labor ($.30 X 64,000) Utilities ($.25 X 64,000) Maintenance ($.10 X 64,000) Total variable costs Fixed costs Rent Supervision Depreciation Total fixed costs Total costs
Budget at 64,000 Units
$ 51,200 57,600 25,600 19,200 16,000 6,400 176,000
12,000 17,000 6,000 35,000 $211,000
Actual Costs 64,000 Units
$ 51,700 56,320 26,620 19,250 16,390 6,820 177,100
12,000 17,000 6,000 35,000 $212,100
Favorable F Unfavorable U
$ 500 U 1,280 F 1,020 U 50 U 390 U 420 U 1,100 U
0U 0U 0U 0U $1,100 U
The manager’s performance was slightly better in September than it
was in August. However, each variable cost was slightly over budget again except for direct labor.
Note that actual variable costs in September were 10% higher than the actual variable costs in August. Therefore to find the actual vari-able costs in September, the actual variable costs in August must be increased 10% as follows:
August (actual)
September (actual)
Direct materials
Direct labor Indirect materials Indirect labor Utilities Maintenance
$ 47,000 X 110% 51,200 X 110% 24,200 X 110% 17,500 X 110% 14,900 X 110% 6,200 X 110% $161,000 X 80%
= $ 51,700 56,320 26,620 19,250 16,390 6,820 $177,100