solutions to questions on hypothesis testing and … · 7. a random sample of 1,562 undergraduates...
TRANSCRIPT

Solutions to Questions on Hypothesis Testing and Regression
1. A mileage test is conducted for a new car model, the “Pizzazz.” Thirty (n=30) random selected Pizzazzes are driven for a month and the mileage is carefully measured in each. The mean mileage for the sample is 28.6 miles per gallon (mpg) and the sample standard deviation is 2.2 mpg. Estimate a 95% confidence interval for the mean mpg in the entire population of Pizzazzes (you might need to round your answer a little bit to agree with mine).
(a) (23.42, 33.84) (b) (27.81, 29.39) (c) (26.82, 30.47) (d) (27.23, 30.03) (e) None of the above
2. Determine the test statistic for testing the null hypothesis that the population mean is 27
mpg ( 0 : 27 : 27aH Hµ µ= ≠ )
(a) t = 3.98 (b) t = -3.98 (c) t = 4.6 (d) t = -4.6 (e) t = 1.96 (f) None of the above
3. A Type II error is made when
a. the null hypothesis is accepted when it is false. b. the null hypothesis is rejected when it is true. c. the alternate hypothesis is accepted when it is false. d. the null hypothesis is accepted when it is true. e. the alternate hypothesis is accepted when it is true.

4. A recent USA TODAY/CNN/Gallup Poll showed that most American people support Bush’s efforts in the Middle East peace process. The poll of 2000 adults was conducted and 1243 people said they supported Bush’s efforts.
a) Find a 95% confidence interval for p, the fraction of Americans who support Bush’s efforts phat = 1243/2000 =62.15% then use the CI formula for a proportion b) Perform the hypothesis test Ho : p = 0.6 versus Ha : p > 0.6.
−
=
= =.6215 .60
(.6)(.4) / 2000
ˆ 62.15%
1.52
p
t
We reject the null hypothesis if T > 1.64 and since its not, we fail to reject the null hypothesis.
5. A random sample of 100 voters in a community produced 59 voters in favor of candidate
A. The observed value of the test statistic for testing the null hypothesis : 0.5oH p =
versus the alternative hypothesis : 0.5aH p ≠ is:
a) 1.80 b) 1.90 c) 1.83 d) 1.28 e) 1.75
6. Paul’s housemate Miranda is trying to convince Paul to get a piercing. Paul is very
sensitive to popular opinion, however, and will only get one if ”everyone else is doing it”. Of course, everyone is unrealistic, so Paul will settle on getting the piercing if Miranda can show that more than 60% of people at Harvard have one. Miranda wastes no time in
taking a sample of 60 people from Adam’s House and performing the appropriate hypothesis test. Her sample revealed 44 people who admitted to having a piercing.
(a) Test the hypothesis 0 : 0.6H p = versus : 0.6aH p > Will Paul end up getting a
piercing ?
−
= =
= =.73 .60
(.6)(.4) / 60
44ˆ 73%
60
2.05
p
t
Since t > 1.64 we reject the null and conclude that more than 60% of students have piercings.
(b) Do you have any criticisms of Miranda’s sample ?
The people sampled were all from Adam’s House so its not clear that we can extend our results to all the Harvard students.

7. A random sample of 1,562 undergraduates enrolled in marketing courses was asked to respond on a scale from one (strongly disagree) to seven (strongly agree) to the proposition: "Advertising helps raise our standard of living." The sample mean response was 4.27 and the sample standard deviation was 1.32. Test the following hypothesis
H0: µ = 4
HA: µ ≠ 4
Create Decision Rule:
Reject H0 if -1.96 > t, or 1.96 < t
Calculate Test Statistic:
T 1562321
4274
/.
. −=
08.8=
Decision:
Reject H0

8. Of a sample of 361 owners of retail service and business firms that had gone into bankruptcy, 105 reported having no professional assistance prior to opening the business. Test the null hypothesis that at most 25% of all members of this population had no professional assistance before opening the business:
H0: p = 0.25 HA: p > 0.25
Formulate Hypotheses:
H0: p = 0.25 HA: p > 0.25
Create Decision Rule:
Reject H0 if t > 1.64,
Calculate Test Statistic:
t
( )( )361
75.025.0
25.02909.0 −=
79.1=
Decision:
Reject H0.

9. The manager at Costello Drug Store assumes the company’s employees are honest. However, there have been many shortages from the cash register lately. There is only one employee who could have taken money from the register during these periods. Realizing that the shortages might have resulted from the employee inadvertently giving incorrect change to customers, the employer does not know whether to forget the situation or accuse the employee of theft. In words, what are the null and alternative hypotheses? Explain your choices.
(a) What constitutes a Type I error in this problem?
(b) What is a Type II error? Which do you think is more serious? Explain.
Solution: (a) In this problem we are asked to state, in English, the null hypothesis for an hypothesis test about whether an employee stole money from a cash register. Obviously, the two alternatives are (1) that the employee is innocent, and (2) that the employee is guilty. The key to this problem is the statement that the manager “assumes the company’s employees are honest.” This is the manager’s default position–the status quo if you like. The manager will not believe guilt unless presented with convincing evidence. Because of this, the null hypothesis is that the employee is innocent. The null hypothesis is usually the default position, the status quo, the situation that nothing interesting or important has happened. Here, theft would represent the interesting or important occurrence. Therefore, guilt is the alternative hypothesis. It may be tempting to argue that the manager wants to “prove” the employee innocent, and that therefore this should be the alternative, and theft the null. That is not correct. The manager does not have to prove innocence–it is his default position which someone else would have to provide strong evidence to change. In general, in the American legal system, innocence is the null hypothesis and the burden of proof lies with the prosecutor. (b) and (c): A Type I error occurs if you reject the null hypothesis when the null hypothesis is in fact true. Here a Type I error would be to conclude that the employee is guilty when he is actually innocent. A Type II error occurs if you fail to reject the null hypothesis when the null hypothesis is false. In this case, a Type II error would be to conclude the employee is innocent when he is in fact guilty. In our legal system it is considered worse to convict an innocent person than to let a guilty person go free. After all, if the employee is guilty all the manager risks is losing a bit more money if he keeps him longer–and he can always fire him later. However firing an innocent person for theft could do serious damage! Therefore, I believe a Type I error is more serious in this problem.

10. A new internet provider claims that using their system you can get transmission speeds of 400 kilobits per second.
(i) Specify, both mathematically and in English, the null and alternative hypotheses a potential customer should investigate if she is worried that the connection is really slower than advertised. Explain your reasoning. (ii) The system is tested on a sample of one hundred computers and the average connection speed is found to be far below 400 kilobits. What hypothesis should probably be rejected? Explain. If the customer needs a connection speed of 400 kilobits to run her application programs, what is the business decision that corresponds to the decision regarding the hypotheses? (iii) How would your answers to (i) if you were looking at the problem from the internet provider’s point of view and wanted to prove to potential customers that your system was good? Solution: (a) (i) In this problem our alternatives are (1) that the company’s connection speed is as advertised, that is that it has a mean, µ, of 400 kilobits per second or higher and (2) that the company’s connection speed is slower than the advertised 400 kilobits per second.
The correct null hypothesis for (i) is H0 : µ ≥ 400 or H0 µ = 400, and the alternative is
HA: µ < 400 You could try to make an argument that a customer would want to prove to themselves that a product was good before buying it but I think this is somewhat weak–the burden is really on the company to convince the consumer to by their product and not someone else’s. (ii) If the sample mean is far below 400 kilobits per second, then customer should reject the null hypothesis that the mean speed is above 400 kilobits and accept the alternative hypothesis, namely that the connection speed is lower than advertised. In this situation, the customer will probably not want to purchase the service. (iii) when the question asked what the null and alternative hypotheses would be from the company’s point of view, the roles would be reversed. In general, a company wants to prove that its product is good (or poses no dangers) whereas a consumer or a consumer’s advocate (such as a government investigator) tries to prove that there is a problem with the product. So, null hypothesis will be Ho: µ = 400, and the alternative is Ha: µ > 400
11. Hamburger Heaven has just found out that one of it’s customers has become ill after eating a burger infected with E. Coli. They are concerned that a whole shipment of meat may have been spoiled and decide to test several randomly selected packages of patties.
(i) What should be Hamburger Heaven’s null hypothesis? Explain briefly. (ii) Explain in English what the type I and type II errors for this problem would
be. Would the company want a small α (type I error) or a small β (type II
error), if it had to choose one or the other? Explain.
Solution: (i) This is one of those confusing situations where you could argue the hypotheses either way. We will accept it both ways as long as you give logical reasoning. Suppose I am the owner of the chain and it has just been announced in the news that people are getting sick at my restaurant. What will happen? I will lose lots of business UNLESS I CAN PROVE TO PROSPECTIVE CUSTOMERS THAT THE REMAINING MEAT IS SAFE. The thing I want to prove is my alternative–namely that the meat is not contaminated. My null hypothesis must be that the meat is contaminated. Another way of saying this is that I prefer to play it safe and not risk serving the meat until I am sure it is OK–I assume the worst and try to prove the best. Of course, if I were a consumer advocate, I might think that the most important thing was to discover the contamination if it exists, thereby reversing the hypotheses. Somebody can also argue that the default position is that nothing has happened and meat is OK as that is what we assume to start with. Thus in this case you can argue it both ways and it depends what is your goal in conducting the hypothesis test. (ii) A type I error occurs if you reject the null hypothesis when the null hypothesis is true. In this problem the null hypothesis is that the meat is contaminated. Therefore a type I error would consist of deciding that the hamburger is not contaminated when in fact it is. A type II error occurs if you fail to reject the null hypothesis when the null hypothesis is false. In this example you would make a type II error if you decided that the hamburger was contaminated when in fact it was not. The probability of a type I error is _ and the probability of a type II error is _. In this problem it is much more serious to make a type I error than a type II error. If we make a type I error, contaminated burgers will be sold, many more people will get sick, and Hamburger Heaven will be in big trouble. If we make a type II error we will only lose a bit of money by failing to use some hamburger that was actually OK. Therefore we want to make _ as small as possible. The errors and interpretation will flip if you started with null hypothesis that meat is not contaminat.
12. The managers at Hunter Chemical Company claim that their major product contains on average µ = 4.0 fluid ounces of caustic material per gallon. They further state that the distribution of caustic material is normal with a standard deviation of σ = 1.3 fluid ounces. If there is too much caustic material, the product will be dangerous. A government inspector is brought in to test the product. She randomly selects a sample of 100, gallon-size containers of the
product and finds that their mean weight of caustic materials is X = 4.5 fluid ounces per gallon.
(a) What are the null and alternative hypotheses that the inspector is exploring? Give them both mathematically and in English and explain your reasoning. (b) Explain in English what the type I and type II errors for this problem would be? (c) Conduct the hypothesis test using test statistics and state your conclusion.
(d) Find the probability of getting a sample mean X , as high as or higher than 4.5 if the production process was working as normal. Based on this probability would you be inclined to accept or reject the null hypothesis? What conclusions would you draw about the amount of caustic material being produced? Explain briefly. Solution: (a) Our null hypothesis is that the process is producing the usual amount of caustic material. Mathematically we would write this as Ho : µ = 4. I actually see two possibilities for the alternative hypothesis the way this question is worded. The problem specifically asks whether we are producing the usual amount, not whether we are producing too much or too little. Thus, we might say our alternative is that the process is not producing the usual amount and write Ha : µ > 4. However, the problem also mentions that if there is too much caustic material the product is dangerous. If our main concern is with whether there is too much caustic material then our alternative would be
HA : µ ≥ 4. The basic rationale for, which hypothesis is the null and which the alternative
is the same either way. Our default position is that the company is telling the truth (innocent until proven guilty if you like)–this is also the status quo, and it is the situation that does not require any action. If the process is producing the usual amount of caustic material the product is safe and the inspector does not need to do anything. Our alternative is that something is wrong and that the product is dangerous. This is what an inspector would be brought in to establish and is the situation that would require action–namely adjusting the production process. (b) Since we know standard deviation and n is large enough so that ¯ X is normal by the CLT we will use a Z calculation. The way I have phrased the problem we have decided on the one-sided alternative, HA: µ > 4. We are calculating the probability seeing something even more extreme (favoring the alternative hypothesis) than our data, assuming H0 is true. Here that would

be the probability of the inspector seeing a sample mean of 4.5 or more when the process was really producing a mean of 4:
4.5 4( 4.5 4) ( ) ( 3.85) .0001
/ 1.3 / 100
XP X P P Z
n
µµ
σ
− −≥ = = ≥ = ≥ =
This probability says that if the process really were producing only 4 ounces of caustic material there is virtually no way the inspector would have gotten a sample mean as high as 4.5. But the inspector DID see a sample mean of 4.5–there is no way around that. Therefore our assumption that the process had a true mean of 4 must have been wrong! I am therefore inclined to reject the null hypothesis and accept the alternative hypothesis. It looks as if the process is producing more caustic material than it should be!
13. Pete’s Powerful Pills (PPP) has branched out and is now promoting a vaccine which is supposed to prevent statisticitis, a nasty disease afflicting students at the local Evermore University. They are trying to convince the university’s health center that the vaccine is worth stocking. The campus health center has agreed to stock and administer the vaccine if it sells well enough, at least µ = 50 vaccines per week. PPP arranges for the health center to conduct a 36 week trial with the goal of convincing the center to stock the vaccine. They find that the center has
administered an average of X = 55 vaccines per week over that period with a standard deviation of s = 6.99.
(a) Compute a 95% confidence interval for µ, the mean number of vaccines the health center will administer per week in the long run. Does it look like the health center will be willing to stock the vaccine? Explain. (b) Perform the hypothesis test using test statistics that PPP will conduct to convince the health center the vaccine is worth stocking. In other words, give the null and alternative hypotheses, both mathematically and in words, and explain your reasoning. (c) Conduct the hypothesis test using p-value (using Stata) and state your real-world conclusions assuming you need to be 95% sure the vaccine is worthwhile before you stock it.. Is this consistent with your result from part (b)? (d) Suppose that PPP makes a $5 profit on every vaccine administered by the health center. Furthermore, suppose they need to average profits of at least $260 per week for it to be worthwhile to market the vaccine at the school. Can they be 95% (really 97.5%) sure of meeting their goal? Explain. (Hint: Use the CI computed in part (a)). Solution: Solution: (a): The general formula for a confidence interval for the mean is:
1.96s
Xn
±

Here we have ¯ X = 55, s = 6.99, and n=36. Since we want a 95% confidence interval we
need 0.025 1.96Z = .Note that we can use Z distribution since n > 30. If n was less than 30
we will be using t distribution.
6.9955 1.96
36± or [52.72, 57.21]
This means that we are 95% sure that the average number of vaccines sold by the health center per week is between 52.72 and 57.28. (Specifically, if we had done many 36 week studies and calculated confidence intervals based on each study, 95% of our confidence intervals would have included the true µ for this problem.) According to this interval our worst case scenario is that we will sell 52.72 vaccines per week which is enough to make the vaccine worth stocking so the health center will probably go ahead. (b)The critical value in this problem is µ = 50 because that is the cut-off line for whether or not the health center will stock the vaccine. PPP wants to PROVE that the vaccine will sell well so this must be the alternative hypothesis. We get
Ho : µ ≤ 50, or µ = 50 –the health center will NOT sell more than 50 vaccines per week
on average, or the health center will sell 50 vaccines per week on average Ha : µ > 50–the health center WILL sell more than 50 vaccines per week on average.
Test Statistic = 55 50
4.3/ 6.99 / 36
X
s n
µ− −= =
Decision Rule: If test statistics > 1.64, reject Ho. Note that we are using the decision rule for upper tail test. Hence we reject Ho and conclude that at 95% level of confidence we have sufficient evidence to conclude that average sales of vaccines will be more than 50 per week and therefore health center should stock the vaccine. (c) From stata p-value = .001. Since p-value < .05, we reject Ho and conclude that at 95% level of confidence we have sufficient evidence to conclude that average sales of vaccines will be more than 50 per week and therefore health center should stock the vaccine. The conclusions of part (b) and part (c) are consistent, as we expected them to be. (d) The company can be 97.5% sure of reaching their goal. We know from part (a) that the average number of vaccines sold per week is between 52.72. and 57.28 (or at least we are 95% sure of that!) Thus, the average profit per week must be between $263.6 and $286.4 per week. (We simply multiply the number of vaccines by the profit per vaccine.) Thus [263.6, 286.4] is a 95% confidence interval for the average weekly profits. Since confidence intervals are symmetric there is a 2.5% chance that our interval was above the true average profit and a 2.5% chance our interval was below the average

profit. In particular this means that we are 97.5% sure that the true mean profit is above 2263.6. This is good enough since we wanted to be 97.5% sure that the average profit was above $260.
14. The Department of Transportation in Georgia did a study a number of years ago that showed that the proportion of cars tested which failed to meet the state pollution standard was .37. The department would like to be able to say that the cars have improved since then. In a sample of n=100 cars more recently, the proportion not meeting the standards was .28.
Are the cars better at meeting the standards than they used to be? Clearly state the null and alternative hypotheses, both in English and mathematically. Perform the hypothesis test at level α = .01, both by computing the test statistic and the p-value (use stata) and explain the meaning of your conclusion in words. Solution: We are told that in the past, 37% of vehicles in California failed to meet the pollution standards. In a new study, we found that only ˆpobs = .28 = 28% failed to meet the standards. We want to establish that fewer cars fail the standards now than used to so that is our alternative hypothesis. Our null hypothesis is the thing we want to disprove, or the status quo, namely that the carshave not gotten any better.
Mathematically, our null and alternative hypotheses are Ho : p ≥ .37 (things are as bad or
worse than before) or p = .37 ( things are as they were) and Ha : p < .37 (things have gotten better).
Test Statistic =
ˆ .28 .37) 1.864
(1 ) / (.37)(.63) /100
p p
p p n
− −= = −
−
Decision rule: if test statistic < -2.33, reject H0. Note we are doing the test at α = .01, that is 99% level of confidence and it’s a lower tail test. Since test statistic > -2.33, we fail to reject H0 and conclude that at 99% level of confidence we do not have enough evidence to say that cars have improved. Note that our conclusion will be different if we were using 95% level of confidence. p-value from stata =0.031 Since p-value > .01, fail to reject H0. Conclusion is same as above.
15. A health services provider has been reimbursed by an HMO for a large number of services. It appears that overpayments may have occurred on many of the reimbursements due to errors in the billing process, or billing for a more expensive procedure than was actually performed. The health services provider claims that no more than 1% of the reimbursements it has received have been overpayments. The HMO suspects that it is being overcharged and wants to get its money back. They hire you to prove their claim.
You audit a random sample of 500 reimbursements and find that 20 of them involve overpayments. Perform an appropriate hypothesis test. Make sure you state your null and alternative hypotheses (both mathematically and in English with a justification of your choice), compute the test statistics and the p-value (use stata) and explain your conclusions.
Solution: We are asked to test whether the proportion of reimbursements that involve overbilling is greater than or less than 1%. The HMO wants to show that it has been overcharged so that it can get its money back. Therefore, the alternative hypothesis is that overbilling occurs more than 1% of the time. In symbols, we have
H0: p ≤ .01 or p = .01, and
HA : p > .01. We are given ˆpobs = 20/500 = .04. Since this is a proportion problem, our
Test statistic = ˆ .04 .01
) 6.742(1 ) / (.01)(.99) / 500
p p
p p n
− −= =
−
Decision rule : if test statistic > 1.64, reject H0. Hence we reject H0 and conclude that at 95% level of confidence, we have enough evidence to conclude that overbilling occurs morethan 1% of the time. p-value from stata: < .001. It is < .05. hence reject Ho and conclude as above.

16. A researcher has a theory that the average age of managers in a particular industry is over 35-years-old, and he wishes to prove this. The null hypothesis to conduct a statistical test on this theory would be ____________.
A. the population mean is < 35 B. the population mean is > 35 C. the population mean is = 35 D. the population mean is > 35
17. A company produces an item that is supposed to have a six inch hole punched in the center. A quality control inspector is concerned that the machine which punches the hole is "out-of-control" (hole is too large or too small). In an effort to test this, the inspector is going to gather a sample punched by the machine and measure the diameter of the hole. The alternative hypothesis used to statistical test to determine if the machine is out-of-control is
A. the mean diameter is > 6 inches B. the mean diameter is < 6 inches C. the mean diameter is = 6 inches D. the mean diameter is not equal to 6 inches
18. A company believes that it controls more than 30% of the total market share for one of its products. To prove this belief, a random sample of 144 purchases, of this product are contacted. It is found that 50 of the 144 purchased this company's brand of the product. If a researcher wants to conduct a statistical test for this problem, the alternative hypothesis would be _______.
A. the population proportion is less than 0.30 B. the population proportion is greater than 0.30 C. the population proportion is not equal to 0.30 D. the population mean is less than 40
19. In a two-tailed hypothesis about a population mean with a sample size of 100 and α = 0.05, the rejection region would be _______.
A. z > 1.64 B. z > 1.96 C. z < -1.96 and z > 1.96 D. z < -1.64 and z > 1.64

20. A researcher is testing a hypothesis of a single mean. The critical z value for α = .05 and a two-tailed test is +1.96. The observed test statistic value from sample data is -1.85. The decision made by the researcher based on this information is to _____ the null hypothesis
A. reject B. do not reject C. redefine D. change the alternate hypothesis
21. A Type II error is committed when
a) we reject a null hypothesis that is true. b) we don\'t reject a null hypothesis that is true. c) we reject a null hypothesis that is false. d) we don\'t reject a null hypothesis that is false.
22. A Type I error is committed when
a) we reject a null hypothesis that is true. b) we don\'t reject a null hypothesis that is true. c) we reject a null hypothesis that is false. d) we don\'t reject a null hypothesis that is false.
23. If a test of hypothesis has a Type I error probability (α) of 0.01, we mean
a) if the null hypothesis is true, we don\'t reject it 1% of the time. b) if the null hypothesis is true, we reject it 1% of the time. c) if the null hypothesis is false, we don\'t reject it 1% of the time. d) if the null hypothesis is false, we reject it 1% of the time.
24. How many Kleenex should the Kimberly Clark Corporation package of tissues contain? Researchers determined that 60 tissues is the average number of tissues used during a cold. Suppose a random sample of 100 Kleenex users yielded the following data on the number of tissues used during a cold: mean = 52, s = 22. Using the sample information provided, calculate the value of the test statistic.
a) t = (52 - 60)/ 22 b) t = (52 - 60)/ (22/ 100) c) t = (52 - 60)/ (22/ 1002) d) t = (52 - 60)/ (22/ 10)

25. A pharmaceutical company claims that its weight loss drug allows women to lose
8.5lb after one month of treatment. If we want to conduct an experiment to determine if the patients are losing less weight than advertised, which of the following hypotheses should be used?
a) H0: µ = 8.5; Ha: µ > 8.5 b) H0: µ = 8.5; Ha: µ = 8.5 c) H0: µ = 8.5; Ha: µ < 8.5 d) H0: µ ≠ 8.5; Ha: µ > 8.5 e) H0: µ ≠ 8.5; Ha: µ < 8.5
26. It is possible to directly compare the results of a confidence interval estimate to the results obtained by testing a null hypothesis if:
a. a two-tailed test is used. b. a one-tailed test is used. c. both of the previous statements are true. d. none of the previous statements is true.
27. Suppose a 95% confidence interval for the proportion of Americans who exercise
regularly is 0.29 to 0.37. Which one of the following statements is FALSE?
a) It is reasonable to say that more than 25% of Americans exercise regularly. b) It is reasonable to say that more than 40% of Americans exercise
regularly. c) The hypothesis that 33% of Americans exercise regularly cannot be rejected. d) It is reasonable to say that fewer than 40% of Americans exercise regularly.
28. A hypothesis test is done in which the alternative hypothesis is that more than
10% of a population is left-handed. The p-value for the test is calculated to be 0.25. Which statement is correct?
a) We can conclude that more than 10% of the population is left-handed. b) We can conclude that more than 25% of the population is left-handed. c) We can conclude that exactly 25% of the population is left-handed. d) We cannot conclude that more than 10% of the population is left-handed.
29. What is the value for the test statistic for the following hypothesis test? ��: � =
.09 �: � < .09 ; n = 60; the sample proportion is 0.085 and α = 0.05.
a. -0.1309 b. -0.1326 c. -0.1353 d. -0.1377

30. A statistics professor used X = “number of class days attended” (out of 30) as an independent variable to predict Y = “score received on final exam” for a class of his students. The resulting regression equation was Y = 39.4 + 1.4*X.
Which of the following statements is true?
a. If attendance increases by 1.4 days, the expected exam score will increase by 1 point b. If attendance increases by 1 day, the expected exam score will increase by 39.4 points c. If attendance increases by 1 day, the expected exam score will increase by 1.4 points d. If the student does not attend at all, the expected exam score is 1.4.
31. In a multiple regression analysis involving 40 observations and 5 independent variables,
SST= 350 and SSE = 30. The coefficient of determination (R2) is:
a) .9408 b) .8571 c) .9143 d) .8529
32. Given the regression equation ˆ 4.3 5.9Y X= − + , which of the following statements is incorrect?
a) The R2 value could be less than 0. b) The correlation between x and y is positive. c) The slope of the line is 5.9. d) Given an X value of 2, the predicted value of Y is 7.5. e) The intercept value is less than 0.
33. In simple linear regression, what is the difference between b1 and β1 ?
(a) b1 stands for the slope of the regression line for the sample, while ββββ1 stands for the slope of the regression line for the population.
(b) b1 stands for the slope of the regression line for the population, while β1 stands for the slope of the regression line for the sample.
(c) b1 and β1 are just two different ways of referring to the slope of the regression line for the sample.
(d) b1 stands for the residual variance, β1 stands for the residual standard deviation.

34. Sixteen student volunteers at Ohio State University drank a randomly assigned number of cans of beer. Thirty minutes later, their blood alcohol content (BAC) was measured by a police officer. The fitted regression line is
ˆ 0.0123 0.0180( )y x= − +
where y is BAC and x is the number of cans of beer. Which of the following is FALSE:
a) As the number of cans of beer increases, so does BAC. b) The predicted BAC after 5 beers is about 0.08. c) The predicted BAC for someone who has had no beer is -0.0123 d) The predicted BAC after 1 beer is about 0.006 e) For every can of beer consumed, BAC is expected to go up by 0.0123.
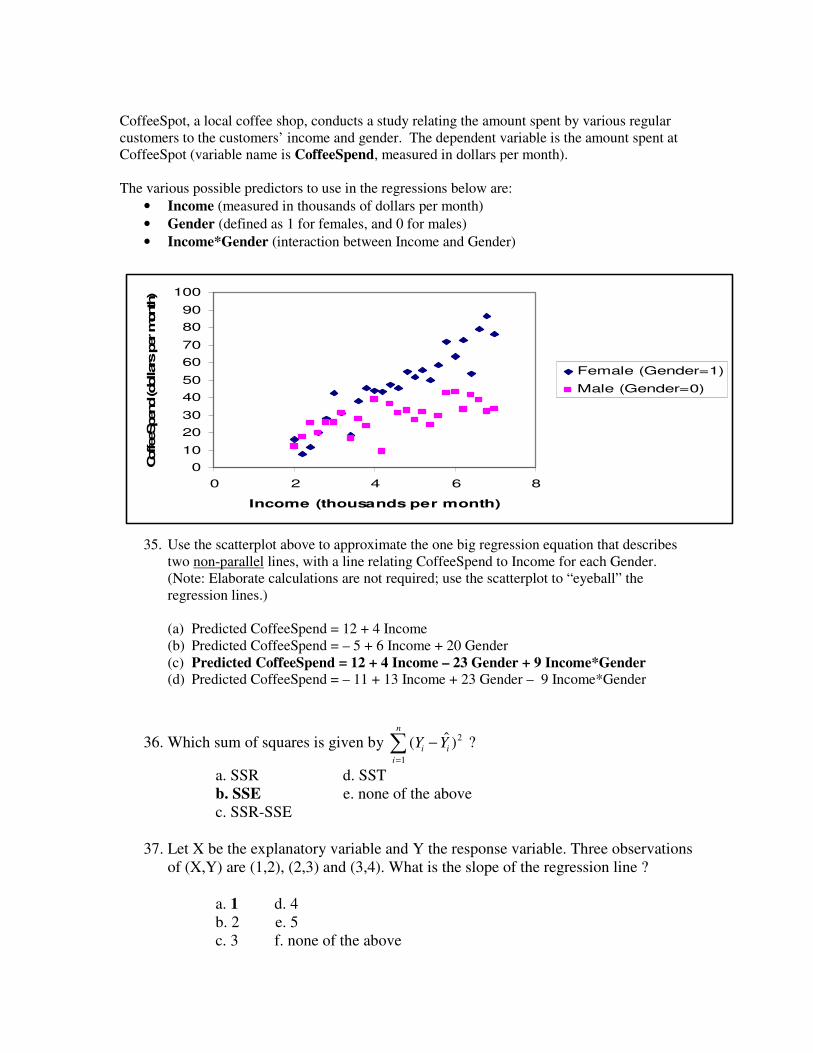
CoffeeSpot, a local coffee shop, conducts a study relating the amount spent by various regular customers to the customers’ income and gender. The dependent variable is the amount spent at CoffeeSpot (variable name is CoffeeSpend, measured in dollars per month). The various possible predictors to use in the regressions below are:
• Income (measured in thousands of dollars per month)
• Gender (defined as 1 for females, and 0 for males)
• Income*Gender (interaction between Income and Gender)
35. Use the scatterplot above to approximate the one big regression equation that describes two non-parallel lines, with a line relating CoffeeSpend to Income for each Gender. (Note: Elaborate calculations are not required; use the scatterplot to “eyeball” the regression lines.)
(a) Predicted CoffeeSpend = 12 + 4 Income (b) Predicted CoffeeSpend = – 5 + 6 Income + 20 Gender (c) Predicted CoffeeSpend = 12 + 4 Income – 23 Gender + 9 Income*Gender (d) Predicted CoffeeSpend = – 11 + 13 Income + 23 Gender – 9 Income*Gender
36. Which sum of squares is given by ( $ )Y Yi
i
n
i
=
∑ −1
2 ?
a. SSR d. SST b. SSE e. none of the above c. SSR-SSE
37. Let X be the explanatory variable and Y the response variable. Three observations
of (X,Y) are (1,2), (2,3) and (3,4). What is the slope of the regression line ?
a. 1 d. 4 b. 2 e. 5 c. 3 f. none of the above
0
10
20
30
40
50
60
70
80
90
100
0 2 4 6 8
Income (thousands per month)
CoffeeSpend (dollars
per m
onth
)
Female (Gender=1)
Male (Gender=0)

38. For n=6 observations, we have SSE=5 and SSR=8. What is the coefficient of
determination (R2) in this simple regression analysis ?
a. 5/13 d. 15/32 b. 6/32 e. 19/32
c. 8/13 f. none of the above
39. For children, there is approximately a linear relationship between “height” and “age”. One child was measured monthly. Her height was 75 cm at 3 years of age and 85cm when she was measured 18 months later. A regression line was fit to her data. The slope of this line is approximately
a. .55 d. 1.57 b. 10 e. 2.1 c. 25 f. none of the above
40. The least squares regression line is the line:
a. which is determined by use of a function of the distance between the observed Y’s
and the predicted Y’s b. which has the smallest sum of the squared residuals of any line through the data
values c. for which the sum of the residuals is 0 d. which has all of the above properties e. which has none of the above properties f. None of the above.
41. There is an approximate linear relationship between the height of females and
their age (from 5 to 18 years) described by: height = 50.3 + 6.01(age) where height is measured in cm and age in years. Which of the following is not correct?
a) The estimated slope is 6.01 which implies that children increase by about
6 cm for each year they grow older. b) The estimated height of a child who is 10 years old is about 110 cm. c) The estimated intercept is 50.3 cm which implies that children reach
this height when they are 50.3/6.01 years old. d) The average height of children when they are 5 years old is about 50% of
the average height when they are 18 years old. e) My niece is about 8 years old and is about 115 cm tall. She is taller than
average.

42. Let X be the independent variable and Y be the response variable. Three observations of (X,Y) are (1,2), (2,3) and (3,4). What is the standard deviation of error (s) in this simple regression analysis ?
a. 1 d. 4 b. 2 e. 5 c. 3 f. none of the above
43. If there is no linear relationship between the variables X and Y, then:
a. β 0=0 d. β1 =1
b. s=0 e. R2 =1
c. β1=0 f. none of the above
44. A large class of 360 students has just taken an exam. The exam consisted of 40 true-false questions each of which was worth one point. A diligent teaching assistant has recorded the number of correct answers (Y) and the number of incorrect answers (X) for each student. Suppose that the student then regresses the
variable Y on the variable X. What will be the values of b0 , b1 and R2 ? Is this a
sensible model to fit to the data ?
We have Y = 40-X. This is an exact relationship so it is easy to figure out the estimated values.
In particular, b b and R0 1
240 1 100%= = − =, . Since there is an exact
relationship between the two variables this is not a sensible model to fit to the data.

45. A 95% confidence interval for b1 is determined to be (15,30). Interpret the meaning of this interval.
a) You can be 95% confident that the mean value of Y will fall between 15 and
30 units. b) You can be 95% confident that the X value will increase by between 15 and
30 units for every one unit increase in Y. c) You can be 95% confident that average value of Y will increase by
between 15 and 30 units for every one unit increase in X. d) At the 5% level of significance, there is no evidence of a linear relationship
between Y and X.
46. What do residuals represent?
a) The difference between the actual Y values and the mean of Y. b) The difference between the actual Y values and the predicted Y
values. c) The square root of the slope. d) The predicted value of Y for the average X value.
47. A regression analysis between sales (in $1,000) and advertising (in $1,000) resulted in the following least squares line: yhat = 80 + 5x. This implies that:
a) as advertising increases by $1,000, sales increases by $5,000. b) as advertising increases by $1,000, sales increases by $80,000. c) as advertising increases by $5, sales increases by $80. d) None of these choices.