solutions to test imagequality filedear customers, thank you for your continued passion in high...
TRANSCRIPT

Solutions to test
imageQuality
Image Engineering
Product Catalog
2017/2018

DEAR CUSTOMERS,
Thank you for your continued passion in high image quality.
Founded in 1997, Image Engineering is an independent test lab for digital cameras. At our new Headquarters in Horrem Germany, we test all types of cameras in order to provide well-known magazines, system integrators and camera manufacturers with reliable test results. Apart from testing cameras, we actively design and develop image quality test equipment. Over the past 20 years, we have grown into the world’s leading supplier for camera test equipment.
At the heart of the IE products are the more than 280 different test charts for the assessment of almost all aspects of image quality and signal analysis. From there, we also provide chart illumination, chart and camera mounting, and evaluation software essentially covering the entire system of image quality testing. By combining the charts and the iQ-Analyzer software, you are provided with a comprehensive camera characterization. Throughout the last decade, additional devices have been created in order to test everything from image stabilization and timing aspects (i.e. frame rate and shutter lag), to measuring the spectral sensitivity of cameras. Our latest development introduces a spectrally variable light source that can be used for illumination and camera calibration.
To get started with your own testing we offer a wide range of options, from a single test chart to a fully automated production line test stand. All of the equipment provided is regularly used in our own lab, and we follow the test methods based on the ISO standards. In addition, our company’s staff participates in several organizations devoted to developing and optimizing camera tests and equipment, ensuring that we are keeping pace with the constantly changing technology. Today’s products fulfi ll the needs of many application areas including mobile devices, automotive, machine vision, broadcast, medical, and surveillance. With today’s rapidly changing technology, we understand that everyone has different requirements. If you can’t fi nd what you are looking for, our engineers are more than happy to assist in developing individual solutions to fi t your needs.
Thank you for your interest in Image Engineering, we look forward to working with you!
Best Regards, Your Image Engineering Team
EDITORIAL
& CONTENT
Image Engineering GmbH & Co. KG
Im Gleisdreieck 550169 Kerpen-Horrem / Germany
Changes to products and technical data reserved.
INFORMATION SALES SUPPORT
TELEPHONE +49 2273 99 99 1-0 +49 2273 99 99 1-50 +49 2273 99 99 1-60
E-MAIL [email protected] [email protected] [email protected]
FAX +49 2273 99 99 1-10
WEB www.image-engineering.com
For worldwide delivery you can fi nd a listwith all distributors on our website:www.image-engineering.com/company/resellers

iQ code
iQ charts
iQ solutions
iQ tools
iQ lab
Solutions for your individual needs.
iQ-TESTSTAND 04
STARTER KITS 06
PHOTO 06MACHINE VISION 06SECURITY 07CELL PHONE 07AUTOMOTIVE 07MEDICAL / ENDOSCOPY 07BROADCAST 07SCANNER 07PRODUCT OVERVIEW 08
TURNKEY SOLUTIONS 09
BASIC 10EXPERT 10LENS 10TIMING MEASUREMENT 11IMAGE STABILIZATION 11SECURITY new 11PRODUCT OVERVIEW 12
Worldwide leading and practically used test equipment.
ILLUMINATION DEVICES
LG3 13LE6 13CAL4 new 13iQ-LED TECHNOLOGY 14LE7 15LE7-IR 15CAL1 16CAL3 new 16CAL2 17iQ-ALIGN 17iQ-FLATLIGHT 18EX1 18iQ-CHART BOX 19iQ-FOV BOX 19
MEASUREMENT DEVICES
LIGHTSTUDIO 20CAMSPECS 21CAMSPECS SOFTWARE 21STEVE-2D 22STEVE-6D 22iQ-AF BOX 24LED-PANEL new version 24iQ-TRIGGER 25iQ-TRIGGER-T new 25iQ-DEFOCUS new 25
One of the highest performance analysis tools in the area of digital imaging.
Our testing facility is capable of measuring any parameters you need regarding your imaging system.
ANALYSIS SOFTWARE
iQ-ANALYZER 26 iQ-ANALYZER MODULES 27
SOFTWARE
iQ-API EXTENSIONS 28iQ-LUMINANCE 29IN-SITU DATA 29
MEASUREMENT SERVICES
iQ LAB –TEST SERVICES FOR YOU 30iQ-DATA – EASY ACCESS – EASY BENEFIT 30iQ LAB – MEASUREMENTS ON A REGULAR BASIS 31
Comprehensive, highly specialized assortment of more than 280 test charts.
SELECTED TEST CHARTS
TE42 32ARCHIVING 32COLOR 33OECF 33RESOLUTION 34TEXTURE LOSS 34
TEST CHARTS
TEST CHARTS SORTED BY NUMBER 35
TEST CHART FOLDER
HD STUDIO KITS 44HD TRAVEL KITS 44SUPER BLACK HOLE (LIGHT TRAP) 44
ACCESSORIES
ACCESSORIES 453RD PARTY ACCESSORIES 46
TEST CHART SIZES
CHART SIZES 47VISUALIZATION OF THE CHART SIZES 47

imageQualitysolutions
4
TURNKEY SOLUTIONS
iQ-TESTSTAND
Over the past few years Image Engineering has developed a large variety of components for camera test stands. A whole range of products have been constructed from simple chart holders to fully automated production line solutions. The motorized modules of the iQ-Teststand are controlled by using a USB interface and come with an SDK/API. These components have now been put together to form a modular system that can easily be customized
for individual requirements. If there is a missing part, it can be added without constructing a completely new solution. Therefore, camera stands can now be arranged faster and more cost effi cient than ever before.A camera test stand can be divided into seven product groups. For each one of these groups we offer a variety of solutions resulting in a complete test stand.
Customized test stands to fi t your individual requirements
Basic iQ-TeststandiQ-Teststand without motorization.
Automated iQ-TeststandiQ-Teststand with automatization for illumination, camera-chartdistance and chart mounting.
iQ-Chartmount-V
iQ-Monopod
iQ-Mobilemount and 3-Way head
Hedler Tungsten halogen light units*
1
2
3
3
4
6
6
6
6
1
4
2
5
*The illustrations show only one light source for a better overview. Complete test stands always include two light sources.
4
1
2
iQ-Chartmount-V (motorized, PC controllable)
iQ-Bench (motorized, PC controllable)
iQ-Cameramount
iQ-Flatlights* (PC controllable)
LE7 (PC controllable)
iQ-LED or iQ-Drive API
4
5
6
1
2
3
3

imageQualitysolutions
5
TURNKEY SOLUTIONS
CHART MOUNTINGFor chart mounting, we offer different versions from a simple wall and table mount to a fully automated version of the iQ-Chartmount-V.
CAMERA-CHART DISTANCEWe provide two different systems to adjust the chart camera distance. iQ-Monopod for large distances (manual operation only) and iQ-Bench, a system based on a linear guide that can be motorized.
CAMERA ALIGNMENTIn order to align the camera to the chart in the simplest way, it is best to use a 3-Way camera head with the iQ-Monopod. iQ-Cameramount is necessary for positioning the 3-Way camera head on the iQ-Bench. If automatic control is desired you can use the iQ-Alignrig or the iQ-Hexalign with various fi ne adjustment possibilities.
REFLECTIVE CHART ILLUMINATIONOur program currently includes four types of illumination sources for refl ective charts. You can choose between a fl uorescent tube light source, Tungsten halogen light units, or a lightHEAD that is equipped with halogen bulbs and fl uorescent tubes. For the fully automated solution we also provide iQ-Flatlights with a C++ Application Programming Interface (API) as another option. For a homogeneous illumination two light sources are always needed.
TRANSPARENT CHART ILLUMINATIONWe produce different kinds of illumination devices to ensure a uniform illumination on transparent charts. LE6 is equipped with a halogen bulb. LE7 uses iQ-LED technology. LG3 offers extremely high intensities and variable frequencies from 10 - 500 Hz with 432 LEDs.
ANALYSIS AND CONTROL SOFTWAREThe iQ-Analyzer software is the market leading solution in the image quality analysis domain. For a meaningful and exact analysis, it is important to have precise control of the instruments. Besides the included user-friendly desktop control software, we offer every customer an opportunity to create programs, whose capabilities and appearance satisfy each individual demand. We also optionally provide a C++ Application Programming Interface (API) for many solutions (respectively a command line interface (CLI) for iQ-Analyzer).
Product descriptions can be found on the respective product pages.
iQ-HOUSINGIf the camera test stand is not set up in a specialized room, then it is crucial to cover it from stray light and other aspects of the surrounding environment by using an appropriate form of housing.
iQ-Chartmount-V iQ-Chartmount-H
iQ-Bench iQ-Monopod
3-Way tripod head
lightHEAD
LE6 LE7 LG3
Fluorescent tubes iQ-Flatlight with LEDs Tungsten halogen light unit
iQ-Cameramount iQ-Alignrig iQ-Hexalign
APIAVAILABLE
APIAVAILABLE
APIAVAILABLE
APIAVAILABLE
APIAVAILABLE
APIAVAILABLE
APIAVAILABLE
APIAVAILABLE
1
2
3
4
5
6
7
iQ-LEDTECHNOLOGY
iQ-LEDTECHNOLOGY

imageQualitysolutions
6
STARTER KITS
PHOTO MACHINE VISIONAfter many years of image quality experience, we have prepared a kit with the most important equipment to test a digital still camera. Without the use of a transparent target, there is no reliable way to measure the dynamic range. To solve this problem, we have included the TE264 to measure noise, OECF, dynamic range and ISO speed (ISO 14524, ISO 15739 and ISO 12232). A transparent target needs a uniform illumination, which the LE6** perfectly provides. The integrating sphere illuminates the TE264 with tungsten light and can be changed to daylight using the color conversion fi lter. When linked with the TE255, you have a uniform light source to measure luminance and color shading (ISO 17957). For color reproduction, a refl ective X-Rite ColorChecker SG (TE230) is included in the kit. Along with that comes the TE251 (ISO 17850) chart, which can be used for measuring distortion and chromatic aberration. Finally, resolution can be measured using sinusoidal Siemens stars and slanted edges (ISO 12233). Also included is a basic wall mount for holding the refl ective targets. Last but not least, in order to evaluate all the images taken with the sample camera, the kit contains the iQ-Analyzer, the most fl exible analysis software for image quality evaluation.
As technology continues to advance, so too does the imaging industry. Today there are more cameras available on the market than ever before. Image applications are steadily expanding to new areas with different requirements, and as a result, the demand for a variety of image quality tests has grown as well.
Due to the versatile applications of cameras in industrial image processing, the requirements for these cameras differ depending on the application. As true multi talents, image-processing systems can scan the quality, identify components, read codes, provide important data for optimizing the production process, and control machines. With the Machine Vision Kit, all of the most important quality criteria for the optics and sensors can be tested including: dynamic range, resolution, sensitivity, noise and image refresh rate. Lighting can usually be controlled in machine vision, so a standard contrast of 10,000:1 for the OECF chart is suffi cient. However, since the tonal levels are used for automatic detection and evaluation of elements in the image, it is helpful to get the OECF as detailed as possible. For this reason, the TE269B with its 36 gray levels, combined with the LE6** integrating sphere, has been added to the kit. As for color, resolution, distortion, shading etc., the standard charts (TE253, TE230, TE251, TE255, CF5400) in addition to the iQ-Analyzer software, can be used for evaluation.
STARTER KITS
Through Image Engineering’s many years of experience and direct contact within the imaging industry, we have identifi ed what is most important for each test area. For that reason, we have put together different Starter Kits to help you start your own image quality measurements.
Starter Kits are a perfect way to get started with your own image quality tests
Universal Multipurpose
TEST CHARTS ILLUMINATION DEVICES*AND MOUNTING
SOFTWAREOECF Resolution
Color
CAL4
LG3
Distortion Luminance and Color Shading iQ-Wallmount
LE6
* Refl ective chart ilumination is not included in the kits.
** LE7 upgrade available

imageQualitysolutions
7
STARTER KITS
CELL PHONESECURITYThe constant growth in camera technology is expanding the requirements for imaging technologies in the fi eld of security. New functions such as motion and face detection have become normal features. Data fl ow is continuously growing and with it the demand for image material with a defi ned quality, thus making a software-based evaluation possible. This Starter Kit is based on basic requirements and the current state of technology.A security camera needs to work under various conditions, from direct sunlight to very low light levels, often using tungsten or LED lights. In order to cover those high contrast levels, the cameras have a high dynamic range and it may be best to use the TE269C (according to the upcoming standard IEC 62676-5: video surveillance systems) in front of the LG3 light box. For measuring resolution and optical parameters, the standard targets (TE253, TE251) can be used in combination with the iQ-Analyzer software.
It is normally challenging to test cameras that cannot be manually adjusted to lighting conditions. This is especially the case for camera modules in cell phones and other mobile devices. Therefore, our Cell Phone Starter Kit consists of the TE42 with an average refl ection of approx. 18% and a standard contrast range. This can be used to determine various image quality aspects including resolution, distortion, color reproduction and texture loss. The LE6* integrating sphere uniformly illuminates the TE270X chart for OECF and noise measurements according to ISO 14524 and ISO 15739. This specifi c chart has a variable center density, which is used to manipulate the automatic exposure control. By exchanging the chart with the TE255 diffusor plate, the setup can be used to determine luminance color shading, which is an issue especially for small camera modules. The captured images are evaluated using the iQ-Analyzer software, which is also part of the kit.
AUTOMOTIVEIn the automotive area, two image quality aspects dominate our current customers’ requests. One is OECF in combination with high dynamic range, and the other is spatial resolution. With that in mind, our Starter Kit consists of an LE6-100 or LG3 and a TE269 OECF chart with a contrast of 1,000,000:1, which equals a 120 dB dynamic range. The TE261 refl ective chart with slanted edges (size A1066) allows to measure the spatial frequency response (SFR), even for cameras with a high level of geometric distortion. Also included is the iQ-Analyzer software, which allows the analysis of these two image quality aspects in addition to many others. Moreover, it can be integrated into customer applications using the CALI, or be used in stand-alone mode with its own graphical user interface.
MEDICAL / ENDOSCOPYMost medical imaging applications are designed to capture images in a macroscopic or microscopic scale, meaning the test charts have to be small. In order to ensure uniform illumination, CAL4, an integrating sphere with a diameter of 30 cm and a fl ange for the typical medical light sources, is included in the Starter Kit (light source is not provided with the kit). This way the test is performed with the same light source that is used in later applications. Perpendicular to the illumination, the integrating sphere has an opening with a chart holder for the 5 x 5 cm charts. The TE253 9x (according to ISO 12233) with sinusoidal Siemens stars is provided in D35 size for resolution measurement. In order to measure the OECF, dynamic range, and noise, the TE240 chart with 24 gray steps (according to ISO 21550) is part of the package. Color can be checked with a transparent version of the X-Rite ColorChecker (TE188 D35). For visual determination the TE250 and the TE132 resolution chart, standardized in ISO 3334 for microfi lm analysis, are included.
In general the image quality of scanners and cameras is tested using charts that are a degree better than the expected test result of the device under test. The TE240, which measures the dynamic range according to ISO 21550, is available as a transparent and refl ective chart. In refl ection, the achievable contrast is limited to about 2.4 densities. In transmission, the user can select between 4.0 and 6.0 densities. The IT8 color target (TE258) is the standard target for color profi ling, and we provide it in a refl ective and a transmissive version with a large color gamut. The TE250 (transparent test chart) is used for visual resolution measurement for scanners, according to ISO 16067, and is done traditionally with the slanted edge target QA-62 (refl ective).
SCANNERBROADCASTThe Starter Kit Broadcast consists of a set of transmissive test charts and the LE6* integrating sphere. This set is a suitable solution to set up and align multiple cameras. The TE259 is an OECF chart with horizontal gray scales, suitable for the analysis of gamma (OECF) using a waveform monitor. The color rendition chart TE226 allows analyzing and controlling of the color reproduction. The TE225 with its regular line structures is used for visual resolution assessment or an analysis performed with a waveform monitor. Last but not least, the multipurpose TE167 chart is part of the package in order to address several remaining aspects including the geometric performance of the system.
* LE7 upgrade availableFor assembling each kit, please see the following table.

imageQualitysolutions
8
STARTER KITS
* API (application programming interface) available
StarterKits
Products Product Description
Test charts
Universal Multipurpose
TE42 multipurpose test chart ∙ A1066 x
TE261 slanted edges 16:9 ∙ A1066 x
TE167 HDTV universal test chart ∙ D280 x
Resolution
AI QA-62 slanted edge target ∙ scanner SFR & OECF x
TE132 ISO test pattern No. 2 ∙ D35 x
TE225 HDTV resolution chart ∙ D280 x
TE250 USAF 1951 transparent chart ∙ D35 x x
TE253 9x modulated sinusoidal Siemens star ∙ A1066 S/H/L x x x x
Color
TE188 color rendition chart (X-Rite) ∙ D35 x
TE226 HDTV color rendition chart ∙ D280 x
TE230 X-Rite ColorChecker SG mounted on TE182 x x
TE258 IT8 scanner characterization chart x
OECF
TE182 neutral gray 18% remission ∙ A1066 x x
TE240 ISO 21550 scanner dynamic range chart x x
TE259 OECF ∙ noise test chart ∙ 20 steps ∙ D280 x
TE264 OECF 20 ISO 14524 / 1573 revision ∙ D280 x
TE269 OECF 36 ∙ D280 A/B/C xB xC xB
TE270X chart with variable center density ∙ D280 x
Geometry Grid Registration
TE251 distortion ∙ chromatic aberration ∙ crosses ∙ A1066 x x x
Signal Evaluation
TE255 diffusor plate (for shading measurement) ∙ D280 x x x
TE285 IR refl ection ∙ A360 x
Mounting
iQ-Wallmount wall mounting frame for charts in size ∙ A1066 x x x x x
llumination Devices
LE6 integrating sphere with halogen light source x x x x x
CF-5400 conversion fi lter 5400 K for LE6 ∙ D280 x x x
LG3*lighting box with a wide range of intensities and special fl icker mode
x
CAL4 integration sphere without own light source x
Software
iQ-Analyzer image quality analysis software x x x x x
Phot
oMac
hine
Vision
Secu
rity
Cell Ph
one
Automot
ive
Medica
l /
Endo
scopy
Scan
ner
Broa
dcast

imageQualitysolutions
9
TURNKEY SOLUTIONS
TURNKEY SOLUTIONS
CUSTOM MADE SOLUTIONS
Everything you need for high quality camera testingImage Engineering is not only a manufacturer of test equipment, but also an independent test laboratory for image quality. Every day we strive to expand our expertise on the characterization of digital image quality. With the hope of bringing you the best equipment and knowledge, we continuously test all types of cameras in the lab, including SLRs, compact cameras, mobile devices, video or broadcast cameras. Specialty cameras from the automotive, medical and security industries are also frequently tested in our lab. When manufacturers come to us with new questions, our engineers develop the appropriate solutions to answer them. In all applicable areas, our specialists always work
The following Turnkey Solutions are selected examples for potential setups. Modern imaging systems and their related requirements may call for custom designed variations of a test system to enable all measurements. On the hardware side, many different equipment types are available. Everything from a simple test chart to a spectrally tunable light source, from a cell phone mount to a fully automated test stand, and from a simple test pattern to a scene with moving parts and high dynamic range capabilities. We combine software, hardware and services to create a complete solution that serves your individual needs. You will not receive a standard off-the-shelf product, but a system that has been constructed, adjusted
based on the requirements originated from practical use. The development department designs the appropriate charts for all the necessary camera characteristics, and the illumination equipment to go with it. The measuring devices are always designed to comply with the requirements of the current and future international standards. The iQ-Analyzer, a special analysis software, is updated regularly. In addition, individually adaptable systems are designed for chart, camera and lighting mounts. In short, Turnkey Solutions were created in order to provide a “full service” performance for your own test lab.
and tuned to meet your individual expectations. We have an answer for each of your measuring needs. If you are interested in a software controllable version of our products, please do not hesitate to contact us. Our engineers are looking forward to helping you with your project.
ANALYSIS
C:\>_
ILLUMINATION
Test ChartsThe most important rule in camera testing is the chart must be better than the camera being tested. We provide the high quality you need to test your devices. Our test chart portfolio contains over 280 test charts for all relevant measuring methods and applications. They are available in different sizes, fi t technical requirements and many of them are available in refl ective and/or transparent versions.
IlluminationThe homogeneous test chart illumination is only one prerequisite for reliable measurement data. Versatile requirements arise from real lighting situations. In order to be as comprehensive as possible, the available types of refl ective and transparent chart illumination range from conventional halogen bulbs to spectrally adjustable iQ-LED lighting units.
MountingThe precise alignment of the camera and the chart to each other is essential for reliable and meaningful test results. The options for camera positioning range from a conventional monopod to an optical bench with fully automated camera fi ne adjustment via a hexapod. For charts, the right options are available for every requirement, from a simple wall mounting to an automated exchange chart holder.
AnalysisThe iQ-Analyzer is an excellent tool for image quality analysis based on international standards and our experts’ extensive experience. Test data can be generated in a user-friendly manner and the computer results are provided as a text or XML fi le.
CONSULT DESIGN IMPLEMENT
MOUNTINGTEST CHARTS
Details on the products can be found on their respective product page.

imageQualitysolutions
10
TURNKEY SOLUTIONS
BASIC
EXPERT
LENS
Providing as much information as possible with a budget-friendly setup, the Basic Kit contains everything you need to set up a test environment for a large variety of cameras. The most important component is the TE42, our multipurpose test chart that covers the most relevant image quality parameters. The TE42 works smoothly with the iQ-Analyzer software; from a single image you can check the resolution at the image center and the corners, as well as texture loss, distortion, shading, color reproduction and noise characteristics. The Tungsten halogen light units with softboxes are suitable to illuminate the refl ective charts. These bulbs provide a uniform illumination, which makes setup quick and easy and ensures reliable color measurement by providing a continuous light spectrum. What is the easiest way to hold the test chart? Simply mount it to the wall with the iQ-Wallmount.
Do you develop high quality cameras? If so, then you should also be using high quality test equipment. The Expert Kit contains everything you need for precise testing. In order to receive comprehensive information about the system being tested, several images need to be taken of different test targets. To make testing fast and convenient, we have developed the iQ-Chartmount-V, which reduces time spent on camera setup when switching charts. The charts are stored and protected in the Chartmount-V and each time one is needed, it can easily be pulled into position by using a handle without actually touching the chart. When the camera is mounted on top of the iQ-Bench it can simply be moved back and forth, wasting no time with realignment while keeping testing fast and reliable. Also in the kit is the iQ-Analyzer software, which analyzes the images captured from the various test targets. The selection of high quality test charts that are included comply with the latest ISO standards and cover the most important aspects of image quality analysis. This includes a
The lens is a vital part of an imaging system, so it is worth a detailed check. All of the tools needed to analyze a lens are included in this package. The most important criterion that describes a lens is the Modulation Transfer Function (MTF). Using the TE268 test chart, in combination with the iQ-Analyzer, you have an ISO 12233 compliant solution that provides a deep insight into the lens and system performance. With 25 sinusoidal Siemens stars, you can obtain up to 600 MTFs for different positions in the fi eld, as well as different orientations from a single image. Distortion and shading, the two other major quality aspects of a lens are just a picture away. The TE251 slides quickly into the fi eld of view using the vertical iQ-Chartmount-V, making checking distortion and chromatic aberrations quick and easy. The LE6 * with test chart TE255 provides a uniform fl at fi eld, perfect for shading measurements on an extremely high precision level. Do you need
All you need for basic camera assessment
The advanced solution with various charts and features
Get to know your lens-camera system in detail
detailed check of the resolution at 25 different areas in the image, the color reproduction of 140 different color patches, detailed geometric distortion, noise and dynamic range measurements from a high dynamic range test chart, and shading in every detail. High quality lighting is crucial for obtaining meaningful results. The LE7, with its unique LED technology, is perfect for this task as transparent targets and the halogen lamps guarantee high quality for the illumination of refl ective charts.
to check a zoom lens? The iQ-Monopod, together with the 3-Way camera head, takes the hassle out of the camera’s alignment to the chart. The iQ lab uses this setup to test hundreds of lenses a year.
The chart can be mounted tightly and does not occupy any fl oor space. Finally, there is a 3-Way head on top of the tripod, which makes it easy to align the camera to the chart for the most meaningful results.
*LE7 upgrade available.

imageQualitysolutions
11
TURNKEY SOLUTIONS
TIMING MEASUREMENT
IMAGE STABILIZATION
SECURITY
An international standard on how to measure shutter release time lag, shooting time lag, shooting rate and startup time is available now. Since Image Engineering is part of the ISO group that developed this standard and Dietmar Wueller, our CEO, has been the editor of the document, we know it very well and have designed a Timing Measurement Kit, according to ISO 15781, to meet the requirements. The iQ-AF Box, with dimmable fl uorescent tubes, illuminates the TE261 test chart and is slightly more sophisticated than the chart printed in the standard itself. With its slanted edges, it can also be used for resolution measurements and focus accuracy tests. Two LED-Panels in the upper left and lower right corners are electronically connected to be started simultaneously from a single switch. Whichever LED-Box shows the earlier LED lighting up in the image, after pressing the shutter release button, is the one that will be used for the analysis. We also deliver an
Capturing well-focused high-resolution images, even under low light conditions, is one of the major performance characteristics of a digital camera. This is the reason why many cameras have built-in image stabilization.We have developed our Turnkey Solution "Image Stabilization" to evaluate the performance of the optical or electronic image stabilization systems built into cameras. The solution is built around the compact and highly dynamic camera-shaking device called STEVE-6D, which has an unique 6 axis positioning system. When using the included software solution, the tester can defi ne any arbitrary motion with six degrees of freedom, thus putting STEVE-6D in a controlled vibration. The software also controls iQ-Trigger, a remote-controlled "mechanical fi nger," which presses the camera’s shutter button. The resulting images are evaluated
The new IEC 62676-5 standard has been developed to make the specifi cations for video surveillance comparable. This standard specifi es measuring methods, while also unifying the presentation of image quality criteria. The IEC 62676-5 standard more appropriately prepares the documentation concerning the quality of surveillance cameras for all parties involved.The arrangement of this Turnkey Solution allows measurements to be carried out according to specifi cations. The package contains the resolution chart TE253 with Siemens stars. The OECF test chart TE269C fulfi lls the requirements for the special distribution of gray scale. Moreover, this allows for the determination of the dynamic range, the OECF and the image noise (SNR, visual and temporal noise) of a camera system. Distortion can be measured using the TE251. The TE281 fl are chart is included to assess
Beyond start up time and shutter lag
High performance and comprehensive image stabilization test equipment
Get prepared for IEC 62676-5, the new image quality standard for surveillance cameras
iQ-Trigger with the kit to operate the switch accurately. The iQ-Trigger can be attached to a tripod and adjusted to operate the exposure button and the switch at the same time.
by the software’s analysis module. The results provide insight into the image stabilizer’s performance. The set up combination of the the STEVE-6D, iQ-Trigger, the Honeycomb Breadboard, (used to mount STEVE-6D), and the iQ-AF Box with the TE261 chart, enables a comprehensive test and analysis of the performance of image stabilization systems.
susceptibility to stray light. The maximum frame rate can be determined under given lighting conditions using the LED-Panel. Also included are all modules for the best possible lighting and exposure measurement, devices for fi tting, the charts, the camera, and the proven iQ-Analyzer analysis software.
For assembling each kit, please see the following table.

imageQualitysolutions
12
TURNKEY SOLUTIONS
Turnkey Solutions
Products Product Description
Test charts
Universal Multipurpose
TE42 multipurpose test chart ∙ A1066 x x
TE261 slanted edges 16:9 ∙ A1066 x x
Resolution
TE253 9x modulated sinusoidal Siemens star ∙ A1066 S/H/L x
TE268 combinaton of resolution pattern ∙ A1066 x x
Color
TE230 X-Rite ColorChecker SG mounted on TE182 x
OECF
TE264 OECF 20 ISO 14524 / 1573 9 revision ∙ D280 x
TE269 OECF 36 ∙ D280 A/B/C xC
Geometry Grid Registration
TE251 distortion ∙ chromatic aberration ∙ crosses ∙ A1066 x x x
Signal Evaluation
TE255 diffusor plate (for shading measurement) ∙ D280 x x
TE285 IR refl ection ∙ A360 x
Black To White
TE281 fl are target according to the upcoming ISO 18844 ∙ A1066 x
Mounting
Chart Mounting
iQ-Wallmount wall mounting frame for charts in size ∙ A1066 x
iQ-Chartmount-V* vertical sliding chart holder with integrating sphere support x x x
Camera and Illumination Mounting
Manfrotto 055XPROB the 055XPROB is an extremely versatile tripod x x
Manfrotto Junior Geared Head 410 this unique head offers gear movement in three directions x x x x x
iQ-Monopod mono stand with rail system for precise camera positioning x x
iQ-Cameramount special mount for vertical and horizontal camera movement x
iQ-Bench* a system based on a linear guide that can be motorized x
Camera plate camera mounting for STEVE x
iQ-Mobilemount tripod mount for mobiles and tablets x
HoneycombBreadboard platform for mounting STEVE-6D x
llumination Devices
Back Illumination
LE6 integrating sphere with halogen light source x
CF-5400 conversion fi lter 5400 K for LE6 ∙ D280 x
LE7* 4x integrating sphere that uses the new iQ-LED light source x x
LG3* lighting box with a wide range of intensities and special fl icker mode x
Front Illumination
Hedler Tungsten halogen light tungsten halogen bulbs 2 x 2 x 2 x
Fluorescence Illumination fl uorescent tubes 2 x
Measurement Devices
STEVE-6DS or STEVE-6DL camera shaking device x
iQ-AF Box illumination box with four dimmable fl uorescent tubes x x
LED-Panel*to determine shutter and shooting time lag, autofocus time, frame rate and exposure times of digital imaging devices
2 x x
iQ-Trigger* and/or iQ-Trigger-T* mechanical fi nger that can press the shutter release button x x
Gossen Digipro F2 exposure meter for high precision incident light measurement x
Gossen MAVOLUX 5032 B USB digital luxmeter and luminance meter class B x x x
PRC Krochmann RadioLux 111 digital luxmeter and luminance meter class L x
Software
iQ-Analyzer image quality analysis software x x x x
LED-Panel control and analysis x
STEVE-6D control and analysis x
Basic
Expe
rt
Lens Ti
min
gM
easu
rem
ent
Imag
eSt
abiliz
atio
n
Secu
rity
* API (application programming interface) available

13
imageQualitytools
The spherical illuminator works on the principle of an integrating sphere
Integration sphere for the measurement of light sources in the medical area
A halogen light source illuminates the interior of the sphere, which is coated with a special white diffuse coating. Due to the internal design, the measuring window can be used up to a picture size of 280 x 210 mm, and is illuminated extremely uniform. A special construction allows dimming the light down to approx. 1% of the maximum illumination without changing the color temperature. For LE6 illuminators, a USB interface is available as an option. Meaning the light intensity can be measured and controlled by a Windows PC.
The CAL4 was developed for measuring resolution, color, OECF, dynamic range and noise when using the endoscopy light source. The integrating sphere provides a uniform illumination over the whole chart plane. Simply connect the integrating sphere with the endoscopies (light projector) light source, to a fi ber optic cold-light cable, by using one of the four adapters that are compatible for the most common light projectors.
Main Features:
• high intensity of approx. 8000 lx (LG6-50 3000 lx)• minimal intensity of approx. 80 lx (LG6-50 30 lx)• thermal radiator with 3200 K +/- 50 K• constant spectrum over the entire intensity range• changing of the color temperature through fi lters• high homogeneity >96%
Main Features:
• high homogeneity >97% in the active area• adaptable to the most common light projectors
Main Features:
• high intensity >150,000 lx• low intensity <10 lx• fl icker mode with adjustable frequency and duty cycle• high homogeneity >95%• dimmable in fi ne steps• stabilized intensity in normal and low intensity mode• correlated color temperature (CCT) of 5000 K
Via the external control and supply unit, two illumination
methods can be selected in three intensity ranges.
1. Pulse width modulation PWM2. Flicker modus 10-500 Hz
Each with:
• normal modus: 0-100% 32 kHz / <100 to >65000 lx• low modus: 0-100% 32 kHz / <10 to >6500 lx • high modus: 100% max. 60s lighting duration / >150000 lx
LE6 CAL4
Dimmable lighting box with extremely high intensity and variable fl icker modeThrough modern lighting technology, the LG3 creates new possibilities in image laboratories by considerably expanding the test areas for dynamic range measurements. The LG3 is capable of illuminating a high contrast test target with over 150,000 lx. As a result, measurements of high dynamic range can also be achieved with short, practical exposure times. In addition, the user can dim the intensity while the LG3 temperature management ensures that the light CCT (correlated color temperature) does not change. Another unique aspect of the LG3 is the fl icker mode. With this feature the user can choose between a constant pulse width modulation mode of 32 kHz and variable duty cycle, or the fl icker mode with a range of 10 to 500 Hz and variable duty cycle. With the LG3, light sources working with variable frequencies can be simulated, e.g. traffi c lights, vehicle and street lighting. Now cameras in the security and automotive area can be tested and optimized for a wide range of real life situations.
LG3
ILLUMINATION DEVICES
For technical specifi catons, please see the following table.
pre-production sample image

14
imageQualitytools
Create your own light by adjusting the 22 channels in the visible range to suit your needs. You can automatically simulate standard light sources, reconstruct the daylight distribution from dawn until dusk, create patches of a high-saturated color chart, or reconstruct the spectral distribution of a measured light source. By using the individual channels, you can even measure the spectral sensitivities of a camera.
The iQ-LED provides you with the closest match to standard D light sources in a broad range from 400 up to 820 nm. Aside from many other predefi ned light sources, you will also be able to generate your own custom spectra in combination with the spectral radiometer EX1. The intensity variation is realized with a pulse width modulation (PWM) of 32 kHz, in order to enable working with short exposure times. Linear tuning of the intensity for each channel using 1000 steps provides an accurate way to manipulate every part of the spectrum. The internal temperature stabilization enables a constant spectrum for a period of a fraction of a second, to well over a few hours. A software-based, quick and easy self-calibration avoids any kind of effects caused by burn-in or long-term degradation of the LEDs on predefi ned spectra, ensuring a long lifetime. Due to its extremely short response time, light settings can be changed with frequencies of up to 40 Hz. The technical characteristics of the iQ-LED are particularly designed for the higher requirements in the area of camera testing and camera calibration. On request, we supply the iQ-LED system (single or multi iQ-LED devices) as a stand-alone version. We combine it with a NIST traceable calibrated micro spectrometer and the control software, which allows you to create your own light source adapted to your needs.
The standard module of the iQ-LED consists of 22 different channels and 80 LEDs arranged on a 10 x 10 cm board. This board can be combined with other boards to form larger and more intense light sources. The iQ-LED extension module was developed to extend the spectral range to the infrared region. It also consists of 80 LEDs on a 10 x 10 cm board, but it has 11 channels mostly in the IR region. It is typically used
The most fl exible LED-based light source is the heart of all adaptive Image Engineering lighting products
ILLUMINATION DEVICES
iQ-LED TECHNOLOGY
in combination with two standard iQ-LED modules so as to level the intensities of all channels. In order to offer you an opportunity to integrate the iQ-LED in your individual test procedures, we optionally provide a C++ Application Programming Interface (API) for the entire iQ-LED product line.
Main Features:
• predefi ned standard illuminants (A, B, C, D50, D75)• black body curve by selected CCT (correlated color
temperature)• auto generation of external measured or imported spectra • creation of individual test sequences • real time display of spectral measurement • real time calculation of CCT, CRI, illumination level• C++ API available
iQ-LED
Comparison of D65 spectra:HQ Fluorescence and iQ-LED
0,00
0,20
0,50
0,75
1,00
400,0 450,0 500,0 550,0 600,0 650,0 700,0 750,0 800,0
Wavelength (nm)
D65 standard illuminant
D65 iQ-LED generated
D65 HQ fluorescence light
Rel
ativ
e Po
wer
LE6-50 LE6-100 LG3 CAL4
Principledimmable halogen light source with constant color temparture
dimmable halogen light source with constant color temparture
light source with a wide range of intensities and special fl icker mode
special solution for medical application
Light source 12 V / 50 W halogen bulb 12 V / 100 W halogen bulb 432 LEDsadaptable to the most common projectors
Color temperature 3200 K +/- 50 K 3200 K +/- 50 K approx. 5000 K +/-5% depends on the projector
Maximum / Minimumillumination values
approx. 30 - 3000 lx approx. 80 - 8000 lxlow modus: <10 to >6500 lxnormal modus: <100 to >65000 lxhigh modus: >150,000 lx
depends on the projector
Uniformity of illumination >96% >96%
>95% for active chart area*,280 x 157.5 mm>95% for full output window*,290 x 220 mm>95% (70 mm diameter circle)*approx. 90% at very lowintensity (intensity <1%)
50 mm x 50 mm output >97%
Dimmable 1 - 100% of max. illumination 1 - 100% of max. illumination
approx. 1000 steps in 2 modesfeedback of illumination levelin [%] and illuminance [cd/m²]32 kHz PWM
depends on the projector
Power supply80 W / 90 - 260 VAC50/60 Hz
120 W / 90 - 260 VAC50/60 Hz
110 V / 230 V, 400 W depends on the projector
iQ-LEDTECHNOLOGY
* measured on chart plane
APIAVAILABLE

15
imageQualitytools
The LE7 is based on a 0.5m integrating sphere. The main version is equipped with two iQ-LED elements (for very high illumination levels, versions with four and six iQ-LEDs are also available). Due to the optimized positioning of the iQ-LED elements in the upper and lower front areas of the machine, a 97% uniformity is reached in the active chart area. By keeping a constant spectral distribution, the predefi ned illumination level can be changed by simply typing in a new illumination value into the control software. To give you an even more personalized approach, individual spectra can be generated. Combined with EXI, the device allows you to reproduce your individual light sources, with a high accuracy guaranteed in any light source at every intensity level. The LE7 comes in a lightproof-box, with an integrated micro spectrometer to verify your spectral distribution in real time, similar to our CAL1. Moreover, when linked with the iQ-LED C++ API interface, it is possible to integrate the control into custom software, or create your own operating software.
Main Features:
• high homogeneity >97%• free selectable spectral distribution• constant spectral distribution for every intensity level
Uniform, multispectral, iQ-LED powered chart illumination par excellence
LE7
ILLUMINATION DEVICES
LE7 WITH 2 iQ-LED LE7 WITH 4 iQ-LED LE7 WITH 6 iQ-LED LE7-IR
Principle integrating sphere
Light source
2 x iQ-LED160 LEDs, 22 channels(20 color, 2 white)32 kHz PWM
4 x iQ-LED320 LEDs, 22 channels(20 color, 2 white)32 kHz PWM
6 x iQ-LED480 LEDs, 22 channels(20 color, 2 white)32 kHz PWM
4 x iQ-LED2 x iQ-LED IR extension480 LEDs, 33 channels(31 color, 2 white)32 kHz PWM
Spectral range 400 – 820 nm 380 – 1050 nm
Predefi ned standard illuminants D50, D55, D65, D75, A, B, C Planckian spectral curve by selected temperature (1900 - 18,000 K)
Uniformity of illumination active chart area (>97%) resp. full chart area (>96%)
Illumination stability +/- 2%**+/- 2% (380 – 820 nm) +/- 4% (820 – 1050 nm)
Maximum / Minimumillumination values
Standard D illuminants: 1400 lx Standard D illuminants: 2800 lx Standard D illuminants: 4200 lx Standard D illuminants: 2800 lx
max: up to 2000 lxmin: down to 25 lx
max: up to 4000 lxmin: down to 25 lx
max: up to 6000 lxmin: down to 25 lx
max: up to 4000 lxmin: down to 25 lx
max. and min. depending on illuminant and required curve fi t/CRI
for low intensity use the system can be combined with a neutral density fi lter
Intensity use depending on illuminant, for low intensity use the system can be combined with a neutral density filter
Spectral measurement integrated NIST traceable calibrated micro spectrometer
Spectral range /spectrometer 350 – 800 nm / resolution: 1024 pixel350 – 1050 nmresolution: 2048 pixel
Featureseasily adjustable spectral distribution of the emiting light via 22 (LE7-IR 33) software controlled LED channels, standard illuminants or reproduction of external measured spectra, self defi ned arrangements including single channels for color calibration, creation of test
sequences, application programming interface (API) available on request
LE7-IR
LE7-IR is a unique device for illuminating transparent test charts, and also to test and calibrate cameras that are sensitive to infrared light. Essentially it is an advanced LED light source that can emulate nearly every spectral characteristic of light in the range from 380 up to 1050 nm. The LE7-IR has four iQ-LED modules with 22 channels that cover the visible spectrum and two additional iQ-LED extension modules with 11 channels, mostly in the IR region, for extending the spectral range. The spectral compilation is evenly distributed over 31 color LED channels and two white LED channels.
Tuneable light spectrum extended to IR
** measured for selected standard illuminants after changing an illuminant at optimal temperatureSee complete datasheet for detailed information.
Main Features:
• high homogeneity >97%• extended spectral range from 380 up to 1050 nm
APIAVAILABLE
APIAVAILABLE
iQ-LEDTECHNOLOGY
iQ-LEDTECHNOLOGY

CAL1
CAL3
CAL
Its compact design consists of one iQ-LED element in a 0.3 m integrating sphere that illuminates a 70 mm opening.
Its design consists of one spectral programmable iQ-LED element in a 0.3 m integrating sphere that illuminates a 38 mm concave curved luminous surface.
Today more than ever camera technology is subject to constant change. In order to keep pace with the market’s quality requirements, the need for a reliable test system grows. For the characterization and calibration of cameras in the laboratory, or in the production line, the specialists of Image Engineering have developed the CAL product line. These compact calibration light sources are equipped with multispectral iQ-LED technology and offer the highest degree of fl exibility in your choice of lighting type. You only need one device for all light sources such as A, D50, D65, or any other standard light source or self-generated spectra. For spectral sensitivity measurements, the CAL product line allows for the individual activation of each of the 20 narrow band color channels. The special design, connected with a non-refl ecting special diffuser fi lter, ensures an even light distribution on the measuring
The one light source solution in the fi eld of camera characterization and calibration
Camera calibration light source based on iQ-LED for wide-angle lenses
Camera characterization and calibration light sources
plane. As a result of the iQ-LED's very short response time, a full calibration can be performed in a few seconds if the image processing and transfer in the camera is fast enough.The easy-to-use iQ-LED control software controls the CAL devices or, if upgraded with the iQ-LED C++ API, they can be integrated into your individual test procedures.
Possible applications are:
• calibration of the exposure control• detection of defect pixels• determine the luminance and color shading• check of the auto white balance under various light sources
(i.e. A, C, D50 D55, D65, D75)• measurement of the spectral sensitivity
Main Features:
• high homogeneity >98%• fast calibration• free selectable spectral distribution• integrated micro spectrometer
Main Features:
• high homogeneity >95%• fast calibration• free selectable spectral distribution• concave curved luminous surface for wide-angle lenses• integrated micro spectrometer
16
imageQualitytoolsILLUMINATION DEVICES
APIAVAILABLE
APIAVAILABLE
iQ-LEDTECHNOLOGY
iQ-LEDTECHNOLOGY

CAL2
iQ-ALIGN
The small light source for the fl exible integration into a production line
Precise adjustment for extreme wide-angle cameras in front of calibration light sources CALI and CAL3
The CAL2 is also based on our 22 channel spectrally tunable iQ-LED light source and can be adapted for the use in many different areas. Therefore, this device can substitute for multiple devices on a production line. It solves 90% of all calibration issues and it saves time and money. The 60 x 60 mm large opening allows you to calibrate multiple cellphone camera modules at the same time, while also making calibration faster and more accurate than with any other device.
The device can also be used for camera calibration and testing purposes when space is limited. In this case, the spectrometer, utilized for calibrating the device, is separated from the light source. This means one single spectrometer can be operated for several calibration stations equipped with the CAL2. Should there be any special requirements regarding implementation into your test setup and workfl ow, the whole system can be customized to fi t your needs. The special internal design, for which we have a patent pending, allows you to achieve a similar uniformity (>96%) and intensity (up to 3000 lx) that we have in the CAL1 with its integrating sphere.
For a comfortable and precise adjustment of cameras in the security and automotive area, we recommend iQ-Align. It can be used with the calibration light sources CAL1 and CAL3. The camera align system is based on a linear guidance in combination with an iQ-Mobilemount.
Main Features:
• high homogeneity >96%• fast calibration• free selectable spectral distribution• micro spectrometer for calibration• ideal for production line integration
17
imageQualitytools ILLUMINATION DEVICES
CAL1 CAL2 CAL3
Principle integrating sphere our patented edge box with adaptable design integrating sphere
Light source 1 x iQ-LED: 80 LEDs, 22 channels (20 color, 2 white) / 32 kHz PWM
Spectral range 400 – 820 nm
Uniformity of luminancein active area
70 mm circle* output >98% 60 x 60 mm output window >96%>95%* for FOV <160° at min. 10 mm depth inside diffuser for 160°- 180° FOV and at min. 20 mm depth inside diffuser
Predefi ned standard illuminants
D50, D55, D65, D75, A, B, C, Planckian spectral curve by selected temperature (1900 up to 18,000 K) depending on illuminant
Illumination stability +/- 2%**
Standard D illuminants 2000 lx 1700 lx
Maximum / Minimum illumination values
max. up to 3000 lxmin. down to 25 lx
max. up to 3000 lxmin. down to 25 lx
max. up to 2500 lxmin. down to 25 lx
depending on illuminant and required curve fi t / CRI
* measurement performed in the center of diffusor, standard illuminant D65** measured for selected standard illuminants after changing an illuminant at optimal ambient temperature
APIAVAILABLE
iQ-LEDTECHNOLOGY

18
imageQualitytools
iQ-FLATLIGHT
EX1
Measure daylight or light sources with one of the smallest calibrated spectral radiometersThe EX1 is based on the same micro spectrometer that is used in our adaptive lighting products. With its compact design and connection through just one USB cable to your laptop, you can measure the spectral distribution of any kind of light source when and wherever needed. The EX1 comes fully NIST traceable calibrated and with an easy-to-use software. After measuring a light source, you can import the spectral distribution to all of your iQ-LED products control software and reproduce it in just a few seconds.
Main Features:
• usable everywhere• easy and quick handling• measure spectral distribution
The spectrally tunable source to illuminate large areasThe iQ-Flatlight is designed to illuminate larger areas, such as our size A1066 test charts, or even small rooms with the comfort of a spectrally tunable light source. Based on your needs, you can select every spectral distribution from the standard D50, or D65 over tungsten to narrow band colored illumination. The iQ-Flatlights are normally sold as a pair, where each of the two units has an approximate luminous area of 0.7 x 0.7 m2 and consist of 10 or 20 iQ-LED modules. The construction allows the lights to be fi xed on ceilings or walls in different ways. In combination with a camera test stand, they come on rollable stands that can be adjusted in front of the test charts in a fl exible way to achieve uniform illumination. The illumination of large charts and areas has never been more fl exible.
Main Features:
• illuminates large areas• fast calibration• free selectable spectral distribution• micro spectrometer included
EX1
Principle linear CMOS detector, directive measurement (~25º FOV)
Spectral range 350 – 800 nm
Resolution 1024 pixel
Integration time 10 μsec. – 10 sec.
Control system software based control
System requirements Windows 7 operating system (or higher)
Recommended calibration period
once a year, regardless of the operating hours
iQ-FLATLIGHT
Principle diffuse light panel
Light sources10 or 20 Image Engineering iQ-LED units:80 LEDs/unit / 22 channels (20 color, 2 white) / 32 khz PWM /1 or 2 F11 fl uorescent tubes OSRAM L 18W/940
Spectral range 400 – 820 nm
Predefi ned standard illuminants
D50, D55, D65, D75, A, B, C, Planckian spectral curve by selectedtemperature (1900 up to 18,000 K)CRI up to 99, depending on illuminant and intensity
Illumination stability +/- 2%**
Maximum / Minimum illumination values
10 units | two fl atlights, illumination on chart:predefi ned illuminants: up to 400 lxwithout defi ned spectra: up to 1000 lx
20 units | two fl atlights, illumination on chart:predefi ned illuminants: up to 800 lxwithout defi ned spectra: up to 2000 lx
condition:two iQ-LED fl atlights placed beside a IE A1066 size test chart in~80 cm distance and ~45° viewing angle
ILLUMINATION DEVICES
APIAVAILABLE
iQ-LEDTECHNOLOGY
** measured for selected standard illuminants after changing an illuminant at optimal temperature

19
imageQualitytools
Compact LED illumination unit for refl ective charts
Resolution of high fi eld of view cameras under close scrutiny
ILLUMINATION DEVICES
The iQ-Chart Box makes it possible to illuminate refl ective test charts quickly and homogeneously. It is the compact solution for providing optimal conditions for the image quality testing of cameras and cell phones. The light source consists of 8 iQ-LED modules that are spectrally tunable so that D50, D65 or tungsten illuminants, as well as custom spectral distributions can be created. Chart changing is carried out quickly and easily by means of a movable carriage. For automated testing, a C++ API is available just as it is for all the other iQ-LED based products.
Measuring the resolution of high fi eld of view cameras requires a specifi c solution. The iQ-FoV Box is the fl exible tool to perform image quality measurements for resolution aspects. Due to the adjustable positioning of the test charts, the distortion of the test pattern in the image is minimized and the analysis method for slanted edges is applicable. Images, corresponding to one of the two specifi ed setups, can be analyzed automatically with the iQ-Analyzer.
Main Features:
• compact• high uniformity • free selectable spectral distribution• creation of test sequences• low light conditions with ND fi lters down to 1,5 lx • auto generation of external measured spectra • spectrometer (350 – 800 nm) NIST traceable• iQ-LED control software• C++ API is available
Main Features:
• for fi sheye cameras up to a viewing angle of 180°• fl exible positioning of test charts • dimmable illumination• accurate positioning system for the camera
* measured at center of A460 sized test chart
iQ-CHART BOX
iQ-FOV BOX
iQ-CHART BOX
Principlechart holder with illumination device(includes micro spectrometer), software controlled
Light sources
8 x Image Engineering iQ-LED units: overall 640 LEDs2 white and 20 color channels, 32 khz PWM,spectral range: 400 – 820 nm ,4 x 18 W fl uorescent tubes D50
Maximum / Minimumillumination values
max. up to 500 lxstandard D illuminants: 400 lx*min. down to 25 lx with ND fi lters down to 1,5 lux*(depending on illuminant and required curve fi t / CRI)*
Dim functionsoftware based by presetting of intensity (lx / watt) while calibration device is connected, further dimming via included ND fi lters1000 step software based dim control (fl uorescent tube)
Predefi ned standardilluminants
D50, D55, D65, D75, A, B, CPlanckian spectral curve by selected temperature (1900 - 18,000 K)
iQ-FOV BOX
Principle test box for high fi eld of view cameras
Light sources 8 x fl uorescence tubes 18 W / 950, dimmable D50
Extension arm travelrange (depth / height)
75 cm / 15 cm
Rotation rangePitch: +/- 15°Yaw: +/- 170°(motorized adjustable via remote control)
Rotation range roll +/- 10° (manually adjustable)
Interior with measurement scales
APIAVAILABLE
iQ-LEDTECHNOLOGY

20
imageQualitytoolsMEASUREMENT DEVICES
Although test charts are used to test digital cameras and perform objective measurements, there are certain aspects when testing a camera that require a real scene. One aspect is correct white balancing for different types of illuminants. Another is the determination of the visual loss of detail due to noise reduction. So, while it is of course possible to perform tests with real scenes, the question becomes, how to make these tests comparable over time? Not only that, but how best to compare results with others from around the world?
To answer these questions, Image Engineering has developed the lightSTUDIO. It provides the standard types of illumination, and at a height of 60 cm, width of 125 cm and depth of 75 cm, it is large enough to illuminate an entire tabletop scene. In order to achieve a worldwide comparison between labs, the lightSTUDIO comes with the complete interior (see picture to the right). Each object* was carefully chosen after extensive testing to determine which ones provide the most unique information.
Main Features:
• reproducible illumination of an entire tabletop scene • switchable light settings • comparison of testing results between different labs • different test criteria• different options available
lightSTUDIO-L with iQ-LED lightHEAD (API available)
The lightHEAD can be exchanged for a LED based one that uses 20 narrow band LED channels and 2 white LED channels to spectrally match almost every standard light source. One set of fl uorescent tubes has also been added to get the spiky spectrum characteristic for these sources.
lightSTUDIO-M with moving targets
When comparing compression technologies, artifacts, motion blur and other aspects in videos, the lightSTUDIO can be equipped with moving targets. One of these is a horizontally moving frame that can hold a variety of targets, including a dead leaves target or a slanted edge target. A second movable section is a rotating plate located on the back wall of the box, which also allows for speed adjusting (up to 600 rpm). In order to stabilize the whole setup with moving parts, the option for moving targets also comes with a rack on which the box is mounted.
lightSTUDIO-H with HDR option
Another aspect that is important for modern digital cameras is the ability to capture high contrast scenes. In order to really create a high contrast scene, it is necessary to add some back illuminated test patterns or images to the box. Two LG light boxes with transparent charts are used for this purpose. In order to avoid stray light, which reduces the contrast in the foreground, the light boxes are placed in the back of a surrounding black box. This box is inserted in the center part of the back wall of the lightSTUDIO. Contrast ratios of more than 10,000:1 can be reached.
lightSTUDIO-T with twin option
The lightSTUDIO Twin offers a space-saving solution for multiple scenes with different illumination. With the same footprint as the lightSTUDIO standard, it provides two separated chambers with independent light sources. Auto white balance can be tested under specifi c conditions. The “Twin” option can also be used as a standard lightSTUDIO when the separated light sources are controlled simultaneously.
A mixture of additional features is possible.
*The interior of lightSTUDIO can change, please have a look at lightSTUDIO interior changelog.pdf on our website (www.image-engineering.com).
LIGHTSTUDIO
Additional features
Standard lightSTUDIO-S*
Moving charts in front of the background
HDR option
Twin option
Real scene lighting for visual analysis
APIAVAILABLE
APIAVAILABLE
APIAVAILABLE
iQ-LEDTECHNOLOGY
iQ-LEDTECHNOLOGY
T i ti
Standard features of the lightSTUDIO
USB interface dimmable several illuminants interior inclusive

21
imageQualitytools
* In this context, Image Engineering uses the term "RAW fi le" for fi les that are created by a digital camera in "RAW-Mode" and are readable by the software dcraw. This does not include RAWfi les that do not follow any readable image fi le format. You will have to convert these fi les to 16 bit linear tiff fi rst.
CAMSPECS SOFTWARECAMSPECSMeasure spectral sensitivity fast and effi cientlycamSPECS is a fast and affordable solution for measuring the spectral sensitivity of a digital camera system because all interference fi lters are mounted in a single "test chart" (access to RAW image fi les* required). It contains the hardware and software tools that are necessary to perform the measurements.
The camSPECS hardware consists of metal housing with a stabilized power supply for the halogen light source. The 39 interference fi lters are mounted to the front plate. The interference fi lters provide monochromatic light from 380 nm to 760 nm. Inside the housing, the device is equipped with a heat absorbing fi lter, a diffusor plate and a neutral density fi lter plate for each interference fi lter. The last provides almost equal power output for the interference fi lters, so that the dynamic range of a typical consumer camera is not exceeded. Neutral density fi lters in between are used to compensate for possible non-uniformities (such as shading in the camera) over the fi lter area.
Convenient evaluation softwareThe evaluation software makes measuring fast and convenient. It calculates the spectral sensitivity with the images and the calibration data of the fi lters as a direct measurement (similar to a monochromator). The software reads image fi les such as TIFF or common RAW fi les* and can perform a dark frame subtraction if needed. Non-Bayer pattern sensors (e.g., sensors with RGB-IR or RGBC pattern) can also be evaluated. In this case, all four channels are measured independently.
The main application for the spectral sensitivities is the calculation of color correction matrices (CCM). With the CIECAM16 model and the export of ICC and Adobe ACR profi les with 2D and 3D-MLUT rendering. An additional feature incorporates the assessment of the measurement setup by comparing real camera data with predicted RGB values.
For the calculation of individual CCMs, the spectral radiances of natural objects from the in-situ database may be applied. The software incorporates a fast and database-driven measurement of spectral sensitivity using the iQ-LED technology. With focal plane captures of all single channels of an iQ-LED device (such as the CAL2), and the corresponding spectral power distributions, it is possible to measure spectral sensitivities in the end-offl ine production. For high precision measurements, the creation of a dedicated database of two master cameras is the sole requirement. For a standard application, a ready-to-use database is available.
MEASUREMENT DEVICES
HARDWARE
Principleillumination box with fi lter panel Spectroradiometer EX1 for calibration
Light sourceHalogen (24 V / 250 W) Osram 64657 HLX
Durability of light source 300 h
Wavelength range380 - 760 nm (10 nm steps)
Bandwidth 10 nm (380 - 760 nm)
Off band rejection 4.0 optical densities
Diameter interference fi lters
10 mm
Diameter ND fi lters 6 mm
SOFTWARE
spectral sensitivity measurement
spectral sensitivity measurement based on iQ-LED technology applicable for production line
creation of ICC and Adobe ACR profiles
use of 2D- and 3D-MLUT for profile creation
CIECAM16 implementation for profile creation
test procedure for evaluating CCMs with different training data
RAW file* processing / dark frame subtraction / batch processing
validation by comparing camera and predicted RGB values
generation of Color Correction Matrices (CCM) (RGB to XYZ and RGB to sRGB) with three different algorithms
calculation of white balance multipliers
calculation of Digital Still Camera / Sensitivity Metamerism Index (DSC/SMI)
visual evaluation of ICC profi les with real images
calibration with included spectro radiometer
export of all results to XML or plain text fi les

22
imageQualitytools
STEVE-6DL (large) STEVE-6DS (small)
STABILIZATION EVALUATION EQUIPMENT
STEVE-6D
Automated OIS testsThe Stabilization Evaluation Equipment (STEVE) was designed for the qualitative analysis of image stabilizing systems under reproducible, realistic conditions. The STEVE bundle, composed of hardware and software, is designed for performing custom handshakes, and calculating the image stabilization performance of optical and electronically stabilized systems.
Automated OIS tests with six degrees of freedomThe STEVE-6D permits high precision and fast simultaneous movements in as many as 6 degrees of freedom. The pivot point is freely selectable. Every axis is separately controllable by using CIPA, custom waveform data or a sine wave generator.
STEVE-6D is available in two versions with the same range of functions, but they differ in the maximum possible load (up to 2.5 kg for the STEVE-6DS and up to 6kg for the STEVE-6DL). The measurements from STEVE-6DS are much more accurate, while the STEVE-6DL is much faster. Both devices are certifi ed by CIPA under the conditions of Verifi cation Method of Vibratory Apparatus for CIPA DC-X011.
Included in the delivery for STEVE-6D is the hardware (hexapod), the control and analysis software, the automated shutter-triggering device (iQ-Trigger), as well as the iQ-Mobilemount. Ideally, STEVE-6D should be combined with the test chart TE261 and the iQ-AF Box.
Main Features:
• high precision and fast simultaneous movements• 6 degrees of freedom• custom waveforms• sine generator• freely selectable pivot point • STEVE-6D certifi ed by CIPA• control and analysis software included • iQ-Trigger and iQ-Mobilemount included
STEVE-2D STEVE
Yaw
Pitch
STEVE-2D
Stability measurementSTEVE-2D is calibrated to provide the best performance at the most signifi cant frequency / amplitude combination of the human vibration of 4 Hz and 0.2 degrees. The whole range of available frequencies and angles of the movement corresponds to the properties of the typical human vibration.
For the initial setup, the mounting stage allows for adjusting the camera position. The movement parameters of the two axes can be controlled separately. Moving along a single axis (yaw or pitch) is possible, as well as simultaneous operation in a parallel or antiparallel way. Both, simple sine shaped motion and individual curves (e.g. to simulate a real handshake), can be produced and logged.
MEASUREMENT DEVICES
Yaw
Pitch
Roll
horizontal axis
vertical axis
optical axis
To determine the infl uence of the handshake it is necessary to combine STEVE with a test chart. We recommend the iQ-AF Box with TE261.

23
imageQualitytools
SOFTWARE STEVE-6DThe software consists of two modules:
Main Features:
MEASUREMENT DEVICES
1. VIBRATION CONTROL moduleto control the movement
interface to STEVE-6D
pivot point can be freely selected
interface to iQ-Trigger
triggering of the camera
set up waveform data
• with the sine wave generator for every axis• choose one of the two/three CIPA handshakes• or upload a custom waveform with Cartesian coordinates
II. DATA ANALYZE modulecalculation of the image stabilization performance
Metadata tool
set camera metadatanecessary pixel pitch and shutter timeimage batch processing for IS-Performance calculationcomparison for IS on/off or estimated edge width
displays the results
• stabilization performance in f-stops• the edge spread function "ESF"• spatial frequency response "SFR"
OIS-PERFORMANCE CALCULATION
PRESENTATION OF THE RESULTS
METADATATOOL
SETUP WAVEFORM DATA
INTERFACE TO STEVE-6D
INTERFACE TO Q-TRIGGERi
VIBRATIO
N C
ON
TRO
L mod
ule DATA AN
ALYSIS m
odule
STEVE-2D STEVE-6DS (PI H-811) STEVE-6DL (PI H-840)
Max. camera weight 5.0 kg 2.5 kg 6.0 kg
Pivot point fi xed customizable
Translation range (X / Y / Z) not available ± 17, ± 16, ± 6.5 mm ± 50, ± 50, ± 25 mm
Rotation range (X / Y / Z) 0.1 - 0.5°(optimized for 0.1 - 0.2°)
± 10, ± 10, ± 21° ± 15, ± 15, ± 30°
Max. linear velocity (X / Y / Z) not available 25 mm/s 50 mm/s
Max. angular velocity (X / Y / Z) not available 325 mrad/s 600 mrad/s
Single-actuator design resolution - 80 nm 500 nm
Motion type 2-axis sine generator or custom waveform
6-axis sine generator or custom waveform
Mean position error < 5% < 3%
Standard accessories camera mounting stage, controller box, USB cable
motion controller C-887, iQ-Trigger, iQ-Mobilemount
Optional accessories iQ-Trigger/-T, iQ-AF Box, TE261, Honeycomb Breadboard, iQ-Anchor for STEVE
For detailed and technical specifi cations please have a look at www.imimag-engineering.com.

24
imageQualitytools
LED-PANEL
Principle array of LEDs to perform timing measurements on digital cameras
Operating mode external trigger,internal single trigger,continuous trigger
Adjustable times via USB: 200 μs to 10 s*manual control: 20 μs to 10 s*
Maximal reading measurement time
1000 x of set time
LED running direction left to right, right to left, top to bottom, bottom to top
Accuracy <0,06% from 1 ms to 10 s
display refresh rate adjustable from 1.0 Hz to 100 Hz
The iQ-Autofocus Box is designed to illuminate a test chart at different light levelsIn combination with the LED-Panel, the iQ-AF Box can be used for low/bright light shutter and shooting time lag measurements of digital cameras. The test pattern used supports the operation of different autofocus systems in order to ensure a reliable focusing ability. A switch can quickly shift between two previously adjusted light intensities without measuring the illuminance again. We recommend the Timing Measurement Turnkey Solution, which provides everything you need for timing measurement (page 11).
Precise timing measurement with software control and analysisThe LED-Panel V4 is the ideal time measurement device to determine the important timing values for digital camera systems. It is now possible to record extremely precise measurements with an accuracy greater than one millisecond with this device. The LED-Panel uses operator-friendly software and has a USB interface that is controlled from a computer. A command line interface next to the control software is also included.
With the LED-Panel the user can separately measure shooting time lag and shutter release time lag. Once measured, they then can be subtracted in order to have a precise auto focus performance. Also, the display refresh mode allows for the measurement of the display refresh rate, and the continuous mode is able to measure frame rate and exposure time. In the rolling shutter mode, the 10 LED rows move simultaneously. The direction of the LED sequence can be changed.
Main Features:
• storage for 2 intensities • easy switching between the stored intensities• fl uorescent tubes right/left/top/bottom can be switched on/
off separately• test pattern optimized for good focusing ability
Measurable Parameters:
• shooting time lag (including AF)• shutter release time lag• autofocus time• negative shooting time lag• burst frame rate• display refresh rate• exposure time• rolling shutter speed• startup time
Main Features:
• analysis of images, taken from the LED-Panel• creating individual test sequences• providing result output as text and XML fi le• can be combined perfectly with iQ-Trigger and iQ-AF Box
iQ-AF BOX
Principle light box with different light levels
Light sources 4 x fl uorecent tubes 18 W4 x fl uorecent tubes 36 WD50 (can be switched on/off separately)
Illumination values 20 - 3200 lx
Size of used test chart A1066 (124.5 x 83.5 cm)
Provided test charts TE261 (other on request)
Setting of light level two rotary control units
iQ-AF BOX
LED-PANEL
-AAututofofococusus BBoxox iiss dedesisigngneded ttoo ilillulumm
MEASUREMENT DEVICES
*depending on measurement mode

25
imageQualitytools MEASUREMENT DEVICES
Mechanical fi ngerTiming is a critical measurement for imaging devices. The human fi nger can be a source of inaccuracy that you want to avoid in a lab environment. iQ-Trigger is a mechanical fi nger that can press the release button of a camera within 25 ms. For touch screens, the touch pen tip can be used, and it is possible to select the start on the LED-Panel when pressing or releasing the touch screen.iQ-Trigger can be used for different measurement tasks and links seamlessly with other devices, such as STEVE, LED-Panel, lightSTUDIO with moving targets, and motor-driven test stands.
Software and remote triggeringiQ-Trigger and iQ-Trigger-T are shipped with a USB Interface (USB Box), a stand-alone control software, and a C++ API. The control software allows you to use your mechanical fi ngers out-of-the-box. The API offers you the possibility of fl exibly integrating iQ-Trigger into your environment. With the USB Box you can control iQ-Trigger from your computer or use the included manual remote.
Main Features:
• releasing the exposure button • different modes: single exposure, serial mode• shutter release when pressing or releasing the fi nger
Defocusing aid for fully automatic camerasMany cameras only have a fully automatic focus. In order to obtain reliable values for the various time measurements, it is necessary to reset them to infi nity or to the factory default settings. The new iQ-Defocus is helpful in this situation. It is placed in front of the lens to bring the camera’s focus system back to the reproducible starting position, thus providing a reliable basis for time measurements. Technical data was not yet available before the printing date. Please visit www. image-engineering.com for up-to-date data.
Main Features:
• defocusing
The automatic camera shutter release for touch screensiQ-Trigger-T simplifi es and accelerates the testing of mobile phone cameras, integrated tablets and other devices and digital cameras operated via touch display. At the same time, the automatic triggering device increases the accuracy and reliability of test routines. Using the iQ-Trigger-T with an API means that it can be pressed reliably in freely programmable intervals, and with a delay of only 0.5 ms, iQ-Trigger-T can also be used as a remote shutter release for cameras with capacitive touch screens. For example, the exposure of a series with a freely defi nable frame rate or for the production of time-lapse photography.
iQ-TRIGGER
iQ-DEFOCUS
iQ-TRIGGER-T
iQ-Trigger-T

26
imageQualitycodeANALYSIS SOFTWARE
iQ-ANALYZER
// MAINTENANCE PROGRAMBecome a member of our Maintenance Program and benefi t from free releases of iQ-Analyzer. Moreover, our experienced engineering team will consult and support you in all matters.
The Advanced Maintenance Program additionally includes a two-day training course with customer-oriented content, either online, at the Image Engineering facilities or on-site at your location (travel expenses excluded).
An annual membership fee applies for both Maintenance Programs. However, every iQ-Analyzer license includes a free standard membership for one year. Thereafter, it will expire if not extended.
// LICENSINGSINGLE USER: You can install the software on as many computers as you wish and then use it on the one with the USB dongle plugged in or with a single network license.
MULTIPLE USERS: We offer a discount for the second and following single user licenses purchased by the same company.
SITE LICENSE: Licenses for up to ten simultaneous users, as well as licenses for an unlimited number of simultaneous users are available upon request.
// WORKFLOW
// FEATURES EXTRACT
VERSATILE USER INTERFACE
iQ-Analyzer comes with a well-designed multilingual graphical user interface and advanced data visualization. A full-fl edged command line interface (with the exception of the video module) enables the user to integrate the capabilities of iQ-Analyzer into individual workfl ows.
FLEXIBLE OUTPUT FORMAT
In addition to the visual representation of the measurement data, the numerical results can be saved as plain text or XML fi les. These common non-proprietary fi le formats allow convenient import and further processing in spreadsheets or databases.
QUICK RESULTS ASSESSMENT
Measurement results can either be checked against custom specs or compared to a “golden master” reference measurement.
RAW FILES SUPPORT
iQ-Analyzer supports RAW image fi les in all modules and is able to convert and save them using user specifi c parameters.
BATCH EXPORT OF RESULT DIAGRAMS
A right-click on a result diagram will open a context menu allowing it to be added to the export list. Your batch export lists can easily be saved and managed.
iQ-Analyzer is the market leading solution in the image quality analysis domain. It is a must have for every camera manufacturer, independent of application area, especially when combined with the high quality test charts and illumination devices developed by Image Engineering. All over the world, many engineers have been successfully using iQ-Analyzer for years. Broadcasting, archiving, medical devices and photography are just a few sectors in the
imaging industry where the iQ-Analyzer succeeds. In addition to these areas, iQ-Analyzer has proven its value in the development and quality assurance of mobile devices, such as webcams, cell phones, notebooks and tablet computers, as well as in automotive, security and machine vision applications. iQ-Analyzer is a versatile tool, which adheres to international standards.
TEST CHARTS &ILLUMINATION
STILL IMAGING DEVICES
MEASUREMENT RESULTSDIAGRAMS
MEASUREMENT RESULTSTEXT AND XML FILES
IMPORT IN SPREADSHEETS AND DATABASES
IMAGE & VIDEOFILES
FRAME GRABBER
DIAGRAMEXPORT
iQ-ANALYZER
VIDEO DEVICES
INPU
TA
NA
LYSI
SO
UT
PUT
C:\>_
8 BIT
16 BIT
RAW AVIMOV...
EXCELPDFPNG
PS
Image analysis for professionals
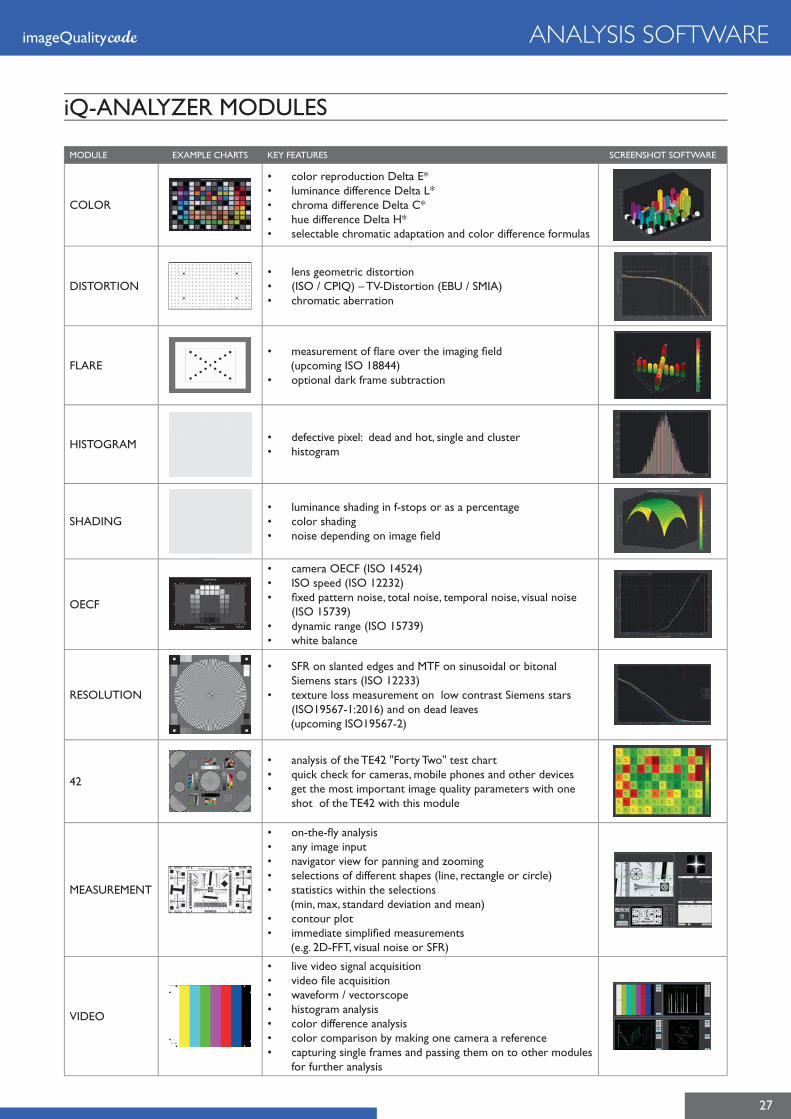
27
imageQualitycode
iQ-ANALYZER MODULES
ANALYSIS SOFTWARE
MODULE EXAMPLE CHARTS KEY FEATURES SCREENSHOT SOFTWARE
COLOR
• color reproduction Delta E*• luminance difference Delta L*• chroma difference Delta C*• hue difference Delta H*• selectable chromatic adaptation and color difference formulas
DISTORTION• lens geometric distortion• (ISO / CPIQ) – TV-Distortion (EBU / SMIA)• chromatic aberration
FLARE• measurement of fl are over the imaging fi eld (upcoming ISO 18844)• optional dark frame subtraction
HISTOGRAM• defective pixel: dead and hot, single and cluster• histogram
SHADING• luminance shading in f-stops or as a percentage• color shading • noise depending on image fi eld
OECF
• camera OECF (ISO 14524)• ISO speed (ISO 12232)• fi xed pattern noise, total noise, temporal noise, visual noise
(ISO 15739)• dynamic range (ISO 15739)• white balance
RESOLUTION
• SFR on slanted edges and MTF on sinusoidal or bitonal Siemens stars (ISO 12233)
• texture loss measurement on low contrast Siemens stars (ISO19567-1:2016) and on dead leaves
(upcoming ISO19567-2)
42
• analysis of the TE42 "Forty Two" test chart• quick check for cameras, mobile phones and other devices• get the most important image quality parameters with one
shot of the TE42 with this module
MEASUREMENT
• on-the-fl y analysis• any image input• navigator view for panning and zooming• selections of different shapes (line, rectangle or circle)• statistics within the selections (min, max, standard deviation and mean)• contour plot• immediate simplifi ed measurements (e.g. 2D-FFT, visual noise or SFR)
VIDEO
• live video signal acquisition• video fi le acquisition• waveform / vectorscope• histogram analysis• color difference analysis• color comparison by making one camera a reference• capturing single frames and passing them on to other modules
for further analysis

28
imageQualitycodeCONTROL SOFTWARE
iQ-API EXTENSIONSApplication interfaces for automated testingThe vast majority of our products come with user-friendly desktop applications for controlling the hardware and analyzing the images. Sometimes however, there is also a need for integration of our products into already existing software systems, or you can write your own custom applications to meet each individual requirement. With our Application Programming Interfaces (APIs) we offer you software building blocks with immense fl exibility. Our APIs are written in a very wide-spread and highly performant C++ programming language.
We consciously avoid dependencies on third-party frameworks, using only standard ISO C++ and its Standard Library (STL) in our interfaces. The APIs come along with extensive documentation, code snippets and example projects. Their high-level interfaces are easy to learn and do not require in-depth knowledge of single components to get started, which signifi cantly reduces development costs.
Some of our products also offer a Command Line Interface (CLI), enabling you to automate tasks without any programming skills. You can begin just by issuing text commands in the Windows Command Prompt or by scripting them in batch fi les.
API (APPLICATION PROGRAMMING INTERFACE)
API (C++) RELATED PRODUCTS KEY FEATURES
iQ-Drive API
iQ-AlignrigiQ-Bench-MiQ-Chartmount-VMiQ-HexaligniQ-RotationlightSTUDIO-M (-LM, -LMH, -SM, -SMH)*
full control over our motor-driven products and hexapods
iQ-LED API
CAL1, CAL2, CAL3LE7iQ-LEDiQ-Chart BoxiQ-FlatlightlightSTUDIO-L (-LH, -LM, -LMH)*EX1
full control over iQ-LED technology as well as over our built-in and stand-alone spectrometer
iQ-Standardlight API
lightSTUDIO-S (-SH, -SM, -SMH, -ST)*iQ-FlatlightiQ-Chart BoxlightHEAD-S (stand-alone)
controlling the fl uorescent and halogen light sources in various devices
iQ-Trigger API iQ-Trigger (-T) controlling iQ-Trigger when connected via the USB-Box
LED-Panel APILED-PaneliQ-Trigger (-T)
full control over the LED-Panel and connected iQ-Trigger
LG APIlightSTUDIO-H (LH, LMH, SH, SMH)*LG3
controlling the HDR extension of the lightSTUDIO-H and the LG3 device
CLI (COMMAND LINE INTERFACE) INCLUDED
CLI PRODUCTS KEY FEATURES
iQ-Analyzer CLI iQ-Analyzer full-featured image analysis for batch processing
LED-Panel CLILED-PaneliQ-Trigger (-T)
full control over the LED-Panel and connected iQ-Trigger
lightSTUDIO-S CLI lightSTUDIO-S (-SH, -SM, -SMH, -ST)* controlling the fl uorescent and halogen light sources in the lightSTUDIO-S devices
* For explanations of the various types, please have a look at page 20

29
imageQualitycode ANALYSIS SOFTWARE
iQ-LUMINANCETurn your camera into a luminance meteriQ-Luminance is a convenient tool that will help turn your camera into a luminance meter. Using a calibrated camera for this purpose allows you to outperform conventional luminance meters while keeping your costs low. The iQ-Luminance software calculates luminance values from the image data taken by the calibrated
camera in consideration of lens shading. The obligatory camera calibration provides the knowledge on how the raw RGB data from the camera can be mapped to the luminance, while still keeping in mind various exposure settings. This device and lens-specifi c calibration is performed in our iQ lab.
The only commonly known source for some in-situ measured spectral radiances until now was ISO 17321-1. It describes the principle of how the color characterization of a digital camera works, and it provides spectral radiances for 14 common objects. Our in-situ spectral radiance data project was started in order to collect several thousand measurements of all different kinds of objects under various illuminations. These objects include typical scenes that people photograph.
Why in-situ?
In many cases the spectral radiation of objects is not only the refl ected light, but some objects, such as leaves, have a transmissive part. In other cases inter-refl ections between the objects modify the spectral radiance in certain scenes. As a result, some objects, such as the human skin, appear totally different in real life compared to the skin tones of a refl ective color target.
What for?
The collected data can be used as a scientifi c data base for different studies related to natural objects. However, the main reason for collecting the data was to provide training data for the color characterization of digital cameras in combination with their spectral sensitivities. Currently, a total number of approx. 2500 measurements is available. With the database, you can optimize your color correction matrix based on real life data, by far exceeding the potential of a ColorChecker.
What is the content?
The database is divided into categories for thematic selection of objects, such as plants, human skin color or illumination type. Each object contains the spectral refl ection in the range from 380 to 780 nm in two variants. One includes the incident light, while in the other this light is removed (white tile corrected).
In-situ spectral radiances
IN-SITU DATA
* In this context, Image Engineering uses the term "RAW fi le" for fi les that are created by a digital camera in "RAW-Mode" and are readable by the software dcraw. This does not include RAW-fi les that do not follow any readable image fi le format. You will have to convert these fi les to e.g. 16 bit linear tiff fi rst.

30
imageQualitylabMEASUREMENT SERVICES
iQ LAB – TEST SERVICES FOR YOUThe iQ lab is our onsite testing facility designed to measure any information you may need regarding your imaging system. Our expertly trained engineers can test everything you require – whether resolution, spectral sensitivity, dynamic range, color reproduction, image stabilization, noise and timing – the iQ lab can help you improve your image quality. Using the latest international standards, our staff will provide you with a professional report detailing the test results, which can be relied upon to help advance your products.
Our expertise – your benefi tWhen you work with the iQ lab, you can choose between regular measurements based on the tests we do for magazines (see table for details), or you can request special tests and test conditions. We will gladly help you fi nd and create the right measurement procedure to collect all the relevant information you need to improve your imaging device.
IQ-DATA – EASY ACCESS – EASY BENEFITWe also offer access to all measurement data for all consumer/system cameras and lenses based on our tests for magazines. The so called iQ-Data consists of more than 300 consumer cameras, 300 SLRs and mirrorless system cameras, as well as more than 1200 lens camera combinations that continues to grow every day. The database is an ideal tool for setting up a side by side quality comparison of various devices. Test images are also available.
You can choose between three types of access to the iQ-Data.
iQ-Data full: For a yearly fee, you will receive unlimited access to all measurement data. This access also includes up to fi ve individual measurements. Product tests for an individual company will only be visible to that company and remain confi dential.
iQ-Data lens: For a yearly fee, you will receive unlimited access to all measurement data for all the lens-tests. This access also includes up to fi ve individual measurements.
iQ-Data camera: With this license, you will receive access to all camera measurement data (consumer & system cameras).
Curious?Contact us at [email protected]
extract from a test report
While you may have your own testing lab, it can still be highly benefi cial to receive an external, neutral opinion on your latest developments. Every year the iQ lab sees hunderdes of cameras and lenses from leading camera and lens manufacturers from all over the world, giving it the proper experience and the necessary capability to put the results in the right contex for you.

31
imageQualitylab MEASUREMENT SERVICES
MEASUREMENTS ON A REGULAR BASISWhat we measure What you get
Test Procedures tested with settings measurement data for available on iQ-Data
Camera Tests
Image qualitymeasurement
refl ective
all ISO-speeds (except ISO 200), f5.6, JPEG & RAW resolution center (Siemens star)texture loss (dead leaves)sharpening (slanted edges)color reproduction
xxxx
transparent
all ISO-speeds (except ISO 200), f5.6, JPEG & RAW visual noise/signal to noise ratio dynamic range used digital values white balance
xxxx
Timingmeasurement
ISO 100, f5.6, 50 mm, JPEG, 30 lx and 300 lxJPEG, RAW
shutter time lagshooting timeautofocus speedstartup timeframe rate and sequence
xxxxx
Cameras are tested with two different lenses: for the image quality we take the best resolving lens on the market, so every resolution measurement of a brand is comparable to each other. The same applies for the time measurements.
Lens Tests
Image qualitymeasurement
refl ective
ISO 100, open aperture and two steps closed aperture, wide-angle, standard and tele focal length, manual focus
for lenses with a bigger aperture than f2.0 also a measurement at f5.6 takes place
resolution center/corners for 3 focal lengths and 2 aperturescontrast center/corners for 3 focal lengths and 2 aperturesautofocus accuracy wide-, standard-, tele-angleresolution center/corners for 3 focal lengths and f5.6contrast center/corners for 3 focal lengths and f5.6
xxx--
refl ective
ISO 100, open aperture, wide-angle, standard- and tele-focal-length
distortion wide-angle (Lens Geometric Distortion)distortion standard-angle (Lens Geometric Distortion)distortion tele-angle (Lens Geometric Distortion)chromatic aberration for the 3 focal lengths
xxxx
refl ective
ISO 100, open aperture and two steps closed aperture, wide-angle, standard and tele-focal-length
for lenses with a bigger aperture than f2.0 also a measurement at f5.6 takes place
shading wide-angle, open and two steps closed apertureshading standard-angle, open and two steps closed apertureshading tele-angle, open and two steps closed aperturevisual noiseshading wide-, standard-, tele-angle f5.6
xxxx
Autofocus speedmeasurement
ISO 100, wide-angle, standard and tele-focal-length autofocus speed wide-angleautofocus speed standard-angleautofocus speed tele-angle
---
additional test is made for the macro-quality of macro lenses.
resolutiondistortion
All lenses are tested with predefi ned cameras depending on their purpose. For every brand two cameras, one with an APS-C sensor and one with a full-frame sensor, are predefi ned. So every lens measurement of a brand is comparable to each other.
Mobile Camera Tests
Image qualitymeasurement
refl ective
default settings of camera: 1000 lx, 5500 Kdefault settings of camera: 4x-zoom: 1000 lx, 5500 Kdefault settings of camera: -2EV equates 250 lx); 5500 Kdefault settings of camera: -4EV (equates 63 lx); 5500 Kdefault settings of camera, fl ash activated: -4 (equates 63 lx); 5500 K
resolution center/corners (Siemens stars)texture loss (dead leaves)sharpening (slanted edges)dynamic rangevisual noisesignal to noise ratiocolor reproductiondistortion wide- and tele-angleshading wide- and tele-angle
Timing measurement
ISOauto, wide-angle and tele-angle if available, 30 lx and 300 lx
shutter delayshooting delay wide-angleshooting delay tele-angle
Image stabilization
two settings: 800 lx and 40 lx; STEVE - movement isa sine shaped function with 4 Hz and an amplitude of 0,14°
Luminance calibrationYou want to use your camera as a luminance meter? We can calibrate your camera and also offer a software solution, so that you can measure the luminance values in a scene captured with a camera. This improves your workfl ow signifi cantly, as you measure the data and the scene at the same time.
Found what you are looking for? Contact us for ordering and pricing details or if you would like any further information.Haven’t found what you’re looking for? Don’t hesitate to contact us and together we can create a special measurement for you. [email protected]

TE42 // FORTY TWOThe TE42 is a multipurpose test chart and is available for cameras with sampling rates between 2 and 170 megapixels. It was designed to get a quick overview of a camera’s image quality performance by taking just a single image under a given illumination condition. The TE42 consists of structures for the analysis of resolution, texture reproduction, acutance, dynamic range, noise, color reproduction, distortion, shading, chromatic aberration and visual analysis. All of these can be automatically analyzed by using the iQ-Analyzer software.
Main Features:
• Dynamic range can be measured up to10 f-stops (due to the limitations of a refl ective target)
• Resolution is measured in the center and the corners of the image
• Enhanced linearization features around the Siemens stars for resolution analysis
• Low contrast Siemens stars support the ISO 19567 texture standard
• Slanted edges at different contrast levels for an analysis of sharpening applied to the image
• Distortion is measured as TV-distortion• Color reproduction is measured with ColorChecker SG
comparable colors• A colored random circle structure (dead leaves) at two
different contrast levels for improved texture analysis• Positioning of dead leaves and visual images at the same
radial distance to the center
In order to produce all of the necessary structures with the required specifi cations, the chart contains materials from different production processes.
• For the standard (S) version, the outer parts are produced on matt paper to avoid specular refl ections from the light source, especially for wide-angle analysis. With this material, the maximum sampling rate of the camera under test should be no greater than 30 megapixels.
• A high-resolution version (H) is available on photographic material. This allows the analysis of cameras with up to 170 megapixels, but puts some constraints on the illumination.
32
imageQualitychartsSELECTED TEST CHARTS
TE263 // Scan Reference ChartThe chart consists of gray steps, color patches, a scale and resolution pattern. It allows automatic analysis of each scanned page and – in combination with the right software – indicates when a specifi c page happens to be out of specs.
TE262 // UTT Universal Test TargetThe Universal Test Target is designed to evaluate the image quality of scanners and other digital input devices for archiving. It is available in various sizes ranging from A4 to A0. For further information on the target specifi cation see www.universaltesttarget.com
ARCHIVING
TE263 extended
The chart covers the following topics in archival
scanning:
• uniformity• banding and registration• distortion and deviations• resolution (slanted edge and visual)• dynamic range and OECF• noise evaluation• color reproduction• color registration• the use of additional reference charts

33
imageQualitycharts
COLORColor rendition targets are used to check the quality of color correction (rendition) in cameras. This can be a subjective analysis for pleasing colors, or it can be a measurement for color reproduction quality. For the latter, the image is converted into CIELAB space and then the color values are compared to the measured colors of the original target. The best way to calibrate color correction in cameras is to measure the spectral
sensitivities with a camSPECS device. The most common chart in this area for cameras is the x-Rite ColorChecker, which we sell under TE188 and the IT8 for scanners under TE258. The TE226 is an extended transparent version of the ColorChecker. For cameras, an extended version is the x-Rite ColorChecker SG, which has become a standard target, sold under TE230.
TE226
TE188
TE258TE230
SELECTED TEST CHARTS
OECFMeasuring the characteristic curve of a camera is one of the most important tests. The resulting function is called the opto electronic conversion function (OECF). OECF, noise and dynamic range measurements, according to ISO14524 and ISO15739 in their latest revision (2013), are based on the TE264, TE269 or TE270. For the standard charts, the gray levels are generated on lithographic fi lm using a half toning process. This could cause problems with high-resolution cameras, but can be solved by slightly defocusing the camera. In addition, we have designed the optional x-version of the TE264 on fi ne grain photographic material for cameras where defocusing is not an option (such as phone cameras). The TE264X is offered at almost any contrast
level up to 1,000,000:1. For an analysis with a waveform monitor we recommend TE223 with its horizontal gray scales. Cameras without manual exposure control can be tested using the TE270X chart. This uses two polarizing fi lters in the center of the chart to fool the automatic exposure. By turning the fi lters, the density (transmission) of the central part of the test chart is modifi ed. TE269 is one of our most important charts and provides more data points with its 36 patches. The selection of the suitable OECF charts should generally be based on the dynamic range of the test device. The chart should have a contrast ratio that is higher than the expected dynamic range of the camera under testing.
TE264TE223
TE269TE270X

34
imageQualitychartsSELECTED TEST CHARTS
One of the most important values when testing a digital camera is the resolution. According to ISO 12233 (digital still cameras) and ISO 16067 (scanners), resolution is the ability of an image capture device to reproduce fi ne details in the captured scene. It is important to see that the number of pixels are not the same as the resolution. The number of pixels are necessary, but they are not a suffi cient requirement to get to a certain resolution. Other optical parts such as the lens, the antialiasing fi lter, as well as image processing, have a signifi cant impact on the resolution of a camera. The smaller the pixels get, the higher the infl uence of optical components on the resulting resolution.
RESOLUTION
Size comparison of the center mark: regular/high resolution
TEXTURE LOSSSinusoidal Siemens stars with reduced contrast are eminently suited to analyze texture loss, meaning the loss of fi ne details with low contrasts. The loss of texture in an imaging system is caused by noise reduction or other image processing techniques.
TE280
low lightlow contrast
bright lightlow contrast
TE268 (fi xed aspect ratio; 4:3 and 3:2 available)
TE253 9x(aspect ratio variable)
Our standard chart for resolution measurements is the sinusoidal Siemens star chart TE253 (part of the latest ISO 12233 revision). The chart allows the analysis of the resolution at 9 positions in the image, which helps to evaluate the fall off from optical center to the corners. It comes in 3 separate columns to allow the adjustment of the chart to various image aspect ratios.To get even more information over the entire image fi eld, the TE268 consists of 25 Siemens stars. Another approach for measuring the resolution of a camera is the analysis of a slanted edge. This method is described in detail in ISO 12233, but can only be applied to images where almost no sharpening and compression is used. This is because these image processing steps affect edges in a way that the edge analysis no longer represents the resolution of the camera.A pilot study published at the 2008 Electronic Imaging Conference, has shown that both methods (the Siemens star and slanted edge) deliver the same results when applied to uncompressed and unsharpened images.A unique manufacturing technology has led to a new generation of TE253 and TE268 (H series) with the sinusoidal Siemens stars. This technology produces extremely high-resolution continuous tone structures on photographic paper, enabling cameras to be measured with up to 180 megapixels using our standard A1066 target size. To get there, we decreased the size of the center mark on each Siemens star from 12 mm to 5 mm. To accurately detect the smaller marks the camera should produce a minimum sample rate of 8 megapixels.
SizSizSizSize ce ce ce compompompompariariariarisonsonsonson ofofofof ththththe ce ce ce cententententer er erer marmarmarmark: k: k:k: regregulaular/hr/highighh rerer solsolutiutionon
TE276
The ISO 19567-1 standard for texture analysis includes a measurement method using low contrast Siemens stars.
The Resolution module of the iQ-Analyzer, our analysis software, supports the analysis of the stars including the new TE280 chart. Using Siemens stars with a reduced contrast (18% modulation), you can benefi t from the well-known advantages of sinusoidal Siemens stars. The result of the analysis using the iQ-Analyzer delivers the full MTF in addition to other numerical results such as limiting resolution (MTF 10) and acutance.
TE276 consists of dead leaves structures and the necessary surrounding markers for registration and linearization, making it the ultimate solution for texture analysis. In various publications, we can show that the latest approach "Dead Leaves_cross" is so far, the best solution to describe the texture loss (see our website for details). You can fi nd the same dead leaves structures and low contrast Siemens stars on TE42, the multipurpose test chart for image quality measurement.
low lighthigh contrast
bright lighthigh contrast
The SFR based on the Dead Leaves_cross method of the image above

35
imageQualitycharts TEST CHARTS
OECF/Gamma Back Focus Color Black to White Special Manufacturer
Resolution/Multiburst Geometry Grid Registration Signal Evaluation Universal Multipurpose
BBC61A Flesh Tone Reference Test Chart
(BBC approved)
The fl esh tone test chart is designed for evaluating the fl esh tone rendition of electronic cameras. The chart, developed by the BBC London, is a four color offset print. The spectral remission of the fl esh tones approximates the natural fl esh tone very well.
BBC64 Color Camera Gray Scale Test Chart
(with super black hole)
The BBC64 is designed for the accurate adjustment of camera fl are corrections and the setting of black level. Two 9-graduated counter current gray scales are arranged on a gray background. The gray scales being graduated logarithmically (gamma = 0.45).
BBC65 Studio Camera Line-Up Test Chart
(with super black hole)
The BBC65 is designed to be used in conjunction with the test chart BBC61A Flesh Tone Reference when very close color matching is required. BBC65 was developed to fulfi ll the need for a simplifi ed studio test chart that gives only the necessary information for routine day-to-day camera line-up in the shortest possible time. Black, white and gray fi elds, along with black lines with different frequencies are positioned on a gray background.
Double-Checker With the Siemens star TE148 on one side and the white balance sheet TE115 on the other, this target is a practical and essential tool for every cameraman. The neckband is a practical way to easily use it in daily work.
QA-61 Includes a slanted edge, an alphanumeric resolution chart, a Landolt Ring chart, and gray step patches. Horizontal, vertical and slanted Ronchi patterns are provided at 6 to 40 c/mm. Applied Image has also provided (as permitted in section 4.1.2 of the standard) a T-100 Digital Electronic Pixel Target, which has horizontal, vertical and slanted bars in widths from 0.1 to 1.0 mm (width to length ratio is 1:5).
SCANNER SFR & OECF
QA-62 Includes a dark gray 25 mm square that is rotated 5 degrees on a gray fi eld. Surrounding grayscale patches change in discrete steps from white to black. Twenty patches are provided, measuring 9x9 mm each. The four corner-crosses measure 2.625" (66.68 mm) from center to center. The upper right grayscale patch is equal in density to the background of the rotated square (0.50 density). The lower left grayscale patch is equal in density to the center rotated square (1.10 density).
T01B / T01B 16:9 Geometry Test Chart / Ring TB
(black surrounding)
The T01 is designed to measure the geometry of cameras and monitors. Circular rings are arranged in a grid in such a way that at ideal geometry, their center points are located in the intersection points of a grid raster of lines in an electronic test generator (black surrounding).
T01W / T01W 16:9 Geometry Test Chart / Ring TB
(white surrounding)
The T01 is designed to measure the geometry of cameras and monitors. Circular rings are arranged in a grid in such a way that at ideal geometry, their center points are located in the intersection points of a grid raster of lines in an electronic test generator (white surrounding).
T03 Depth Of Modulation 0.5 / 5 MHz
The T03 is designed for evaluating the uniformity of a TV camera´s modulation depth. Between the line raster rows, two white bars of different lengths are arranged on a black background (upper part) respective, while two black bars of different lengths are arranged on a white background (bottom part).
T04 16:9 Bar Test Chart (IEC 61146)
The bar test chart is designed for checking the transmission characteristics of TV cameras at intermediate and deep frequencies. It consists of horizontal bars with a white-on-black and black-on-white background pattern.
T06 Chess Board Test Chart
The T06 test chart is designed for checking geometry and resolution. It is composed of black and white square fi elds that are surrounded by rectangular fi elds at the edges, which correspond to the grid raster lines of electronic test generators.
T10B Scattered Light Test Chart 99%
(IEC 84/60B)
The T10B is designed to measure localized fl are of camera systems. In the center of the chart is a black area surrounded by a white area in a way that the average picture level is 99%.
TEST CHARTS SORTED BY NUMBERSelection of the most important test charts

36
imageQualitycharts
OECF/Gamma Back Focus Color Black to White Special Manufacturer
Resolution/Multiburst Geometry Grid Registration Signal Evaluation Universal Multipurpose
T13 EBU Universal Film Test Chart
(EBU Tech. 3087 ∙ specifi cation 8/1.1)
The T13 is designed for checking color and neutral gray reproduction, relative modulation depth, gradation and granularity of fi lm material for television. On a neutral gray background three groups of test components (grays, colors, resolution patterns) are arranged within the picture-relevant area.
TE42 Forty Two ∙ Multipurpose chart for fast
camera testing
This chart contains everything you need to measure the OECF: dynamic range (contrast limited to 1000:1), color reproduction quality, white balance, noise, resolution, shading, distortion, and kurtosis (see page 32).
TE83 ITE Grayscale Chart I (Gamma = 0.45)
The TE83 is designed for the evaluation of the halftone reproduction of an electronic camera. Two 11-graduated counter current gray scales are arranged on a gray background. The gray scales being graduated logarithmically (gamma = 0.45).
TE84 ITE Grayscale Chart II (Gamma = 1)
The TE84 is designed for the evaluation of the halftone reproduction of an electronic camera. Two 11-graduated counter current gray scales are arranged on a gray background. The gray scales being graduated logarithmically (gamma = 1.0)
TE94 ITE Radial Resolution Chart
The TE94 is designed for checking resolution over the whole picture area. It consists of nine sector stars of 90 (black and white) sectors each. Resolution measurement with TV lines is independent from TV standard.
TE95 ITE Resolution Chart /
EIAJ Test Chart A
The TE95 test chart is designed for general (visual) appraisal of electronic cameras. It consists of circular fi gures, multibursts, vertical wedge-sharped rasters, diagonal lines and gray scales.
TE97 High Resolution Universal Test Chart
1000 CP/PH (= 2000 lines)
The TE97 is designed for the measuring and quick (mostly visual) appraisal of transmission characteristics of high resolution non-broadcast cameras. In addition to other features, it contains gray scales, multibursts and resolution wedges with different frequencies (vertical and horizontal).
TE99 Multiburst Test Chart
(High-Class in Mega Cycle Chart)
The TE99 is designed to measure frequency response of the modulation depth of electronic cameras. A line raster is arranged in the center of the test chart and produces frequencies of 0.5 to 10 MHz in the output of the TV camera. Bar rasters are located in the corners of the test chart and produce frequencies of 0.5 and 5 MHz.
TE100 / TE100 16:9 Lens Focus Test Chart
The TE100 is designed for the adjustment of camera lenses, checking back focal distance and resolution, and establishing cushion and barrel distortion. It consists of a Siemens star, outlined arrows and several black and white line pairs.
TE101 Standard Test Chart
The TE101 is designed for the general (visual) appraisal of TV cameras. The circular fi gures and the grid make a rough evaluation of the geometry possible. The wedge-shaped line rasters are used for the visual appraisal of the resolution limit. The gray scales are designed for the evaluation of the halftone reproduction.
TE102 / TE102 16:9 Chess Board Test Chart
The TE102 test chart is designed for checking the geometry, resolution and uniformity of signal generation. It is composed of black and white square fi elds. Two resolution wedges in the middle of the chart allow for the checking of vertical and horizontal resolution.
TE104 Multiburst Test Chart 1-6 MHz
(negative)
The TE104 is designed for resolution measurements, mainly for visual tests. It consists of four rows, each with six fi elds of multiburst frequencies (1-6 MHz).
TE105 16:9 Universal Test Chart
The TE105 test chart is designed for the general (visual) appraisal of 16:9 TV cameras. It includes circular fi gures, gray scales, wedge-shaped line rasters, zone plates, a grid, diagonal and horizontal lines.
TE106 / TE106 16:9 Color Bar Test Chart
The TE106 is designed for checking the color rendition of TV cameras. The picture area is divided into six color bars showing the three primary colors red, green and blue, and the secondary colors cyan, yellow and purple. In addition, there is one bar of white and black. The succession corresponds to that of an electronically generated color bar.
TEST CHARTS

37
imageQualitycharts
OECF/Gamma Back Focus Color Black to White Special Manufacturer
Resolution/Multiburst Geometry Grid Registration Signal Evaluation Universal Multipurpose
TE107 / TE107 16:9 Multiburst Test Chart (0-10 MHz)
The TE107 is designed for checking the frequency response and the uniformity of an electronic camera. A line raster is arranged in the center of the test chart which produces frequencies of 0.5 to 10 MHz in the output of the TV camera.
TE108 Log. Gray Scale Test Chart (9 steps)
The TE108 is designed for the evaluation of the halftone reproduction of an electronic camera. Two 9-graduated counter current gray scales are arranged on a gray background. The gray scales being graduated logarithmically.
TE109 Log. Gray Scale Test Chart (5 steps)
The TE109 is designed for the evaluation of the halftone reproduction of an electronic camera. Two 5-graduated counter current gray scales are arranged on a gray background. The gray scales being graduated logarithmically.
TE110 9 Sector Stars Test Chart (36 cycles)
The TE110 is designed for the adjustment of camera lenses, checking back focal distance and checking resolution over the picture area. The test chart consists of nine sector stars. Within the sector stars are two circular lines, which mark a 625 and a 312 line structure (525 / 262 in the NTSC version).
TE111B / TE111B 16:9 Critical Flesh Tones Test Chart
The fl esh tone test chart is designed for evaluating the fl esh tone rendition of electronic cameras. The picture shows the portraits of three women with ideal and critical fl esh tones.
TE113 / TE113 16:9 Zone Plate With MHz-Grid
The TE113 is designed for checking the resolution characteristics and “cross color” interferences of TV cameras and TV transmission systems. The test chart shows a zone plate over the whole image area where the spatial frequency of the rings has a linear increase towards the edges. The line grid marks the spatial frequency in vertical and horizontal direction.
TE114 Zone Plate Test Chart
The TE114 is designed for checking the resolution characteristics and “cross color” interferences of TV cameras and TV transmission systems. The test chart shows a zone plate over the whole image area where the spatial frequency of the rings increase linearly towards the edges.
TE115 / TE115 16:9 White Balance Chart 70% Refl ectance
The TE 115 chart is designed for white balance. The density of the white area is 0.15 (based on BaSO4=0). This corresponds to a remission of 70%.
TE116 16:9 HDTV Grid Test Chart
The TE116 is designed for the operational adjustment and control of HDTV cameras. It consists of circles permitting rough visual appraisal of scan linearity. Lines serve the purpose of adjusting registration, while wedges account for resolution appraisal.
TE117 16:9 HDTV Universal Test Chart
The TE117 is designed for the quick (mainly visual) appraisal of an HDTV camera´s transmission characteristics. It comprises of a gray background on which circles, gray scales, horizontal and vertical lines are positioned.
TE118 16:9 HDTV Resolution Test Chart
(100-600 CP/PH)
The TE118 is designed for checking the resolution characteristics of HDTV cameras. Five fi elds with different line grids and black and white reference are arranged on a black background. The line grids are inclined at different angles.
TE120 Sector Star Test Chart (36 cycles)
The TE120 test chart is designed for the adjustment of camera lenses and checking back focal distance. It shows a 36 sector Siemens star on a white background.
TE121 Sector Star Test Chart (72 cycles)
The TE121 test chart is designed for the adjustment of camera lenses and checking back focal distance. It displays a 72 sector Siemens star on a white background.
TE122 / TE122 16:9 CCD Registration Test Chart
The TE122 is designed for measuring registration errors in a CCD camera.
TEST CHARTS

38
imageQualitycharts
OECF/Gamma Back Focus Color Black to White Special Manufacturer
Resolution/Multiburst Geometry Grid Registration Signal Evaluation Universal Multipurpose
TE123 100% Red
The TE123 is designed for measuring the behavior of the chrominance channel expressed as the signal-to-noise ratio.
TE124 16:9 HDTV Resolution Test Chart
(100- 600 CP/PH)
The TE124 is designed for checking the resolution characteristics of HDTV cameras.The test chart with an aspect ratio of 16:9 shows nine blocks containing 42 resolution patterns each in the center area. The corner fi elds have 20 resolution patterns.
TE125 16:9 HDTV Zone Plate Test Chart
(600 CP/PH ∙ asymmetric)
The TE125 zone plate test chart is particularly suited for the visual determination of a high defi nition camera´s resolution. It shows an asymmetrically arranged one zone plate ranging from 0 to 600 CP/PH, as well as two zone plate sectors with their centers located in the left corners. The gore-shaped gaps are gray.
TE127 16:9 Log. Gray Scale Test Chart (9 steps)
The TE127 is designed for the evaluation of the halftone reproduction of a camera with a 16:9 aspect ratio. Two 9-graduated counter-current gray scales are arranged on a gray background. The gray scales being graduated logarithmically.
TE128 16:9 ITE High Resolution Chart
The TE128 is designed for measuring a quick (mostly visual) appraisal of transmission characteristics of high resolution non-broadcast cameras. It consists of a gray background, a white circle, gray scales, multibursts, resolution wedges with different frequencies (vertical + horizontal) and circular rings.
TE129 Black Pulse Bar Test Chart
The TE129 is used to measure the low and intermediate frequency response (streaking) and fl are in video systems. A black rectangle (width equal to 25% of picture width; approx. 0.05 MHz) and a narrow black pulse (width equal to 1% picture width; approx. 1.25 MHz) are shown on a white background.
TE129 16:9 S Black Pulse Bar Test Chart (+2T pulse)
The TE129 is a chart with an additional 2T-pulse in the middle of the black 25%-pw-pulse.
TE130 White Pulse Bar Test Chart
The TE130 is used to measure the low and intermediate frequency response (streaking) and fl are in video systems. A white rectangle and a narrow white pulse are shown on a black background.
TE130 16:9 S White Pulse Bar Test Chart
(+ 2T pulse)
The TE130 is a chart with an additional black 2T-pulse in the middle of the white 25%-pw-pulse.
TE132 ISO 3334 (DIN19051) Test pattern No. 2
(1-18 LP/mm ∙ sheet with 12 patterns)
This chart is designed for resolution measurements. Five pairs of lines (black and white) with frequencies from 1-18 line pairs per millimeter are printed on a white background. The patterns are ordered counterclockwise by decreasing resolution on the chart.
TE135 Multiburst (Megacycle) Test Chart
(0.5 ∙ 1 ∙ 1.5 ∙ 2 ∙ 2.5 ∙ 3 ∙ 5 ∙ 6 MHz)
The test chart is designed for measuring the amplitude frequency response of the luminance channel, i.e. the amplitude of the output signal relative to a reference level as a function of frequency. A multiburst with different frequencies is shown on a gray background.
TE138 Line pairs per cm
(1-28.5 LP/cm ∙ set of 10 pcs.)
The TE138 is designed for resolution measurements. Frequencies from 1-28.5 line pairs per centimeter are printed on a white background. The patterns are ordered clockwise by decreasing resolution on the chart.
TE143 ISO 446 (DIN 19051) Test pattern
No. 1 (sheet with 20 pattern)
The TE143 is designed to check the readability of document reproductions. In pattern number 84, the direction of the two lines inside the octagon must be recognized without problems for seven out of eight symbols.
TE145 Test Signal Test Chart ∙ Line 17
The TE145 is designed for measuring several signal parameters according to the defi nitions set in CCIR Recommendation 569. It consists of a gray scale, a color gradient, and gray and black bars of different sizes.
TEST CHARTS

39
imageQualitycharts
OECF/Gamma Back Focus Color Black to White Special Manufacturer
Resolution/Multiburst Geometry Grid Registration Signal Evaluation Universal Multipurpose
TE146 Test Signal Test Chart ∙ Line 18
The TE146 reproduces the test signal, line 18 as specifi ed in CCIR Recommendation 473. With measurement instruments the test signals can be evaluated in a simple and partially automatic way. It includes a multiburst with different frequencies.
TE147 Test Signal TC ∙ Line 18 with 0.2 MHz
The TE147 reproduces the test signal, line 18, as stated in CCIR recommendation 473. With measurement instruments the test signals can be evaluated in a simple and partially automatic way. It consists of a multiburst with different frequencies.
TE148 16:9 Sector Star Test Chart (36 Cycles)
The TE148 is designed for adjustment of camera lenses and checking back focal distance. It contains a large Siemens star in the center and four smaller ones positioned in the corners of the test chart.
TE152 Frequency Response TC
(1-8 MHz continuously)
The TE152 is designed for checking the frequency response of a camera. The test chart shows vertical lines over the whole image area ranging from 1 to 8 MHz.
TE153 Log. Gray Scale Test Chart (11 steps)
The TE153 is designed for evaluation of the halftone reproduction of electronic cameras. Two 11-graduated counter current gray scales are arranged on a gray background. The gray scales being graduated logarithmically. The contrast range of the gray scales is 40:1.
TE155 Window Test Chart
3/10 Picture Height (IEC 61146)
The TE155 is designed for evaluating the degree of the spurious image that remains after removing the still subject being shot. Therefore, the black test chart has a transparent square in the center.
TE156 Window Test Chart 1% (IEC 61146)
The TE156 is designed to measure blooming and smearing effects of CCD cameras. The transparency includes a black area with a white (transparent) area. The transparent area has 1% of the picture area, marked by the white arrows.
TE158 Cine Test Chart with format markings
for 1:1375 (35 mm) ∙ 1:166 (S16) ∙ 16:9
(HDTV) ∙ 1:185 ∙ 1:2.
Resolution power is given for three
different enlargements
The TE158 is designed for evaluating the image quality of fi lm cameras and can be used for cameras of different formats. It comprises of sector stars, several test elements, a linear gray scale, and nine color patches.
TE159 Sinusoidal Multiburst Test Chart
(IEC 61146)
(0.5 ∙ 1 ∙ 1.5 ∙ 2 ∙ 2.5 ∙ 3 ∙ 4 ∙ 5 ∙ 6 MHz)
The TE159 is designed for measuring the horizontal static resolution. It shows vertical bars, the density variation of which gives a sinusoidal video response.
TE161 16:9 Sector Star Test Chart (72 cycles)
The TE161 test chart is designed for the adjustment of camera lenses and checking back focal distance. It consists of a large Siemens star in the center and four smaller ones positioned in the corners of the test chart.
TE162 Chrominance Response Test Chart
(IEC 61146)
The TE162 is designed to measure the amplitude frequency response of the chrominance channels. The test chart is a color multiburst pattern, covering a spatial frequency range from 100 kHz to 1.5 MHz.
TE165 16:9 Log. Gray Scale Test Chart (11 steps)
The TE165 is designed for evaluation of the halftone reproduction of 16:9 electronic cameras. Two 11-graduated counter current gray scales are arranged on a gray background. The gray scales being graduated logarithmically. The contrast range of the gray scales is 40:1.
TE167 16:9
HDTV Universal Test Chart
The TE167 test chart is designed for the general appraisal of HDTV cameras. It consists of gray scales, circular fi gures, a grid, sector stars, multibursts and resolution wedges.
TE169 EBU/CAM Test Chart (EBU Tech. 3237)
TE169 is designed to measure color reproduction. The chart includes18 color patches and six patches from white to black.
TE170 Electronic Still Picture Resolution
Chart (ISO 12233)
The TE170 chart is designed to measure the resolution of still cameras. It contains resolution wedges up to 2000 lines per picture height. In addition, it incorporates slanted edges for SFR measurements.
TE175 Streaking Measurement Test Chart
The TE175 is designed for the measurement of disturbance caused by the video level in black areas to the right of or below the areas. Horizontal white lines are positioned on a black background.
TEST CHARTS

40
imageQualitycharts
OECF/Gamma Back Focus Color Black to White Special Manufacturer
Resolution/Multiburst Geometry Grid Registration Signal Evaluation Universal Multipurpose
TE182 / TE182 16:9 Neutral Gray 18% remission
The TE182 is an 18% gray test chart.
TE188 / TE188 16:9 Color Rendition Chart
(X-Rite ColorChecker)
The TE188 was designed with respect for the well-known "ColorChecker". The chart consists of 18 color patches and a 6-step gray scale, and is used in photography, fi lm and TV.
TE192 / TE192 16:9
Saw Tooth Signal Test Chart
The TE192 is designed for cameras without an integrated electronic saw tooth signal, allowing the visualization of the gamma correction on the oscilloscope. It shows a linear continuous progression from 0% to 100% transmission set on a gray background.
TE194 Aliasing Test Chart
The TE194 is designed for measuring aliasing. The chart consists of eight rows of rectangular bars with the spatial frequencies of 1, 2, 4, 6, 8, 10, 12 and 14 MHz.
TE195 Ikegami CPU Test Chart
The TE195 is designed for the setup of Ikegami cameras.
TE197 16:9 OECF Test Chart (ISO 14524) Contrast
20:1 ∙ 80:1 ∙ 160:1 ∙ 1000:1 ∙ 4000:1
The TE197 is designed for evaluating the opto electronic conversion function of a camera. The chart consists of a circular ordered 12-step-gray scale on a gray background.
TE202 Sector star 20 Cycles
The TE202 is designed for adjustment of camera lenses and checking back focal distance.
TE203 Double Saw Tooth Test Chart
(digital signal quantisation)
The TE203 is designed to check cameras for quantization errors. It consists of a high and low contrast saw tooth.
TE205 Gamma Measurement Test Chart
The TE205 is designed to check the gamma setting of the camera. The chart shows ten gray steps from 1-10% transmission and ten gray steps from 10-100% transmission.
TE218 A + B Autofocus Test Chart Set (IEC 61146)
The TE218 is designed to check the autofocus system of a camera. It includes two different sizes of Siemens stars.
TE219 16:9 Noise Measurement Test Chart
(ISO 15739) 20:1 ∙ 80:1 ∙ 160:1 ∙ 1000:1
The TE219 is designed for noise measurement of still images. It contains circular and horizontal positioned gray fi elds, one gradient fi eld, and one fi eld containing a diagonal multiburst with different frequencies.
TE220 Back Focus Test Chart
(36 cycles with corner stars)
The TE220 is designed for adjustment of camera lenses and checking back focal distance. It consists of a large Siemens star in the center and four smaller ones positioned in the corners of the test chart.
TE223 16:9 HDTV Log. Gray Scale Test Chart
13 steps ∙ contrast 1:200
The TE223 is designed for evaluation of the halftone reproduction of electronic cameras. Two 13-graduated counter current gray scales are arranged on a gray background. The gray scales are graduated logarithmically.
TE224 16:9 HDTV Resolution Test Chart
The TE224 is designed to measure and describe the frequency response of an electronic HDTV camera. The test chart consists of 50 multiburst fi elds, which are distributed over a 16:9 picture area. The fi elds are arranged in horizontal and vertical directions in order to measure resolution in both directions.
TE225 16:9 HDTV Resolution Test Chart
The TE225 is designed to measure and describe the frequency response of an electronic HDTV camera. The test chart comprises of 32 multiburst fi elds, which are distributed over a 16:9 picture area. The fi elds are arranged in horizontal and vertical directions in order to measure the resolution in both directions.
TE226 16:9 HDTV Color Rendition Test Chart
The TE226, is designed for the evaluation of the color rendition of HDTV cameras. The chart consists of 36 color patches and a 9-step gray scale. In addition to the primary and secondary colors, the test chart contains mainly the colors that are critical in reproduction, e.g. dark and light skin tones, foliage, blue sky, orange, violet and others.
TEST CHARTS
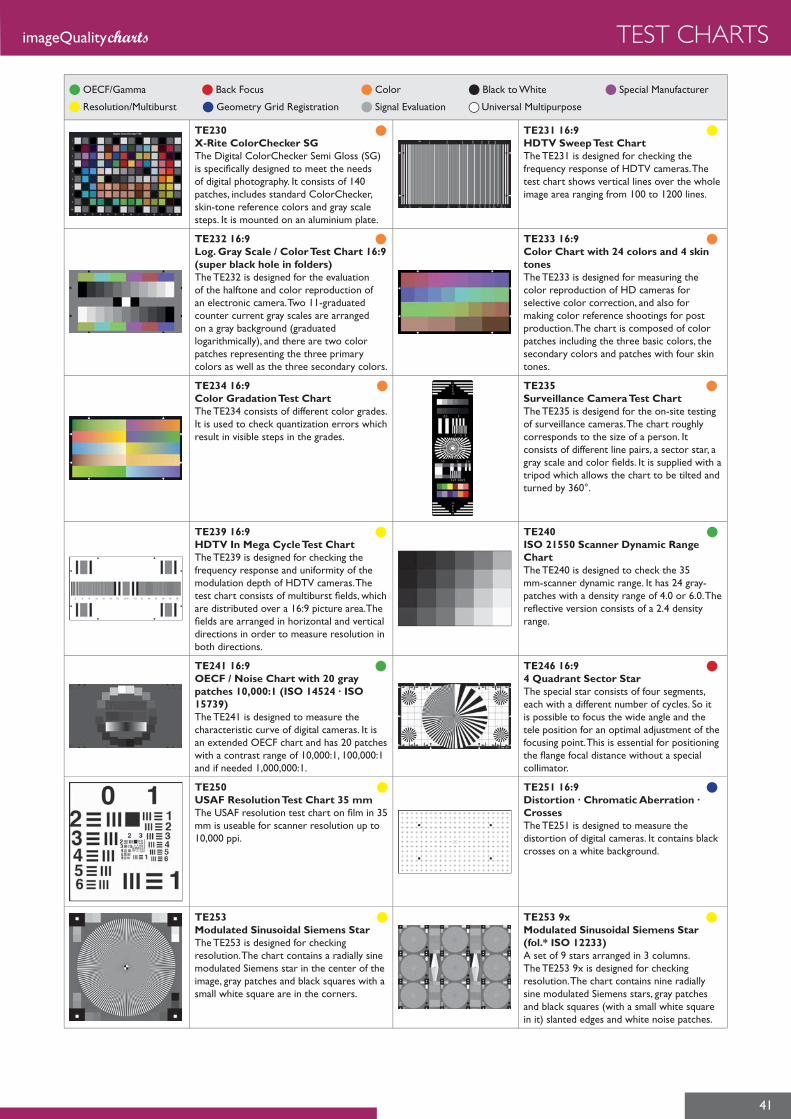
41
imageQualitycharts
OECF/Gamma Back Focus Color Black to White Special Manufacturer
Resolution/Multiburst Geometry Grid Registration Signal Evaluation Universal Multipurpose
TE230 X-Rite ColorChecker SG
The Digital ColorChecker Semi Gloss (SG) is specifi cally designed to meet the needs of digital photography. It consists of 140 patches, includes standard ColorChecker, skin-tone reference colors and gray scale steps. It is mounted on an aluminium plate.
TE231 16:9 HDTV Sweep Test Chart
The TE231 is designed for checking the frequency response of HDTV cameras. The test chart shows vertical lines over the whole image area ranging from 100 to 1200 lines.
TE232 16:9 Log. Gray Scale / Color Test Chart 16:9
(super black hole in folders)
The TE232 is designed for the evaluation of the halftone and color reproduction of an electronic camera. Two 11-graduated counter current gray scales are arranged on a gray background (graduated logarithmically), and there are two color patches representing the three primary colors as well as the three secondary colors.
TE233 16:9 Color Chart with 24 colors and 4 skin
tones
The TE233 is designed for measuring the color reproduction of HD cameras for selective color correction, and also for making color reference shootings for post production. The chart is composed of color patches including the three basic colors, the secondary colors and patches with four skin tones.
TE234 16:9 Color Gradation Test Chart
The TE234 consists of different color grades. It is used to check quantization errors which result in visible steps in the grades.
TE235 Surveillance Camera Test Chart
The TE235 is desigend for the on-site testing of surveillance cameras. The chart roughly corresponds to the size of a person. It consists of different line pairs, a sector star, a gray scale and color fi elds. It is supplied with a tripod which allows the chart to be tilted and turned by 360°.
TE239 16:9 HDTV In Mega Cycle Test Chart
The TE239 is designed for checking the frequency response and uniformity of the modulation depth of HDTV cameras. The test chart consists of multiburst fi elds, which are distributed over a 16:9 picture area.The fi elds are arranged in horizontal and vertical directions in order to measure resolution in both directions.
TE240 ISO 21550 Scanner Dynamic Range
Chart
The TE240 is designed to check the 35 mm-scanner dynamic range. It has 24 gray-patches with a density range of 4.0 or 6.0. The refl ective version consists of a 2.4 density range.
TE241 16:9 OECF / Noise Chart with 20 gray
patches 10,000:1 (ISO 14524 ∙ ISO
15739)
The TE241 is designed to measure the characteristic curve of digital cameras. It is an extended OECF chart and has 20 patches with a contrast range of 10,000:1, 100,000:1 and if needed 1,000,000:1.
TE246 16:9 4 Quadrant Sector Star
The special star consists of four segments, each with a different number of cycles. So it is possible to focus the wide angle and the tele position for an optimal adjustment of the focusing point. This is essential for positioning the fl ange focal distance without a special collimator.
TE250 USAF Resolution Test Chart 35 mm
The USAF resolution test chart on fi lm in 35 mm is useable for scanner resolution up to 10,000 ppi.
TE251 16:9 Distortion ∙ Chromatic Aberration ∙
Crosses
The TE251 is designed to measure the distortion of digital cameras. It contains black crosses on a white background.
TE253 Modulated Sinusoidal Siemens Star
The TE253 is designed for checking resolution. The chart contains a radially sine modulated Siemens star in the center of the image, gray patches and black squares with a small white square are in the corners.
TE253 9x Modulated Sinusoidal Siemens Star
(fol.* ISO 12233)
A set of 9 stars arranged in 3 columns.The TE253 9x is designed for checking resolution. The chart contains nine radially sine modulated Siemens stars, gray patches and black squares (with a small white square in it) slanted edges and white noise patches.
TEST CHARTS
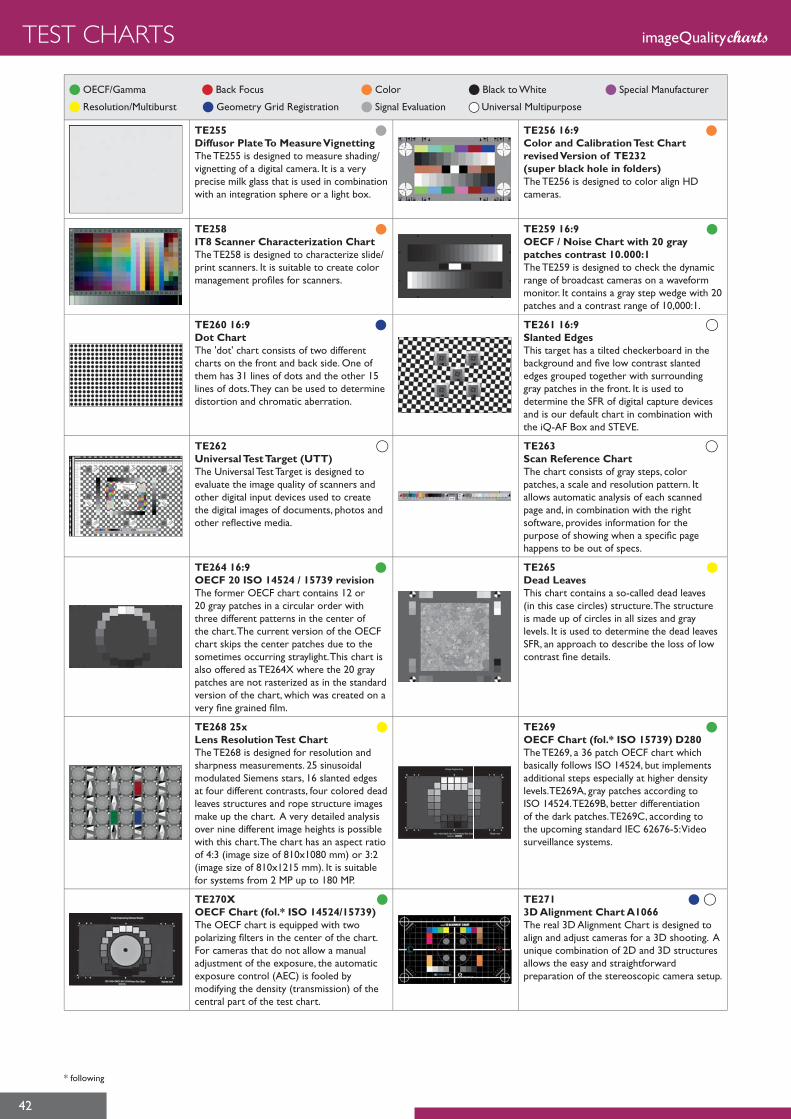
42
imageQualitycharts
OECF/Gamma Back Focus Color Black to White Special Manufacturer
Resolution/Multiburst Geometry Grid Registration Signal Evaluation Universal Multipurpose
TE255 Diffusor Plate To Measure Vignetting
The TE255 is designed to measure shading/vignetting of a digital camera. It is a very precise milk glass that is used in combination with an integration sphere or a light box.
TE256 16:9 Color and Calibration Test Chart
revised Version of TE232
(super black hole in folders)
The TE256 is designed to color align HD cameras.
TE258 IT8 Scanner Characterization Chart
The TE258 is designed to characterize slide/ print scanners. It is suitable to create color management profi les for scanners.
TE259 16:9 OECF / Noise Chart with 20 gray
patches contrast 10.000:1
The TE259 is designed to check the dynamic range of broadcast cameras on a waveform monitor. It contains a gray step wedge with 20 patches and a contrast range of 10,000:1.
TE260 16:9 Dot Chart
The 'dot' chart consists of two different charts on the front and back side. One of them has 31 lines of dots and the other 15 lines of dots. They can be used to determine distortion and chromatic aberration.
TE261 16:9 Slanted Edges
This target has a tilted checkerboard in the background and fi ve low contrast slanted edges grouped together with surrounding gray patches in the front. It is used to determine the SFR of digital capture devices and is our default chart in combination with the iQ-AF Box and STEVE.
TE262 Universal Test Target (UTT)
The Universal Test Target is designed to evaluate the image quality of scanners and other digital input devices used to create the digital images of documents, photos and other refl ective media.
TE263 Scan Reference Chart
The chart consists of gray steps, color patches, a scale and resolution pattern. It allows automatic analysis of each scanned page and, in combination with the right software, provides information for the purpose of showing when a specifi c page happens to be out of specs.
TE264 16:9 OECF 20 ISO 14524 / 15739 revision
The former OECF chart contains 12 or 20 gray patches in a circular order with three different patterns in the center of the chart. The current version of the OECF chart skips the center patches due to the sometimes occurring straylight. This chart is also offered as TE264X where the 20 gray patches are not rasterized as in the standard version of the chart, which was created on a very fi ne grained fi lm.
TE265 Dead Leaves
This chart contains a so-called dead leaves (in this case circles) structure. The structure is made up of circles in all sizes and gray levels. It is used to determine the dead leaves SFR, an approach to describe the loss of low contrast fi ne details.
TE268 25x Lens Resolution Test Chart
The TE268 is designed for resolution and sharpness measurements. 25 sinusoidal modulated Siemens stars, 16 slanted edges at four different contrasts, four colored dead leaves structures and rope structure images make up the chart. A very detailed analysis over nine different image heights is possible with this chart. The chart has an aspect ratio of 4:3 (image size of 810x1080 mm) or 3:2 (image size of 810x1215 mm). It is suitable for systems from 2 MP up to 180 MP.
TE269 OECF Chart (fol.* ISO 15739) D280
The TE269, a 36 patch OECF chart which basically follows ISO 14524, but implements additional steps especially at higher density levels.TE269A, gray patches according to ISO 14524. TE269B, better differentiation of the dark patches. TE269C, according to the upcoming standard IEC 62676-5: Video surveillance systems.
TE270X OECF Chart (fol.* ISO 14524/15739)
The OECF chart is equipped with two polarizing fi lters in the center of the chart. For cameras that do not allow a manual adjustment of the exposure, the automatic exposure control (AEC) is fooled by modifying the density (transmission) of the central part of the test chart.
TE271 3D Alignment Chart A1066
The real 3D Alignment Chart is designed to align and adjust cameras for a 3D shooting. A unique combination of 2D and 3D structures allows the easy and straightforward preparation of the stereoscopic camera setup.
TEST CHARTS
* following
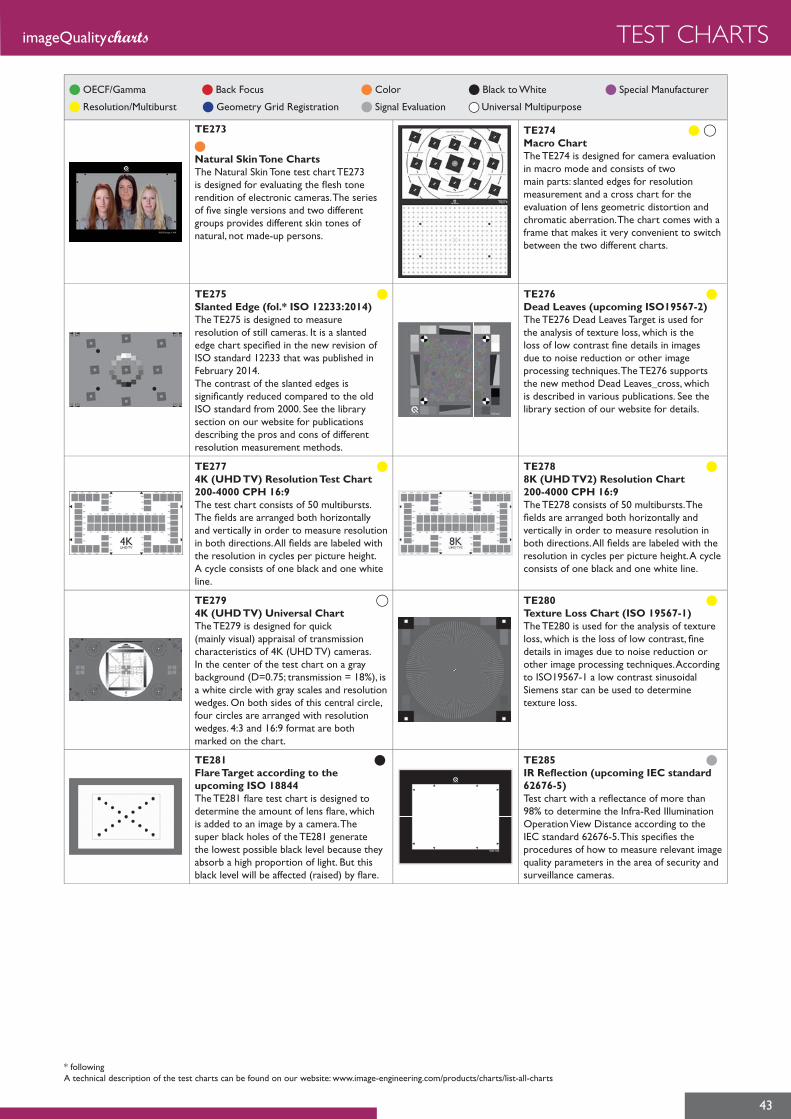
43
imageQualitycharts
OECF/Gamma Back Focus Color Black to White Special Manufacturer
Resolution/Multiburst Geometry Grid Registration Signal Evaluation Universal Multipurpose
TE273
Natural Skin Tone Charts
The Natural Skin Tone test chart TE273 is designed for evaluating the fl esh tone rendition of electronic cameras. The series of fi ve single versions and two different groups provides different skin tones of natural, not made-up persons.
TE274 Macro Chart
The TE274 is designed for camera evaluation in macro mode and consists of two main parts: slanted edges for resolution measurement and a cross chart for the evaluation of lens geometric distortion and chromatic aberration. The chart comes with a frame that makes it very convenient to switch between the two different charts.
TE275 Slanted Edge (fol.* ISO 12233:2014)
The TE275 is designed to measure resolution of still cameras. It is a slanted edge chart specifi ed in the new revision of ISO standard 12233 that was published in February 2014. The contrast of the slanted edges is signifi cantly reduced compared to the old ISO standard from 2000. See the library section on our website for publications describing the pros and cons of different resolution measurement methods.
TE276 Dead Leaves (upcoming ISO19567-2)
The TE276 Dead Leaves Target is used for the analysis of texture loss, which is the loss of low contrast fi ne details in images due to noise reduction or other image processing techniques. The TE276 supports the new method Dead Leaves_cross, which is described in various publications. See the library section of our website for details.
TE277 4K (UHD TV) Resolution Test Chart
200-4000 CPH 16:9
The test chart consists of 50 multibursts. The fi elds are arranged both horizontally and vertically in order to measure resolution in both directions. All fi elds are labeled with the resolution in cycles per picture height. A cycle consists of one black and one white line.
TE278 8K (UHD TV2) Resolution Chart
200-4000 CPH 16:9
The TE278 consists of 50 multibursts. The fi elds are arranged both horizontally and vertically in order to measure resolution in both directions. All fi elds are labeled with the resolution in cycles per picture height. A cycle consists of one black and one white line.
TE279 4K (UHD TV) Universal Chart
The TE279 is designed for quick (mainly visual) appraisal of transmission characteristics of 4K (UHD TV) cameras. In the center of the test chart on a gray background (D=0.75; transmission = 18%), is a white circle with gray scales and resolution wedges. On both sides of this central circle, four circles are arranged with resolution wedges. 4:3 and 16:9 format are both marked on the chart.
TE280
Texture Loss Chart (ISO 19567-1)
The TE280 is used for the analysis of texture loss, which is the loss of low contrast, fi ne details in images due to noise reduction or other image processing techniques. According to ISO19567-1 a low contrast sinusoidal Siemens star can be used to determine texture loss.
TE281
Flare Target according to the
upcoming ISO 18844
The TE281 fl are test chart is designed to determine the amount of lens fl are, which is added to an image by a camera. The super black holes of the TE281 generate the lowest possible black level because they absorb a high proportion of light. But this black level will be affected (raised) by fl are.
TE285
IR Refl ection (upcoming IEC standard
62676-5)
Test chart with a refl ectance of more than 98% to determine the Infra-Red Illumination Operation View Distance according to the IEC standard 62676-5. This specifi es the procedures of how to measure relevant image quality parameters in the area of security and surveillance cameras.
* followingA technical description of the test charts can be found on our website: www.image-engineering.com/products/charts/list-all-charts
TEST CHARTS

44
imageQualitycharts
HD TRAVEL KIT SB (K180) LIGHT TRAP
TE115 white balance chart (70% refl ectance)
TE148 sector star (36 cycles)
TE233 color chart (24 colors + 4 skin tones)
TE256 color calibration chart
HD TRAVEL KIT (K180) NO LIGHT TRAP
TE115 white balance chart (70% refl ectance)
TE148 sector star (36 cycles)
TE256 color calibration chart
HD TRAVEL KITS
SUPER BLACK HOLE (LIGHT TRAP)
Both, HD Studio Kit and HD Travel Kit SB, include a folded up light trap that is easy to handle. It increases the contrast of the TE256 between the white patch and the two dark holes to at least 2000 : 1.
HD STUDIO KIT 3 (K360) LIGHT TRAP
TE148 sector star (36 cycles)
TE233 color chart (24 colors + 4 skin tones)
TE256 color calibration chart
HD STUDIO KIT 4 (K360) LIGHT TRAP
TE148 sector star (36 cycles)
TE233 color chart (24 colors + 4 skin tones)
TE234 color gradiation test chart
TE256 color calibration chart
HD STUDIO KITS
TEST CHARTS FOLDER

45
imageQualitycharts ACCESSORIES
ACCESSORIES
iQ-Tripodmount frame for test charts in size A280 / A360 / A460
iQ-Foldermount frame for Studio Kits
iQ-Tablemount frame for refl ective charts A280 / A360 / A460
iQ-Wallmount frames for refl ective test charts in size A1066
chartBOARD has a magnetic, neutral gray surface with special alignment marks.
magneticTAPE can be fi xed on the backside of all refl ective charts.
iQ-Chartmount-V is a vertical sliding chart holder for easily changing charts, manually or automatically with the iQ-Drive API.
Support with wheels and precise height adjustment for the LE6/LE7 series.
Tripods for the LE6, LG3 and LG2 series.
iQ-Mobilemount
Tripod mount for mobiles and tablets.
iQ-Monopod Tripod for a professional, quick and exact camera positioning.
Cases for storage, protection and transport
• Chart cases for transparent test charts available in all sizes• Chart cases for refl ective test charts available in all sizes • Cases for spherical illuminators LE6/LE7/CAL3• Cases for illumination devices LG2/LG3
APIAVAILABLE
iQ-LEDTECHNOLOGY

46
imageQualitycharts
GOSSEN MAVO-MONITOR USBUsable for precise measurements of luminance levels of transparent test charts.
GOSSEN DIGIPRO F2
HONEYCOMB BREADBOARD
An exposure meter for high precision incident light measurement. Ensures the illumination uniformity of refl ective test charts.
The Honeycomb Breadboard is an ideal and useful accessory to securely mount STEVE-6D on a fl at and stiff surface when measuring the image stabilization performance of cameras or mobile devices. This platform has the following advantages:
Main Features: • silicon blue cell photodiode• digital display• measuring range LW –2.5 to +18 (with ISO 100/21°)• repeatable accuracy ±0,1 LW• exposure times1/8000 s to 60 min• aperture stops f/1 to f/90 9/10
• resists bending when force is applied• lightweight and portable• platform sides are made of stainless steel• countersunk and tapped holes with
threads for individual mounting
GOSSEN MAVOLUX 5032 B USB
PRC KROCHMANN RADIOLUX 111
Digital luxmeter and luminance meter classifi ed accordingto DIN 5032-7 and CIE 69.
The RadioLux 111 is a precision hand held instrument for photometric measurement.
Main Features: • silicon photo diode, color corrected, i.e.
its spectral responsitivity is matched to the spectral photopic vision of the human eye V(λ).
• measuring range 0.01 lx to 199900 lx and 0.1 cd/m² to 1999000 cd/m² in 5 ranges (with luminance attachment)
• measurement rate: 2 measurements per second
Main Features: • autoranging from 0.001 lx to 360 klx• luminance adapter• universal possibilities of application with a
wide range of accessories• serial computer interface with USB
adapter in the advanced version• Class L
RESTANOur PTFE (polytetrafl uoroethylene) based RESTAN is the ultimate white reference. It diffusely refl ects more than 98% of light in the area between 300 and 1700 nm. This means the refl ection level is higher and more uniform, especially at longer wavelengths than the refl ectance of barium sulfate (BaSO4).
HEDLER TUNGSTEN HALOGENLIGHT UNITTungsten halogen light comes with two independent switchable tungsten halogen bulbs. The light unit is suited for all photographic fi elds, mainly when a high intensity light is needed. The continuous spectrum makes it particularly suitable for all kinds of color measurement where fl uorescent light sources may cause metamerism problems.
FLUORESCENT TUBE LIGHT SOURCEFluorescent tube light sources are an economic illumination system for digital imaging. The color temperature is approx. 5500 K. The six bulbs, each with 55 W, are as bright as the usual 2650 W standard illumination, but the power consumption is only 330 watts. The durability of the bulbs is approx. 7000 hours.
h a
MANFROTTO 055XPRO3 TRIPOD MANFROTTO 410 – 3-WAY HEADThe Manfrotto 055XPRO3 guarantees camera stability and is a secure method to test image quality.
Extremely compact 3-Way tripod head
The very compact Manfrotto 410 head offers movement in three directions, pan, tilt and side to side tilt. It is suitable for 35 mm SLR medium format cameras and the iQ-Mobilemount.
POD
Main Features:
• classifi ed according to DIN 5032-7 Class B and CIE no. 69
• silicon photo diode, color corrected with spectral response matched to the spectral photopic vision of the human eye V(λ)
• 3½ digit display• data storage of max. 100 values• USB 1.1 interface• CD ROM with software for processing the
measured values and controlling the meter
3RD PARTY ACCESSORIES
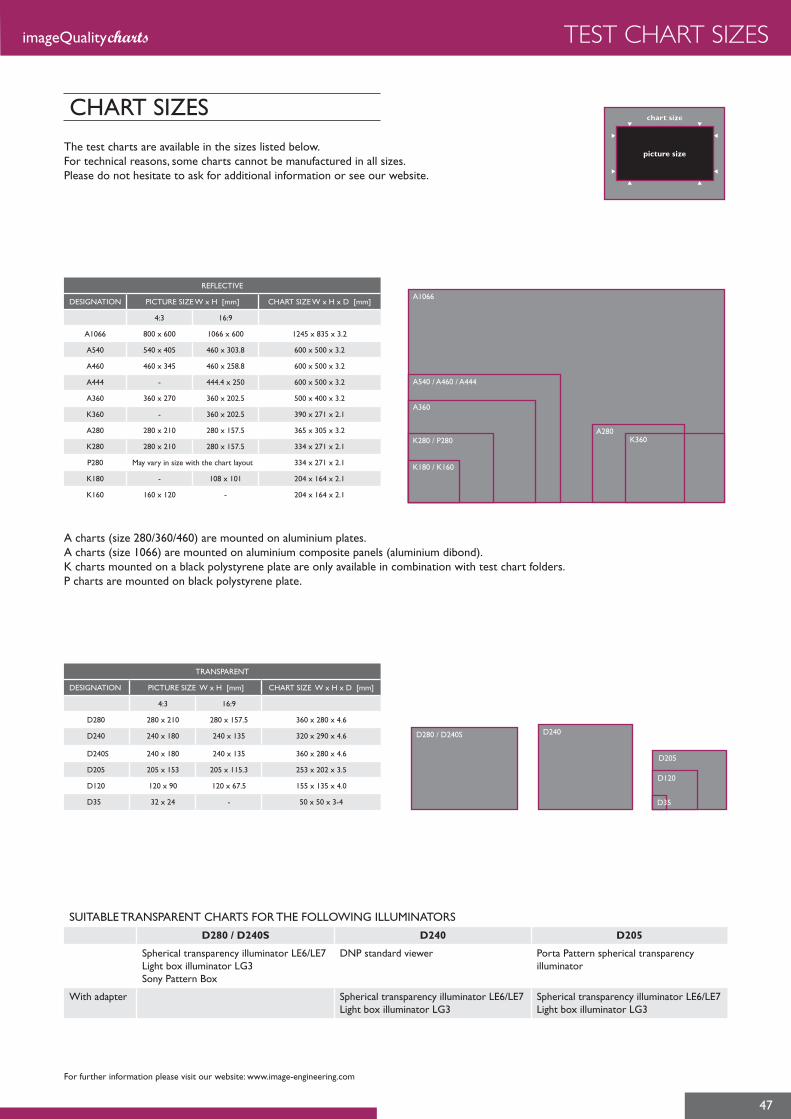
47
imageQualitycharts TEST CHART SIZES
REFLECTIVE
DESIGNATION PICTURE SIZE W x H [mm] CHART SIZE W x H x D [mm]
4:3 16:9
A1066 800 x 600 1066 x 600 1245 x 835 x 3.2
A540 540 x 405 460 x 303.8 600 x 500 x 3.2
A460 460 x 345 460 x 258.8 600 x 500 x 3.2
A444 - 444.4 x 250 600 x 500 x 3.2
A360 360 x 270 360 x 202.5 500 x 400 x 3.2
K360 - 360 x 202.5 390 x 271 x 2.1
A280 280 x 210 280 x 157.5 365 x 305 x 3.2
K280 280 x 210 280 x 157.5 334 x 271 x 2.1
P280 May vary in size with the chart layout 334 x 271 x 2.1
K180 - 108 x 101 204 x 164 x 2.1
K160 160 x 120 - 204 x 164 x 2.1
The test charts are available in the sizes listed below. For technical reasons, some charts cannot be manufactured in all sizes.Please do not hesitate to ask for additional information or see our website.
A charts (size 280/360/460) are mounted on aluminium plates.A charts (size 1066) are mounted on aluminium composite panels (aluminium dibond).K charts mounted on a black polystyrene plate are only available in combination with test chart folders.P charts are mounted on black polystyrene plate.
CHART SIZESchart sizechart size
picture sizepicture size
A1066
A540 / A460 / A444
A360
K280 / P280
K180 / K160
K360A280
TRANSPARENT
DESIGNATION PICTURE SIZE W x H [mm] CHART SIZE W x H x D [mm]
4:3 16:9
D280 280 x 210 280 x 157.5 360 x 280 x 4.6
D240 240 x 180 240 x 135 320 x 290 x 4.6
D240S 240 x 180 240 x 135 360 x 280 x 4.6
D205 205 x 153 205 x 115.3 253 x 202 x 3.5
D120 120 x 90 120 x 67.5 155 x 135 x 4.0
D35 32 x 24 - 50 x 50 x 3-4
SUITABLE TRANSPARENT CHARTS FOR THE FOLLOWING ILLUMINATORS
D280 / D240S D240 D205
Spherical transparency illuminator LE6/LE7Light box illuminator LG3Sony Pattern Box
DNP standard viewer Porta Pattern spherical transparency illuminator
With adapter Spherical transparency illuminator LE6/LE7Light box illuminator LG3
Spherical transparency illuminator LE6/LE7Light box illuminator LG3
For further information please visit our website: www.image-engineering.com
D280 / D240S D240
D205
D120
D35

Image Engineering GmbH & Co. KG
Im Gleisdreieck 550169 Kerpen-Horrem / GermanyT+49 2273 99 99 1-0F+49 2273 99 99 [email protected]
Image Engineering // imageQuality test equipment made in Germany