solvation dynamics: fundamentals and a survey of results
TRANSCRIPT
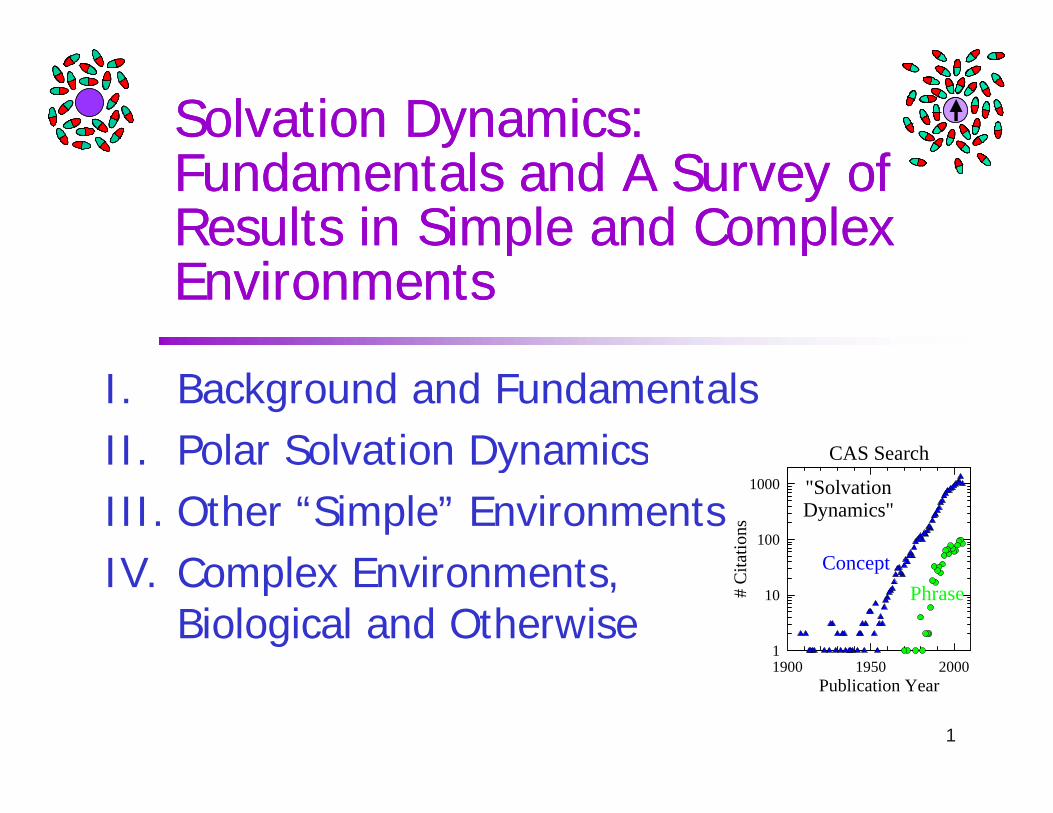
Solvation Dynamics: Solvation Dynamics: ffFundamentals and A Survey of Fundamentals and A Survey of
Results in Simple and Complex Results in Simple and Complex p pp pEnvironmentsEnvironments
I. Background and FundamentalsII Polar Solvation Dynamics CAS SearchII. Polar Solvation DynamicsIII. Other “Simple” EnvironmentsIV C l E i t
CAS Search
atio
ns 100
1000 "SolvationDynamics"
ConceptIV. Complex Environments, Biological and Otherwise
1900 1950 2000
# C
ita
1
10 PhraseConcept
1
Publication Year1900 1950 2000

I. Background & Fundamentals
Solvation Energies & SolvatochromismSolvatochromismThe Dynamic Stokes ShiftMeasurement TechniquesLinear Response (Interlude)p ( )3PEPS MeasurementsWhy Study?Why Study?
11/1/2005 Topic I - Fundamentals 2
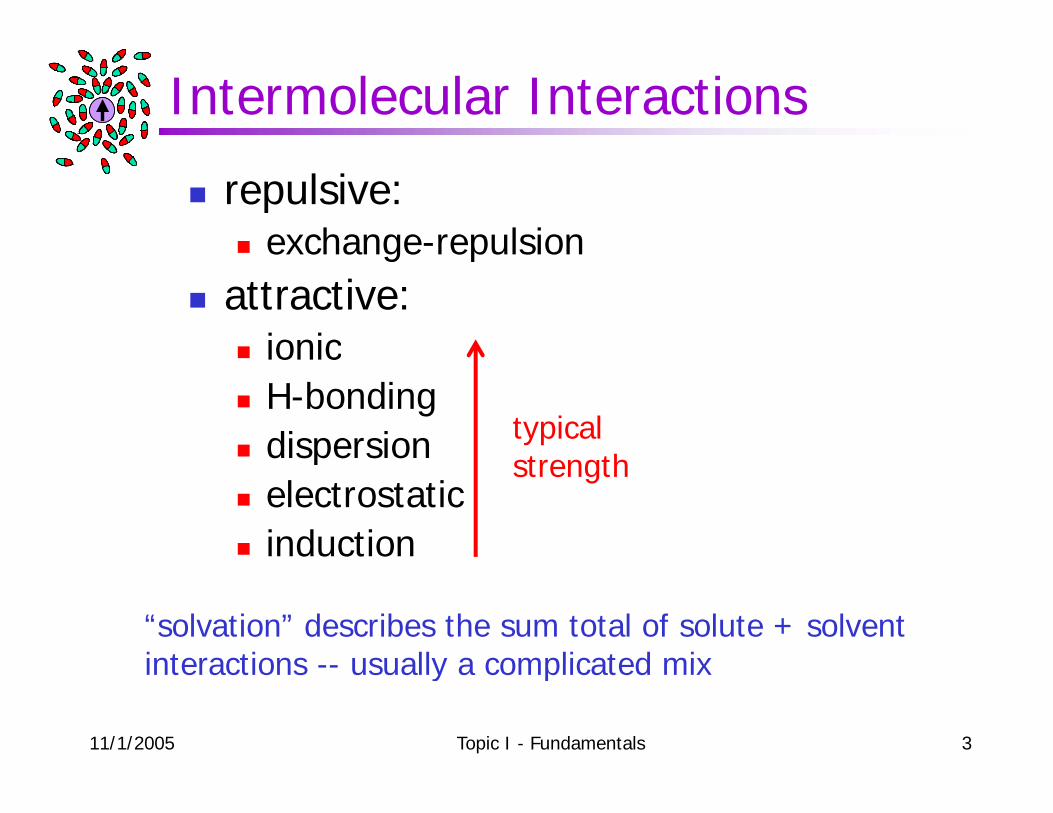
Intermolecular Interactions
repulsive:exchange-repulsionexchange repulsion
attractive:ionicionicH-bondingdispersion typical
t thd spe s oelectrostaticinduction
strength
“solvation” describes the sum total of solute + solvent interactions usually a complicated mix
11/1/2005 Topic I - Fundamentals 3
interactions -- usually a complicated mix

Solvation Energies - ΔGsolv
gas-phase solvent solvated soluteThe Solvation Process:
+
gas-phasesolute
ΔGsolv
solvent solvated solute
+
cavity formation u-v attraction(di i t )
Interpretation:y
(repulsion) (dispersion, μ-μ, etc.)
11/1/2005 Topic I - Fundamentals 4

Solvatochromism - hν = ΔΔGsolv
spectral shifts are differential solvation energies ΔΔG
SSS1S1
gasphase weakly
interacting l
gasphase weakly
interacting linteractingsolvent strongly
interactingsolvent
interactingsolvent strongly
interactingsolvent
S0S0
11/1/2005 Topic I - Fundamentals 5
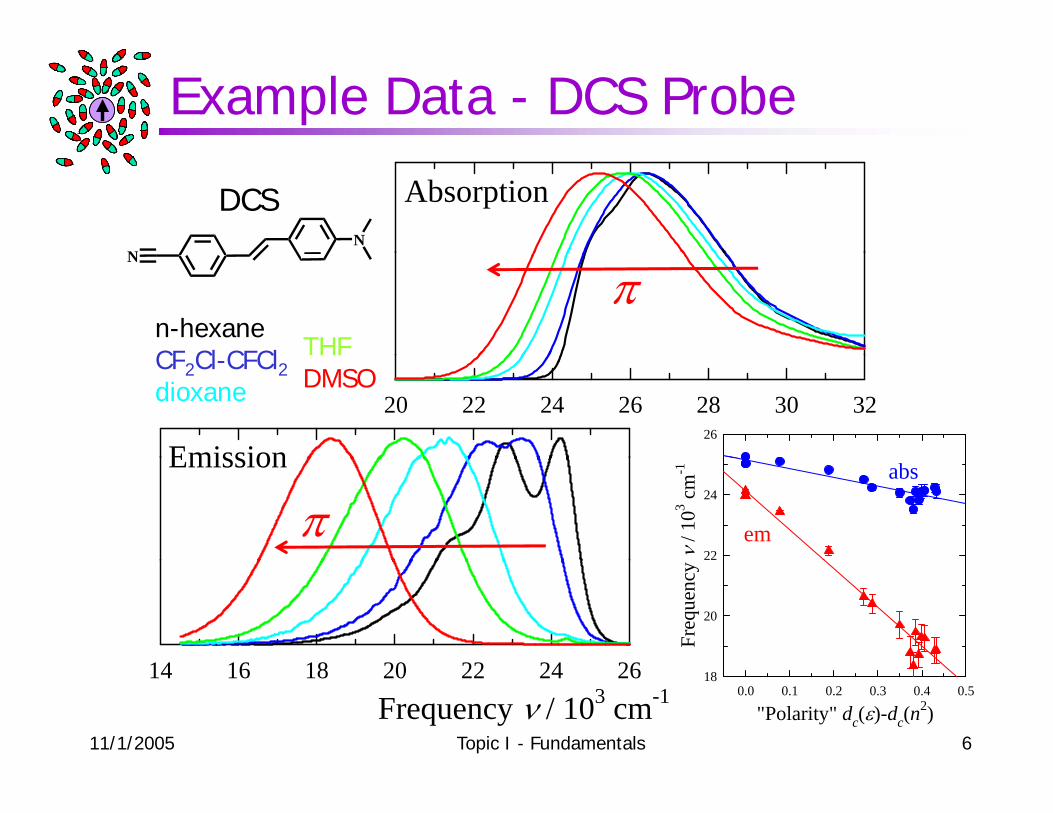
Example Data - DCS Probe
AbsorptionN
N
DCS
n-hexaneCF Cl CFCl THF
N
π
20 22 24 26 28 30 32
Emission
CF2Cl-CFCl2dioxane DMSO
26
Emission
ν / 1
03 cm
-1
22
24abs
emπ
14 16 18 20 22 24 26Fr
eque
ncy
20
11/1/2005 Topic I - Fundamentals 6
Frequency ν / 103 cm-114 16 18 20 22 24 26
"Polarity" dc(ε)-dc(n2)
0.0 0.1 0.2 0.3 0.4 0.518

Solvatochromic Polarity Scalesπ
“From the total of 78 solvatochromic and solvatofluorchromic compounds in Table 1 which have
πaz
oReichardt, Chem. Rev. 94, 2319 (1994).
solvatofluorchromic compounds in Table 1, which have been proposed and used as potential empirical solvent polarity indicators, up to now only ca. 18 of them have been really used to establish definite UV/vis/near-IR
ET(30)
been really used to establish definite, UV/vis/near-IR spectroscopically derived scales of solvent polarity…” RPM Z S
LMCTχR
π*χB
Py
11/1/2005 Topic I - Fundamentals 7

Solvatochromic Polarity Scales
“…Most of these scales are based on th t l d t f i l t d d
Reichardt (cont.) Z vs ET(30) - a favorable case
Zthe spectral data of a single standard probe (or reporter) molecule. They are, therefore, of somewhat limited
l i h l i l i f
Z
value in the correlation analysis of other solvent-dependent processes because they respond to a combination
E (30)of nonspecific and specific solute/solvent interactions, which are typical for the chemical structure of
ET(30)
the probe molecule, i.e. its ability to register dispersion, dipole/dipole, hydrogen-bond, and other possible
11/1/2005 Topic I - Fundamentals 8
intermolecular interactions.”

More Typical: ET(30) & H-Bonding
53)/1
03 cm
-1
0.5
1.0
N+O–OET(30) π*νabs
N1.0
λ (C
15
0.0λ C153
O
νabs νabs
O
π *
0.20.40.60.8
π∗
O
0.0
405060
π
C153ANδNMR
ON O
CF3 P AN
010203040
AcceptorNumber
νabs-νem
11/1/2005 Topic I - Fundamentals 9
ON O
ETN(30)
0.0 0.2 0.4 0.6 0.8 1.0

A Refinement
S1S1
What’s wrong with this picture? Absorption and EmissionS1
gaskl
S1
gaskl
26
Absorption and EmissionShifts are Different
gphase weakly
interactingsolvent strongly
interactingsolvent
gphase weakly
interactingsolvent strongly
interactingsolvent / 1
03 cm
-1
24abs
emS0S0
eque
ncy
ν
20
22
"Polarity" d (ε) d (n2)0.0 0.1 0.2 0.3 0.4 0.5
Fre
18
11/1/2005 Topic I - Fundamentals 10
Polarity dc(ε)-dc(n )

The Stokes Shift (DCS)
S1S1hexane~ gas
absem
solv
THF
solvΔν∼0
Ener
gy
SEner
gy
Sνabs νem
THF
Δν
S0S0
DMSO
ΔΔν
11/1/2005 Topic I - Fundamentals 11
Solvation CoordinateSolvation CoordinateFrequency ν / 103 cm-1
16 18 20 22 24 26 28 30
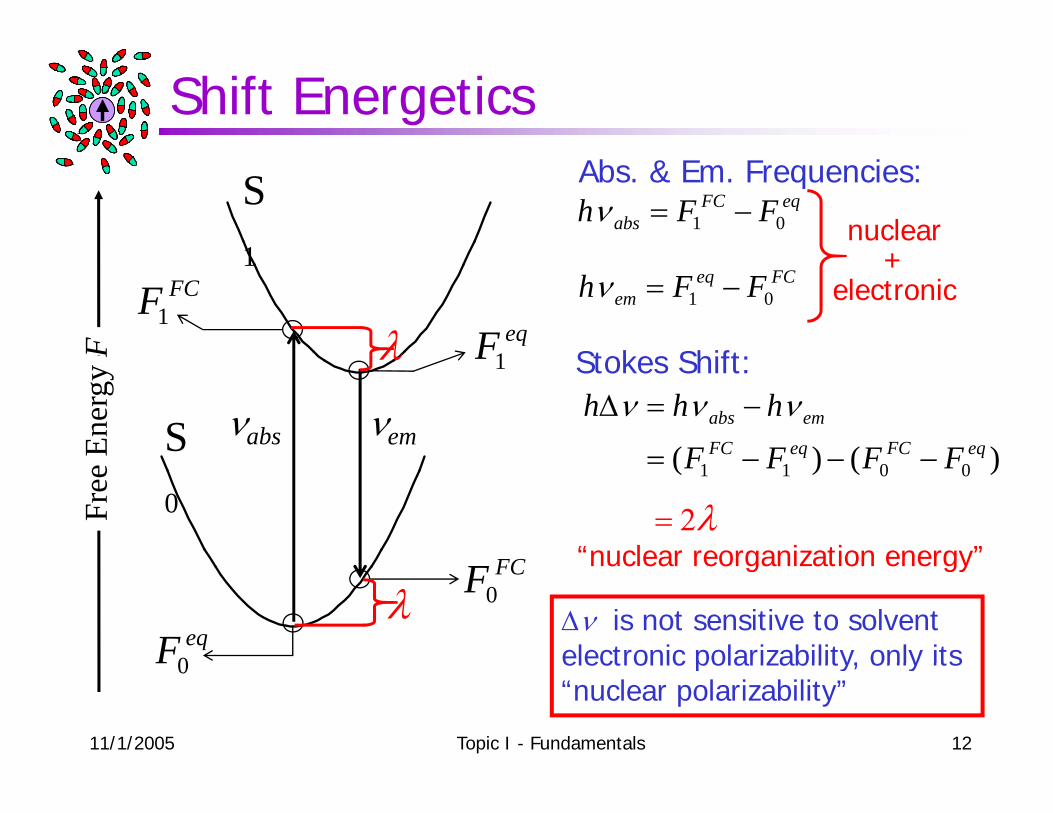
Shift Energetics
eqFCabs FFh 01 −=ν
nuclear+
Abs. & Em. Frequencies:S1
FCeqem FFh 01 −=ν
+electronic
Stokes ShiftF eqF1
FCF1
1
λ
)()( eqFCeqFCemabs
FFFF
hhh
=
−=Δ νννStokes Shift:
Ener
gy F
νabs νem
F1
S
λ
)()( 0011 FFFF −−−=
Free
FC
0 = 2λ“nuclear reorganization energy”
eqF0
FCF0λnuclear reorganization energy
Δν is not sensitive to solvent electronic polarizability, only its
11/1/2005 Topic I - Fundamentals 12
F0 electronic polarizability, only its “nuclear polarizability”

For Example, Dielectric Models
)}()({)( 220 nddCndAhvh ccabscabsabsabs −++= ενε0,n α,μ
)}()({)( 220 nddCndAhvh ccemcememem −++= εν2agas electronic nuclear
)}()(]{)(2[ 23201
0 nddahh cc −−+Δ=Δ − εμμνν rrgas electronic nuclear
322 3 3rrr
3/ ac α≡
solvent nuclearresponse
solute properties
solute factors: 32
021 )( −−−== aAA emabs μμ 3
010 )(2 −−⋅−= aCabs μμμ rrr 3011 )(2 −−⋅−= aCem μμμ rrr
)()( 0 xdxd ≡ 1)(0−
≡xxdsolvent dielectric
f ti
11/1/2005 Topic I - Fundamentals 13
)(21)(
0 xcdxdc − 12
)(0 +≡
xxdfunctions:

C153 Δν and π*
CF3N+O–O
cm-1
2 0
2.5r2=0.52
dipolarON O
O
ν / 1
03 c
1.5
2.0 dipolarmultipolarH-bonding
Shift
Δν
1.0• Δν (or λ) of C153
provides excellent measure of non-specific
Stok
es
0.5
CS2
pfhx.
measure of non specific solvent nuclear polarity
• correlation with π* scale is quite poor because the
π* Polarity-0.5 0.0 0.5 1.0
0.0 2is quite poor because the latter is strongly affected by electronic polarizability
11/1/2005 Topic I - Fundamentals 14
Reynolds, Maroncelli, J. Phys. Chem. 100, 10337 (1996)π Polarity

Key Points:
solvation energies reflect a complex mix of interactions (attractive & repulsive)te act o s (att act e & epu s e)solvatochromism is a differential measurement; what is measured are those ;interactions that change between S0 and S1
many scales of solvatochromic polarity exist each emphasizing a certain mixνabs & νem depend on both the electronic and nuclear solvent polarizabilities; Δν depends only on the nuclear part (i.e. the polarization requiring nuclear solvent motions)
11/1/2005 Topic I - Fundamentals 15
requiring nuclear solvent motions)
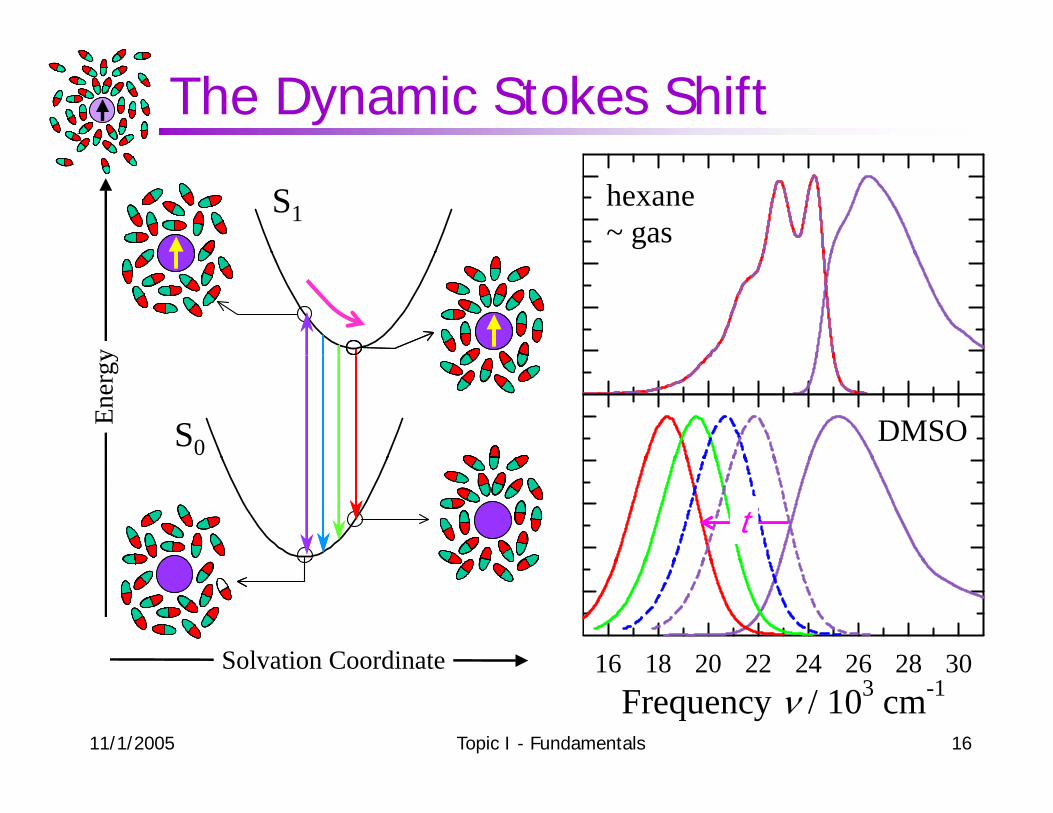
The Dynamic Stokes Shift
S1hexane~ gas
yEn
ergy
S0 DMSO
t
Solvation Coordinate 16 18 20 22 24 26 28 30
11/1/2005 Topic I - Fundamentals 16
Solvation Coordinate
Frequency ν / 103 cm-116 18 20 22 24 26 28 30

First Observations: T-dep.• before time-resolved spectra, solvation dynamics detected via
time-temperature connection first expressed by Bakhshiev ~1961
C102 / n-PropanolT/K88120140 3 c
m-1
24 0
24.5
abs140160175190233 ν 00
/ 10
3
23.5
24.0
em233295
eque
ncy
23.0
emT
absem Fre
22.5
11/1/2005 Topic I - Fundamentals 17
Frequency ν / 103 cm-118 20 22 24 26 28
Temperature / K100 150 200 250 300

Time-Resolved Experiments1 P l 298 K
NN
R
O4-AP probe
1-Propanol 298 K
N R
O
1-Propanol 203 Kt/ns48
stroboscopic fluorimetert
81523
t
11/1/2005 Topic I - Fundamentals 18
Ware & Co: Chem. Phys. Lett. 2, 356 (1968); J. Chem. Phys. 54, 4729 (1971).

Early Protein DynamicsTNS probe adsorbed to bovine serum albumin protein @ 273 KTNS
time resolved spectra λ(t) dataHN
TCSPC decays
-O3S
0.42 ns/cht=2,6,20 ns
1 − EtOH 273K2 - protein 273 K3 - protein 323 K4 l l 273 K
11/1/2005 Topic I - Fundamentals 19
Brand & Gohlke, J. Biol. Chem. 246, 2317 (1971).4 - glycerol 273 K5 - glycerol 323 K

Modern Measurement Techniques
Spontaneous Emission Methods:• phase fluorimetry• time-correlated single-photon counting• streak-camera• fluorescence upconversion
IRF>20 ps
• fluorescence upconversion• Kerr-gating
Stimulated Emission:• transient absorption /stimulated emission
or hole burning
Other:
<1 ps
Other:• photon echo (3PEPS) measurements• THz & RAPTORS (solvent’s perspective)
11/1/2005 Topic I - Fundamentals 20
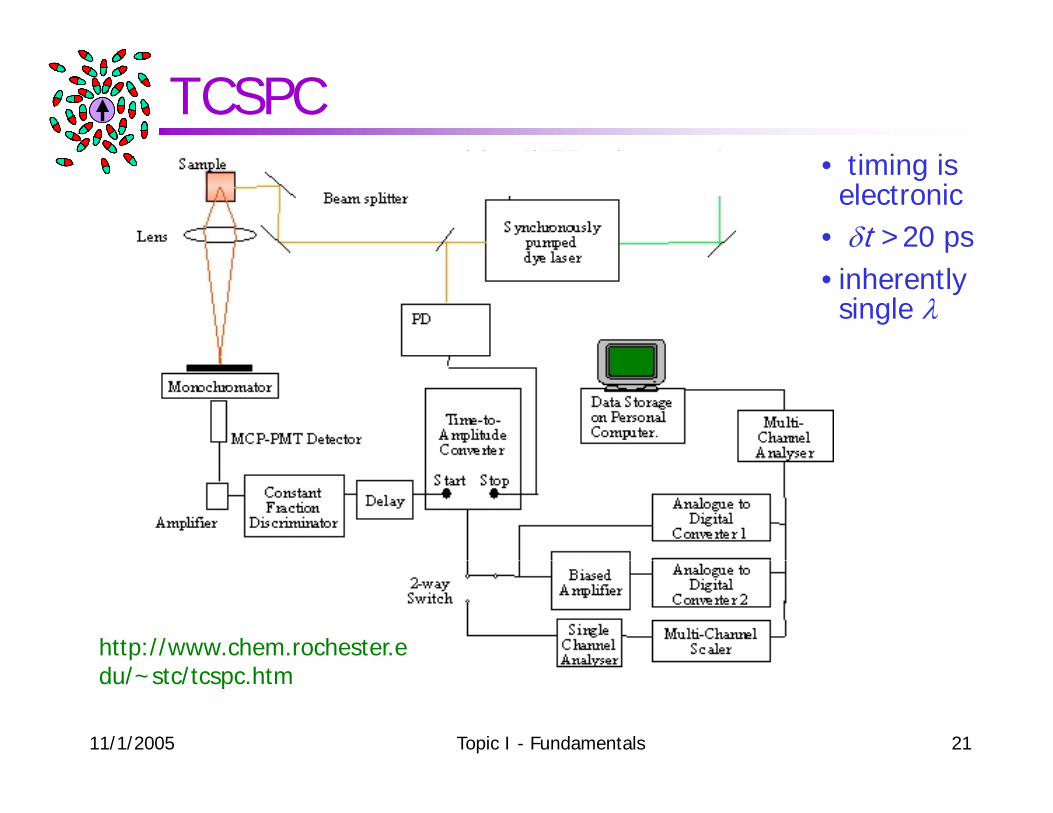
TCSPC• timing is electronic
• δt >20 ps• inherently single λ
http://www.chem.rochester.e
11/1/2005 Topic I - Fundamentals 21
du/~stc/tcspc.htm

Fluorescence Upconversion
Nonlinear upconvertedi icrystal emission
ω1+ω2
•better than 100 fs IRF possible (but hard)
11/1/2005 Topic I - Fundamentals 22
better than 100 fs IRF possible (but hard)

A. Single Wavelength Versionunamplified Ti:saphunamplified Ti:saph390 nm pump440-700 em.IRF 120 fs fwhmIRF 120 fs fwhm
11/1/2005 Topic I - Fundamentals 23
Horng et al., J. Phys. Chem. 99, 17311 (1995); after Fleming & co.

Representative Data - 1λ upcv
Single λ Decay & Fit Decays Across Spectrum4 exp
02
4 exp
λ.02 .2
2 ps/ch
IRF
Frauchiger Castner J Phys Chem
11/1/2005 Topic I - Fundamentals 24
Horng et al., J. Phys. Chem. 99, 17311 (1995)Frauchiger, Castner, J. Phys. Chem. B, 106 (30), 7463

“Spectral Reconstruction” & Fitting
),(),(
)(),(0
tIdI
FtF i
i
iSSi λ
ττλ
λλ⎪⎭
⎪⎬⎫
⎪⎩
⎪⎨⎧
∝∫
∞
Log-Normal FitsNormalization
tens
ity t/ps005
C153/FA
)(0 i ⎭⎩∫
ssio
n In
t .05.1.25
ive
Emis .5
125
Rel
ati
50
11/1/2005 Topic I - Fundamentals 25Wavelength / nm
450 500 550 600

Broadband Upconversion
ss50 ps
• thin, low dispersion crystal (100μ KDP)
l 1300 (C•gate at long λ = 1300 nm (Cr: Forsterite laser)
•amplified pulses requiredp p q
11/1/2005 Topic I - Fundamentals 26
Schanz,… Ernsting, Appl. Phys. Lett. 79, 566 (2001).

“FLUPS” (FLuorescence UPconversion Spectroscopy)
• pulse tiltingp g• nearly dispersion-free collection• prism based spectrograph• 80 fs IRF 10 000 cm-1 range
11/1/2005 Topic I - Fundamentals 27
Zhao, …Ernsting, Phys. Chem. Chem. Phys. 7, 1716 (2005)• 80 fs IRF, 10,000 cm range

Kerr-Gated Emission Spectroscopy
0º 90ºKerrmedium
emission gatedemission
1969 D & H• 1969 Duguay & Hansen1970 Rentzepis & Co. 1st reports
• 1987 Rulliere & Co.
• 2000 Kanematsu & Co.
“ps fluorimeter” (δt ~ 25 ps)
t i i ti l2000 Kanematsu & Co.• 2000 Takeda et al.• 2003 Schmidt et al.
recent versions using opticalglasses & crystals; δt < 200 fs
11/1/2005 Topic I - Fundamentals 28
• 2002 Matousek et al. Raman spectroscopy

KGE Spectrometer
CoherentRegA
delay
BBO
770-850 nm250 kHz160 fs, 3-4μJ
P2F
mono-chromator
P1
Kerrcell
PMTF
CCD
samplecell to ADC
sync signal
AmplifierReferenceChannel
Arzhantsev & Maroncelli, Appl.• tuned for ns lifetime solutes•1 mm benzene Kerr medium
11/1/2005 Topic I - Fundamentals 29
Arzhantsev & Maroncelli, Appl. Spectroscop. 59, 206 (2005).
1 mm benzene Kerr medium

Limitations of KGE
fusedili 15
20C153
6
IRF limited ~200 fs Long τfl Challenging
< 300 fs
sity
silica
sity
10
15 τfl=6 ns
t>0 t<0
ve In
tens
b ve In
tens
0
5
DCS
signal
450 fs
Rel
ativ benzene
Rel
ativ
2
3 DCS0.6 ns
0
1
11/1/2005 Topic I - Fundamentals 30Time / ps
-1.5 -1.0 -0.5 0.0 0.5 1.0Wavelength / nm
400 450 500 550 600 6500
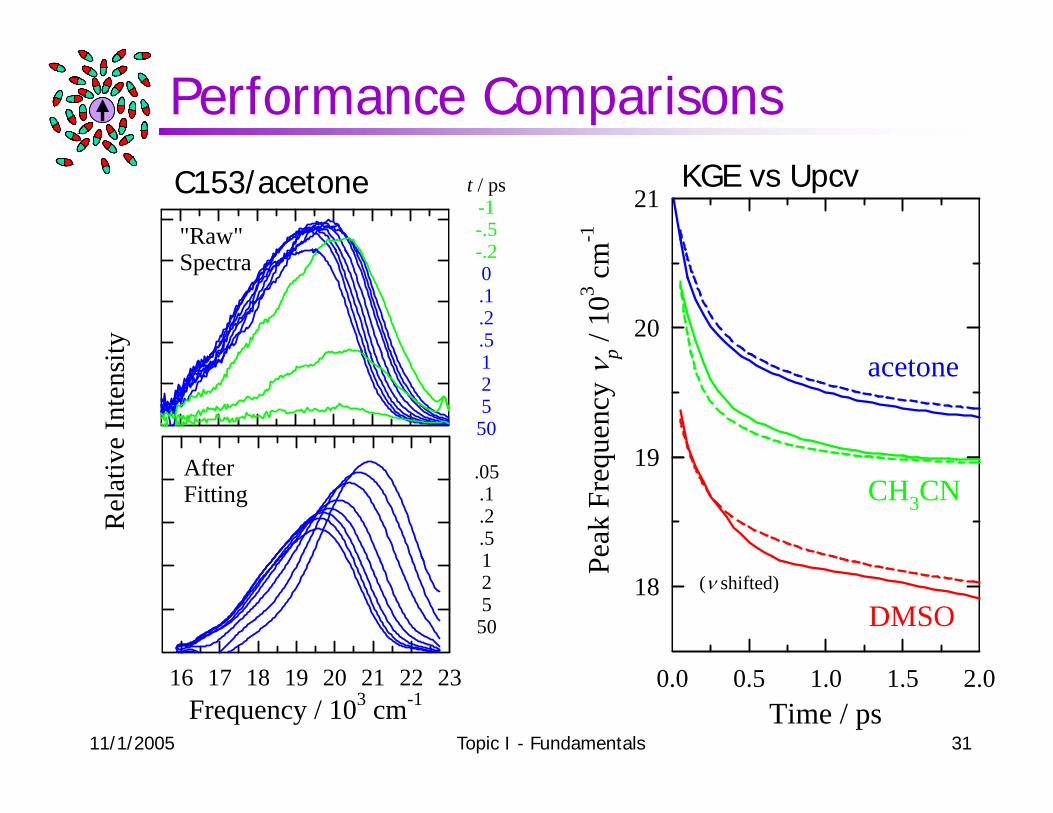
Performance Comparisonst / ps
-1-.5- 2
"Raw"
m-1
21C153/acetone KGE vs Upcv
ity
-.20.1.2.51
Spectra
p / 1
03 cm
20
ve In
tens
i 125
50
quen
cy ν
p
19
acetone
Rel
ativ .05
.1
.2
.51
AfterFitting
Peak
Fre
q 19CH3CN
125
50P
18 (ν shifted)
DMSO
11/1/2005 Topic I - Fundamentals 31
Frequency / 103 cm-116 17 18 19 20 21 22 23
Time / ps0.0 0.5 1.0 1.5 2.0

KGE current status
1500 Current Performance:DCS in SC CHF3 1.6ρc
t / ps0.1
+ 400-675 nm range+ sample OD << 1
Cou
nts
1000 .2.512
- IRF limited (450 fs)- spectral correction
l (6 f ld)C
5005
50large (6-fold)
- hard for τ>2 ns
400 450 500 550 6000
11/1/2005 Topic I - Fundamentals 32
Time / ps
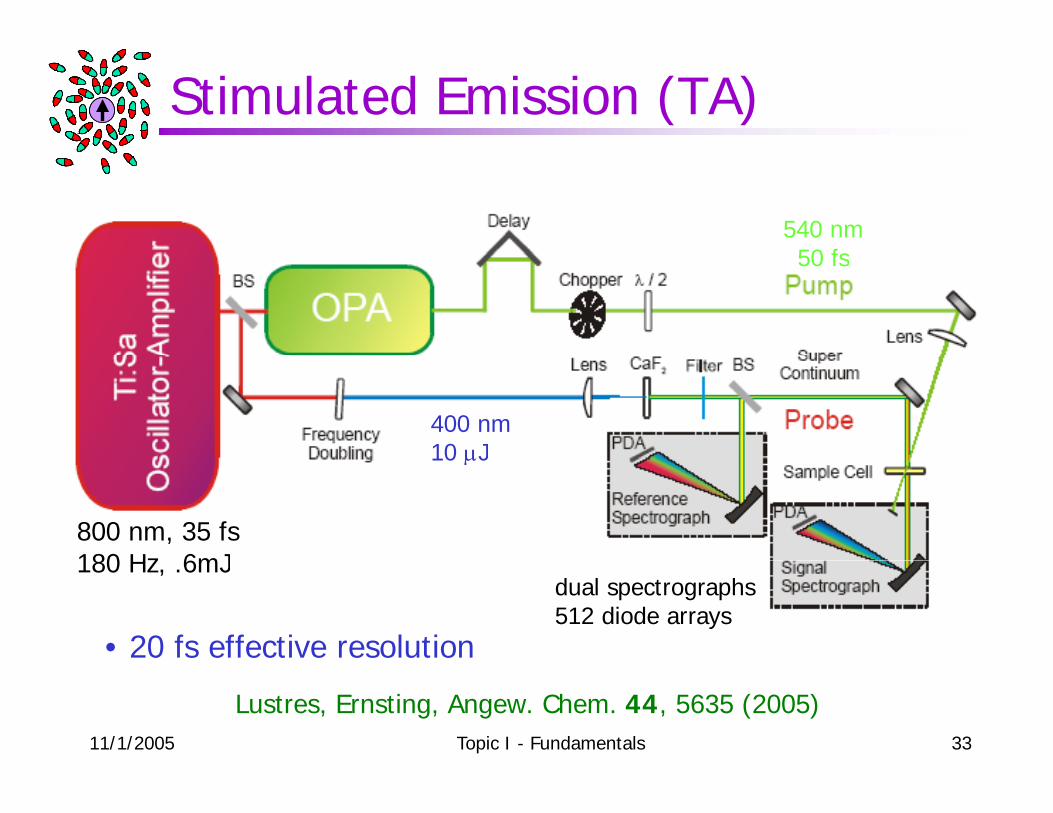
Stimulated Emission (TA)
540 nm50 fs50 fs
400 nm10 μJ
800 nm, 35 fs180 Hz 6mJ
10 μJ
180 Hz, .6mJdual spectrographs512 diode arrays
• 20 fs effective resolution
11/1/2005 Topic I - Fundamentals 33
Lustres, Ernsting, Angew. Chem. 44, 5635 (2005)

Sample data: MQ/MeOH
N+
• easier than upconversion but signal is GSB+ESA+SE
SnSnMQ in CH3OH
O-
S1 ESAS1 ESA
S0GSB SES0GSB SE
11/1/2005 Topic I - Fundamentals 34
Lustres, Ernsting, Angew. Chem. 44, 5635 (2005)

Sample data: MQ/MeOH ν(t)
m-1 H2O
• with care SE component can be extracted
N+
E /
103
cm
O-
ncy
of S
Eak
fre
que
CH3OH
pea
11/1/2005 Topic I - Fundamentals 35
time /ps
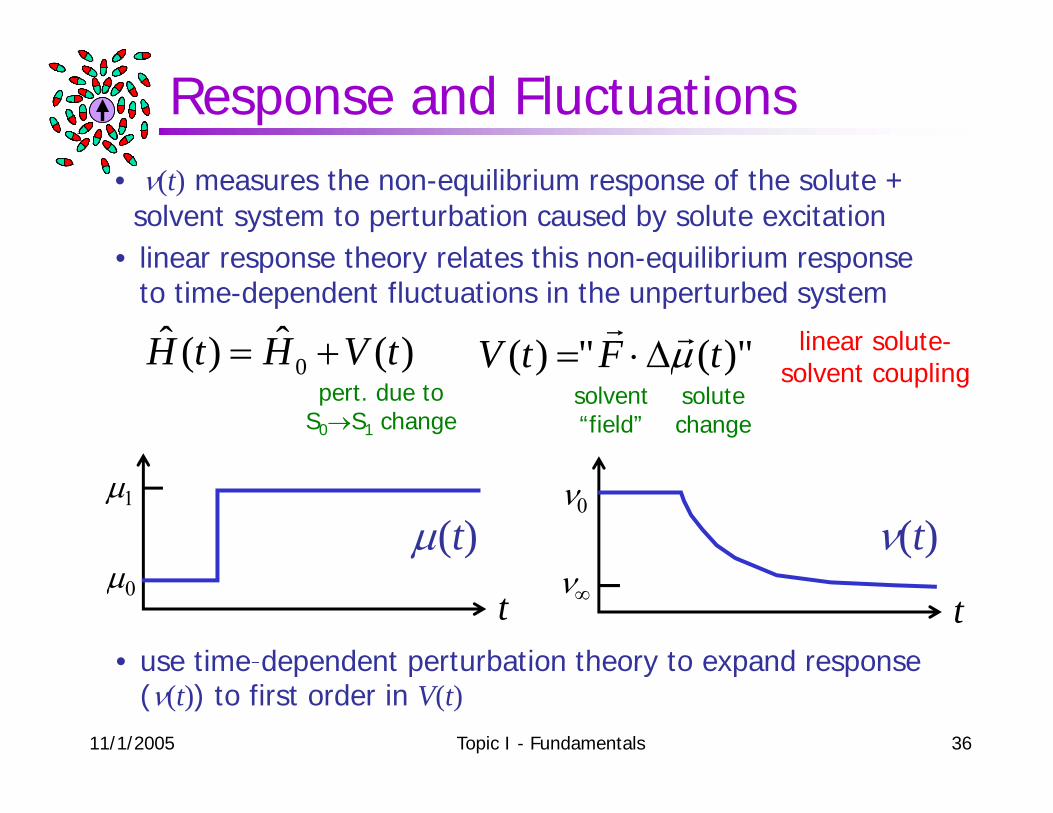
Response and Fluctuations• ν(t) measures the non-equilibrium response of the solute +
solvent system to perturbation caused by solute excitation linear response theory relates this non equilibrium response• linear response theory relates this non-equilibrium response to time-dependent fluctuations in the unperturbed system
)(ˆ)(ˆ tVHtH += )"(")( tFtV μrr
Δ⋅= linear solute-)()( 0 tVHtH += )()( tFtV μΔ⋅=pert. due to
S0→S1 changesolvent“field”
solutechange
solvent coupling
μ(t)μ1 ν0
ν(t)
• use time-dependent perturbation theory to expand response
tμ0
tν∞
11/1/2005 Topic I - Fundamentals 36
• use time dependent perturbation theory to expand response (ν(t)) to first order in V(t)

Linear Response Predictions
Non-Equilibrium Response Equilibrium Fluctuations
tEth )()( Δ=ν eqEtEth Δ−Δ= )()(δν
ne)()( eq
)()(
)()0( ∞−=Δ ννν TkBeq/δνmagni-
tude
νννν Δ∞−= )}()({)( ttS eqeqttC δνδνδνν )()0()( =time
dep.
11/1/2005 Topic I - Fundamentals 37

A Simulation Example
0.8
1.0CH3CN CH3OH
ν(t) 0.6 Δq/e
03/
Δq=1eS ν
0 2
0.4 3/41
Δq=0
Δq 1e
0 1 20.0
0.2
0 1 2 3 4
Δq=0is eq tcf
11/1/2005 Topic I - Fundamentals 38
Time / ps0 1 2
Time / ps0 1 2 3 4

3PEPS: The Echo IdeaFig. 1. Ray optics analogy for the three-pulse stimulated photon echo experiment. The rays represent the phase evolution of the quantum system. (a) After the initial pulse (τ = 0) the rays fan out with slopesthe initial pulse (τ = 0), the rays fan out with slopes determined by the value of the offset from the mean frequency of individual members of the inhomogeneous distribution. The second pulse (first lens) collimates the rays by converting the superposition into a population t t Th thi d l ( d l ) f thstate. The third pulse (second lens) refocuses the rays
by converting the population state to the Hermitian conjugate of the first superposition state. The echo intensity is proportional to the square of the field amplitude and thus depends on the amount of constructive interference generated by the third (rephasing) pulse. For a wide inhomogeneous distribution, the constructive interference is restricted to a very short time interval at around t = τ depicted by the sharpness of focus produced by the second lens. (b) p p y ( )The disruption of the smooth phase evolution during the population period, T, and during the two coherence periods (τ and t) leads to a loss of refocusing ability. Thus, by recording the photon echo as a function of the population period, the fluctuations in the
11/1/2005 Topic I - Fundamentals 39
Fleming, Proc. Natl. Acad. Sci. USA 95, 15161 (1998).
population period, the fluctuations in the inhomogeneous distribution ("spectral diffusion") can be followed.

3PEPS - The Experimentpeak shift
cavity dumped Ti:Sa 250 kHz, <1 nJ 20 fs
T=0
B B’<1 nJ, 20 fs
1 ps1 ps
50 ps
11/1/2005 Topic I - Fundamentals 40
Passino,… Fleming, J. Phys. Chem. A 101, 725 (1997); Larsen,…Fleming, J. Chem. Phys. 111, 8970 (1999).
τ

3PEPS - Interpretation•peak shift τ*(T) qualitatively like frequency tcf M(t), but complex analysis required for quantitative results
Input model M(t)solvent + intra vib
absorption spectrum
Fit to:
absorption spectrum
3PEPS
with
11/1/2005 Topic I - Fundamentals 41
Joo,…Fleming, J. Chem. Phys. 104, 6089 (1996).
Summary
many measurement options available for both single channel and complete spectral s g e c a e a d co p ete spect acoveragemeasuring spontaneous emission gets more g p gdifficult as IRF gets shortertransient absorption and 3PEPS measurements offer alternatives with very high time resolution but at the cost of added
l it f i t t ticomplexity of interpretation
11/1/2005 Topic I - Fundamentals 42

Why Solvation Dynamics?δ - δ -
dina
te”
P
on C
oord P
Solv
atio R
“Chemical Coordinate”
“
11/1/2005 Topic I - Fundamentals 43
Like it or not, solvent is part of the reaction coordinate!