solvency ii: a market risk perspective · solvency ii: a market risk perspective ... • client...
TRANSCRIPT
Solvency II: A Market Risk Perspective
September 2010
David Lomas, ACII
Managing Director
FOR PROFESSIONAL INVESTORS ONLY
2
Agenda
I. BlackRock Overview
II. Solvency II v Market Reality
III.Conclusions
3
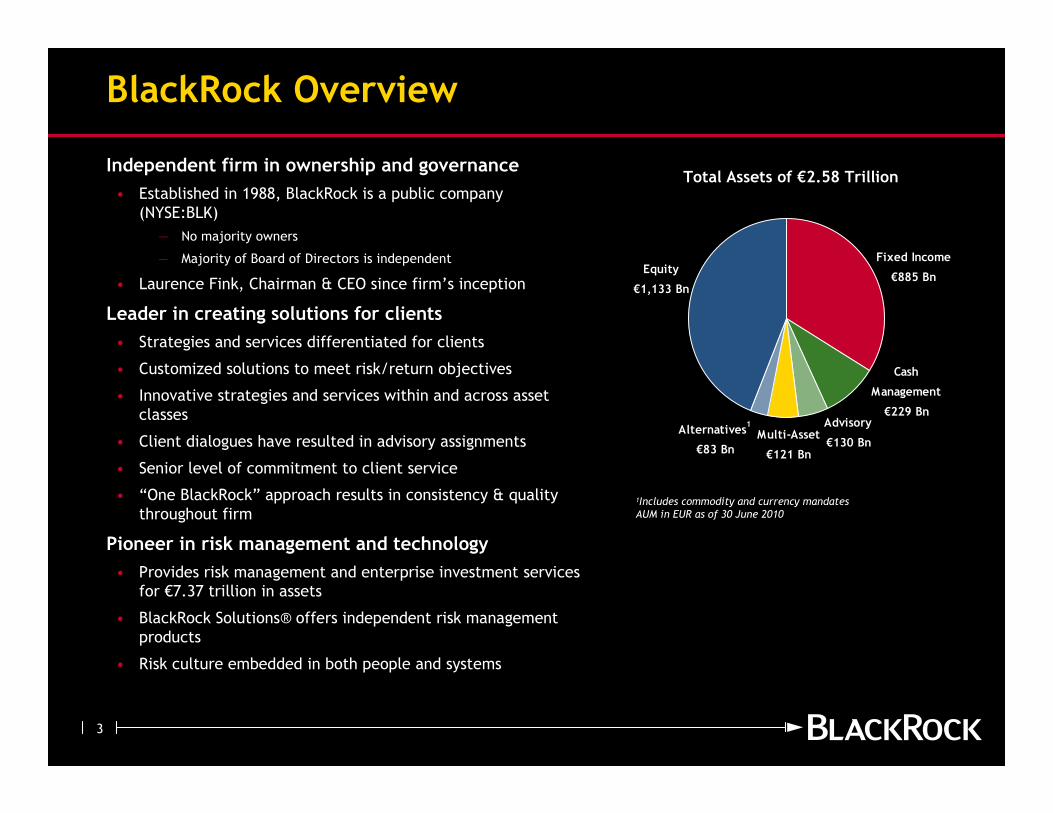
Multi-Asset
€121 Bn
Advisory
€130 BnAlternatives
1
€83 Bn
Equity
€1,133 Bn
Cash
Management
€229 Bn
Fixed Income
€885 Bn
BlackRock Overview
Independent firm in ownership and governance
• Established in 1988, BlackRock is a public company
(NYSE:BLK)
— No majority owners
— Majority of Board of Directors is independent
• Laurence Fink, Chairman & CEO since firm’s inception
Leader in creating solutions for clients
• Strategies and services differentiated for clients
• Customized solutions to meet risk/return objectives
• Innovative strategies and services within and across asset
classes
• Client dialogues have resulted in advisory assignments
• Senior level of commitment to client service
• “One BlackRock” approach results in consistency & quality
throughout firm
Pioneer in risk management and technology
• Provides risk management and enterprise investment services
for €7.37 trillion in assets
• BlackRock Solutions® offers independent risk management
products
• Risk culture embedded in both people and systems
Total Assets of €2.58 Trillion
1Includes commodity and currency mandatesAUM in EUR as of 30 June 2010
4
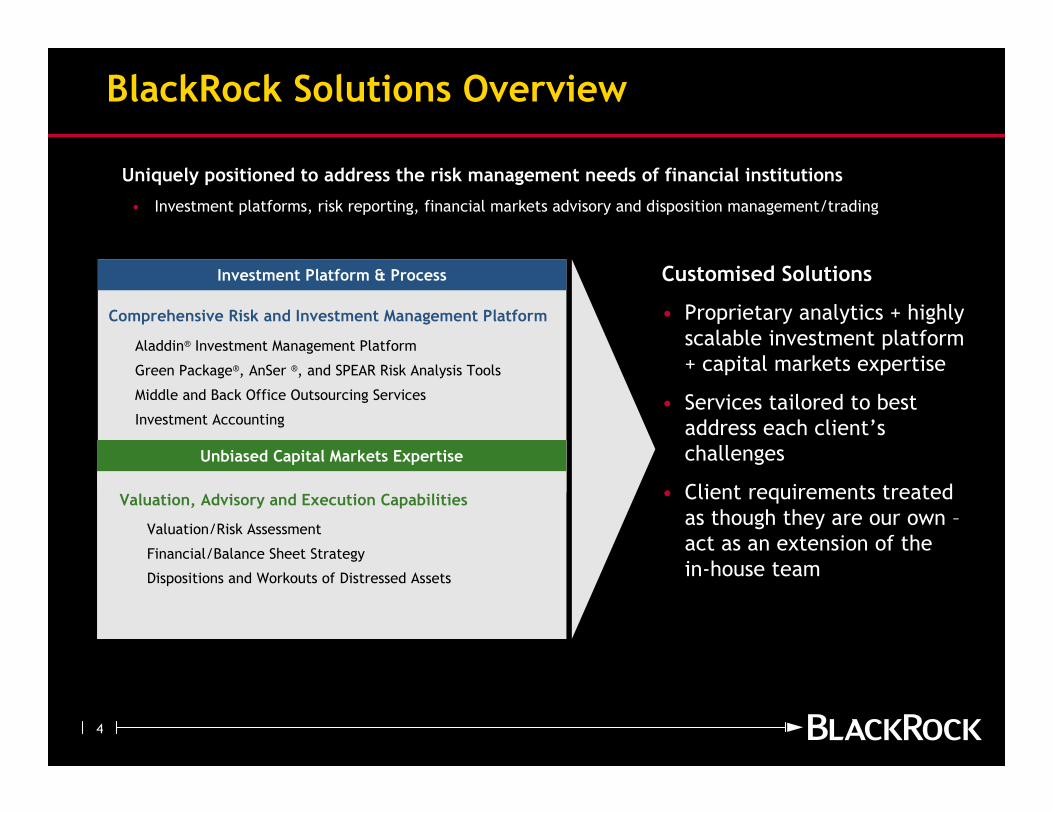
BlackRock Solutions Overview
Uniquely positioned to address the risk management needs of financial institutions
• Investment platforms, risk reporting, financial markets advisory and disposition management/trading
Customised Solutions
• Proprietary analytics + highly
scalable investment platform
+ capital markets expertise
• Services tailored to best
address each client’s
challenges
• Client requirements treated
as though they are our own –
act as an extension of the
in-house team
Investment Platform & Process
Aladdin® Investment Management Platform
Green Package®, AnSer ®, and SPEAR Risk Analysis Tools
Middle and Back Office Outsourcing Services
Investment Accounting
Comprehensive Risk and Investment Management Platform
Unbiased Capital Markets Expertise
Valuation, Advisory and Execution Capabilities
Valuation/Risk Assessment
Financial/Balance Sheet Strategy
Dispositions and Workouts of Distressed Assets
5
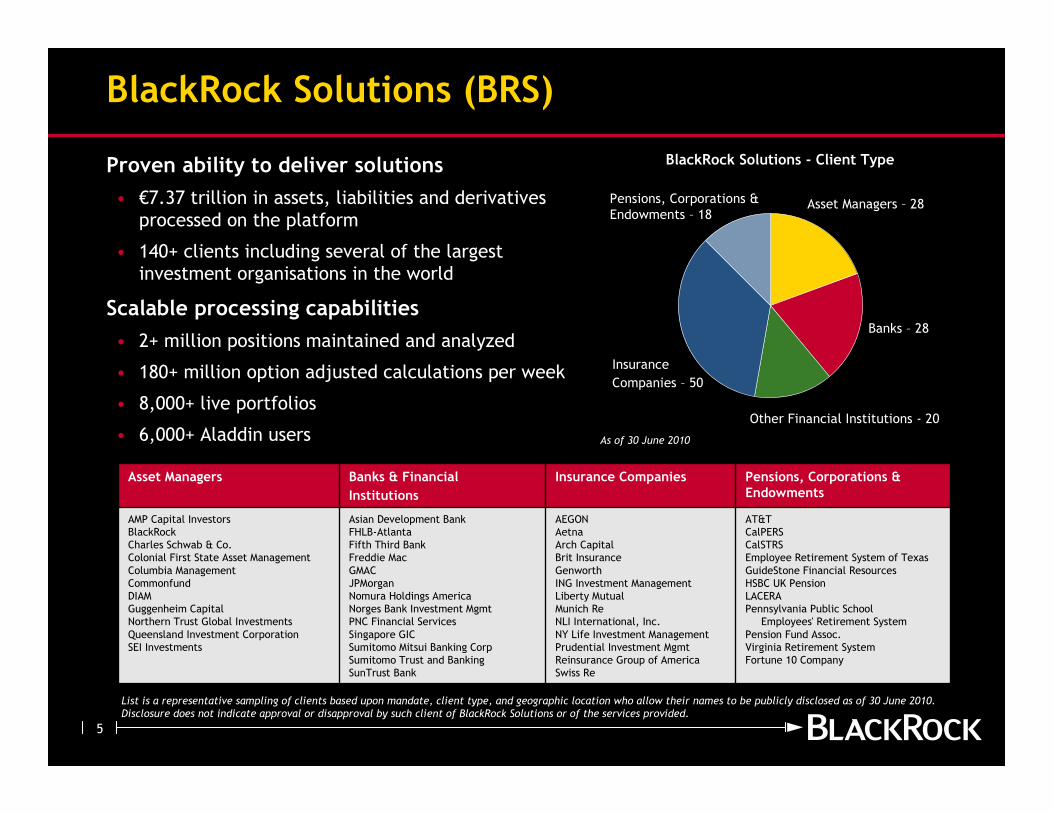
BlackRock Solutions (BRS)
Proven ability to deliver solutions
• €7.37 trillion in assets, liabilities and derivatives
processed on the platform
• 140+ clients including several of the largest
investment organisations in the world
Scalable processing capabilities
• 2+ million positions maintained and analyzed
• 180+ million option adjusted calculations per week
• 8,000+ live portfolios
• 6,000+ Aladdin users
BlackRock Solutions - Client Type
Banks – 28
Asset Managers – 28
Insurance
Companies – 50
Other Financial Institutions - 20
Pensions, Corporations &
Endowments – 18
List is a representative sampling of clients based upon mandate, client type, and geographic location who allow their names to be publicly disclosed as of 30 June 2010. Disclosure does not indicate approval or disapproval by such client of BlackRock Solutions or of the services provided.
AT&T
CalPERS
CalSTRS
Employee Retirement System of Texas
GuideStone Financial Resources
HSBC UK Pension
LACERA
Pennsylvania Public School
Employees' Retirement System
Pension Fund Assoc.
Virginia Retirement System
Fortune 10 Company
Pensions, Corporations & Endowments
AMP Capital Investors
BlackRock
Charles Schwab & Co.
Colonial First State Asset Management
Columbia Management
Commonfund
DIAM
Guggenheim Capital
Northern Trust Global Investments
Queensland Investment Corporation
SEI Investments
Asset Managers
AEGON
Aetna
Arch Capital
Brit Insurance
Genworth
ING Investment Management
Liberty Mutual
Munich Re
NLI International, Inc.
NY Life Investment Management
Prudential Investment Mgmt
Reinsurance Group of America
Swiss Re
Insurance Companies Banks & Financial
Institutions
Asian Development Bank
FHLB-Atlanta
Fifth Third Bank
Freddie Mac
GMAC
JPMorgan
Nomura Holdings America
Norges Bank Investment Mgmt
PNC Financial Services
Singapore GIC
Sumitomo Mitsui Banking Corp
Sumitomo Trust and Banking
SunTrust Bank
As of 30 June 2010
6
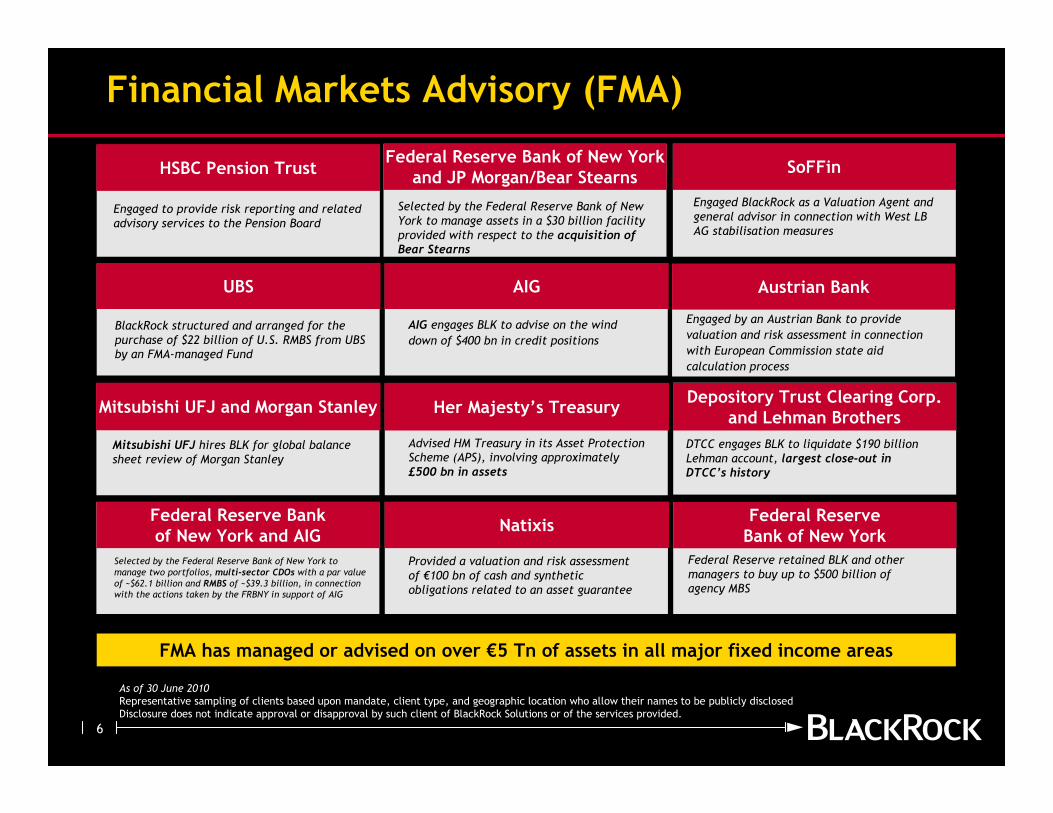
Financial Markets Advisory (FMA)
Engaged to provide risk reporting and related advisory services to the Pension Board
Selected by the Federal Reserve Bank of New York to manage assets in a $30 billion facility provided with respect to the acquisition of Bear Stearns
BlackRock structured and arranged for the purchase of $22 billion of U.S. RMBS from UBS by an FMA-managed Fund
AIG engages BLK to advise on the wind
down of $400 bn in credit positions
Engaged by an Austrian Bank to provide
valuation and risk assessment in connection
with European Commission state aid
calculation process
Mitsubishi UFJ hires BLK for global balance sheet review of Morgan Stanley
Advised HM Treasury in its Asset Protection Scheme (APS), involving approximately £500 bn in assets
DTCC engages BLK to liquidate $190 billion Lehman account, largest close-out in DTCC’s history
As of 30 June 2010Representative sampling of clients based upon mandate, client type, and geographic location who allow their names to be publicly disclosed
Disclosure does not indicate approval or disapproval by such client of BlackRock Solutions or of the services provided.
HSBC Pension TrustFederal Reserve Bank of New York
and JP Morgan/Bear Stearns
UBS AIG Austrian Bank
Mitsubishi UFJ and Morgan Stanley Her Majesty’s TreasuryDepository Trust Clearing Corp.
and Lehman Brothers
Provided a valuation and risk assessment of €100 bn of cash and synthetic obligations related to an asset guarantee
Federal Reserve retained BLK and other managers to buy up to $500 billion of agency MBS
Selected by the Federal Reserve Bank of New York to manage two portfolios, multi-sector CDOs with a par value of ~$62.1 billion and RMBS of ~$39.3 billion, in connection with the actions taken by the FRBNY in support of AIG
Federal Reserve Bank of New York and AIG
NatixisFederal Reserve Bank of New York
FMA has managed or advised on over €5 Tn of assets in all major fixed income areas
Engaged BlackRock as a Valuation Agent and general advisor in connection with West LB AG stabilisation measures
SoFFin
7
Agenda
I. BlackRock Overview
II. Solvency II v Market Reality
III.Conclusions
8
Market risk
55%
Non-life u/w
risk
16%
Health u/w
risk
12%
Life risk
15%
Counterparty
Risk 2%
Health u/w
risk
1%
Life risk 36%
Market Risk
60%
Counterparty
Risk 3%
Market Risk
33%
Non-life u/w
risk
44%
Life risk
1%Health u/w
risk
16%
Counterparty Risk
6%
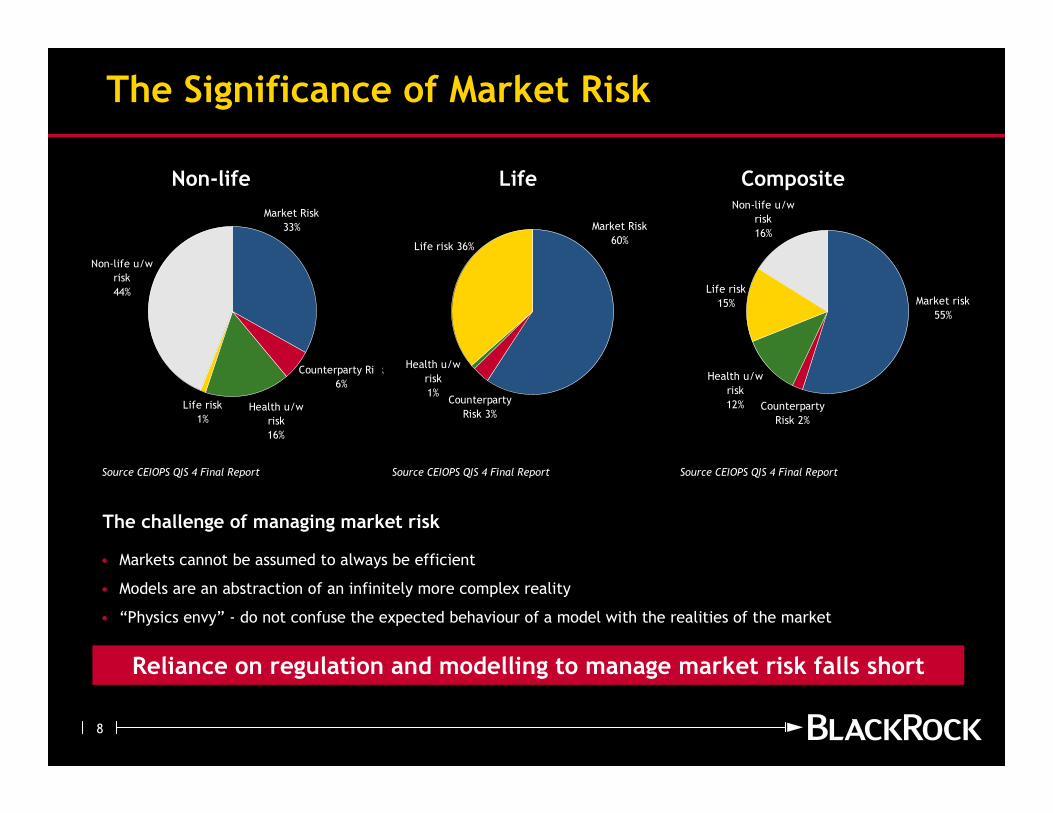
The Significance of Market Risk
Reliance on regulation and modelling to manage market risk falls short
The challenge of managing market risk
Life Composite
Source CEIOPS QIS 4 Final Report
• Markets cannot be assumed to always be efficient
• Models are an abstraction of an infinitely more complex reality
• “Physics envy” - do not confuse the expected behaviour of a model with the realities of the market
Non-life
Source CEIOPS QIS 4 Final Report Source CEIOPS QIS 4 Final Report
9
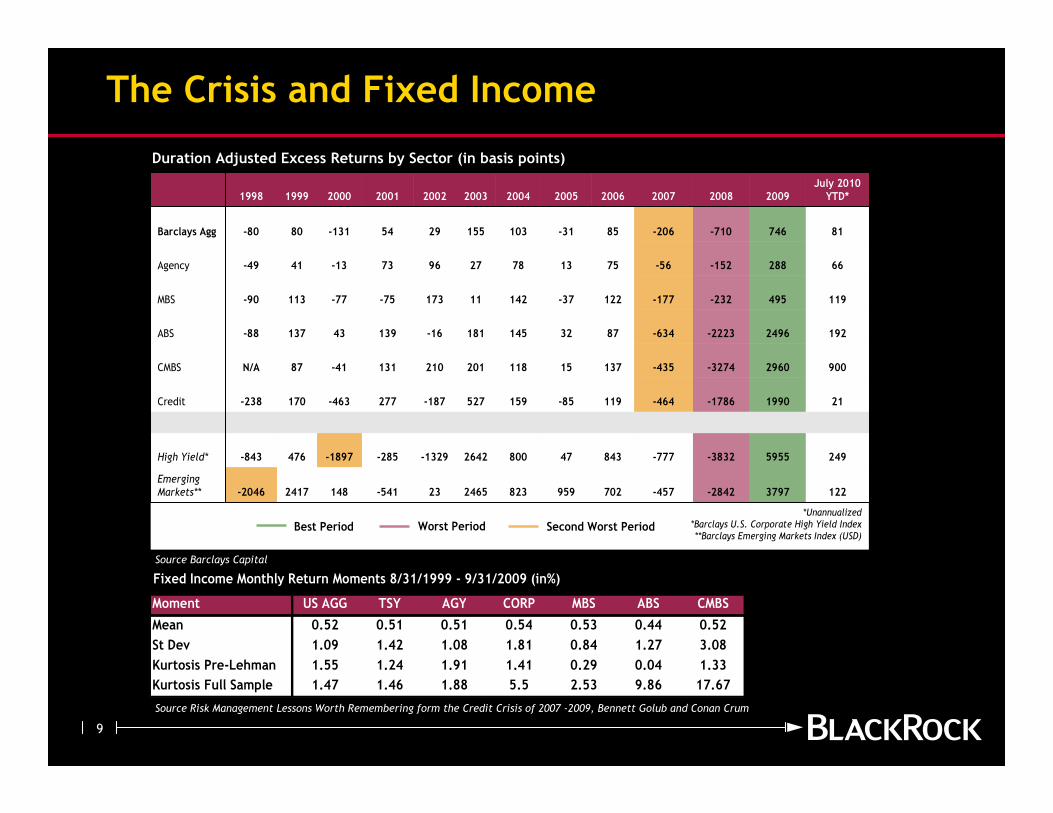
Moment US AGG TSY AGY CORP MBS ABS CMBS
Mean 0.52 0.51 0.51 0.54 0.53 0.44 0.52
St Dev 1.09 1.42 1.08 1.81 0.84 1.27 3.08
Kurtosis Pre-Lehman 1.55 1.24 1.91 1.41 0.29 0.04 1.33
Kurtosis Full Sample 1.47 1.46 1.88 5.5 2.53 9.86 17.67
Fixed Income Monthly Return Moments 8/31/1999 - 9/31/2009 (in%)
Worst Period Second Worst PeriodBest Period
*Unannualized*Barclays U.S. Corporate High Yield Index**Barclays Emerging Markets Index (USD)
3797
5955
1990
2960
2496
495
288
746
2009
122
249
21
900
192
119
66
81
July 2010 YTD*
-2842-457702959823246523-5411482417-2046Emerging Markets**
-3832-777843478002642-1329-285-1897476-843High Yield*
-1786
-3274
-2223
-232
-152
-710
2008
-464119-85159527-187277-463170-238Credit
-43513715118201210131-4187N/ACMBS
-6348732145181-1613943137-88ABS
-177122-3714211173-75-77113-90MBS
-56751378279673-1341-49Agency
-20685-311031552954-13180-80Barclays Agg
2007200620052004200320022001200019991998
The Crisis and Fixed Income
Source Barclays Capital
Source Risk Management Lessons Worth Remembering form the Credit Crisis of 2007 -2009, Bennett Golub and Conan Crum
Duration Adjusted Excess Returns by Sector (in basis points)
Fixed Income Monthly Return Moments 8/31/1999 - 9/31/2009 (in%)
10
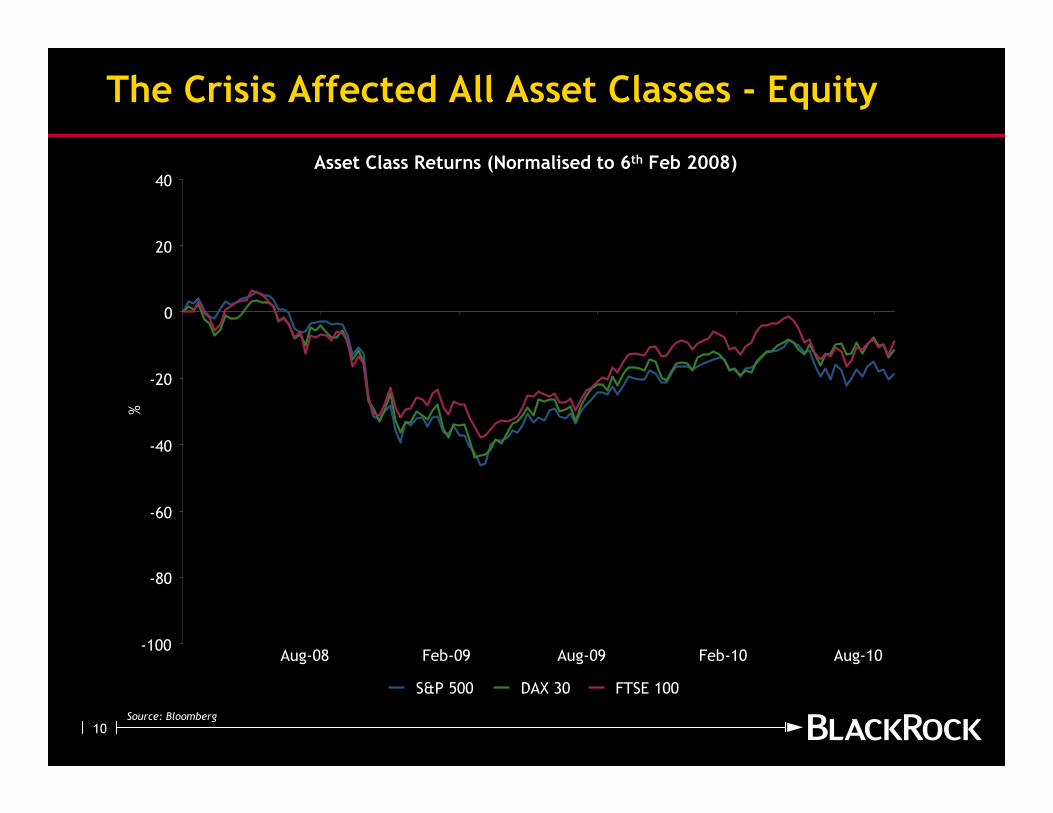
The Crisis Affected All Asset Classes - Equity
Asset Class Returns (Normalised to 6th Feb 2008)
Source: Bloomberg
-100
-80
-60
-40
-20
0
20
40
Aug-08 Feb-09 Aug-09 Feb-10 Aug-10
%
S&P 500 DAX 30 FTSE 100
11
-100
-80
-60
-40
-20
0
20
40
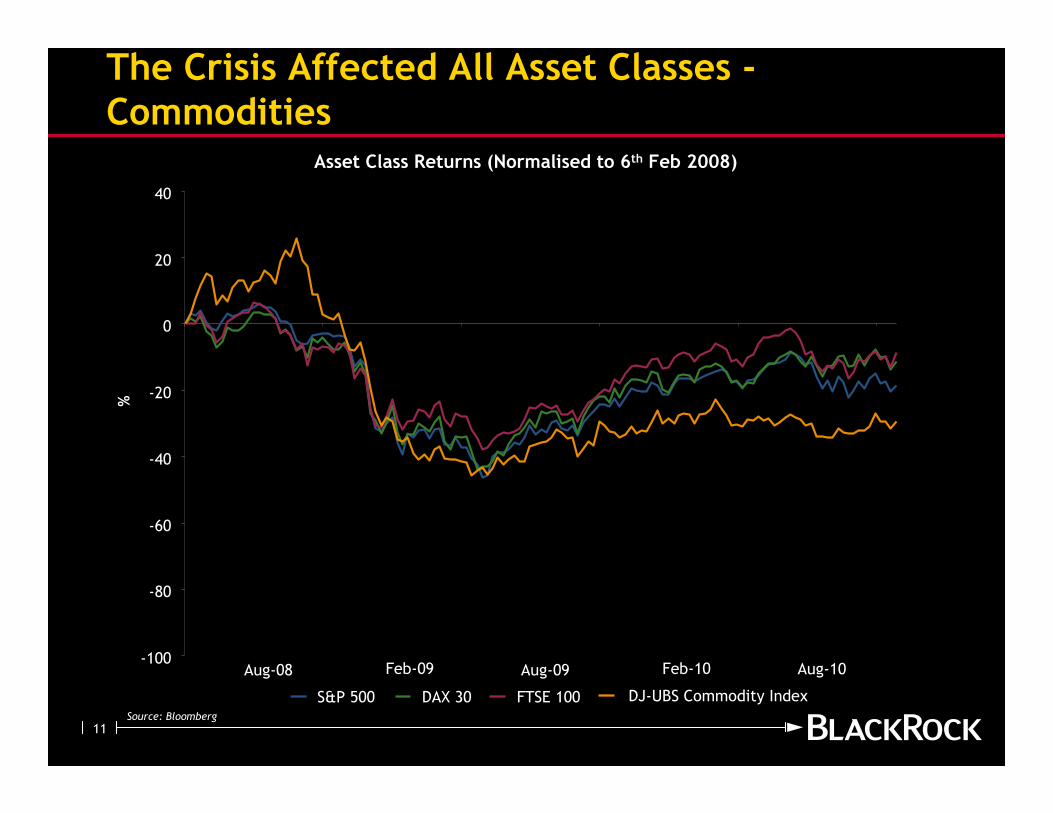
Aug-08 Feb-09 Aug-09 Feb-10 Aug-10
%
DJ-UBS Commodity Index
The Crisis Affected All Asset Classes -Commodities
Asset Class Returns (Normalised to 6th Feb 2008)
Source: Bloomberg
S&P 500 DAX 30 FTSE 100
12
-100
-80
-60
-40
-20
0
20
40
%
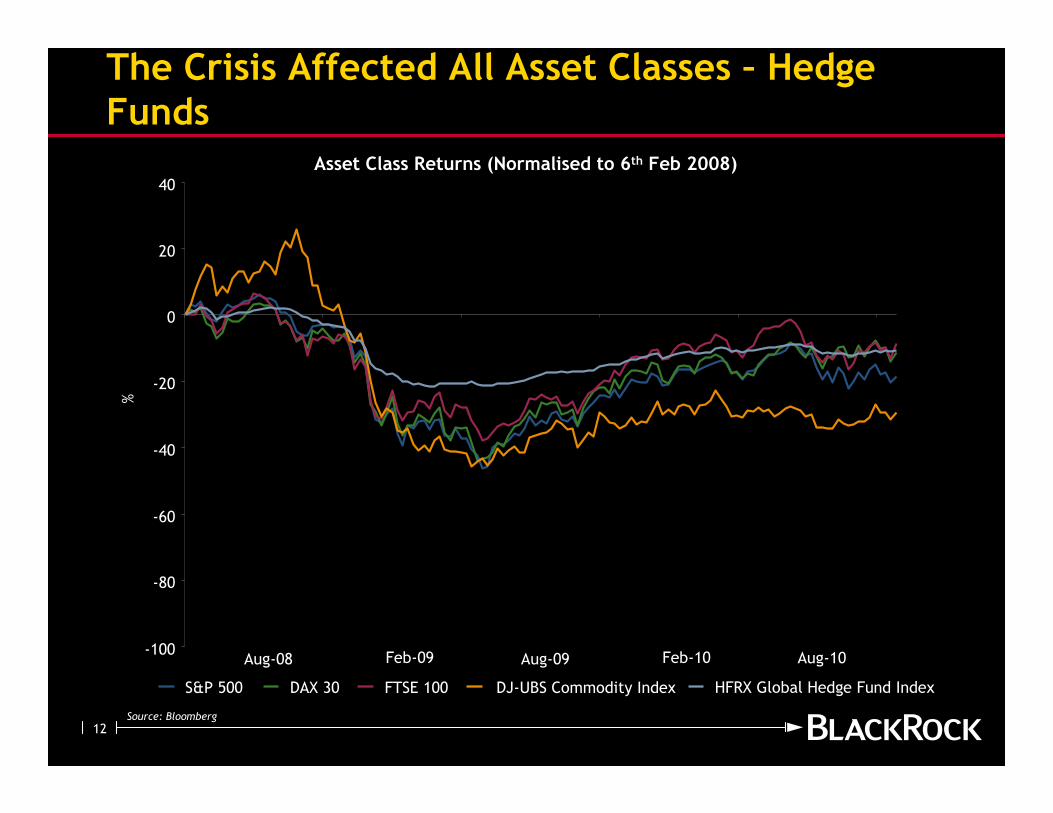
HFRX Global Hedge Fund Index
The Crisis Affected All Asset Classes – Hedge Funds
Asset Class Returns (Normalised to 6th Feb 2008)
Source: Bloomberg
Aug-08 Feb-09 Aug-09 Feb-10 Aug-10
DJ-UBS Commodity IndexS&P 500 DAX 30 FTSE 100
13
-100
-80
-60
-40
-20
0
20
40
%
DJ Global Select Real Estate Index
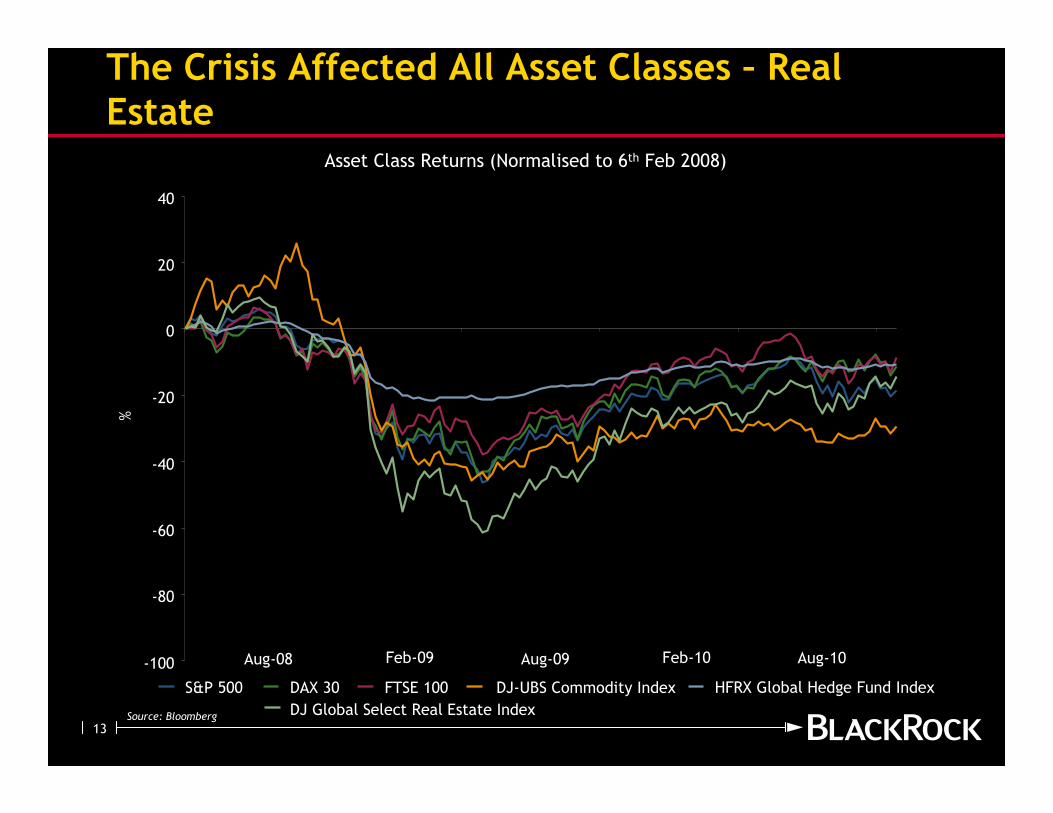
The Crisis Affected All Asset Classes – Real Estate
Asset Class Returns (Normalised to 6th Feb 2008)
Source: Bloomberg
Aug-08 Feb-09 Aug-09 Feb-10 Aug-10
HFRX Global Hedge Fund IndexDJ-UBS Commodity IndexS&P 500 DAX 30 FTSE 100
14
-100
-80
-60
-40
-20
0
20
40
%
DJ Global Private Equity Index
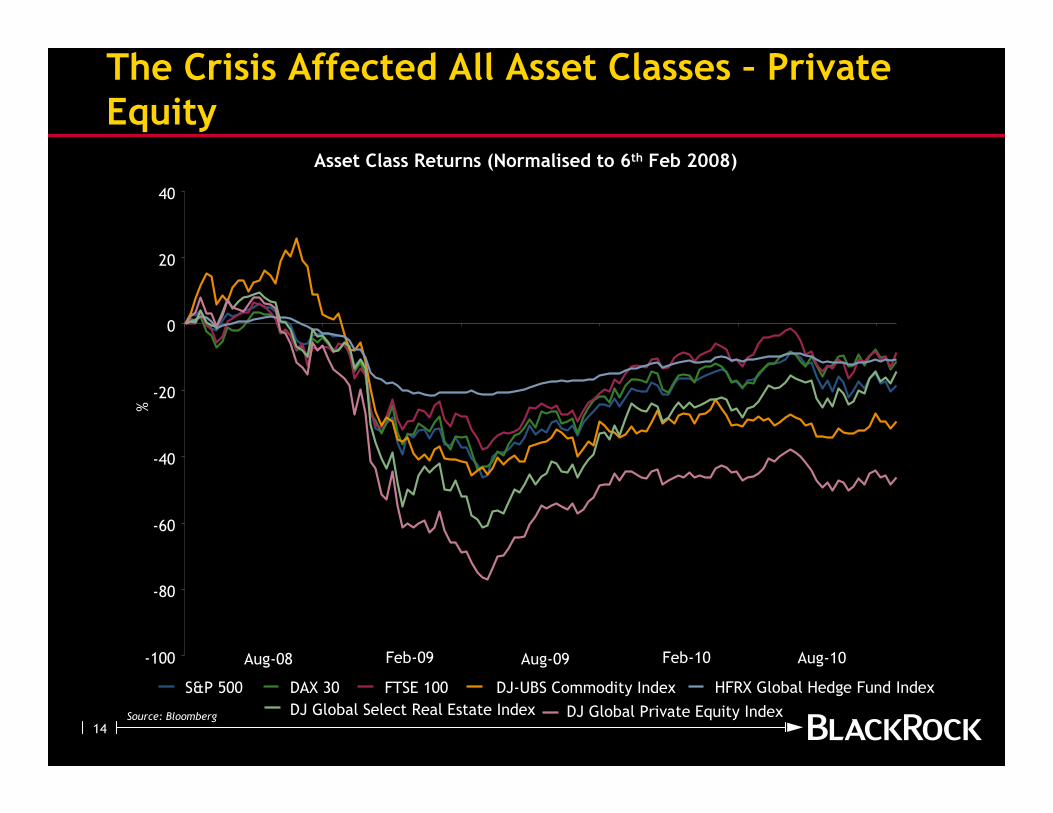
The Crisis Affected All Asset Classes – Private Equity
Asset Class Returns (Normalised to 6th Feb 2008)
Source: Bloomberg
Aug-08 Feb-09 Aug-09 Feb-10 Aug-10
DJ Global Select Real Estate Index
HFRX Global Hedge Fund IndexDJ-UBS Commodity IndexS&P 500 DAX 30 FTSE 100
15
-100
-80
-60
-40
-20
0
20
40
%
S&P Leveraged Loan Index
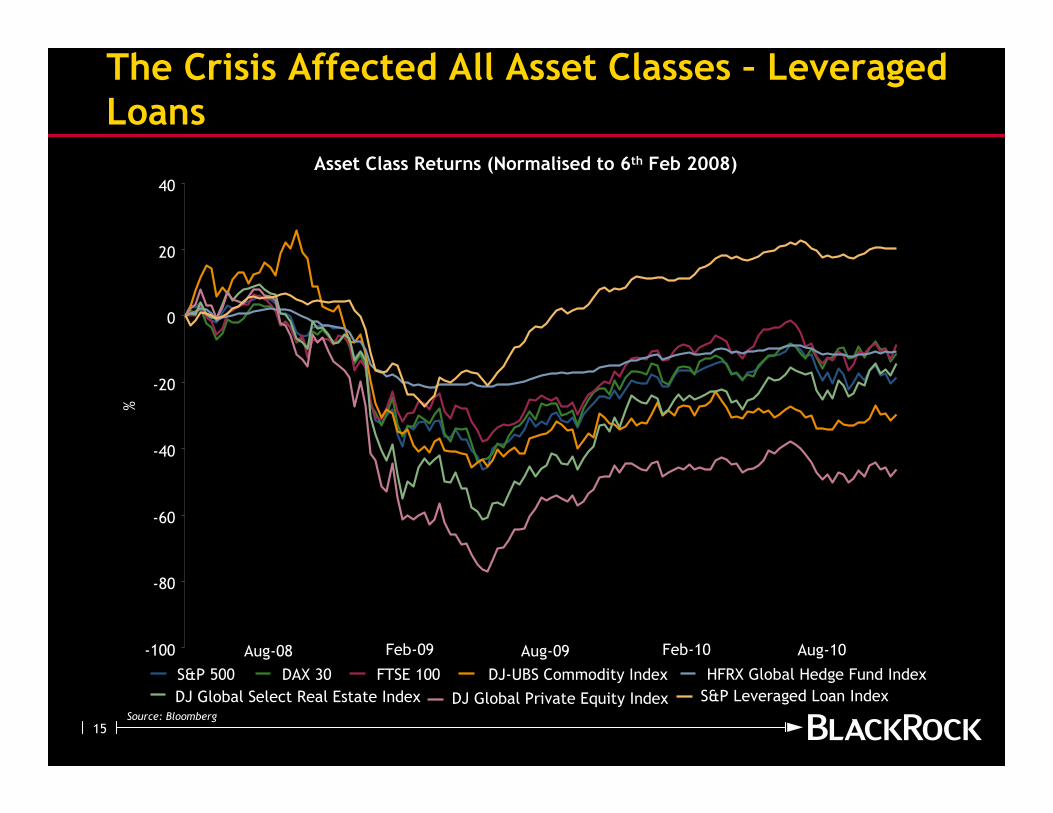
The Crisis Affected All Asset Classes – Leveraged Loans
Asset Class Returns (Normalised to 6th Feb 2008)
Source: Bloomberg
Aug-08 Feb-09 Aug-09 Feb-10 Aug-10
DJ Global Private Equity IndexDJ Global Select Real Estate Index
HFRX Global Hedge Fund IndexDJ-UBS Commodity IndexS&P 500 DAX 30 FTSE 100
16
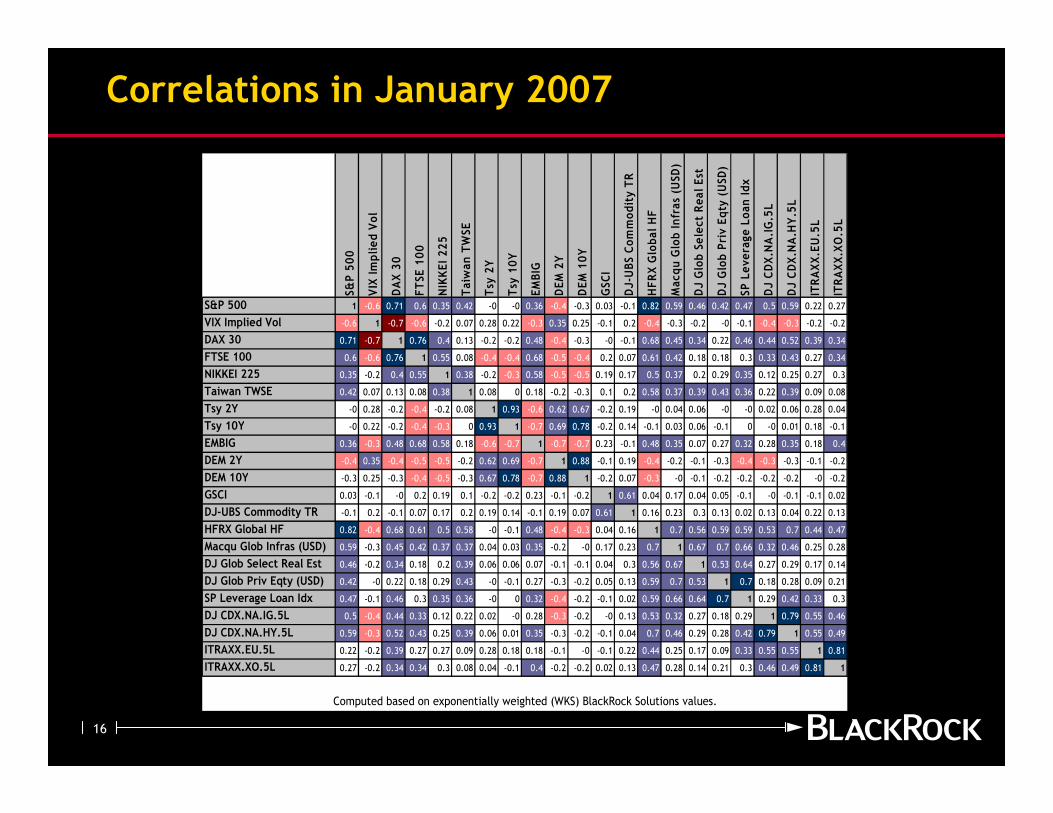
Correlations in January 2007
S&P 500
VIX Implied Vol
DAX 30
FTSE 100
NIKKEI 225
Taiwan TWSE
Tsy 2Y
Tsy 10Y
EMBIG
DEM 2Y
DEM 10Y
GSCI
DJ-UBS Commodity TR
HFRX Global HF
Macqu Glob Infras (USD)
DJ Glob Select Real Est
DJ Glob Priv Eqty (USD)
SP Leverage Loan Idx
DJ CDX.NA.IG.5L
DJ CDX.NA.HY.5L
ITRAXX.EU.5L
ITRAXX.XO.5L
S&P 500 1 -0.6 0.71 0.6 0.35 0.42 -0 -0 0.36 -0.4 -0.3 0.03 -0.1 0.82 0.59 0.46 0.42 0.47 0.5 0.59 0.22 0.27
VIX Implied Vol -0.6 1 -0.7 -0.6 -0.2 0.07 0.28 0.22 -0.3 0.35 0.25 -0.1 0.2 -0.4 -0.3 -0.2 -0 -0.1 -0.4 -0.3 -0.2 -0.2
DAX 30 0.71 -0.7 1 0.76 0.4 0.13 -0.2 -0.2 0.48 -0.4 -0.3 -0 -0.1 0.68 0.45 0.34 0.22 0.46 0.44 0.52 0.39 0.34
FTSE 100 0.6 -0.6 0.76 1 0.55 0.08 -0.4 -0.4 0.68 -0.5 -0.4 0.2 0.07 0.61 0.42 0.18 0.18 0.3 0.33 0.43 0.27 0.34
NIKKEI 225 0.35 -0.2 0.4 0.55 1 0.38 -0.2 -0.3 0.58 -0.5 -0.5 0.19 0.17 0.5 0.37 0.2 0.29 0.35 0.12 0.25 0.27 0.3
Taiwan TWSE 0.42 0.07 0.13 0.08 0.38 1 0.08 0 0.18 -0.2 -0.3 0.1 0.2 0.58 0.37 0.39 0.43 0.36 0.22 0.39 0.09 0.08
Tsy 2Y -0 0.28 -0.2 -0.4 -0.2 0.08 1 0.93 -0.6 0.62 0.67 -0.2 0.19 -0 0.04 0.06 -0 -0 0.02 0.06 0.28 0.04
Tsy 10Y -0 0.22 -0.2 -0.4 -0.3 0 0.93 1 -0.7 0.69 0.78 -0.2 0.14 -0.1 0.03 0.06 -0.1 0 -0 0.01 0.18 -0.1
EMBIG 0.36 -0.3 0.48 0.68 0.58 0.18 -0.6 -0.7 1 -0.7 -0.7 0.23 -0.1 0.48 0.35 0.07 0.27 0.32 0.28 0.35 0.18 0.4
DEM 2Y -0.4 0.35 -0.4 -0.5 -0.5 -0.2 0.62 0.69 -0.7 1 0.88 -0.1 0.19 -0.4 -0.2 -0.1 -0.3 -0.4 -0.3 -0.3 -0.1 -0.2
DEM 10Y -0.3 0.25 -0.3 -0.4 -0.5 -0.3 0.67 0.78 -0.7 0.88 1 -0.2 0.07 -0.3 -0 -0.1 -0.2 -0.2 -0.2 -0.2 -0 -0.2
GSCI 0.03 -0.1 -0 0.2 0.19 0.1 -0.2 -0.2 0.23 -0.1 -0.2 1 0.61 0.04 0.17 0.04 0.05 -0.1 -0 -0.1 -0.1 0.02
DJ-UBS Commodity TR -0.1 0.2 -0.1 0.07 0.17 0.2 0.19 0.14 -0.1 0.19 0.07 0.61 1 0.16 0.23 0.3 0.13 0.02 0.13 0.04 0.22 0.13
HFRX Global HF 0.82 -0.4 0.68 0.61 0.5 0.58 -0 -0.1 0.48 -0.4 -0.3 0.04 0.16 1 0.7 0.56 0.59 0.59 0.53 0.7 0.44 0.47
Macqu Glob Infras (USD) 0.59 -0.3 0.45 0.42 0.37 0.37 0.04 0.03 0.35 -0.2 -0 0.17 0.23 0.7 1 0.67 0.7 0.66 0.32 0.46 0.25 0.28
DJ Glob Select Real Est 0.46 -0.2 0.34 0.18 0.2 0.39 0.06 0.06 0.07 -0.1 -0.1 0.04 0.3 0.56 0.67 1 0.53 0.64 0.27 0.29 0.17 0.14
DJ Glob Priv Eqty (USD) 0.42 -0 0.22 0.18 0.29 0.43 -0 -0.1 0.27 -0.3 -0.2 0.05 0.13 0.59 0.7 0.53 1 0.7 0.18 0.28 0.09 0.21
SP Leverage Loan Idx 0.47 -0.1 0.46 0.3 0.35 0.36 -0 0 0.32 -0.4 -0.2 -0.1 0.02 0.59 0.66 0.64 0.7 1 0.29 0.42 0.33 0.3
DJ CDX.NA.IG.5L 0.5 -0.4 0.44 0.33 0.12 0.22 0.02 -0 0.28 -0.3 -0.2 -0 0.13 0.53 0.32 0.27 0.18 0.29 1 0.79 0.55 0.46
DJ CDX.NA.HY.5L 0.59 -0.3 0.52 0.43 0.25 0.39 0.06 0.01 0.35 -0.3 -0.2 -0.1 0.04 0.7 0.46 0.29 0.28 0.42 0.79 1 0.55 0.49
ITRAXX.EU.5L 0.22 -0.2 0.39 0.27 0.27 0.09 0.28 0.18 0.18 -0.1 -0 -0.1 0.22 0.44 0.25 0.17 0.09 0.33 0.55 0.55 1 0.81
ITRAXX.XO.5L 0.27 -0.2 0.34 0.34 0.3 0.08 0.04 -0.1 0.4 -0.2 -0.2 0.02 0.13 0.47 0.28 0.14 0.21 0.3 0.46 0.49 0.81 1
Computed based on exponentially weighted (WKS) BlackRock Solutions values.
17
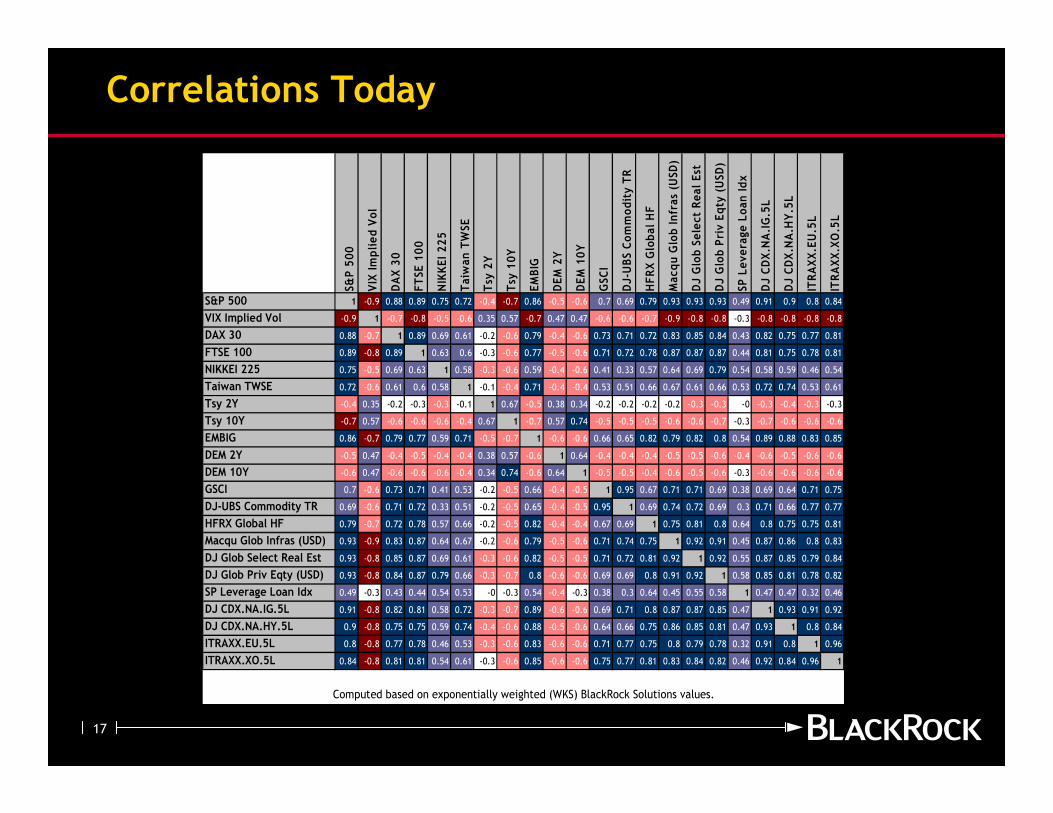
Correlations Today
S&P 500
VIX Implied Vol
DAX 30
FTSE 100
NIKKEI 225
Taiwan TWSE
Tsy 2Y
Tsy 10Y
EMBIG
DEM 2Y
DEM 10Y
GSCI
DJ-UBS Commodity TR
HFRX Global HF
Macqu Glob Infras (USD)
DJ Glob Select Real Est
DJ Glob Priv Eqty (USD)
SP Leverage Loan Idx
DJ CDX.NA.IG.5L
DJ CDX.NA.HY.5L
ITRAXX.EU.5L
ITRAXX.XO.5L
S&P 500 1 -0.9 0.88 0.89 0.75 0.72 -0.4 -0.7 0.86 -0.5 -0.6 0.7 0.69 0.79 0.93 0.93 0.93 0.49 0.91 0.9 0.8 0.84
VIX Implied Vol -0.9 1 -0.7 -0.8 -0.5 -0.6 0.35 0.57 -0.7 0.47 0.47 -0.6 -0.6 -0.7 -0.9 -0.8 -0.8 -0.3 -0.8 -0.8 -0.8 -0.8
DAX 30 0.88 -0.7 1 0.89 0.69 0.61 -0.2 -0.6 0.79 -0.4 -0.6 0.73 0.71 0.72 0.83 0.85 0.84 0.43 0.82 0.75 0.77 0.81
FTSE 100 0.89 -0.8 0.89 1 0.63 0.6 -0.3 -0.6 0.77 -0.5 -0.6 0.71 0.72 0.78 0.87 0.87 0.87 0.44 0.81 0.75 0.78 0.81
NIKKEI 225 0.75 -0.5 0.69 0.63 1 0.58 -0.3 -0.6 0.59 -0.4 -0.6 0.41 0.33 0.57 0.64 0.69 0.79 0.54 0.58 0.59 0.46 0.54
Taiwan TWSE 0.72 -0.6 0.61 0.6 0.58 1 -0.1 -0.4 0.71 -0.4 -0.4 0.53 0.51 0.66 0.67 0.61 0.66 0.53 0.72 0.74 0.53 0.61
Tsy 2Y -0.4 0.35 -0.2 -0.3 -0.3 -0.1 1 0.67 -0.5 0.38 0.34 -0.2 -0.2 -0.2 -0.2 -0.3 -0.3 -0 -0.3 -0.4 -0.3 -0.3
Tsy 10Y -0.7 0.57 -0.6 -0.6 -0.6 -0.4 0.67 1 -0.7 0.57 0.74 -0.5 -0.5 -0.5 -0.6 -0.6 -0.7 -0.3 -0.7 -0.6 -0.6 -0.6
EMBIG 0.86 -0.7 0.79 0.77 0.59 0.71 -0.5 -0.7 1 -0.6 -0.6 0.66 0.65 0.82 0.79 0.82 0.8 0.54 0.89 0.88 0.83 0.85
DEM 2Y -0.5 0.47 -0.4 -0.5 -0.4 -0.4 0.38 0.57 -0.6 1 0.64 -0.4 -0.4 -0.4 -0.5 -0.5 -0.6 -0.4 -0.6 -0.5 -0.6 -0.6
DEM 10Y -0.6 0.47 -0.6 -0.6 -0.6 -0.4 0.34 0.74 -0.6 0.64 1 -0.5 -0.5 -0.4 -0.6 -0.5 -0.6 -0.3 -0.6 -0.6 -0.6 -0.6
GSCI 0.7 -0.6 0.73 0.71 0.41 0.53 -0.2 -0.5 0.66 -0.4 -0.5 1 0.95 0.67 0.71 0.71 0.69 0.38 0.69 0.64 0.71 0.75
DJ-UBS Commodity TR 0.69 -0.6 0.71 0.72 0.33 0.51 -0.2 -0.5 0.65 -0.4 -0.5 0.95 1 0.69 0.74 0.72 0.69 0.3 0.71 0.66 0.77 0.77
HFRX Global HF 0.79 -0.7 0.72 0.78 0.57 0.66 -0.2 -0.5 0.82 -0.4 -0.4 0.67 0.69 1 0.75 0.81 0.8 0.64 0.8 0.75 0.75 0.81
Macqu Glob Infras (USD) 0.93 -0.9 0.83 0.87 0.64 0.67 -0.2 -0.6 0.79 -0.5 -0.6 0.71 0.74 0.75 1 0.92 0.91 0.45 0.87 0.86 0.8 0.83
DJ Glob Select Real Est 0.93 -0.8 0.85 0.87 0.69 0.61 -0.3 -0.6 0.82 -0.5 -0.5 0.71 0.72 0.81 0.92 1 0.92 0.55 0.87 0.85 0.79 0.84
DJ Glob Priv Eqty (USD) 0.93 -0.8 0.84 0.87 0.79 0.66 -0.3 -0.7 0.8 -0.6 -0.6 0.69 0.69 0.8 0.91 0.92 1 0.58 0.85 0.81 0.78 0.82
SP Leverage Loan Idx 0.49 -0.3 0.43 0.44 0.54 0.53 -0 -0.3 0.54 -0.4 -0.3 0.38 0.3 0.64 0.45 0.55 0.58 1 0.47 0.47 0.32 0.46
DJ CDX.NA.IG.5L 0.91 -0.8 0.82 0.81 0.58 0.72 -0.3 -0.7 0.89 -0.6 -0.6 0.69 0.71 0.8 0.87 0.87 0.85 0.47 1 0.93 0.91 0.92
DJ CDX.NA.HY.5L 0.9 -0.8 0.75 0.75 0.59 0.74 -0.4 -0.6 0.88 -0.5 -0.6 0.64 0.66 0.75 0.86 0.85 0.81 0.47 0.93 1 0.8 0.84
ITRAXX.EU.5L 0.8 -0.8 0.77 0.78 0.46 0.53 -0.3 -0.6 0.83 -0.6 -0.6 0.71 0.77 0.75 0.8 0.79 0.78 0.32 0.91 0.8 1 0.96
ITRAXX.XO.5L 0.84 -0.8 0.81 0.81 0.54 0.61 -0.3 -0.6 0.85 -0.6 -0.6 0.75 0.77 0.81 0.83 0.84 0.82 0.46 0.92 0.84 0.96 1
Computed based on exponentially weighted (WKS) BlackRock Solutions values.
18
Lessons from the Crisis
• The paramount importance of liquidity – the life blood of commerce
— What is the market value of an asset that does not trade?
• Risk models require vigilance and scepticism - assumptions are just assumptions
— Risk analytics and processes need to be constantly reviewed and reinvented
• Look beyond securitised products to the behaviour of underlying assets
— Need an in depth and direct understanding of the behaviours, incentives and practices of
borrowers, servicers and the origination process
— Incorporate this understanding properly into risk analytics and models to manage model risk
• The sources of risk are not constant and can change quickly
— Power and control over financial systems is shifting to political capitals
• You can’t cram for a crisis
— A robust risk management process requires a material commitment of resources and
“institutional buy-in”
• Risk takers must think like risk managers
— Must provide portfolio managers with the necessary tools to help them make the
appropriate risk-return trade off
• Has the portfolio manager identified the relevant risk drivers?
• Does the portfolio manager have access to accurate and timely ex ante metrics / an appropriate risk
dashboard?
19
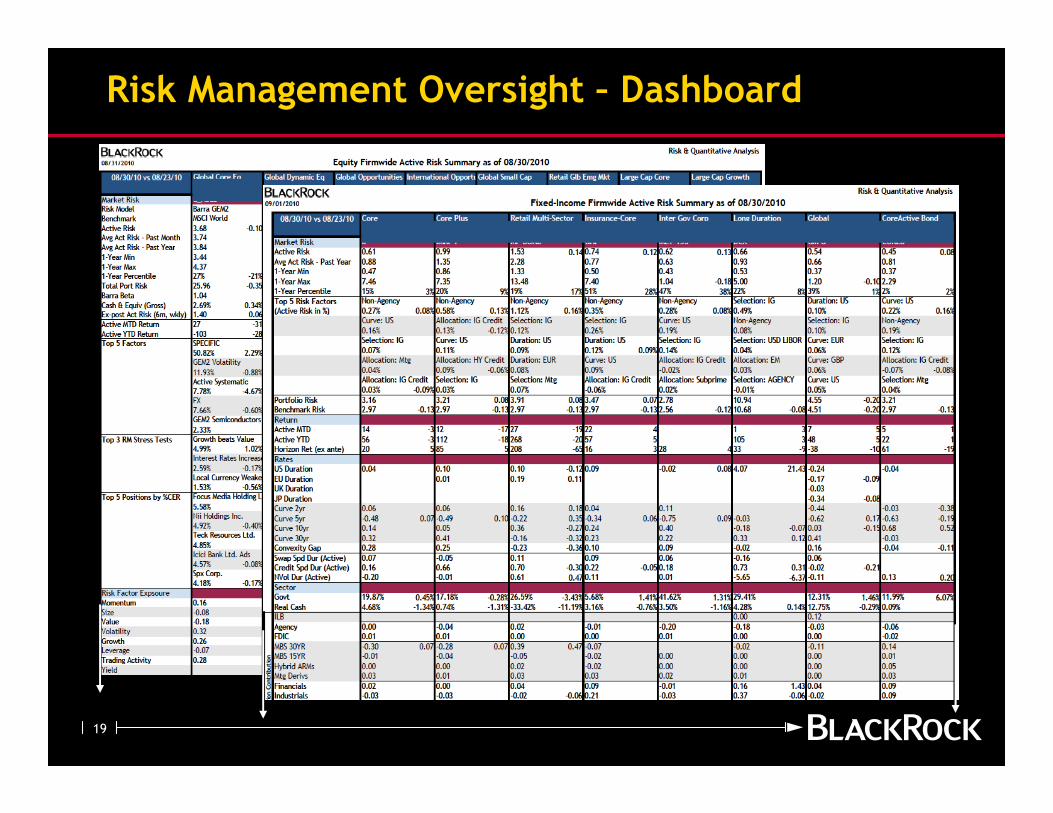
Risk Management Oversight – Dashboard
20
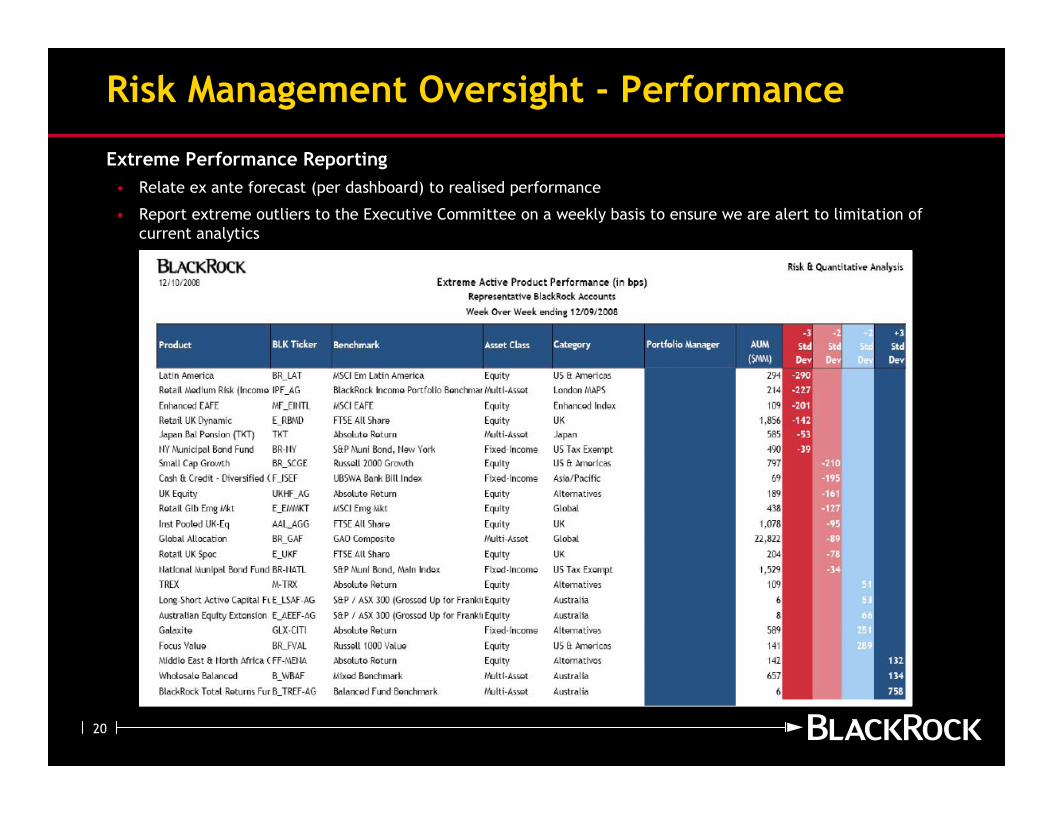
Risk Management Oversight - Performance
Extreme Performance Reporting
• Relate ex ante forecast (per dashboard) to realised performance
• Report extreme outliers to the Executive Committee on a weekly basis to ensure we are alert to limitation of
current analytics
21
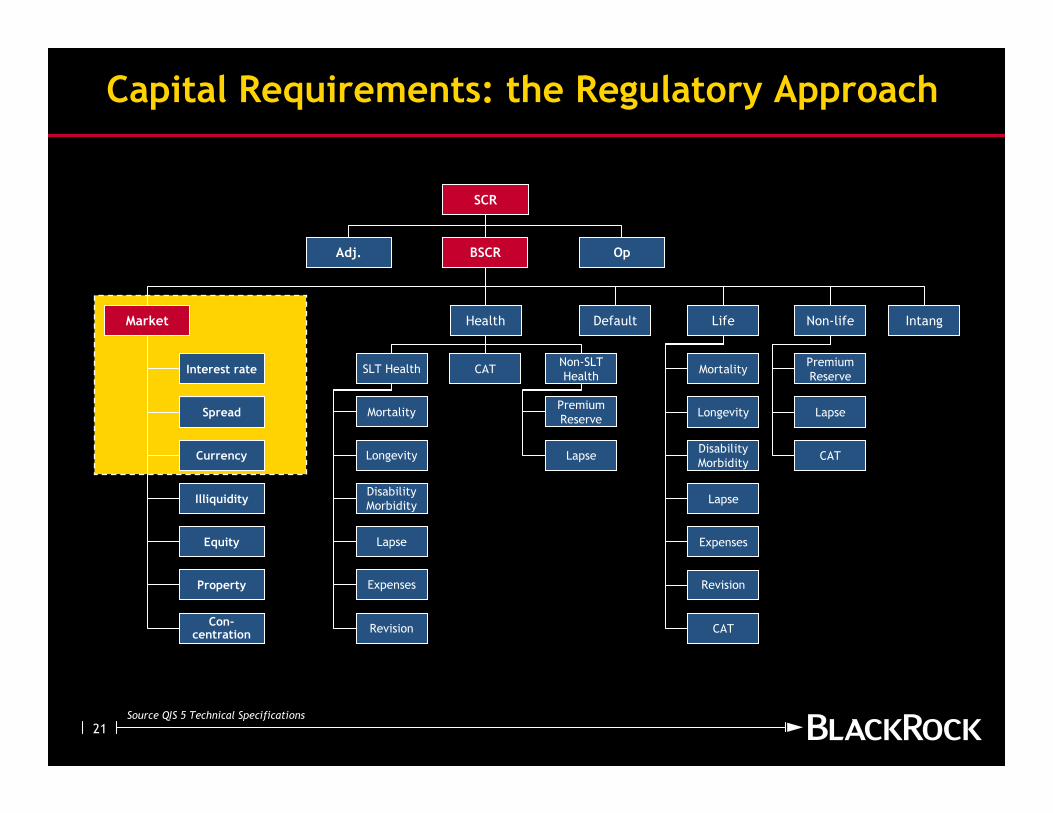
Capital Requirements: the Regulatory Approach
Adj. BSCR Op
SCR
Market Health Default Life Non-life Intang
Interest rate
Equity
Property
Spread
Currency
Con-centration
Illiquidity
SLT Health
Mortality
Longevity
Disability
Morbidity
Lapse
Expenses
Revision
CATNon-SLT
Health
Premium
Reserve
Lapse
Mortality
Longevity
Disability
Morbidity
Lapse
Expenses
Revision
CAT
Premium
Reserve
Lapse
CAT
Source QIS 5 Technical Specifications
22
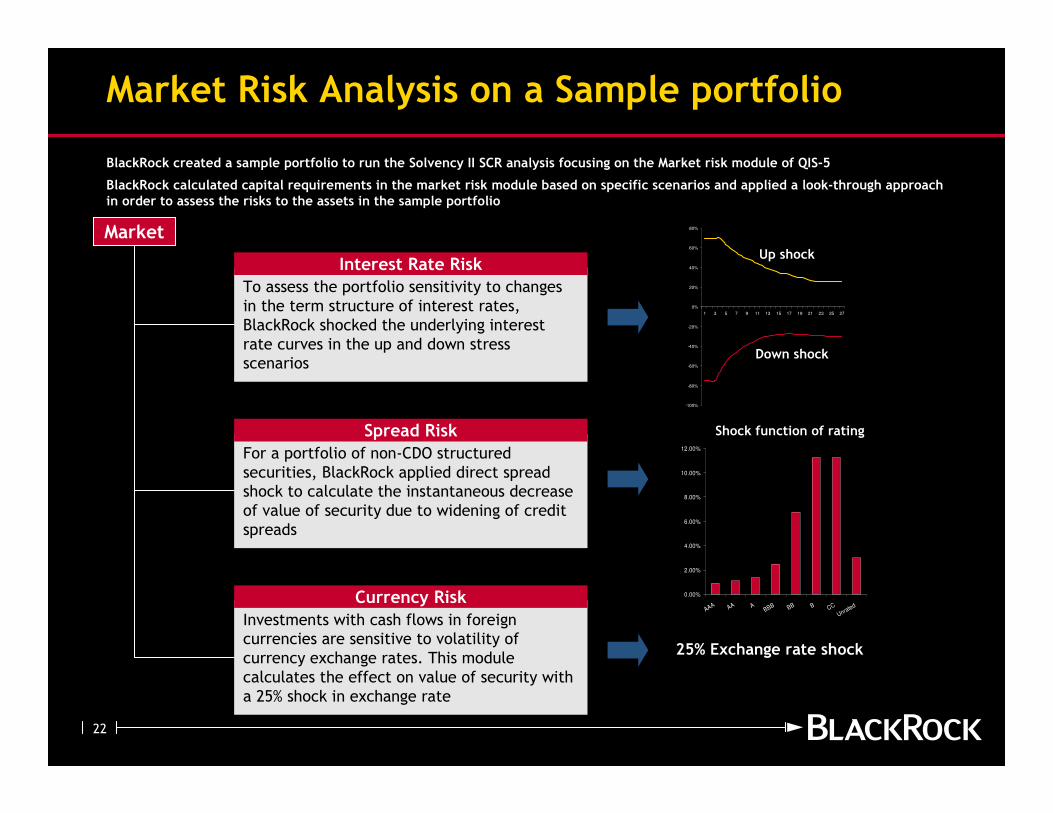
Market Risk Analysis on a Sample portfolio
BlackRock created a sample portfolio to run the Solvency II SCR analysis focusing on the Market risk module of QIS-5
BlackRock calculated capital requirements in the market risk module based on specific scenarios and applied a look-through approach in order to assess the risks to the assets in the sample portfolio
MarketUp shock
Down shock
For a portfolio of non-CDO structured
securities, BlackRock applied direct spread
shock to calculate the instantaneous decrease
of value of security due to widening of credit
spreads
Spread Risk
Investments with cash flows in foreign
currencies are sensitive to volatility of
currency exchange rates. This module
calculates the effect on value of security with
a 25% shock in exchange rate
Currency Risk
-100%
-80%
-60%
-40%
-20%
0%
20%
40%
60%
80%
1 3 5 7 9 11 13 15 17 19 21 23 25 27
To assess the portfolio sensitivity to changes
in the term structure of interest rates,
BlackRock shocked the underlying interest
rate curves in the up and down stress
scenarios
Interest Rate Risk
Shock function of rating
25% Exchange rate shock
0.00%
2.00%
4.00%
6.00%
8.00%
10.00%
12.00%
AAA AA ABBB BB B CC
Unrated
23
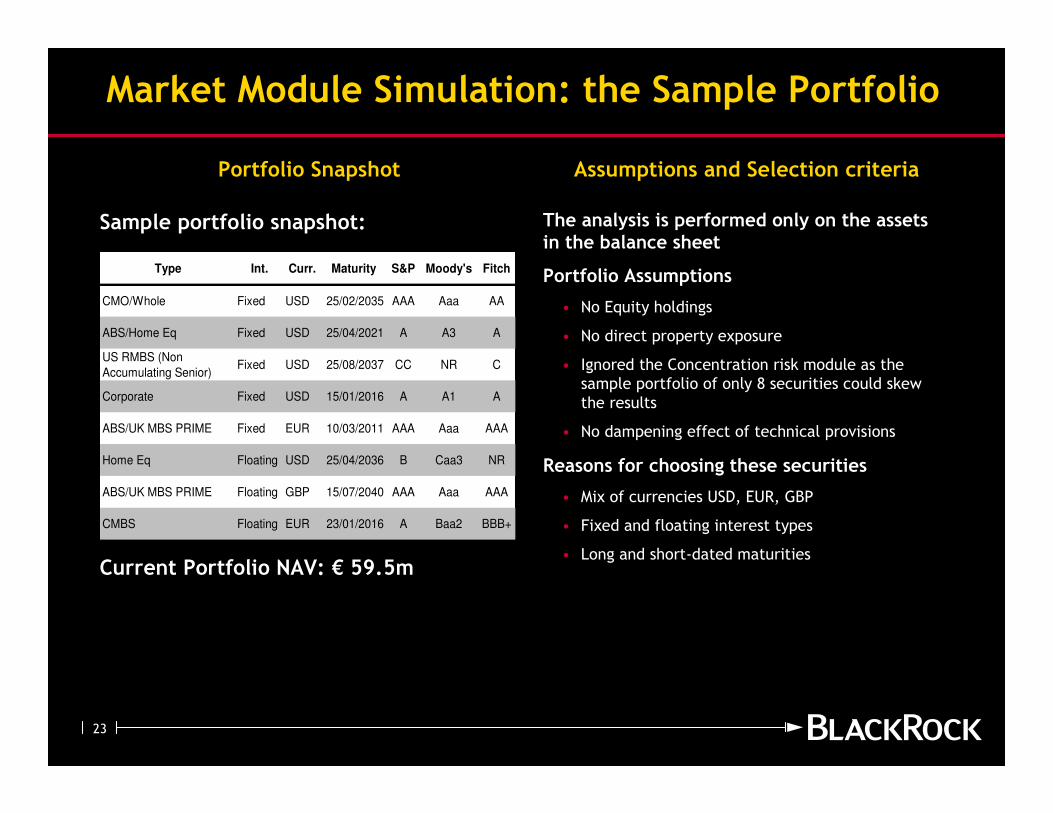
Market Module Simulation: the Sample Portfolio
Assumptions and Selection criteriaPortfolio Snapshot
Sample portfolio snapshot:
Current Portfolio NAV: € 59.5m
The analysis is performed only on the assets in the balance sheet
Portfolio Assumptions
• No Equity holdings
• No direct property exposure
• Ignored the Concentration risk module as the
sample portfolio of only 8 securities could skew
the results
• No dampening effect of technical provisions
Reasons for choosing these securities
• Mix of currencies USD, EUR, GBP
• Fixed and floating interest types
• Long and short-dated maturities
Type Int. Curr. Maturity S&P Moody's Fitch
CMO/Whole Fixed USD 25/02/2035 AAA Aaa AA
ABS/Home Eq Fixed USD 25/04/2021 A A3 A
US RMBS (Non
Accumulating Senior)Fixed USD 25/08/2037 CC NR C
Corporate Fixed USD 15/01/2016 A A1 A
ABS/UK MBS PRIME Fixed EUR 10/03/2011 AAA Aaa AAA
Home Eq Floating USD 25/04/2036 B Caa3 NR
ABS/UK MBS PRIME Floating GBP 15/07/2040 AAA Aaa AAA
CMBS Floating EUR 23/01/2016 A Baa2 BBB+
24
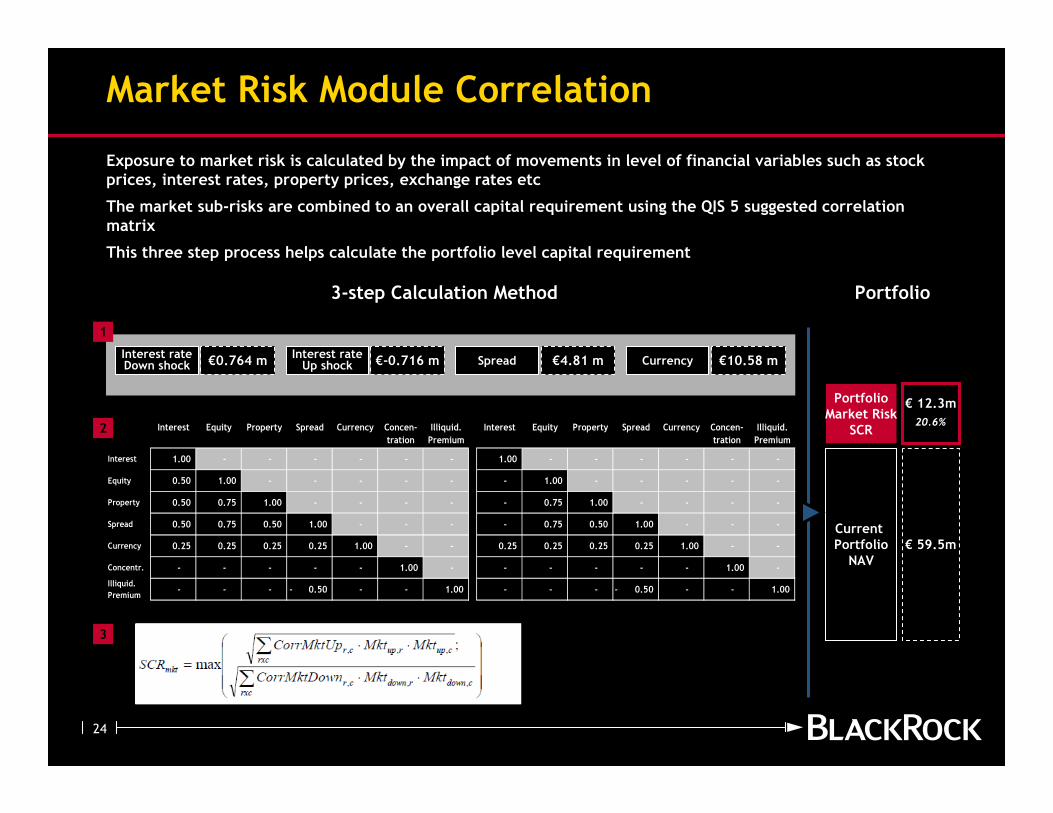
Market Risk Module Correlation
Exposure to market risk is calculated by the impact of movements in level of financial variables such as stock prices, interest rates, property prices, exchange rates etc
The market sub-risks are combined to an overall capital requirement using the QIS 5 suggested correlation matrix
This three step process helps calculate the portfolio level capital requirement
Interest rateDown shock €0.764 m Spread €4.81 m Currency €10.58 m
Interest rateUp shock €-0.716 m
1
3-step Calculation Method
3
Portfolio
€ 12.3m
20.6%
€ 59.5m
PortfolioMarket Risk
SCR
Current PortfolioNAV
2 Interest Equity Property Spread Currency Concen-
tration
Illiquid.
Premium
Interest Equity Property Spread Currency Concen-
tration
Illiquid.
Premium
Interest 1.00 - - - - - - 1.00 - - - - - -
Equity 0.50 1.00 - - - - - - 1.00 - - - - -
Property 0.50 0.75 1.00 - - - - - 0.75 1.00 - - - -
Spread 0.50 0.75 0.50 1.00 - - - - 0.75 0.50 1.00 - - -
Currency 0.25 0.25 0.25 0.25 1.00 - - 0.25 0.25 0.25 0.25 1.00 - -
Concentr. - - - - - 1.00 - - - - - - 1.00 -
Illiquid.
Premium- - - 0.50- - - 1.00 - - - 0.50- - - 1.00
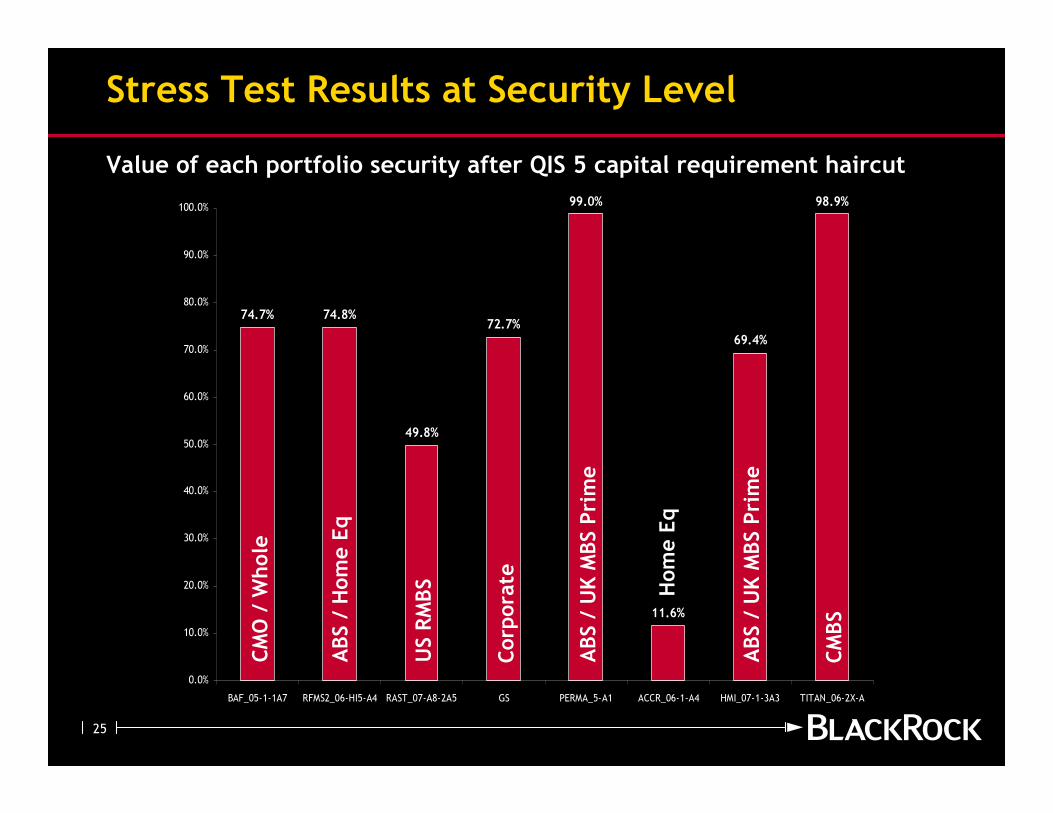
25
Stress Test Results at Security Level
Value of each portfolio security after QIS 5 capital requirement haircut
98.9%
69.4%
11.6%
99.0%
72.7%
49.8%
74.8%74.7%
0.0%
10.0%
20.0%
30.0%
40.0%
50.0%
60.0%
70.0%
80.0%
90.0%
100.0%
BAF_05-1-1A7 RFMS2_06-HI5-A4 RAST_07-A8-2A5 GS PERMA_5-A1 ACCR_06-1-A4 HMI_07-1-3A3 TITAN_06-2X-A
CMO / Whole
ABS / Home Eq
US RMBS
Corporate
ABS / UK MBS Prime
Home Eq
ABS / UK MBS Prime
CMBS
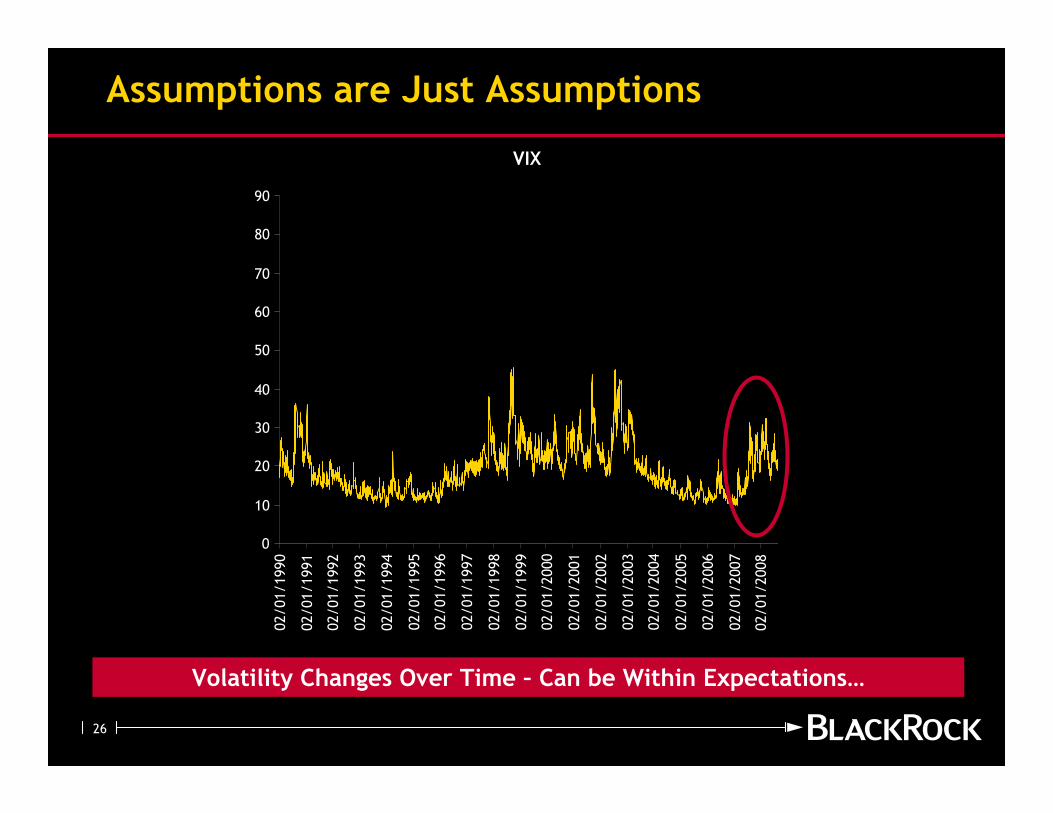
26
Assumptions are Just Assumptions
Volatility Changes Over Time – Can be Within Expectations…
VIX
0
10
20
30
40
50
60
70
80
90
02/01/1990
02/01/1991
02/01/1992
02/01/1993
02/01/1994
02/01/1995
02/01/1996
02/01/1997
02/01/1998
02/01/1999
02/01/2000
02/01/2001
02/01/2002
02/01/2003
02/01/2004
02/01/2005
02/01/2006
02/01/2007
02/01/2008
02/01/2009
02/01/2010
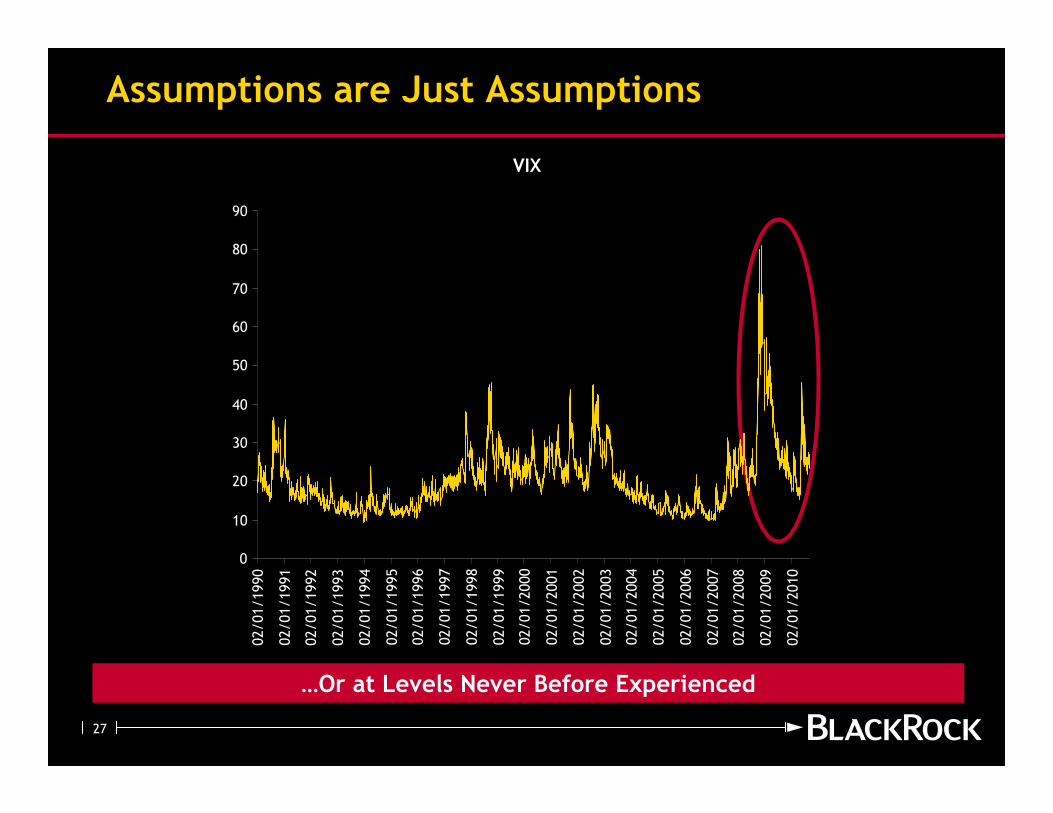
27
Assumptions are Just Assumptions
…Or at Levels Never Before Experienced
VIX
0
10
20
30
40
50
60
70
80
90
02/01/1990
02/01/1991
02/01/1992
02/01/1993
02/01/1994
02/01/1995
02/01/1996
02/01/1997
02/01/1998
02/01/1999
02/01/2000
02/01/2001
02/01/2002
02/01/2003
02/01/2004
02/01/2005
02/01/2006
02/01/2007
02/01/2008
02/01/2009
02/01/2010
28
74.8%
49.8%
99.0%
69.4%
98.9%
85.8%
78.0%
23.4%
74.7%72.7%
11.6%
71.0%
25.4%
90.0%
63.1%
91.4%
0.0%
10.0%
20.0%
30.0%
40.0%
50.0%
60.0%
70.0%
80.0%
90.0%
100.0%
BAF_05-1-1A7 RFMS2_06-HI5-
A4
RAST_07-A8-
2A5
GS PERMA_5-A1 ACCR_06-1-A4 HMI_07-1-3A3 TITAN_06-2X-A
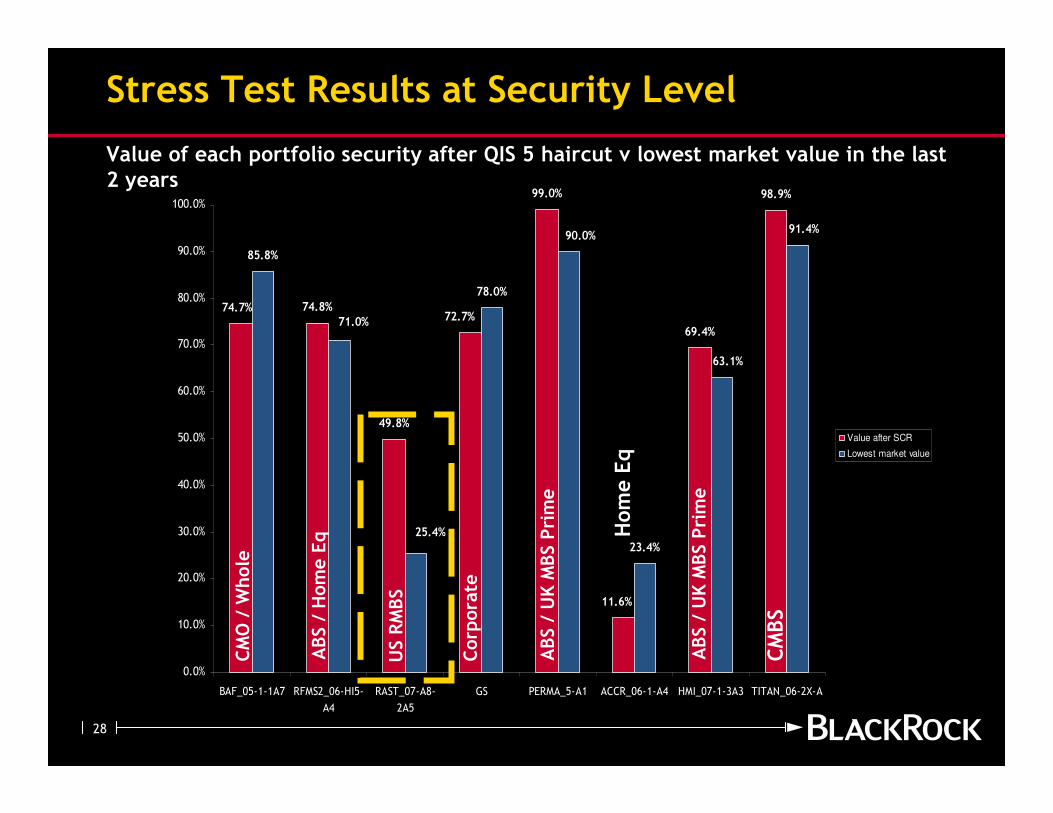
Value after SCR
Lowest market value
Stress Test Results at Security Level
Value of each portfolio security after QIS 5 haircut v lowest market value in the last 2 years
CMO / Whole
ABS / Home Eq
Corporate
ABS / UK MBS Prime
Home Eq
ABS / UK MBS Prime
US RMBS
CMBS
29
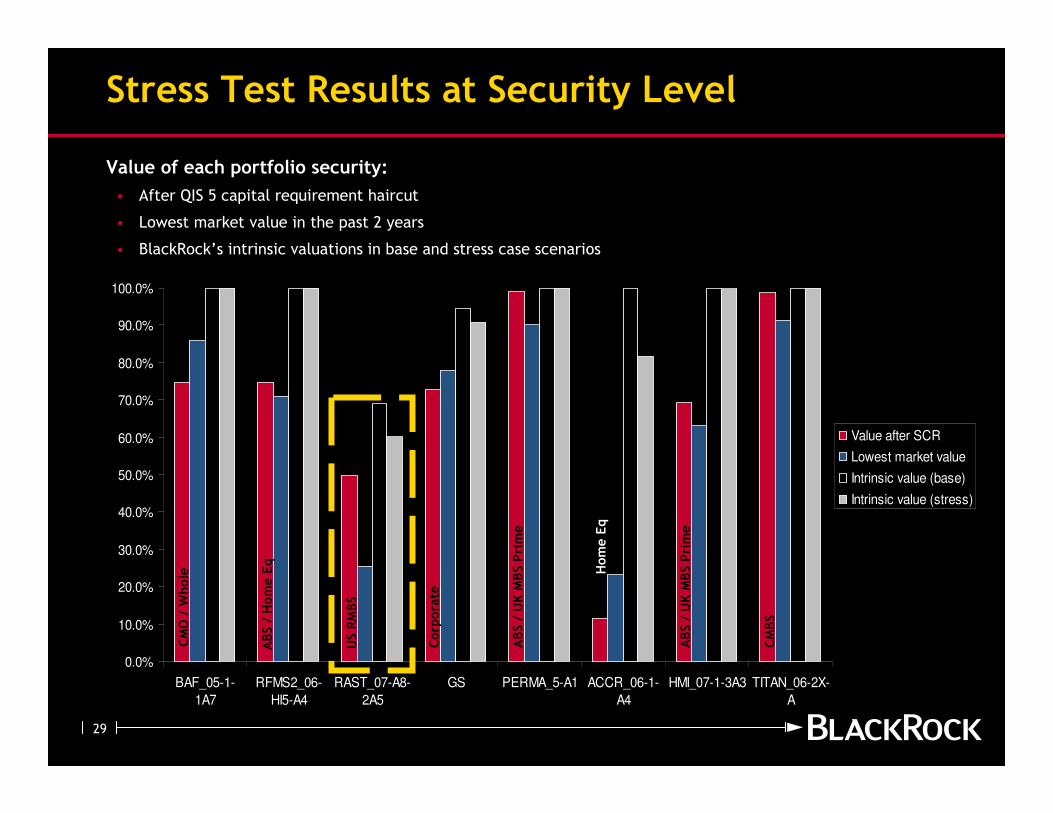
0.0%
10.0%
20.0%
30.0%
40.0%
50.0%
60.0%
70.0%
80.0%
90.0%
100.0%
BAF_05-1-
1A7
RFMS2_06-
HI5-A4
RAST_07-A8-
2A5
GS PERMA_5-A1 ACCR_06-1-
A4
HMI_07-1-3A3 TITAN_06-2X-
A
Value after SCR
Lowest market value
Intrinsic value (base)
Intrinsic value (stress)
Stress Test Results at Security Level
Value of each portfolio security:
• After QIS 5 capital requirement haircut
• Lowest market value in the past 2 years
• BlackRock’s intrinsic valuations in base and stress case scenarios
CMO / Whole
ABS / Home Eq
Corporate
ABS / UK MBS Prime
Home Eq
ABS / UK MBS Prime
US RMBS
CMBS
30
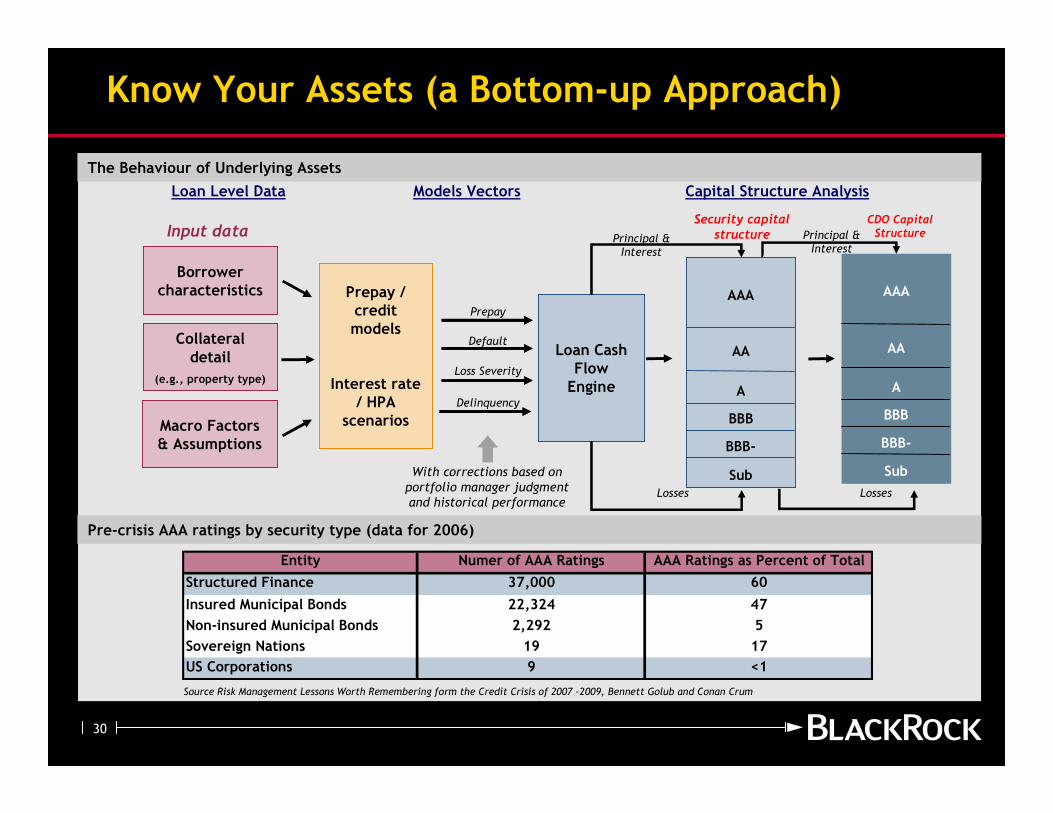
Know Your Assets (a Bottom-up Approach)
Loan Level Data Capital Structure AnalysisModels Vectors
Loan Cash Flow Engine
Prepay / credit models
Interest rate / HPA
scenarios
Prepay
Default
Loss Severity
Delinquency
Collateral detail
(e.g., property type)
Macro Factors & Assumptions
Losses
AAA
BBB
AA
A
Sub
BBB-
Principal & Interest
Security capitalstructureInput data
With corrections based on portfolio manager judgment and historical performance
Borrower characteristics
Principal & Interest
AAA
BBB
AA
A
Sub
BBB-
Losses
CDO Capital Structure
The Behaviour of Underlying Assets
Pre-crisis AAA ratings by security type (data for 2006)
Entity Numer of AAA Ratings AAA Ratings as Percent of Total
Structured Finance 37,000 60
Insured Municipal Bonds 22,324 47
Non-insured Municipal Bonds 2,292 5
Sovereign Nations 19 17
US Corporations 9 <1
Source Risk Management Lessons Worth Remembering form the Credit Crisis of 2007 -2009, Bennett Golub and Conan Crum
31
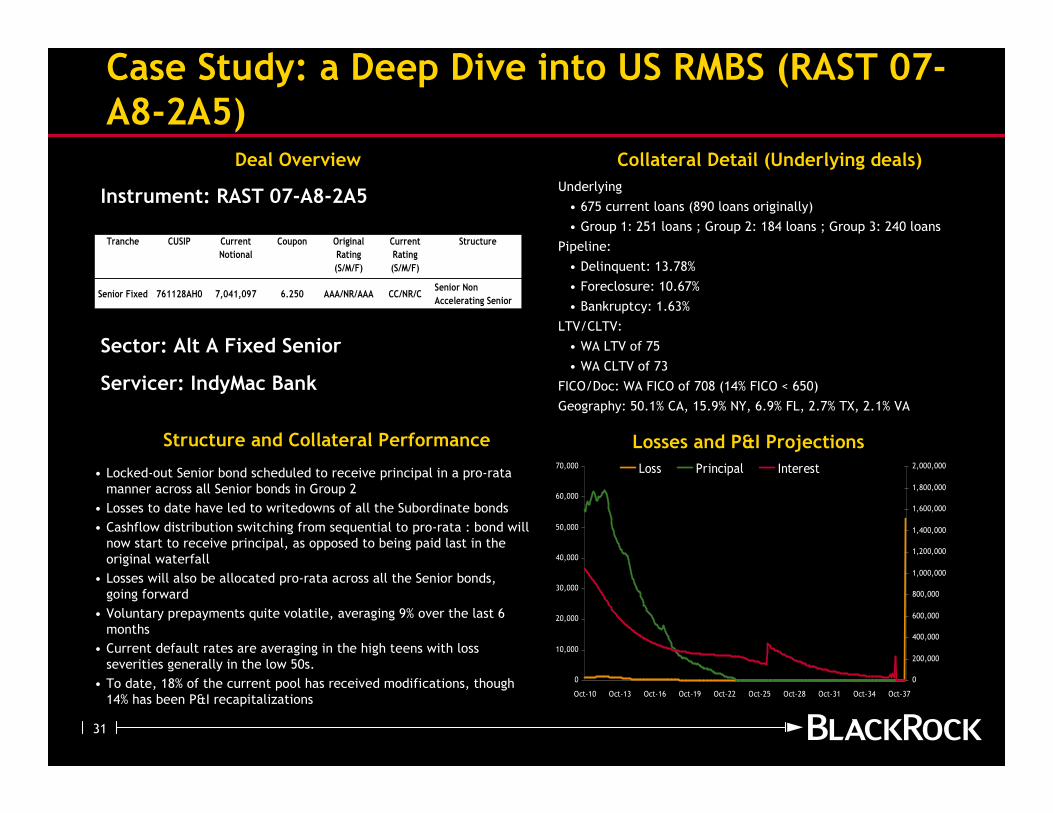
Case Study: a Deep Dive into US RMBS (RAST 07-A8-2A5)
Deal Overview
Underlying
• 675 current loans (890 loans originally)
• Group 1: 251 loans ; Group 2: 184 loans ; Group 3: 240 loans
Pipeline:
• Delinquent: 13.78%
• Foreclosure: 10.67%
• Bankruptcy: 1.63%
LTV/CLTV:
• WA LTV of 75
• WA CLTV of 73
FICO/Doc: WA FICO of 708 (14% FICO < 650)
Geography: 50.1% CA, 15.9% NY, 6.9% FL, 2.7% TX, 2.1% VA
• Locked-out Senior bond scheduled to receive principal in a pro-rata
manner across all Senior bonds in Group 2
• Losses to date have led to writedowns of all the Subordinate bonds
• Cashflow distribution switching from sequential to pro-rata : bond will
now start to receive principal, as opposed to being paid last in the
original waterfall
• Losses will also be allocated pro-rata across all the Senior bonds,
going forward
• Voluntary prepayments quite volatile, averaging 9% over the last 6
months
• Current default rates are averaging in the high teens with loss
severities generally in the low 50s.
• To date, 18% of the current pool has received modifications, though
14% has been P&I recapitalizations
Instrument: RAST 07-A8-2A5
Sector: Alt A Fixed Senior
Servicer: IndyMac Bank
Structure and Collateral Performance Losses and P&I Projections
Collateral Detail (Underlying deals)
Tranche CUSIP Current
Notional
Coupon Original
Rating
(S/M/F)
Current
Rating
(S/M/F)
Structure
Senior Fixed 761128AH0 7,041,097 6.250 AAA/NR/AAA CC/NR/CSenior Non
Accelerating Senior
0
10,000
20,000
30,000
40,000
50,000
60,000
70,000
Oct-10 Oct-13 Oct-16 Oct-19 Oct-22 Oct-25 Oct-28 Oct-31 Oct-34 Oct-37
0
200,000
400,000
600,000
800,000
1,000,000
1,200,000
1,400,000
1,600,000
1,800,000
2,000,000Loss Principal Interest
32
Agenda
I. BlackRock Overview
II. Solvency II v Market Reality
III.Conclusions
33
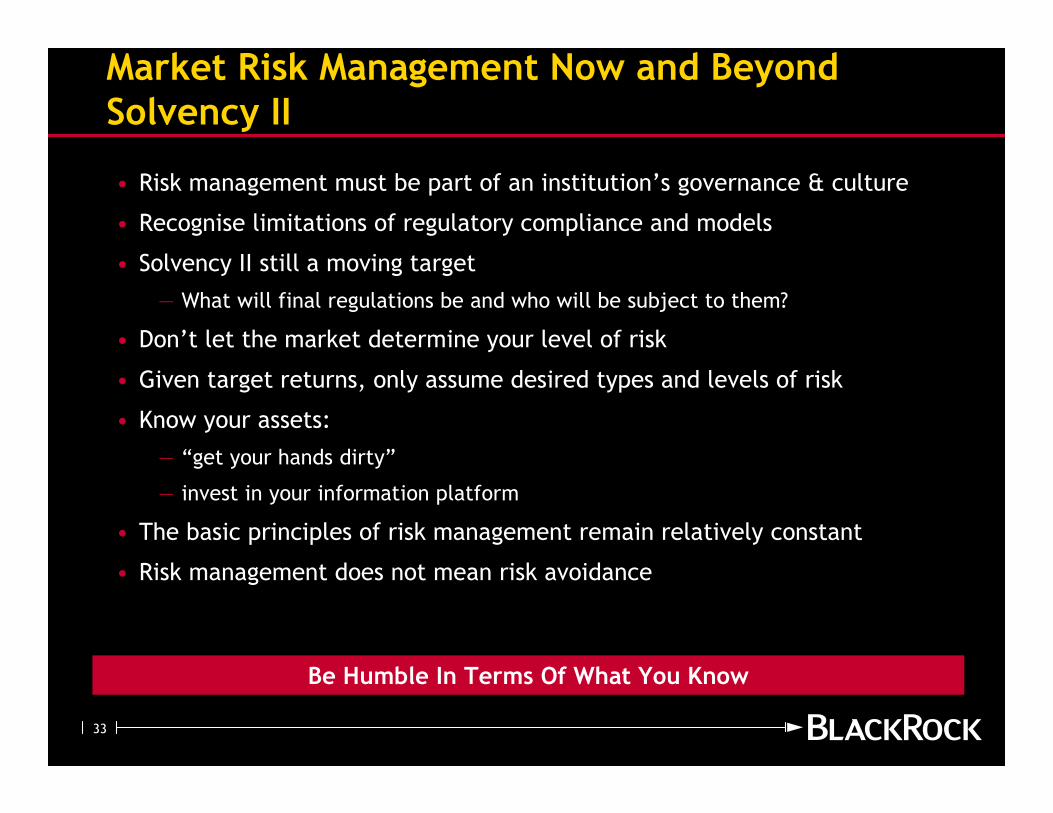
Market Risk Management Now and Beyond Solvency II
• Risk management must be part of an institution’s governance & culture
• Recognise limitations of regulatory compliance and models
• Solvency II still a moving target
— What will final regulations be and who will be subject to them?
• Don’t let the market determine your level of risk
• Given target returns, only assume desired types and levels of risk
• Know your assets:
— “get your hands dirty”
— invest in your information platform
• The basic principles of risk management remain relatively constant
• Risk management does not mean risk avoidance
Be Humble In Terms Of What You Know
34
The following notes should be read in conjunction with the attached document:
1. Issued by BlackRock Investment Management (UK) Limited, authorised and regulated by the Financial Services Authority. Registered
office: 33 King William Street, London, EC4R 9AS. Tel: 020 7743 3000. Registered in England No. 2020394. For your protection
telephone calls are usually recorded. BlackRock is a trading name of BlackRock Investment Management (UK) Limited.
2. Past performance is not a guide to future performance and should not be the sole factor of consideration when selecting a product.
All financial investments involve an element of risk. Therefore, the value of your investment and the income from it will vary and
your initial investment amount cannot be guaranteed. Changes in the rates of exchange between currencies may cause the value of
investments to go up and down. Fluctuation may be particularly marked in the case of a higher volatility fund and the value of an
investment may fall suddenly and substantially. Levels and basis of taxation may change from time to time.
3. Mandates we manage may be exposed to finance sector companies, as a service provider or as counterparty for financial contracts.
In recent months, liquidity in the financial markets has become severely restricted, causing a number of firms to withdrawn from the
market, or in some extreme cases, becoming insolvent. This may have an adverse affect on the mandates we manage.
4. Any research in this document has been procured and may have been acted on by BlackRock for its own purpose. The results of such
research are being made available only incidentally. The views expressed do not constitute investment or any other advice and are
subject to change. They do not necessarily reflect the views of any company in the BlackRock Group or any part thereof and no
assurances are made as to their accuracy.
5. This document is for information purposes only and does not constitute an offer or invitation to anyone to invest in any BlackRock
funds and has not been prepared in connection with any such offer.
6. This material is for distribution to Professional Clients (as defined by the FSA Rules) and should not be relied upon by any other
persons.
7. Subject to the express requirements of any client-specific investment management agreement or provisions relating to the
management of a fund, we will not provide notice of any changes to our personnel, structure, policies, process, objectives or,
without limitation, any other matter contained in this document.
8. No part of this material may be reproduced, stored in retrieval system or transmitted in any form or by any means, electronic,
mechanical, recording or otherwise, without the prior written consent of BlackRock.
UNLESS OTHERWISE SPECIFIED, ALL INFORMATION CONTAINED IN THIS DOCUMENT IS CURRENT AS AT 1 September 2010.

35