solver for optimization - chiang mai...
TRANSCRIPT

SOLVER for Optimization
Dr. Warisa Wisittipanich

LOGO
The procedures for finding an alternative with the best achievable performance as possible under the given constraints
Minimization/Maximization
Optimization tools?
Lingo CPLEX
Lindo Mathlab
Excel - Solver Etc.
Optimization

LOGO
Solver is numerical optimization add-in software embedded in Excel, but not enable by default
Used to solve problem to find optimal or near optimal value
Solve linear/some non-linear problems
Excel Solver

LOGO
Advantages
– Everything of interests can be tracked (costs, profits, resources availability, resource usage)
– Cells of interests can be varies
– Used as “what-if” analysis tool
Disadvantages
– Black box
– Need carefully modeling: constraints
Excel Solver

LOGO
Main Components :
Target cells
Changing cells
Constraints
Excel Solver

LOGO
Target cell(s): contains objective function, the cell that represents the goal or objective of the problem
Setting: maximization/minimization/fixed value
Excel Solver
Target Cell
Maximize Profit
Minimize Cost
Value of Net future value

LOGO
Changing cells /Adjustable cells: cells that contain decision variables, the cells that can be modified to arrive at the desired outcome, cells that we can change or adjust to optimize the target cell
Excel Solver
Problem Changing cells
Product mix Amount of each product produced
Product shipping Shipping quantity
Investment Money invested in each project

LOGO
Constraints:
– Restrictions or limitations to what Solver can do to solve the problem
– Restrictions to the changing cells or other cells related
– The rules which define the limits of the possible solutions to the problem
– Requirement constraints: given by problem
– Non-negative constraints
Excel Solver

LOGO
Excel Solver
Problem Constraints
Product mix Product mix produced cannot use more resources than are available
Production planning Do not produce products more than demand
Investment Obtain an expected return of at least 10 percent on the investment
Type of Constraint SymbolNot greater than ≤Not less than ≥Equal to =Integer intBinary binNon-negative ≥ 0

LOGO
Activate Solver: add-in that is not installed by default
How to use Solver
File>Excel Option>Add-in>Manage Excel Add-in>Select the Solver Add-in checkbox
LOGO
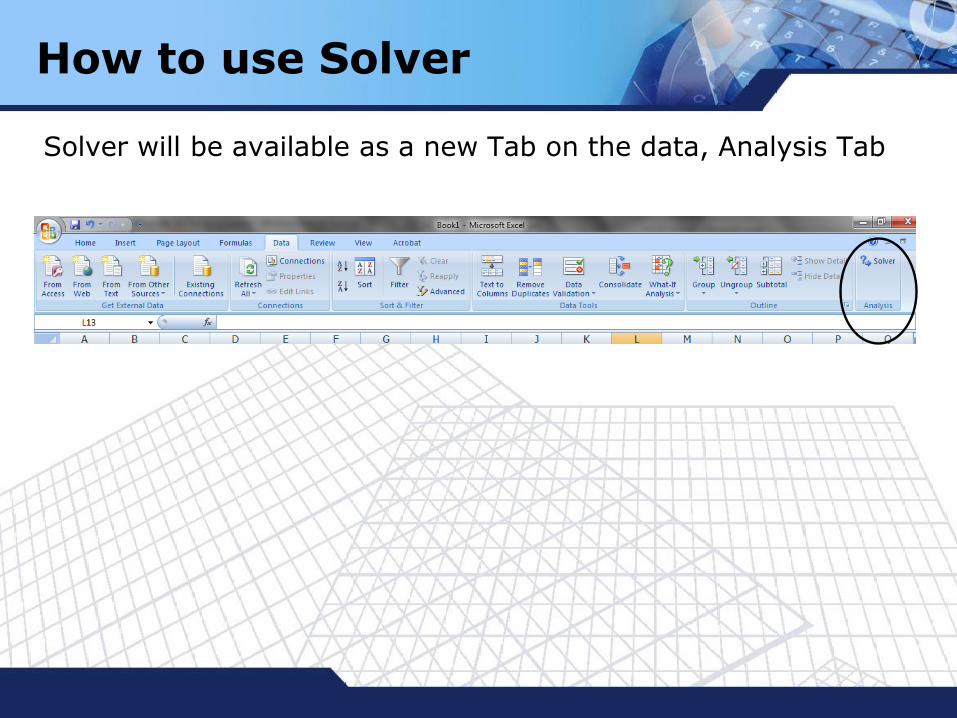
How to use Solver
Solver will be available as a new Tab on the data, Analysis Tab
LOGO
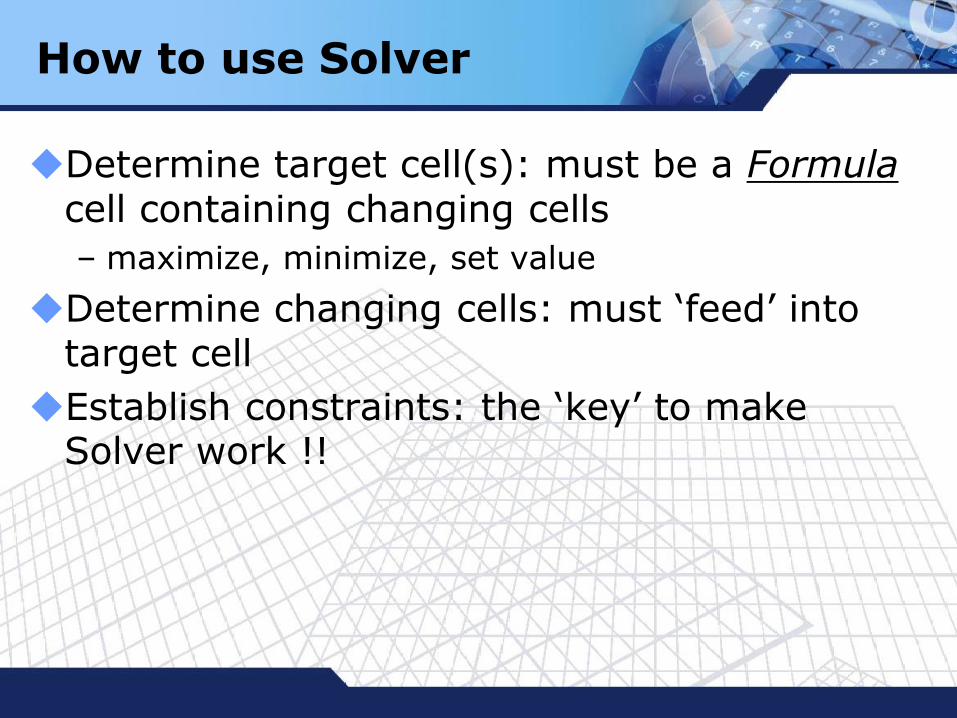
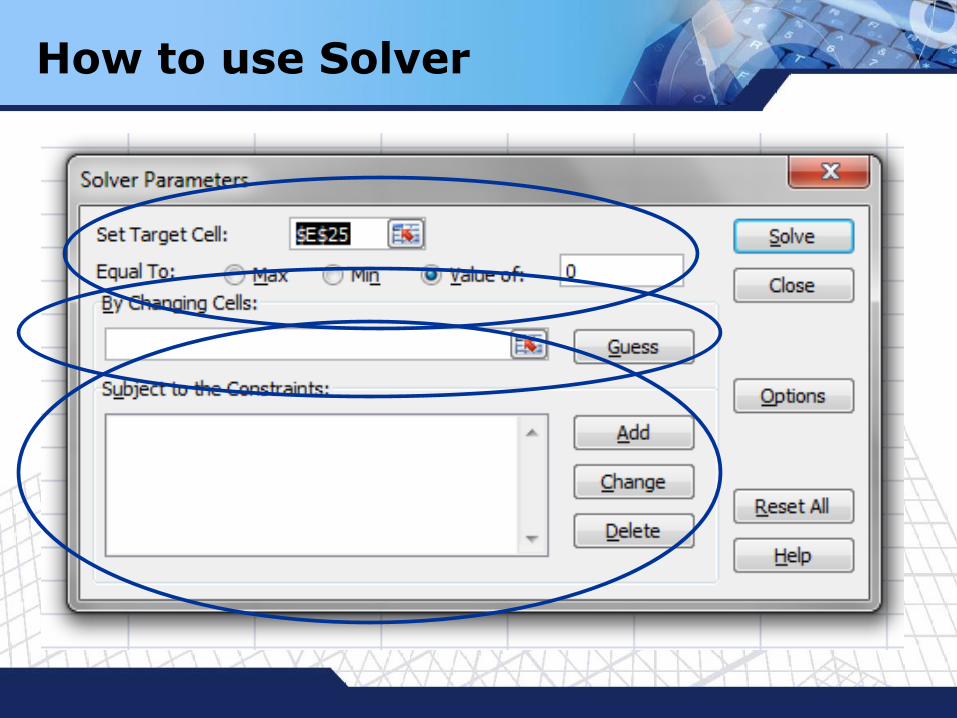
Determine target cell(s): must be a Formulacell containing changing cells
– maximize, minimize, set value
Determine changing cells: must ‘feed’ into target cell
Establish constraints: the ‘key’ to make Solver work !!
How to use Solver
LOGO
How to use Solver

LOGO
How to use Solver
LOGO
How to use Solver

LOGO
Precision is the real number from 0 to 1higher numbers means more precise
Tolerance shows how far away from the true optimal value and still be acceptable. Only applied to the problem with integer constraints
How to use Solver

LOGO
How to use Solver

LOGO
SUM()
SUMPRODUCT()
– Sum of product of 2 data sets [][] which are corresponding to each other
– Example
SUMPRODUCT(L4:N4,L5:N5)=(3*1)+(4*5)+(2*0)
Etc….
Functions in Excel
LOGO
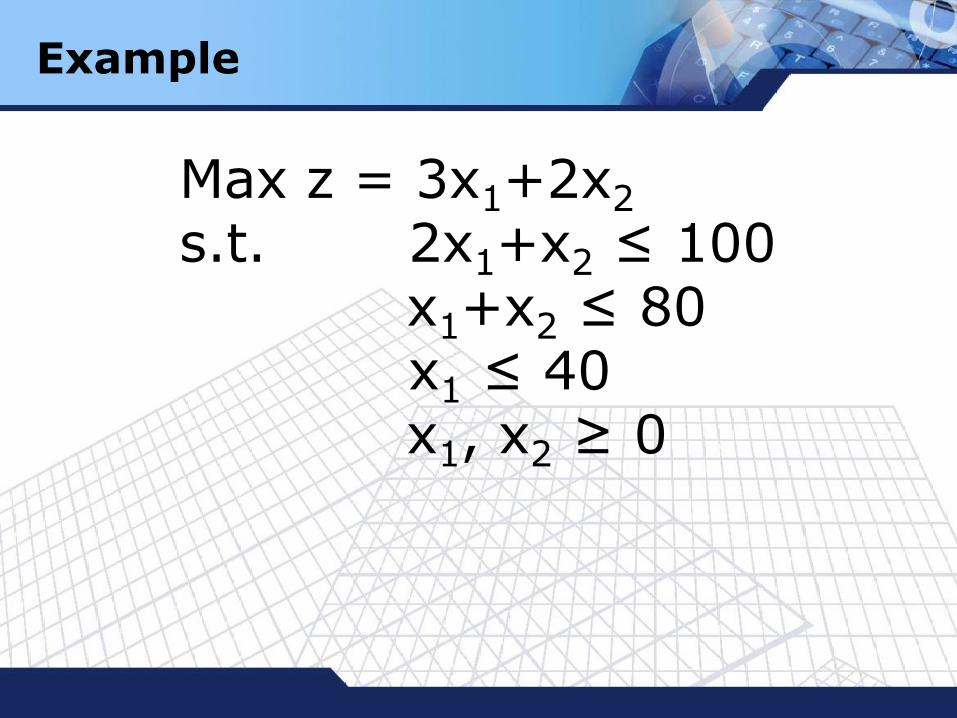
Example
Max z = 3x1+2x2
s.t. 2x1+x2 ≤ 100x1+x2 ≤ 80x1 ≤ 40x1, x2 ≥ 0
LOGO
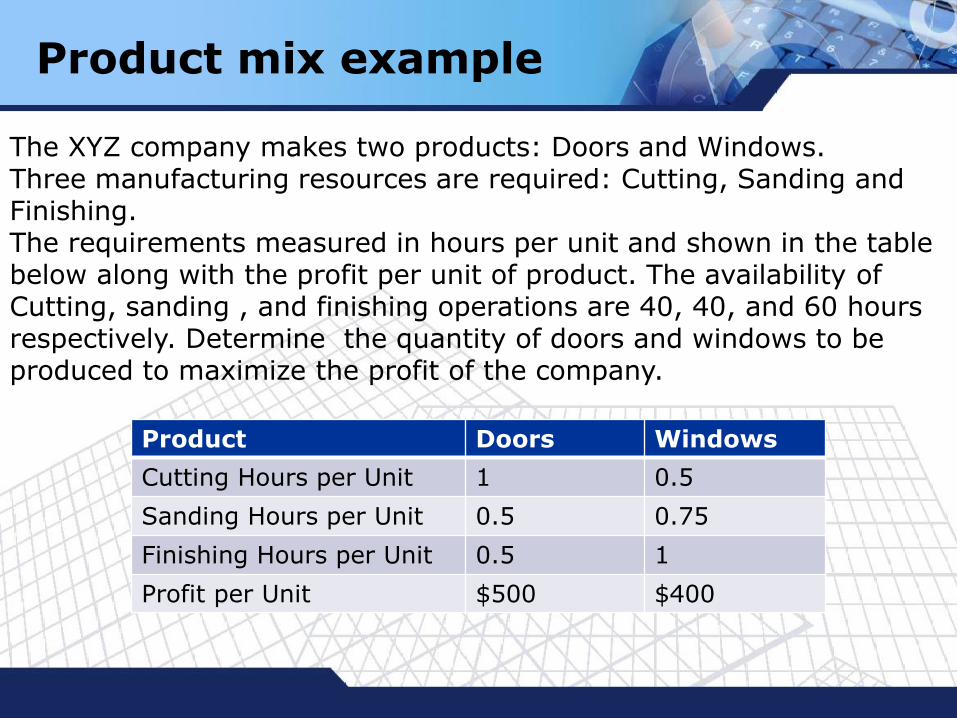
Product mix example
The XYZ company makes two products: Doors and Windows.Three manufacturing resources are required: Cutting, Sanding and Finishing. The requirements measured in hours per unit and shown in the table below along with the profit per unit of product. The availability of Cutting, sanding , and finishing operations are 40, 40, and 60 hours respectively. Determine the quantity of doors and windows to be produced to maximize the profit of the company.
Product Doors Windows
Cutting Hours per Unit 1 0.5
Sanding Hours per Unit 0.5 0.75
Finishing Hours per Unit 0.5 1
Profit per Unit $500 $400

LOGO
Product mix example
Formulate the Product mix problemX1 : number of Doors producedX2 : number of Windows producedz : company profit
max z = 500 X1 + 400 X2
s.t X1 + 0.5X2 ≤ 400.5X1 + 0.75X2 ≤ 400.5X1 + X2 ≤ 60X1 , X2 ≥ 0 (non-negative
constraint)

LOGO
Diet Problem
My diet requires that all the food I eat come from one of the four “basic food groups”(chocolate cake, ice cream, soda, and cheesecake). Now, the following four foods are available for consumption: brownies, chocolate ice cream, cola, and pineapple cheesecake. Each brownie costs 50¢, each scoop of chocolate ice cream costs 20¢, each bottle of cola costs 30¢, and each piece of pineapple cheesecake costs 80¢. Each day, I must consume at least 500 calories, 6 oz of chocolate ,10 oz of sugar, and 8 oz of fat. The nutritional content per unit of each food is shown in Table2. Solve this problem that can be used to satisfy my daily nutritional requirements at minimum cost.
Type of food Calories Chocolate (oz) Sugar (oz) Fat (oz)
Brownies 400 3 2 2
Chocolate ice cream(1 scoop)
200 2 2 4
Cola(1 bottle)
150 0 4 1
Pineapple Cheesecake (1 piece)
500 0 4 5

LOGO
Transportation Problem
Powerco has 3 electric power plants that supply the needs of 4 cities. The costs of sending 1 million kwh of electricity from plant to city are shown in the table. Use Solver to minimize the cost of this problem.
To Supply
From City1 City2 City3 City4 (million kwh)
Plant1 $8 $6 $10 $9 35
Plant2 $9 $12 $13 $7 50
Plant3 $14 $9 $16 $5 40
Demand 45 20 30 30
(million kwh)

LOGO
Assignment Problem
Machineco has 4 machines and 4 jobs to be completed. Each machine must be assigned to complete one job. The time required to set up each machine for completing each job is shown the Table. Use Solver to minimize the total set up time needed to complete the 4 jobs.
Time (Hours)
Machine Job 1 Job 2 Job 3 Job 4
1 14 5 8 7
2 2 12 6 5
3 7 8 3 9
4 2 4 6 10
LOGO
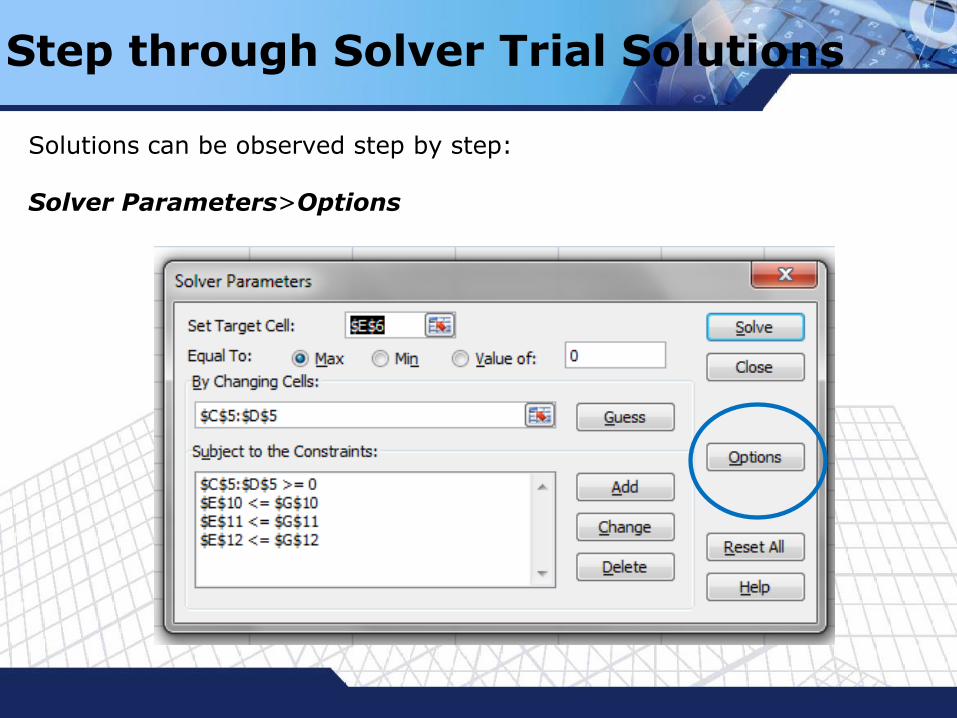
Step through Solver Trial Solutions
Solutions can be observed step by step:
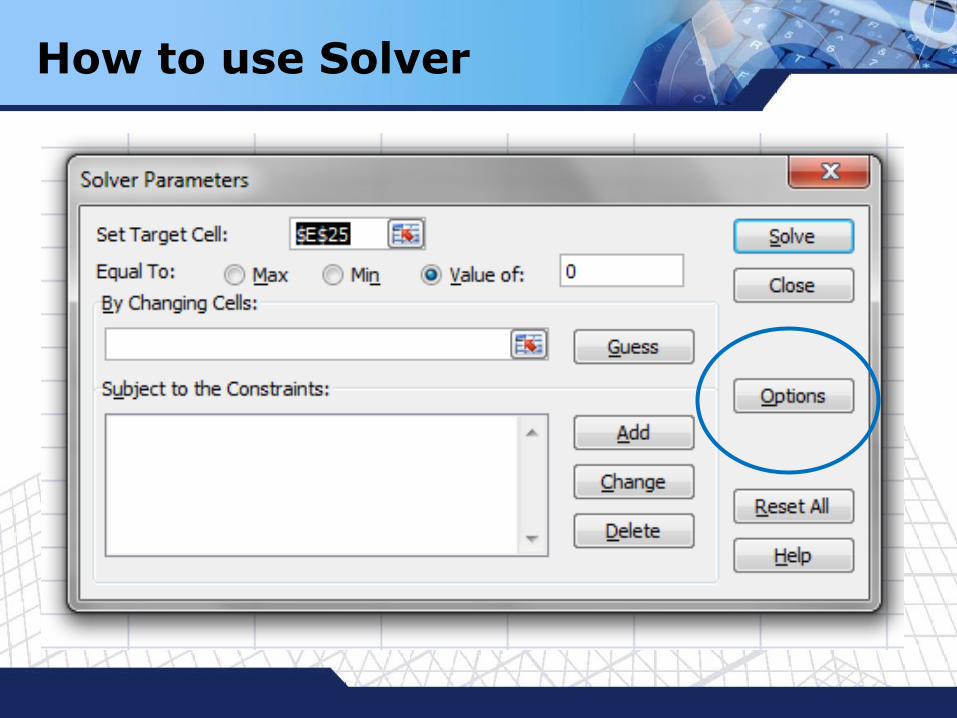
Solver Parameters>Options
LOGO
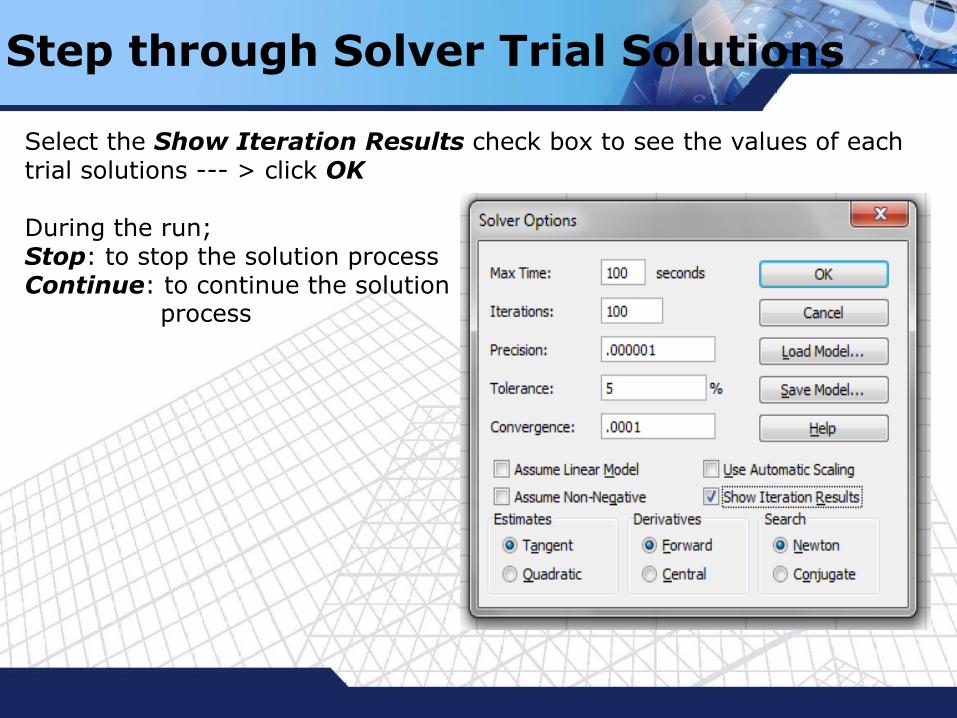
Step through Solver Trial Solutions
Select the Show Iteration Results check box to see the values of each trial solutions --- > click OK
During the run;Stop: to stop the solution processContinue: to continue the solution
process

LOGO
Solver Report
LOGO
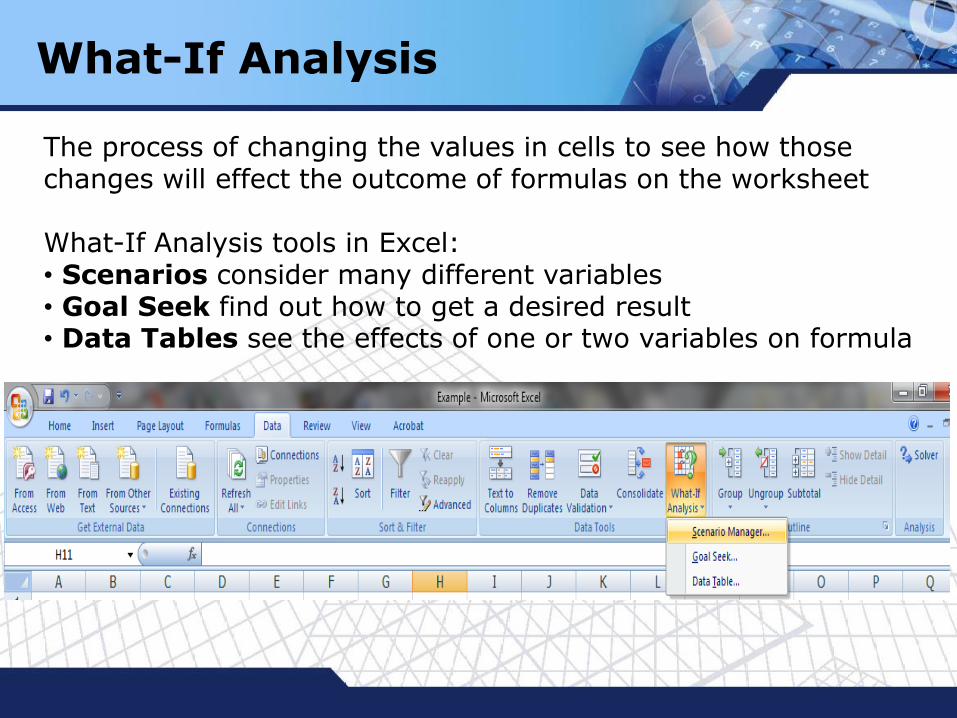
What-If Analysis
The process of changing the values in cells to see how those changes will effect the outcome of formulas on the worksheet
What-If Analysis tools in Excel:• Scenarios consider many different variables• Goal Seek find out how to get a desired result• Data Tables see the effects of one or two variables on formula

LOGO
What-If Analysis
Goal Seek to find out how to get a desired result
The target is to determine the possible input value that produce the result
Goal Seek work with only one variable input value!!
resultvariable 1??

LOGO
What-If Analysis
Data Tables see the effects of one or two variables on a formula/result
Data Table cannot work with more than two variables. But it can take as many different variable values as wanted.
If a model has more than two variables, use scenarios.
variable1
variable2
result

LOGO
What-If Analysis
Scenarios consider many different variables
It can take many input variables sets up to 32 different valuesBut as many scenarios as wanted can be created
result
Variable 1
Variable 2
.
.
.
Variable n

LOGO
What-If Analysis
Solver is a tool for What-If Analysis
Solver is similar to Goal Seek except for the fact that it can determine more than one variable inputs

LOGO
Solver Report
To save adjusting cell values as a scenario, click Save Scenario, then type the name of the scenario in the Scenario Name box

LOGO
Solver Report
Scenario will be available for use in the Scenario Manager, which is accessed from Data>What-If-Analysis Tab
See example

LOGO
Solver Report
Scenario Name is “good”

LOGO
Solver Report
Scenario Name is “good”.

LOGO
Solver Report
Report will be created on a new worksheet in the current workbook

LOGO
Product mix example
The XYZ company makes two products: Doors and Windows.Three manufacturing resources are required: Cutting, Sanding and Finishing. The requirements measured in hours per unit and shown in the table below along with the profit per unit of product. The availability of Cutting, sanding , and finishing operations are 40, 40, and 60 hours respectively. Determine the quantity of doors and windows to be produced to maximize the profit of the company.
Product Doors Windows
Cutting Hours per Unit 1 0.5
Sanding Hours per Unit 0.5 0.75
Finishing Hours per Unit 0.5 1
Profit per Unit $500 $400

LOGO
Product mix example
Formulate the Product mix problemX1 : number of Doors producedX2 : number of Windows producedz : company profit
max z = 500 X1 + 400 X2
s.t X1 + 0.5X2 ≤ 400.5X1 + 0.75X2 ≤ 400.5X1 + X2 ≤ 60X1 , X2 ≥ 0 (non-negative
constraint)

LOGO
Product mix example

LOGO
Answer Report
Answer Report reports• The original and final objective values• The original and final values of the variables • The final values of constraints • The constrains formulas, binding status and the slacks
Constraint with no Slack - Binding

LOGO
Answer Report
Constraint with no Slack - Binding

LOGO
Sensitivity Report
Sensitivity Report gives• The optimal variable values• The final values for constraints• The shadow prices for the constraints with the maximum allowable increase and decrease• The reduced cost for the input variables with the maximum allowable increase and decrease
Note: if the model contains integer or Boolean constraints, sensitivity report cannot be produced

LOGO
Sensitivity Report

LOGO
Sensitivity Report
Shadow Price/Dual price: determine how the objective values will change as you obtain an additional unit of constraints without re-run the Solver
If constraint is binding (no slack) -- Shadow price ≠ 0If constraint is no binding -- Shadow price = 0
LOGO
Sensitivity Report
Reduced Cost : determine additional cost/profit for every additional variable unit occurred
If reduced Cost ≤0 - Solution is optimal

LOGO
Sensitivity Report
MAXIMIZATION (ex. Profit, Revenue)
If shadow price is positive Profit increaseIf shadow price is negative Profit decrease
If reduced cost is positive Profit increaseIf reduced cost is negative Profit decrease
MINIMIZATION (ex. Cost)
If shadow price is positive Cost increaseIf shadow price is negative Cost decrease
If reduced cost is positive Cost increaseIf reduced cost is negative Cost decrease

LOGO
Sensitivity Report
Analysis: Product Mix Problem
1. If the availability of the cutting hours is increased to 80 hours, how much does the XYZ company gain their profit?
2. How much should the XYZ company pay for the sanding labor cost if the availability of sanding hours is increased to 41?

LOGO
Limits Report
Limits Report reports• The achieved optimal objective value• The input variables with the optimal values and with lower and upper bound• The lower bound indicates the smallest value that a variable can take while satisfying the constraints and holding all of the other variables constant• The upper bound is the largest value the variable can take under these circumstances

LOGO
Limits Report

LOGO
Diet Problem
My diet requires that all the food I eat come from one of the four “basic food groups”(chocolate cake, ice cream, soda, and cheesecake). Now, the following four foods are available for consumption: brownies, chocolate ice cream, cola, and pineapple cheesecake. Each brownie costs 50¢, each scoop of chocolate ice cream costs 20¢, each bottle of cola costs 30¢, and each piece of pineapple cheesecake costs 80¢. Each day, I must consume at least 500 calories, 6 oz of chocolate ,10 oz of sugar, and 8 oz of fat. The nutritional content per unit of each food is shown in Table2. Solve this problem that can be used to satisfy my daily nutritional requirements at minimum cost.
Type of food Calories Chocolate (oz) Sugar (oz) Fat (oz)
Brownies 400 3 2 2
Chocolate ice cream(1 scoop)
200 2 2 4
Cola(1 bottle)
150 0 4 1
Pineapple Cheesecake (1 piece)
500 0 4 5

LOGO
Diet Problem
Create sensitivity report and answer the following questions
1. If you must consume total calories at least 600 oz, what is the new cost?
2. If you must consume chocolate at least 8 oz, what is the new cost ?
3. If you want to eat 1 piece of brownie, what is the new cost?

LOGO
Transportation Problem
Powerco has 3 electric power plants that supply the needs of 4 cities. The costs of sending 1 million kwh of electricity from plant to city are shown in the table. Use Solver to minimize the cost of this problem.
To Supply
From City1 City2 City3 City4 (million kwh)
Plant1 $8 $6 $10 $9 35
Plant2 $9 $12 $13 $7 50
Plant3 $14 $9 $16 $5 40
Demand 45 20 30 30
(million kwh)

LOGO
Transportation Problem
Create sensitivity report and answer the following questions
1. If electricity supply of Plant1 increases by 5 million kwh, how is it effect the cost? What will be the new cost?
2. If electricity supply of Plant2 increases by 5 million kwh, how is it effect the cost? What will be the new cost?

LOGO
Inventory Problem
Sailco Corporation must determine how many sailboats should be produced during each of the next four quarters. The demand during each of the next four quarters is as follows: 40, 60, 75, and 25 sailboats. Sailco must meet demand on time. At the beginning of the first quarter, Sailco has an inventory of 10 sailboats. Sailco must decide how many sailboats should be produces during the quarter. For simplicity, we assume that sailboats manufactured during a quarter can be used to meet demand for that quarter. During each quarter, Sailco can produce up to 40 sailboats with regular time labor at a total cost of $400 per sailboats. By having employees work overtime during a quarter, Sailco can produce additional sailboats with overtime labor at a total cost of $450 per sailboats.At the end of each quarter(after production has occurred and the current quarter’s demand has been satisfied), a carrying or holding cost of $20 per sailboats is incurred. Determine production schedule to minimize the sum of production and inventory cost during the next four quarters.