solving the great steel caper - journal of 9/11...
TRANSCRIPT

- 1 -
Solving The Great Steel Caper: DEW-Demolition Contrary Evidence
By Dr. Gregory S. Jenkins
Directed energy weapon (DEW) demolition proponents claim that a large majority
of above-grade structural steel from the World Trade Center (WTC) towers was
dissociated into dust and aerosols during and/or after collapse. However, multiple
quantitative dust and aerosol measurements show that no significant fraction of
structural steel was dissociated into dust or aerosols. A review of the photographic
record (flickr)20
shows no gas, dust, aerosols, or debris moved upwards during the
collapse, and physical principles reveal that that no significant fraction of structural
steel from the towers could reasonably be supported by air during or immediately
after collapse. Visibility (optical path length) measurements, dust collected directly
from the south tower debris cloud, and an analysis of the physical transport
mechanisms for dust and aerosols prove that the debris which hung in the air after
the collapse was miniscule compared to the amount of steel in the towers. A large
fraction of steel in the towers could not be transformed into a gas due to the reactive
nature of iron and oxygen which would have caused suffocation of anyone in the
vicinity of ground zero.
The photographic record of debris removal from ground zero (GZ) reveals that the
majority of the debris generated from the collapse of the WTC towers fell upon
their footprints and filled sublevels. Other corroborating evidence from multiple
independent sources quantitatively and explicitly indicates that sufficient amounts
of debris and steel were removed from GZ. In short, no significant amount of steel
from the towers was turned to dust or aerosols at anytime during and after the
collapse. All of the steel may be accounted for if the sublevel collapses are included
in the analysis which is corroborated by the photographic record and other
quantitative evidence.

- 2 -
Introduction................................................................................................................ - 3 -
Amount of steel above grade in the towers ................................................................. - 6 -
Quantifying iron found in dust samples ...................................................................... - 6 -
Part I: USGS dust study results6.............................................................................. - 7 -
Part II: McGee et al dust study results8
................................................................... - 9 -
Part III: EPA dust study results7............................................................................ - 11 -
Part IV: Summary of all three dust studies ............................................................ - 12 -
Quantifying iron found in aerosol studies ................................................................. - 12 -
Part I: EPA12
and UC Davis11
................................................................................ - 12 -
Part II: OSHA....................................................................................................... - 14 -
The first 36 hours ..................................................................................................... - 16 -
Introduction.......................................................................................................... - 16 -
Photographically characterizing dust clouds ......................................................... - 18 -
Particle sizes......................................................................................................... - 19 -
Part I: EPA and the McGee samples ................................................................. - 19 -
Part II: USGS ................................................................................................... - 20 -
Part III: Cahill and UC Davis Group – South Tower dust cloud sampling ......... - 22 -
Part IV: Characterizing approximate particle sizes from photographs................ - 23 -
All known vertical dust transport mechanisms ...................................................... - 25 -
Visibility measurements (optical path length) ....................................................... - 29 -
Alchemy and nuclear reactions ............................................................................. - 35 -
Summary of section.............................................................................................. - 36 -
Evidence steel fell as large pieces ............................................................................. - 37 -
Conclusion ............................................................................................................... - 43 -
References................................................................................................................ - 46 -
A. Manhattan wind-speeds from EPA................................................................... - 46 -
B. Manhattan wind-speeds from Cahill et al11
....................................................... - 46 -
C. Data from reported EPA aerosol study in lower Manhattan .............................. - 47 -
D. McGee8 bulk dust samples: table 3................................................................... - 48 -
E. EPA7 bulk dust samples: table 5 ....................................................................... - 48 -
F. Oxylance materials data safety sheet excerpt .................................................... - 49 -
G. Air Properties26
................................................................................................ - 49 -
H. Derivations ...................................................................................................... - 50 -
H1. Gases and hydrostatic pressure gradients.................................................... - 50 -
H2. Diffusion and terminal velocity .................................................................. - 51 -
H3. Air jets ....................................................................................................... - 52 -
H4. Optical path lengths in dust clouds ............................................................. - 53 -
H5. Thumbnails of the flickr18
annotated slideshow: ......................................... - 55 -
Bibliography ............................................................................................................ - 61 -

- 3 -
Introduction At its core, a ‘truth movement’ necessarily involves vetting the credibility of ideas which
are put forth. Gauging what arguments may be true often involves proving which
arguments are false. That is, truth is necessarily that which is not false.
Many people involved in 9/11 research have sacrificed their time to cogently present their
work on websites and journal publications so that the data and the concepts may be
evaluated: dust and aerosol studies, building performance analyses, construction pictures
and blueprints, flight trajectories, eyewitness testimonies, etc. The compiled resources
save many thousands of people time in compiling and evaluating data. I know, personally
speaking, that I owe many thanks to those researchers who have saved me much time
from investigating blind alleys. By presenting my own work, I hope that I may amplify
the time saved to me and pass it on to many others.
This paper primarily focuses upon the hard evidence which directly contradicts the notion
that Directed Energy Weapons (DEWs) destroyed the WTC towers. The DEW-notion can
hardly be called a hypothesis or theory since nothing specific has been proposed.1
“Energy” is the cause of every physical action without exception. It makes all physical
objects move, causes all damage and explosions, hurls planes into buildings, and fuels
every life-giving process. The official story states that directed energy brought down the
towers. The form of the energy was first the kinetic energy of the plane which caused
impact damage to the floors and columns of the WTC tower, followed by exothermic
energy release from fires, followed by the slow creep of the building caused by the
conversion of potential energy into kinetic energy, and finally the ensuing ‘global
collapse’ where all the potential energy of the building was released into heat energy,
deformation energy, pulverization energy, sound and ground wave energy, etc. Stating
that “energy” destroyed the towers conveys absolutely nothing. It is precisely the form of
the energy which is at issue. DEW-demolition proponents have not even stated the form
of “energy” manifested in a “directed beam.” I address this issue directly in my previous
publication where I consider all known forms of energy beams in physical existence, and
show the impossibility of any of them to destroy the towers while remotely matching
observations.35
DEW-demolition proponents claim that massive amounts of steel were implausibly
turned into dust or aerosols. Estimates from different proponents of DEW-demolition
vary, but the stated missing amount material is always over 50% and is usually more in
the vicinity of 80%.2 Each and every supporting reason cited has been extensively
repudiated: erroneous scaling arguments applied to seismograph readings and the
naturally resulting non-catastrophic damage to the bathtub, impulse damage to
surrounding buildings from falling debris, the amount of debris expected from collapsed
and partially collapsed WTC buildings is consistent with observation, inconsistency with
observed damage from all known DEWs, astronomical power requirements, and other
peripheral arguments.35,3,4
DEW-demolition proponents often cite photographs and videos as proof of their claims.
Unaltered photographs and videos do represent factual evidence. However, the
interpretation of photographs and videos can be highly subjective. Interpretations should
not be conflated with factual evidence. For instance, videos of the North tower core
column “spires” which were standing for multiple seconds after the collapse immediately

- 4 -
before their own subsequent demise5 are often interpreted by observers in one of two
ways: 1) the spires fell while dust and debris were generated by crumbling concrete and
wallboard which were built into the core as well as the liberated remnant dust which had
settled upon the spires, or 2) the steel spires themselves turned to dust. I believe that all
people who interpret the videos report what they observe. However, I do not conflate
interpretations with facts. My personal observation, as well as many other witnesses, is
that the spires fell. Other people observe spires spontaneously turning to dust. All
observers are credible and report what they observe. The data is inherently ambiguous
since it may be interpreted in more than one way. This is the definition of ambiguous
data. Usually the demise of the spires is cited as the strongest evidence by DEW-
demolition proponents, but the interpretation is hopelessly ambiguous as can be gauged
by the people who report what they observe.
A second example of ambiguous data used to support the claims of DEW-demolition
proponents are aerial and surface photographs of ground zero (GZ) after the collapse of
the towers.6 Some people interpret the photographs as evidence that only a tiny fraction
of the debris is present at GZ since, they argue, little debris is observed on the surface
compared to the total amount of material comprising the building. However, surface
photographs taken before debris removal are ineffective in gauging the amount of debris
which may reside in the sublevels. The interpretation of these photographs as proof that
little debris was present after the collapse is inherently ambiguous. The methodology is
explicitly flawed since the amount of debris which may reside in sublevels can not be
gauged.
No matter what method is used to hypothetically dissociate the steel in the WTC towers,
there should have been massive amounts of iron in the dust since the structural steel in
the towers was composed of over 98% iron.7 USGS,
8 EPA,
9 and McGee et al
10
independently sampled dust at many locations around the WTC site and lower Manhattan
and quantitatively analyzed the iron content. All the quantitative dust samples are
consistent with the amount of iron measured in bulk concrete (direct measurements
performed by Dr. Steven Jones11
as well as explicit validation by the McGee study)
which is insignificant compared to the expected amount if a large fraction of above-grade
structural steel was somehow dissociated.
The notion that debris, in the words of Dr. Wood, 12
“shot up into the upper atmosphere”
during and immediately after collapse is not supported by the photographic record
(flickr)20
and violates the physics of all reasonable dust transport mechanisms. In
particular, a 2250 year old law known as Archimedes principle (the concept of buoyancy)
quantitatively shows that air can not buoy the immense weight of the towers even if the
towers and all their contents were turned to dust. Explosive vertical air jets generated by
the collapse (a notion which is directly contradicted by the photographic record) could
not propel any significant amount of the weight of the towers into the air. Prevailing wind
currents did not vertically transport a significant quantity of debris upwards. Visibility
(optical path length) measurements through the debris cloud derived from various
photographs show that the density of the dust which hung in the air during the collapse of
the South tower, 30 minutes after the collapse, and 36 hours after collapse is miniscule
compared to the total weight of a tower. No quantitative evidence exists that any
significant amount of debris was, in fact, supported by air which contradicts quantitative
measurements and basic physical principles. Qualitatively pointing to photographs of
dust and debris which drifted from GZ is not evidence a significant fraction of the WTC

- 5 -
towers were suspended in air, no more so than qualitatively pointing to clouds in the sky
or a thick London fog.
Aerosol studies performed independently by both UC-Davis DELTA Group13
, EPA14
,
and OSHA17
measured the chemical constituents emanating from the smoldering rubble
pile during the days, weeks, and months following 9/11. The aerosol data directly and
quantitatively shows that much less than 4% of above-grade steel from the WTC towers
was contained within the plume integrated over the entire lifetime of the plume.
Rust colored airborne dust produced during clean-up as depicted in photographs is not
steel spontaneously transforming into dust. Photographs and written verification from the
vice-president of Oxylance confirms that large amounts of iron-oxide dust, otherwise
known as rust, were produced from burning Oxylances during steel cutting.
The obvious conclusion based on the hard evidence is that steel beams fell to the ground
as large pieces and were subsequently removed during clean-up. At no time during or
after collapse did any significant quantity of steel dissociate into dust or aerosols.
Multiple measurements and estimates of the quantity of debris removed from GZ, the
amount of debris located in the sublevels, and multiple reports of the amount of steel
recycled all support the claim that steel fell in large pieces.

- 6 -
Amount of steel above grade in the towers The total weight of above grade concrete and steel as well as estimates of live and dead
loads has been compiled by Gregory Urich for a single WTC tower:15
Steel by weight above grade in the towers was 90,000 tons / 240,000 tons ~ 38% (and
this ignores all the iron present in the live loads). Since all the structural carbon steel used
in the towers was over 98% iron by weight7, the amount of steel and the amount of iron
can be thought of as synonymous.
Concrete in the tower represents 87,000/240,000 ~ 36% of the total above-grade mass.
The percentage of iron by weight found in WTC bulk concrete based upon a
measurement performed by Dr. Steve Jones11
of the MacKinlay sample was found to be ~
3.2%. So, the concrete in the towers can contribute up to 36% x .032 =1.2% to the total
percentage of iron in the dust.
Take special note that literally all iron in the office material (live loads) and all duct
work, plumbing, and wiring (superimposed dead load) have been ignored. Thus, a lower
bound of iron expected in the dust from above-grade structural steel and concrete is
found to be at least 38% + 1.2% ~ 39%.
If the structural steel was dissociated, the dust would contain at least 39% iron.
Since DEW-demolition proponents believe that the majority of the structural steel in the
towers was turned into dust,2 I will use this number as a reference for comparison to the
actual amount of iron found in the dust and aerosol samples. This will allow the reader to
quickly gauge the relative difference in magnitude. However, the percentage of iron
physically measured in the dust and aerosol studies is so tremendously insignificant that a
direct comparison is not even required.
Quantifying iron found in dust samples The amount of iron measured in the WTC dust is consistent with the expected amount
generated from concrete as reported by three independent bulk dust studies. The amount
of iron measured in all three studies confirms that an insignificant fraction of above-grade
structural steel was dissociated into dust, if at all. The following four sections investigate
the results reported by the USGS, the EPA, and McGee et al.

- 7 -
Part I: USGS dust study results8
A 2-person USGS crew collected samples of dust and air-fall debris from more than 35
localities within a 1-km radius of the World Trade Center site on September 17 and 18,
2001. Twenty samples were chemically analyzed and the pertinent data (elements that are
greater than .1% of the dust sample by weight) are summarized in the table below. The
data clearly shows that only 1.6 +/- 0.7 %-weight of iron is found in the dust.

- 8 -
A summary of the pertinent results are as follows:
%-weight Fe expected from concrete 1.2%
%-weight Fe expected from dissociated steel 38%
USGS average %-weight Fe content 1.6 +/- 0.7%
As we can see, 1.6 +/- 0.7% is consistent with the 1.2% iron content expected from the
bulk concrete aggregate contribution.
We can calculate how much structural steel may have been turned into dust based upon
the USGS findings:
(1.6 +/- 0.7% – 1.2%)/38% = 1 +/- 2%
Proponents of DEW-demolition claim that the initial above-grade steel ‘missing’ from
the WTC rubble is obvious to the point of being self-evident based upon photographs of
ground zero (GZ).2 This claim is in direct contradiction with the quantitative data: no
significantly elevated levels of iron are found in the dust, and the level is consistent with
what is found in the concrete aggregate.
Even if you consider the maximum error in favor of DEW-demolition (3% dissociation of
structural steel), this amount of hypothetically ‘missing steel’ from ground zero is
obviously not going to be qualitatively assessed based solely upon photographs.

- 9 -
Part II: McGee et al dust study results10
McGee states in the discussion section of his paper, “Levels of elements that could be
attributed to metal wiring (Cu), plumbing (Fe, Cu, Pb), structural steel (Fe, Mn), and
communication and computer equipment (Cu, Fe, Zn, others) are also low. This may be
attributed to the relatively small proportion of metal-containing building contents
compared with the building itself, or perhaps these materials resisted crumbling and
pulverization into the PM2.5 fraction.” Furthermore, he reported that “the relative
weight-percent ratios of Al, Mg, and Fe are in the range of those found in Portland
cement, a major component of concrete.” This is, of course, perfectly consistent with
the analysis in the previous section where we found that the USGS data was consistent
with the iron content expected from bulk concrete as measured by Dr. Steven Jones. Even
though McGee explicitly states that the iron level in the dust is consistent with that found
in concrete, we will analyze the raw data reported by McGee and compare the results
directly to the measured iron content in bulk concrete.
Seven dust samples were collected at various locations around lower Manhattan as
indicated in the above map (the numbered samples were collected on 9-12-01 and the
lettered samples were collected on 9-13-01). McGee presents quantitative amounts of Fe
as well as other metals for all 7 samples in the PM2.5 fraction (less than 2.5 µm).

- 10 -
The table above summarizes the pertinent results taken directly from the McGee
publication (“D. McGee10 bulk dust samples: table 3” in reference section). The units in
the table are µg/g, and the average percent weight and standard deviation is reported per
element in the last 2 columns. The amount of S04 and Si content were not measured for
any sample except for the WTC 3 sample since a different measurement technique was
employed (x-ray fluorescence). Note that S04 has been converted to S for easy
comparison between studies.
%-weight Fe expected from concrete 1.2%
%-weight Fe expected from dissociated steel 38%
McGee average %-weight Fe content 0.8 +/- 0.4%
Notice the Fe content is consistent with the USGS findings, 1.6 +/- 0.7%, as well as the
amount of iron expected from the concrete aggregate.

- 11 -
Part III: EPA dust study results9
Three bulk dust samples from two different buildings were collected by the EPA on
September 17, 2001. The two locations are listed on the map above and are labeled ‘high
exposure’ and ‘low exposure’ buildings. Two samples were from the ‘high exposure’
building and one sample was from the ‘low exposure’ building. The results are
summarized in the above table which is taken directly from the report (see “E. EPA9 bulk
dust samples: table 5” in the reference section).
%-weight Fe expected from concrete 1.2%
%-weight Fe expected from dissociated steel 38%
EPA average %-weight Fe content 0.8 +/- 0.4%
The EPA results are in excellent agreement with that found by McGee (0.8 +/- 0.4%) and
are consistent with USGS (1.6 +/- 0.7%) as well as the iron content expected from
concrete (1.2%). The amount of iron found in the EPA dust samples pales in comparison
to the total amount expected if the steel from the WTC tower was turned into dust,
namely 39%.

- 12 -
Part IV: Summary of all three dust studies
We may average the dust results from all three bulk dust studies. The resulting iron
content by weight from three independent studies totaling thirty dust samples is the
following:
%-weight of Fe in bulk dust samples 1.4 +/- 0.8 %
The amount of steel possibly dissociated based upon all 3 dust studies can be calculated
by subtracting the amount expected from concrete, ((1.4 +/- 0.8%) – 1.2%)/ 38%:
average %-weight of above grade structural steel found in dust 0.6 +/- 2 %
No appreciable percentage of structural steel is found in the dust samples. DEW-
demolition proponents claim much more than 0.6% (or even 3%) of the structural steel is
missing from photographs. It is obvious that no significant quantity of steel was located
in the dust. Not one solitary quantitative dust study in the literature substantiates the
claim that any appreciable fraction of steel dissociated into dust.
Quantifying iron found in aerosol studies
Part I: EPA14 and UC Davis13
The EPA measured iron density in the aerosols
rising from the debris pile in the PM10 fraction
(effectively PM12 as explained by the UC-
Davis publication). The EPA published the raw
data on their website14
from 15 locations in the
vicinity of ground zero, which is shown on the
adjoining map. Data was recorded during the
period of September 16, 2001 through May
2002 (see “C. Data from reported EPA aerosol
study in lower Manhattan” in the reference
section). A peak iron density reading of 25
µg/m3 was recorded in November at the Albany
and Greenwich location as well as WTC 5 – SW
location. A global peak reading for all locations
over the entire measurement period was 27
µg/m3 recorded in November at Church and
Dey.
The UC Davis study (DELTA Group) measured
aerosols rising from the debris pile from
October 2nd
to October 30th
on the rooftop at 201 Varick Street which was 50m above
street level.13
They measured the PM5 fraction. The following graph shows a maximum
of about 2 µg/m3
iron emission recorded on October 3rd
. The material in the ultra-fine

- 13 -
region (.25 to .09 µm) as reported by UC-Davis, including the directly measured iron
content, is insignificant compared to the coarser material.
One major contributing factor for the large discrepancy between the EPA maximum
readings and the UC Davis maximum reading is due to the differences in location of the
detectors. The UC Davis group was located 1.8 km north-northeast of ground zero which
is much further away than the EPA detectors. As the plume travels away from ground
zero, it spreads out somewhat becoming less dense. If the cross-sectional area increases
by a factor of 5 or 10 by the time it reaches Varick Street, for instance, then the density of
the plume would be 5 to 10 times lower.
We want to find an upper bound on the weight of iron contained in the entire plume using
the aerosol emission studies in order to directly compare to the weight of above-grade
steel from the towers. Therefore, the largest EPA iron density measurement will be used
in the calculation of the total amount of iron contained in the plume.
To find the amount of iron emitted from the rubble, we need to estimate the plume size as
it passes by the detector. We know that smoke and debris emanated from an area no
larger than 10 times the footprint of a WTC tower, or 4 x 10⁴ m
2. The plume traveled
with a lateral wind speed of about 10 mph (see “A. Manhattan wind-speeds from EPA”
reference section for a wind velocity chart in lower Manhattan), and rose vertically with a
velocity no greater than 10 mph (the angle of the plume with the horizontal was no larger
than 45 degrees). The volume per second passing the sampling stations is then (4 x 10⁴
m2) x Sqrt(2) x 4.5m/sec ~ 2.2 x 10
10 m
3/day. Combining this exaggerated plume volume
with the maximum measured density of iron measured by EPA gives an upper bound on
the total amount of iron emitted per day from the rubble:
27 µg/m3
x (2.2 x 1010
m3/day) ~ 600 kg/day
0.006.5130.21
2
3
4
5
6
7
8
9
10
11
12
13
14
15
16
17
18
19
20
21
22
23
24
25
26
27
28
29
30
31
October, 2001
0
0.5
1
1.5
2
2.5
3
Th
ou
sa
nd
s
Na
no
gra
ms/m
3
Silicon Calcium Iron Aluminum
New York Coarse Aerosols post Sept. 11, 2001UC Davis DRUM Data from 201 Varick Street
5.0 > Dp > 2.5 micrometers

- 14 -
Remember that this is an upper bound. Even with these exaggerations, this quantity of
iron represents no significant amount of steel from the two towers whose initial above-
grade steel weight was about 2 x (8.1 x 107 kg):
15
(600 kg / day) / (2 x 8.1 x 107 kg) ~ 0.0004% per day
If the rubble emitted iron at this grossly exaggerated level for an entire year, it would
only represent about 0.1% of the above-grade structural steel in the two towers.
The UC Davis Group and the EPA aerosol studies quantitatively support the claim that no
significant amount of steel was turned into dust from the rubble pile during the days,
weeks, and months following 9/11.
Part II: OSHA
OSHA acquired more than 6,500 air and bulk samples in lower Manhattan during the
entire clean-up operation. A subset was used to monitor metal exposure:16
OSHA has taken a total of 1331 samples (excluding bulk and blank samples) to
monitor worker exposures to dusts, fumes, oxides, and other compounds of metals
such as antimony, beryllium, chromium, cobalt, copper, iron, lead, manganese,
mercury, molybdenum, nickel, vanadium, zinc, cadmium, magnesium, and
arsenic. To minimize the length of the "WTC OSHA Heavy Metal Monitoring
Data tables" only the samples that showed detected results for these metals are
listed. Results from these samples are generally well below the applicable OSHA
limits. However, torch cutting and burning structural steel at the rubble pile have
resulted in instances of overexposures as follows: copper (17); iron oxide (28);
lead (19); zinc oxide (1), antimony (1); and cadmium (3). Accordingly, OSHA is
recommending that workers engaged in these operations wear appropriate
respiratory protection. See information below for the specific counts in regards to
mercury.
Over 640 aerosol samples which report iron-oxide content17
were taken in the immediate
vicinity of and directly on the debris pile beginning on September 22nd
and continuing
through June 12th
. Sampling consisted of a filter canister which was fitted in-line (as
depicted above) and either affixed to clean-up personnel or mounted in various places on
the rubble pile. The actual filter was either a mixed cellulose ester (MCE) filters (0.8-µm
pore size) or 37-mm polyvinyl chloride (PVC) filters with a pore size designed to capture

- 15 -
welding fumes.18
It is ambiguous in the reports which filter was actually used at ground
zero. A battery operated pump set to about 2 L/min pump rate forced air through the filter
canister.19
Each aerosol sample is representatively labeled as depicted below.
Quad Date Sampling# Task/Operation Sample Type Substance
Duration (min.)
Result mg/m3
SW 9/22/2001 20010922M41 TORCH CUTTER/BURNING Personal Iron Oxide Fume 201 0.2935
The fields are mostly self-explanatory. The ‘Sample Type’ field only included the
description ‘Personal’ or ‘Area.’ The ‘task/Operation’ field was many times left blank. I
subdivided the ‘Task/Operation’ into three categories: Iron workers, non-iron workers,
and unlabeled. I calculated the average density of iron oxide fume (weighted by the
duration of the sample) for each month. I did this for each category individually as well
as combined. The two resulting graphs are depicted below.
0
0.5
1
1.5
2
2.5
3
Av
era
ge
Iro
n O
xid
e (
mg
/m3)
Sep-01 Oct-01 Nov-01 Dec-01 Jan-02 Feb-02 Mar-02 Apr-02 May-02
OSHA Monthly Average Iron Oxide Aerosols
OSHA - Iron Oxide Aerosol Samples
0.0
0.5
1.0
1.5
2.0
2.5
3.0
3.5
4.0
Sep-01 Oct-01 Nov-01 Dec-01 Jan-02 Feb-02 Mar-02 Apr-02 May-02
Avera
ge Iro
n O
xid
e (
mg
/m3)
Non-Iron Workers
Iron Workers
Unlabeled
All samples which showed no detectable level of exposure of iron oxide were not
reported. Also notice that the iron workers were much more exposed to iron oxide fumes
than non-iron workers. This strongly suggests that the iron workers were generating large
amounts of iron oxide --- a rather obvious conclusion. Iron cutting produces massive
densities of iron oxide in the vicinity of the iron workers. Also, the tens-of-thousands of
Oxylance burning bars produced large amounts of iron oxide fumes (see supplemental
section “Rust-colored smoke”). All of these facts will result in a gross overestimate of the
actual iron oxide density emitted from the rubble pile directly.
The total average iron oxide exposure measured from the non-iron worker samples
(which does not preclude being in the vicinity of steel cutters) is 316 µg/m3, the total for
non-iron workers together with the unlabeled samples yields 835 µg/m3, and the total for
all 640 samples (left graph) is 1470 µg/m3. Since iron oxide is Fe2O3, this corresponds to
a density 221, 585, 1029 µg/m3 of elemental Fe.
Even though we know that the samples are grossly exaggerated due to the proximity of
workers to iron cutting as evidenced from the overexposure of iron workers, we use the
value of 1029 µg/m3 using the same assumptions as the previous section to calculate the
total weight of iron in the plume.
For a plume emanating from an area 10 times the footprint of a tower at a velocity of 10
mph with a cross wind of 10 mph at a density of 1029 µg/m3, we find the grossly
overestimated daily iron emission to be:
0.014% of above grade steel per day

- 16 -
If the rubble emitted iron at this grossly exaggerated level for the entire 9 months for
which sampling data exists, it would represent less than 4% of the above-grade
structural steel in the two towers.
For the non-iron workers who may have been less exposed to the direct effects of iron
cutting who measured an average exposure of 221 µg/m3 of iron, yields a plume emission
of 0.003% of above-grade steel per day, or about 0.8% of above grade steel if integrated
over the entire 9 month period.
The first 36 hours
Introduction
The previous sections reviewed quantitative dust and aerosol studies which show that no
significant amounts of iron were present. If steel was dissociated into dust and aerosols,
you would expect to physically find it! Literally none of the reported dust and aerosol
studies report any significant amounts of iron.
The photographic record shows that the debris on the ground the day after the collapses
was very similar to the amount of debris on the ground for the entire week. Since the
first dust samples were collected on 9-12 and 9-13 by McGee, if the steel vanished, it
would have had to be within the first 36 hours.
This section will systematically consider the following scenarios:
1. steel was turned into a gas and the hydrostatic pressure suspended the
particulates
2. the iron in steel was turned into a different element
3. steel was aerosolized and/or turned to dust during the collapse and went
somewhere else besides downward, meaning transported upwards and
outwards, and subsequently drifted on ambient air currents.
4. steel fell to the ground as large pieces and was transformed into aerosols
during the first 36 hours after the collapse
5. steel fell to the ground as large pieces and remained large pieces
The pertinent characteristics of the plume and dust clouds generated by the collapse of
the two towers are thoroughly reviewed in the photographic record as a slideshow
(flickr20
). A variety of points will be emphasized, but particularly important is the fact
that nothing --- gas, aerosols, dust, nor debris --- shot upwards during either WTC tower
collapses.
In a previous paper, I showed the physical impossibility of vaporizing the steel in the
towers into a gas.35
Ignoring this fact, the consequences of transforming the above-grade
steel into gaseous iron is the mass suffocation of everyone in the vicinity of ground zero.
The sudden generation of this massive amount of gas would result in a pressure of 42,000
lb/in2 throughout a volume the size of a WTC tower, the energy equivalent of blasting an
entire WTC tower to an altitude of 5000 m.
Changing the iron in steel into other elements involves nuclear reactions. This is shown
to be energetically impossible, and the radiation fallout from such an endeavor would
annihilate all life on earth.

- 17 -
The remainder of the section will analyze in detail the dust clouds and plume in order to
prove that the weight of the massive amount of steel in the WTC towers could not be
supported by air in any reasonable estimation during the collapses, and that
measurements of the debris clouds density quantitatively prove that no significant amount
of steel hung in the air during and after collapse, or drifted away on the prevailing winds.
The visibility (optical path length) through the generated dust clouds is directly measured
from photographs. The spires of the South tower are visible through the dust which hangs
in the air yielding the density of the cloud. Furthermore, Bill Biggart’s last surviving
photograph at approximately half an hour after the south tower collapse gives a direct
optical path across ground zero. Both measurements show that the dust in the air is an
insignificant amount compared to the weight of the towers.
All pertinent dust transport mechanisms are considered. By considering hypothetical
violently explosive vertical air jets and hot buoyant gases generated during the collapse, it
is quantitatively shown that no significant amount of weight of the towers could be
supported by air during collapse.
Dust was physically captured from the south tower debris cloud. The results reported by
Cahill (UC Davis group) from a shirt and a cloth carry-bag which suffered a direct hit
from the south tower debris cloud are consistent with both the size distribution and
chemical constituency of the bulk dust samples presented earlier in the paper.
Quantitative methods of estimating the size of particles from the post-collapse dust
clouds show that the vast majority of particles were larger than 1 µm. Since no significant
amount of weight of particles was located in the dust clouds which hung in the air nor in
the remnants from the low density turbidity flows (which I will also henceforth refer to as
“pyroclastic surge” clouds, a commonly known type of low density turbidity flow in air,
understood to mean without the usual accompanying high gaseous temperature) after the
larger debris settled (after about 5 or 10 minutes post-collapse), the average sized particle
generated from the collapses are found in the bulk dust samples. Therefore, average
particle sizes from bulk dust samples will be reviewed (EPA/McGee, USGS, and Cahill).
Rayleigh scattering effects are utilized to verify the particle sizes from photographs of the
debris clouds and plume. The white appearance of the post collapse dust cloud (after the
first few minutes when the larger particles have settled) when viewed from all angles
demonstrates that the vast majority of particles from the pyroclastic surge generated
clouds were larger than 1 µm. This is consistent with the bulk dust sample reports. The
plume emanating from ground zero a day or two after the collapses shows a bluish hue
indicating that smaller particles less than 1 µm were in abundance. This is consistent with
quantitative aerosol studies.
By the end of the section, all listed scenarios except the last are eliminated. By process of
elimination, the conclusion is the steel from the WTC towers merely fell to the ground in
large pieces. An exploration of the supporting evidence of this conclusion is reviewed
later in the paper.

- 18 -
Photographically characterizing dust clouds
I have chronologically organized 110 photographs from various perspectives to illustrate
various points. By navigating to the flickr20
website and clicking the “view slideshow”
button, all the time-stamped photographs with in-line notes can be chronologically
viewed. As soon as the slideshow begins, hit the “pause button” and click on the “i”
(which interactively appears superimposed on the photograph) to show the annotations.
The chronology with the associated time-stamp allows the viewer to intuitively gauge the
variations in perspective even though the differing views are of the same event. True
differences in the character of the debris plumes and clouds which develop over time can
be quickly and directly observed. Misleading perspectives as well as artifacts produced
by lighting and camera settings can easily be judged based upon other corroborating
photographs.
For completeness, I have appended in the reference section all of the thumbnail
photographs comprising the annotated slideshow. The main points emphasized are as
follows:
- The north and south tower plumes before collapse traveled virtually horizontally
with the prevailing wind over lower Manhattan
- The smoke emanating from the north tower blew directly over the south tower
and remained completely unperturbed during and after the collapse of the south
tower
- During the collapse of the north tower, no significant upward movement from
the generated debris is witnessed, and certainly never rose above the position of
the pre-collapse plume - During and immediately after both collapses, all debris moved horizontally
outward and downward due to the expulsion of air from the collapsing buildings.
Clouds of dust moved outward resembling a pyroclastic surge, a specific type of
low density flow to be discussed later, engulfing lower Manhattan. Generated air
currents responded to the local topology with some currents moving upward along
the face of buildings, while other air currents were channeled through the canyons
of NYC. Turbulence maintained particles in suspensions while concurrently
transporting the particles horizontally.
- As the debris flows slowed, the larger particles settled quickly leaving behind the
finer particles giving the debris clouds the appearance of a ‘diffuse’ cumulus-like
cloud. The resemblance, which will be discussed later, is not serendipitous: the
cloud density and particle sizes are comparable.
- Some of the smaller particles continued to be carried by the prevailing air
currents.
- The wind currents at 1400’ were about the same as those at 600’ since no
significant sheer forces manifested in elongated clouds.
- Fires in surrounding buildings began developing after the collapse of the north
tower which increased in intensity. As the original debris cloud settled and drifted
from ground zero, the whitish plume was replaced by a carbonaceous plume
mainly from fires in the vicinity of WTC 5, 6, and 7.
No debris, dust, aerosols, or gas shot upwards during the collapse of either tower!

- 19 -
Particle sizes
Obtaining an estimate of the size of the dust and aerosol particles becomes important in
our upcoming analysis regarding dust transport. The average particle size will impact the
following:
- estimates of the plume density based upon contrast measurements from
photographs
- the terminal velocity and the resulting effectiveness of wind currents to transport
the particles
- hydrostatic pressure and diffusion as dust transport mechanisms
- characterization of the horizontal dust transport mechanisms
The average particle size of the dust which settled on the ground will be reviewed which
was analyzed by EPA using samples collected by McGee, Lioy, and USGS. Dust trapped
in clothing as well as a cloth carry-bag directly impacted from the debris cloud generated
by the collapsing South Tower was analyzed by Cahill (UC Davis group).
The particle sizes measured in bulk dust and aerosol studies, as well as Cahill’s
measurement of the particles within the South tower debris cloud, will be shown to be
consistent with measurements of particle sizes derived directly from photographs
utilizing known Rayleigh scattering effects. All results will be shown to be consistent.
There is a distinct difference in scattering effects associated with particles smaller than
the wavelength of light compared to particles larger than the wavelength of light.
Rayleigh scattering is a very general phenomenon and explains why the sky is blue. The
lack of Rayleigh scattering explains why cumulus clouds and fog are white. The dust
particles created by the collapses were generally larger than the wavelength of visible
light and show no Rayleigh scattering effects, but the aerosols emitted by the plume
during the days and weeks following the collapse were much finer and clearly exhibit
Rayleigh scattering effects.
Part I: EPA and the McGee samples
We know from bulk dust sample studies that most of the dust which was collected on the
ground was of the very coarse variety. For instance, EPA acquired the same samples as
used in the McGee study (Part II: McGee et al dust study results10) and reported the
distribution of particle sizes by %-weight:21
Bulk samples of dust were sieved with a 53 micro-mesh screen …Analysis of the
weights found in the 4 size fractions showed that roughly half of the sample was
in the PM53 sieved fraction. Of the PM53 fraction, about 80-89% was in the 10 -
53 u size range… The amount of the 2.5 - 10 u fraction was very small (0.04 -
1.14 % of the PM53 fraction, except 3.23% in sample 13) and was therefore not
feasible to study. The PM2.5 fraction, however, was present in large enough
amounts (2.29 - 4.06% of PM53 fraction) to study for potential respiratory health
effects, and is toxicologically relevant since it is associated with epidemiological
findings of health effects in humans (Dockery et al., 1993). [The sum of the size
fraction percentages does not total 100% of the original PM53 fraction because
of loss of sample during fractionation steps.]
Summarizing, half the sampled dust (~50%) was larger than 53 µm, about 45% was
between 10 and 53 µm, about ½% between 2.5 and 10 µm, and about 1 to 2% smaller

- 20 -
than 2.5 µm. Some relatively small amount was lost in the filtering process but is
inconsequential for our purposes.
For the more discerning reader, let me emphasize that the distribution of particle sizes is
quoted as percent weight! This is distinctly different than the relative percentages which
will result in optical scattering effects. Optical scattering effects will depend directly
upon the average surface area of the particles (number density multiplied by the average
cross-sectional surface area which is proportional to r2), while percent weights are
averages over volume (mass density multiplied by the average particle volume which is
proportional to r3).
Part II: USGS22
Seven collected bulk dust samples were analyzed to determine the distribution of particle
sizes. Samples labeled USGS 4, 6, and 12 (see map in section Part I: USGS dust study
results8) were collected from ground level between September 16 and 17, 2001. Sample
USGS 36, was collected on September 12, 2001, from inside an apartment on the 30th
floor of a building. Samples LM2 and L18-2 refer to samples collected by Lioy:23Error!
Bookmark not defined. sample LM2 is an outdoor sample collected on September 16 or 17,
2001, approximately 0.70 km east of the center of the WTC site, and sample L18-2 was
collected indoors on November 19, 2001, from an area adjacent to the WTC site (0.25 km
west).
The dust samples were sieved through a 100-mesh screen. A scanning electron
microscope was used in the laborious process of measuring the area of many individual
particles. The resulting graph shows the relative percent abundance versus the cross
sectional area of the particle.
The particles are in a variety of shapes: fibers, spheres, flakes, vesicles, etc. For
simplicity, we would like to approximate the dust particles as spheres. We only require a
very rough approximation of the actual particle sizes in terms of the approximate

- 21 -
diameter of the particle. Since the above graph is plotted on a logarithmic scale, it is
difficult to judge the number of particles in a specified range of diameters. I replot the
above graph for sample USGS-4 (represented by the lavender curve):
Percent Fraction vs diameter assuming sphere
for sample USGS-4
0
5
10
15
20
25
30
35
40
0 2 4 6 8 10 12 14 16 18 20
diameter (um)
Pe
rce
nt
Fra
cti
on
Integrated Percent Fraction
for sample USGS-4
0
20
40
60
80
100
120
0 2 4 6 8 10 12 14 16 18 20
diameter (um)
No
rma
lize
d
Pe
rce
nt
Fra
cti
on
The plot on the left is the approximate distribution of diameter sizes for the USGS-4
sample. The plot on the right is the integration of the left graph normalized to 100% at 20
µm. The right graph shows that 50% of the particles are less than 4 µm in diameter, and
very few (<3%) are less than 1 µm. This is exactly what we need. The diameter of the
lighter dust which settled in great quantity is effectively in the vicinity of 1 to 10 µm.
Note that the particles larger than 20 µm were sieved from the sample, and represent the
majority of dust. The vast majority of the dust (>>99%) is substantially larger than the
wavelength of visible light (~0.5um). This distribution directly relates to the optical scattering cross section. The percent fraction of the optical cross sectional area was
actually measured in this study, and the distribution plotted versus diameter directly
relates to this measured scattering area.
We should note in passing that experimentally it is found that the higher elevation and
more distant samples from GZ are skewed toward finer dust size. This is consistent with
precipitated facies produced from low density flows which will be discussed later. That
is, lighter particles settle to the ground more slowly and are therefore transported further
before settling.
Although the USGS results are presented in terms of percent cross-sectional area, we see
that very little iron was measured compared to the abundant gypsum and concrete. Little
iron located in the bulk dust samples is completely congruous with our previous
discussion regarding bulk dust samples.

- 22 -
Part III: Cahill and UC Davis Group – South Tower dust cloud sampling24
The UC Davis group acquired dust samples from a cloth carry-bag as well as a shirt that
was directly hit by the expanding south tower dust cloud during collapse. Their results
are tabulated below as well as a relevant synopsis of their aerosol study presented earlier
in this paper (Part I: EPA14 and UC Davis13).
Around the Pile, 10/3/01
Coarse particles (12 to 2.5 microns), 11% of sample Very fine aerosols (0.26 - 0.09 microns), 20% of sample

- 23 -
70. 1% aggregate
5.8% gypsum
4% cement
4% chlorine
3.9% sulfur
12.2% other
78% Sulfuric.
14% Metals
7% Glass fumes
0.5% Chlorine,
cement, and gypsum
The airborne debris directly emanating from the south tower which was in the PM10-2.5
fraction was 85% of the sample, leaving the PM2.5-.26 fraction in the vicinity of 15%.
This quantitatively shows that the dust directly emanating from the south tower at ground
level was very similar to the settled dust since the large majority of particles by weight
were much larger than the wavelength of visible light.
This is in stark contrast to the aerosol plume produced by the smoldering debris pile. In
the Cahill aerosol study, we note that our previous analysis showed that very little weight
was associated with the smoldering plume. The particles in the plume consisted of mostly
finer particles: the PM2.5-.26 fraction composed about 70% of the sample and the
PM0.26-.09 fraction was about 20%. Many more particles were smaller than the
wavelength of visible light in the aerosol plume emitted by the rubble pile during the
days and weeks following the collapse of the towers. The large number of particles which
are less than the wavelength of visible light will affect the scattering properties which we
now explore.
Part IV: Characterizing approximate particle sizes from photographs
Rayleigh scattering is a type of scattering which involves particles which are substantially
smaller than the wavelength of light (particles less than ~ 0.05 µm).61
The intensity of
scattered light from such small particles is a strong function of angle and wavelength of
light. The geometry is shown in the diagram below:25
4
62 )cos1(
λθ
d
I
I
o
+∝ where d is the particle diameter, Ө is the angle depicted, λ is the
wavelength of light from the sun, and I/Io is the intensity of light scattered to the
observer.
Rayleigh scattering favors shorter wavelengths at large off-angles and explains why the
sky is blue! In relevance to our particular circumstances, Rayleigh scattering is
maximized at 90 degrees and strongly favors blue light.

- 24 -
For particles larger than ~5 µm, the scattering intensity is wavelength independent for
visible light. That is, the scattered light is white when viewed from all angles. Cumulus
clouds are white since the water particles are typically between 3 and 30 µm.55
In the intermediate range, between about 1 and .1 µm, there is weaker wavelength
dependent scattering which gives rise to possible bluish hues associated with an aerosol
plume.
Summarizing, if a cloud viewed at a 90 degree angle is bluish, the particle sizes are
submicron. If the debris cloud appears white from many different angles in direct
sunlight, then the abundance of particles are larger 1 µm.
Before recklessly evaluating the color and brightness of debris clouds generated by a
WTC tower collapse based upon photographs, there are some very important
considerations:61
The plume air light is a strong function of scattering sun angle. A plume viewed in
forward scatter will appear bright against the sky or background targets. The
same plume can appear dark against the sky and bright against dark targets at
scattering angles greater than 30 degrees. Detailed calculation for models
requires particle concentration and size information for the plume and similar
information or extinction measurements for the surrounding atmosphere.
Increases in extinction resulting from plume absorption, from soot or NO2, for
example, will make the plume darker at all sun angles.
Suspended particles generally scatter much more in the forward direction than in
other directions. This fact means a plume or haze layer can appear bright in
forward scatter (sun in front of observer) and dark in back scatter (sun in back of
observer) because of the angular variation in scattered air light (Figure 2-24).
This effect can vary with background sky and objects.
Objects in the shade will appear bluish since they are mainly illuminated by the ambient
scattered light in the sky which is predominantly blue.
Here is a picture of the aerosol plume emanating from the GZ rubble pile following a day
or two after 9-11 viewed at an angle of about 90 degrees (Rayleigh scattering effects will
be maximized at this angle). Direct sunlight illuminates the plume as well as a white

- 25 -
reference building which has about the same optical path length which we use as a white
reference. Definitively, the particles in the aerosol are in abundance below 1 µm due to
the bluish color of the plume. This measurement visually verifies Cahill’s results.
(Left) A day or two after 9-11, the plume has an obvious bluish tint in direct sunlight when viewed at an angle of 90 degrees
with respect to the sun demonstrating that a significant fraction of particles in the plume are smaller than 1 µm. The inset
shows the plume color compared to a white reference, both of which have about the same optical path length. (Right) Although
only one angle is depicted (west and slightly south of GZ), the white color of the debris cloud when viewed at all angles in
direct sunlight show that the particles which hung in the air after the collapse of both towers were greater than 1 µm.
The picture on the right is taken a few minutes after the north tower collapsed which was
initially located at the approximate center of the photograph and stood twice as high as
the depicted debris cloud. The time is approximately 10:30 AM, so the sun-cloud-camera
angle is around 40 degrees. Some forward scattering is occurring causing the cloud to
look a little brighter against the blue sky. However, the resemblance to a cumulus cloud
is obvious from multiple camera angles. Although some camera views show the cloud to
be grayish which is wholly expected from variations in background and viewing angle,
there is no direct sunlit view (out of the shadows) showing a blue tint. This means that the
majority of particles during and immediately after collapse are larger particles (greater
than ~1 µm). Most of this dust eventually settles to the ground as observed from
photographs and videos, and reinforced by physical principles --- the mass supportable by
non-turbulent air currents is miniscule as will be shown later. The bulk dust samples
show the vast majority of particles are much larger than 1 µm which is certainly
consistent with the observed white debris clouds.
The particles in a typical cumulus cloud are anywhere from 3 to 30 µm in diameter, so
the white appearance is an inherent optical scattering effect. After the turbulent winds
generated from the collapse died down and coarser material settled from the air, the
similarity to a cumulus cloud is uncanny. For the sake of comparison, the density of a
cumulus cloud is 1.0 g/m3 of water.
26 Later in this section, we will use optical path length
measurements from photographs to derive the density of the debris cloud which hung in
the air is less than 0.6 g/m3, less dense than a cloud!
All known vertical dust transport mechanisms
All mechanisms in which air might vertically lift dust and aerosols will be explored in
this section. If the above-grade steel in the towers were instantly aerosolized, is there any
reasonable method in which the air could support the weight? The answer is a resounding
negative.
- 26 -
Diffusion and hydrostatic pressure as mechanisms of dust and aerosol transport will be
shown to be negligible. Air currents are the dominating modes of dust transport which
can be generated by buoyant forces (leading to convection), explosive events, or ambient
weather conditions.
In a previous publication, I show the impossibility of vaporizing the WTC towers by any
known directed energy beam and the absurdly large power requirements.35
In reference
section “H1. Gases and hydrostatic pressure gradients,” the consequences of vaporizing
the above-grade steel into a gas are considered. A solid is much denser than gas. Instantly
converting the above-grade solid steel to a gas would create a very dense gas or,
equivalently, a gas under incredible pressures. The sheer number of particles, if
transformed from a solid to a gas, would exert a pressure of 42,000 lbs/in2 over the entire
volume of the WTC tower! This pressure would be energetically capable of launching a
tower like a bottle-rocket to an altitude of 5000m! Furthermore, iron is extremely reactive
with oxygen. The elemental iron gas would explode outward in all directions and
immediately combine with the oxygen in the air. All the ambient oxygen in the vicinity of
GZ would have literally been sucked out of the air, tightly locked-up in iron-oxide
(Fe2O3) molecules, suffocating thousands of people. None of this was observed, so the
steel was not turned to a gaseous state. Hydrostatic pressure gradients only apply to
gases, and in references section “H1. Gases and hydrostatic pressure gradients,” it is
shown that the tiniest of particles (greater than a few nanometers) do not behave like a
gas.
Diffusion is a phenomenon which results from Brownian motion-type collisions. As it
turns out, a 1nm size particle only travels about 1.3mm in an hour via diffusion (see
reference section “H2. Diffusion and terminal velocity” for details). The diffusion rate
decreases as particle size increases. Obviously, dust and smoke clouds which begin to
look hazy after about a half hour after collapse is not due to diffusive processes.
Turbulent mixing as well as the larger debris settling out of the debris cloud resembles a
“diffusively generated” cloud. For the sake of our discussion, diffusion does not play a
significant role in dust transport.
How fast do dust particles settle out of the air? The speed at which dust particles settle, or
the terminal velocity, is directly dependent upon the particle size. The smaller the
particle, the longer it will take for the particles to settle from air since the viscous drag
forces increasingly dominate. The terminal velocity is the same as the vertical wind
velocity needed to exactly levitate a particle.
The terminal velocity for a particle in air is proportional to r2 where r is the radius of the
particle (see reference section H2. Diffusion and terminal velocity for details). For a 100
µm sphere of iron, the terminal velocity is approximately 5 mph. A 1 µm sphere would
only travel at 0.2 mm/sec! Clearly, vertical components of air velocity can easily
suspend µm size particles. However, there are limitations to the total weight supportable
by air currents regardless of particle size which we now consider.
Since vertical air currents of sufficient velocity are able to suspend large dust particles,
what net weight can be suspended by an explosive event at the towers? Even though the
photographic record conclusively demonstrates that no significant vertical air currents
were generated in the upward direction during collapse (flickr27
), if a massive

- 27 -
hypothetical air jet in the upward direction is considered, how much weight of dust could
be physically support?
An upper bound on the net weight of particles which can be levitated by a vertical air jet
can be calculated. This is an upper bound since supporting the maximum weight would
completely halt the upward moving air current. Suppose an air jet shoots straight up
uniformly across the area of a tower footprint. Since we are only interested in an upper
bound, we ignore that the air jet would slow down due to drag with the surrounding air as
well as the drag experienced from any stationary air above the jet. If the net upward
momentum from all the air particles in the vertical jet is completely consumed by
supporting a maximum weight of particles, what mass would it be? In the reference
section “H3. Air jets,” we find that the maximum mass supportable by the pressure
generated by the air jet obeys the relation M ~ ρair v2 area where ρair is the density of air,
v is the velocity of the air jet, and area is footprint of a tower. A 100 mph air jet
emanating across the entire footprint of the tower shooting straight up would only be
able to levitate a maximum of half a percent of the weight of a tower.
Another way to analyze the same phenomenon is to calculate the energy flux associated
with the same air jet. Again, we assume a lossless air jet which converts the kinetic
energy of the air jet into lifting power. The energy of the same 100 MPH air jet would
only be able to lift a maximum of 1% of the total mass of above grade steel the height of 1 tower during the collapse time (see “
H3. Air jets”).
Obviously, no where near a 100 mph velocity air jet shot upwards during or after collapse
as evidenced by the photographic record (flickr). The immediate conclusion is
extraordinarily large vertical air currents hypothetically generated during the collapse
could not physically support or vertically transport a significant amount of weight of
the towers upwards.
In normal prevailing wind currents, updrafts can occur for several reasons, but there
exists only two fundamental forcing factors.28
The topology on a large scale (landscape)
and small scale (texture of landscape) can force a horizontal laminar air current to acquire
vertical velocity components. Laminar air flows which encounter an uphill grade, for
instance, will force the air upwards. A laminar air current flowing over a rough surface
will produce turbulent flow which causes local, time dependent vertical components of
velocity. The turbulence can completely dominate the terminal velocity entraining and
lifting particles that would otherwise quickly settle.
In the specific case of the WTC towers, topological forcing factors (pyroclastic surges
which flow over adjacent buildings) obviously lift horizontally moving particles upwards.
However, the topology only lifts the low density flow to a maximum altitude of roughly
half the original height of the WTC towers as may be verified by the photographic record
(flickr). The prevailing wind currents were very much horizontal at that altitude in the
vicinity of GZ as evidenced by many photographs (in particular, see photographic
number 2a, and 13c through 14c).
The outward turbulent air flow in the pyroclastic surge is the main mechanism for
transporting large dust and debris outwards. The horizontal transport, or low density
flow, of dust and debris will be explored later in the supplemental section entitled
“Horizontal dust transport: Low density flows”.

- 28 -
The second forcing mechanism creating updrafts in the prevailing winds is associated
with changes in air density. This concept is expressed as Archimedes principle, also
known as buoyancy. Hot air is less dense than cool air, and humid air is less dense than
dry air. Less dense air rises and can cause vertically moving convective air currents.
If the “hot air + dust” weighs less than the surrounding cooler air, then the dust will be
lifted. The air ejected from the towers is presumed to be warmer than the surrounding air.
The size of the particle is irrelevant to the argument. The maximum weight of debris that
can be lifted is the difference in weight between the hot air generated and the surrounding
air.
If this maximal weight is hypothetically suspended in the buoyant air plume, then the air
would not rise but would remain stationary. If the net weight of all the particles is less
than the maximum amount of weight supportable by the ambient air, then the air would
rise. Rising hot air can cause vertical air currents which then can entrain other particles.
However, the maximal net amount of energy (work) which the rising buoyant plume
consumes, including the energy lost in generating vertical air currents, can not exceed the
maximum work performed by the buoyant force. This maximum calculable work energy
achievable by the hot air is equivalent to the maximum debris carrying capacity times the
debris displacement.
The density of air as a function of temperature is listed in the reference section “G. Air
Properties”.29
The table indicates the density of air changes by 0.26 kg/m3 when the air
temperature increases from 20°C to 100°C, the boiling point of water. The air could not
have become much hotter than 100°C since many people survived the debris cloud
without suffering heat strokes and burns. The maximum weight of dust that the air can lift
during collapse is found by estimating the volume of the dust cloud during collapse and
multiplying by the change in air density generated by the heat. The dust cloud volume
during collapse was no greater than 10 times the volume of the tower (~1.7 x 10⁶ m
3).
The maximum weight supportable by the warmer, less dense air is 10 x 1.7 x 106 m
3 x
0.26 kg/m3 = 4900 tons. A tower weighed 240,000 tons,
15 so the air could only support
approximately 4900/240,000 ~ 2% of the weight of the building during collapse.
Even if we consider that the temperature rose to 100°C during the collapse (which is
much higher than expected based upon the existence of people who survived the dust
cloud), the percentage of the towers which could be buoyed by air during collapse is only
2%. The above-grade steel accounted for less than half of the weight of the towers. Since
at least half of the dust was other pulverized material like concrete and wallboard, the
result is that much less than 1% of the structural steel could have been buoyed by air during the collapse. More than 99% of the structural steel from the towers had to move
downward based upon Archimedes principle.
Some people may get the idea that I am stating that dust can not be transported upwards.
Nothing could be further from the truth. What I have done in the above analysis is show
that the towers are indeed massive, and that all known transport mechanisms which may
lift dust and aerosols vertically are miniscule in comparison to the energy required to lift
a significant fraction of the weight of the towers during collapse.

- 29 -
Visibility measurements (optical path length)
Photographic evidence shows that no significant amount of dust or debris rose above the
original height of the towers during or immediately after collapse. Debris was transported
outwards and downwards. It was shown in the previous sections that all known dust
transport mechanisms could only support a tiny fraction of a tower’s weight even if the
entire tower was unrealistically aerosolized. The vast majority of debris must have
physically moved downward. In this section, specific optical measurements of the density
of the debris cloud during and after the collapse are consistent with our previous analysis
--- the amount of weight in the air during and after collapse is miniscule compared to the
weight of the towers.
In this section, we analyze three photographs and measure a quantitative upper bound on
the amount of steel in the dust cloud and plume. The first is a measurement of the density
of the debris cloud which hangs in the air around the spires of the South tower during
collapse. The second measures density of the dust in the air at GZ 30 minutes after the
collapse of the South tower. The third measures the density of the plume emanating from
the rubble in the late evening of the following day.
By measuring the relative intensity of light which traverses a cloud of particulates, an
upper bound on the density of the cloud or plume can be acquired. If one can recognize
shapes through the cloud of particulates, then at least some of the photons must have
traversed the cloud ballistically from the object to the observer. By measuring the relative
intensity of the object from photographs, one can derive the density of the plume.
However, there are some pitfalls to be avoided in performing an estimate of the amount
of iron which may hypothetically be located in the air:
1) Firemen spraying the debris with water will generate large amounts of steam and
will lead to a gross overestimate.
2) Any carbon-combustion smoldering underneath the debris pile will lead to an
overestimation since carbon aerosols are very absorbing in the visible spectrum.
3) Inhomogeneous clouds may lead to errors.
4) Massive fires which occurred after the collapse of the North Tower from WTC 5,
6, and 7, as well as smaller localized fires from Banker’s Trust and peripheral
fires need to be avoided since they literally pump tons of absorbing carbon soot
into the air.
5) Lighting angle of the dust can greatly affect the contrast between an object and
the background. When light is back reflected off of the dust and into the camera,
it can washout the effect since more light will be reflected off the dust in the air
and into the camera. Consideration must be given to the amount of light
backscattered off of particles. This effect will overestimate the density of particles
in the plume.
6) To estimate the density of particulates which hang in the air for extended periods
of time, a sufficient amount of time needs to have elapsed after the collapse to
allow the very coarse particles to settle from the debris clouds.
7) The analysis will assume a perfectly black object on a perfectly white background
which is not the case in actuality; the real life conditions decrease the optimal
contrast between background and object which increases the minimum visibility
threshold.

- 30 -
Every single one of these effects (with the possible exception of point 3) will
overestimate the density of the iron particulates produced by the collapse and rubble pile.
The photographic record reveals that the debris cloud and plume change character over
time. Also, the characteristic shade depends upon the camera angle relative to the sun
(see section “Part IV: Characterizing approximate particle sizes from photographs”).
However, some generalizations can be made based upon the photographic record
(flickr).20
The pertinent sequence is as follows:
1) Pre-collapse, a mostly horizontal carbonaceous plume was generated from fires
from both towers.
2) Collapse of the south tower generates airborne dust, but a thick fire generated
plume continues emanating from the north tower. There is about 30 minutes for
much of the dust to settle and blow southwardly before the north tower collapse.
3) During and immediately after the north tower collapse which generated dust, the
remnant plume from the upper level fire remained for a time until it is gradually
blown southwardly.
4) Dust begins to settle from the north tower collapse, but concurrently fires grow in
intensity from WTC 5, 6, and 7.
5) Smoke profusely emanates from WTC 5, 6 and 7 from about 1 hour after the
collapse of the north tower until WTC 7 collapses about 7 hours after the north
tower collapse. Most firefighting occurs on the north side of GZ apart from
extinguishing smaller peripheral fires. The wind direction shifts about 30 degrees
eastward in the late afternoon before WTC 7 collapses.
6) Dust is generated from the collapse of WTC 7 while WTC 5 and 6 remain burning
for some time.
7) Nightfall, and no useful photographs characterizing dust occurs during this time.
8) The day after 9/11, all above ground fires are extinguished and the smoldering
rubble piles are hosed down with water generating much water vapor.
I have found three photographs which circumvent many of the above-mentioned
problems. The first is a photograph by Aman Zafar showing the remaining south tower
core columns in the middle of the remnant dust cloud during collapse. The density of the
surrounding dust cloud hanging in the air around the spires is measured. The second
photograph is Bill Biggert’s last surviving photograph a minute before the collapse of the
north tower, and about 30 minutes after the collapse of the south tower. No large fires are
burning above ground, no fire responders are extinguishing fires on the rubble generating
steam, the distance of objects in the photograph can be measured, little backscattering
occurs washing out the effect, 30 minutes worth of coarse dust has settled from the air
after the collapse of the South Tower, and the plume emanating directly from the South
Tower’s footprint (blowing in a southwardly direction) as well as from much of the
scattered rubble is sampled along the optical path. The wind is known to be blowing
directly from the north tower to the south tower from the pre-collapse plume, and this
prevailing wind direction would have blown any plume generated from the south tower
rubble directly at the Banker’s Trust building.
An upper bound on the mass density of the dust cloud based upon the optical scattering is
given by the following (see reference “H4. Optical path lengths in dust clouds”):
xrIILnP /)/(3/4 0ρρ =

- 31 -
From photographs, we can measure a lower bound on the relative drop in intensity I/Io.
The distance that the light travels through the dust suspended in air, x, can be measured.
The density of the particles is assumed to be huge, the density of iron which is 7800
kg/m3. The diameter of particles will be assumed to be the average size particle analyzed
in the previous section (see section “Particle Size”), ~4 µm. All numbers will be
exaggerated to find an upper bound on the density of the dust cloud.
During the collapse of the south tower, spires remained standing for a number of seconds
after the rest of the building had collapsed. Forward scattering from the sun enhances the
brightness of the cloud which maximizes the contrast with the standing spires. Here, we
ignore the bottom part of the building obscured by the horizontal outward debris cloud
which obscures about 20% of the base of the tower and only consider the debris which is
hanging in the air above that point. The outline of the core structure can easily be made
out. The contrast is measured to be very small, so I use the minimum I/Io of 2% (see “H4.
Optical path lengths in dust clouds” for details). The width of the debris cloud can be
seen based upon how much of the 1 Liberty Street building is blocked out by the
illuminated debris cloud. The radius of the debris cloud is about 2 WTC widths. Using
these numbers, I find a debris cloud density of 5.7 x 10⁻⁴
kg/m3. The debris cloud
generated from the collapse occupies a volume of less than 10 WTC volumes; therefore,
the debris hanging in the air around the spires during the collapse of the South Tower
is only 0.004% of the weight of the entire tower.
The photograph is Bill Biggart’s last surviving photograph which was taken about 30
minutes after the collapse of the South tower just before the North tower collapse. The
amount of dust in the air is mixed with particles which are still settling from the South
tower collapse. Fires and the smoldering rubble eject particles which we assume to be
iron particles. These effects will grossly overestimate the amount of steel which may be
hypothetically dissociating.
The height of the Banker’s Trust building is 570’.30
The horizontal distance between
Biggart and the base of the Banker’s Trust building is about 4 WTC tower lengths, so the
angle of inclination to the top of the building is about 35 degrees. The optical path length,
x, is underestimated to be the path length between the Banker’s trust building roof and
WTC 3 which gives a length of about 230 meters (which includes the angle of
inclination). The contrast between the lighter background and the black Banker’s trust
building is measured to be 18% which is equal to I/Io (see reference H4. Optical path
lengths in dust clouds for the procedure). Using the aforementioned values for the radius
of particles and density of iron, the density of the cloud is found to be 1.0 x 10⁻⁴
kg/m3.
Remember, this is a gross over-estimation of the density of the dust cloud. This optical
path directly samples the particles in the plume generated by dust emitted from South
tower debris field since the prevailing winds would carry the south tower emission
directly into the Banker’s Trust building.
If this density of debris cloud is assumed to be completely composed of iron and emitted
from an area defined by 10 times the footprint of a WTC tower at a vertical ascent rate of
10 mph upwards (the angle of the plume compared to the horizontal prevailing winds ---
which were less than 10 mph --- was less than 45 degrees) for a duration of 24 hours (all
exaggerations), the weight of emitted particles is calculated by
ρvAreatM ∆=
resulting in a value of 2.3 x 10⁶ kg/day, or 1.4 % above-grade steel/day. This is a gross
overestimate, a ridiculously large upper bound on the amount of steel directly measured

- 32 -
in the plume based upon the optical path length. We see that 30 minutes after the south
tower collapsed, the amount of dust in the air which was entrained in the air currents,
even if all of it was considered to be steel particles, was less than 1.4% above-grade
steel/day.
The following evening of September 12th
, another photograph was taken in which little
backscattering occurs and the visibility through the dust cloud can be estimated. The
photograph of the USNS Comfort arrives at sunset on September 12th
.31
Much water is
being sprayed upon the rubble generating a large amount of water vapor, and the rubble
pile smolders from large amounts of fuel load (the aerosol studies clearly evidence a lot
of plastics, paper, office furniture, etc. burning). The Millennium Hilton Hotel is used as
the black reference object. The outline of the building is clearly visible. The optical path
length, x, through the aerosol cloud is estimated to be 4 WTC tower widths and I/Io is
measured to be 5%. Note that the background is dark giving a much smaller contrast
which will greatly overestimate the aerosol density (see reference “H4. Optical path
lengths in dust clouds” for details). With all other values assumed the same as previously
discussed and assuming all particulates in the air are iron, we find a similar cloud density
upper bound of 1.7 x 10⁻⁴
kg/m3 translating to 1.7 % of above grade-steel from both
towers per day.
From all optical path-length measurements, much less than 1.7% of above grade steel per
day could have been emitted from the debris once it hit the ground during the first 24
hours based upon representative optical path length measurements. Please keep in mind
that this is a wildly over exaggerated upper bound, where we assume all the emitted dust
and aerosols in the air are iron! The cloud literally hanging in the air during the collapse
of the South tower shows a miniscule, insignificant amount of debris by weight in the air
surrounding the spires.
After the first 24 hours, it is apparent based upon comparing photographs of the rubble to
photographs taken on 9-11 and 9-12 that no appreciable amount of steel then disappeared
or disintegrated.

- 33 -
(Top) layout of ground zero with pertinent viewing angles shown. Red depicts the view perspective
for the bottom picture, and blue depicts the view on the next two photograph on the next page
(Bottom) Bill Biggart’s last photograph after the South Tower collapse and about 1 minute before the
North Tower collapse. Foreground building is WTC 3 with the visible background Banker’s Trust
building. The white smoke cloud appears whiter nearer the bottom due to light scattering effects
rather than gross density effects. The face of the Banker’s trust building is slightly illuminated due to
backscattering from the south-eastern morning sun direction.

- 34 -
(Top) During the collapse of the South Tower, the core columns can be observed within the dust
cloud (Bottom) USNS Comfort arrives in NYC during sunset on 9/12/01. The World Financial center
buildings are in the foreground, and the tall skinny black building on the far right behind the plume
is the Millennium Hilton Hotel.

- 35 -
Alchemy and nuclear reactions
Transforming one element into another is historically known as alchemy. Since the
1930s, it has been known that transforming one element into another element is
accomplished via nuclear reactions. The idea that large amounts of iron atoms
transformed into other elements through the use of a ‘secret weapon’ blatantly violates
tenets of known nuclear physics. In this section, I will illustrate but a few of these
violations.
An element is defined by the number of protons in the nucleus. The number of neutrons
defines the isotope. For example, hydrogen has 1 proton, helium has 2 protons, and iron
has 26 protons. The most common isotope of iron found at about 92% abundance
contains 30 neutrons. The number of nucleons (protons plus neutrons) in an iron nucleus
is 56 also known as the atomic number. The only way to convert iron into a different
element involves either fusing or splitting the nuclei of iron atoms.
The nuclear binding energy per nucleon of all the elements is plotted versus atomic
number. The nuclear binding energy is a measure of how tightly the nucleus is held
together. As depicted, iron has the strongest nuclear binding energy per nucleon of all the
elements.
Fission reactions (splitting nuclei) used in nuclear reactors release a net amount of energy
only if the reaction products have a higher binding energy than the initial reactants.
Therefore, heavy elements like plutonium-239 or uranium-235 are used in nuclear fission
reactors. The resulting fission products from such reactions have atomic masses around
100. The difference in nuclear binding energy per nucleon can be read off the graph and
is roughly ½ MeV per nucleon. If uranium is used as a fuel, then the total amount of
energy released per atom by a fission reaction would be about 235 x ½ MeV.
However, since iron is at the peak of the graph, any kind of fission reaction would
necessarily cost a huge net amount of energy. There is no way around this fact.

- 36 -
For instance, any method of splitting an iron nuclei (breaking it into at least two other
elements) will cost at least 1 MeV per nucleon. Since iron has 56 nucleons, this is at least
56 MeV per iron atom. One iron atom weighs ~56 amu ~ 9.3 x 10⁻²⁶
kg. The number of
iron atoms in the above-grade steel from both towers is ~2 x 8.1 x 107/(9.3 x 10
-26) ~ 1.7
x 1033
. The minimum energy required to cause the structural steel in the towers to
transform via any fission reaction would necessarily be at least 1.7 x 1033
x 56 MeV ~ 1.6
x 1022
J. This is equal to the total energy harnessed by human beings over the entire
globe integrated over the next 50 years or, equivalently, the energy released by 37 thousand of the largest nuclear bombs ever built!
32
Fusion occurs when two nuclei are combined. For instance, if two hydrogen-2 nuclei
were hypothetically fused together to form Helium-4, the energy released per nucleon can
be read off the graph, namely 7-1=6 MeV per nucleon. This would be 24 MeV per atom
released.
However, for fusion to occur at room temperature, atomic nuclei must overcome the
repulsive Coulomb energy (like charges repel). The minimum amount of energy required
for a hydrogen nuclei (one proton of positive charge) to overcome the Coulomb repulsion
of an iron nuclei can be calculated. Since an elemental iron has a nuclear radius, r, of
about 4.5 fm,33
the energy required to overcome the Coulomb energy per iron atom is
proportional to Qproton x Qiron / r ~ 1.3 x 10⁻¹²
J where Qproton is the charge of a proton and
Qiron is 26 times Qproton. The total energy required to overcome the repulsive Coulomb
energy for all the above-grade steel in the towers would be equivalent to at least 70 years
of the total energy output of the earth! The associated temperature of atoms with the
required average kinetic energy to overcome the Coulomb energy for fusion to occur
would be 7000 times the temperature in the core of the sun.34
Besides the absurd energy requirements to split or fuse iron nuclei (the most tightly
bound nuclear element), there are many other problems associated with massive numbers
of nuclear reactions which would be required to convert the structural steel into other
elements. The nuclear reactions and resulting ‘excited state’ product nuclei would
assuredly emit massive amounts of high energy radiation and particles. The energy scale
we are talking about is literally tens of thousands of 100 mega-ton nuclear bombs.
Imagine the nuclear radiation and fall out! The inevitable result of such a device would
have been the complete and utter instantaneous annihilation of all life in lower
Manhattan, and most likely all life on earth.
Summary of section
A review of the photographic record shows that no debris launched vertically upwards
during either collapse of the WTC towers. The steel could not have been vaporized to a
gaseous state and maintained consistency with observations. An analysis of all the
physical mechanism which can transport dust and aerosols upwards prove that no
significant amount of weight of the towers could be supported by air during the collapse.
Cahill obtained samples which were directly hit by the dust cloud from the South tower
collapse, and no significant levels of iron were detected. Iron in steel could not have been
transformed into another element. Visibility measurements showed that the density of the
cloud which hung in the air during the collapse of the South tower was miniscule, and the
amount of debris emanating from the rubble measured 30 minutes and 36 hours after the
collapse of the South tower at GZ was insignificant.

- 37 -
Over the first 36 hours, no appreciable amount of steel disappeared into the air. Bulk dust
samples and aerosol studies prove than no steel was subsequently present in elevated
quantities.
In short, the steel did not dissociate in any significant quantities. The only conclusion is
that the steel fell to the ground in large pieces.
Evidence steel fell as large pieces As I have definitively demonstrated, the structural steel did not dissociate. In this section,
I present all the physical evidence that steel fell in large pieces. Photographs of the
amount of debris in sublevels across the footprint of the tower show that the majority of
the debris from the towers fell straight down. Measurements of the net amount of debris
and the net amount of steel removed from GZ are consistent with the weight expected if
no material disappeared.
Some proponents of DEW-demolition persistently cling to the notion that photographs of
the rubble at GZ do not show sufficient debris to account for the WTC towers and
conclude that something mysterious must have happened to it.
Most of the debris from the towers likely occupied the sublevel collapses as has been
quantitatively explained.35
Damage assessment schematics issued by the Mueser
Rutledge Consulting Engineers36
clearly show approximately 1/3rd
of the total volume of
the sublevels was collapsed or heavily damaged while another 1/3rd
of the total volume
was not assessed. If only 1/3rd
of the volume was filled with debris, then this would
assuredly account for all the ‘missing’ debris. Furthermore, at least 350,000 tons of steel
were reported to be removed from GZ to landfills and recycle centers.37
The number of
truck loads (over 100,000)38
which transported material from GZ is consistent with the
expected amount of debris generated. Martin J. Bellew, Director of the Bureau of Waste
Disposal at the New York City Department of Sanitation, reports over 1900 barges were
used to transport the material from 59th Street and Hamilton Avenue Marine Transfer
Stations, Pier 6, and Pier 25 totaling 1.6 millions tons of debris removed from GZ:39
At the peak of the operation, approximately 10,000 tons of material were
delivered daily to the [Fresh Kills] site… approximately 200,000 tons of steel
were recycled directly from Ground Zero to various metal recyclers. The Fresh
Kills Landfill received approximately 1.4 million tons of WTC debris of which 200,000 tons of steel were recycled by a recycling vendor (Hugo Neu Schnitzer).
The remaining material, approximately 1.2 million tons of WTC debris, was
landfilled on the western side of Section 1/9 at the Fresh Kills Landfill in a 40-
acre site.
The project had come up to speed quickly, processing from 1,750 tons per day of
debris in mid-September to 17,500 tons per day by mid-October. Average
throughput over the duration of the project was 4,900 tons of debris processed
per day.
The last WTC debris was received at the Fresh Kills Landfill on July 29, 2002. On
September 3, 2002 the project was completed.

- 38 -
The United States Army Corp of Engineers (USACE) immediately arrived on the scene
and helped organize and coordinate the debris removal from GZ:40
During the next couple days, the debris team coordinated with NYC to devise a
Debris Removal Action Plan for FEMA that would show the progress of debris
removal and would allow tracking the tonnage of debris being removed. On
Sept.17th, 10 debris specialists were deployed to work with Allen Morse and Beau
Hanna in monitoring the debris operations for FEMA. On Sept.19th, the debris
team was tasked to provide 15,000 load tickets and train the city personnel in
their use and 4 engineers were deployed to develop an overall debris estimate.
Two days later, the possibility of dumping the debris to the ocean was explored
but the EPA rejected the idea and Staten Island was chosen as the landfill area.
On Sept. 23rd, 12 debris specialists started debris monitoring. USACE completed
its part of the Debris Operations Plan on Sept. 23rd and turned the operations
over to FEMA at the DFO. The official joint estimate of the total debris amount
was released at 1.2 million tons. The discussions with NYC and FEMA regarding
the City’s request for the USACE to manage the debris disposal site began on 25
Sept. By the end of 29 Sept., approximately 145,000 tons of debris was removed
from the WTC site inclusive of the steel designated for recycling. As of 21 May
2002, 1,625,550 tons of debris had been removed from the WTC site.
The Mueser Rutledge Consulting Engineers damage assessment schematics show that all
6 sublevels (7 stories) across the entire footprint of the towers likely collapsed. I will
show in the remainder of this section that the photographic record of GZ debris removal
from September 2001 through May 2002 clearly depicts all sublevels directly beneath
both towers collapsed and filled with debris. The amount of debris which compacted into
the sublevels across the footprints of the towers will be shown to be the majority of the
material associated with the towers.
Many DEW-demolition proponents use erroneous interpretations of photographs to argue
that a massive amount of debris from ground zero is ‘missing’ which inherently assumes
that almost no sublevel collapses occurred. Most of the photographs that are used to
justify this claim do not offer insight into the amount of debris located in the sublevel
collapses for the simple reason that visible light can not penetrate the rubble pile.
However, as GZ debris removal progressed, debris from the collapse of the towers and
surrounding buildings was unearthed and photographs were taken. A time-lapsed record
graphically shows the debris located within the footprint of the towers. As it turns out,
debris filled nearly the entire volume beneath the footprint:

- 39 -
Un-sourced picture of the WTC tower lobby. Notice the location of the cross supports along the
exterior column ‘tridents’ with respect to the ground level.
South Tower viewed from the south on Warrington Street. Note the debris stack is at least two to
three stories above street level when viewed from this perspective. Photo was taken well before
9/23/01 (compared to the 9/23/01 NOAA satellite image41
).42

- 40 -
October 5, 2001: South tower (looking east). Note the debris stacks are well above the ground level
associated with the lobby.43

- 41 -
October 17, 2001: North tower. Much surface debris has been removed, but notice the compacted
debris in the sublevels.44
October 17, 2001: South tower. It is evident that debris resided at least in the first few sublevels as
well as filling 1 to 2 levels of the lobby based upon this photograph.45

- 42 -
(Left) Foundation of exterior columns during construction (right) 3-11-02: South tower lower level.
All levels down to the foundation were filled with debris.
The key on the left, measured in feet, shows ranges of elevation of the debris which are color-coded:
-75 to -55, -55 to -35, -35 to -15, -15 to 5, 5 to 25, 25 to 50, 50 to 75, 75 to 100, 100 to 150, 150 to 200,
200 to 300, 300 to 400, 400 to 1381. Although the LIDAR maps are coarsely quantized in height, note
the excellent agreement with WTC 7 debris mound and the contour plot compiled by the author
from photographs.35
The estimate of an average 2 story debris height for the North Tower and 1
story debris height for the South Tower based upon photographs of the rubble are consistent with
the LIDAR topology map.46

- 43 -
If all the sublevels beneath the footprint of the towers were filled with material as the
above photographs show, how much debris does this represent?
Using a volumetric compression ratio of 11.6% based upon the collapse of WTC 7,35
and
knowing the original volume of the WTC tower was 110 stories + 7 stories of sublevels,
the amount of debris occupying the sublevel collapses across the footprint of a tower was:
7 stories/.116/(110+7 stories) = 52%
In the case of the North tower, I conservatively estimate the surface debris pile to be at
least 2 stories high on average across the footprint:
9 stories/.116/(110+7 stories) = 66%
In the case of the South tower, I conservatively estimate the surface debris pile to be at
least 1 story high on average across the footprint:
8 stories/.116/(110+7 stories) = 59%
The results show that the majority of the material from the towers fell on their footprints. A significant percentage (~40% to 35%) landed outside the footprint.
Certainly, some of this debris caused collapses and filled some of the surrounding
sublevels as assessed by the Mueser Rutledge Consulting Engineers36
and affirmed by the
reported 350,000 tons of steel removed from GZ to landfills and recycle centers37
as well
as the total number of truck loads (over 100,000)38
and barges (over 1900)39
which
transported over 1.6 million tons of material39,40
from GZ.
Conclusion DEW-demolition proponents argue that the vast majority of the steel in the WTC towers
was turned into dust. USGS, McGee, and EPA quantitatively measure and report that no
significant amount of steel was dissociated into dust. A review of the photographic record
clearly shows that no gas, dust, or aerosols shot upward during or after the collapse. An
analysis of all reasonable dust transport mechanisms which might have lifted dust
vertically prove that air could not support a significant amount of weight of the towers
during or immediately after collapse. Visibility measurements performed during the
collapse of the South tower, thirty minutes after the collapse, and 36 hours after the
collapse show the density of the dust which hung in the air was miniscule. UC Davis,
EPA, and OSHA aerosol studies quantitatively prove that no significant amount of steel
was aerosolized in the rubble pile during the days and months which followed the
collapse. Iron in the steel was not transformed into another element. In short, there was
no significant amount of steel dissociated at any time at Ground Zero.
The steel simply fell to the ground in large pieces during the collapse. More than 50% of
the debris generated from the collapse of the towers was located in the 6 sublevels
directly beneath the towers as revealed by photographs of debris removal and
corroborated by damage assessment schematics produced by the Mueser Rutledge
Consulting Engineers.36
The expected amount of steel removed from GZ is affirmed by
the reported minimum of 350,000 tons of steel removed from GZ to landfills and recycle
centers37
as well as the total number of truck loads (over 100,000)38
and barges (over
1900)39
which transported 1.6 million tons of material39,40
from GZ.

- 44 -
A summary of the current arguments compiled from the author’s current and previous
reports35
which have not been addressed by DEW-proponents are as follows:
• Quantitative dust measurements by the USGS, EPA, and McGee prove that only
0.6% +/- 2% of the structural steel dissociated into dust. A thorough analysis of all
vertical debris transport mechanisms quantitatively proves that less than 1% of the
structural steel could be supported by air during collapse. EPA, UC-Davis, and
OSHA aerosol studies quantitatively prove that only a tiny fraction of 4% could have
dissociated in the rubble during the days, weeks, and months following the collapses.
• The photographic record contradicts the notion that gas, dust, aerosol, or debris shot
upwards during either collapse of the WTC towers (flickr20
).
• All dust transport mechanisms considered are utterly incapable of vertically lifting
any significant fraction of the tower’s weight (diffusion, hydrostatic pressure, massive
air jets, buoyancy and convective air currents, and topological forcing factors from
prevailing air currents).
• Visibility measurements of the density of the debris clouds surrounding the South
Tower spires during collapse, the dust cloud at ground zero 30 minutes after the
collapse of the south tower, and the plume emitted from the rubble pile 36 hours later
all were quantitatively shown to be miniscule compared to the weight of a tower.
• Dust sampled directly from the south tower pyroclastic surge showed no significant
level of elevated iron content.
• Elemental iron could not be transformed into other elements due to the energy
requirements: at least 37,000 100 mega-ton nuclear warheads worth of energy for
fission to occur, and an average particle energy equivalent of 7000 times the
temperature of the sun’s core to overcome the Coulomb energy for fusion to occur.
• The amount of power required to dissociate the steel in one WTC tower, not
including any energy loss mechanisms, is well over 5 times the power output
harnessed by human beings from the entire globe. Conservative estimates of energy
losses swell the power requirements to at least 1000 times the earth’s power output.
Obviously, no known power source is even remotely capable of accomplishing this
feat.
• No aircraft or space-based platform could reflect (or generate) such a beam since the
opposing thrust would be equivalent to over 1100 (or 500) space shuttles at maximum
burn, respectively. No known reflector could survive the intense energy flux.
• If steel was dissociated into a gaseous state, a massive pressure equivalent of 42,000
lb/in2 over the entire volume of a WTC tower would have developed which is the
energy equivalent of launching the tower like a bottle-rocket 5000m straight up into
the air. The elemental iron would have immediately reacted with the oxygen in the
area, locking it away in Fe2O3 molecules, over a volume 75 times as large as the
volume of a tower suffocating anyone in the vicinity of ground zero.
• Sublevel collapses together with minimal surface debris easily account for all the
debris from the WTC towers, WTC 4, WTC 3, and holes in WTC 6. The sublevel
volume directly beneath the towers which was filled with debris accounts for more
than 50% of the debris from the towers. The total amount of steel removed from
ground zero as recorded by landfills and recycle centers (350,000 tons) and the total
number of truckloads (over 100,000)38
and barges (over 1900)39
which transported
over 1.6 million tons of material39,40
from GZ are consistent with the amount of debris
expected.
• No known directed energy beam can possibly match the observed destruction of the
WTC towers:

- 45 -
o Symmetry of collapse
o No expected optical effects were manifested from the astronomical
intensity: air ablation, optical distortions from heated air, bright flashes
from super-heated steel, etc.
o No known energy beam could simultaneously penetrate the thick dust
during collapse, energetically heat steel sufficiently, and not massively
scatter into the surrounding area.
o In the case of the North Tower, the antenna dropped first; indicating an
internal structural failure.
o Eyewitness testimonies of explosions occurring before collapse initiation
• The volumetric compression expected from collapsed steel-framed buildings matches
the amount of debris observed in the holes in surrounding buildings as well as from
partially collapsed surrounding buildings. Furthermore, the damage is consistent with
the impulse forces generated from falling debris. The presence of jagged edges,
rectangular holes, and right-angle corners in photographs directly contradict the
claims of proof as a result of DEW damage: circular holes. However, the entire
methodology is hopelessly flawed as shown by other isometric photographic
perspectives of building damage.
• Seismograph readings do not directly correlate to the potential energy of a building in
any fundamental way for reasons which have previously been cogently explained.35
Applying the same erroneous scaling arguments used by DEW-proponents (scaling
the potential energy and the consequent hypothetical release of seismic energy in a
linear fashion) to WTC 7 leads to the conclusion that less than 6% of the building hit
the ground: the seismic energy readings were 87 times less and the potential energy
was 5 times less that of the WTC towers, so 5/87 ~ 5.7%. If we then use the
arguments from DEW proponents that 80% of the towers did not hit the ground, then
only 1% of WTC 7 hit the ground and was present in the rubble pile!
• Non-catastrophic bathtub damage is a natural result of minimal surface waves
generated during the collapse of the WTC towers as recorded by seismograph
readings.
• Other phenomena which have been ascribed to DEWs which supposedly support the
hypothesis such as burning vehicles, spontaneous disintegration of materials, intact
paper, ‘dirt,’ rust-colored smoke, and videos allegedly showing disappearing acts of
steel, were either shown to be egregiously wrong or that much more plausible
explanations exist.

- 46 -
References
A. Manhattan wind-speeds from EPA47
B. Manhattan wind-speeds from Cahill et al13

- 47 -
C. Data from reported EPA aerosol study in lower Manhattan
http://www.epa.gov/wtc/metal/

- 48 -
D. McGee10 bulk dust samples: table 3
E. EPA9 bulk dust samples: table 5
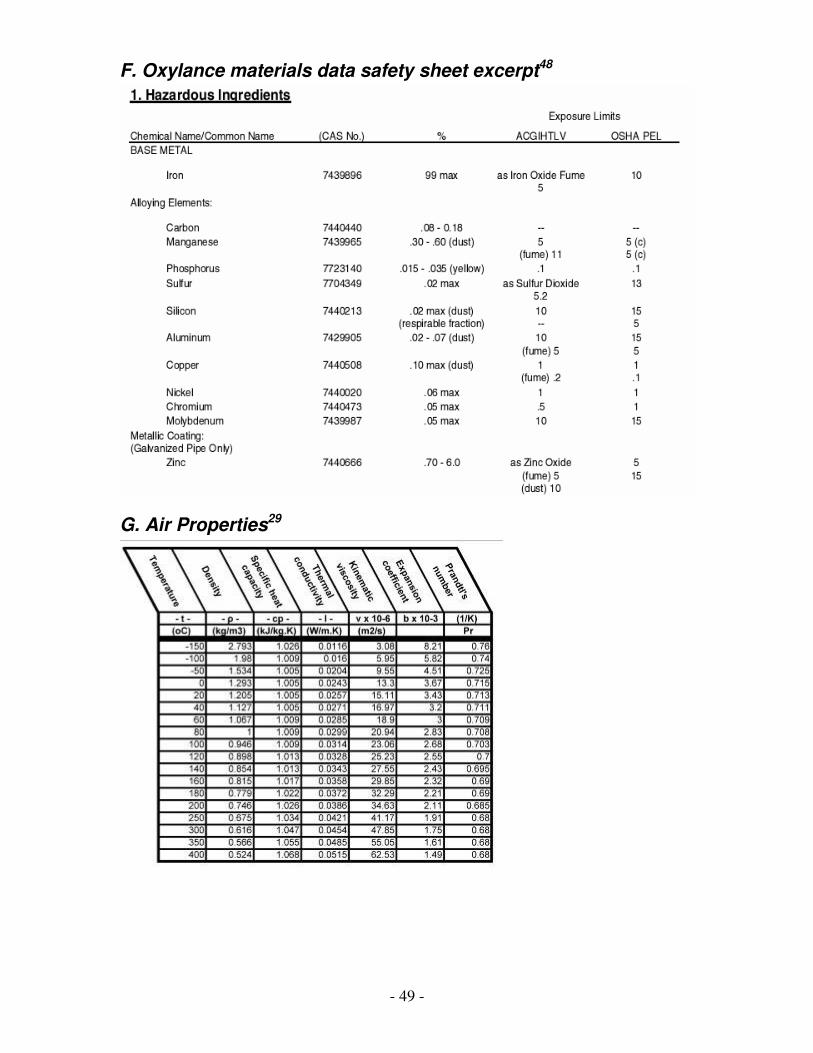
- 49 -
F. Oxylance materials data safety sheet excerpt48
G. Air Properties29

- 50 -
H. Derivations
H1. Gases and hydrostatic pressure gradients
Why do gas particles like oxygen (O2) and nitrogen (N2) remain ‘airborne’ in the
atmosphere? After all, gravity is constantly pulling them down, so what is keeping the
particles from accelerating straight down? Collisions with other particles! Since these
particles are extremely light, their kinetic energy dominates over the gravitational
potential energy. However, even gases such as oxygen and nitrogen are affected by
gravity which is demonstrated by the lower density of particles at higher altitudes. The
density gradient, synonymous with the ‘hydrostatic pressure’ gradient, can be calculated
via the well-known thermodynamically derived expression:49
kTmgykTmgy
eyey/
0
/
0 1/)(/)( −− −=∆→= ηηηη
That is, the change in density of gas particles ∆η(y) decreases as a function of height y
relative to the density at ground level ηo. T is the temperature of the gas and m is the
mass of a gas particle, and g and k are the gravitational acceleration and Boltzmann
constants, respectively. For O2, the difference in density between the bottom and the top
of a WTC tower is about 5%.
NASA measured the changes in air pressure (which is exactly equivalent to relative
changes in density) which show that air pressure is halved with an increase in altitude of
5400m.50
This result agrees well with our formula. The discrepancy between
measurements and the formula is mainly due to variations in the relative amounts of the
constituent elements which compose air as a function of altitude. However, if we
consider oxygen and nitrogen, the formula yields a composition in gas density of 51%
and 46%, respectively. This is in good agreement with the NASA measurements.
Larger particles which weigh significantly more than elemental or diatomic gases can not
remain airborne by the same mechanism as lighter gas particles (Brownian motion-type
collisions). For ‘still’ air (no air currents) at room temperature, the density of an iron
oxide (Fe2O3) gas would be 24% less at the height of the tower compared to the ground!
The density of iron oxide particles which are ~10 nm in diameter at a height of 1 meter
would only be 0.1% of the density compared to ground level (using a density of iron
oxide of 5250 kg/m3)51
. Obviously, particles greater than about 1 nm or so in diameter are
much too heavy to behave as a gas and to remain suspended in a colloid due to Brownian
motion.
What would happen if all the steel in the towers was vaporized and turned into elemental
iron? Recall, I show in my previous paper that the physical process of performing such a
feat is impossible.35
However, ignoring the physical impossibility, what would one expect
to observe if the iron were actually dissociated into a gas?
If the steel in the entire volume of a tower were suddenly converted into gaseous
elemental iron, the gas would exert a pressure of about ~42,000 lb/in2 exploding in all
directions! This pressure is about 10 times the pressure in a common compressed gas
cylinder! The derivation of this result is straight forward. The ideal gas law is given by
PV=NkT where P is pressure, V is volume, N is the number of particles, T is the
temperature, and k is the Boltzmann constant. The number of iron particles in the above-
grade steel from a WTC tower is equal to the weight of above-grade steel divided by the
weight of an iron particle, or 8.1x10⁷ kg/56 amu = 8.7 x 10
32 Fe particles. At a
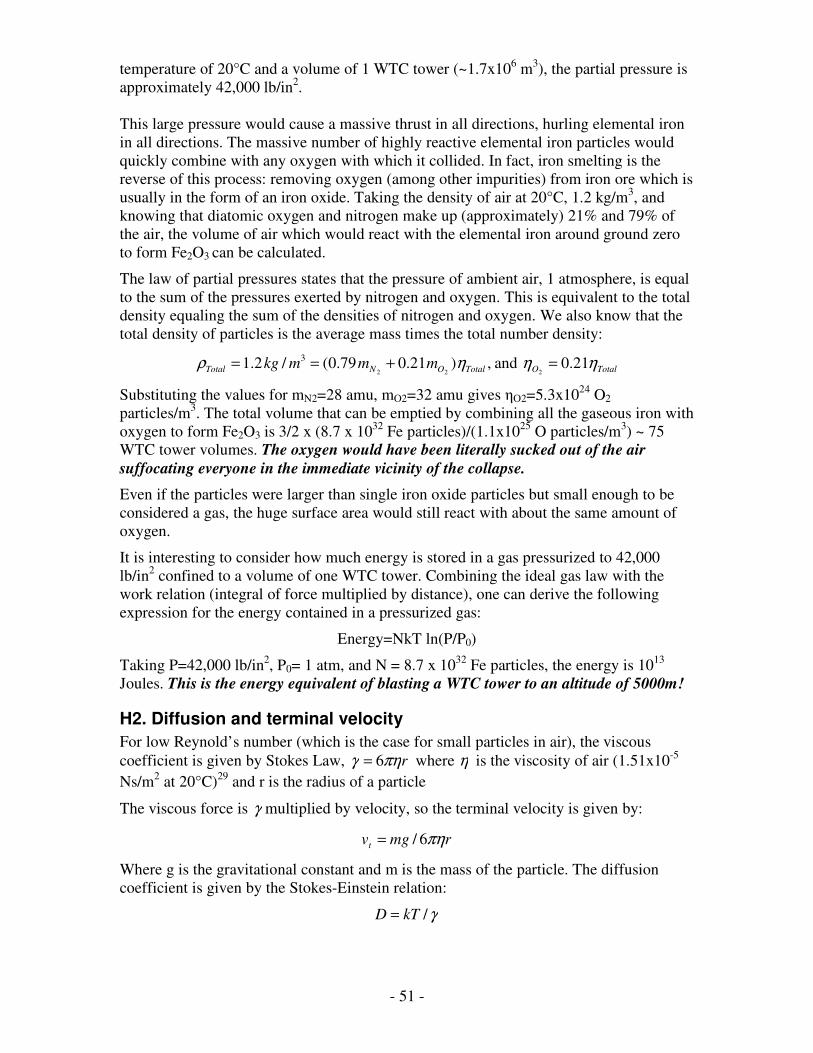
- 51 -
temperature of 20°C and a volume of 1 WTC tower (~1.7x10⁶ m
3), the partial pressure is
approximately 42,000 lb/in2.
This large pressure would cause a massive thrust in all directions, hurling elemental iron
in all directions. The massive number of highly reactive elemental iron particles would
quickly combine with any oxygen with which it collided. In fact, iron smelting is the
reverse of this process: removing oxygen (among other impurities) from iron ore which is
usually in the form of an iron oxide. Taking the density of air at 20°C, 1.2 kg/m3, and
knowing that diatomic oxygen and nitrogen make up (approximately) 21% and 79% of
the air, the volume of air which would react with the elemental iron around ground zero
to form Fe2O3 can be calculated.
The law of partial pressures states that the pressure of ambient air, 1 atmosphere, is equal
to the sum of the pressures exerted by nitrogen and oxygen. This is equivalent to the total
density equaling the sum of the densities of nitrogen and oxygen. We also know that the
total density of particles is the average mass times the total number density:
,)21.079.0(/2.122
3
TotalONTotal mmmkg ηρ +== and TotalO ηη 21.02
=
Substituting the values for mN2=28 amu, mO2=32 amu gives ηO2=5.3x1024
O2
particles/m3. The total volume that can be emptied by combining all the gaseous iron with
oxygen to form Fe2O3 is 3/2 x (8.7 x 1032
Fe particles)/(1.1x1025
O particles/m3) ~ 75
WTC tower volumes. The oxygen would have been literally sucked out of the air
suffocating everyone in the immediate vicinity of the collapse.
Even if the particles were larger than single iron oxide particles but small enough to be
considered a gas, the huge surface area would still react with about the same amount of
oxygen.
It is interesting to consider how much energy is stored in a gas pressurized to 42,000
lb/in2 confined to a volume of one WTC tower. Combining the ideal gas law with the
work relation (integral of force multiplied by distance), one can derive the following
expression for the energy contained in a pressurized gas:
Energy=NkT ln(P/P0)
Taking P=42,000 lb/in2, P0= 1 atm, and N = 8.7 x 10
32 Fe particles, the energy is 10
13
Joules. This is the energy equivalent of blasting a WTC tower to an altitude of 5000m!
H2. Diffusion and terminal velocity
For low Reynold’s number (which is the case for small particles in air), the viscous
coefficient is given by Stokes Law, rπηγ 6= where η is the viscosity of air (1.51x10⁻⁵
Ns/m2 at 20°C)
29 and r is the radius of a particle
The viscous force is γ multiplied by velocity, so the terminal velocity is given by:
rmgvt πη6/=
Where g is the gravitational constant and m is the mass of the particle. The diffusion
coefficient is given by the Stokes-Einstein relation:
γ/kTD =

- 52 -
where k is the Boltzman constant and T is temperature. The root-mean-square change in
position as a function of time t for diffusive processes involving small particles is given
by:
tDX RMS 2=
For a 1 nm size particle at room temperature, RMSX = 1.3 mm/hour. For larger particles,
the diffusion length is even less since rX RMS /1∝ . For dust and aerosols in the case of
the WTC tower collapse, the diffusion lengths are negligible compared to other transport
mechanisms.
The terminal velocity associated with a specific material whose density is ρ with a radius
r can be found as follows:
η
ρπρ
23
9
2)3/4(,
rgvrvolumevolumeM t =⇒=⋅=
This result agrees with the reported settle time for a 10 and 0.5 um soot particles falling 1
foot (using the density of carbon which is approximately 2267 kg/m3)52
of just under 1
minute and about 5 hours, respectively.53
Also, if we compare with the terminal velocity
of a 10 µm radius water particle (density of water is about 1 g/cm3), we arrive at 0.3
cm/sec consistent with other authors.54
H3. Air jets
If all the upward momentum from all the air particles in a vertical jet is completely
consumed by supporting a maximum weight of particles, what mass would it be? The air
jet would cease moving upwards since all the net upwards momentum would be
consumed in supporting this maximum weight. We now calculate that maximum mass.
The force exerted by the jet is given by the following:
tvMtPF JetJetJet ∆∆=∆∆= //
∆P is the net change in momentum of the vertical component of the air jet occurring in
the time interval ∆t. The maximum amount of weight supportable, Mmax, is given by the
force balance FJet= g Mmax. Note that ∆vJet is the initial velocity of the jet, MJet = ρair Vair,
where Vair = area x ∆y is the volume of air which is arrested in time ∆t. Combining gives
the following:
2
max/ JetAirJetAirtJet vg
areaMtyareavF ρρ =⇒∆∆=
For a jet of cross sectional area of a tower (~4000 m2) traveling at a velocity of 100 mph
vertically upward with an air density at STP ~ 1.2 kg /m3 and g =9.8 m/s
2 gives Mmax
~106
kg ~0.5% of the total weight of a tower.
The above is an upper bound since all the upward momentum of the jet is consumed in
levitating mass Mmax.
Another way to approach the same problem is to consider the rate of energy flux from
such a jet of air, and compare that to the rate of energy required to lift the building mass.
The energy flux associated with a stream of air is given by the following expression:
32 )2/1()/()2/1()/(/ JetAirJetJet vtareavMtareaKEareaPower ρ=∆⋅=∆⋅∆=

- 53 -
If all of this energy is consumed, then the air current will stop moving, so we calculate an
upper bound on the amount of work which can be used to lift a given mass. For the same
air jet (100 mph across the footprint at STP), then the power per footprint = 2.5 x 10⁸
Watts. If this jet was emitted straight up for the duration of the collapse time of about 13
seconds, then the net energy associated with the jet is 3.2 x 10⁹ Joules. The amount of
mass which may be lifted a height h is given by E = m g h, or h = E / m g. For the entire
mass of the building, the amount of energy associated with our jet would only lift the
building up 1.5 meter, or the above-grade steel mass about 4 meters. The amount of
energy in the jet would only lift 1% of the mass of above-grade steel the height of 1 tower
(1350’). Please keep in mind that these results are upper bounds since it is assumed that
no energy is lost from viscous effects between the jet and entraining air or air above the
jet, heat loss, or turbulence, and the total amount of energy in the jet is completely
converted into lifting energy which would complete halt the flow.
H4. Optical path lengths in dust clouds
A photon is normally incident on a slab of area L2 and width dx. The volume contains a
certain number density of particles, η, whose average cross sectional area is σp. The
photonic wavelength is assumed to be the smallest length scale in the problem and is
considered to travel ballistically. The probability of the photon being stopped by the
particles is given by:
Probability of stopping photon in length dx = area occupied by particles/ total
area dxLdxL PP ησησ == 22 /)(
The transmitted intensity is proportional to the number of photons which make it through
the slab. The drop in the number of photons after traversing the slab is given by:
dxIdI Pησ=− ,
or upon integration and applying the condition that the initial intensity is Io and the slab
has a total thickness x gives:
xPeIIησ−= 0 , or equivalently, )/()/( 0 xIILn Pση =
Note that the optical path length is defined as 1/ η σp. We want to calculate the total mass
in a dust cloud given that shapes are optically discernable after traversing the cloud. The
decrease in contrast of the object behind the cloud compared to the reference background
will measure the drop in intensity.
However, first we need to do some re-arranging and some substitutions. We begin by
defining ρ as the mass density of the cloud of particles, Vp as the volume of an average

- 54 -
size particle, ρp as the density of the particle itself, and r as the radius of a particle. Re-
arranging the previous equation gives:
ηπρρηρ 3)3/4( rV PPP == and 2rP πσ =
Using the above two relations to eliminate σp and η from our previous formula gives:
xrIILnP /)/()3/4( 0ρρ =
If we consider a moving cloud which emanates from a surface of a specified area at a
vertical velocity v, then the rate of volume emission is dV/dt = Area v. The rate of mass
emission is then given by dM/dt = ρ dV/dt = ρ Area v. Integrating over some finite time
duration, ∆t, we find the total mass emitted from the surface:
ρvAreatM ∆= , or more explicitly, )/(3
40 IILn
x
rvAreatM P ∆= ρ
For a cumulous cloud, the density of water is ρ = 16 g/m3 and the size of the typical water
particle is in the range of r = 3 to 30 µm.55
The density of water is about ρp ~ 1 g/cm3=10
6
g/m3 (ice is about 10% less dense).
56,57
The optical path length in a cumulous cloud is then given by:
rrr
rl PP
p
6
2
31 103.1
3
4)3/4()( ×==== −
ρ
ρ
πρ
πρησ
Therefore, )/(103.1)/( 0
6
0 IILnrIILnlx ×−=−= . For the ballistic intensity to drop to
I/Io=0.01, and r=10 µm, we find x = 61 meters. Making out features in a cumulus cloud
out to 60 meters is near impossible as anyone who has ascended in a plane through a
cloud has witnessed. At best, to see any features on the ground when ascending through a
cloud would be more likely in the vicinity of 30 meters at most.
As an aside, the weight of a cumulous cloud is miniscule compared to the weight of a
tower. The weight of a cumulus cloud which occupies a volume of 100 world trade center
towers would only weigh about 0.08% of the weight of 1 tower.
Experimentally, the drop in intensity in which an object might barely be seen in a cloud
of particulates has been found to be 2% under ideal conditions, but most modern studies
use 5% in real-life situations. 58,59,61
This is known as the visibility threshold. Note that
the visibility threshold can be experimentally found by analyzing the contrast of a black
object located some distance from a viewer compared to a bright background. Brightness
is defined as proportional to the intensity and contrast is defined as the relative difference
in brightness between object and background. Although the visibility threshold depends
upon the f-number of the optical system, usually the naked eye or camera, changing the f-
number only affects the derived result logarithmically. This means that the visibility
threshold will not change appreciably with geometry.
Please note that for the case of a black object, the contrast between a white background
and a black object is derived elsewhere to be -I/Io, known as the Lambert-Beer law.59
I
quote the result since the derivation is a bit involved and defer the interested reader to the
references.60
and
61
The criteria used here was originally formulated by Koschmieder in
1924 but shown to be correct in a variety of circumstances:
lxVisibility Threshold ×=≡ 921.3
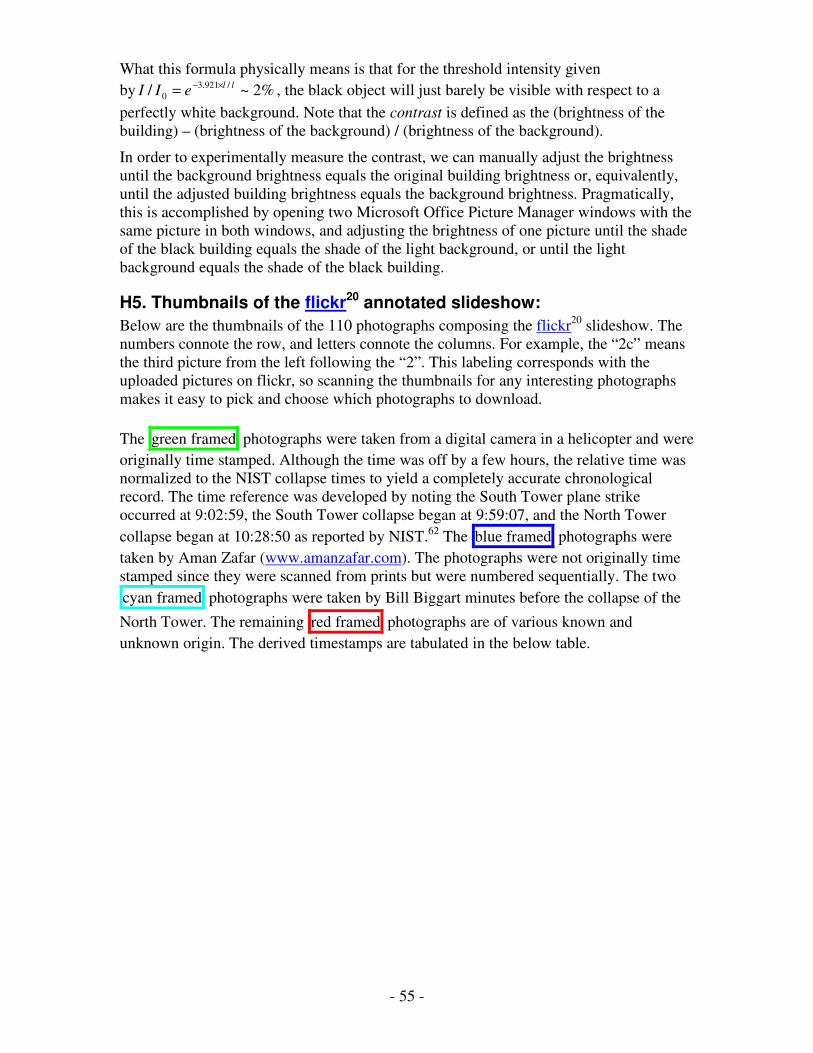
- 55 -
What this formula physically means is that for the threshold intensity given
by %2~/ /921.3
0
lleII
×−= , the black object will just barely be visible with respect to a
perfectly white background. Note that the contrast is defined as the (brightness of the
building) – (brightness of the background) / (brightness of the background).
In order to experimentally measure the contrast, we can manually adjust the brightness
until the background brightness equals the original building brightness or, equivalently,
until the adjusted building brightness equals the background brightness. Pragmatically,
this is accomplished by opening two Microsoft Office Picture Manager windows with the
same picture in both windows, and adjusting the brightness of one picture until the shade
of the black building equals the shade of the light background, or until the light
background equals the shade of the black building.
H5. Thumbnails of the flickr20 annotated slideshow:
Below are the thumbnails of the 110 photographs composing the flickr20
slideshow. The
numbers connote the row, and letters connote the columns. For example, the “2c” means
the third picture from the left following the “2”. This labeling corresponds with the
uploaded pictures on flickr, so scanning the thumbnails for any interesting photographs
makes it easy to pick and choose which photographs to download.
The green framed photographs were taken from a digital camera in a helicopter and were
originally time stamped. Although the time was off by a few hours, the relative time was
normalized to the NIST collapse times to yield a completely accurate chronological
record. The time reference was developed by noting the South Tower plane strike
occurred at 9:02:59, the South Tower collapse began at 9:59:07, and the North Tower
collapse began at 10:28:50 as reported by NIST.62
The blue framed photographs were
taken by Aman Zafar (www.amanzafar.com). The photographs were not originally time
stamped since they were scanned from prints but were numbered sequentially. The two
cyan framed photographs were taken by Bill Biggart minutes before the collapse of the
North Tower. The remaining red framed photographs are of various known and
unknown origin. The derived timestamps are tabulated in the below table.

- 56 -
1
2
3
4
5
6
7
8

- 57 -
9
10
11
12
13
14
15
16

- 58 -
17
18
19
20
21
22
23
24

- 59 -
25
26
27
September 12th
:
28

- 60 -

- 61 -
Bibliography
1http://drjudywood.com/articles/DEW/StarWarsBeam7.html: “Our critics have accused us of insisting that
beam weapons did their damage from outer space, yet we make no claim about whether the directed energy
weapon operated from a space-, air-, or ground-based platform. Nor do we make any claim about what
wavelength(s) was used, what the source(s) of energy was, whether it involved interference of multiple
beams, whether it involved sound waves, whether it involved sonoluminescence, whether it involved
antimatter weapons, whether it involved scalar weapons, whether it was HAARP (more here and here),
whether it involved a nuclear process (e.g. NDEW, more info), whether it involved conventional directed
energy weapons (cDEW), whether it involved improvised directed energy weapons (iDEW), nor what kind
of accelerator was used, nor do we claim to know what the serial numbers of the parts that were in the
weapon(s). What we do claim is that the evidence is consistent with the use of high-energy weapons that go
well beyond the capabilities of conventional explosives and can be directed.” 2http://drjudywood.com/articles/DEW/StarWarsBeam3.html: “While it has been reported that much of the
steel was removed from the site, sold to China, and loaded onto barges, and sent to China to be melted
down, the steel could not have been removed this fast. So, if it was not shipped to China overnight, where
did the steel go? Most of it was not on the ground, initially; so it had to have been suspended in the air.”;
http://drjudywood.com/articles/DEW/StarWarsBeam2.html : using a flawed analysis of the Ricther scale
readings, Wood concludes “2/11th of the mass of WTC1 would have the same PE as the Kingdome”
and, therefore, this is the amount of mass corresponding to large chunks from the tower which hitt
theground. That is, Wood erroneously concludes that 9/11th, or 81%, of the towers either never hit the
ground or landed as dust. http://drjudywood.com/articles/DEW/StarWarsBeam4.html: “Figure 57. Some
debris has been cleared, but the pulverized dust is still emerging. If most of the steel from the upper
floors of WTC1 and WTC2 was pulverized, then how much steel was really shipped as scrap to
China?”; http://drjudywood.com/articles/DEW/StarWarsBeam6.html “Figure 87(d). On the afternoon of
9/11/01 the "rubble pile" left from WTC1 is essentially non-existent.” & “Figure 87(e). The "rubble pile"
from WTC1 is essentially non-existent.” http://drjudywood.com/articles/DEW/StarWarsBeam7.html: “7.
The upper 80 percent, approximately, of each tower was turned into fine dust and did not crash to
the earth” as stated in her ‘conclusion’ section. Also quoted: “In fact, the data refute theories a to e–
natural, arson, official, conventional and thermite demolition–in particular the intact bathtub, minimal
seismic impact, and "dustification" prove nothing close to 1 million tons of material slammed down
on the WTC foundation and its sub-basements. The debris stacks left where the Twin Towers once
stood hardly covered the ground.” 3 James Gourley, “Scientific Critique of Judy Wood’s Paper ‘The Star Wars Beam Weapon’”, Journal of
9/11 Studies, Letter B (January 9, 2007) 4 Tony Szamboti ,"Why the damage to WTC Bldgs. 3 and 6 does not support the beam weapon hypothesis
and some correspondence with Dr. James Fetzer about it", Journal of 9/11 Studies, Letter B, (March, 2007) 5 http://youtube.com/watch?v=v3yvViAF4IM &
http://video.google.com/videoplay?docid=7937273264329816394 6 http://www.noaanews.noaa.gov/wtc/images/wtc-photo.jpg
7 NIST publication, NCSTAR1-3E
8 USGS: Environmental Studies of the World Trade Center area after the September 11, 2001 attack
9 EPA Bulk Dust Study: Summary Report: Characterization of Particulate Found in Apartments After
Destruction of the World Trade Center, October 12, 2001, 10
John K. McGee et al, “Chemical Analysis of World Trade Center Fine Particulate Matter for Use in
Toxicologic Assessment”, Environmental Health Perspective (June 2003) 11
Dr. S. Jones Bulk Concrete measurement: 1.2%, “Comparison of elemental concentrations observed in
WTC dust, concrete and wallboard samples”, To be published in Journal of 9/11 Studies 12
Dr. Greg Jenkins and Arabesque, Interview with Dr. Judy Wood and Dr. Greg Jenkins, transcript and
analysis 13
UC Davis Aerosol Study: Cahill et al., “Analysis of Aerosols from the World Trade Center
Collapse Site, New York, October 2 to October 30, 2001”, Aerosol Science and Technology, 38:165-183
(2004) 14
EPA Aerosol Study: http://www.epa.gov/wtc/metal/ 15
Gregory H. Urich , Analysis of Mass and Potential Energy in the World Trade Center Twin Towers
(April 25, 2007); Note that a revised Journal publication by Gregory Urich is anticipated which will more
accurately describe the distribution and constituent materials of the towers. The modifications actually
increase the amount of above grade steel but are insignificant for our purposes and will not change the
conclusions.

- 62 -
16
http://www.osha.gov/nyc-disaster/summary.html 17
http://www.osha.gov/nyc-disaster/wtc-metals.html 18
http://www.osha.gov/dts/sltc/methods/inorganic/id125g/id125g.html#table1 19
http://www.osha.gov/dts/sltc/methods/inorganic/id121/id121.html 20
http://www.flickr.com/gp/9773403@N02/ERL77U 21
EPA, report EPA/600/R-02/028, “Toxicological Effects of Fine Particulate Matter Derived from the
Destruction of the World Trade Center”, December 2002 22
Gregory P. Meeker, Amy M. Bern, Heather A. Lowers, and Isabelle K. Brownfield, “Determination of a
Diagnostic Signature for World Trade Center Dust using Scanning Electron Microscopy Point Counting
Techniques”, Open-File Report 2005 - 1031 U.S. Department of the Interior U.S. Geological Survey,
Denver Federal Center, Denver, CO 80225 23
Lioy et al, “Characterization of the Dust/Smoke Aerosol that Settled East of the World Trade Center
(WTC) in Lower Manhattan after the Collapse of the WTC 11 September 2001”, Environmental Health
Perspectives, Volume 110 #7 (July 2002) 24
http://www.esquire.com/features/breakdown0407 25
http://en.wikipedia.org/wiki/Raleigh_scattering 26
http://www.madsci.org/posts/archives/may98/895960099.Es.r.html 27
http://www.flickr.com/gp/9773403@N02/ERL77U 28
http://www.islandnet.com/~see/weather/elements/whatgoesup1.htm 29
http://www.engineeringtoolbox.com/air-properties-d_156.html 30
RJ Lee Group, “Property Damage Claim”, Volume II Section 5: Detailed Building Description 31
USNS Comfort arrives in NYC in the evening of September 12th;
http://www.navy.mil/search/display.asp?story_id=25586; http://www.pagetutor.com/misc/cnn.html 32
Worldwide power output: 300 Quads/year, http://energy.cr.usgs.gov/energy/stats_ctry/Stat1.html;
Russian 100 MegaTon Tsar Bomba, and 1 kiloTon TNT = 4.183 TJ
http://en.wikipedia.org/wiki/Nuclear_weapon_yield 33
Halliday and Resnick, “Fundamentals of Physics”, extended third edition, John Wiley and Sons, 1988,
p1080 34
Sun core temperature is 13,600,000 K (http://en.wikipedia.org/wiki/Sun). Setting the coulomb energy
equal to kb T where kb is Blotzmann’s constant results in a temperature about 7000 times the temperature of
the sun. 35
Dr. Greg Jenkins, “The Overwhelming Implausibility of Using Directed Energy Beams to Demolish the
World Trade Center”, Journal of 9/11 Studies, Volume 8 (February, 2007) 36
A schematic representation of the damaged sublevels published in the NY Times is used to estimate the
volume of sublevel collapses. “The diagrams are based on floor-by-floor assessments of the basement
levels of the World Trade Center complex by Mueser Rutledge Consulting Engineers, which is advising the
city.”, http://www.nytimes.com/library/national/index_WALL.html; Also, one level from the original
assessment may be found in the following article: figure 7, p16, George J.Tamaro, "World Trade Center
Bathtub: From Genesis to Armageddon", The Bridge, Volume 32, Number 1 Spring 2002 37
FEMA Report Appendix D: WTC Steel Data Collection. 38
http://www.pbs.org/americarebuilds/engineering/engineering_qfacts.html 39
Martin J. Bellew (Director of the Bureau of Waste Disposal), "Clearing the way for recovery at Ground
Zero: The 9-11 role of the NYC Department of Sanitation", New York City Department of Sanitation;
http://www.apwa.net/Publications/Reporter/ReporterOnline/index.asp?DISPLAY=ISSUE&ISSUE_DATE
=032004&ARTICLE_NUMBER=770 40
GW Institute for Crisis, Disaster and Risk Management, "Role of USACE at the WTC Response
Operations"; http://www.gwu.edu/~icdrm/publications/usace911/usacerole.html 41
http://911research.wtc7.net/wtc/evidence/photos/gzaerial3.html 42
http://www.photolibrary.fema.gov/photolibrary/photo_details.do?id=4013 43
http://www.photolibrary.fema.gov/photolibrary/photo_details.do?id=4235 44
http://www.studyof911.com/gallery/displayimage.php?album=18&pos=128 45
http://www.studyof911.com/gallery/displayimage.php?pos=-2351 46
http://www.geography.hunter.cuny.edu/~carsi/INDEX/CURRENTAFFAIRS/exhibit/lidar_sep.htm 47
TASK ORDER 0001, SPECIAL INVESTIGATIVE AUDIT #14 (SIA#14), “Environmental Data Trend
Report World Trade Center Disaster (DRAFT)” prepared by: The Data Auditing Group, Quality
Assurance Technical Support Laboratory, IT Corporation, 2700 Chandler Avenue, Las Vegas, Nevada
89120, October 29, 2001 48
http://oxylance.com/catalog.pdf

- 63 -
49
Richard Feynman, “The Feynman Lectures on Physics Vol I”, equation 43.37; The general potential
energy U is replaced with the gravitational potential energy, m g h 50
http://en.wikipedia.org/wiki/Atmospheric_pressure 51
http://www.everything2.com/index.pl?node_id=739982 52
http://www.allmeasures.com/Formulae/d1/d2/d3/Results2_2.asp?material=Carbon+%5BC%5D&formula=2 53
http://www.dec.state.ak.us/spar/perp/docs/isb_rev1.pdf 54
http://www.islandnet.com/~see/weather/elements/cloudfloat.htm 55
http://www.sciam.com/askexpert_question.cfm?articleID=00057690-D38E-1C71-9EB7809EC588F2D7 56
http://www.simetric.co.uk/si_water.htm 57
http://www.elmhurst.edu/~chm/vchembook/122Adensityice.html 58
Hautiere et al, “Detection of Visibility through use of Onboard Cameras”, IEEE, 2005 59
Fernando M. Janeiro , Frank Wagner , Pedro M. Ramos and Ana Maria Silva ,“Atmospheric Visibility
Measurements Based on a Low-Cost Digital Camera”, 2003;
http://www.co.it.pt/conftele2007/assets/papers/instrumentation/paper_152.pdf 60
http://www.du.edu/~jcalvert/astro/visib.htm 61
An EPA Report to Congress, “Protecting Visibility”, Chapter 2,
http://vista.cira.colostate.edu/improve/Publications/Principle/EPA_Report/chapter2.pdf 62
http://wtc.nist.gov/NISTNCSTAR1CollapseofTowers.pdf