some economic scenarios for the 1980’s · economic sciences 1980 this is a pattern familiar not...
TRANSCRIPT
SOME ECONOMIC SCENARIOSFOR THE 1980’s
Nobel Memorial Lecture, 8 December, 1980
by
LAWRENCE R. KLEIN
University of Pennsylvania, Philadelphia, Pennsylvania 19 104, USA
At the beginning of a decade it is tempting to look ahead for the next ten years.In addition to end-of-decade targets, there is considerable interest, at thepresent time, in end-of-century targets. Analysis of multi-decade developmentsdepends on an even longer view, and I shall focus my attention on the medium-term outlook for one decade as much as possible.
This analysis will proceed through the medium of two econometric models,one for the United States and one for the World as a whole. I shall refer toavailable simulations of the Wharton Model of the United States for a single(large) country appraisal. The U.S. weight in the total for all OECD countriesis more than one-third of aggregate production. Any sizeable action by the U.S.is, therefore, reflected in the totals.
Other countries are going in their own chosen directions, and it will be usefulto try pull them all together in world model simulations from the equationsystem of project LINK. The LINK system is an amalgamation of econometricmodels from 17 OECD industrial countries, eight socialist countries, and fourregional models of developing countries.1
BASE CASE - UNITED STATES
First, let us consider a baseline simulation for the United States. There isgeneral recognition that something large (a “sea change”) has come over theleading countries in the OECD area. In the case of the United States, real GNPgrowth, from the end of World War II until the end of the 1960’s, averaged justunder 4%. The baseline projection shows a distinct tendency for the economyto hover in the neighborhood of 3% growth. Slower growth, more inflation,high interest costs, an elevated rate of unemployment and balance-of-paymentsproblems are manifest in the long sequence of tables generated by the WhartonAnnual Model. Some annual growth rates, recorded at live year intervals, arelisted in Table 1.
1 This is the present country/regional make-up of the LINK system. In some versions of systemsimulations - set up a year or so ago - there are four fewer OECD country models and one fewercentrally planned model.

422 Economic Sciences 1980
This is a pattern familiar not only in the United States but in other industrialcountries. The changed economic profile between the post World War IIrecovery/expansion period (1945-1970) and the period since 1970, throughthe end of the decade, is a result of some profound changes in the underlyingeconomic environment. They are related to such major events as
(i) energy supply-demand imbalance and a shift from inexpensive to dearprices;
(ii) pressure on available food supplies and a shift towards higher foodprices;
(iii) accelerated inflation;(iv) declining productivity growth;
5.5 6.2 9.9 0.5 8.85.1 6.5 6.4 6.0 7.7
2.8 3.9 3.6 1.0 1.40.9 2.1 2.0 -2.7 2.05.1 5.9 5.0 3.6 1.01.1 1.6 2.0 1.5 2.71.4 1.3 2.1 2.3 2.5
3.13.9
1.93.30.91.41.3
3.73.3
2.22.02.31.31.1
1 Forecast values: Wharton EFA. Real values in prices of 1972
(vi)(v) rapid expansion of the labor force;
increasing attention paid to problems of quality of life.These issues started to appear in the late 1960’s, many in the wake of the
Vietnam war, and prevailed during the 1970’s which proved to be a turbulentdecade for the U. S. economy. Averages for the past decade, after smoothing ofcyclical movements show changed trends in growth, inflation, unemploymentrates, interest rates, internal deficits, and external deficits. It is also a period inwhich the U. S. economy became highly internationalized; i. e., increasinglysubject to pressures of international events, less self-contained, and not at allinsulated. The differences between the 1970’s and earlier decades are matters ofrecorded history. The average trends estimated from the decade 1971-1980

L. R. Klein 423
govern the projections for the 1980’s and 1990’s. There is no indication that thetrends of the 1970’s were aberrations and that we are likely to return to theheady days of earlier postwar decades. The reasons for this changed perfor-mance are contained in the six points listed above, but in this essay, I want tolook at the problem through the medium of econometric model simulation,rather than point-by-point analysis of the six items.2
Table 2. Selected U. S. Economic Indicators Projections to 1990.
A trend projection of a large scale econometric model has a special interpre-tation. In the initial two or three years of such an extrapolation, an attempt ismade to introduce as much specific business-cycle content as possible bymoving principal policy magnitudes along specified short-run courses thatinterpret budget commitments, tax statutes, behavior of monetary authorities,and various economic regulations. This portion of the extrapolation mayproperly be labelled as a multi-dimensional forecast. From that point forward,major inputs are placed on recent medium-term trend paths. A set of exoge-
2 The Wharton Model projections for the United States, reported here, were prepared by VijayaDuggal, Gene Guill, George Schink, and Yacov Sheinin.
424 Economic Sciences 1980
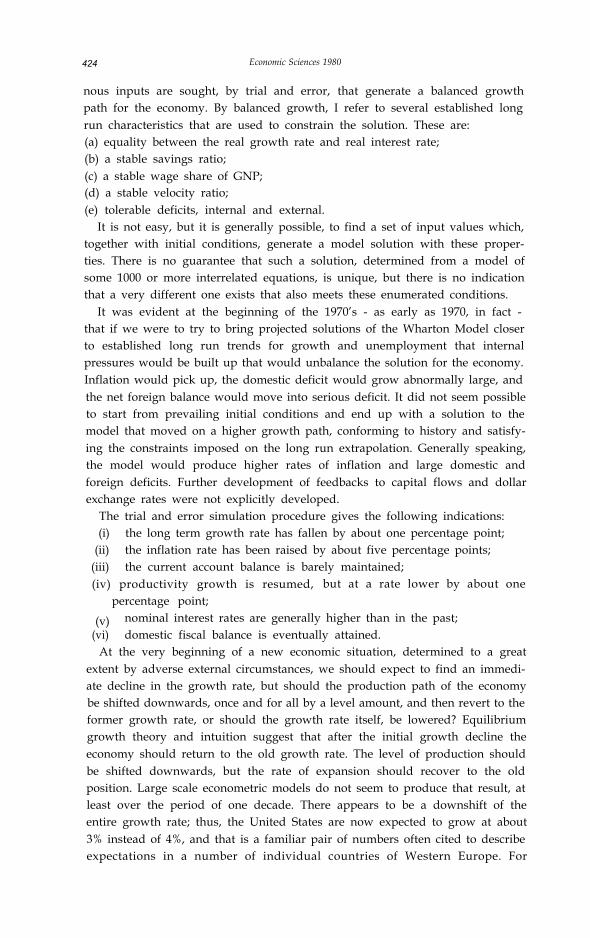
nous inputs are sought, by trial and error, that generate a balanced growthpath for the economy. By balanced growth, I refer to several established longrun characteristics that are used to constrain the solution. These are:(a) equality between the real growth rate and real interest rate;(b) a stable savings ratio;(c) a stable wage share of GNP;(d) a stable velocity ratio;(e) tolerable deficits, internal and external.
It is not easy, but it is generally possible, to find a set of input values which,together with initial conditions, generate a model solution with these proper-ties. There is no guarantee that such a solution, determined from a model ofsome 1000 or more interrelated equations, is unique, but there is no indicationthat a very different one exists that also meets these enumerated conditions.
It was evident at the beginning of the 1970’s - as early as 1970, in fact -that if we were to try to bring projected solutions of the Wharton Model closerto established long run trends for growth and unemployment that internalpressures would be built up that would unbalance the solution for the economy.Inflation would pick up, the domestic deficit would grow abnormally large, andthe net foreign balance would move into serious deficit. It did not seem possibleto start from prevailing initial conditions and end up with a solution to themodel that moved on a higher growth path, conforming to history and satisfy-ing the constraints imposed on the long run extrapolation. Generally speaking,the model would produce higher rates of inflation and large domestic andforeign deficits. Further development of feedbacks to capital flows and dollarexchange rates were not explicitly developed.
The trial and error simulation procedure gives the following indications:(i) the long term growth rate has fallen by about one percentage point;
(ii) the inflation rate has been raised by about five percentage points;(iii) the current account balance is barely maintained;(iv) productivity growth is resumed, but at a rate lower by about one
percentage point;
(v) nominal interest rates are generally higher than in the past;(vi) domestic fiscal balance is eventually attained.
At the very beginning of a new economic situation, determined to a greatextent by adverse external circumstances, we should expect to find an immedi-ate decline in the growth rate, but should the production path of the economybe shifted downwards, once and for all by a level amount, and then revert to theformer growth rate, or should the growth rate itself, be lowered? Equilibriumgrowth theory and intuition suggest that after the initial growth decline theeconomy should return to the old growth rate. The level of production shouldbe shifted downwards, but the rate of expansion should recover to the oldposition. Large scale econometric models do not seem to produce that result, atleast over the period of one decade. There appears to be a downshift of theentire growth rate; thus, the United States are now expected to grow at about3% instead of 4%, and that is a familiar pair of numbers often cited to describeexpectations in a number of individual countries of Western Europe. For

L. R. Klein 425
Japan, the downshift in long term equlibrium growth is from about 10 percentto 5 %. This is an interesting finding that pervades many econometric model-ing exercises for different countries and, as we shall see, for the world, too.
If the economy of the United States is stimulated toward recovery of thehigher growth path of the 1950’s and 1960’s, a gap in trade and paymentsappears. But if the economy is allowed to proceed along the more moderatepath of 3%, the current account stays close to balance with only slightdeterioration in spite of a continuing increase (assumed) in the real price ofimported oil. There is some tendency towards energy conservation, but thevalue of oil imports is expected to grow significantly, year by year. Mainstays ofthe American current balance are growing agricultural exports and an impres-sive positive balance for services, or invisible accounts. Among the latter, themost important growth item is investment income. Many U. S. firms unsettledthe balance of payments when they invested capital abroad in earlier formativeyears. But eventually, they made good on their investments, which was alwaysthe intention. U. S. based multinational enterprises now enjoy good incomefrom abroad. In many cases, foreign income is much more favourable thandomestic income.
Two other developments also contribute to net investment income frominvisibles; high interest rates abroad, especially in the Euro-dollar market,enable U. S. corporate treasurers to realize good earnings from short terminvestments of working capital. High oil prices, which hurt our balance in thevisible, merchandise sector, are offset by high earnings of U. S. multinationaloil companies.
The U.S. economy is fundamentally beset by “fiscal drag”. When theeconomy is operating in the neighborhood of full employment, present tax andrevenue statutes are capable of generating very large receipts, generally largeenough to cover all reasonable expenditures, extrapolated along historicalgrowth paths. There will be some fresh tax cuts, and these are, indeed, factoredinto the baseline projection. But that is not enough to prevent overall expan-sion, by large sums, of revenues for the account of central government. Al-though we seldom realize balanced internal budgets, after the year is over, wedo project them in baseline simulations. Major disturbances that bring forthnew outlays and hold back the expansion of the personal income base causeinternal accounts to fall into deficit positions much more frequently than isexpected when a decade projection is made.
It is not solely energy considerations, such as the shift to relatively higherenergy prices, that have caused the new slower profile of economic expansion inthe United States, but energy is a key factor in these aspects of economicchange. It is not possible to appreciate fully the new dimensions of the moderneconomy without devoting a great deal of attention to the role of energy.Accordingly, the Wharton Model, among other econometric interpretations ofthe United States, has incorporated a great deal of energy detail. It is evidentfrom the accompanying table that progress is expected in energy conservation,a natural component of economic efficiency. Inefficiency in the use of anexpensive scarce resource such as energy should eventually result in its more

426 Economic Sciences 1980
careful use. The baseline projection for the American economy shows a steadydownward trend in the energy (BTU) to GNP ratio, from 52.48 (Thou BTU/1972$) in 1980 to 44.57 in 1990. Were it not for energy conservation, inresponse to a relative price shift, the problem of bringing external tradeaccounts into current balance would be much more difficult, with addedpressure on the dollar and thus on domestic inflation; therefore, energy use inresponse to the laws of economics forms an important component of this entirelook into the future.
It is not only the free working of the market economy that brings aboutincreasing energy efficiency but also legislative mandates on the fuel efficiencyof the automobile fleet. The steady improvement of the statistics on averagemiles-per-gallon is clearly evident in Table 3. By meeting these standards fromthe side of the fleet supply, consumers and producers are implicitly contribut-ing to the improvement in the energy to GNP ratio. These institutional consid-erations are part of the exogenous input into the baseline case.
Table 3. Energy and R&ted U.S. projections to 1990
The projected decline in energy use per unit of production is not simply a“hope” built into the solution of the Wharton Model; it is, in fact, a continu-ation of an existing trend that has been apparent but too little appreciated since1973. The energy-GNP ratio fell from 60.41 to 54.50 over the period 1973-79.
In searching for a set of economic policies that give rise to the balancedsolution, termed the baseline case, I have been mindful of contemporarypolitics. Since the Kennedy-Johnson years, the federal administration in theUnited States has been conservative, undoubtedly becoming more conservativewith the passage of time and with mounting frustration in dealing with infla-tion. The fiscal and monetary policies of the baseline case are appropriatelyconstrained to be conservative also. They continue basic downward trends inpublic expenditures as a percent of GNP and keep taxes high enough togenerate an eventual domestic budget balance. The growth of money supply isprudent. In the long run there is a tendency for this model to conform to thequantity theory of money, i.e., nominal GNP and money supply expand at thesame rate of change.3
This is shown by a tendency toward steady velocity of3See L.R. Klein, “Money in a General Equilibrium System: Empirical Aspects of the Quantity
Theory”, Economic Appliquée , XXXI (l-2, 1978), 5-14.

L. R. Klein 427
circulation. This is a conservative monetary policy, to go hand-in-hand with anassumed conservative fiscal policy.
Table 4. Estimated M4 Velocity in U.S. Baseline Projections
1980 2.28 1984 2.27 1988 2.211981 2.34 1985 2.22 1980 2.191982 2.42 1986 2.21 1990 2.171983 2.31 1987 2.21
BASE CASE-THE WORLD ECONOMY 4
In many respects, the economic evolution of the United States over the nextdecade should indicate a general pattern for most developed industrial econo-mies. To be sure, every country will have its own special situation, but theprincipal simulation results - moderate growth, less inflation, and overall bal-ance - should prevail for several if not all industrial market economies. Next letus consider the world as a whole, not just the group of industrial countrieswhich comprise the OECD, but the centrally planned and developing countriesas well. Interest centers on their interaction and the way the world economyevolves.
During the 1960’s economic development was rapid. Among industrializedcountries, Japan’s growth was unusually high, exceeding 10% annually. Thegrowth rate of all industrialized countries averaged 5.1% over the decade butfell to only 3.2% during the greater part of the 1970’s as a result of businesscycle swings. The centrally planned economies turned in some individual goodperformances, but the cultural revolution in China, internal upheavals inCzechoslovakia, and difficulties elsewhere held their growth rate to 4.9%, justunder the OECD average. The socialist countries picked up considerably in the1970’s but now face the same problems as the market economies in the periodahead.
For the developing countries, the results are very mixed depending oncountry classification. According to World Bank estimates, low income coun-tries grew at rates significantly under 4% in both the 1960’s and 1970’s.Performance was close to 6 % in the middle income grouping, and even higherfor Persian Gulf Oil exporters. These tabulations cut off notably in 1978, justprior to the revolution in Iran, which has disrupted economic activity for sometime to come.
4 Members of the research team of Project LINK contributed markedly to the results reported inthis section. They are Victor Filatov, Shahrokh Fardoust, Yuzo Kumasaka, Michael Papaioannou,and Baudouin Velge.

428 Economic Sciences 1980
Inflation rates were modest prior to the economic dislocations of the pastdecade, with single-digit rates well under 5% customary in the non-socialistworld. There were some significant exceptions in the developing world. Afterthe large increments in food and fuel prices during the early 1970’s, and theabsorption of the legacy of Vietnam, prices took off to new heights. Theaverage, 1970-78, was just below 10% for the industrialized countries, butthe situation has worsened considerably in the most recent years. This is one ofthe bleakest aspects of the future outlook.
There are no satisfactory price reports from the centrally planned economies.Very recently, they have shown a series of once-for-all price changes, but theiropening of their borders to trade on a significantly larger scale means that theywill have to absorb a large degree of imported inflation. Where appropriateprice indexes are available, they indicate price increases comparable to those inthe West.
Another dimension in the world economy is the growth and pattern of worldtrade. The decade of the 1960’s was a “golden era ” in trade development. Bothexports and imports grew faster than did aggregate production. As recession hitthe world economy in the 1970’s, trade growth also receded, but it remainedsignificantly above the growth in production. On a world scale, the growth intrade volume was about 50% faster than production growth.
For most of the historical period since the end of World War II, the fixedparity system of the Bretton Woods Agreement took care of adjustments intrade balances, while developing a thriving multilateral system of trade. Thebuild up of large surpluses by countries like Japan and Germany and therelative weakness of the United States, United Kingdom and a few other keycountries brought the downfall of this system at the end of the 1960’s orbeginning of the 1970’s. The managed floating system was being given a chanceto operate, when the world was shocked by the oil embargo of 1973, followed byhigh energy pricing by OPEC. Now there are large surpluses and deficitsamong countries, subject to a great deal of turnover from year to year, asregards who is in surplus and who is in deficit. Overshadowing the short runadjustments among various OECD members is the very large balance of oilexporting nations. After the first buildup of surplus balances by OPEC in1974-75, the excess funds were recirculated throughout the world economythrough inflation, dollar devaluation, and OPEC’s high propensity to import.

L. R. Klein 429
This situation has been halted, and a large surplus for oil exporting countries ispresently matched by a deficit for oil importing countries in both the developedand developing world.
The basic assumption for world model projections into the 1980’s is that oilproduction will be more moderate; price increases will be maintained abovewestern inflation rates; and the surplus of oil exporting countries will be usedfor the development of the non-oil sectors of their economies or investedthroughout the world.
By using the initial conditions of recent world economic history, an assump-tion about the course of oil prices, and extrapolated trends of major exogenousvariables, we can compute a baseline projection of the world economy as awhole. The interrelated system of national and regional econometric modelsthat constitute project LINK is the statistical medium through which thiscalculated projection is made.5
Each component model of the LINK system is put through a trend extrapo-lation exercise analogous to that described above for the Wharton Model of theUnited States, the main difference being that the models of project LINK,including the U.S. component, do not have the large detailed input-output andenergy sectors that are present in the version of the Wharton Model that isbeing used for these longer term analyses. In the U.S. case, the projectedAmerican economy of the LINK model is monitored by the known results ofthe annual Wharton Model.
The main advantage of using the integrated LINK system for this mediumterm projection is to develop the growth patterns of world trade and inflation aspart of the outcome of the calculation rather than as assumed inputs. For theindividual assessment of growth patterns in each separate country or region,assumed values for world trade and import prices must be established inadvance.
The base case projection for the world economy bears some close resem-blances to the results discussed already for the U.S. case, since most parts of theworld are experiencing the same kinds of economic pressures and convergingtowards a similar response and outcome.
5 R. J. Ball, ed., The International Linkage of National Economic Models , J. Waelbroeck, ed., The Models
of Project LINK , and J. Sawyer, ed., Modelling the International Transmission Mechanism. (Amsterdam:North-Holland Publishing Co., 1973, 1976, 1979). See also B. G. Hickman and L. R. Klein, “ADecade of Research by Project LINK”, ITEMS (New York: Social Science Research Council), vol.33, (December, 1979) 49-56.

430 Economic Sciences 1980
On average, the industrialized countries are protected to lose one or twopercentage points of growth. During the 1960’s they expanded at more than5%, but a longer stretch of time including the 1950’s would reduce thatestimate. In the projection, the growth rate is about 3%, the same as in thecyclical decade of the 1970‘s. GDP growth of’ the developing countries isreduced in this projection. as is that of the centrally planned economics. Alltold, When the figures are averaged on a world-wide basis, the resulting figurefor growth is between 3.5 and 4.0% for the decade ahead. The corrospondingfigure was in excess of 5% for the 1960’s and somewhat smaller during the1970’s.
Historically, world trade has expanded more rapidly than production, in aratio of about 1.5. In the projection, however, the ratio falls considerably, sothat world trade is expected to grow by little more than 10% above the growthrate of production. This is a new situation, with new large economies enteringthe world trade system on a large scale - China, the U.S.S.R., and othersocialist countries - together with an awareness of an increasing degree ofinterrelatedness among nations. The United States is noticeably more con-cerned about its international economic relations, and more involved too.Countering these tendencies are efforts at import substitution, the introduction

L. R. Klein 431
of some measures of protectionism, and some attempts by oil exporting nationsto restrain the growth of their output.
In this moderate growth, relatively slow trade era, it is expected that eventu-ally anti-inflationary policies will take hold. These are promoted by the conser-vative economic attitudes of policy makers now prevalent in the United States.The overall inflation rate does not fall back to the very low ranges thatprevailed some twenty years ago. In place of the less than 5% rates what weonce enjoyed, a reduction to single digit ranges and ultimately to about 5-6%is considered a significant achievement. In the developing world, a reasonabletarget would be about 15%, on average.
The growth of the OPEC surplus, covered over in these tables as a result ofthe amalgamation of all developing countries is matched, over the decade, bythe deficit of the industrial countries. There is some deficit. as well. among thesocialist countries. This projection assumes that these offsetting balances arerecycled through the world financial system. The actual process may be quitedifficult to accomplish.
Within the OECD area, there is a great deal ofshifting between surplus anddeficit areas. While the U.S. goes from deficit towards balance by 1990, Japanand Germany initially move into deficit, as do France, Italy, and the United

432 Economic Sciences 1980
Table 6. (continued) World trade summary
177.2
186.5
- 9 . 3
Figures in parentheses are annual average trade balances.1 13 LINK OECD countries are Australia, Austria, Belgium, Canada, Finland. France, Federal Republic (If
Germany, Italy, Japan, Netherlands. Sweden. United Kingdom and the United States of America.2 Measures are for merchandise trade. F.O.B.3 Includes only Eastern Europe CMEA and the U.S.S.R4 Period averages are calculated as the compound annual growth rate of the last over first war projection.
Kingdom. The Japanese situation is projected to change drastically andpromptly back into surplus by mid-decade, while the German case follows amore moderate path towards balance and reaches a small surplus by 1990.
The analysis of U.S. growth prospects is applicable by analogy to theindustrial countries as a whole. Restrictive policies to fight inflation, to pay forexpensive oil imports, protect exchange value of the currency, and to recoupproductivity losses keep the economy on a moderate path. The slowdown in theindustrial world holds back the export potential of developing countries. Inorder to cope with adverse trade and payments deficits, restrictive policies arefollowed. In this environment. capital inflows for development are harder to

L. R. Klein 433
come by. High debt service burdens, in a number of cases. act as additionalconstraints. Conservative governments in the OECD area are less disposedthan previously to grant concessionary aid.
The centrally planned economics used to consider themselves well insulatedagainst the economic ills of the rest of the world. This is no longer the case.
The centrally planned economies, dissatisfied with the outcome of their own efforts to achieve good economic growth performance, have changed strategyand decided to import high technology from the West. as well as necessarygrains to supplement their domestic agicultural supplies. This new approachhas opened their economies to Western inflation because imports have been

434
Table 6. (continued)
Economic Sciences 1980
reflecting rising world price. Gold and oil sales at correspondingly rising priceshave been used by the Soviet Union to finance part of their import needs. butthey are fully enmeshed in world inflation accounting in balancing rising exportprices.
The economies of Eastern Europe have had to cope with trade deficits andunusual borrowing in order to pay for imports, over and above their abilities toproduce exports for the world markets. As their external accounts have got outof line, they have had to resort to the “stop” phase of familiar “stop-go”politics. In addition, Poland and other Eastern countries have been confrontedwith domestic labor unrest in an inflationary environment.
The People’s Republic of China are resorting to similar trade politics, butmindful of the complications that arise when socialist countries rush headlonginto an open economy format, they are taking lessons from the Europeanexperience and modcrating their original trade and capital import plans.Although the Chinese are approaching this phase of development quite cau-tiously, they have enough pent-up growth potential at the present time tosupport a growth rate in excess of the average for centrally planned economies.
L. R. Klein 435
3172.8
3174.3
- 1 . 5
1399.8
1403.2
- 3 . 4
424.6
433.6
- 9 . 0
12.3
12.3
512.5
498.7
13.9
27.3 9.1 9.6 9.2 10.6 9.4
52.3 3.2
29.7
54.0
9.0
3.3 3.8 3.1 2.8 3.5
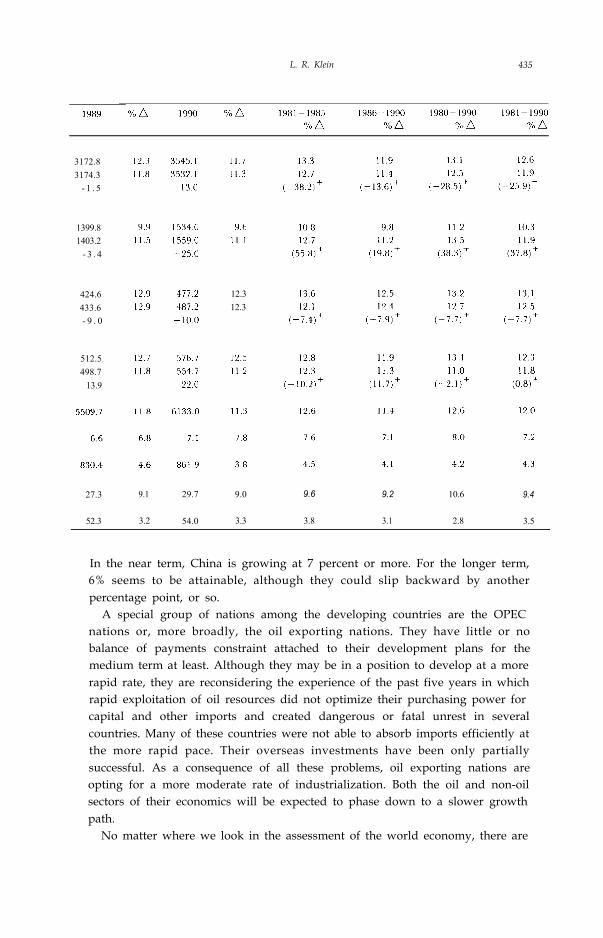
In the near term, China is growing at 7 percent or more. For the longer term,6% seems to be attainable, although they could slip backward by anotherpercentage point, or so.
A special group of nations among the developing countries are the OPECnations or, more broadly, the oil exporting nations. They have little or nobalance of payments constraint attached to their development plans for themedium term at least. Although they may be in a position to develop at a morerapid rate, they are reconsidering the experience of the past five years in whichrapid exploitation of oil resources did not optimize their purchasing power forcapital and other imports and created dangerous or fatal unrest in severalcountries. Many of these countries were not able to absorb imports efficiently atthe more rapid pace. Their overseas investments have been only partiallysuccessful. As a consequence of all these problems, oil exporting nations areopting for a more moderate rate of industrialization. Both the oil and non-oilsectors of their economics will be expected to phase down to a slower growthpath.
No matter where we look in the assessment of the world economy, there are

436 Economic Sciences 1980
fundamental reasons for expecting a slower rate of development.Recognition of lack of abundant energy resources for the world, more partic-
ularly crude oil resources, has by itself contributed to the slowing down of theworld economy. This can be seen by looking at the results of alternativesimulations of the LINK model with different assumptions about energy prices.A standard procedure is to compute a baseline projection, as has already beendescribed here, and then compare this result with an alternative projectionwhere specific changes in external factors have been imposed on the model. Inthe case being examined here, the change imposed is an increase in the worldoil price by 10%; i. e., the exogenous path of world oil prices, set by OPEC, israised, year by year, to a new path that is uniformly about 10% above thebaseline path.
On occasion, we have made simulations in which the oil price was kept fixedat some base year value or in which the real price of oil was kept fixed - byallowing the nominal price to move by the same percentage change as anaccepted index of inflation, say a general price index in the OECD countries.The LINK system has a basic symmetry property. Results with lower oil pricesare opposite in sign, with similar magnitude, to those with an increase in price.
The general findings can best be described by considering main elasticities ofthe system. These are percentage changes in principal magnitudes associatedwith a change in oil price, other external inputs remaining unchanged.
In the first place, fuel import demand falls by about 1.1% for a 10% increasein price. The elasticity coefficient is about 0.11. This degree of sensitivityappears in the first year of a projection and persists for a whole decade. After 10years, if the price is higher by 10%, the trade volume is lower by about 1% .
Higher oil price discourages world economic activity and adds to worldinflation. Industrial world GDP falls by about 0.5% when oil prices are initially10% and then about 6% higher after the first year. This works out to be anelasticity coefficient of 0.06. For this same change in oil price, OECD inflationmeasured by the GDP implicit deflator is up by about 0.2% and consumerprice rises by 0.3% to 0.4%.
When we consider that world energy prices have gone up much more than10%, after 1973 - they quadrupled and then more than doubled again - wecan see that energy issues had much to do with the present state of stagflation.It is not a simple matter of finding a multiple of the 10% change used in theelasticity calculations, because those changes were introduced in an artificialceteris paribus situation, while many things changed in the actual worldenvironment after oil prices first jumped. In fact, real oil prices did not perma-nently rise after the initial change in 1974-75; they did, however, after thelatest change in 1979.
In any event, we can plainly see that world economic activity and worldinflation are highly sensitive to world energy prices. The present slowing downof economic growth, accompanied by higher inflation, is due, in part at least, tohigher energy prices.
The baseline projections made here for both the United States and the worldas a whole are done in a benign environment; that is to say, there are no
L. R. Klein 437
untoward major disturbances contemplated for the 1980’s in this case. Sincethe end of World War II and the immediate readjustment period there havebeen three completed decades, each with its own disturbing factors that upsetan otherwise benign environment. These have been:1950’s Korean War
“Cold” WarSuez Canal Closing
1960’s Vietnam War1970’s Breakdown of Bretton Woods
Massive Harvest FailuresOil Embargo cum OPEC Cartel PricingIranian Revolution
These major events had enormous impact on economic performances all overthe world. Within each decade there were other disturbances as well, lessdramatic, yet economically significant.
In thinking about possible “futures” for the 1980’s, it may be convenient toformulate baseline cases without contingency planning for such disturbancesbecause, in many respects, the kinds of formal models that we use decompose,approximately, into a systematic (baseline) component and a disturbancecomponent.
This property is associated with linearity in formal model theorizing, and itappears to be a reasonable approximation. Therefore, we proceed by firstworking out the base case and then superimposing disturbances on it.
Sometime during the 1980’s there can very well be - according to manythinkers there will be - another significant interruption of delivery of oil sup-plies and another large harvest failure. During the 1970’s there was war in theMiddle East but not on the scale and duration of Korea or Vietnam. In a sense,the oil embargo and OPEC pricing listed above are economic surrogates for theMiddle East War.
Will the military experience of the 1950’s and 1960’s be repeated during the1980’s? This is certainly a contingency. There could well be large scale cold orhot war during the coming decade. Also, the international economy has been soupset by events in the food and fuel sectors that we tend to look to those areasfor the reappearance of disturbances. It is likely that a large scale economicdisruption will occur during the decade, but there will probably be distur-bances in surprising new areas. Shortages of basic materials other than foodand fuel could develop. There could be a wave of debt defaults runningthroughout the developing world or among relatively poor countries of thedeveloped world. There could be a massive dislocation in the physical ennviron-ment, in atmospheric or water pollution, or urban congestion. It is worthwhileexploring in some detail the economic dimensions of a few of the distur-bances.

438 Economic Sciences 1980
POSSIBLE DISTURBANCES
Cartel Pricing: For the baseline case, we have assumed that, after the immedi-ate effects of the Iranian Revolution have been worked out, crude oil priceswould rise, on average, by about 10% annually for the whole decade. Thisturns out to be about 3% above the inflation rate that is relevant to the oilexporting countries, namely, the export price of OECD countries. In thebaseline solution, this key price grows at about 6-7% annually. Between 1980and the attaining of the trend pattern for the rest of the decade, there is anassumed transitional period before world inflation and the growth rate of oilprices decline; thus, the 1981 real price increases by more than 3%. Inaddition, a disturbance did appear during 1980, continuing at the end of thisyear, in the form of war in the Middle East. W e are witnessing an unusualevent in which two members of an effective cartel are engaged in open warfare.This has significantly reduced oil supplies and provides another reason formarking up the price in the transitional period, at least.
The steady rise of 3% in the real price of oil, together with an approximatesolution path for OECD export prices at 7%, amount, in a numerical sense, tothe indexation of oil prices. It has often been mentioned that a stated objectiveof OPEC is to devise an index formula for oil pricing. The simplest of suchformulas is implicit in the baseline cast. Variations on this cast have beenworked out with either higher or lower rates of increase of real oil prices.Another route to follow is to have a multivariate indexation formula, in whichthe oil price is also tied to GDP growth in the developed world, to the exchangevalue of the dollar, and other relevant indicators.
Indexation formulas give smooth steady paths for the course of oil prices, butat least one unsteady path is worth consideration as a result of a possibledisturbance. If forseeable world supplies of oil are balance against estimatedworld demand, there appears to be a large scale shortfall developing by mid-decade. This deficit could be made up either by having price rise steadily on afaster gradient, by having a one-time large upward step of 50-100%, or byrationing.
The fact that the OPEC Cartel has been as cohesive and long lasting as ithas, surprises many economists. At the present time it even appears to besurviving open warfare between two members. We should be prepared, there-fore, to experience other surprises of similar proportions. There are, of course,some unique features about OPEC that are not easily duplicated. Cartels inother fields of economic activity may not reach out to such important productsfrom an industrial viewpoint. Cartels in diamonds, mercury, chromite or otherindustrial products would not have as great an impact on overall worldactivity. In most food lines, grains for example, large developed countries,which would be more disposed towards maintainance of a multilateral free tradesystem, are major export suppliers and could, therefore, inhibit or prohibiteffective cartel action. Petroleum products are peculiarly concentrated, as far assurplus capacity for export is concerned, in the hands of a fairly cohesivepolitico-social group, dedicated to pan-Arabism or to aspirations of developing

L. R. Klein 439
nations. If export capacity of important industrial products were concentratedin the hands of a cohesive group of nations (religious, political, social, geogra-phical) another effective cartel could arise. Such a possible field of action doesnot presently appear to exist on the world scene.
The world has been economically disturbed by food, as well as by fuel. Thereis certainly a possibility of unforeseen supply shocks in the provision of foodduring the 1980’s. Harvest failures have been occurring with alarming regular-ity as ambitious attempts are being made to upgrade diets over a large part ofthe world. The year 1980 initiates the decade on an insecure footing with somemeasurable disturbances. The embargo of American grain shipments to theU.S.S.R., as a result of the invasion of Afghanistan has been controversial, notonly because of its political impact but also because of doubts about itseffectiveness. When all the arguments are sifted, it does appear that theembargo has been effective in delaying the delivery of larger meat supplies tothe Soviet population. When it is placed in juxtaposition to the disappointingSoviet harvest of 1980 and the food shortages in Poland, it is evident that thereare quite significant stresses on the world economy. To add to the list of foodsupply setbacks, we can also cite the drought, resulting in a poor crop in feedgrains in the United States in 1980. We are starting out the decade withupward pressure on food/agricultural prices. The downward drift in worldinflation, which is an important component of the baseline economic scenariofor the 1980’s is temporarily being thrown off course by rises in food/agricultur-al prices and in energy prices. If more disturbances like these occur during thecourse of the decade, we could have significantly worse economic performancethan in the base case.
There is an important difference between food and fuel disturbances. Thefuel disturbances of the 1970’s, stemming from the 1973 Middle East War, wereinstitutionalized and made permanent by the control power of OPEC. Food/agricultural prices, however, fluctuated during the decade, since supply re-sponses to high prices have been relatively quick in agriculture. U.S. grainsupplies, in particular, were expanded on a large scale after the massivedepletion of stocks by Soviet purchases in 1972/73. The responsiveness of U.S.and other suppliers tends to soften the effect of agricultural disturbances whenspread over a two or three year horizon.
The next disturbance to the world economy could well be entirely unfore-seen. In searching for new and different areas where contingent planning wouldbe helpful, we may cite the possibility of simultaneous debt default. Manydeveloping countries, some centrally planned economics, and some poorerdeveloped countries are seriously in debt. The degree of seriousness is indicatedby debt service ratios showing the extent to which trade gain can cover (or failto cover) needs for interest payment and debt amortization. There have beenseveral singular cases of a nation’s inability to meet current debt servicerequirements, but they have always been met in recent years without theprecipitation of a crisis. Debt rescheduling has been successful for dealing withthe specific situations that have arisen - Peru, Zaire, Zambia, Poland, Turkey,to name a few. As long as such cases can be kept isolated from the routine
440 Economic Sciences 1980
functioning of the world financial system, a major disturbance can be averted.Commercial banks and international institutions have become alerted to thesituation as a result of experiences in these singular cases. They have, accord-ingly, become more prudent in loan activity. This is another reason whymoderation in the face of economic activity has become a characteristic of thebaseline projection for the decade ahead. Although there is good reason tobelieve that disturbances in the form of a wave of debt defaults will not occur,such an event is by no means impossible.
AN OPTIMISTIC CASE
While some economists may feel that the base case, itself, is optimistic - at leastcomplacent and trouble free - there are many industrialists, policy makers,financiers, and economists who strive for a better outcome. If there is a singlemeasure, among the many that properly describe the economy, that indicatesthe unsatisfactory nature of present performance and its extrapolation alongthe path of the baseline case, it is the poor performance of productivity. In Table2, it can be seen that productivity growth during 1980, in the United States, hasbeen negative, while its trend projection, at rates of change that are mainlybetween 1.0 and 2.0% annually, fall considerably below a previously estab-lished long run path. It used to grow at a rate in excess of 3% in the UnitedStates. Outside the U.S., across most international lines, it is also true that theproductivity improvement factor has fallen, perhaps not as drastically as in theUnited States, but it is uniformly lower in recent years.
A central focus for policy targets that gives some promise for better economicperformance is, therefore, a policy mix that attempts to enhance productivitygrowth. Since we are not sure of the causes that led to the productivityslowdown it is especially difficult to prescribe policies for productivity improve-ment. Of the possible sources of productivity decline, it is widely felt thatrelatively weak capital formation, in the private sector, plays a major role.
Both through general capital expansion, and through modernization, it isexpected that higher rates of fixed capital formation will lead to better produc-tivity growth. It is necessary to make firms want to invest and to use the newcapital at a high capacity rate.
Capital formation is important but not the whole story, because there is stilla long way to go towards revitalizing the economy even after some objectives oncapital formation have been reached. In a study for the New York StockExchange, last year, the operators of the Wharton Model examined the result-ing net gains for the United States as a consequence of raising the investmentshare of GNP to about 12% from a stagnating level of about 10%. 6
In a rounded policy package, the raising of the investment and savings ratesby 2 percentage points are formidable steps forward, but they apparently donot suffice to restore the rate of growth of productivity to its historical trend of
6 Building a Better Future: Economic Choices for the 1980’s. New York Stock Exchange, New York,(December, 1979).
L. R. Klein 441
the early 1960’s. This drastic upward shift in investment is estimated to addabout 0.2 to 0.5 percentage points to the overall rate of productivity expansion.This in turn is associated with an overall improvement of the GNP growth rateby about 0.5 percentage points. These are promising policies but standing bythemselves, they are not enough.
It is one thing to assume in a statistical mathematical model solution that theinvestment ratio is to be higher (by about 2.0 percentage points) and quiteanother to design policies that will, indeed, raise the share of capital formationin GNP by 2.0 percentage points. The policy discussion in the United States isnarrowing to the provision of tax incentives for investment through liberalizeddepreciation rules and investment tax credits. There is still ample room forimprovement of the rate of return on capital through changes in the appropri-ate tax parameters. Additional policy measures concern tax benefits for R & Doutlays, more federal spending for R & D, and more federal spending for basicresearch. In addition to these standard fiscal measures on the taxing andspending sides of the national budget, there is expectation that productivitygrowth will be helped by relaxation of restrictive regulations and by thepromotion of worker training programs on-the-job. To complement policiesdesigned to raise the investment share of GNP, there should be correspondingpolicies to raise the savings share. One possible route is to encourage privatesavings for pension systems, possibly through policies to make retirementpensions portable between jobs. Another way is to exempt some interest onsavings accounts from income taxation. The basic issue, however, is to shift theproportions in the make-up of U.S. GNP, namely, to reduce the consumptionratio by 2 percentage points while raising the investment ratio by an equalamount. This is the same thing as saying that the savings ratio should beincreased by the same amount as the increase in the investment ratio. In otherwords, the objective is to shift the U.S. economy from being fundamentally ahigh consumption to being a high investment economy.
Other countries may view the problem differently, but there should be broadagreement that capita1 formation has had a relatively poor recovery since thestart of the cyclical upswing after 1975. World-wide, the problem is to stimulateinvestment, but, as in the United States, that will be only a step in the rightdirection; it will lead to only modest improvement. Clearly, more imaginativepolicy thinking will have to deal with higher productivity growth.
A feature of the baseline path is the gradual reduction of the average rate ofinflation. Many economists would argue that the central economic problem inboth the long and short run is to reduce the inflation rate and that many thingswill “fall-into-place” once inflation has been controlled and gradually reduced.
Many policies can contribute to this worthy end, but a principal line wouldbe to tie changes in the rate of productivity growth to the inflation rate. In thelong run, if the rate of inflation is to be lowered, the growth rate of productivitymust be significantly increased on a lasting basis.
If the rate of return on capital can be raised, if R & D activity can be madepopular again, if economic regulation is liberalized, if worker productivity canbe improved through training schemes, and if the rate of inflation can be

442 Economic Sciences 1980
moderately but steadily decreased, then there is a chance that we can enjoy aninvestment boom in the 1980’s that compares favorably with the great expan-sionary era of the 1950’s and early 1960’s.
The appropriate policy measures for raising capital formation and produc-tivity growth are being looked at essentially on individual national bases. Butcoordinated fiscal and monetary policies offer a new dimension in which to act.If all major countries act synchronously to stimulate capital formation or toease monetary stringency, there can be added reinforcement effects. Interna-tional amplification of national fiscal multipliers is estimated to be as large as1.25 to 1.50. Simultaneous expansions operate through the world tradingsystem because as countries expand, they generally increase import demand.This, in turn, helps partner country export activity and feeds back again ondomestic expansion in each individual country. The stronger the response,both nationally and internationally, the less the stimulus has to be in order toarrive at a specified objective. The more we can moderate the use of fiscal/monetary policy, the better is the prospect for lower inflation. By keepinginflation on a favorable path, we stand to gain much through better tradeperformance.
The figures in Table 7 give a rough indication of what might be expected ifthe federal government were to stimulate private fixed investment so that itwould grow by an extra 2% annually. The policies are different among coun-tries, but they generally consist of tax changes, support from public capitalformation and support from general government spending.
The growth rate of GDP is improved over the course of this scenario byabout 0.5 percentage points at the beginning, but gradually the investmentstimulus tends to wear off by mid-decade. Similarly, there are gains in reducinginflation, again by 1.0 or 2.0 percentage pints. A major contributing factor tothe inflation gains is the improvement in productivity (real output per workerhour). It, too, performs better at the outset than at the end in 1985.