some research highlights: cattle feeding & environmental...
TRANSCRIPT
Some Research Highlights: Cattle Feeding & Environmental Quality
Texas A&M AgriLife Research & Extension
Amarillo TX
December 10, 2013
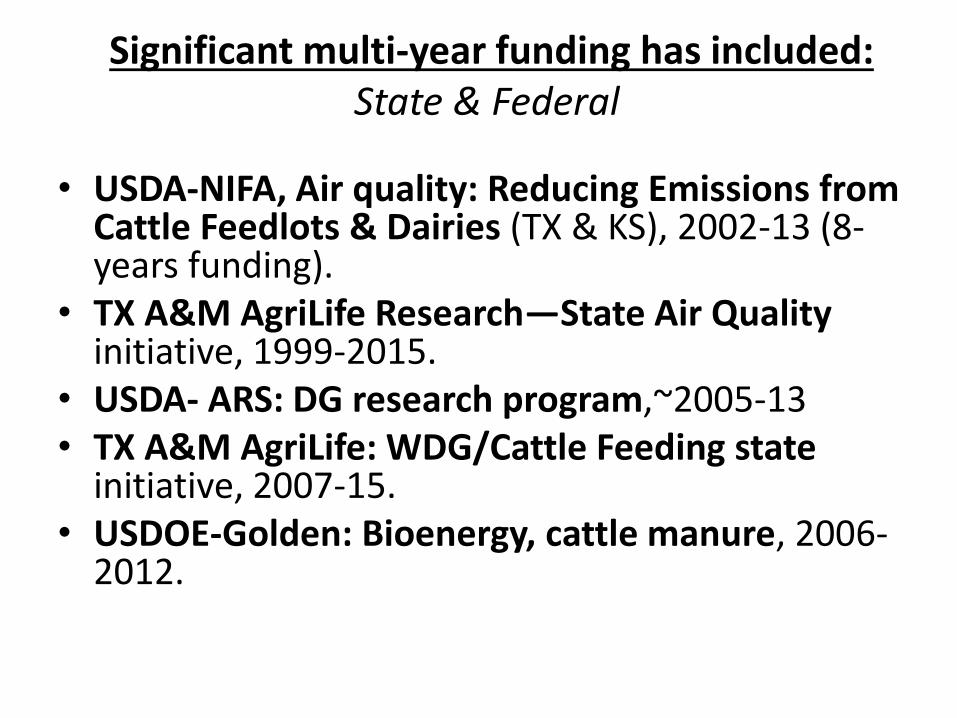
Significant multi-year funding has included: State & Federal
• USDA-NIFA, Air quality: Reducing Emissions from
Cattle Feedlots & Dairies (TX & KS), 2002-13 (8-years funding).
• TX A&M AgriLife Research—State Air Quality initiative, 1999-2015.
• USDA- ARS: DG research program,~2005-13 • TX A&M AgriLife: WDG/Cattle Feeding state
initiative, 2007-15. • USDOE-Golden: Bioenergy, cattle manure, 2006-
2012.

USDA-NIFA Federal Air Quality Initiative (FAQI)
• Objectives (4):
A. Abatement measures & receptor impacts.
B. Process-based emission models.
C. Dispersion modeling, regulation & emission factors.
D. Technology transfer to stakeholders.
• Research Partners:
TX A&M AgriLife Research & Extension; KSU; WTAMU; USDA-ARS; UN-L Ext.
• Industry Partners: Stakeholder Advisory Committee – TCFA, NCBA, KLA, TFB, USDA-NRCS, TCEQ, USEPA Reg. 6&7.

Texas A&M AgriLife Research & Extension
• Amarillo/Vernon faculty has included: – Brent Auvermann – Steve Amosson – Mike Brown (WT & AgriLife – Ken Casey – Kay Ledbetter – Jim McDonald (AgriLife & WT; now UN-L) – Ted McCollum – Seong Park (Vernon & AMA) – Bill Pinchak (Vernon) – Pablo Pinedo
• College Station faculty: – Brock Faulkner – Calvin Parnell – Sergio Capareda – Saqib Mukhtar.
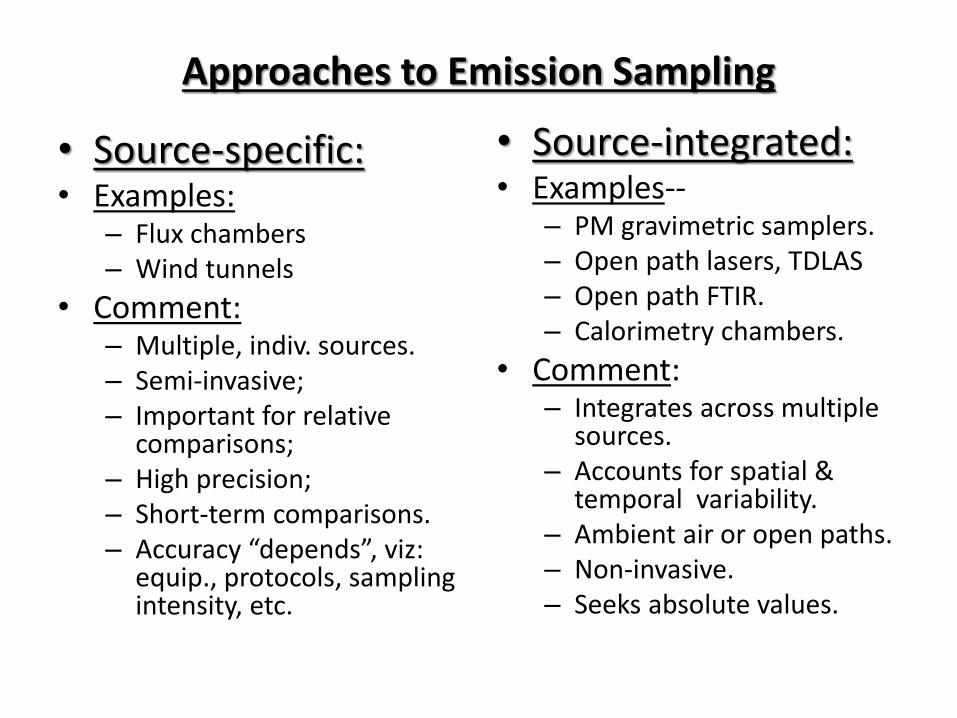
Approaches to Emission Sampling
• Source-specific: • Examples:
– Flux chambers – Wind tunnels
• Comment: – Multiple, indiv. sources. – Semi-invasive; – Important for relative
comparisons; – High precision; – Short-term comparisons. – Accuracy “depends”, viz:
equip., protocols, sampling intensity, etc.
• Source-integrated: • Examples--
– PM gravimetric samplers. – Open path lasers, TDLAS – Open path FTIR. – Calorimetry chambers.
• Comment: – Integrates across multiple
sources. – Accounts for spatial &
temporal variability. – Ambient air or open paths. – Non-invasive. – Seeks absolute values.

Common Emission Expressions
• Emission concentrations: – mass/volume (µg/m3 )
– mass/mass, ppm or ppb.
• With inverse dispersion modeling, measured concentrations are used to produce calculated values for: – Emission rate, mass/time, µg/sec, or kg/day .
– Emission flux rate, mass/area/time: µg/m2/sec, or kg/m2/yr.
– Emission factor, mass/time/unit of production: lbs/day/1,000 hd.
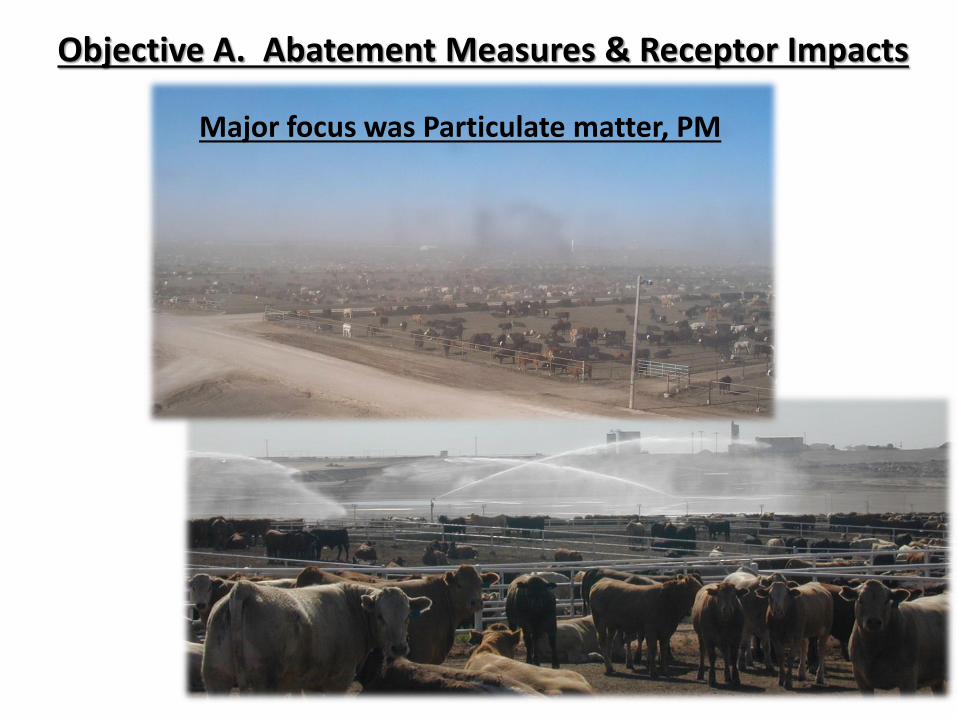
Objective A. Abatement Measures & Receptor Impacts
Major focus was Particulate matter, PM


Increased Cattle Activity
Transient Inversion
Driest Pen Surfaces
EDP
Critical threshold is 20% moisture, Auvermann & Maghirang

Slide courtesy Texas Tech University Conceptual model (Auvermann):
Emission Factor, EF (g/hd/d) = Pen Surface Dustiness, S (g/kJ) X Animal Activity, AA (kJ/hd/d)
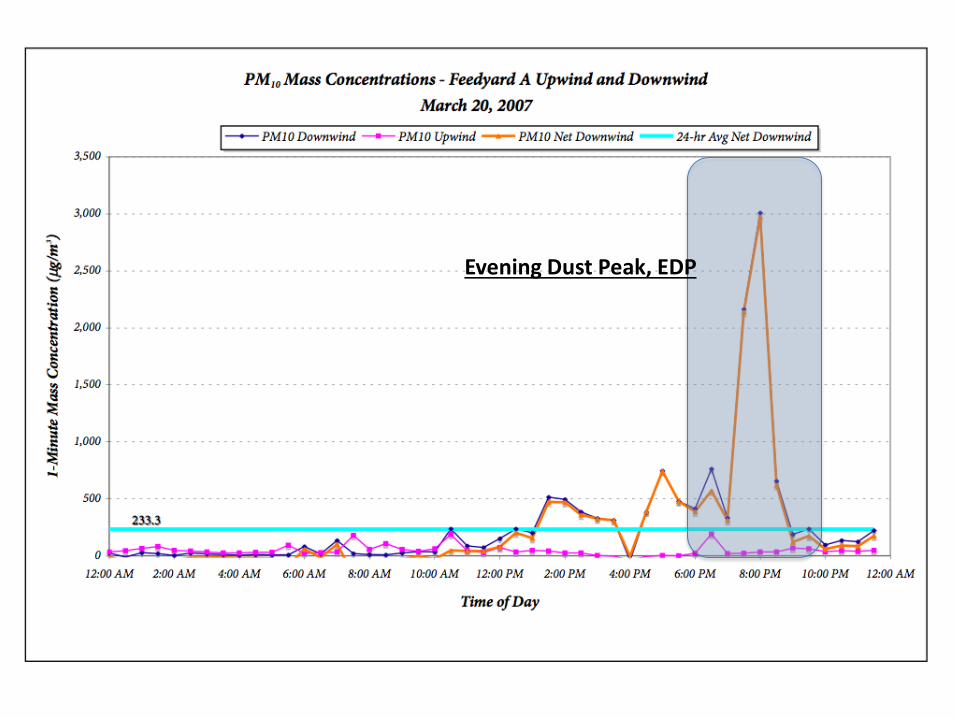
Evening Dust Peak, EDP
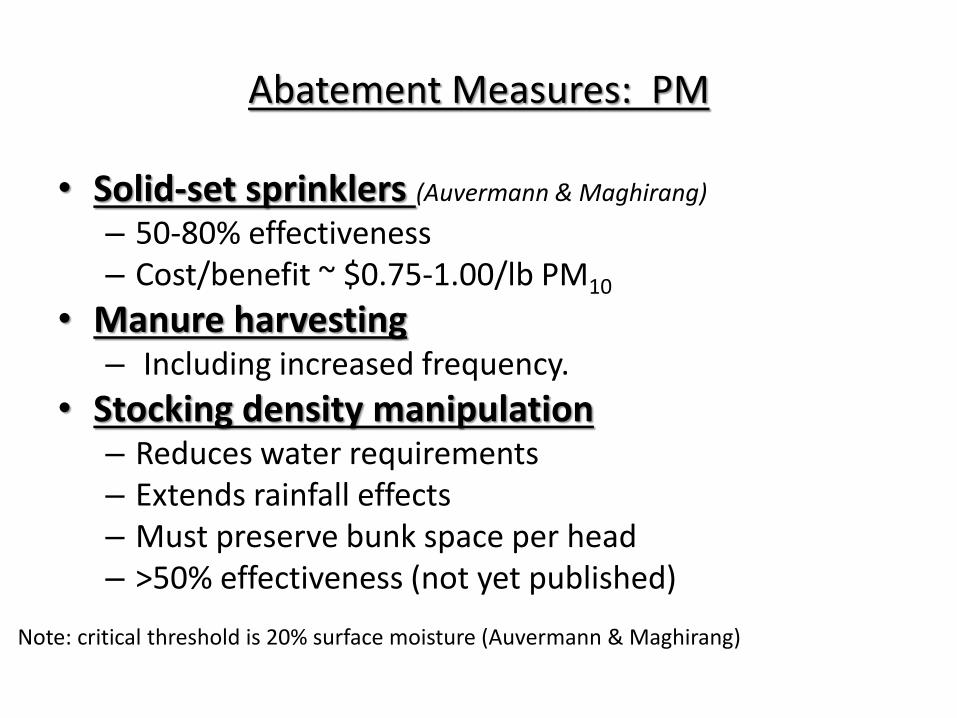
Abatement Measures: PM
• Solid-set sprinklers (Auvermann & Maghirang)
– 50-80% effectiveness – Cost/benefit ~ $0.75-1.00/lb PM10
• Manure harvesting – Including increased frequency.
• Stocking density manipulation – Reduces water requirements – Extends rainfall effects – Must preserve bunk space per head – >50% effectiveness (not yet published)
Note: critical threshold is 20% surface moisture (Auvermann & Maghirang)

Obj. A-- Abatement Measures & Receptor Impacts
• Solid-set sprinklers: • PM10 control efficiency (24-hr values): (Maghirang, KSU)
• Sprinkled feedyard (KS1): – PM10 concentration reductions: mean = 53% (range = 32-80% ).
– PM10 emission rates 24-hr reduced: mean = 49% (range=12-92%)
– PM10 emission rates for EDP reduced: mean = 61% (range = 21-93%).
– Sprinkler effect lasted one-day. Improved w/higher application.
• Rainfall effect for sprinkled vs. unsprinkled (KS2) feedyards: – means --KS1 = 77%; KS2 = 76%;
– range = 60 - ~100% both feedyards.
– Rainfall effect lasted 3-7 days, per amount & intensity.
• Cost/benefit of sprinkling ~ $0.75-1.00/lb PM10 (Brent Auvermann & Seong Park)
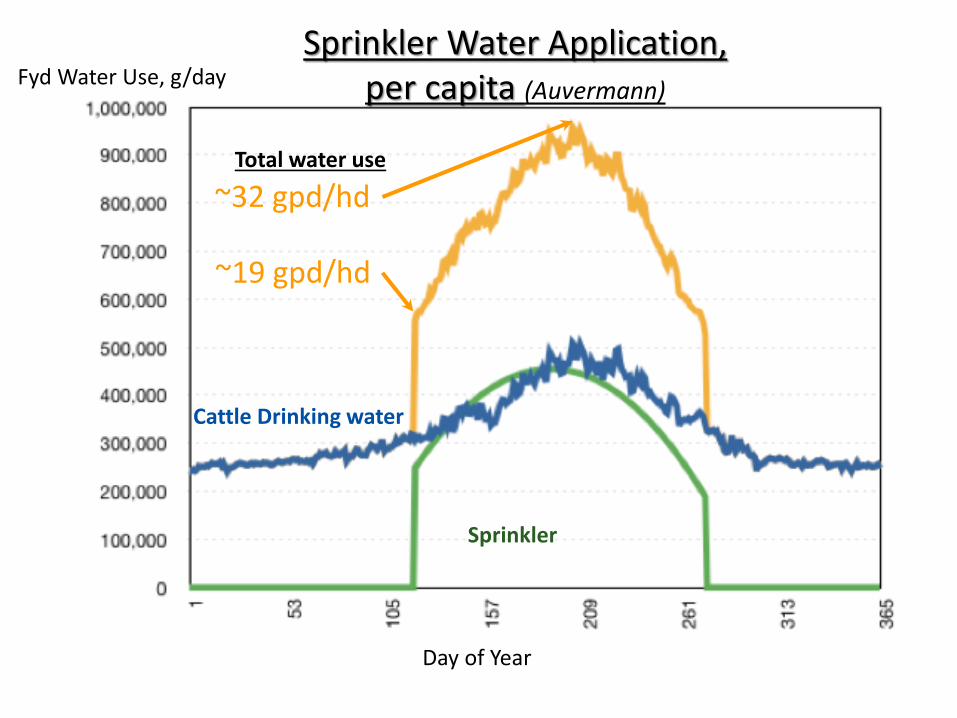
Cattle Drinking water
Sprinkler
~32 gpd/hd
~19 gpd/hd
Total water use
Sprinkler Water Application, per capita (Auvermann)
Fyd Water Use, g/day
Day of Year

Water Application
• Suggestions: • Don’t rely on water ALONE if uncompacted
manure is deeper than ½”-1” • Longer sprinkler sets rather than more
numerous, IF POSSIBLE • The last set of the day should be the
downwind set, if layout permits. • B. W. Auvermann
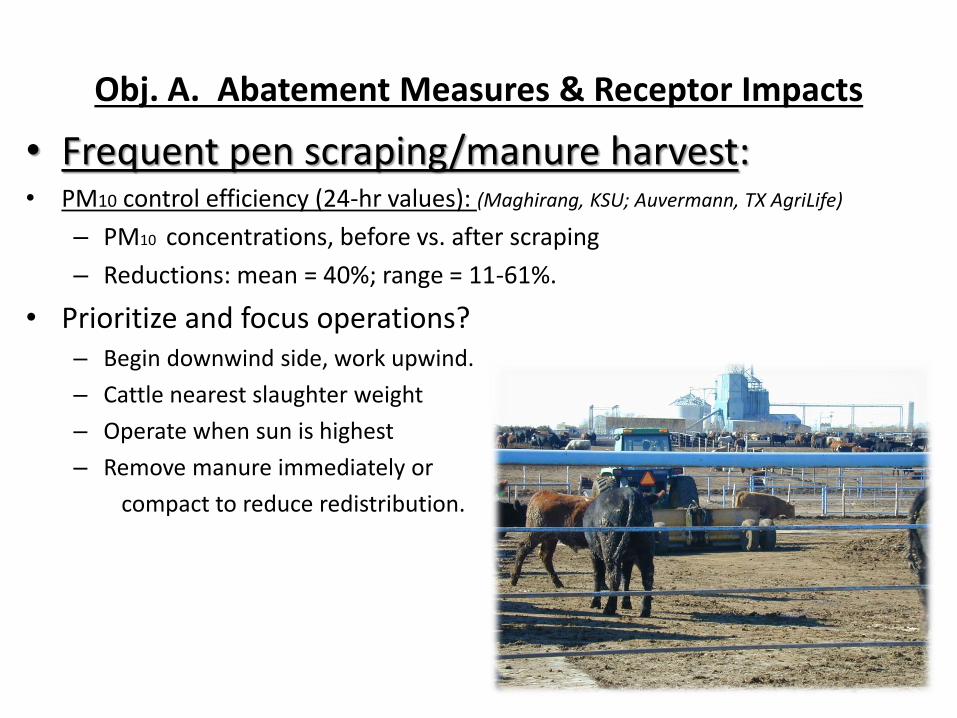
Obj. A. Abatement Measures & Receptor Impacts
• Frequent pen scraping/manure harvest: • PM10 control efficiency (24-hr values): (Maghirang, KSU; Auvermann, TX AgriLife)
– PM10 concentrations, before vs. after scraping
– Reductions: mean = 40%; range = 11-61%.
• Prioritize and focus operations? – Begin downwind side, work upwind.
– Cattle nearest slaughter weight
– Operate when sun is highest
– Remove manure immediately or
compact to reduce redistribution.

Stocking Density Treatments (Auvermann)
Obj. A. Abatement Measures & Receptor Impacts
Mobile Monitoring Platforms
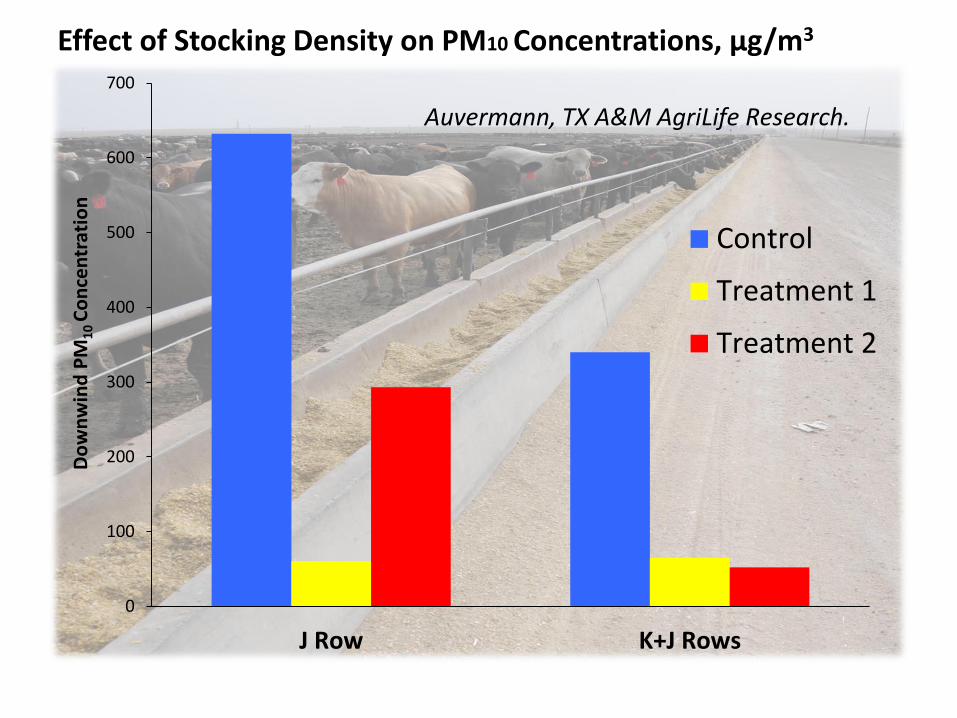
0
100
200
300
400
500
600
700
J Row K+J Rows
Do
wn
win
d P
M1
0 C
on
cen
trat
ion
Control
Treatment 1
Treatment 2
Auvermann, TX A&M AgriLife Research.
Effect of Stocking Density on PM10 Concentrations, µg/m3
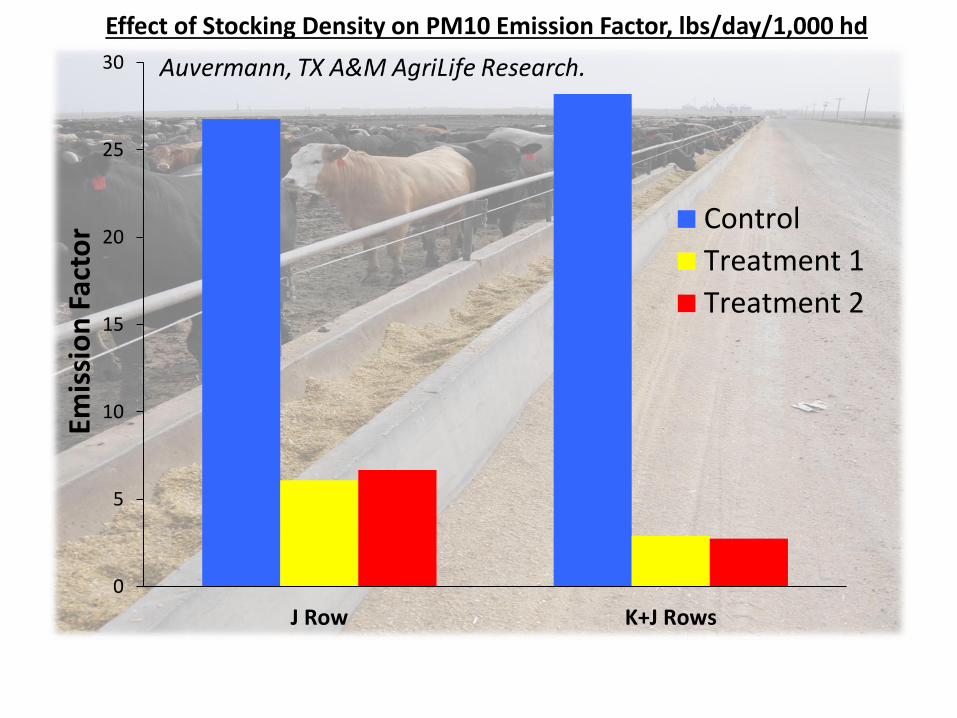
0
5
10
15
20
25
30
J Row K+J Rows
Emis
sio
n F
acto
r Control
Treatment 1
Treatment 2
Effect of Stocking Density on PM10 Emission Factor, lbs/day/1,000 hd

Objective B. Process-based emission models.
• Process-based modeling: – Mathematical expressions based on good understanding of
emission source(s) & causal mechanisms.
• Hypothet: – Modeling prediction/evaluation is generally cheaper than in-
field monitoring; but requires robust models.
• Major recent focus:
– Ammonia (Todd, Cole & Waldrip)
– Particulate matter, PM (dust) (Maghirang & Auvermann)
– Greenhouse gases: N2O, CH4, CO2. (Casey, Faulkner, Cole, Todd, Waldrip, Capareda, Mukhtar, Maghirang).

PM10 Conceptual Model, an example (Auvermann)
PM10 Emission Factor, EF (g/hd/d) = Pen Surface Dustiness, S (g/kJ)
X Animal Activity, AA (kJ/hd/d) In which: • S = “[Intrinsic] dust susceptibility” • Key Factors Affecting S: Varies spatially & temporally through 3
surface layer properties: – Moisture content – Bulk density – Depth
• USDA-NRCS Standard 375 addresses all three. • Pen surface assessment tool,
– Condition A, B, C, … – Descriptors.

Objective B. Process-based emission models.
• Measurement of GHG Fluxes from Feedyard Pens
using NFT-NSS Chamber Techniques (Casey)
• Objectives:
• Develop understanding of spatial, temporal and seasonal variations in N2O and CH4 fluxes from feedyard pen surfaces
• Collaborate with modelling community and contribute to improving models of GHGs from CAFOs. • Working with Heidi Waldrip USDA-ARS and through her with Al Rotz,
Bill Salas et al.

Why Non-Flow-Through – Non-Steady-State Chambers?
Advantages: • Dominant technique used by scientists for measurement of GHG fluxes
from other land and crop systems. • Well developed methodology and well supported in the scientific
literature • Very useful for developing an understanding of the emission processes Disadvantages: • Small area measured by each chamber may not be representative of a
large highly spatially varied area for determining overall emission rates • Integrative techniques such as eddy correlation (EC) and open path
measurement : • face significant operational challenges in the feedlot environment • Instrumentation to continuously measure N2O at required speed and resolution is very
expensive, has limited field deployment potential and is only just becoming available • Provides limited information for developing a understanding of the emission processes
because the spatial variability masks the response of individual areas

Two rows of five NFT-NSS
chambers installed in a pen at
Feedyard-C.
NFT-NSS chamber with top
installed and sealing skirt rolled
up.
GHG Sample Collection and Analysis

GHG Sample Collection and Analysis K.D. Casey
Air sample collected from NFT-NSS
chamber being injected into an
evacuated vial.
Gas chromatograph used for analysis
of GHG samples.

Methane and nitrous oxide flux rates for different pen areas (K.D. Casey)
Feedlot Greenhouse Gas Flux Rates (mg m-2 h-1)
Overall Near Feed Bunk
On Mound Near Water Trough
Mound Edge Visually Wetter Area
CH4 N2O CH4 N2O CH4 N2O CH4 N2O CH4 N2O CH4 N2O
Fyd-C – Oct 12 10.96 0.03 17.80 0.03 5.98 0.04 12.24 0.03 2.95 0.06 33.63 0.00
Fyd-A – Nov 12 4.85 9.85 7.66 46.57 2.95 4.05 2.91 1.32 -- -- 2.27 2.04
Fyd-C – Nov 12 1.40 0.15 1.82 0.01 0.10 0.45 0.74 0.26 0.17 0.14 -- --
Fyd-C – Dec 12 2.03 0.13 0.90 0.02 0.08 0.05 1.03 0.15 1.35 0.29 6.79 0.04
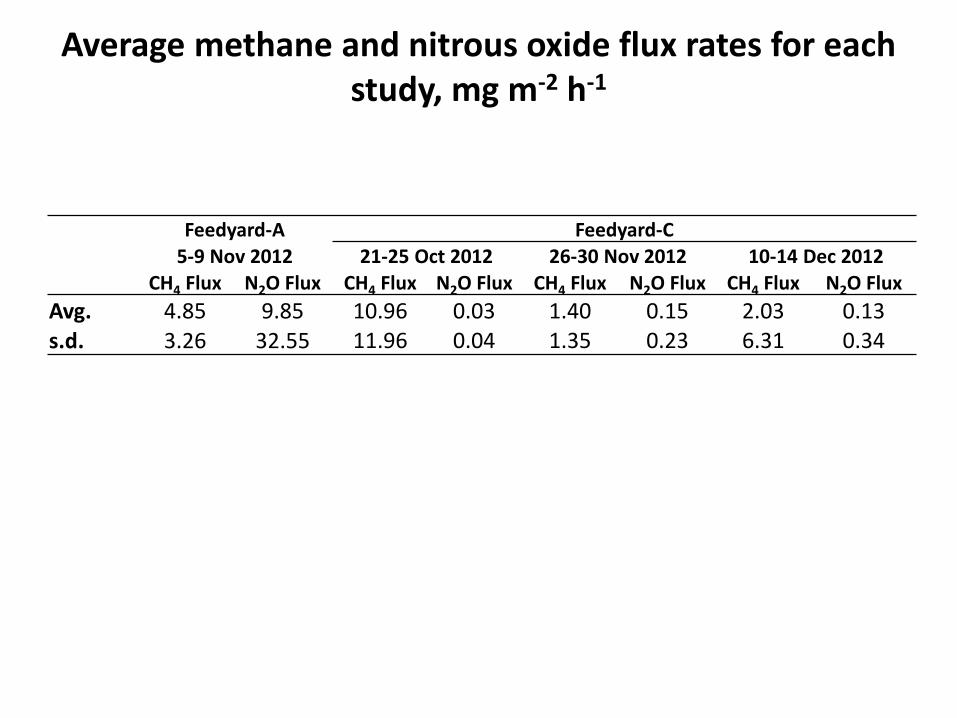
Average methane and nitrous oxide flux rates for each study, mg m-2 h-1
Feedyard-A Feedyard-C
5-9 Nov 2012 21-25 Oct 2012 26-30 Nov 2012 10-14 Dec 2012
CH4 Flux N2O Flux CH4 Flux N2O Flux CH4 Flux N2O Flux CH4 Flux N2O Flux
Avg. 4.85 9.85 10.96 0.03 1.40 0.15 2.03 0.13
s.d. 3.26 32.55 11.96 0.04 1.35 0.23 6.31 0.34
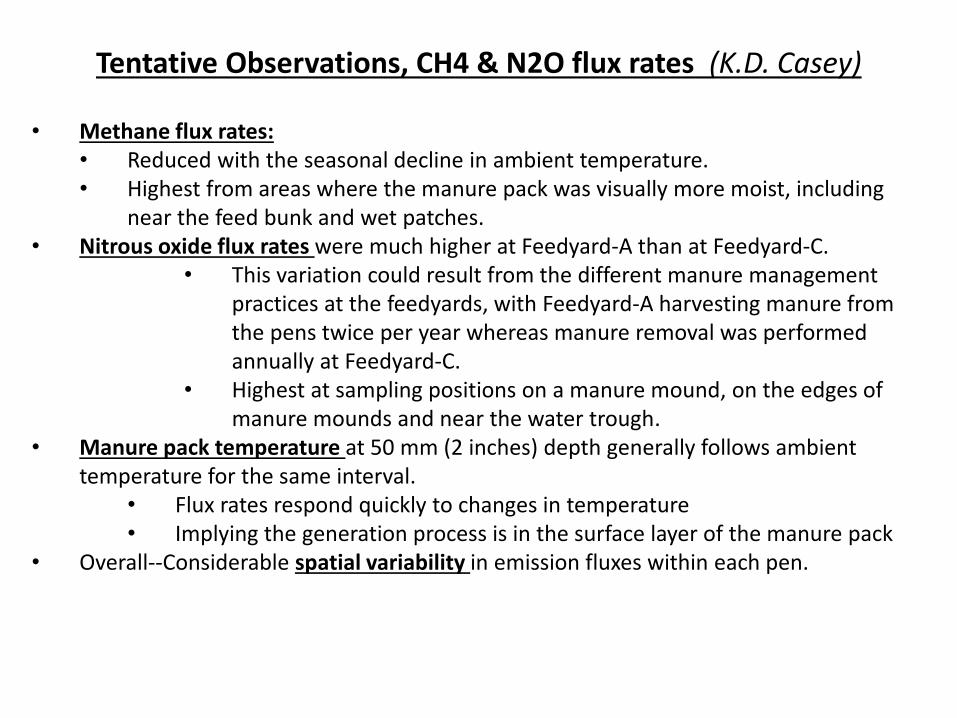
Tentative Observations, CH4 & N2O flux rates (K.D. Casey)
• Methane flux rates: • Reduced with the seasonal decline in ambient temperature. • Highest from areas where the manure pack was visually more moist, including
near the feed bunk and wet patches. • Nitrous oxide flux rates were much higher at Feedyard-A than at Feedyard-C.
• This variation could result from the different manure management practices at the feedyards, with Feedyard-A harvesting manure from the pens twice per year whereas manure removal was performed annually at Feedyard-C.
• Highest at sampling positions on a manure mound, on the edges of manure mounds and near the water trough.
• Manure pack temperature at 50 mm (2 inches) depth generally follows ambient temperature for the same interval.
• Flux rates respond quickly to changes in temperature • Implying the generation process is in the surface layer of the manure pack
• Overall--Considerable spatial variability in emission fluxes within each pen.

Open-Path FTIR , Methane & Nitrous oxide emissions (W.B. Faulkner & K.D. Casey)
• Goal - develop baseline greenhouse gas (GHG) emissions data from a Texas cattle feeding operations
• Issues – Dust obscured optics
– Alignment issues
– Inter-instrument bias
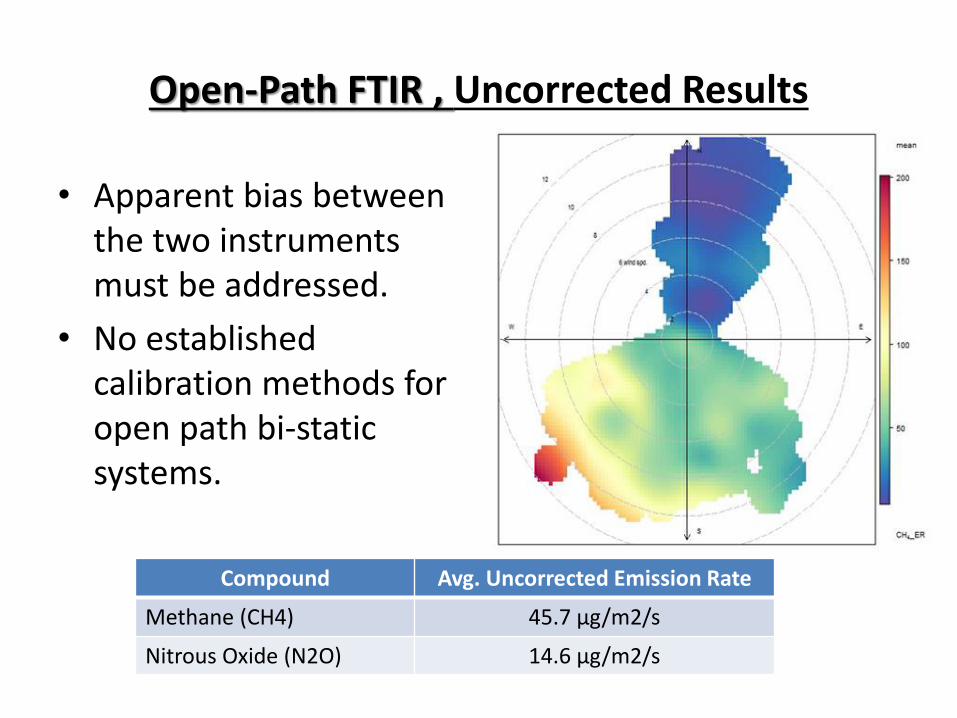
Open-Path FTIR , Uncorrected Results
• Apparent bias between the two instruments must be addressed.
• No established calibration methods for open path bi-static systems.
Compound Avg. Uncorrected Emission Rate
Methane (CH4) 45.7 µg/m2/s
Nitrous Oxide (N2O) 14.6 µg/m2/s
Next Steps Related to OP-FTIR (Brock Faulkner)
• Send northern (downwind) FTIR to MIDAC for repair.
• Setup both FTIRs side-by-side.
• Determine if post-hoc data correction can be conducted.
Objective C. Dispersion modeling, emission factors & regulation.
• Particulate matter, PM10: • Developed correction factors for non-EDP conditions;
translates measured concentrations from EPA’s FRM vs. TEOM sampler types (Parnell, Faulkner & Auvermann). – For low PM10 concentration (<100 µg/m2) & small particles (<10 µg
MMD): FRM concentrations = TEOM concentrations.
– For high PM10 Conc. (>100 µg/m2) & larger MMD (>10 µm): FRM= 0.6 x TEOM results.
– If oversampling bias due to very large PM sizes:
• FRM conc. = 0.5 x TEOM results.
– TEOM concentrations of PM10 at Fyd. C, non-EDP conditions (20 hrs/day), averaged: Sept. 169; Oct. 107; Nov. 43; Dec. 63 µg/m2.
– Derived Emission Factors (non-EDP conditions) varied 3-36 lbs/PM10/1,000 hd/day (11.5 average).
Objective C. Dispersion modeling, emission factors & regulation.
• Greenhouse gases, GHG: • Open–path FTIR at Fyd. C to measure nitrous oxide (N2O) emissions
. Downwind vs. Upwind N2O increased ~160 ppb across the feedyard. (Faulkner & Casey)
• Back-calculated emission rates were (Faulkner & Casey): – N2O = 14.6 µg/m2/sec;
– CH4 = 45.7 µg/m2/sec.
• Flux chambers had higher uncertainty values than source-integrated OP-FTIR & required more labor. (Faulkner & Casey)
• OP-FTIR had equipment issues. • Simultaneous use of both source-specific & source-integrated
sampling, may improve accuracy of determining GHG emission factors. (Faulkner & Casey)
Objective C. Dispersion modeling, emission factors & regulation.
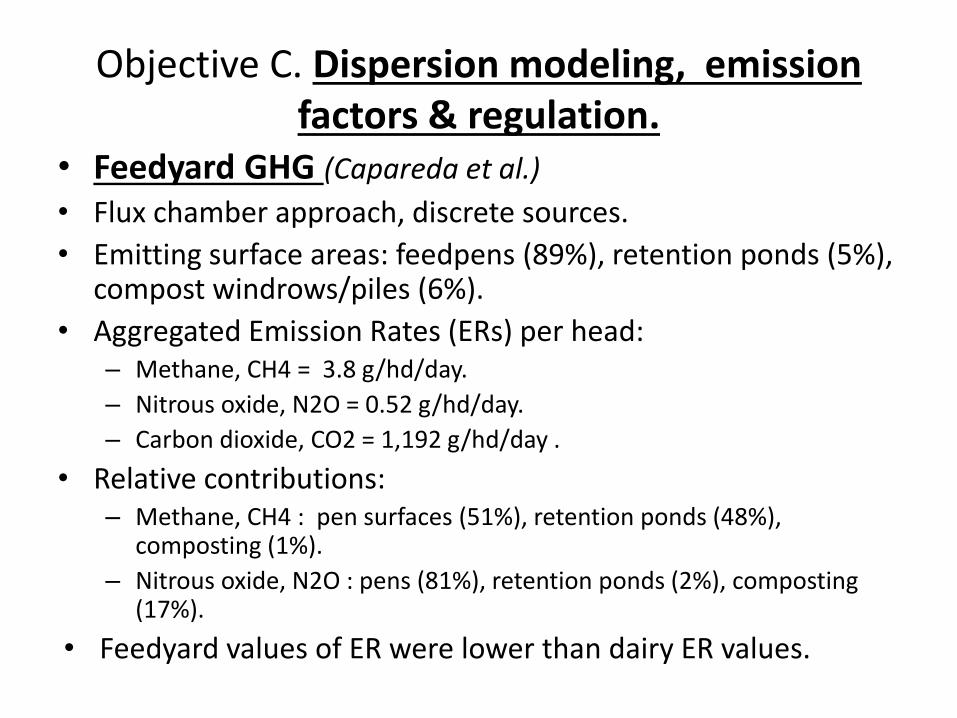
• Feedyard GHG (Capareda et al.)
• Flux chamber approach, discrete sources.
• Emitting surface areas: feedpens (89%), retention ponds (5%), compost windrows/piles (6%).
• Aggregated Emission Rates (ERs) per head: – Methane, CH4 = 3.8 g/hd/day.
– Nitrous oxide, N2O = 0.52 g/hd/day.
– Carbon dioxide, CO2 = 1,192 g/hd/day .
• Relative contributions: – Methane, CH4 : pen surfaces (51%), retention ponds (48%),
composting (1%).
– Nitrous oxide, N2O : pens (81%), retention ponds (2%), composting (17%).
• Feedyard values of ER were lower than dairy ER values.

Objective D. Technology Transfer to Stakeholders
• Final-year report: • Stakeholder Advisory Committee, met w/investigators 2011 &
2012. • In-depth short courses (8) for state regulators TX, KS, IA, etc. • Annual updates to TCFA Research Committee. • County Extension & TCFA feedyard management seminars (7),
May 2013—So. Tx, So. Plains, Panhandle. • Bulletins & fact sheets (10)— eXtension websites, UN-
L/NLPELC & AgriLife Extension. • Policy-relevant summaries—1 ready; 5 drafted. • Webinars (8)– ditto. • Co-Funding: $0.9 million, (0.9:1 leveraging of federal dollars). • Presentations (22), prof. papers or abstracts (24); 32 peer-
reviewed journal articles; M.S. theses (2).