sonoma marin area rail transit district · pdf filepage | 3 background as required in the...
TRANSCRIPT

Sonoma‐Marin Area Rail Transit District
Strategic Plan 2014
BOARD OF DIRECTORS APPROVED DECEMBER 17, 2014

Board of DirectorsJudy Arnold, Chair Marin County Board of Supervisors Barbara Pahre, Vice Chair Golden Gate Bridge, Highway and Transportation District Jim Eddie Golden Gate Bridge, Highway and Transportation District Shirlee Zane Sonoma County Board of Supervisors Debora Fudge Sonoma County Mayors and Councilmembers Association Stephanie Moulton‐Peters Marin Council of Mayors and Councilmembers
Jake Mackenzie Sonoma County Mayors and Councilmembers Association Kathrin Sears Marin County Board of Supervisors Madeline Kellner Transportation Authority of Marin Gary Phillips Transportation Authority of Marin Carol Russell Sonoma County Mayors and Councilmembers Association David Rabbitt Sonoma County Board of Supervisors
District ManagementFarhad Mansourian Erin McGrath General Manager Chief Financial Officer
Citizens Oversight CommitteeRuss Colombo, Chair Steve Birdlebough Peter Breen Dennis Harter Patricia Kendall David Oster Steve Rabinowitsh Tanya Narath, alternate Julia Violich, alternate

P a g e | 1
TABLE OF CONTENTS
EXECUTIVE SUMMARY .................................................................................................................................. 2
BACKGROUND ............................................................................................................................................... 3
GUIDELINES ................................................................................................................................................... 4
PROJECT DESCRIPTION AND UPDATE ........................................................................................................... 7
FUTURE PHASES .......................................................................................................................................... 10
OPERATIONS AND MAINTENANCE ............................................................................................................. 13
FINANCIAL PROJECTIONS ............................................................................................................................ 15
CONCLUSIONS ............................................................................................................................................. 20
APPENDIX A: MEASURE Q SALES TAX BACKGROUND ................................................................................. 21
APPENDIX B: FINANCIAL MODEL................................................................................................................. 25
APPENDIX C: SMART PATHWAY MAPS ....................................................................................................... 27

P a g e | 2
EXECUTIVE SUMMARY Measure Q, adopted by voters in 2008, authorized a new quarter‐cent sales tax for the
construction, operation, and maintenance of the SMART project. The accompanying Expenditure Plan required the SMART Board of Directors to prepare a Strategic Plan to guide implementation of the project and to update the plan at least every five years. It also required the Plan to be reviewed by a Citizens Oversight Committee appointed by the Board of Directors.
This 2014 Strategic Plan provides revised estimates of revenues and expenditures for SMART’s capital and operating costs and presents the District’s current financial plan for building and operating the SMART project through the expiration of the Measure Q tax in 2029.
The 2014 Strategic Plan emphasizes the following objectives of the Measure Q program:
Optimize the use of sales tax dollars;
Leverage SMART revenues to maximize outside funding sources; and
Support timely and cost‐effective project delivery.
The Plan was developed in cooperation with the Citizens Oversight Committee prior to presentation to the Board. The materials presented here represent the most current information available on the SMART project. Notably, SMART’s capital and operating costs have been revised from the 2008 Expenditure Plan to reflect the District’s approach to completing and operating the project in phases, and Measure Q sales tax projections have been adjusted to reflect the impact of the 2008 recession and subsequent recovery. These changes reinforce the need for the Strategic Plan to be flexible, and for future updates to the Strategic Plan to reflect changing conditions.
The 2014 Strategic Plan is organized into the following sections:
Background – an overview of the challenges confronting the project since 2009;
Guidelines – a set of guidelines that provide a framework for implementing the project;
Project description and update – a review of the strategic decision to construct the project
in phases, and a summary of the work completed on Phase 1 and projected costs;
Future phases – an overview of remaining project elements and their estimated costs;
Operations and maintenance – a description of the operating divisions and preliminary
operating plan;
Financial projections – a tabulation of revenues and capital and operating costs, and the
alignment of revenues and expenditures in a cash flow model;
Conclusions – observations concerning the financial viability of the SMART project; and
Appendices – more detail on tax revenues, the financial model and the SMART pathway.
Considerable progress has been made on the capital program in the past five years with the construction of Phase 1 approximately halfway complete. The District is preparing for the initiation of passenger rail service in 2016, as well as activation of many sections of the bicycle and pedestrian pathway. The Strategic Plan outlines the fiscal stability of SMART to the end of the Measure Q tax approved overwhelmingly by voters and provides useful details on the components of the plan, including sales tax revenue collection to date and projections for the future, other capital and operating revenue projected going forward and corresponding operating costs for the next 15 years. Outreach to and surveys of the community show that the public is very interested in using the alternative to Highway 101 that SMART provides for both work and recreation.
P a g e | 3
BACKGROUND
As required in the passage of Measure Q in 2008, SMART must complete a Strategic Plan every five years. In 2009, SMART prepared and approved its first Strategic Plan, which focused on initiation of the SMART capital project and the funding available for that project. That Strategic Plan recognized that the 2008 recession and a more detailed engineering review of the proposed project had significant implications for project planning and delivery. While SMART had anticipated an economic downturn in its initial Measure Q revenue projections, just like major public and private agencies throughout the nation, it could not have foreseen the severity of the recession and impact on sales tax revenues. At the same time, the detailed engineering review identified needed changes to the scope and cost of the project to deal with factors such as new regulatory requirements (e.g., positive train control, emissions standards), construction in an active freight corridor, and environmental mitigation measures, to name a few.
Despite the challenges posed by the downturn, in the fall of 2010 and early 2011 the SMART Board of Directors held a number of public meetings and a workshop specifically designed to address those challenges. During this process, experts from the staff of the Metropolitan Transportation Commission provided critical review and assistance. With further input provided by the Citizens Oversight Committee during and after the Strategic Plan process and additional funding provided by Sonoma County Transportation Authority (SCTA), Transportation Authority of Marin (TAM) and the Metropolitan Transportation Commission (MTC), the Board made a difficult decision to move forward to build the project in phases, rather than wait and subject the region to further delays and uncertainties in project cost escalation. The Board’s initial direction was to commence with Phase 1 of the SMART project, an initial operating segment running from downtown San Rafael to Railroad Square in Santa Rosa. The ability to move quickly during a slow economic time led to excellent bid results and further project expansions extending the project to an additional station at Guerneville Road in Santa Rosa, a station at Atherton/San Marin in Novato, and then ultimately to Airport Boulevard in Sonoma County.
The importance to the region for the SMART project continues to grow five years after the last Strategic Plan. Currently, the only transportation infrastructure of significance connecting the two counties is Highway 101. In 2011, Marin saw a 43% increase in congestion and in 2012 Sonoma saw a 44% increase over the previous year. Caltrans data shows that the Marin and Sonoma sections of Highway 101 were among the top 10 congested freeways in the Bay Area in 2012. Over 80% of all North Bay commercial, residential, health care and educational facilities are located along the SMART corridor, including four community and state college campuses. More than 30% of the jobs in Marin and Sonoma County are located within one‐half mile of the SMART corridor. With the start of SMART passenger rail services, paired with the completion of portions of the SMART pathway, another viable transportation alternative to the private automobile will finally exist along the corridor, connecting Bay Area transit services and state‐wide rail networks to the North Bay.

P a g e | 4
GUIDELINES
As part of the 2009 Strategic Plan, the SMART Board of Directors adopted guidelines for the implementation of the project, with the understanding that those guidelines may need to be revised over time as the program matures. As the project transitions from the predominantly construction phase to initial testing followed by full operations, the guidelines have been revised as part of the 2014 Strategic Plan. The following eight guidelines are designed to provide a framework for SMART in the implementation of the capital project and the operation of the SMART commuter rail and pathway.
Guideline 1 – Use of Measure Q Funds
In light of the changes in project cost estimates and projected revenues, Measure Q funds should be applied to the following priorities:
Completion of the current construction project: Currently, SMART is constructing Phase 1 of the entire SMART project, which is building rail from the Sonoma County Airport station to the San Rafael downtown station. Phase 1 also includes the completion of many segments of the SMART pathway pending approval of various permitting agencies.
Fully fund Phase 1 rail and path operations: SMART Phase 1 rail operations are scheduled to begin in late 2016. Before that time, there are numerous SMART pathway segments that will be placed into service, including the CalPark tunnel path and the Santa Rosa pathway from Eighth Street to West College Avenue which are already heavily used. Measure Q funds will be allocated for operation and maintenance going forward.
Fund prudent reserves: There are a number of best practices related to the establishment of reserves for public agencies. SMART will establish reserves as necessary to ensure against unknown fluctuations in expenses and unpredictable revenue downturns.
Leverage additional funds for remaining project elements: Currently, SMART has received significant funding to assist with an extension of Phase 1 from its current Marin terminus in downtown San Rafael to Larkspur just south of the CalPark Tunnel. Measure Q funds will be utilized for this extension as well as for future extensions of the rail and pathway to ultimately reach Cloverdale.
Guideline 2 – Annual Program Reporting
Measure Q required that the Chief Financial Officer prepare a report setting forth the funds collected and expended and the status of any project component authorized to be funded in the 2008 Expenditure Plan. SMART has provided these annual reports and will continue to do so as part of the Measure Q program. Although currently the annual report details progress on the building of the rail and pathway, future reports will begin to bring greater focus on operations details and activities such as SMART property development and any future coordination on freight activities.
P a g e | 5
Guideline 3 – Annual Independent Financial Audits
SMART’s enabling legislation and the 2008 Expenditure Plan require the District to undergo an independent financial audit each year. In addition to this requirement, good fiscal practice requires that government entities prepare annual financial statements that are in compliance with standards set by the Government Accounting Standards Board (GASB). SMART currently utilizes the County of Sonoma for accounting services, until such time as the District deems it appropriate to perform those functions in‐house. SMART also uses the services of an independent auditor obtained through a public procurement process in 2012. As of Fiscal Year 2013‐14, SMART has converted to reporting its financial activities on an enterprise accounting basis, which is the same practice as most other government transit agencies. For its first ever Comprehensive Annual Financial Report of Fiscal Year 2012‐13, SMART received an Award of Financial Reporting Achievement from the Government Finance Officers Association.
Guideline 4 – Multi‐Jurisdictional Coordination
SMART will continue to work closely with the municipalities located along the project corridor, as well as with Marin and Sonoma county transportation and transit agencies, to ensure that the project is closely coordinated with existing and future transportation planning efforts and achieves the goal of serving riders and improving the quality of life and the environment. As Phase 1 nears completion, the District is actively engaged with technical advisory committees, working groups, and steering committees comprised of various regional players to address specific issues such as “first and last mile” connections between the rail and home or work destinations, station design and amenities, fare coordination and collection, and pathway improvements.
SMART will also continue to maintain a close working relationship with the North Coast Railroad Authority (NCRA) to ensure that capital improvements meet the needs of freight rail traffic, which shares the right‐of‐way with SMART passenger service. Improvements along the 43‐mile initial operating segment include gauntlet tracks at each station, upgraded freight rail sidings, passenger rail vehicles that meet Federal Railroad Administration standards, and installation of “positive train control” equipment on all locomotives and along the entire right‐of‐way.
Similarly, additional coordination with law enforcement, fire and safety agencies, and regional and state emergency preparedness services has already begun. These important relationships are a priority for SMART now and into the future.
Guideline 5 – Ongoing Planning for Future Phases
SMART will continue to conduct planning and engineering work to support future project elements, and to pursue funding for those elements. This will ensure continuity and enable the District to respond quickly when new opportunities are identified. The current financial plan provides enough funding to keep necessary staffing for that effort on an ongoing basis. See page 10 for further discussion and detail on the cost estimates and strategies for funding these extensions.

P a g e | 6
Guideline 6 – Citizens Oversight Committee
The Citizens Oversight Committee is responsible for providing input and oversight for the update of the Strategic Plan. The committee will review the financial plan and underlying revenue and expenditure assumptions, provide comment on the draft document, and present an updated Strategic Plan to the Board for its consideration. The Citizens Oversight Committee held meetings in May, August and October of 2014 that were open to the public. The Plan was also available on the SMART website for comment in advance of the Board of Directors discussion of the document.
Guideline 7 – Amendment to Strategic Plan Guidelines
As the project progresses, SMART may find the need to revise, delete, or add new guidelines. Guidelines can be revised, deleted, or added during subsequent Strategic Plan updates or at any time by resolution of the SMART Board of Directors.
Guideline 8 – Update of the Strategic Plan
Consistent with the 2008 Expenditure Plan approved by voters, the Strategic Plan will be updated at least once every five years and approved by the SMART Board of Directors. Strategic Plan updates will continue to be developed with input from the public and the Citizens Oversight Committee.

P a g e | 7
PROJECT DESCRIPTION AND UPDATE
The SMART project will ultimately extend from Cloverdale in Sonoma County to Larkspur in Marin County, and includes passenger rail service as well as a bicycle and pedestrian pathway along much of the rail line. The project was originally envisioned to be built in its entirety as a single construction project, but as discussed in the Background section, in response to the 2008 recession and revised project cost estimates, the SMART Board of Directors elected to construct the project in phases (see Figure 1). Phase 1 focuses on the corridor between downtown San Rafael and northern Santa Rosa. Subsequent phases will extend the corridor north to Cloverdale and south to Larkspur, thus completing the original project scope. The 2014 Strategic Plan focuses on Phase 1 currently underway.
FIGURE 1: SMART PROJECT CORRIDOR
P a g e | 8
In the fall of 2011, SMART kicked off the first phase of the SMART project to rehabilitate and upgrade the rail corridor between downtown San Rafael and Santa Rosa, and build an adjacent bike and pedestrian pathway. Five major contract packages have been awarded to deliver the numerous elements of the capital project. Together, these contracts are injecting more than $250 million dollars directly into the economy to deliver the most significant infrastructure improvement project in the North Bay in generations as well as a substantial economic stimulus to our local region.
SMART contractor Stacy & Witbeck/Herzog of Oakland, California, has completed 36.5 miles of mainline track reconstruction in Sonoma and Marin, with additional mileage and track sidings under reconstruction through the end of 2014. In addition, SWH has rebuilt or repaired 22 bridges and rebuilt 36 grade crossings. Project materials are made in the U.S., with steel rail manufactured in Colorado, concrete ties in Washington, and 100% of ballast coming from local suppliers. The 60‐100 year‐old track bed and rails are being replaced to the standard of FRA Class 4, or for speeds up to 79 miles per hour, and the creation of a new signal system to control train movements and implementation of safety measures for the entire right‐of‐way are being completed. More than 63% of subcontractors on the job are local, adding more than 138,500 local labor hours to the region.
SMART is also well on its way towards receiving the first of seven two‐car train sets to serve the 43‐mile first phase of the SMART rail system. These energy‐efficient, Tier 4 compliant train sets, built by Sumitomo Corporation of America/Nippon Sharyo USA, will begin to arrive in spring of 2015. Each two‐car train set has capacity for up to 158 seated passengers, 160 standing passengers and 24 bicycles, depending on the mix of bikes, wheelchairs, strollers and the use of flip seats. Future options exist within the contract to procure a third car for the train sets to expand capacity, options that were recently preserved by the Board through an amendment approved in October of 2014 (see page 13 for more discussion).
Shimmick Construction, also of Oakland, California, was awarded a contract in late 2013 to build the rail infrastructure from the Civic Center Station in Marin to Downtown San Rafael. That contract is also replacing the Haystack Bridge over the Petaluma River, completing station improvements at all 10 stations, building the Operations and Maintenance Facility (OMF) near the Airport Station and developing seven pathway segments. Those pathway segments to be constructed next year are as follows:
North San Pedro to Civic Center Drive (San Rafael)
Main Gate Road to Pacheco Creek (Novato)
Franklin Pedestrian Crossing to Grant Avenue (Novato)
Rush Creek Place to Atherton (Novato)
Manor Drive to East Cotati Avenue (Cotati)
Bellevue Avenue to Hearn Avenue (Santa Rosa/Sonoma County)
6th Street to 8th Street (Santa Rosa)
Please see Appendix C for more detailed maps regarding existing, funded and future pathways.
Shimmick also has completed utility installations at the OMF and is currently constructing the foundations for the building structure. The Haystack Bridge is also under construction with nearly all foundation work complete. Finally, work on the remaining track segments from the Marin County Civic Center to Downtown San Rafael is well underway.
In addition to the seven segments of multi‐use pathway included in the Shimmick contract, the following pathway segments are also funded as part of Phase 1, but the work cannot be awarded until

P a g e | 9
the completion of the federal environmental process, expected in early 2015. Those segments are as follows:
East Cotati Avenue to Southwest Boulevard
Southwest Boulevard to Golf Course Drive
College Avenue to Guerneville Road
On an ongoing basis, the District continues to plan for additional pathway segments that provide critical access to SMART stations, have high potential use, provide critical access across geographic and physical barriers, or bridge gaps between existing pathway segments. In a number of cases, those segments are a cooperative effort with our partners in the region, such as the recently completed section in Santa Rosa from 8th Street to College Avenue. Similarly, the Cal Park Hill Tunnel was completed and opened in 2011 in conjunction with the County of Marin and has facilitated bicycle and pedestrian trips between San Rafael and Larkspur. Future pathway segments funded for construction through grants and Measure Q include Guerneville to College in Santa Rosa and Golf Course Drive to East Cotati Avenue in Rohnert Park and Cotati.
The current estimate for Phase 1 project expenditures is $427.9 million. This amount includes the contracts to build the rail infrastructure and several pathway segments between downtown San Rafael to the newest station at the Sonoma County Airport. It also includes the seventh train car set required to provide full service to all stations within Phase 1.
The project cost estimate includes contingencies for work not yet incorporated into existing contracts as well as unknowns that remain to be resolved. These unknowns include the costs associated with a permit approval process which have substantially exceeded the initial estimates, increased environmental mitigation and management costs, and unanticipated utility relocation costs. Because there are still uncertainties in a project spanning a 43 miles, there may be future project cost adjustments needed.
Below is the breakdown of direct construction dollars related to the total project costs. Over 81% of the project costs are in direct construction contracting costs. Less than 19% are for project management costs, commonly known as “soft costs,” which includes all construction management, design support, permitting, environmental, real estate, and other costs. This ratio falls well within the range of less complicated capital projects, as industry standards can range from 20% up to 40%.
Phase 1 Capital Costs
Construction Contracts $347.8 million
Capital Project Management $80.1 million
Total $427.9 million

P a g e | 10
FUTURE PHASES
SMART remains committed to completing the entire 70‐mile corridor from Cloverdale in Sonoma County to Larkspur in Marin County. Just as the District aggressively pursued outside funding to close the gap for Phase 1, and has consistently expanded the elements that will be delivered in that first phase, SMART will continue to seek funding partners to address the remaining project elements. While the current financial plan includes only those grants that have already been awarded, and reflects conservative projections for growth in sales tax revenues, those and other sources could generate additional revenues that could be applied to extensions of both the rail project and the pathway. As funding is identified, additional elements will be added to the project. The major project elements and estimated costs include (in alphabetical order, amounts approximate):
Future Project Elements
Bicycle/pedestrian pathway $40 million
Cloverdale extension $61 million
Healdsburg extension $46 million
Larkspur extension $40 million
Petaluma additional station $11 million
Windsor extension $27 million
Total $225 million
While logically project extensions might be built geographically going North and South, there may be funding scenarios or other considerations such as public‐private partnerships with other entities that activate certain segments before others. For example, the Larkspur extension represents the most likely next phase of the project, given MTC’s allocation of $20 million in Regional Measure 2 funds, the project’s acceptance into the federal “Small Starts” program, and receipt of $2.5 million for preliminary engineering (described later in the financial projections section of this report). No additional rail vehicles will need to be purchased to serve this extension, and operating expenses for the rail extension are minimal. Current projections of the incremental cost to SMART are $35,000 annually.
The District’s Grade Crossing Improvement Project, a $12 million project funded with federal funds, Measure Q and NCRA matching funds, has improved 39 crossings to‐date within the 70 mile corridor, 14 of which were North of Santa Rosa outside of Phase 1 construction. This project made those grade crossings safer, bringing them in compliance with current regulatory standards.
Likewise, pathway funding opportunities may be based on considerations other than geographic extensions to existing pathways. SMART’s anticipated 2014 completion of federal environmental clearance (“NEPA”) on the Pathway will enable SMART to apply for federal funding to construct segments between Marin Civic Center and Guerneville Road. This process has also enabled significant progress to be made with permit agencies towards an understanding of Pathway construction permitting requirements. Moving forward, SMART continues to apply multiple criteria for prioritizing SMART Pathway segments for completion. The Sonoma County Transportation Authority (SCTA) programmed Measure M sales tax funds for NEPA clearance and final design of SMART Pathway in Sonoma to be “ready to go” when construction funding is available. The San Francisco Bay Trail also
P a g e | 11
provided funding for design work on a segment of the SMART Pathway in order to move that eligible segment towards being “construction ready”. Below is a listing of the future segments identified and included in our $40 million planning cost estimate. From South to North the segments are:
o McInnis Parkway to Smith Ranch Road
o Smith Ranch Road to Main Gate Road
o Pacheco Creek to Bay Trail
o Hannah Ranch Road to South End Rowland Boulevard
o South End Rowland Boulevard to North Novato Creek
o Grant Avenue to Rush Creek Place
o Lakeville to Payran Street
o Payran Street to South Point Boulevard
o South Point Boulevard to Corona Road.
o Corona Road to Ely Road
o Ely Road to Main Street
o Main Street to East Railroad Avenue
o East Railroad Avenue to Manor Drive
o Golf Course Drive to Todd Road
o Todd Road to Bellevue Avenue
o Prince Greenway to 3rd Street
o 3rd Street to 6th Street
Please see further detail in the maps located in Appendix C showing pathway segments that are funded, planned or to be built in cooperation with other agencies.
Other funding strategies for future rail and pathway segments will include targeting the following programs:
California Cap and Trade funds for Transit and Intercity Capital Rail are currently beingdiscussed in Sacramento and allocated to various state transportation programs
Freight and “goods movement” funds through State and Federal programs addressing thestate and regional rail networks would be available for portions of the track available forfreight expansion.
Federal USDA and other agriculture funding may provide financing for our moreagriculturally intensive northern section
Regional Funds through the Metropolitan Transportation Commission including additionalbridge toll funding which has provided significant funding for Phase 1
FTA Small Starts program which is currently considering a construction grant submitted lastmonth for the Larkspur Extension. There may be other elements which would qualify forthis funding in the future

P a g e | 12
Sonoma County Transportation Authority and Transportation Authority of Marin continueto work with SMART on strategic partnerships and funding opportunities.
Future State or Regional Ballot Measures that fund transportation infrastructure
Measure Q Sales Tax: As noted previously, the financial plan uses an assumption of 3%annual growth in sales tax revenues. However, a one percent increase in the projectedannual growth rate (from 3% to 4%), would generate an additional $324,733 in Fiscal Year2015, and if that growth continued annually through 2029, it would generate an additional$52 million. Those revenues could be used toward extensions or to meet the incrementaloperating costs of future project extensions.
Our grants and planning staff are working every day on investigating funding options, preparing grant applications and building partnerships to achieve progress on the work still to be done on the 70‐mile overall SMART project. Recent successes in 2014 have included grants for Clipper Fare equipment from the Metropolitan Transportation Commission, a grant from Caltrans to create a bicycle parking investment plan, and matching grants from the Sonoma County Agricultural Preservation and Open Space District program for the SMART Pathway from Payran Street to Southwest Boulevard over the Petaluma River.
While we continue to pursue these strategies to build beyond Phase 1 between Larkspur in Marin and Airport Boulevard in Sonoma, we are budgeting for shuttle buses to the stations not yet reached by the train. While the details of the service are still in the planning stages, every effort will be made to ensure that riders from those stations have a way to get to the SMART train.

P a g e | 13
OPERATIONS AND MAINTENANCE
Passenger rail service is scheduled to start in late 2016, with testing beginning in spring 2015. SMART has prepared preliminary operating plans and defined the basic structure of an Operations Department, which will be comprised of three functional divisions:
The Transportation Division, which staffs and moves the trains themselves. The division includes staff that dispatch trains, monitor train movement and train handling, provide field supervision, training, and train operators. This division will also manage future bus connections that will be needed to reach rail passengers in Larkspur and Cloverdale.
The Vehicle Maintenance Division, staffed by maintenance technicians and utility personnel who maintain, repair, clean, and service SMART’s passenger cars, as well as the mobile equipment needed to maintain the infrastructure and respond to urgent problems that will, inevitably, arise. This division will perform federally‐required inspection and maintenance procedures and other regulatory compliance.
The Maintenance and Way Division, which maintains tracks, bridges, stations, buildings, grades crossing warning devices (gates, flashers, bells), electronic equipment, and the train signal system which is the key to safety in railroad operation. This division will also oversee maintenance of the SMART pathway.
The Operations Department is currently projected to consist of 80 staff positions when fully staffed. Authorization for 29 positions is included in the FY 2014‐2015 budget to support acceptance and testing of train cars, maintenance and testing of new track and signals as they are turned over from construction contractors. The FY 2015‐16 budget will include funding for the remaining staff needed before full operations begin.
When full service begins, the operating plan includes 15 northbound and 15 southbound trains every weekday, spread across the morning and evening commute hours with roughly 30‐minute headways, and at least one mid‐day train in each direction. Current proposed weekend service provides four trips in each direction, with options for possible future weekend service expansion under discussion.
Trains will travel approximately 30 minutes apart, and the 43‐mile trip from downtown San Rafael to the Sonoma County Airport station will take approximately 67 minutes in either direction. Trips between San Rafael and downtown Petaluma will take only 31 minutes. Trains can travel at a top speed of about 80 mph, with an end‐to‐end average “commercial speed” (including stops, station dwell time, deceleration and acceleration time) of about 40 mph with an enforced signal system. Trains will feature level boarding from station platforms, all‐door entry and a 30‐second station “door open” dwell time, and comfortable seating.
The operating plan is based on ridership projections originally prepared in 2011 for the initial operating segment (see February 16, 2011 Board Meeting, www.sonomamarintrain.org). Ridership within the initial operating segment represents more than 75% of the total projected ridership for the entire corridor, with the greatest station utilization in Novato, Petaluma, and San Rafael. Bus connections to the ends of the rail line will provide service to the entire SMART project area. The 15 trains in each direction are anticipated to satisfy weekday ridership projections.
This year, to investigate ridership assumptions at a more detailed level, SMART began the first of a series of surveys of potential riders to investigate SMART’s passenger market. This summer’s general phone survey of over 1,000 residents of Marin and Sonoma County found some interesting results. They

P a g e | 14
are as summarized in the box below:
SMART 2014 SURVEY DATA HIGHLIGHTS
• 65% of potential respondents “screened‐in” to the survey, by indicating they wouldconsider riding SMART
• 91% of those responding said they would consider riding SMART if the service andschedule fit their needs
• 87% of potential SMART riders currently use cars for day‐to‐day travel, which tracksclosely with recent data from other area transit agencies
• 64% of respondents would consider riding 1‐3 days per week
• 15% would ride 4‐7 days/week
• 61% of respondents favor a tiered‐zone fare, 27% a flat fare
• 45% would pay $5 to ride the train one way, another 45% of respondents would pay
between $7 and $12 to ride the train one way
These and other results from the survey support our current expectations about ridership and fares that are contained in the Strategic Plan (fare revenue is discussed in more detail below). SMART continues to survey other groups, including major employers in the two counties, as well as employee surveys in cooperation with those employers. Each of these surveys will continue to educate the District on future service needs and transportation patterns. These models and surveys are very useful for planning purposes, and provide evidence that the District should plan for the possibility that ridership will be much higher than our current models anticipate. Recently, the SMART Board of Directors approved an amendment to the District’s contract with rail car builder Sumitomo Corporation of America. In the amendment, designed in part to address the potential for many more riders than our current model predicts, SMART negotiated a change in the expiration date for purchase of additional rail car “options”. Rail car options provide SMART the ability to purchase additional cars at the price that was negotiated for those cars back in 2010. Currently all of SMART’s options will expire by December 2015, almost one year before train service begins. The best time to determine if additional vehicles are needed to serve the required demand will be within a year after start of our passenger service. The amendment approved in October 2014 extended the option period to purchase three more cars for SMART to December 31, 2017, when SMART is in operation and can best determine if the need for additional cars exists.
P a g e | 15
FINANCIAL PROJECTIONS
A key component of this Strategic Plan is to demonstrate SMART’s ongoing ability to both build and operate the SMART project. The 2009 Strategic Plan adopted a cash flow approach that aligned projected revenues with capital and operating costs over the 20‐year period of the Measure Q sales tax. The 2014 Strategic Plan utilizes the same cash flow approach, but incorporates revisions to the project scope and cost estimates and greater delineation of operating costs, as well as additional funding sources and revised sales tax projections.
The sections below provide descriptions of the project’s revenue sources, capital and operating expenses, and estimated values. The financial plan aligns revenues and expenses to illustrate the financial viability of the Phase 1 project and the District as a whole during passenger service.
Operating and Capital Revenues
The SMART project and future operations are supported with a variety of funding sources:
Measure Q Sales Tax: The 20‐year quarter‐cent local sales tax is the single largest source of revenues for SMART. With collection that started in April 2009, the sales tax is projected to generate $756.6 million over 20 years, when it sunsets in April 2029. Sales tax receipts that SMART received in the first years of the tax were lower than initially projected between 2009 and 2013 due to the 2008 recession, but receipts have shown significant recovery in the last several years. In fact, actual sales tax receipts grew by 5.9% in the 2012 fiscal year, 7.1% in 2013, and grew by 6.7% in 2014, a three year average increase of 6.6%, which reflects a strong regional recovery from the “great” recession. SMART is currently projecting growth of 3% annually for the remaining life of the tax. While actual sales tax receipts may fluctuate (up or down) from year to year, the 3% average growth represents a reasonable assumption over the remaining life of Measure Q. Appendix A includes a more detailed discussion of this sales tax projection including historical analysis.
Farebox Revenues: Passengers will pay for fares using the regional Clipper system. SMART has based its revenue projections on an initial fare structure that is distance‐based, that is, a passenger’s individual fare is based on the origin and destination points for each trip. This fare structure is similar to other train operators in the Bay area (e.g., BART and Caltrain), as well as Golden Gate’s bus service in the Marin‐Sonoma corridor. SMART determined an average fare per passenger (weighted for shorter and longer trips) and multiplied the average fare by projected ridership from the operating plan, and heavily discounted in the first two years of operations to account for a buildup of ridership during that time. On average, in the financial model, average fares (including passes and discounts) are projected to increase by 3% annually; however total farebox revenues are projected to grow 5.6% on average as the service becomes more familiar, trips taken become longer and the regional economy expands. However to account for the uncertainty of projecting a service that has no historical basis, total fare revenues were reduced overall by 20% . At the start of service in late 2016, the average overall fare is assumed to be $5.07. For comparison purposes, comparable fares for transit service in the Bay Area ranges from $5.00 to $13.00 per trip.
State Transit Assistance (STA): Historically, the State of California has provided operating assistance to public transportation agencies from sales tax collected on diesel fuel. This is allocated by formula to agencies for transit operations and capital. STA operating assistance is

P a g e | 16
projected to equal $15.3 million cumulatively in future years. This estimate was developed in conjunction with the Metropolitan Transportation Commission (MTC) in 2011 in advance of SMART’s bond sale and continues to be a reasonable projection at this time.
Joint Development and Leases: SMART plans to utilize certain properties within the corridor to generate revenues through various joint development projects for housing, office, or retail use, principally at the downtown Santa Rosa and Petaluma stations. SMART had entered into a development agreement for its Railroad Square property in Santa Rosa, an agreement which is not currently active. In addition to revisiting this development potential, SMART plans to initiate a planning process for its Petaluma property. Proceeds from these joint development projects could take the form of a lump sum payment for land value, or an ongoing payment from a ground lease for an extended period of time (typically 60 to 75 years, depending on the estimated life of the asset). The financial plan assumes two parcel payments in 2018 and 2019, and on‐going lease revenues from 2019 through 2029, for a total of $8.1 million.
Regional, State, and Federal Grants: Over the last five years, SMART has aggressively pursued any and all opportunities to leverage the local Measure Q sales tax revenues to attract additional funding from regional, state, and federal sources. This strategy was critical to addressing the project shortfall created by the recession and decline in projected sales tax receipts. To date, the District has been awarded grants in the amount of $122.6 million from a variety of agencies, as summarized below. These funds are being used for Phase 1 construction costs.
Regional, State, and Federal Grants Received to Date
Sonoma County Transportation Authority Measure M $16.2 million
Metropolitan Transportation Authority Bridge Tolls (RM2) $48.4 million
State Funds (SLPP/Proposition 116) $37.3 million
Sonoma County Transportation Authority other funds $6.6 million
Federal Funds $12.8 million
Miscellaneous $1.3 million
Total $122.6 million
Other operating funds: In addition to SMART revenues related to leases, license agreements and other reimbursements, SMART will have additional revenues related to activities it may choose to develop on the right of way, including advertising, parking, fiber optic licenses, concessions and other miscellaneous activities. Current projections are conservative in nature and begin with $651,000 per year in 2017.
Bonds: In 2012, SMART issued revenue bonds backed by the District’s sales tax. Net proceeds from the bond sale were $180 million, which were used to fund Phase 1 construction costs. The bonds will be retired by 2029, with the expiration of the existing sales tax authorization. The financial plan factors in debt service (principle and interest) to be paid as required by the bond indenture.
P a g e | 17
These revenues currently are being used to meet capital expenditures and SMART administrative costs. As construction is completed and SMART shifts to initial and then full operations, available continuing revenues will be used to meet operating expenses and debt service. It is anticipated that there are future operating funds that will be available through the Federal Transit Administration’s Section 5307 program and the State’s Cap and Trade revenues for transit and rail operators, but because those revenues are still unknown, they are not included yet in the financial plan.
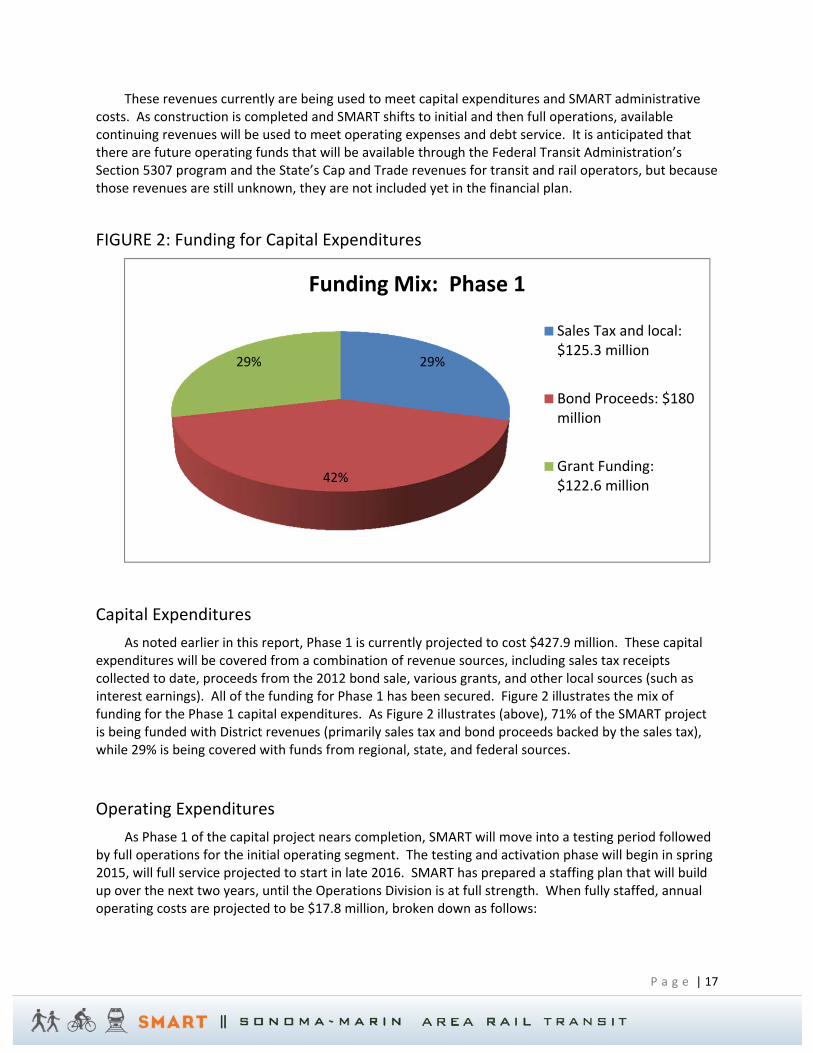
FIGURE 2: Funding for Capital Expenditures
Capital Expenditures
As noted earlier in this report, Phase 1 is currently projected to cost $427.9 million. These capital expenditures will be covered from a combination of revenue sources, including sales tax receipts collected to date, proceeds from the 2012 bond sale, various grants, and other local sources (such as interest earnings). All of the funding for Phase 1 has been secured. Figure 2 illustrates the mix of funding for the Phase 1 capital expenditures. As Figure 2 illustrates (above), 71% of the SMART project is being funded with District revenues (primarily sales tax and bond proceeds backed by the sales tax), while 29% is being covered with funds from regional, state, and federal sources.
Operating Expenditures
As Phase 1 of the capital project nears completion, SMART will move into a testing period followed by full operations for the initial operating segment. The testing and activation phase will begin in spring 2015, will full service projected to start in late 2016. SMART has prepared a staffing plan that will build up over the next two years, until the Operations Division is at full strength. When fully staffed, annual operating costs are projected to be $17.8 million, broken down as follows:
29%
42%
29%
Funding Mix: Phase 1
Sales Tax and local:$125.3 million
Bond Proceeds: $180million
Grant Funding:$122.6 million

P a g e | 18
Annual Operating Costs (beginning Fiscal Year 2016‐17)
Labor $10,019,505
Non‐labor (services/supplies) 5,811,405
Insurance 2,000,000
Total $17,830,910
By far the largest operating expense is labor (fully loaded with fringe benefits). The staffing plan includes at least 35 positions in the transportation division (train controllers, engineers, and conductors), 20 vehicle maintenance workers (including supervisors, technicians, and laborers), 20 positions for maintaining tracks and facilities (including stations, bridges, and signals), and 2 administrative positions (an operations manager and technical support). The largest components of non‐labor expenses include fuel ($1.5 million), utilities ($310,000), vehicle, signal and maintenance parts and supplies ($536,000), and operations related services ($625,000). Other costs included in the $5.8 million non‐labor budget are bus services, communications, service vehicle costs, information technology, safety and security costs, and other miscellaneous expenses totaling $2,840,000. This amount includes bus links to stations north of Airport Boulevard to Cloverdale and south between San Rafael and Larkspur to connect the entire 70‐mile corridor. Finally as shown above, liability insurance costs are anticipated to approach $2 million annually, a cost that is added to our anticipated $1 million a year in claims costs not covered by insurance.
In 2008, SMART consultants estimated that the annual operating cost for the entire 70‐mile corridor would be $19.3 million (in 2008 dollars). In 2011, the District recalculated the operating cost for the initial operating segment alone at $14.1 million (in 2008 dollars), or 73% of the cost for the entire corridor. The current initial operating segment includes 43 miles of track (65% of the total corridor) and 10 stations. While some costs correlate to the length of the project, many of the operating costs are fixed regardless of project size such as most management staff, most services and supplies, insurance, and a number of jobs such as parts clerks and staff related to dispatch. Looking forward, staff projections of the incremental operating costs for future segments will be proportionately less than the current estimated cost of operating the initial operating segment. As mentioned earlier, the incremental operating cost of the Larkspur extension is projected to be only $35,000 annually.
Administrative Expenditures
SMART will continue to fund administrative costs as part of the capital project through Fiscal Year 2015‐16, and separated thereafter. These expenditures include labor for positions that support both the capital program and on‐going operations (executive staff, security, human resources, contract management, financial planning and accounting services, legal counsel, public relations, joint development and property management) and associated non‐labor costs (e.g. office space and supplies, information technology, auditing, marking and public outreach and other as‐needed professional services). The District will also maintain a core number of planning and engineering staff to support future project elements as they are funded. This will ensure continuity and enable SMART to respond quickly when new opportunities arise. Beginning in Fiscal Year 2016‐17, on‐going administrative costs are estimated to be $6.4 million ($3.3 million in labor and $3.1 million in non‐labor).
SMART will also begin accumulating an operating reserve in Fiscal Year 2014‐15, with the goal of building necessary and prudent reserves prior to passenger service. The establishment of reserves is
P a g e | 19
recommended for security against revenue fluctuations or to satisfy rating agency expectations. Over the next two years, SMART will continue to review operating costs and determine an appropriate level of reserves to maintain. Those reserves are detailed below and in the financial plan itself (Appendix B).
Financial Plan
All of the elements discussed in this plan come together in the remaining 15‐year financial plan for SMART (when the Measure Q tax authorization expires in 2029). This plan, which is detailed in Appendix B, shows the years in which expenditures are planned and revenues are received. The basic structure of the financial plan is unchanged from the financial models prepared as part of the 2009 Strategic Plan and those prepared in advance of the Board’s approval of the issuance of debt. This plan shows that sufficient revenues are available for the District through the year 2029 to meet capital and operating costs and to protect against revenue and expenditure uncertainty in the future. This plan was prepared cooperatively with Public Financial Management, Inc. (PFM), SMART’s Financial Advisors who have been assisting SMART with long‐term planning since 2011.
The financial model provides projections for operating revenues and expenditures in each fiscal year since the commencement of Phase 1 construction (late 2011). Ongoing revenues are detailed on lines 1‐9 and include sales tax, farebox collection, and other ongoing revenues such as joint development projects and leases. Operating expenses, lines 15‐17, are then shown and divided into direct operating costs and other expenses related to supporting operations and managing the District. As indicated on line 21, net operating income is positive every year; a portion of net income is allocated to debt service first then to capital and reserves, as discussed below.
Debt service on SMART’s successful revenue bond is shown on line 69. The bond sale, conducted in two
phases in late 2011 and early 2012, resulted in excellent results for SMART. Sufficient bond proceeds of
$180 million were generated for the Phase 1 project, at a very low total interest cost of 3.1 percent
through the end of the debt. During that time, SMART undertook a vigorous process with bond
investors and rating agencies and received two independent ratings. SMART bonds received an excellent
“AA” rating from Standard and Poor’s and an “A” rating from Fitch, who reviewed our finances again in
early 2014 and confirmed SMART’s “A” rating.
Capital revenues, made up almost entirely of grants awarded to SMART, are available for the Phase 1 construction project and shown on lines 31 through 44. Those revenues are added to the bond proceeds and available sales tax revenues and provide the funding needed for the project. The construction fund, which is detailed on lines 74 through 84, provide a picture of SMART’s capital expenses by year.
SMART’s planned reserves are detailed in three places in the financial plan. First, general operating and maintenance reserves are shown on line 26. At the completion of Phase 1 construction and the start of passenger service (Fiscal Year 2016‐17), the District will have an available $12.2 million reserve. Second, SMART will be building an insurance reserve fund designed to keep the cost of insurance low and manage smaller claims in‐house. That reserve is carried on line 35 and designed to start each year with $2 million available. Finally, the District intends to maintain a small capital reserve for unknown capital needs upon completion of project and to provide seed funding for future phases. That fund is currently anticipated to be $17.7 million at the start of operations in FY 2016‐17. However, as mentioned earlier, because of the size, complexity and nature of the current Phase 1 project, it is possible that this reserve will be needed for resolution of construction or other capital issues to achieve

P a g e | 20
project completion in 2016. SMART also maintains, through the bond trustee, a debt service reserve fund of $17 million as required in the bond indenture.
In total, the financial plan shows that SMART has a strong financial outlook through the life of the current Measure Q sales tax. While there are always uncertainties facing any large capital project and any new transit operation, the model’s conservative estimates and building of prudent reserves means the District will be on sound footing with the ability to manage those uncertainties.
CONCLUSIONS
SMART has made tremendous strides in the five years since the last Strategic Plan in 2009. At that time the agency was in its infancy with limited staff and facing tremendous pressure to take a complicated, 70‐mile public improvement project and manage it successfully in the face of the largest recession experienced in over 75 years. Despite the challenges posed by the downturn, the SMART Board moved forward to build the project in phases rather than wait and subject the region to further delays and uncertainties in project cost escalation. With input from the public, regional partners and the Citizens Oversight Committee, the Board’s decision to move quickly during a slow economic time led to initiation of a Phase 1 project that was later extended and enhanced to include 10 stations running from Downtown San Rafael in Marin County to Airport Boulevard in Sonoma County.
In 2014, the promise of a transit alternative to the citizens of Sonoma and Marin Counties is well on its way, with design, permitting and construction activities in full swing. By the end of 2015, construction of over 44 miles of rail, systems and signals will be completed and SMART will be testing 14 new, clean, safe rail cars and servicing them in our new maintenance facility. Seven new segments of multi‐use pathway will be completed in Sonoma and Marin Counties, with more on the way. In late 2016, SMART rail operations will be up and running, providing an alternative to Highway 101 that has never before existed.
There are always uncertainties with a large, complicated capital project and the startup of a new transit operation, but those are the types of challenges that the District has successfully overcome in the last five years and will continue to tackle in the next five years. This Strategic Plan incorporates the most up‐to‐date estimates of SMART’s costs and revenues, and presents them in a solid financial plan that demonstrates SMART’s ongoing ability to build and operate the train and pathway. Measure Q sales tax revenues are providing the backbone for the construction, operation, and maintenance of the SMART project and will continue to do so in the future, thanks to the voters of the District. With continued leadership from the Board and ongoing vigilance on maintaining necessary reserves and financial transparency, SMART’s future operations are on solid footing.

P a g e | 21
APPENDIX A: MEASURE Q SALES TAX BACKGROUND
The Measure Q quarter‐cent sales tax is by far the single largest source of revenues for the SMART project, financing more than 70% of capital expenditures and 80% of operating expenses. Given the project’s reliance on sales tax revenues, the financial outlook for the project is very sensitive to the assumptions used in projecting sales tax proceeds over the remaining 15 years of Measure Q. This appendix reviews historical sales tax revenues in Sonoma and Marin counties, and examines the sensitivity of the financial plan to changes in the projected growth rate through 2029.
Historical Sales Tax Growth
For a point of reference to evaluate the sales tax forecast, the District reviewed the long‐term history of the taxable transactions subject to the quarter‐cent sales tax in Marin and Sonoma counties. Table A‐1 presents the annual taxable transactions in each county, as well as the annual percentage change for the two counties combined, for the past 20 years. The 20‐year average of taxable sales in the two counties shows an average growth rate of 3.7%. For projection purposes, the financial plan assumes an average annual growth of 3% for the remaining 15 years of the sales tax. A close examination of the historical data reveals a number of important considerations for projecting future sales tax revenues. As illustrated in Table A‐1, the counties experienced positive growth in taxable transactions in 16 of the past 20 years. At the same time, the recession of 2008 resulted in unprecedented declines; even with above‐average growth in the last four years, the losses of those two years eroded the tax base significantly, and continue to suppress the long‐term average growth rates. The table also illustrates the risk of basing projections only on recent experience. During the first five years of Measure Q, the District has seen actual sales tax revenues increase by an average of 7.8% annually, while over the last three years, taxable transactions have grown an average of 6.6%.
Historical SMART Measure Q Tax Revenues
Fiscal Year Ending
June 30 Revenues % Change
20091 $4,976,687 ‐‐
2010 24,059,929 ‐‐
2011 26,826,843 11.5
2012 28,419,772 5.9
2013 30,435,753 7.1
2014 32,473,329 6.7
Average ‐‐ 7.8
1 Partial year
Nevertheless, when the negative growth of even one year of the recession is factored in, the five‐year average growth rate in taxable transactions drops to 2.0%. In order to maintain a long‐term

P a g e | 22
perspective when considering sales tax revenue forecasts; the 20‐year average growth in taxable transactions in Marin and Sonoma counties provides the most reasonable projection for the long‐term. It captures a number of years of significant growth, but also factors in the worst recession since the Great Depression. The 20‐year average also balances out the ups and downs of several business cycles, which are notoriously difficult to predict with any accuracy. Finally, the 20‐year average reflects the reasonably steady long‐term growth in the economy, as evidenced by the recovery from the most recent recession.
Table A‐1: Historical Value of Taxable Transactions, 1993‐2013
Calendar Year
Marin
County
Sonoma
County Combined
($1,000) ($1,000) ($1,000) % Change
1993 2,463,653 3,836,452 6,300,105 ‐‐
1994 2,564,628 3,951,850 6,516,478 3.4
1995 2,686,020 4,222,495 6,908,515 6.0
1996 2,902,225 4,569,715 7,471,940 8.2
1997 3,108,231 4,989,888 8,098,119 8.4
1998 3,378,233 5,383,612 8,761,845 8.2
1999 3,670,921 6,017,754 9,688,675 10.6
2000 4,056,025 6,823,544 10,879,569 12.3
2001 3,950,152 6,819,365 10,769,517 (1.0)
2002 3,848,444 6,702,865 10,551,309 (2.0)
2003 3,891,300 6,796,205 10,687,505 1.3
2004 4,053,515 7,189,087 11,242,602 5.2
2005 4,171,444 7,622,099 11,793,543 4.9
2006 4,285,264 7,894,595 12,179,859 3.3
2007 4,397,181 7,877,195 12,274,376 0.8
2008 4,158,899 7,369,109 11,528,007 (6.1)
2009 3,660,036 6,263,829 9,923,864 (13.9)
2010 3,834,168 6,485,931 10,320,099 4.0
2011 4,049,869 6,962,114 11,011,983 6.7
2012 4,333,600 7,382,997 11,716,597 6.4
2013 4,656,411 7,857,113 12,513,524 6.8
Average Change in Taxable Transactions
Last 3 years 6.6
Last 5 years 2.0
Last 20 years 3.7
Source: California Board of Equalization

P a g e | 23
SMART’s Measure Q Sales Tax Projections
After careful review of historical data and SMART’s own experience since Measure Q was initiated in 2009, the District has elected to use an average annual growth rate of 3.0% for the remaining 15 years of the sales tax for the financial plan. This is more conservative than the 20‐year average in taxable transactions noted above (3.7%), but is consistent with the assumptions being used by overlapping government entities (such as the SCTA) and a reduction in the growth rates contained in previous analysis done by Beacon Economics. In 2011, SMART contracted with Beacon Economics to project sales tax receipts for the District for the life of the tax. Their projections were based on standard time series regression analysis, estimating total taxable sales in Marin County and Sonoma County on the basis of population and growth, as well as nominal consumer spending on goods. That analysis forecast over 4.9% growth between Fiscal Year 2011‐12 and Fiscal Year 2027‐28, a far more aggressive projection than SMART is currently modelling (report at www2.sonomamarintrain.org/index.php/finance).
Based on this 3% assumption going forward, Measure Q is projected to generate $756.6 million over the 20 years of Measure Q, as shown graphically in Figure A‐1. SMART considered whether to attempt to model the business cycle and other economic factors and their impact on taxable transactions from year to year. When actual experience is compared to projections, however, it is rare that the two match. Indeed, prior to 2008, very few forecasters projected a double‐digit drop in sales tax revenues; nor did they predict the speed and strength of the recovery. Thus it is prudent to assume for purposes of the current model that over time, future sales tax revenues will reflect the average annual growth experienced in the past.
Figure A‐1: Historical and Projected Measure Q Sales Tax Revenues with Variances
*Sales tax revenues expire during Fiscal Year 2028‐29; chart shows partial revenues in that last year.
$732 M
$756 M
$782 M
5
15
25
35
45
55
65
Dollars in
Millions
Less Growth Plan Projection More Growth
Variance of $1.1 Million higher or lower in 2020
Fiscal Year

P a g e | 24
To test the sensitivity of the financial plan to the assumed growth rate in sales tax revenues, Figure A‐1 also includes projected sales tax revenues using a lower (2.5%) and higher (3.5%) annual growth rate beginning in 2015. A half‐percent change in the growth rate (up or down) would affect total revenues by about $25 million over the remaining 15 years of Measure Q. The difference is very small in the base year ($162,367 in 2015), but grows over time (due to compounding). In the year 2020, as shown on the graph, the difference in annual projected revenue is $1.1 million, which would either increase or decrease SMART tax revenue by 2.9% in that year, an amount that would be more than covered by SMART’s reserves (discussed in Appendix B). However, while lower growth will happen during a downturn, it is not likely to be an ongoing trend given historical averages and anticipated growth in the region. Further discussion of SMART’s financial planning in the case of lower growth (and reserve funds for such planning) are examined in more detail in the description of the financial model in Appendix B.
The District considered whether a higher sales tax growth rate assumption would generate sufficient revenues to support a future bond issue. As illustrated in Figure A‐1, the total revenues from another half‐percent growth would equal $25 million over the remaining 15 years. The annual revenues would support only a modest‐sized bond, when debt service and issuance expenses are factored in. Further, the District’s financial advisors noted that the rating agencies would be unlikely to accept a higher sales tax growth rate when evaluating the security of a new bond at this time. A more likely scenario, to be evaluated in future Strategic Planning efforts, is an extension of the current tax past its expiration date, which would allow for greater borrowing ability for capital projects beyond Phase 1.

P a g e | 25
APPENDIX B: FINANCIAL MODEL
The District’s financial advisors, PFM, developed a financial model to plan for the completion of the current capital project and ongoing operations. The model uses a cash flow approach to align projected revenues with capital and operating costs over the 20‐year period of the Measure Q sales tax. The results of the financial model are presented on the last page of this document. Beginning in 2015, total operating revenues (line 9) are used to cover administrative and operating expenses (line 19), and to fund an operating reserve and other reserves (lines 23 and 31). Net operating income (line 39) is then used to cover debt service (line 69), and any remaining funds are deposited into the construction fund (line 85). Table B‐1 summarizes the financial model results for the entire projection period.
Table B‐1: SMART Financial Plan Summary FY 2012‐2029
Revenue/Expense Category FY 2012‐2029
(In thousands)
Total Operating Revenues $804,264
Total Administration & Operations $390,509
Transfers to Reserves $26,568
Debt Service $272,802
Transfers to Construction Fund $112,381
An important element of the financial plan is the buildup of reserves to provide for contingencies and unanticipated changes in revenues and/or expenses. Beginning in 2014, the District created an operating reserve, with the intention to build a reserve equal to at least 50% of annual operating costs, excluding debt service. Deposits to the operating reserve are shown on line 23, and the 50% target is reached in 2015. By the first year of full operations (2016), the ending balance in the operating reserve is more than $12 million (line 26). The 50% target provides fully for six months of operations in the highly unlikely event that the District’s revenues dropped to zero. This reserve would also provide SMART with funding to weather a multi‐year recession while the agency made other adjustments to costs or revenues to make up the difference. This operating reserve is in addition to a Bond Reserve fund of $17 million, which is held in trust by SMART’s trustee. This cash reserve is used to cover debt service payments in the event that sales tax revenues are not available to pay the debt service.
The financial plan also includes an insurance reserve fund, designed to keep the cost of insurance and risk management low and manage smaller claims in‐house. This reserve, shown on line 31, is designed to start each year with a balance of $2 million, and is assumed to be drawn down over the life of the project.
A third form of a reserve is the construction fund, into which any remaining operating revenues (after funding operations, debt service, and the designated reserves) are deposited. In the early years of the project, nearly all of the operating revenues were deposited into the construction fund. By full operation (2016), most of the revenues go to operations and debt service. Nevertheless, in every year a modest amount of net operating revenues are available for deposit into the construction fund (line 77).
Both the operating reserve and the construction fund provide protection against a shortfall in projected revenues and/or an increase in expenses. Appendix A noted a potential revenue shortfall of

P a g e | 26
nearly $25 million if sales tax revenues grow at only 2.5% a year instead of the assumed 3.0%. The model illustrates that the entire shortfall could be covered by the operating reserve and by not making the planned contributions to the construction fund. A more likely scenario, however, would be for the District to address revenue shortfalls by reducing operating costs or increasing fares.
The model can also be used to test the District’s inflation assumptions. Consistent with the guidelines for agency short range transit plans provided by the Metropolitan Transportation Commission, SMART used the 20‐year average of changes in the Bay Area Consumer Price Index (CPI) to project changes in operating costs. If the inflation rate were increased from the current assumption of 2.61% to 3% for the remaining years of the project, total operating costs would increase by close to $10 million. The operating reserve is sufficient to cover the higher costs, or contributions to the construction fund could be reduced to maintain the operating reserve. An inflation rate of 4% would increase total operating costs by more than $30 million; this, too, could be covered by the operating reserve and the construction fund contributions.
While the model demonstrates that the SMART project could sustain either lower revenues or higher operating costs, in practice the District would respond to significant deviations from the projections as those trends emerge. The District demonstrated this flexibility when it revised its approach to the project by phasing construction when sales tax revenues were lower than initially forecast, and by securing outside funding to make up the shortfall. SMART will also develop a better understanding of operation cost options in the coming year after hiring more operations staff and beginning vehicle testing.
As described in Appendix A, the 3.0% average annual growth in sales tax revenues represents a reasonable assumption for the financial plan. In fact, that assumption might be conservative in comparison to the 20‐year historical average (3.7%) in Marin and Sonoma counties, an average that included the recent Great Recession. The financial model demonstrates the value of erring on the low side when projecting revenues. If the assumption proves to be too high, the District still has sufficient reserves to cover a revenue shortfall. If the assumption proves to be too low, excess revenues could be deposited into the construction fund to support additional capital expenditures. The District concluded that the more conservative assumption for growth in sales tax revenues provides greater protection against projection uncertainty.
Detailed Financial Model is found on the next two pages. Please note that the model is split across two pages, with FY2012‐2020 on the first page and 2021‐2029 on the second page. Totals are also located on the second page.
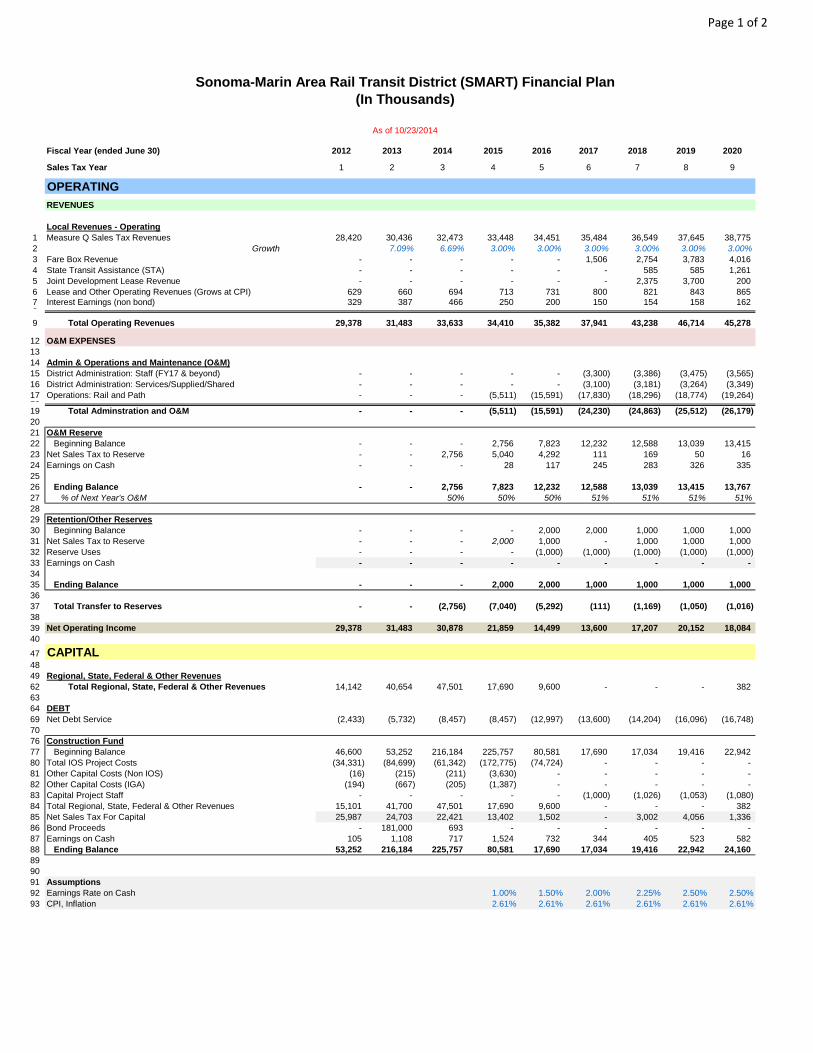
##Fiscal Year (ended June 30) 2012 2013 2014 2015 2016 2017 2018 2019 2020
Sales Tax Year 1 2 3 4 5 6 7 8 9
OPERATING
REVENUES
Local Revenues - Operating 0.0% 0.0% 2.5% 4.6% 6.3% 6.6%1 Measure Q Sales Tax Revenues 28,420 30,436 32,473 33,448 34,451 35,484 36,549 37,645 38,775 2 Growth 7.09% 6.69% 3.00% 3.00% 3.00% 3.00% 3.00% 3.00%3 Fare Box Revenue - - - - - 1,506 2,754 3,783 4,016 4 State Transit Assistance (STA) - - - - - - 585 585 1,261 5 Joint Development Lease Revenue - - - - - - 2,375 3,700 200 6 Lease and Other Operating Revenues (Grows at CPI) 629 660 694 713 731 800 821 843 865 7 Interest Earnings (non bond) 329 387 466 250 200 150 154 158 162 8
9 Total Operating Revenues 29,378 31,483 33,633 34,410 35,382 37,941 43,238 46,714 45,278
12 O&M EXPENSES1314 Admin & Operations and Maintenance (O&M)15 District Administration: Staff (FY17 & beyond) - - - - - (3,300) (3,386) (3,475) (3,565) 16 District Administration: Services/Supplied/Shared - - - - - (3,100) (3,181) (3,264) (3,349) 17 Operations: Rail and Path - - - (5,511) (15,591) (17,830) (18,296) (18,774) (19,264) 18
19 Total Adminstration and O&M - - - (5,511) (15,591) (24,230) (24,863) (25,512) (26,179) 2021 O&M Reserve22 Beginning Balance - - - 2,756 7,823 12,232 12,588 13,039 13,415 23 Net Sales Tax to Reserve - - 2,756 5,040 4,292 111 169 50 16 24 Earnings on Cash - - - 28 117 245 283 326 335 2526 Ending Balance - - 2,756 7,823 12,232 12,588 13,039 13,415 13,767 27 % of Next Year's O&M 50% 50% 50% 51% 51% 51% 51%2829 Retention/Other Reserves30 Beginning Balance - - - - 2,000 2,000 1,000 1,000 1,000 31 Net Sales Tax to Reserve - - - 2,000 1,000 - 1,000 1,000 1,000 32 Reserve Uses - - - - (1,000) (1,000) (1,000) (1,000) (1,000) 33 Earnings on Cash - - - - - - - - - 3435 Ending Balance - - - 2,000 2,000 1,000 1,000 1,000 1,000 3637 Total Transfer to Reserves - - (2,756) (7,040) (5,292) (111) (1,169) (1,050) (1,016) 3839 Net Operating Income 29,378 31,483 30,878 21,859 14,499 13,600 17,207 20,152 18,084 40
47 CAPITAL4849 Regional, State, Federal & Other Revenues62 Total Regional, State, Federal & Other Revenues 14,142 40,654 47,501 17,690 9,600 - - - 382 6364 DEBT69 Net Debt Service (2,433) (5,732) (8,457) (8,457) (12,997) (13,600) (14,204) (16,096) (16,748) 7076 Construction Fund77 Beginning Balance 46,600 53,252 216,184 225,757 80,581 17,690 17,034 19,416 22,942 80 Total IOS Project Costs (34,331) (84,699) (61,342) (172,775) (74,724) - - - - 81 Other Capital Costs (Non IOS) (16) (215) (211) (3,630) - - - - - 82 Other Capital Costs (IGA) (194) (667) (205) (1,387) - - - - - 83 Capital Project Staff - - - - - (1,000) (1,026) (1,053) (1,080) 84 Total Regional, State, Federal & Other Revenues 15,101 41,700 47,501 17,690 9,600 - - - 382 85 Net Sales Tax For Capital 25,987 24,703 22,421 13,402 1,502 - 3,002 4,056 1,336 86 Bond Proceeds - 181,000 693 - - - - - - 87 Earnings on Cash 105 1,108 717 1,524 732 344 405 523 582 88 Ending Balance 53,252 216,184 225,757 80,581 17,690 17,034 19,416 22,942 24,160 899091 Assumptions92 Earnings Rate on Cash 1.00% 1.50% 2.00% 2.25% 2.50% 2.50%93 CPI, Inflation 2.61% 2.61% 2.61% 2.61% 2.61% 2.61%
Sonoma-Marin Area Rail Transit District (SMART) Financial Plan(In Thousands)
As of 10/23/2014
Page 1 of 2

Fiscal Year (ended June 30)
Sales Tax Year
OPERATING
REVENUES
Local Revenues - Operating1 Measure Q Sales Tax Revenues 2 Growth3 Fare Box Revenue4 State Transit Assistance (STA)5 Joint Development Lease Revenue6 Lease and Other Operating Revenues (Grows at CPI)7 Interest Earnings (non bond)8
9 Total Operating Revenues
12 O&M EXPENSES1314 Admin & Operations and Maintenance (O&M)15 District Administration: Staff (FY17 & beyond)16 District Administration: Services/Supplied/Shared17 Operations: Rail and Path18
19 Total Adminstration and O&M2021 O&M Reserve22 Beginning Balance23 Net Sales Tax to Reserve24 Earnings on Cash2526 Ending Balance27 % of Next Year's O&M2829 Retention/Other Reserves30 Beginning Balance31 Net Sales Tax to Reserve32 Reserve Uses33 Earnings on Cash3435 Ending Balance3637 Total Transfer to Reserves3839 Net Operating Income40
47 CAPITAL4849 Regional, State, Federal & Other Revenues62 Total Regional, State, Federal & Other Revenues6364 DEBT69 Net Debt Service7076 Construction Fund77 Beginning Balance80 Total IOS Project Costs81 Other Capital Costs (Non IOS)82 Other Capital Costs (IGA)83 Capital Project Staff84 Total Regional, State, Federal & Other Revenues85 Net Sales Tax For Capital86 Bond Proceeds87 Earnings on Cash88 Ending Balance899091 Assumptions92 Earnings Rate on Cash93 CPI, Inflation
Sonoma-Marin Area Rail Transit District (SMART) Financial Plan(In Thousands)
As of 10/23/2014
2021 2022 2023 2024 2025 2026 2027 2028 2029
10 11 12 13 14 15 16 17 20 Total
7.0% 7.5% 7.9% 8.4% 8.8% 9.3% 9.8% 10.4% 75.07%39,938 41,136 42,370 43,641 44,951 46,299 47,688 49,119 37,979 700,803 3.00% 3.00% 3.00% 3.00% 3.00% 3.00% 3.00% 3.00% 3.00%4,258 4,512 4,776 5,051 5,338 5,638 5,950 6,275 6,614 60,470 1,294 1,328 1,362 1,398 1,435 1,472 1,510 1,550 1,590 15,370
200 200 200 200 200 200 200 200 200 8,075 887 910 934 959 984 1,009 1,036 1,063 1,090 15,628 166 171 175 180 184 189 194 199 204 3,918
46,744 48,257 49,818 51,429 53,091 54,807 56,578 58,405 47,678 804,264
(3,659) (3,754) (3,852) (3,953) (4,056) (4,162) (4,271) (4,382) (4,497) (50,311) (3,437) (3,527) (3,619) (3,713) (3,810) (3,910) (4,012) (4,117) (4,224) (47,262)
(19,767) (20,283) (20,813) (21,357) (21,915) (22,487) (23,075) (23,677) (24,296) (292,936)
(26,862) (27,564) (28,284) (29,023) (29,781) (30,559) (31,357) (32,176) (33,016) (390,509)
13,767 14,126 14,495 14,874 15,262 15,661 16,070 16,490 16,920 15 16 16 17 17 18 18 18 - 12,568
344 353 362 372 382 392 402 412 423 4,776
14,126 14,495 14,874 15,262 15,661 16,070 16,490 16,920 17,344 51% 51% 51% 51% 51% 51% 51% 51%
1,000 1,000 1,000 1,000 1,000 1,000 1,000 1,000 1,000 1,000 1,000 1,000 1,000 1,000 1,000 1,000 1,000 - 14,000
(1,000) (1,000) (1,000) (1,000) (1,000) (1,000) (1,000) (1,000) (1,000) (14,000) - - - - - - - - - -
1,000 1,000 1,000 1,000 1,000 1,000 1,000 1,000 -
(1,015) (1,016) (1,016) (1,017) (1,017) (1,018) (1,018) (1,018) -
18,866 19,677 20,517 21,389 22,293 23,231 24,203 25,211 14,661 387,187
925 1,509 2,135 2,805 3,791 - - - - 141,134
(17,406) (18,060) (18,718) (19,368) (20,024) (20,681) (21,336) (21,990) (16,496)
24,160 26,056 28,721 32,242 36,721 42,531 44,900 47,615 50,722 - - - - - - - - - (427,872) - - - - - - - - - (4,072) - - - - - - - - - (2,452)
(1,109) (1,138) (1,167) (1,198) (1,229) (1,261) (1,294) (1,328) (1,363) (15,246) 925 1,509 2,135 2,805 3,791 - - - - 143,139
1,460 1,617 1,800 2,021 2,270 2,550 2,867 3,221 (1,834) 112,381 - - - - - - - - - 181,693
620 676 753 851 978 1,079 1,142 1,214 1,228 14,582 26,056 28,721 32,242 36,721 42,531 44,900 47,615 50,722 48,753
2.50% 2.50% 2.50% 2.50% 2.50% 2.50% 2.50% 2.50% 2.50%2.61% 2.61% 2.61% 2.61% 2.61% 2.61% 2.61% 2.61% 2.61%
Page 2 of 2

P a g e | 27
APPENDIX C: SMART PATHWAY MAP
Detailed maps outlining Pathway segments are attached on following pages.

U
S
1
0
1
U
S
1
0
1
U
S
1
0
1
N
O
R
T
H
S
A
N
P
E
D
R
O
R
O
A
D
C
IV
IC
CENTER
SANTA VENETIA
D
R
I
V
E
M
E
R
R
Y
D
A
L
E
R
D
M
C
I
N
N
I
S
P
K
W
Y
S
M
IT
H
R
A
N
C
H
R
D
S
M
I
T
H
R
A
N
C
H
R
D
P
R
IV
A
T
E
(
M
P
2
2
.1
)
M
A
IN
M
A
IN
G
A
T
E
R
D
G
A
T
E
R
D
L
I
N
C
O
L
N
A
V
E
(
P
U
E
R
T
O
S
U
E
L
L
O
)
(
M
P
1
8
.
3
)
CIVIC CENTER STATION
STATION
B
E
G
I
N
I
O
S
M
U
P
(
M
P
1
8
.
8
)
N
O
R
T
H
S
A
N
P
E
D
R
O
R
D
LA
S
GA
LLIN
AS
C
R
E
E
K
MILLER CREEK
(
M
P
2
0
.
9
)
(
M
P
1
9
.
7
)
(
M
P
2
0
.
1
)
(M
P
2
0
.9
)
S
T
V
IN
C
E
N
T
S
D
R
SAN RAFAEL
EXISTING PATHWAY TO
DOWNTOWN SAN RAFAEL
N
H
W
Y
3
7
U
S
1
0
1
U
S
1
0
1
U
S
1
0
1
N
. H
A
M
IL
T
O
N
P
A
R
K
W
A
Y
N
A
V
E
D
R
IV
E
HA
MILT
ON
D
RIV
E
I
G
N
A
C
I
O
B
L
V
D
P
A
L
M
E
R
D
R
R
E
D
W
O
O
D
B
L
V
D
N
O
V
A
T
O
B
L
V
D
N
O
V
A
T
O
BLV
D
R
E
D
W
O
O
D
B
L
V
D
S
U
N
S
E
T
P
K
W
Y
R
E
D
W
O
O
D
B
L
V
D
M
A
IN
S
T
A
T
E
A
C
C
E
S
S
R
D
M
A
I
N
G
A
T
E
R
D
R
O
B
L
A
R
R
D
B
E
L
M
A
R
I
N
K
E
Y
S
B
L
V
D
D
E
L
O
N
G
A
V
E
G
A
T
E
R
D
O
L
I
V
E
A
V
E
RUSH CREEK PLACE
(MP 28.5)
S
A
N
M
A
R
I
N
D
R
AT
HE
RT
ON
AV
E
HAMILTON STATION
PACH
ECO
CR
K
(MP 23.9)
BAY TRAIL (M
P 25.5)
PH
AS
E ll M
UP
(MP 25.85)
H
A
N
N
A
R
A
N
C
H
R
D
N
O
V
A
T
O
C
R
E
E
K
(
M
P
2
6
.9
)
L
A
M
O
N
T
A
V
E
G
R
A
N
T
A
V
E
(
M
P
2
4
.2
)
(
M
P
2
4
.5
)
(M
P
25.85)
F
R
A
N
K
L
IN
P
E
D
. C
R
O
S
S
IN
G
(
2
7
.5
)
(
M
P
2
7
.
9
)
(
M
P
2
8
.
1
)
SAN MARIN / ATHERTON OVERPASS
SAN MARIN / ATHERTON STATION
NOVATO
NOVATO
N
O
V
A
T
O
C
R
E
E
K
BIKEWAY TO PETALUMA UNDER
CONSTRUCTION (CALTRANS)
CITY PATH
A
PATHWAY LEGEND
UNDER CONSTRUCTION/FUNDED
EXISTING BIKE WAYS AND CONNECTIONS
INDICATES MILE POST(MP 63.3)
SMARTMULTI-USE PATH ALIGNMENT
PROPOSED
NOVEMBER 2014
SAN RAFAEL TO NOVATO
FUTURE MULTI-USE PATHWAY (MUP)
MULTI-USE PATHWAY (MUP)
HAMILTON STATION
EXISTING PARALLEL BIKE ROUTE

N
H
W
Y
1
1
6
U
S
1
0
1
U
S
1
0
1
US
101
PETALUMA
N
O
R
T
H
P
E
T
A
L
U
M
A
B
L
V
D
E
A
S
T
D
S
T
R
E
E
T
P
A
Y
R
A
N
S
T
R
E
E
T
M
A
D
IS
O
N
S
T
R
E
E
T
LY
N
C
H
C
R
E
E
K
T
R
A
IL
N
M
C
D
O
W
E
L
L
B
L
V
D
N M
CD
OW
ELL B
LV
D
O
L
D
R
E
D
W
O
O
D
H
W
Y
L
A
K
E
V
I
L
L
E
S
T
E
A
S
T
W
A
S
H
IN
G
T
O
N
S
T
P
A
Y
R
A
N
S
T
(
M
P
3
9
.
2
)
SOUTHPOINT BLVD
C
O
R
O
N
A
R
D
(M
P
4
1
.1
)
N
E
L
Y
R
D
PETALUMA STATION
PETALUMA RIVER
(MP 39.5)
McDOWELL CROSSING
(MP 40.7)
(M
P
4
2
.2
)
(M
P
3
8
.5
)
(M
P
3
8
.8
)
END MUP BY CALTRANS
(MP 36.9)
CITY OF PETALUMA BIKEWAYS (EXISTING & FUTURE)
CITY BIKEWAYS ON CITY OF PETALUMA STREETS
PETALUMA BLVD. S. TO LAKEVILLE ST .
L
A
K
E
V
I
L
L
E
S
T
N
ROHNERTPARK
O
L
D
R
E
D
W
O
O
D
H
W
Y
P
E
T
A
L
U
M
A
H
I
L
L
R
O
A
D
V
A
L
L
E
Y
H
O
U
S
E
D
R
I
V
E
B
O
D
W
A
Y
P
K
W
Y
C
A
M
I
N
O
C
O
L
E
G
I
O
CA
MIN
O C
OLE
GIO
S
O
U
T
H
W
E
S
T
B
L
V
D
SE
ED
F
AR
M D
R
E
N
T
E
R
P
R
I
S
E
D
R
S
T
A
T
E
F
A
R
M
D
R
IV
E
N
E
L
Y
R
D
M
A
I
N
S
T
O
L
D
A
D
O
B
E
R
D
E
R
A
I
L
R
O
A
D
A
V
E
EA
ST
CO
TA
TI A
VE
E
A
S
T
C
O
T
A
T
I
A
V
E
R
O
H
N
E
R
T
P
A
R
K
E
X
P
W
Y
MU
P IN
TE
GR
AT
ED
IN
TO
SO
NO
MA
M
OU
NT
AIN
V
ILLA
GE
COTATI STATION
ROHNERT PARK STATION
C
O
P
E
L
A
N
D
C
R
E
E
K
(
M
P
4
2
.
2
)
(
M
P
4
3
.
3
)
(
M
P
4
3
.
6
)
(
M
P
4
4
.
8
)
(MP 45.6)
COTATI
(
M
P
4
6
.
1
)
(MP
46.8
)
(
M
P
4
7
.
4
)
C
SMARTMULTI-USE PATH ALIGNMENT
PROPOSED
NOVEMBER 2014
PETALUMA TO ROHNERT PARK
PATHWAY LEGEND
UNDER CONSTRUCTION/FUNDED
EXISTING BIKE WAYS AND CONNECTIONS
INDICATES MILE POST(MP 63.3)
FUTURE MULTI-USE PATHWAY (MUP)
MULTI-USE PATHWAY (MUP)
EXISTING PARALLEL BIKE ROUTE

N
U
S
1
0
1
U
S
1
0
1
U
S
1
0
1
H
E
A
R
N
A
V
E
ROHNERTPARK
SANTA ROSA
S
T
A
T
E
F
A
R
M
D
R
C
O
M
M
E
R
C
E
B
L
V
D
R
E
D
W
O
O
D
D
R
M
IL
L
B
R
A
E
A
V
E
L
A
N
G
N
E
R
A
V
E
S
C
E
N
IC
A
V
E
S
M
O
O
R
L
A
N
D
A
V
E
T
O
D
D
R
D
S
T
A
N
D
IS
H
A
V
E
M
O
O
R
L
A
N
D
A
V
E
B
E
L
L
V
U
E
A
V
E
(
M
P
5
1
.3
)
B
E
L
L
V
U
E
A
V
E
W
IL
J
A
N
C
T
C
O
R
B
Y
A
V
E
D
U
T
T
O
N
A
V
E
R
O
H
N
E
R
T
P
A
R
K
E
X
P
W
Y
G
O
L
F
C
O
U
R
S
E
D
R
W
R
O
B
L
E
S
A
V
E
H
IN
E
B
A
U
G
H
C
R
E
E
K
(
M
P
4
7
.4
)
(
M
P
4
8
.
5
)
(
M
P
4
9
.4
)
(
M
P
5
0
.3
)
(M
P
5
2
.1
)
U
S
1
0
1
H
W
Y
1
2
H
W
Y
1
2
U
S
1
0
1
D
U
T
T
O
N
A
V
E C
O
R
B
Y
A
V
E
E
A
R
L
E
S
T
BO
YD
S
T
O
L
I
V
E
RA
ILR
OA
D
S
T
W
ILS
ON
S
T
C
L
E
V
E
L
A
N
D
A
V
E
C
O
L
L
E
G
E
A
V
E
(
M
P
5
4
.
4
)
N
D
U
T
T
O
N
A
V
E
S
E
B
A
S
T
O
P
O
L R
D
(M
P
53.4)
G
U
E
R
N
E
V
IL
L
E
R
D
C
O
F
F
E
Y
L
N
S
T
W
B
A
R
H
A
M
A
V
E
W 3RD ST
(MP 53.7)
6T
H S
T
7T
H S
T
8T
H S
T
W
9
T
H
S
T
J
E
N
N
IN
G
S
A
V
E
W
S
T
E
E
L
E
L
N
(
M
P
5
5
.
0
)
SANTA ROSASTATION
EXISTING JOE
RODOTA TRAIL
GUERNEVILLE ROADSTATION
(M
P
5
5
.0
)
(M
P
5
5
.3
)
EX
IS
TIN
G
CLA
SS
2 B
IK
E LA
NE
S
SMARTMULTI-USE PATH ALIGNMENT
PROPOSED
NOVEMBER 2014
ROHNERT PARK TO SANTA ROSA
D
TYPICAL SECTION
PATHWAY WITH TRACK DITCH
EXAMPLE
PATHWAY SECTIONS
TYPICAL SECTION
PATHWAY ADJACENT TO RAILROAD EMBANKMENT
PATHWAY LEGEND
UNDER CONSTRUCTION/FUNDED
EXISTING BIKE WAYS AND CONNECTIONS
INDICATES MILE POST(MP 63.3)
FUTURE MULTI-USE PATHWAY (MUP)
MULTI-USE PATHWAY (MUP)
EXISTING PARALLEL BIKE ROUTE

Sonoma-Marin Area Rail Transit
Sales Tax Revenue Forecast
B E
This publica on was created for:
Sonoma-Marin Area Rail Transit District
The views expressed in this report represent the analysis and opinions of the authors, and do not necessarily reflectthe posi on of Sonoma-Marin Area Rail Transit.
This publica on was prepared by:
Beacon Economics, LLC
Christopher Thornberg Jordan G. LevineFounding Partner Economist & Director of Economic Research310.571.3399 [email protected] [email protected]
And by:
Brian VanderplasSenior Research [email protected]
For further informa on about Beacon Economics, please contact:
Victoria Pike BondDirector of Communica [email protected]
Or visit our website at www.BeaconEcon.com.
Reproduction of this document or any portion therein is prohibited without the expressed written permission of BeaconEconomics. Copyright ©2014 by Beacon Economics LLC.
Sonoma-Marin Area Rapid Transit - Forecast 2

B E
Introduction
Beacon Economics was contracted by the Sonoma-Marin Area Rail Transit District (SMART) to perform a forecast oftaxable sales and the revenues that would be generated for the SMART infrastructure project out to the end of fiscalyear 2029. This report lays out the forecast and a summary of the basis of this forecast.
Methodology
As noted in previous years, our methodology is based on standard me series regression analysis, where we es matetotal taxable sales in Marin County and Sonoma County on the basis of popula on and growth, as well as nominalconsumer spending on goods at the na onal level. The analysis presented here includes an analysis of price trends asmeasured by the consumer price index (CPI) as well as trends in the sources of popula on growth.
Forecast Highlight
This report revises our September 2011 forecast of the SMART’s sales tax revenues out to 2029 upward slightly overthe long run. We have slightly lower growth rates over the short-run, though the actual revenues reported for fiscalyears 2012-13 and 2013-14 came in higher than our previous es mates, meaning we are growing from a larger base.The slightly lower growth rates over the short run are largely driven by this higher than expected growth in taxablesales over these most recent fiscal years. As such, our forecast for the amount of sales taxes revenues generated isslightly higher than previously forecasted despite lower revenue growth.
0
20
40
60
Rev
enue
s ($
Milli
ons)
2011-12
2012-13
2013-14
2014-15
2015-16
2016-17
2017-18
2018-19
2019-20
2020-21
2021-22
2022-23
2023-24
2024-25
2025-26
2026-27
2027-28
2028-29
Source: Forecasts by Beacon Economics
2014 Forecast vs. 2011 ForecastSMART Revenue Forecast
2014 Forecast 2011 Forecast
Beacon Economics con nues to predictroughly similar growth rates in popu-la on in Marin and Sonoma coun esover the long term. In recent years, thepopula on in the SMART region hasgrown at slower pace than our previ-ous forecast. However, from a sales taxperspec ve, this was offset by a sharpup ck in taxable sales in the regionover the sameperiod. Our revised fore-cast has higher revenues by $3,051,375in 2014-15. This is mainly a result ofSMART's sales tax revenues coming in$2,962,002 above our 2013-14 es -mates which were made in in 2011.By the end of our forecast in 2028-29,Beacon Economics is forecas ng thatSMART's sales tax revenues will be between $1.7 and $2.3 million higher than previously forecasted.
Sonoma-Marin Area Rapid Transit - Forecast 3

B E
Detailed Forecast ResultsSMART Forecast, Fiscal Years 2014-15 to 2028-29
Fiscal YearTaxable Sales Tax GrowthSales Revenue (%)
2012-13 12,232,000,000 30,435,753 7.1
2013-14 13,081,133,000 32,473,329 6.7
2014-15 13,752,291,000 34,072,991 4.9
2015-16 14,365,895,000 35,593,271 4.5
2016-17 15,139,949,000 37,511,084 5.4
2017-18 15,936,782,000 39,485,336 5.3
2018-19 16,689,178,000 41,349,490 4.7
2019-20 17,508,643,000 43,379,815 4.9
2020-21 18,302,972,000 45,347,863 4.5
2021-22 18,964,227,000 46,986,203 3.6
2022-23 19,675,164,000 48,747,637 3.7
2023-24 20,449,814,000 50,666,928 3.9
2024-25 21,264,309,000 52,684,939 4.0
2025-26 22,124,069,000 54,815,100 4.0
2026-27 23,019,561,000 57,033,792 4.0
2027-28 23,942,415,000 59,320,276 4.0
2028-29 18,567,418,000 46,003,060 −Forecast by Beacon Economics
In 2011, we said the worst of the "Great Recession"was behind us. The taxable sales numbers that haveresulted in subsequent years has confirmed that viewwith taxable sales exceeding their pre-recession peakand spending ac vity that is currently at record lev-els in both Marin and Sonoma coun es. Thus, we ex-pect to see growth in taxable sales con nue throughthe remainder of the current fiscal year and be-yond. However, as the economy con nues to normal-ize Beacon Economics expects growth level to edgedown to more average levels. Specifically, we areforecas ng that taxable sales will grow from roughly$13.1 billion per year in the combined two coun esin 2013-14 to nearly $24 billion per year by fiscal year2029. This means that holding tax rates constant overthis period, SMART’s sales tax revenuewill grow from$32.5 million in the 2013-14 fiscal year to $57.6 mil-lion by 2027-28. In total, this will result in cumula vesales tax revenues over this period of $693 million,shown in the annual amounts in the table.
This is slightly slower growth than our previous fore-cast in the short-run. In 2011, Beacon Economics called for growth in revenues of between 5% and 6% between fiscalyears 2014-15 and 2016-17. In our current forecast, Beacon Economics has revised this figure to between 4.5% and5.5% in the short run as the economy con nues to return to more normal levels of spending increases. Our growthforecast for 2017-2021 is lower than our previous forecast, with revenues rising by between 4.5% and 5.3% annually.Our longer-run forecast is also slightly lower, with growth con nuing at roughly 3.5% to 4.0% per year.
This forecast is based on a number of factors (men oned above) that come out of Beacon’s own econometric modelsof overall na onal spending pa erns and future popula on, which will be detailed in the remainder of this report.There are several key components of our forecast, which are detailed herein:
1. Firstly, Beacon Economics creates an es mate popula on growth in Marin and Sonoma coun es respec vely.
2. Next, Beacon Economics analyzed and forecasted consumer spending behavior—both in terms of goods (whichgenerate sales tax in California), as well as on services in real terms.
3. Finally, this spending behavior is then combined with a forecast of infla on for both overall consump on as wellas on goods specifically (which is what ma ers for sales tax, as services are as-yet untaxed by California's salesand use tax system).
Sonoma-Marin Area Rapid Transit - Forecast 4

B E
-2
0
2
4
6
Net
Mig
ratio
n (%
of P
opul
atio
n)
1971 1978 1985 1992 1999 2006 2013 2020 2027Fiscal Year Ending
Marin Sonoma
Source: Forecasts by Beacon Economics
1970-71 to 2028-29SMART Area Net Migration Forecast
0.2
0.4
0.6
0.8
Nat
ural
Incr
ease
(% o
f Pop
ulat
ion)
1971 1978 1985 1992 1999 2006 2013 2020 2027Fiscal Year Ending
Marin Sonoma
Source: Forecasts by Beacon Economics
1970-71 to 2028-29SMART Area Natural Increase Forecast
As noted, popula on is an important driver of taxable sales in a region. Even if the amount of spending per personremains constant over me, any increase in the number of spenders will give rise to increased aggregate sales, holdingall else constant. Beacon Economics con nues to call for popula on growth in the region. As shown below, historicalperformance and current economic trends support addi onal popula on in the region moving forward.
• Net migra on into the region is forecasted to form a larger share of the popula on base in Sonoma County.Currently, Beacon Economics is forecas ng that net migra on in Sonoma County will average 0.96% of the pop-ula on base per year on average, while Marin will see slightly less in-migra on at 0.27% due to the higher costof homes and less available land to squeeze new residents into. This is in linewith historic average for the region,with growth over the last three decades averaging 0.96% in Sonoma County and 0.19% inMarin County. It's alsoimportant to note that these growth rates were impacted by the dot-com bubble of the early 2000s, indeed ifwe amount the 5 years following the downturn Marin County's new migra on nearly doubles, increasing to0.33%.
• Beacon Economics es mates that total popula on in the combined Marin-Sonoma region will grow to 902,000by 2030.
• This is roughly 16,000 less than previously forecast and is driven by lower-than-expected, but s ll posi ve, levelsof net migra on in 2012 and 2013.
• We expect the rela ve affordability of homes in the SMART region to be a major factor for in migra on tothe region. Indeed, with the Median home price in San Francisco nearing the $1 million mark residents cangarner substan al cost savings by op ng to reside in the SMART region. Indeed, in the third quarter of 2014median home price in Sonoma County were just $468,000, while median home prices in San Francisco wereover $961,000.
• Natural increase is forecasted to average roughly 0.42% of Sonoma's popula on base per year, while the moredeveloped, expensive, and older area of Marin County will average natural increase of just 0.29% of its popu-la on per year. It is also important to note that rela ve to the historical figures, this is well within the range ofnatural increase that we have observed in both coun es over the past three decades, which averaged 0.48% inSonoma County and 0.37% in Marin County.
Sonoma-Marin Area Rapid Transit - Forecast 5

B E
• The California Department of Finance’s (DOF) projec on for the region is 787,500 residents by 2030. Our pop-ula on growth is larger than the es mates from DOF, but it is important to note that we remain confident inour es mates a er considering historical pa erns and the forecasted trajectory of the economy. Moreover, theinfla on and per capita spending forecasts are not impacted by a downward revision to popula on. Therefore, alower popula on figure than the es mates presented here would result in a propor onal reduc on in SMART'ssales tax revenue forecast.
The current forecast was generated on the basis of na onal consumer spending pa erns as well. Taxable sales, andthus sales tax revenues, are highly correlated with and driven by nominal spending trends observed na onwide. Ona per capita basis, nominal spending on goods has con nued to trend upward, and this is forecasted to con nue intothe future. The post-recessionary recovery can be seen present in this data series, with per capita expenditures in-creasing to $11,930 and $12,138 per year in 2012-13 and 2013-14. Beacon Economics is forecas ng that per capitagoods spending will con nue to increase—reaching $21,577 by the end of our forecast.
0.0
1.0
2.0
3.0
4.0Po
pula
tion
Gro
wth
(%)
400
500
600
700
800
900
SMAR
T Po
pula
tion
(000
s)
1971 1978 1985 1992 1999 2006 2013 2020 2027Fiscal Year Ending
SMART Population Population Growth
Source: Forecasts by Beacon Economics
1970-71 to 2028-29SMART Area Population Forecast
30.0
35.0
40.0
45.0
Goo
ds S
hare
of C
onsu
mpt
ion
(%)
5
10
15
20
25
Per C
apita
Goo
ds S
pend
ing
(000
s)
1981 1988 1995 2002 2009 2016 2023 2030Fiscal Year Ending
Per Capita Goods Spending Goods Share of Consumption
Source: Forecasts by Beacon Economics
1980-81 to 2028-29Consumer Spending Pattern Forecast
Importantly, this forecast takes into account the fact that spending on goods,which form the basis of sales tax revenuesin California, has con nued to gradually decline as a share of the overall consumer basket. For example, in the early1980s, spending on goods represented 45% of all consumer expenditures. However, this has been on a steady declineover the past three decades, and dropped below 33% during the height of the downturn. This has since popped backup a fair amount, which is hardly surprising as services tend to be more income elas c than goods, and hence tend tobe more heavily affected by reduc ons to income associated with job losses such as the ones that characterized themost recent downturn. S ll, despite the declining share of goods in the consump on bundles across the na on, theamount of spending on goods have con nued to grow steadily.
• Beacon Economics s ll forecasts that goods will represent amarginally lower share of consumers' overall spend-ing. By 2028-29, we see goods leveling off to just below 33% of all consumer spending. This is an increase fromour previous forecast and represents another reason for our slightly higher sales tax revenue projec ons.
S ll, despite a slightly smaller shares of consump on going toward goods in the long-term, the level of goods con-sump on is expected to con nue to grow. This is due to the following factors:
• The first major driving factor is that popula on is projected to see con nued growth, as detailed earlier, whichwould boost taxable sales even if per capita expenditures remained constant.
Sonoma-Marin Area Rapid Transit - Forecast 6
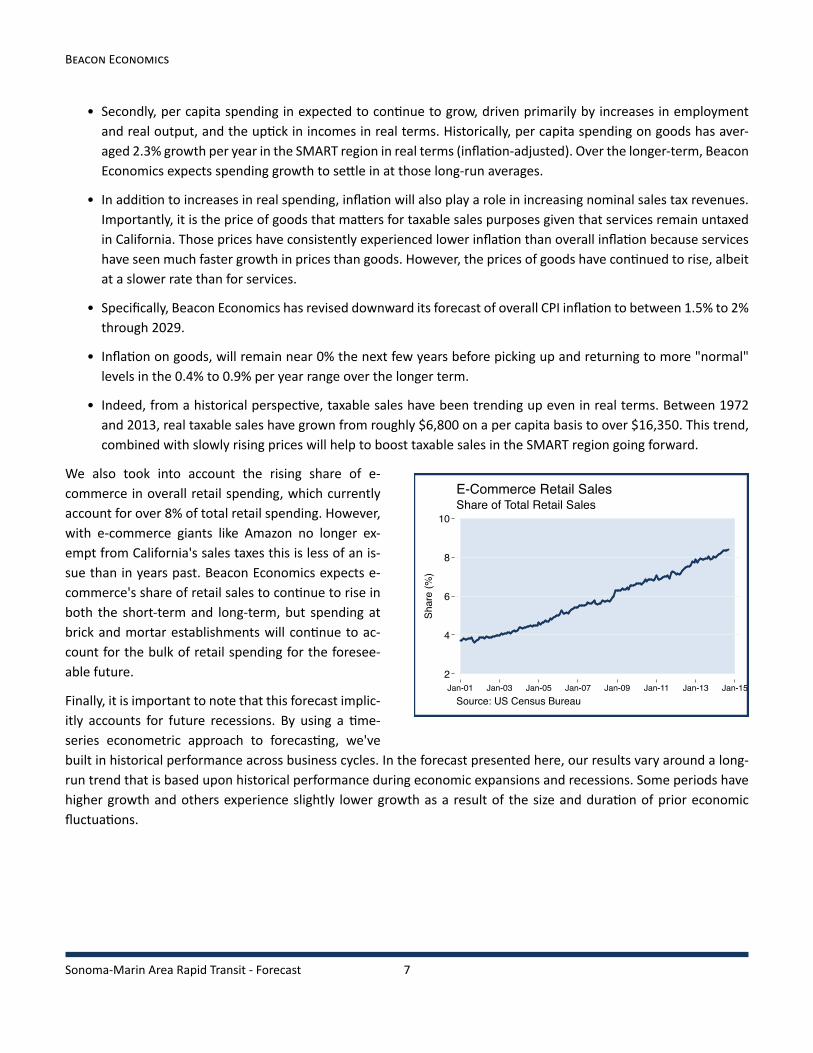
B E
• Secondly, per capita spending in expected to con nue to grow, driven primarily by increases in employmentand real output, and the up ck in incomes in real terms. Historically, per capita spending on goods has aver-aged 2.3% growth per year in the SMART region in real terms (infla on-adjusted). Over the longer-term, BeaconEconomics expects spending growth to se le in at those long-run averages.
• In addi on to increases in real spending, infla on will also play a role in increasing nominal sales tax revenues.Importantly, it is the price of goods that ma ers for taxable sales purposes given that services remain untaxedin California. Those prices have consistently experienced lower infla on than overall infla on because serviceshave seen much faster growth in prices than goods. However, the prices of goods have con nued to rise, albeitat a slower rate than for services.
• Specifically, Beacon Economics has revised downward its forecast of overall CPI infla on to between 1.5% to 2%through 2029.
• Infla on on goods, will remain near 0% the next few years before picking up and returning to more "normal"levels in the 0.4% to 0.9% per year range over the longer term.
• Indeed, from a historical perspec ve, taxable sales have been trending up even in real terms. Between 1972and 2013, real taxable sales have grown from roughly $6,800 on a per capita basis to over $16,350. This trend,combined with slowly rising prices will help to boost taxable sales in the SMART region going forward.
2
4
6
8
10
Shar
e (%
)
Jan-01 Jan-03 Jan-05 Jan-07 Jan-09 Jan-11 Jan-13 Jan-15Source: US Census Bureau
Share of Total Retail SalesE-Commerce Retail Sales
We also took into account the rising share of e-commerce in overall retail spending, which currentlyaccount for over 8% of total retail spending. However,with e-commerce giants like Amazon no longer ex-empt from California's sales taxes this is less of an is-sue than in years past. Beacon Economics expects e-commerce's share of retail sales to con nue to rise inboth the short-term and long-term, but spending atbrick and mortar establishments will con nue to ac-count for the bulk of retail spending for the foresee-able future.
Finally, it is important to note that this forecast implic-itly accounts for future recessions. By using a me-series econometric approach to forecas ng, we'vebuilt in historical performance across business cycles. In the forecast presented here, our results vary around a long-run trend that is based upon historical performance during economic expansions and recessions. Some periods havehigher growth and others experience slightly lower growth as a result of the size and dura on of prior economicfluctua ons.
Sonoma-Marin Area Rapid Transit - Forecast 7
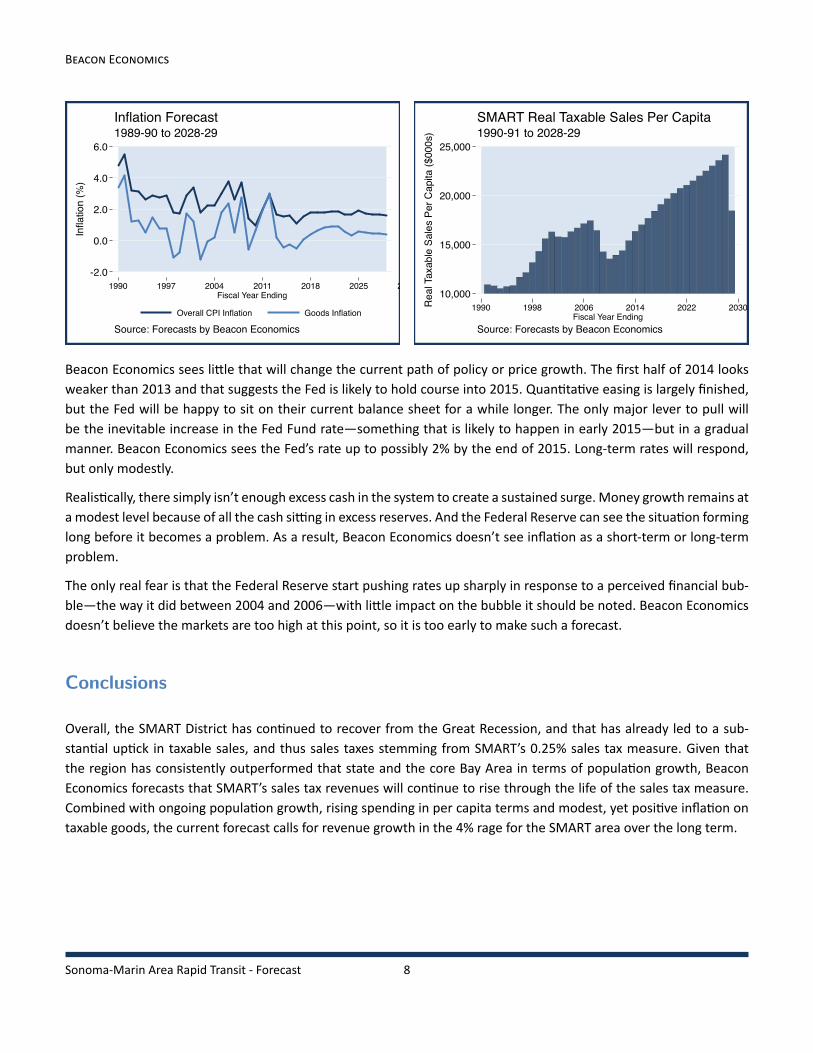
B E
-2.0
0.0
2.0
4.0
6.0
Infla
tion
(%)
1990 1997 2004 2011 2018 2025 2032Fiscal Year Ending
Overall CPI Inflation Goods Inflation
Source: Forecasts by Beacon Economics
1989-90 to 2028-29Inflation Forecast
10,000
15,000
20,000
25,000
Rea
l Tax
able
Sal
es P
er C
apita
($00
0s)
1990 1998 2006 2014 2022 2030Fiscal Year Ending
Source: Forecasts by Beacon Economics
1990-91 to 2028-29SMART Real Taxable Sales Per Capita
Beacon Economics sees li le that will change the current path of policy or price growth. The first half of 2014 looksweaker than 2013 and that suggests the Fed is likely to hold course into 2015. Quan ta ve easing is largely finished,but the Fed will be happy to sit on their current balance sheet for a while longer. The only major lever to pull willbe the inevitable increase in the Fed Fund rate—something that is likely to happen in early 2015—but in a gradualmanner. Beacon Economics sees the Fed’s rate up to possibly 2% by the end of 2015. Long-term rates will respond,but only modestly.
Realis cally, there simply isn’t enough excess cash in the system to create a sustained surge.Money growth remains ata modest level because of all the cash si ng in excess reserves. And the Federal Reserve can see the situa on forminglong before it becomes a problem. As a result, Beacon Economics doesn’t see infla on as a short-term or long-termproblem.
The only real fear is that the Federal Reserve start pushing rates up sharply in response to a perceived financial bub-ble—the way it did between 2004 and 2006—with li le impact on the bubble it should be noted. Beacon Economicsdoesn’t believe the markets are too high at this point, so it is too early to make such a forecast.
Conclusions
Overall, the SMART District has con nued to recover from the Great Recession, and that has already led to a sub-stan al up ck in taxable sales, and thus sales taxes stemming from SMART’s 0.25% sales tax measure. Given thatthe region has consistently outperformed that state and the core Bay Area in terms of popula on growth, BeaconEconomics forecasts that SMART’s sales tax revenues will con nue to rise through the life of the sales tax measure.Combined with ongoing popula on growth, rising spending in per capita terms and modest, yet posi ve infla on ontaxable goods, the current forecast calls for revenue growth in the 4% rage for the SMART area over the long term.
Sonoma-Marin Area Rapid Transit - Forecast 8

B E About Beacon Economics
About Beacon EconomicsBeacon Economics is one of California’s leading economic research and consul ng firms, specializing in economic andrevenue forecas ng, economic impact analysis, economic policy analysis, regional economic analysis, real estate mar-ket and industry analysis, and EB-5 Visa analysis. Known for delivering independent and rigorous analysis, we striveto give our clients an understanding of economic trends, data, and policies that helps strengthen strategic decisionmaking. Clients range from the State of California to Fortune 500 companies to major ci es and universi es. Learnmore at www.BeaconEcon.com.
Services Contacts• Economic, Revenue, &Occupa onalForecas ng
• Economic Impact Analysis
• Regional Economic Analysis
• Economic Policy Analysis
• Real Estate Market Analysis
• Industry and Market Analysis
• EB-5 Economic Analysis
• Public Speaking
• Expert Tes mony
• Sherif HannaManaging Partner(424) [email protected]
• Victoria Pike BondDirector of Communica ons(415) [email protected]
Sonoma-Marin Area Rapid Transit - Forecast 9
1
Public Financial Management, Inc. PFM Asset Management LLC PFM Advisors
December 9, 2014
Memorandum
To: Board of Directors, Sonoma-Marin Area Rail Transit District
From: Sarah Hollenbeck, Managing Director, Public Financial Management, Inc. Bob Rich, Managing Director, Public Financial Management, Inc.
Re: 2014 Strategic Plan Financial Model
In support of SMART's development of the 2014 Strategic Plan, Public Financial Management, Inc., as the District's Financial Advisor, has worked with staff and the Citizen's Oversight Committee ("COC") over the last six months to prepare an update to the financial model we created in 2011in connection with SMART's bond issuance. In updating the model, we revisited the key assumptions driving the financial projections to determine whether adjustments were appropriate. Based on discussions with the COC and SMART staff, major assumptions that were updated from the original model presented to the Board and rating agencies in connection with SMART's 2012 borrowing were the sales tax revenue growth rate, the inflation rate that is applied to certain costs, and the investment earnings rate applied to balances on hand. In the current model the sales tax revenue growth rate was adjusted to a flat rate of 3.00% per year for fiscal years 2015 and beyond. Previously the model had assumed growth projections ranging from 2.70% to 5.40% and averaging 3.86% based on the 2011 projection prepared for SMART by Beacon Economics. While sales tax growth has well exceed model assumptions in recent years, adopting a forecast of flat 3.00% annual rate increases the conservatism of the model. The flat 3.00% annual rate increase remains conservative based upon the updated Beacon forecast, prepared in December 2014, which projects SMART's sales tax growth to range from 3.50% to 5.50% annually through 2029. The annual inflation rate was increased from 2.50% to the 2.61%, the 20-year average of CPI for the San Francisco Bay Area. The investment earnings assumption was adjusted downward in the near term and the gradual increase to a maximum rate of 2.50% was delayed to reflect continued low short-term interest rates. We would note that these changes to the financial model all reflect more conservative assumptions than were presented to the credit rating agencies, Standard & Poor's and Fitch, when they assigned their ratings of AA and A, respectively, to the District's bonds in 2012 and when Fitch affirmed its rating earlier this year. We hope this information is helpful to you in your consideration of the 2014 Strategic Plan and would be happy to respond to any questions you may have.

P.O. Box 750641 Petaluma, CA 94975 707.318.0348 [email protected] www.econforensics.com
November 30, 2014
Basic Overview of SMART Financial and Strategic Plan Citizens Oversight Committee
This report provides some insight concerning SMART’s recent, draft strategic plan (dated October 24, 2014) for the Citizens Oversight Committee (COC). There is a lot of data in the financial plan. That is where I will focus. I will pick out a few things from the main part of the strategic plan to consider as well. I will try and explain the sales tax forecasts as well as the other revenue and expense forecasts. Potential issues with the public based on the past and also current communications with your committee suggest some issues with these forecasts. As we see below, there are some confounding factors that may support sales tax revenue locally even if demographic shifts cause a slow reduction of the tax base otherwise. Strategic Plan
The strategic and financial plans are linked. The ability of SMART to complete its Phase 1 construction, and then to expand to Larkspur, is dependent upon their ability to fund the phases. The financial estimates suggest positive net operating revenue (revenue after operational and administrative expenses) through 2029. The excess revenues would become “reserves”. The reserves are a prudent way to plan for contingencies, as in any business. It would be good to have more details in terms of regularly-scheduled maintenance and other expenses just to be explicit about the operations and maintenance expenses over time. The forecasted reserve funding will be used for revenue shortfalls or unexpected changes in expenses most likely. The financial plan, as discussed later, is very dependent on sales tax revenue through 2029. Revenue also comes from an array of potential options. The ridership revenue (called “farebox” revenue in the plan) is a revenue stream that is not very large versus the expenses. While it may be standard practice to use state and federal grants, reallocated tax revenue, continued sales-tax revenue locally, and other public and private sources for funding, the plan would be more appealing financially if operations revenue (outside of sales taxes) was closer to operations expenses. Debt can make up that difference; interest payments on that debt must still be paid (as well as principal). However, most transportation systems rely on continued or reallocated tax receipts, grant revenue and other sources beyond operational revenue to survive, and I get that.

P.O. Box 750641 Petaluma, CA 94975 707.318.0348 [email protected] www.econforensics.com
It is interesting (at least for me) to consider the farebox revenue maximum. If the cars were full every weekday, then we would be assuming 318 passengers per set of two cars, $5.07 as the average fare, 30 train trips per day on weekdays, and 51 weeks of 5-day weeks (which takes weekends and holidays out for sake of discussion). This suggests that the maximum farebox revenue for a year of five-day weeks would be: 318 people x $5.07/person as average fare x 255 days x 30 trips/day = $12,333,789
This does not count weekend revenue, and we know there will be fewer trains running on weekends. The financial plan only shows a maximum of $6.6 million in fare revenues, which implies a 53.625 percent utilization rate, in 2029; the plan only shows a 30.67 percent utilization rate in 2019. The hope is demand will be driven by marketing, relative newness and excitement about the train, and also gains for passengers from not commuting. The plan suggests 5.6 percent growth of revenues and 3 percent growth in fares through 2029 also. The more these trains are filled, the more revenue and less dependence on sales tax revenue.
There seems to be little analysis in terms of elasticity of demand. I know SMART is currently doing some demand analyses (I recently answered their survey). Ridership estimates at different price points and different times of the day can create a way to look at demand theoretically. Because two points make a straight line, it would be good to estimate a simple demand relationship between fares and ridership (and perhaps for different market segments, such as commute versus non-commute times) to know how to optimally price, or what revenue may be gained by raising or lowering price based on demand conditions. Fares and ridership rising in tandem, without a further assumption that income growth and other demand factors (such as a willingness to ride the train over driving one’s own car or taking other transport) will trump ridership otherwise, may be an assumption to consider more deeply.
Because sales taxes may experience ups and downs due to economic recessions and growth cycles, the operational budget is exposed to recession and demographic risk, especially if sales tax goes away at some point (there is a strong belief, based on other transportation systems’ history, that the sales tax will be renewed by voters as 2029 draws nearer). I think it is good that the plan puts so much thought into alternative revenues. It would be great if ridership were increased.
There seems to be no explicit recessions predicted (downturns are subsumed in the trend), which can be both good and bad. The trend in sales tax revenue may very well be as predicted, thus the need to show peaks and valleys is less important. Because predicting when a recession will come is difficult, trying to put these cycles in such a forecast will cause alarm when not needed. There will very likely be at least one recession between now and 2029, and a conservative estimate may be in fact put two recessions in over a 15-year span; the postwar era (1945 to present) has not gone more than ten years without a recession in the United States. The key is how a recession will potentially reduce the overall trend.
What may causes some questions is the dependence on sales tax revenue in the forecast, and thus the risk exposure to a downturn. The strategic plan did a great job of discussing alternative revenue sources and that planning is already in place to provide options. Figure A-1 is a great graphic to consider with respect to the arguments around the sales tax forecast (on page 21 of the draft plan). Notice that the gap widens in
P.O. Box 750641 Petaluma, CA 94975 707.318.0348 [email protected] www.econforensics.com
cumulative sales tax dollars more as time goes on when there is slower growth, which is intuitive. Any reduction in sales tax revenue through 2029 from the current projections can be boiled down to a philosophical discussion of how the components of such a forecast will move around.
Also, the long-term cost forecast may also have a need for reserves given that labor costs are 56.2 percent of the total (from the table on page 15 under operating expenses) and cost growth may outpace the current forecast easily through rising wages in a relatively high cost-of-living marketplace, health care costs, etc.
The sales tax forecast has these components, where a trend line can be estimated (as alluded to in the text from an econometric/statistical estimation as was done by Beacon Economics in 2011, which I also reviewed) from these data:
Population growth (more people to buy taxable goods and services);
Personal Income growth (more income to buy taxable goods and services);
Inflation growth (reduces the real value of incomes and sales tax revenue); and
Taxable sales as a percentage of income (how much of our personal income do
we spend on taxable goods).
This table summarizes a way to consider each of these variables, as the philosophical discussions about what will or will not take place boils down to these changes:
Component (as this component rises, holding the other components constant, sales tax revenues …)
Direction of Sales Tax
Revenue Change
Personal Income (Income before taxes for households) per person
Rise
Inflation Fall
Taxable sales as % of income Rise
So, when considering arguments of slower or faster growth of sales tax revenue, these are the normal components. However, there are some confounding factors to consider in this area:
Sonoma County generates sales tax revenue from tourism, which depends on
outside-area incomes and not on local-area incomes per se. This supports a
faster growth forecast (if tourism grows, sales tax revenue will grow even if
personal income has flat growth);
The supposition that rising wealth means less spending depends on the flow of
income from wealth. If there is more wealth overall in this area, but more
people living off that wealth as they age, Sonoma and Marin counties may
experience some more wealth converts to income and then to spending than
expected from history;

P.O. Box 750641 Petaluma, CA 94975 707.318.0348 [email protected] www.econforensics.com
An aging populace may spend less on taxable goods, so the speed at which Marin
and Sonoma counties age may be a negative factor in taxable sales if aging is
more rapid than currently predicted;
Business-to-business sales may also be taxable. For example, Petaluma’s Scott
Laboratories makes sales that are taxable and is one of Petaluma’s larger sales
tax generators. This has nothing to do with local personal income growth; and
If internet sales become more taxable, and where people live generate more
sales taxes from their purchases, there will be more sales taxes collected (at least
in theory), and there may also be a shift toward local retailers as a result of not
being able to avoid sales taxes anymore.
In sum, there are many reasons to both challenge and also agree with the sales tax forecast in the report, as with any other long-term forecast. Further, inflation will constantly be an issue and erode the real value of those sales tax dollars, which may affect the ability to repay debt if there is any variability to interest rates there.
I think the strategic plan provides a good forecast, and they are adjusting from previous forecasts with new information, but your committee should consider the risks, which would be any forecast over this long a time horizon.
Sincerely,
Robert Eyler, Ph.D. Economic Forensics and Analytics PO Box 750641 Petaluma, CA 94975-0641 [email protected] 707-318-0348 (cell)