sony and the global environment · pdf filesony and the global environment. ... sony...
TRANSCRIPT

Sony Corporation CSR Report 200332
Sony and the Global Environment

Sony Corporation CSR Report 2003 33
Sony recognizes that conservation of the global environment is one of the greatest
tasks facing humanity in the 21st century.
Sony intends to contribute positively to conservation of the natural environment and
the dreams of future generations.
Sony recognizes the utmost importance of a healthy global environment, and has
made sustainable development the Group’s top business priority. This entails utilizing
Sony’s environmental resources in a manner that will also allow future generations to
achieve their potential in health, wealth and happiness.
Sony aims to show that it is possible to achieve a new balance between
humankind and nature by doing more with less, reducing the environmental impact
from its use of energy and resources while providing its customers with high-quality,
high-performance products and services.
Sony employees will be encouraged to study constantly to learn about a broad
variety of environmental issues. Sony will also cooperate with stakeholders in a joint
quest to improve the world that we share.
Excerpt from the Sony Environmental Vision
Sony Environmental Vision
* The Sony Environmental Vision is an extension of Sony’s environmental policy formulated in 1993.
33

Sony Corporation CSR Report 200334
The Sony Environmental Vision was formulated in October 2000 to establish principles for environmental
management activities throughout the Sony Group worldwide. Its constituent elements are vision,
commitment, and driving forces. Sony’s fundamental aim is the creation of a sustainable society built on
continual improvements in eco-efficiency*1.
Basic Stance on Environmental Issues
Sony’s basic stance on key global environmental issues is
summarized below.
• Climate Change
Sony is working to help prevent global warming and
other aspects of climate change that could possibly
result from its business activities.
• Natural Resources
Sony is promoting a continuous increase of resource
productivity in its business process and the reduced use
of virgin materials, energy and water whenever
possible. Sony will thus promote the reuse and recycling
of resources.
• Chemical Substances
Sony is committed to the progressive and continuous
reduction and, whenever possible, the phasing out of
hazardous materials and chemicals in its business process.
• Natural Environment
The biodiversity of the Earth must be maintained, and
Sony actively supports protecting the biodiversity of the
world’s forests and oceans.
Sony Environmental Vision
*1 Eco-efficiency equals sales divided by environmental impact. (See p. 38 for more on eco-efficiency)
Three Driving Forces
Sony Mid-Term Environmental Targets
Green Management 2005
Education
Technology Business Models
Vision(see p.33)
Sony Environmental Vision
Commitment
Basic stance on environmental
problems
Commitment in business activities

Sony Corporation CSR Report 2003 35
1. Corporate Citizenship
Individual Sony employees will enhance their
knowledge of environmental issues and act
responsibly with respect to society.
2. Business Planning
Sony will continually encourage the development of
innovative business models that can help to reduce
environmental impact.
3. Research and Development
Sony will make ongoing efforts to develop new and
original technologies that contribute to conservation of
the environment.
4. Product Design
Sony will aim to apply “cradle-to-cradle” design
principles in all its products and services in order to
minimize impact on the environment.
5. Manufacturing Processes and Site Management
Sony will continuously improve environmental manage-
ment systems at both manufacturing and non-
manufacturing sites.
Commitment in Business Activities
Sony is committed to reducing its environmental impact through the following initiatives.
6. Distribution, Sales, Marketing and
Aftersales Service
Sony strives to minimize the environmental impact of
product packaging and business activities such as
distribution and sales. Whenever possible, Sony provides
environmental information to customers.
7. Post-use Resource Management
Sony will vigorously promote product collection, reuse
and recycling, together with the application of resources
recycled from post-use products to new uses.
8. Information Disclosure and
Stakeholder Communication
Sony will continually provide fast and accurate
disclosure of environmental information while
maintaining a dialogue on environmental issues with
all stakeholders.
9. Risk Management System and Occupational Health
and Safety Management
Sony will apply rigorous risk management systems
worldwide and maintain communication concerning
risks with its stakeholders. Sony will also work to
ensure safe and healthy working environments for
all employees.
Three Driving Forces
Sony has designated the three driving forces of Technology, Education and Business Models to promote its Vision and
follow through on its Commitment. These forces mutually reinforce each other, helping to drive progress in reducing
environmental impact.
Sony Mid-Term Environmental Targets (Green Management 2005)
In March 2001, to outline a path toward the achievement of the Sony Environmental Vision, Sony formulated its Mid-Term
Environmental Action Program, Green Management 2005. This established specific quantitative targets for the period to
2005. In July 2003, Sony revised this program to set more practical mid-term environmental goals.

Sony Corporation CSR Report 200336
Understanding Environmental Impact Based on
Product Life Cycles
Sony purchases resources as materials and components
and converts them into products at Sony sites through
manufacturing processes using energy, water and
chemical substances. A certain volume of waste is
generated in the course of this process. The use of Sony
products and services also consumes energy. By consum-
ing energy and resources, Sony’s business activities have
an impact on the natural environment.
The aim of the overview is to look at the overall
environmental impact of Sony’s operations around the
world. The focus has expanded to include the entire life
cycle of products, encompassing the energy Sony
products consume once they are in the hands of
customers and the extent of recycling and waste disposal
and energy and resources consumed through such
business activities.
This overview looks at forms of environmental impact in
the year ended March 2003 that Sony can recognize and
manage directly. It is important to remember that Sony’s
business activities impact the environment in ways not
covered in this report. For example, the manufacture of
components and materials, recycling of end-of-use
products and distribution processes place an additional
burden on the environment.
Based on the principles set forth in the Sony Environ-
mental Vision, Sony continues to implement various
measures designed to reduce environmental impact, such
as the formulation of new mid-term environmental
targets contained in Green Management 2005.
Overview of Sony’s Environmental Impact
Sony’s business activities have an impact on the environment in various ways. Consumption of energy and
resources is one example. This overview looks at Sony’s environmental footprint from the perspective of
product life cycles. Sony is undertaking numerous activities based on the Sony Environmental Vision to
reduce its impact on the environment.
Products (Not recycled) 1,271,000 tons
Packaging material (Waste)44,000 tons
Recycling
Product recycling14,000 tons
Packaging materials recycling128,000 tons
For detailed figures, please refer to pp. 69–71.

Sony Corporation CSR Report 2003 37
*1 Calculated based on the total amount of electricity, gas, oil and vehicle fuel used at sites.
*2 Total amount of class 2 through class 4 substances handled (see p.65).
*3 Total of amounts based on product weight and waste from sites.
*4 Total amount of vegetable-based plastics used.
*5 Calculated based on total transport weight and distance transported.
• Purchased via deeds, other 63 TJ• Self-produced 1 TJ
Renewable energyEnergy*1 42,000 TJ
Water 26,390,000 m3
Chemical substances*2 165,000 tons
Other resources*3 1,680,000 tons (including 120,000 tons of recycled resources and 6 tons of renewable materials*4)
Energy consumed by products and services 276,000 TJ
Products1,285,000 tons
Packaging materials 172,000 tons
Chemical substances (Release and transfer)9,000 tons
CO2 emissions fromproduct delivery*5 1,536,000 ton-CO2
Waste from sites(Disposal) 37,000 tons
Greenhouse gases (CO2 equivalent) 2,214,000 ton-CO2
CO2 emissions from energy use15,300,000 ton-CO2
Recycled/reduced waste from sites 187,000 tons
Recovered and recycled chemical substances 105,000 tons
Customers(use of products/services)
Resources
Sony(manufacturing and other
business activities)

Sony Corporation CSR Report 200338
Eco-Efficiency
What is Eco-Efficiency?
Eco-efficiency is an expression of Sony’s commitment to
striking a more harmonious balance between ecological and
economic demands, based on concepts such as those
proposed by the World Business Council for Sustainable
Development (WBCSD*1). Eco-efficiency rises if environmen-
tal impact falls as the scale of business activities expands.
Eco-efficiency is defined by the equation on the right, and
Sony has set numerical performance targets for the specific
environmental activities undertaken throughout the company,
all of which are subject to periodic objective evaluation.
Five Environmental Indices
Based on careful consideration of the life cycle of its
business activities, Sony has established its own unique set
of five environmental indices. These are based on those
aspects of operations that Sony can identify and improve
internally. The indices provide quantitative measurements of
environmental impact, with lower numerical values
signifying reduced levels of impact. Eco-efficiency factors
can be calculated for each index separately (the results are
shown from p. 39 onwards).
Besides the goal of raising eco-efficiency, Sony’s mid-term
environmental targets, Green Management 2005 also
contains detailed numerical targets related to each of
these indices.
Specific Targets Within Sony Mid-Term Environmental
Targets
By the years ending March 2006 and 2011, respectively,
Sony aims to raise eco-efficiency with respect to green-
house gases, resource input and resource output by 1.5 and
2.0 times, compared with those levels achieved in the year
ended March 2001. Sony has set numerical targets related
to its products and business activities. Steady progress
continues to be made towards these goals.
1 Greenhouse gas index (unit: ton-CO2)
Total CO2
emissions fromSony sites
Total CO2
emissions fromproduct use
Greenhousegas offsetcontribution
+ —
2 Resource input index (unit: tons)
Total resourceconsumption
Total recycledmaterial used
Total renewablematerials used
3 Resource output index (unit: tons)
Waste fromSony sites sentto landfill
Total volume ofproducts shipped(ex-factory)
Collectedproducts
4 Water index (unit: m3)
Water purchasedfrom watersuppliers
Groundwaterused
Waterconservationcontribution
5 Chemical substances index (unit: tons)
Released intoair, waterand soil
Wastetransfervolume
Chemicalsubstances inproducts sold
Chemicalsubstances inproducts collected
Eco-efficiency is the numerical indicator that Sony uses as a gauge of the degree of environmental impact
caused relative to the scale of its business activities. Sony has established five indices to provide a quantita-
tive assessment of the environmental problems associated with these business activities. The goal is to raise
eco-efficiency in each of these five areas.
Greenhouse gas efficiency
Resource input efficiency
Resource output efficiency
2000 2005 2010
1.5 times
2.0 times
(Fiscal)
*1 Consisting of over 160 multinational corporations from around the world, the mission of the WBCSD provides business leadership as a
catalyst for change toward sustainable development. Sony has been a member of the WBCSD since its establishment.
Sales
Environmental impact(Environmental Index)
Eco-efficiency =
— —
+ —
+ —
+ + —

Sony Corporation CSR Report 2003 39
Eco-efficiency levels achieved by Sony in the year ended March 2003 and in previous years are shown on
the accompanying charts. While resource input and output efficiency showed slight improvement, further
efforts are still required to raise greenhouse gas efficiency in order to achieve targets set out in Green
Management 2005.
Eco-Efficiency in the Year Ended March 31, 2003
Greenhouse Gas Efficiency: 1.05 Times
Total greenhouse gas emissions in the year ended March
2003 were calculated as 2.18 million tons*1 due to
activities such as energy consumption at business sites and
15.3 million tons due to emissions from product use.
Helping to offset this, contributions from emission
reduction activities such as electric power generation from
renewable energy sources totaled 2, 570 tons.
As a result, the greenhouse gas index for the year was
17.48 million ton-CO2, generating a greenhouse gas
efficiency of 1.05 times, compared to the year ended
March 2001. Despite ongoing progress in reducing
greenhouse gas emissions from most business sites, a
slight increase was noted in emissions from semiconduc-
tor and liquid crystal manufacturing sites. At the
product use stage, higher shipments of televisions, which
are the main source of greenhouse gas emissions, and
home videogame consoles, which continued to sell
extremely well, also pushed overall emissions higher.
FY02 calculations
¥7.5 trillion
15.3 million tons + 2.18 million tons – 2,570 tons
Sales and operating revenue (¥ trillion)
Eco-efficiency (times)
■ CO2 emissions from business sites(unit: million tons)
■ CO2 emissions from product use(unit: million tons)
■ Emission offset contribution (unit: tons)
7.37.6 7.5
00 01 02
0
05 (Fiscal)
Sales (¥ trillion)
Emissions (unit: million
tons)
Emissionoffset
contribution (tons)
750
1.50 (Target)
2,570
1.08 1.05
2.25 2.15
1.00
0
25
7.0
7.8
20
15
10
5
15.77 15.09
2.18
15.30
*1 CO2 emissions from vehicle fuel use not included, as no emissions figures existed when eco-efficiency was compiled in fiscal 2000.
➔
Please refer to pp. 70-71 for more data and explanations of
calculation methods.
Eco-efficiency in FY02(Greenhouse gases)
1.05 times(compared with FY00)

Sony Corporation CSR Report 200340
Resource Input Efficiency: 1.18 times
The total volume of materials used by Sony in the year
ended March 2003 was 1.68 million tons, including a total
volume of 120,000 tons in recycled materials and 6 tons of
renewable, vegetable-based plastics. This resulted in a
resource input index of 1.56 million tons and eco-efficiency
of 1.18 times, compared to the year ended March 2001.
This modest improvement is largely attributed to greater
resource-saving features incorporated into computer monitors
and recording media.
*Please refer to pp. 70-71 for more data and explanations of
calculation methods.
7.37.6
00 01 02 05 (Fiscal)
Sales(¥ trillion )
Resource input
(1,000 tons)
Recycled /renewable
materials used (1,000 tons) 0.002
1.50 (Target)
1.13
1,9201,762
7.5
1.18
1,680
1.00
113 1000.006116
0 0
2,500 7.8
7.02,000
1,500
1,000
500
Resource Output Efficiency: 1.18 times
The total volume of product packaging produced by Sony in
the year ended March 2003 was 1.46 million tons. Of the
waste generated by business sites, 37,000 tons was deemed
non-recyclable and marked for disposal. Post-consumer use
products collected and recycled amounted to 142,000 tons.
This resulted in a resource output index of 1.35 million tons
and eco-efficiency of 1.18 times, compared to the year
ended March 2001. Increased collection and recycling of
home appliances in Japan and of Sony products in the U.S.
are credited for this slight improvement.
*Please refer to pp. 70-71 for more data and explanations of
calculation methods.
Eco-efficiency in FY02(Resource input)
1.18 times(compared with FY00)
FY02 calculations
¥7.5 trillion
1.68 million tons – 120,000 tons – 6 tons
Eco-efficiency in FY02(Resource output)
1.18 times(compared with FY00)
FY02 calculations
¥7.5 trillion
37,000 tons + 1.46 million tons – 142,000 tons
Sales and operating revenue (¥ trillion)Eco-efficiency (times)
■ Total volume of materials used (unit: 1,000 tons)■ Total volume of recycled materials (unit: 1,000 tons)■ Total volume of renewable resources used
(unit: 1,000 tons)
In contrast to the year ended March 2001, eco-
efficiency for water in the year ended March 2003 was
1.11 times. For chemical substances, eco-efficiency for
volatile organic compounds (VOCs), the most common
class of chemicals used by Sony, was 1.41 times.
7.37.6 7.5
Sales(¥ trillion)
Resource output
(1,000 tons )
Products collected for the year ended
March 2001 (1,000 tons) 131 120
1.50 (Target)
142
1.13
5545
1.00
1,6391,505
1.18
371,457
0 0
2,500 7.8
7.02,000
1,500
1,000
500
00 01 02 05 (Fiscal)
Sales and operating revenue (¥ trillion)Eco-efficiency (times)
■ Waste from business sites (unit: 1,000 tons)■ Total volume of products produced (unit: 1,000 tons)■ Total volume of products collected (unit: 1,000 tons)
➔➔

Sony Corporation CSR Report 2003 41
Environmental Accounting
Environmental accounting was used to determine the cost of environmental conservation measures
implemented during the year ended March 2003 and to calculate the year-on-year reduction in environ-
mental impact achieved. Quantification of the effects achieved provides an evaluation of activities
undertaken in the year under review and allows plans for future years to be adjusted accordingly.
Environmental Conservation Costs
Environmental conservation costs in the year ended
March 31, 2003 were split between capital investment
totaling ¥4.7 billion (an increase of ¥0.5 billion
compared with the figure for the previous year of ¥4.2
billion) and expenses of ¥20.8 billion (a decrease of
nearly ¥5.7 billion compared with the figure for the
previous year of ¥26.5 billion). A notable decrease was
recorded in the cost for environmental remediation,
which decreased from ¥7.1 billion in the year ended
March 31, 2002 to ¥35 million. As a result of consistent
measures to prevent the recurrence of problems
surrounding certain chemicals used in Sony products,
Sony realized reductions in costs at the environmental
remediation phase from the year ended March 2002 to
the year ended March 2003. In line with its commitment
to avoiding future problems of this nature, Sony made
capital investments for infrastructure associated with
lead-free solder, purchased equipment for analyzing
chemical substances, and incurred costs for Green Partner
Environmental Quality Approval Programs. These actions
Please refer to the Sony CSR website for a full explanation of environmental conservation costs and effects.
http://www.sony.net/eco/book/
Category Investment Expenses Main Activities
Product design 717 (46) 2,903 (1,871) Design of environmentally conscious productsProduct recycling cost
0 (0) 37 (45)*1 Collection and recycling of discarded home electronics goods,packaging materials and batteries
Production and service 1,885 (2,250) 5,549 (5,129) Pollution prevention (Maintenance of environmental facilities,activities cost environmental research etc.)
1,245 (1,601) 4,460 (5,223) For reducing environmental impact (Energy conservation, resource conservation,chemical management etc.)
77 (3) 302 (83) Green purchasing
Administrative costs 667 (205) 5,558 (5,192) For environmental promotion organizations within Sony, andbuilding and maintaining environmental management systems
R&D costs 0 (62) 1,768 (1,637) R&D focused on products and manufacturing technologies designedto reduce environmental impact
Communication and 89 (14) 203 (246) For site environmental reports and greenification as well as othercommunity relations activities community activities for environmental conservation
Environmental remediation costs 1 (6) 35 (7,101) For cleanup of soil contamination and other forms of environmental damage
Total 4,681 (4,187) 20,815 (26,527)
(¥ million)
Environmental Conservation Costs in Fiscal 2002 (Fiscal 2001 figures in parentheses)
led to higher costs related to product design, green
procurement and management activities.
Environmental Conservation Effects
In the year ended March 31, 2003, greenhouse gas
emissions (CO2 equivalent) increased by 420,000 tons
year-on-year from product use and by 50,000 tons from
emissions related to production and service activities. In
terms of resources, the total amount consumed in products
and production declined by approximately 50,000 tons,
with waste from business sites down nearly 7,000 tons.
Water consumption rose by approximately 410,000 m3,
while the use of chemical substances marked for reduction
or elimination decreased by almost 2,900 tons. Separately,
the category “environmental risk,” included as part of data
presented in the previous year, has been excluded for the
year ended March 2003 due to difficulties in accurately
calculating the figure. Total environmental conservation
effects for the year totaled approximately ¥10.4 billion on a
monetary conversion basis.
*1 Due to insufficient accuracy, recycling costs for Europe in fiscal 2001 were omitted from calculations.
* Please refer to pp.70-71 for more data and explanations of calculation methods.

Sony Corporation CSR Report 200342
Progress Report on Mid-Term Environmental Targets,Green Management 2005
To outline a path toward achievement of the Sony Environmental Vision, Sony formulated the Mid-Term
Environmental Targets, Green Management 2005 plan. This sets individualized targets for both business
activities and products. Below is an overview of progress made by the end of March 2003, with more
detailed information on each target found on the pages in related-articles.
Environmentally Conscious Products
In the year ended March 2003, the management processes
applicable to the chemical substances contained in products
provided one major focus. Sony established a new manage-
ment system for these chemicals, in the process revising
management policies and standards. Sony also sought the
cooperation of all its suppliers in the effective upstream
management of this issue at the raw material and compo-
nent stages through the introduction of the Green Partner
Environmental Quality Approval Program (pp.50-51). Sony
was able to progress in digitization for its audio system
amplifiers, as well as in improving the energy-saving design
for its televisions sold in Japan. Despite such efforts,
increased production and other factors led to product-related
CO2 emissions in the year ended March 2003 totaling
approximately 15.3 million tons, with emissions due to
products and packaging materials reaching 1,457 thousand
tons. This resulted in a year-on-year increase in CO2 emissions
of 210,000 tons, while resource consumption declined by
50,000 tons (p.47). Further progress was made in the
development of vegetable-based plastics (p.55), a new type
of renewable material. Walkman models and other products
using this material were launched. In Europe, Sony joined
forces with three other leading manufacturers to establish a
pan-European recycling platform. This initiative will help Sony
prepare more efficiently with the WEEE (Waste Electrical and
Electronic Equipment) Directive (p.57).
This Walkman makes use of vegetable-based plastic.
with the year ended March 2001. Sony aims to continue to
raise output efficiency through the more efficient operation of
existing facilities. Other ongoing efforts to prevent global
warming include reductions in greenhouse gas emissions from
production processes and the increased use of renewable
energy through the purchase of power under the Green
Power Certification System in Japan (pp.60-62). Sony has
achieved significant reductions in total waste generation
through revision of various internal processes (pp.63-64). Use
of chemical substances is also on the decline, with reductions
in the use of Class 2 and Class 3 substances. Use of Class 4
substances rose in the year ended March 2003 due to
changes in data-gathering methods. Finally, Sony revised the
environmental risk management guideline to prevent the
occurrence of on-site environmental incidents (pp.65-66).
Environmental Management
The year ended March 2003 involved a revision of Sony Group
rules on environmental management, including adjustments
to the Green Management 2005 (pp.43-44). Each region
organizes its own green procurement program, such as
extending the purchase information system to cover green
procurement activities with non-production materials such as
office supplies as well as production materials. A total of nine
pre-construction site assessments at locations in Japan, China,
Thailand and Malaysia were carried out in accordance with
the Environmental Guideline, Construction Edition, which
ensure that all environmental considerations have been taken
into account prior to site development. Meanwhile, June 2002
was designated as Environment Month within the Sony
Group. Many different events took place at Sony sites to raise
environmental awareness among employees, to promote
relations with local communities, and to undertake specific
conservation projects (p.46). Sony is actively disclosing
information on its various environmental activities through
channels such as the Internet
and social & environmental
reports. In addition, the Sony
Eco Plaza (p.18) is a
permanent exhibition about
the environment.
Environmentally Conscious Business Activities
Total CO2 emissions related to business activities at Sony
manufacturing sites and offices amounted to approximately
2,214 thousand tons in the year ended March 2003. Starting
operation at semiconductor plant in the year ended March
2002 relative to the previous year was one source of higher
emissions. Per unit of sales, emissions were flat compared Environment Month exhibition at
Sony EMCS Corporation, Nagano TEC

Sony Corporation CSR Report 2003 43
Environmentally Responsible Management
Sony regards the environment as one of the main elements that governs the management of the Sony Group.
Sony has enhanced its environmental management systems, both to strengthen environmental policy
planning capabilities and to ensure the comprehensive implementation of such policies around the world.
Sony Group Environmental Management
Environmental management practices at Sony are based on
the rationale of the PDCA (Plan–Do–Check–Act) cycle. Each
business division, subsidiary and affiliate within the Sony
Group conducts environmental management activities in
line with established Group rules and mid-term targets.
The Group headquarters monitors compliance and
performance status using environmental audits and
evaluation, the results of which are used by management
to modify policy as necessary.
Improved Environmental Focus
Sony enterprises span a variety of fields and are global in
nature. Sony has recently modified its environmental
management structures to ensure that environment-related
activities are deeply ingrained throughout its business.
The sources of environmental impact within the Group
can be divided between products and business site
activities. Separate departments based at the Group
headquarters apply specialist expertise to implement the
most effective management methods to tackle these two
causes of environmental impact. The “products” depart-
ment manages the environmental aspects of product life
cycles, from procurement and design to after-sales services.
The “business site activities” department focuses on the
management of environmental issues common to all
business sites, such as disaster prevention and occupational
health and safety.
At the local operational level, other departments have
been established to oversee environmental management
activities by region and business area. The Sony Environmen-
tal Conservation Committee continues to provide a forum at
which managers from different parts of the Sony Group can
meet to discuss environmental issues.
Sony has also established the Institute for Environmental
Research to coordinate the details of its environmental
vision over the medium to long term.
Formulation of Sony Group environmental rules
and Green Management 2005
Environmental management actions
Environmental audits, evaluation/award
programs
Review of Green Management 2005
Revisions by management
P
D
C
A
Management at regional and divisional levels
Formulation of environmentalpolicies and rules
Product-related environ-mental management
Business sites-relatedenvironmental management
Division charged with implementation
Management
Sony EnvironmentalConservationCommittee
Institute forEnvironmentalResearch

Sony Corporation CSR Report 200344
Regional-Level Environmental Management
Five regional environmental conservation committees
(Japan, Europe, Americas, Asia, and China) have been
established under the Sony Environmental Conservation
Committee to oversee environmental activities throughout
Sony. These regional committees promote all environmen-
tal management activities conducted at business sites
within each respective region. Each committee covers issues
such as compliance with national legislation, environment-
related demands with products from markets within the
region, recycling, site management and audits, and ISO
14001 certification programs.
System of Environment-Related Rules
ISO 14001 certification is an ongoing process throughout
Sony. To align environmental management activities at
each business site more closely with Group environmental
policies, Sony is formulating internal regulations that are
based on the ISO 14001 rationale. In the year ended March
2003, Sony made revisions to the system governing
the types of environment-related rules.
Formulation of Corporate Environmental Audit Rule
The formulation of corporate environmental audit rules
provides one example of environment-related internal rules
at Sony. Besides ensuring that environmental audits check
compliance at each business site with all relevant environ-
ment- and OH&S-related legislation, these rules also check
that environmental management at each business site is in
conformity with all Sony Group environmental management
policies. The overall structure provides Sony with a coherent
internal system of regulation formulation and compliance.
ISO 14001 Certification Status
During the year ended March 2003, 4 certifications for
manufacturing sites and 4 certifications for non-manufac-
turing sites within the Group were obtained. As of June 1,
2003, a total of 73 certifications for manufacturing sites
and 64 certifications for non-manufacturing sites had
completed the certification process.
China EnvironmentalConservation Committee
Manufacturing sites: 6 /6 (6)Non-manufacturing sites: 1/1 (2)
Americas EnvironmentalConservation Committee
Manufacturing sites: 17/17 (17)Non-manufacturing sites: 3/7 (65)
Japan EnvironmentalConservation Committee
Manufacturing sites: 26/26 (43)Non-manufacturing sites: 24 /26 (137)
Europe EnvironmentalConservation Committee
Manufacturing sites : 9 / 9 (9)Non-manufacturing sites : 21/22 (23)
Sites Overseen by Regional Environmental Conservation Committees and Status of ISO 14001 Certification(As of June 1, 2003)
See p.69 for more information on sites eligible for ISO certification.* The numerator denotes sites that have received ISO 14001 certification, while the denominator denotes the total number of business sites eligible for
certification. Numbers in parentheses denote the total number of sites included within the scope of ISO certification. A number of sites have receivedcollective certification, resulting in discrepancies between the figures listed above. For example, 62 non-manufacturing sites and 2 manufacturingsites in the Americas respectively have collective certification. The result is that while there are a total of 3 certified sites, 65 sites are included withinthe scope of ISO certification.
■ Japan Environmental Conservation Committee = Japan■ Europe Environmental Conservation Committee = Europe, Turkey, Mediterranean North Africa, Russia and surrounding countries■ Americas Environmental Conservation Committee = North and South America■ Asia Environmental Conservation Committee = Asia (excluding Japan and China), the Middle East, Africa
(excluding Mediterranean North Africa) and Oceania■ China Environmental Conservation Committee = China
GlobalManufacturing sites: 73 /73 (101)Non-manufacturing sites: 64 /72 (303)
Asia EnvironmentalConservation Committee
Manufacturing sites: 15 /15 (26)Non-manufacturing sites: 16 /17 (76)

Sony Corporation CSR Report 2003 45
Evaluation and Award Programs for Environmental Performance
Sony conducts environmental audits to check that environmental management practices across the Sony
Group are in conformity with company policies. As additional parts of the system, status evaluations are
used to confirm that progress is being made toward environmental targets, while awards are given for
outstanding achievements.
Environmental Audits and Incidents (Fiscal 2002)
Environmental audits are a key part of Sony’s continued
efforts to improve environmental and OH&S management
at business sites, and to prevent environmental incidents
and accidents from occurring.
These audits mostly fall into one of three categories:
internal audits, which are self-checking exercises by
business units; corporate environmental audits, con-
ducted at business sites by the regional environmental
conservation committees; and third-party audits, which
are evaluations carried out by certified external bodies. In
addition, Sony has asked PricewaterhouseCoopers (PwC)
to provide independent verification*1 of the collection of
environmental data from business sites. The results of the
various audits play a useful role in improving environmen-
tal management practices across the Sony Group. For
instance, they can sometimes highlight the need for new
internal rules to tackle a problem common to the Group.
Evaluation of Environmental Activities
Sony undertakes a company-wide evaluation of its
environmental activities on an annual basis. Evaluation of
environmental performance focuses on the progress made in
terms of actual environmental impact reduction over the
course of the past year, in accordance with targets in Green
Management 2005. Performance is evaluated in quantitative
terms wherever possible. Starting in the year ended March
2003, with the aim of generating better results for the
Group as a whole, specific evaluation criteria were stipulated
in key areas, taking into account the varied business
characteristics of different parts of the Group.
Environmental Award Programs
Sony has a system of environmental awards that
recognize outstanding achievements in environmental
conservation, both by parts of the Sony Group organiza-
tion and by individuals within the organization.
Environmental incidents (fiscal 2002):Sony did not have any significant environmental incidents thatresulted in a release of hazardous materials impacting anysurrounding properties. Further, Sony did not receive anymaterial notification of an enforcement action or violation forthe unlawful or prohibited release of hazardous materials intothe environment.
Key evaluation criteria for environmental activities (fiscal 2002):
Products: Comprehensive management of chemical substancesProgressive shift to use of lead-free solderProgressive shift to energy-conserving products
Business sites: On-site energy conservationSite environmental risk managementGreenhouse gas reductions(semiconductor manufacturing sites)
Presentation of the Sony Environmental
Award using materials produced during
processing of vegetable-base plastics
*1 Please see pp. 75-77 for more details on the independent verification process and results provided by PwC.
Sony Environmental AwardLaunched in 1994, the Sony Environmental Award is presented annuallyin recognition of exceptional achievements in environmental conservationactivities. The Sony Environmental Conservation Committee selectswinners from a list of regional candidates.
Special Environmental Contribution AwardThis award is presented in recognition of outstanding contributionto the environment. The Chairman of the Sony EnvironmentalConservation Committee chooses the recipient of this award.
Environmental Excellent Performance AwardBased on the results of business performance evaluations, thisaward is presented in recognition of outstanding environmentalperformance within different parts of the Sony Group.
Aside from those listed above, individual regions and businessdivisions also operate their own award programs.

Sony Corporation CSR Report 200346
Environmental Education
Education is one of the three driving forces in the Sony Environmental Vision. Sony regards a comprehen-
sive in-house environmental education program as the first step towards promoting conservation of the
environment. The year ended March 2003 saw the introduction of educational programs designed to
promote environmental activities as part of core business functions and to encourage individual employees
to act voluntarily on environment conservation activities.
Applying Environmental Education to Work
Training courses tailored to specific work functions
supplement existing ISO 14001-based environmental
training for all Sony staff. Separately, in the year ended
March 2003, Sony introduced more advanced environmental
education programs that target different activities and types
of participant. Employees are free to attend these programs,
which aim to teach staff how to reduce environmental
impact in their daily work and to encourage voluntary
participation in environmental management activities.
Sony supplies employees with environment-related
information on a continuous basis. These media include in-
house publications, such as the “Sony Environmental
Update” environmental newsletter and internal Sony
websites, as well as the in-house Sony Times corporate
newsletter, Scope video broadcasts, and a variety of local
newsletters published in overseas locations.
In the year ended March 2003, Sony also organized a
number of in-house conferences to share information on
topics such as product-related environmental issues and
lead-free solder.
Sony Group “Environment Month” Initiated
The year ended March 2003 marked the launch of “Sony
Group Environment Month” on a worldwide basis.
Throughout the Group, one month was dedicated to
various environment-related activities designed to raise
environmental awareness among employees. In-house
events conducted during this month included award
ceremonies to mark exceptional environment-related
achievements and lectures given by outside experts.
Events designed to secure the cooperation of people
outside the company in reducing environmental impact
were also held, such as community environmental
conservation programs and award ceremonies for
business partners.
Participants at the in-house Product Environmental
Conference held during Environment Month ranged from
product design engineers and production personnel to
staff from support departments and sales, together with
various people from around Japan and the rest of the
world. The meeting encouraged lively debates on topics
such as the construction of a system to manage chemical
substances contained in products.
• Principal “Environment Month” in-house activities
Environmental meetings/exhibitions
Environmental lectures/training courses/training sessions
Educational events
• Principal “Environment Month” external activities
Green Partners exhibitions and award ceremonies
Environmental conservation programs targeted at site
environs
Seminars involving members of local communities
Company site tours for local schoolchildren
Environmental exhibitions
Examples of Environmental Month activities
Sony Group tree planting and
cleanup activities (Malaysia)
Information sessions at the Oita
Technology Center, Sony
Semiconductor Kyushu Co.
regarding environmental activities
(Japan)
Environmental exhibitions inside
the Sony Europe headquarters
building (Germany)

Sony Corporation CSR Report 2003 47
Environmental Impact of Products and Services
Sony, in addition to consumer electronics, is involved in the provision of games, music and an assortment
of other products and services. The main part of Sony’s impact on the environmental results from the use
and disposal of its products. For this reason, Sony sets medium-term objectives to guide it in reducing the
environmental footprint of its products and services.
During normal use, Sony products consume energy, leading to the indirect emission of CO2 gas at power generation
facilities. In the year ended March 2003, CO2 emissions from use over the life cycle of Sony products rose 1.4% year on year
to approximately 15.3 million tons. This increase is attributed mainly to higher shipments of consumer electronics, notably
televisions and increasingly popular home videogame consoles. Televisions are the largest producers of CO2 emissions, with
far higher power consumption than other consumer electronic products. Televisions also have a higher frequency of usage
(average of 4.5 hours/day) and longer product life cycles (average of 10 years).
Resources consumed in the manufacture of Sony products declined 3.2% from the previous year to 1.46 million tons. This is
attributed mainly to the ongoing shift to LCDs for use as computer monitors. Televisions, which are comparatively large compared
to most of the products created by Sony, consumed nearly 40% of resources allocated to the manufacture of products. However,
Sony collected and recycled televisions totaling nearly 12,000 tons in Japan during the year ended March 2003.
Greenhouse Gas Emissions From Product Use ( Unit: million ton-CO2)
Total Volume of Resources Used in Products(Unit: million tons )
■ Game ■ IT ■ Video
■ Industrial use ■ Audio ■ Television
■ Music ■ Devices/Other ■ IT ■ Video
■ Game ■ Industrial use ■ Audio ■ Television
*1, 2 From fiscal 2003, this will apply only to AC drive equipment.
*3 From fiscal 2003, the objective will be to reduce the total volume of resources used in products by 20%. Total volume of resources used in
products = total weight of products and accessories – total volume of recycled / renewable materials used.
*4 See pp. 50-51 for more information.
00 01 02
15
20
15.77 15.09 15.30
10
5
( Fiscal ) 00 01 02
1.5
1
0.5
21.64
1.50 1.46
(Fiscal )
Target Base Fiscal Year Target Fiscal Year Progress in Fiscal 2002
Reduce operating power consumption 2000 2005 Reductions targets were achieved for 40% of Sony’s latest products, and progressby 30%*1. is gradually being made for the remaining 60% of products.
Reduce standby power consumption — 2005 Approximately 50% of Sony’s latest products have a standby power consumptionto 0.1W or less*2. below the target 0.1W range, with particular success in compact product models.
Focus is now shifting to reducing standby power consumption in larger devices andthe internal components of tuners.
Reduce product weight and number 2000 2005 Few difficulties were encountered in reaching reduction targets in 40% of Sony’sof parts by 20%*3. latest products. The ongoing digitization of audio system amplifiers also contributed
to this success. Attention is now shifting to reducing the weight of glass in CRTtelevisions and on containing the weight of mobile phones and PCs despite theaddition of new functions.
Increase percentage of recycled 2000 2005 New applications for recycled materials continue to be developed, with materialsmaterials in products (by weight) by 20%. adopted for use in television speakers and as shock-absorbing materials.
To further promote the use of recycled materials, attention is now focused onpreventing contamination by hazardous materials.
Shift to environmentally conscious packaging — 2005 Nearly 70% of latest product models already incorporate environmentally consciousmaterials, such as recycled materials. materials. Shock-absorbing materials for lightweight products now consist
of paper-based cushioning. Polystyrene foam recycled through Sony’s limonenereconstitution process is being used as cushioning for heavier product models inJapan, with attention also shifting to increasing usage elsewhere.
The ban, phase-out and — — Sony is instituting the extensive management of chemical substances in its productscontrol of chemical substances*4. worldwide through its Green Partner Environmental Quality Approval Program
and other initiatives. Through the ongoing adoption of lead-free solderand a complete switch to this alternative in solder-intensive television models soldin Japan, Sony has reduced its use of lead by nearly 48 tons.
Green Management 2005 Targets for Products and Services

Sony Corporation CSR Report 200348
Environmental Impact Reduction of Products and Services
Sony is working to reduce the environmental impact of electronic products not just at the manufacturing
stage, but also during use and disposal. Sony believes that the majority of its products’ life cycle environmen-
tal impact is already determined at the stage of product planning and design stages. Sony is therefore
focusing efforts on ways to design more environmentally conscious products and services.
Product Assessment
Product assessments entail the study of how to reduce
the environmental impact of products throughout their
life cycle—from manufacture, to customer use (through
methods such as reduced power consumption) and final
disposal. At Sony, chief product designers are responsible
for applying the results of such assessments to develop
products that consume less power, are lighter, and
contain less chemical substances and packaging materials.
The aim is to use such product assessments to achieve
significant reductions in the environmental impact of
products at the planning and design stages, particularly
with products whose impact is large.
Introduction of Life Cycle Assessment (LCA)
LCA methodology provides a way of making an objective,
quantitative evaluation of the environmental impact of a
product over its entire life cycle. This approach spans parts
production, final manufacture, transport, operation,
disposal, and recycling. Practical LCA tools have been
developed internally for use at each Sony product design
department to help create products with minimal
environmental impact. These tools estimate the total life
cycle CO2 emissions of products based on input data such
as product characteristics, composition and logistics
details. During the year ended March 2003, LCA
analytical tools were introduced across the whole of Sony
for the quantitative analysis of product environmental
impact. As the diagrams on the right illustrate, the stage
at which environmental impact occurs varies from product
to product. As a means of reducing environmental impact
more efficiently, greater emphasis is being given to
scrutinizing processes that have enormous impacts. Future
plans also call for the extension of LCA-based design
processes to more categories of Sony products.
■ Component manufacture
■ Product assembly
■ Transport
■ Operation
■ Standby
■ Disposal and recycling
LCA tools for
evaluating
environmental
impact during
product life cycle
During production…• Energy conservation• Resource conservation etc.
During use…• Reducing power usage while operating• Reducing power usage while on standby etc.
During disposal or when recycling…• Making recycling easy• Chemical compounds etc.
Verified during productplanning and design stages
In the case ofa 32-inch digital television*1
In the case of an MD Walkman
Manufacture ofcomponents 17%
Assembly andtransport activities 1%
Operation 82%
Operation 1%
Disposal and recycl ing 1%
Product assembly 19%
Transport 2%
CO2 Emissions During the Life Cycle Stages ofVarious Sony Products
*1 Created with a built-in display.
Manufacture ofcomponents 77%

Sony Corporation CSR Report 2003 49
Shift to Lead-Free Solder
Solder is an indispensable component of many Sony products since it is used to connect numerous electronic
parts together. Yet the lead used in soldering materials may cause serious environmental damage if
products are improperly disposed. Sony continues to make good progress in utilization enhancement of
lead-free solder.
Promotion of Lead-Free Solder in Parts and
Manufacturing Processes
The solder used at Sony falls into two main varieties: solder
used during manufacturing processes to join parts and
circuit boards; and solder that is coated to joins on the
various parts (to allow parts to be joined together by the
application of heat). Sony aims to convert both types of
solder to lead-free varieties
by March 31, 2005, for the
elimination of lead from all
soldering materials used in
Sony products. Steady
progress is being made
toward this goal.
Use of Lead-Free Solder in Manufacturing
Sony started the basic research behind lead-free soldering
materials in 1995. Currently, in manufacturing processes Sony
is using lead-free solder formulations that contain tin, silver
and copper, which have become the standard in the industry.
Even once formulations have been developed, the
adoption of lead-free solder requires a broad scope of
expertise in production technology and equipment, as well
as design modification of products. The challenge is to
incorporate all this knowledge and expertise into the
processes used at each Sony manufacturing site.
Sony has initiated a specific project for the introduction
of lead-free solder throughout its manufacturing opera-
tions. In December 2002 a conference was held to further
promote this project, which representatives from around
the world attended. This meeting allowed different aspects
of Sony to showcase lead-free solder technology, and
promoted the sharing of technical and management
expertise in tackling this important issue.
Promotion of Lead-Free Solder From Suppliers
Sony is also seeking the cooperation of its suppliers to
convert the materials used in coated soldering joints for
parts into lead-free formulations.
Development of Low-Melting Point Lead-Free SolderAlthough lead-free solder has a reduced environmental impact, it typically has a higher melting point than the 183˚C
common to traditional lead solder. Depending on the material formulation, this melting point can even exceed the heat-
resistant limit of parts in process. This problem has complicated the introduction of lead-free solder varieties, necessitating
the development of various solutions at the design and manufacturing stages, such as new design rules, materials and
production processes for parts and printed wiring boards.
Through a joint development project with Nihon Genma Mfg. Co., Ltd., Sony has successfully
devised a type of lead-free solder with a low melting point of 196˚C, based on a mixture of tin
and zinc. This breakthrough has allowed a relatively simple shift to be made in the manufacture
of various products: not only can the same printed wiring boards and parts be
used, but no major changes in the production set-up are required. This variety of
lead-free solder is therefore highly effective. During the year ended March 2003,
this solder was introduced in the manufacture of MD decks, and tests were also
conducted for its application in the soldering of printed wiring boards in certain
mass-produced items.
Lead-Free Soldering Conference
This MD deck uses lead-free solder
with a low melting point.

Sony Corporation CSR Report 200350
Management of Chemical Substances in Products
In October 2001, Dutch authorities determined that the level of cadmium was above the limit allowed
under Dutch regulations for Sony’s PS one game consoles. To prevent any recurrence of similar problems
involving the use of chemical substances in products, Sony has revised its policies and rules that govern
such matters. A management system has also been put in place across the entire company.
Chemical Substances in Products:
Three Core Principles
The cadmium contamination issue in 2001 generated a
wide range of corrective and preventative measures within
Sony. Related spending and losses have totaled approxi-
mately ¥10 billion by March 31, 2003. Besides replacement
of the parts with excessive cadmium levels, Sony invested
in measurement devices to prevent a recurrence of any
problems involving levels of chemical substances in
products. The company also revised internal rules and
established the Green Partner Environmental Quality
Approval Program to be implemented by all companies as
well as manufacturing sites.
Three core principles now guide the management of
chemical substances in products across the whole of Sony.
The system is structured so that chemical substances are
Chemical Substances in Products:
Management Regulations
Sony’s Green Management 2005 plan establishes
management criteria for those chemical substances
contained in products that are judged—whether by Sony,
or in line with legislative trends in individual countries, or
according to scientific opinion—to have a significant
influence on either the natural environment or on humans.
Sony is seeking the compliance of all its suppliers with a
new set of “Management Regulations for the Environment-
related Substances to be Controlled which are included in
Parts and Materials (SS-00259)” that stipulate environmen-
tal management regulations for chemical substances in
For more details about the SS-00259 technical standards and Green Partner Environmental Quality Approval Program,
please refer to the Sony website http://www.sony.net/eco/book/
Upstream management of materials sourcingGreen Partner Environmental Quality Approval ProgramOEM Green Partner Environmental Quality Approval Program
Management of product design and QC/QA processesMultiple inspections of parts are conducted at the stages of delivery,manufacture and shipment, based on defined measurement rules.
Application of measurement rulesManagement is based on actual measurement datausing internal standards that are common to Sonyand to any parts suppliers.
Management of Chemical Substances in Products:Three Aspects of Principle Application
1
2
3
Measurementtaken
Upstreammanagement
Product design andquality assurance
Flow chart for management of chemical substances in products
Outline of “Management Regulations for the Environment-related Substances to be Controlled which are included inParts and Materials (SS-00259)”
1. Clear common global standards on prohibitedsubstances and usage
2. Clearly defined measurement standards andallowable concentrations
3. Ban/phase-out/reduction of substances and usagedefined on a three-level temporal scale
Level 1: Banned immediatelyLevel 2: Phase-out by individually set periodsLevel 3: Reduced
Measurementtaken
Measurementtaken
Measurementtaken
Measurementtaken
CustomerRaw materialssupplier
Componentsupplier
Componentinspection
Manufacturing(mass production)
Shipment
managed in line with these three core principles, all the
way from upstream materials sourcing through product
design to final QC/QA processes that involve the applica-
tion of measurement rules defined for individual parts.
parts and materials. An outline of this system is given
found on the right.

Sony Corporation CSR Report 2003 51
Sony Environment-related Substances to be controlled
Green Partner Environmental Quality Approval
Program
Since the management of chemical substances in
products under the new principles requires upstream
materials sourcing, Sony has introduced this program to
certify suppliers that meet the prescribed standards as
approved “Green Partners.” The approval process involves
a 60-point environmental quality audit that covers the
three aspects of environmental management systems,
*1 OEM products are products made by other companies that display the Sony logo.
Heavy metals Cadmium and cadmium compounds
Lead and lead compounds
Mercury and mercury compounds
Hexavalent chromium compounds
Chlorinated Polychlorinated biphenyls (PCB)
organic Polychlorinated naphthalenes (PCN)
compounds Chlorinated paraffins (CP)
Mirex
Other chlorinated organic compounds
Brominated Polybrominated biphenyls (PBB)
organic Polybrominated diphenylethers (PBDE)
compounds Other brominated organic compounds
Organic tin compounds
(tributyl tin compounds, triphenyl tin compounds)
Asbestos
Azo compounds
Formaldehyde
Polyvinyl chloride (PVC) and PVC blends
Reductions in Usage of PVCAlthough excellent flame-resistance and insulation properties have made PVC
a widely used plastic, it poses environmental risks because improper disposal
may result in release of hazardous materials. Similar risks surround the use of
various other chemical substances, such as plasticizers (some of which have a
detrimental effect on natural ecosystems) and heavy metals used as
stabilizers. Sony is working toward the abolition of the use of PVC in all its
products by the end of 2005, pending the availability of a technically and
economically comparable replacement material. From the year ended March 2003, the powercable for the AC adapter supplied with thismobile phone was made using a cadmium andlead-free non-PVC material.
business processes and its management. Suppliers are
required to meet all the SS-00259 technical standards for
environmental management of chemical substances. A
similar approval process is also applied with OEM
products*1.
After approval, suppliers are subject to periodic audits.
Suppliers must also certify on the basis of measurement
data that controlled environmental substances have not
been used in the manufacture of supplied items.
Environmental Audits of Materials Suppliers
Worldwide
By the end of March 2003, Sony had completed environ-
mental audits of all its materials suppliers worldwide, nearly
4,200 companies, for the purposes of determining
environmental quality for Green Partner approval. From
April 2003, Sony began procuring all its materials, parts
and product assemblies from these approved suppliers.
Chemical Substances in Parts Managed Using
Database
Sony has created a database of environmental quality and
controlled environmental substances to facilitate more
effective searches of parts supplied by Green Partner firms
at the product design stage. This database provides a
common internal source for information about each part,
including measurement data and the results of data
audits conducted by Sony.
Sony Corporation CSR Report 200352
Environmentally Conscious Products and Services
To help customers make environmentally conscious purchases, Sony indicates explicitly and precisely the
environmentally conscious aspect of products with a special “eco info” mark, which is used in product
catalogs and on its website. Below are some of the environmentally conscious products released in the
year ended March 2003.
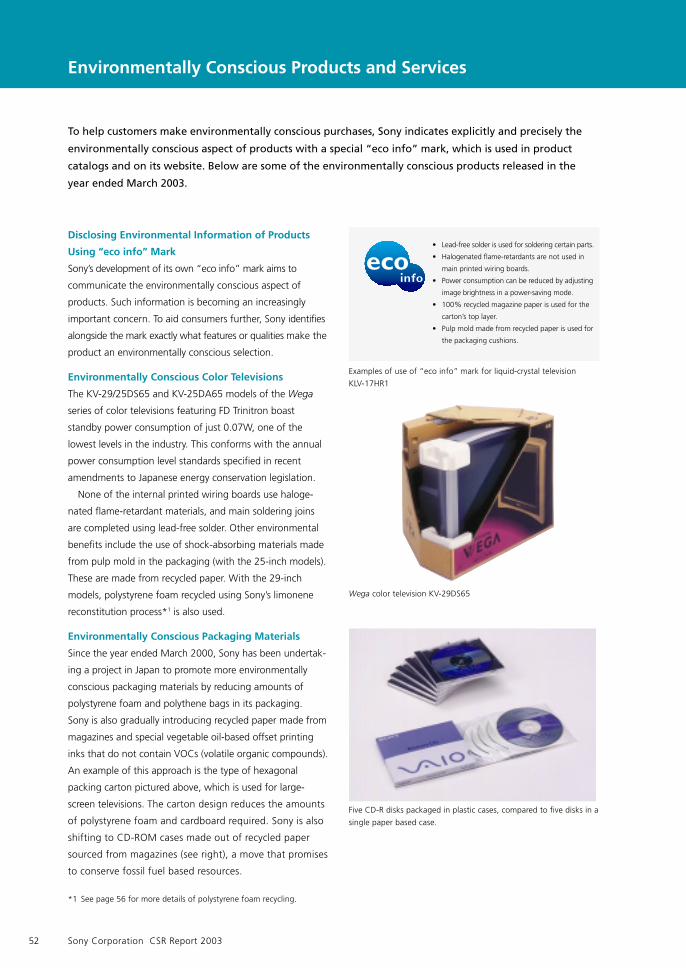
Disclosing Environmental Information of Products
Using “eco info” Mark
Sony’s development of its own “eco info” mark aims to
communicate the environmentally conscious aspect of
products. Such information is becoming an increasingly
important concern. To aid consumers further, Sony identifies
alongside the mark exactly what features or qualities make the
product an environmentally conscious selection.
Environmentally Conscious Color Televisions
The KV-29/25DS65 and KV-25DA65 models of the Wega
series of color televisions featuring FD Trinitron boast
standby power consumption of just 0.07W, one of the
lowest levels in the industry. This conforms with the annual
power consumption level standards specified in recent
amendments to Japanese energy conservation legislation.
None of the internal printed wiring boards use haloge-
nated flame-retardant materials, and main soldering joins
are completed using lead-free solder. Other environmental
benefits include the use of shock-absorbing materials made
from pulp mold in the packaging (with the 25-inch models).
These are made from recycled paper. With the 29-inch
models, polystyrene foam recycled using Sony’s limonene
reconstitution process*1 is also used.
Environmentally Conscious Packaging Materials
Since the year ended March 2000, Sony has been undertak-
ing a project in Japan to promote more environmentally
conscious packaging materials by reducing amounts of
polystyrene foam and polythene bags in its packaging.
Sony is also gradually introducing recycled paper made from
magazines and special vegetable oil-based offset printing
inks that do not contain VOCs (volatile organic compounds).
An example of this approach is the type of hexagonal
packing carton pictured above, which is used for large-
screen televisions. The carton design reduces the amounts
of polystyrene foam and cardboard required. Sony is also
shifting to CD-ROM cases made out of recycled paper
sourced from magazines (see right), a move that promises
to conserve fossil fuel based resources.
*1 See page 56 for more details of polystyrene foam recycling.
• Lead-free solder is used for soldering certain parts.
• Halogenated flame-retardants are not used in
main printed wiring boards.
• Power consumption can be reduced by adjusting
image brightness in a power-saving mode.
• 100% recycled magazine paper is used for the
carton’s top layer.
• Pulp mold made from recycled paper is used for
the packaging cushions.
Examples of use of “eco info” mark for liquid-crystal television
KLV-17HR1
Wega color television KV-29DS65
Five CD-R disks packaged in plastic cases, compared to five disks in a
single paper based case.

Sony Corporation CSR Report 2003 53
The Network Walkman: Smaller and Less
Power Consumption
In February 2002, Sony launched the NW-MS70D network
Walkman, which has an internal memory capacity equivalent
to approximately 11 CDs of music*1. This Walkman model is
compatible with DUO Memory Stick miniature IC recording
media. It is not just its dimensions (36.4 x 48.5 x 18 mm) that
are small: this new Walkman uses an LSI-chip called the Virtual
Mobile Engine™ based on newly developed semiconductor
technology that minimizes power consumption. The product
consumes significantly less power, and has a maximum
continuous playback time of 33 hours*2.
Environmentally Conscious Digital Still Camera
The casings of nearly all of Sony’s digital still camera models
are now free of halogenated flame-retardant materials. The
surfaces of the cardboard in the packaging cartons use
100% recycled paper sourced from magazine papers, and
are printed using vegetable oil-based inks containing no
VOC. Rechargeable long-life AA batteries are included with
the Cybershot DSC-P72, enabling users to enjoy capturing
their favorite moments again and again.
Repeated-Use Products
Sony has been using a special “Re!” advertising campaign to
promote the use of rechargeable long-life nickel metal
hydride (Ni-MH) batteries in place of dry-cell batteries. These
Ni-MH batteries can be charged approximately 500 times*3,
and also last roughly twice as long as conventional alkaline
batteries. It takes approximately 130 minutes*4 to charge
two of these batteries (size AA). Overall, they provide an
alternative with extremely low environmental impact.
Another repeated-use technology is the FeliCa
contactless IC card. Designed with built-in high-security
features, FeliCa IC cards permit the rapid exchange of data,
and are highly reusable since data can be easily replaced or
updated. The surface of these cards is made from PET
which gives less environmental impact even if the cards are
incinerated. FeliCa technology has been adopted not only
for the “Suica” commuter pass / stored fare card of East
Japan Railway Company, but also in other fields such as the
prepaid electric money service “Edy,” employee, and
membership identification.
*1 Assuming 60 minutes of music per CD, recorded in ATRAC3 plus mode at 48 kbps.
*2 Playback time in ATRAC3 mode; playback time in ATRAC3 plus mode is approximately 28 hours.
*3 Based on charging and de-charging conditions specified in JIS C8708 1997 (4.4.1).
*4 Performance varies depending on actual usage conditions.
NW-MS70D Network Walkman
DSC-P72 digital still camera
The “Re!” advertising campaign
“Suica” and Sony ID cards both use FeliCa technology.

Sony Corporation CSR Report 200354
Major Environmentally Conscious Products
Product name Model code no. Lead-free Halogenated Packagingsolder flame retardant materials
Video projector VPL-HS10 ■ — ■
LCD television ALV-15F1 — — ■• Standby power consumption: 0.9W Power-saving mode available
Color LCD SDM-P232W ■ ■ ■
computer monitor • Eco-mode button equipped Eco-mode power consumption: 80% of normal operation
VHS videocassette recorder SLV-NX31 ■ ■ ■
Digital camcorder DCR-TRV22K ■ ■ ■
CD/DVD player DVP-NS730P ■ ■ ■• Standby power consumption: 0.1W
Component stereo CMT-J500 ■ ■ — hi-fi system • Standby power consumption: less than 1W
Net MD deck MDS-JE780 ■ ■ ■• Standby power consumption: less than 1W
Car audio system CDX-L410 ■ ■ ■(FM/AM/CD player)
MD Walkman MZ-E10 ■ ■ ■• Standby power consumption: less than 0.1W
CD Walkman D-EJ2000 ■ ■ ■• Standby power consumption: less than 0.1W
No PVC used in headphones and remote control cord (included)
TV/FM/AM radio ICF-R533V ■ ■ ■• Standby power consumption: 0.3W No PVC used in ear receiver cord (included)
Notebook PC PCG-R505W/PD ■ ■ ■
Personal entertainment PEG-T650C ■ ■ ■organizer
Mobile phone A1301S ■ ■ ■
AIBO ERS-311 ■ — ■
Lead-free solder■ Used in over 80% of soldering
Halogenated flame retardant■ Not used in over 80% of printed wiring boards
Packaging materials■ Environmentally conscious items used
(e.g. recycled paper shock-absorbing materials)

Sony Corporation CSR Report 2003 55
Vegetable-Based Plastic
Vegetable-based plastics are derived from vegetable starches. Sony has developed technology
for its use in packaging and product casing applications. Use of such vegetable-based plastics
can help to reduce CO2 emission volumes because the vegetable materials are more renewable
and contribute to the conservation of resources derived from fossil fuel.
Benefits of Vegetable-Based Plastics
Vegetable-based plastics are more environmentally
conscious than conventional plastics made from petro-
chemicals for a number of reasons, summarized below:
• Consumption of non-renewable oil-derived resources
is reduced.
• Plant starches can be cropped annually; also, since
these raw materials are a result of photosynthesis, their
production itself helps to absorb atmospheric CO2.
• The plastics can also be broken down at composting
facilities used in manure production.
• Expectations are high for a chemical recycle that may
prove able to recycle the plastic to lactic acid.
From Plants to Plastics
Vegetable-based plastics are made from plants, and
decompose as follows.
WM-FX202 Walkman stereo casings created using
vegetable-based plastics
1. “NEIGE” blank MD 5- and 10-pack (wrapping film)
2. ICR-P10 portable radio (blister packaging)
3. DVP-NS999ES DVD player (front panel)
4. ERF-210AW06 AIBO entertainment robot software (marker base)
5. WM-FX202 Walkman (casing)
Plants (Starch) Plastic
Decomposition via composting into water, CO2, etc.
Lactic acid Polylactic acid
Total CO2 Emissions Over Product Life Cycle
ConventionalPlastics
Manufacturing and transport
Approx. 20% reduction
CO2 absorption from photosynthesis
Incineration
IncinerationManufacturing and transportVegetable-Based Plastics
(Sony data)
1
2
3
4
5
The life cycle of vegetable-based plastics involves substantial
absorption of atmospheric CO2 due to photosynthesis. Even
if they were disposed of by incineration, these plastics would
still contribute to a net reduction in CO2 emissions relative to
oil-derived plastics.
Incorporation in Walkman Stereos and
Other Products
Launched in November 2002 in Japan, the WM-FX202
Walkman stereo uses vegetable-based plastic for
approximately 90% of its casing by weight. Sony
estimates that this plastic uses only 45% of the oil-
derived resources of conventional plastics, producing a
reduction in CO2 emissions of approximately 20%.
Currently Sony uses vegetable-based plastics for the
products illustrated below. Sony also plans to extend the use
of these plastics to more products.

Sony Corporation CSR Report 200356
Product Recycling
Sony is actively promoting collection and recycling of post-consumer products to ensure the most effective
usage of limited resources. In the year ended March 31, 2003, a global total of approximately 14,000 tons
of Sony products were recycled. Sony continues to develop recycling systems tailored to the requirements
of each area and country.
Recycling Activities in Japan
The Home Appliance Recycling Law that came into force
in Japan in April 2001 covers four major types of home
appliance: televisions, refrigerators, washing machines
and air conditioners. As part of a broader effort to create
a recycling-oriented society, this legislation defines the
separate recycling responsibilities of consumers, retailers,
local governments and appliance manufacturers. The only
products in this list that Sony manufactures are televisions
(defined as those containing a CRT, and including Aiwa-
branded sets). A total of approximately 460,000 Sony-
manufactured television sets were recycled in the year
ended March 31, 2003. (Please refer to pp. 58-59 for
more details on the recycling processes involved).
Under the provisions of separate Japanese legislation
aimed at promoting more effective use of resources, Sony
Corporation started to recycle all business-consnmer
computers from May 2002. In the year ended March 31,
2003, Sony collected approximately 1,200 such post-use
computers*1 and sent them for disassembly and materials
recycling. This process generated various metals and
plastics, as well as secondary batteries. Sony plans to
commence a recycling program for post-use home PCs in
October 2003 in Japan.
Television Recycling Technology
Sony has been developing recycling technology for its
large televisions since the year ended March 1992. In
October 1997, Sony established the Recycling Research
Center to further this work. Some plants that recycle
Sony-manufactured television sets employ special
machines developed by Sony as part of this recycling R&D
program to handle tasks such as CRT disassembly and
plastics sorting. Other work in this program includes
market research on actual recycling conditions to provide
feedback to television designers and engineers so that
new products can be made more easily recyclable.
Recycling of Polystyrene Foam
Sony has developed a recycling system for polystyrene
foam. Known as the “Orange R-net System,” it is based on
limonene, a substance derived from orange peel. Since
January 1999, this system has been applied to the recycling
of waste polystyrene foam generated by the Group
companies. In the year ended March 31, 2003, approxi-
mately 130 tons of this foam was collected and recycled
into new polystyrene foam for use as a packing material
with nearly 290,000 large televisions. Sony has begun
licensing out this technology and providing technical
support to promote the wider use of this recycling system
outside the company.
Sets received at collection centers: 458,125 units
Sets entering recycling process: 457,535 units
Total weight of products processed: 12,008 tons
Total weight of recycled products/materials: 9,728 tons
Recycling ratio: 81%
Television Recycling in Japan (Fiscal 2002)*2
Limonene cars can liquefy
polystyrene foam during
transportation.
*1 Products collected include desktop and notebook PCs, CRT monitors and LCD monitors.
*2 Difference between numbers of sets received and processed represents work-in-process at the time of reporting.

Sony Corporation CSR Report 2003 57
Recycling Activities in Europe
A formal EU directive covers recycling of post-use
electrical and electronic products throughout Europe. The
WEEE (Waste Electrical and Electronic Equipment)
Directive obliges manufacturers of such products to
collect and recycle them from August 2005.
Some countries in Europe have already passed separate
laws requiring the recycling of post-use home appliances.
Such laws are now in force in five countries: Belgium,
Sweden, the Netherlands, Norway and Switzerland. In line
with the systems in each of these countries, Sony has
contracted with third-party recyclers to ensure that its
products are recycled in accordance with these laws. In
2001, Sony paid approximately 6.3 million euros for
recycling services in Europe.
In conjunction with three other leading manufactur-
ers—Braun (Germany), Electrolux (Sweden), HP (USA) and
Sony are teaming up to establish a common waste
management procurement platform, called the pan-
European Recycling Platform (ERP). This initiative is
designed to ensure that Sony has an innovative pan-
European recycling strategy in the European market. In
March 2003, this consortium of four companies agreed to
the “Principles for the Implementation of the EU WEEE
Directive” outlined below, to ensure that national
legislation remains consistent with the WEEE Directive and
to secure economies of scale and operational efficiency.
The ERP initiative aims to construct the most efficient
recycling system for consumers, for the environment, and
for industry. The ERP plans to establish an operational
taskforce to handle issues relating to procurement, take-
back and recycling schemes.
Main Pillars of “Principles for the
Implementation of the EU WEEE Directive”
• To implement the principle of individual producers’
responsibility established by the WEEE Directive.
• To establish National Registers that record companies
placing products on the EU market and their levels of
responsibility.
• To develop guidelines on financing for future waste.
• The creation of a common logistics interface to ensure
that competitive take-back schemes can operate.
*1 Includes the District of Columbia and the U.S. states of Delaware, Maryland, Pennsylvania, Virginia and West Virginia.
Plug-In to eCycling program
http://www.epa.gov/epaoswer/osw/conserve/plugin/
eCycling program
http://www.epa.gov/reg3wcmd/eCycling.htm
Sony programs in Minnesota
http://www.moea.state.mn.us/plugin/sonyevents.cfm
Recycling Activities in the United States
Sony Electronics Inc. operates a program in the United
States, which it refers to as “Shared Responsibility.”
Under this program, which aims to promote recycling by
reducing the burden placed on consumers and local
governments, Sony pays for the recycling of all own-
branded products that are brought to designated
collection points or to special collection events. In 2002,
Sony supported over 100 collection events in 16 states,
including California, Connecticut and Pennsylvania, which
resulted in collection and recycling of a total of approxi-
mately 85 tons of Sony products.
As part of the “Shared Responsibility” program, Sony
has also solely continued to support a recycling initiative
in Minnesota following the completion of a demonstra-
tion project for electronics recycling in the state. Such
support has helped to maintain a network of permanent
collection points since 1998.
Sony has also played a pioneering role in the “eCycling”
program undertaken by the U.S. Environmental Protection
Agency (EPA) in the Mid-Atlantic region*1 (designated as
Region 3 by the EPA). As an active partner in the “Plug-In
to eCycling” program, a new initiative by the EPA to apply
the “eCycling” program nationwide. Sony is cooperating
with local governments, retailers, recyclers and consumers
to raise awareness of this program.
Other Sony recycling initiatives in the United States
include efforts to expand secondary markets for recycled
materials by developing
televisions and packing
materials for VAIO
computers that use
100% recycled plastics.
Products gathered at a post-use
product collection event

Sony Corporation CSR Report 200358
Television Recycling ProcessPhotos from Green Cycle Corporation and Ichinomiya Recycling Research Center (Japan)
Transport to plant
Directed to recycling line CRTs
Speakers, printed wiring boards, etc.
Plastics separated by identification
Separation of anti-explosion band
To smelter
Recycling Rate of 81% Achieved With Televisions
The minimum recycling rate of 55% required by Japan’s
Home Appliance Recycling Law. For each television set
recycled, the average yield of usable materials amounts to
21.3 kg of assorted glass, plastic and metals.
Plastics Recycling Achieved by Machine Processing
Sony has developed a specialized machine designed to
locate black plastics, formerly difficult to distinguish from
other plastic materials, and identify quickly the type of
flame retardant they contain.
Inside a Television
Cabinets
Manual disassembly
Anti-explosionband
Electron gun
Panel
Cathode-ray tube (CRT)
Printed wiring board
Cabinet
Deflection yoke
Reusable Materials Collected From Televisions
Iron 833
Copper 469
Aluminum 9
Mixed/non-ferrous compounds 73
CRT glass 7,306
Other materials of value 1,034
Total weight of materials of value*1 9,724
(Unit: tons)
*1 Differences in the total weight of materials of value and the total
weight of recycled products listed on p.56 stem from a rounding
of figures.
Product Recycling

Sony Corporation CSR Report 2003 59
Pulverization
Tapes separated out
Recycled as metal items
Recycled as plastic items
CRT separater to sort glass
that contains lead
Cleaning of
funnel glass
Cullet* from
funnel glass
Fluorescent layer
removed from inner
panel surface
Cullet* from panel glass
Recycled as CRTs
* Cullet is a raw material for making glass.
Green Cycle Corporation website (Available in Japanese) http://www.greenc.co.jp/
Home Appliance Recycling Plants Across JapanHome Appliance Recycling Plants at 15
Locations Across Japan
Sony operates a network of 15 recycling plants across
Japan that convert collected post-use TVs into valuable
materials. Green Cycle Corporation, in which Sony is the
principal shareholder, recycles four varieties of home
appliance (TVs, refrigerators, washing machines and air
conditioners), principally in the areas of central and north-
central Japan. The flow chart illustrates how different
types of discarded appliances yield varying types of
recycled materials. Green Cycle Corporation undertakes
plant tours on request.
Green Cycle Corporation
Panel glass(no lead)
Funnel glass(containing lead)
Return to
funnel glass
Return to
panel glass

Sony Corporation CSR Report 200360
Global Warming Prevention Measures at Sites
Sony treats global warming as an important environmental issue. Through energy-saving programs and
the adoption of renewable sources of energy, Sony continues to make efforts to reduce emissions of
greenhouse gases in its business activities. This report focuses on the measures being taken at Sony
manufacturing sites and offices to reduce greenhouse gas emissions.
Green Management 2005 Targets for Greenhouse Gas Emission From Business Sites
Target Base Fiscal Year Target Fiscal Year Progress in Fiscal 2002
Reduce CO2 emissions from business sites 2000 2005 Emissions came to approximately 1,976,000 tons,by 15% or more per sales unit*1. about 40,000 tons more than fiscal 2001. Emissions per sales
unit were roughly equal to those in the previous year.
Aim to increase the ratio of renewable resources to 2000 2005 Incorporated 64 TJ of renewable energy, accountingat least 5% of energy used at all sites*2. for 0.15% of the total energy consumed at all Sony sites,
owing to the combined use of the Green Power CertificationSystem and local renewable energy sources.
Reduce fuel consumption on CO2 emission basis by 2000 2005 Emissions from vehicles owned by Sony sites in15% or more per sales unit. Japan came to approximately 34,000 tons, a
reduction of nearly 1,000 tons, or approximately16% per sales unit, compared to fiscal 2001.
Reduce CO2 emissions by at least 15% per sales unit 2001 2005 Emissions from products delivery came tofrom in-house and subcontracted logistics operations. 1,536,000 tons. Emissions from distribution in Japan
fell approximately 5,000 tons, or nearly 16% per sales unit.
Reduce greenhouse gas emissions from 2000 2005 —business sites by 30% (CO2 equivalent)*3
■ : HFC ■ : PFC ■ : SF6 ■ : NF2 ■ : Others
In terms of CO2 equivalents, total energy consumption at Sony sites worldwide in the year ended March 31, 2003, was
approximately 1.98 million tons, an increase of 4.1% over the previous year. Energy consumption per unit of sales was flat
relative to the year ended March 31, 2001 (a reduction of approximately 0.2% was achieved). The increase in energy
consumption in the year ended March 31, 2003 was primarily attributable to an increase in the number of sites from which
data was compiled. Of these new sites, American Video Glass Company (U.S.), which manufactures CRTs, and Sony
Semiconductor Kyushu Co., Kumamoto Technology Center, are particularly large consumers of energy, producing
combined CO2 emissions of approximately 160,000 tons.
Sony has established quantitative reduction targets of 30% by the end of March 2006 for emissions of greenhouse gases
other than CO2 emission related to energy consumption. Sony is also making progress in introducing the use of renewable
energy sources through initiatives such as the Green Power Certification System.
NEW
*1 The target will be changed from fiscal 2003 to reduce energy consumption (CO2 equivalent) by 15% more per sales unit.
*2 Due to anticipated time required until necessary supply infrastructure will be established, the target fiscal year initially slated will be pushed
forward to fiscal 2010.
*3 A new objective effective from fiscal 2003.
*4 Excludes CO2 emissions from energy consumption.
00 01 02 (Fiscal)
300
400
305
266
204
200
100
(%)
45
60
39 41 40 3842
30
15
98 99 00 01 02 05 (Fiscal)
25
50
75
100
(Target)
Energy Consumptionat Business Sites (1,000 TJ )
Greenhouse Gas Emissions*4
From Business Sites (1,000t-CO2)
■ : Japan ■ : U.S. ■ : Europe ■ : Asia ■ : China
: Energy consumption per sales unit (fiscal 2000 = 100)
(%)

Sony Corporation CSR Report 2003 61
High-Efficiency Heating and Cooling SystemEnergy-Efficient Air-Conditioning Systems
Besides their use in Sony offices, air-conditioning systems
play a key role in quality control at manufacturing sites.
Sony is working to ensure that such systems are as efficient
as possible to minimize the energy consumed. In conjunc-
tion with Takasago Thermal Engineering Co., Ltd., Sony has
developed a system that promotes energy saving by
maximizing the thermal efficiency of heating and
cooling processes.
Such a system is now in operation at Sony Semiconductor
Kyushu Co., Kumamoto Technology Center (or Kumamoto
Tec). It has four key elements: an integrated system of
cooling towers; highly efficient refrigeration units; heat
exchangers that extract energy from water used for
cooling; and high-efficiency boilers.
The integrated cooling tower system automatically
regulates the volume and temperature of water within the
cooling system to keep these variables at optimally efficient
levels. The natural cooling effect of low external tempera-
tures is harnessed in winter to reduce the need for extra
cooling, thereby tapping into renewable energy sources. By
responding to such seasonal changes, high-efficiency
refrigeration units automatically maintain precise control
while also saving energy. High-efficiency steam boilers
powered by natural gas are used to supply heat to the
system. Integrated control of each part of the air-
conditioning system ensures that optimal efficiency is
maintained at all times. Kumamoto Tec has already
achieved energy savings of over 30% with this system,
compared with the system previously used (see diagram).
Integrated cooling towers
Use of atmospheric cooling
Daytime: OffNighttime: On
High-efficiency refrigeration units
Ice-condensation heating system
Heat exchanger
Steam boilers
Business site
Ice
Saving
Measure (%, relative to old system)
Use of atmospheric cooling
From production cooling water -6%
From cooling (refrigeration units) -5%
High-efficiency refrigeration units -17%
Ice-condensation heating system -1%
Steam boilers -1%
Total -30%
Energy-Saving Measures and Proportional Savings
Achieved with High-Efficiency Heating and Cooling System
In terms of CO2 equivalents, annual energy savings have
so far amounted to about 1,290 ton-CO2. Sony has sought
the help of external bodies such as academic institutions in
making an objective determination of the efficiency and
energy-saving capabilities of this system. Plans call for its
development for use at various other Sony sites.
Phase-Out of Use of Fuel Oil
(Sony Corporation Sendai Technology Center)
Sony Corporation Sendai Technology Center (Sendai Tec)
has been implementing a switch to fuels such as natural
gas that generate fewer CO2 emissions. In the year ended
March 2003, the company completely phased out its use
of fuel oil. As part of this move, the company has installed
high-efficiency energy supply systems powered by natural
gas, as well as equipment for neutralizing volatile organic
compounds. The latter equipment is capable of neutraliz-
ing up to 99.5% of organic solvents used to manufacture
magnetic tape, and contributes to an energy saving of
over 50% for this process. Sendai Tec posted CO2
emissions of approximately 49,000 tons for the year
ended March 2003. This figure represented an overall
reduction of about 30% in emissions compared with the
year ended March 1999, when the company first began
switching over to natural gas.

Sony Corporation CSR Report 200362
150
200
100
50
98 99 00 01 02 05 (Fiscal)
138
189173
150
11198
Greenhouse Gas Reduction Programs in Semicon-
ductor Manufacturing
Sony manufacturing sites use greenhouse gases such as
perfluorocarbons (PFCs) in cleaning, etching and other
processes involved in the production of semiconductors
and liquid-crystal products. Excluding CO2 emissions
associated with energy consumption, total greenhouse
gas emissions in fiscal 2002 totaled approximately
200,000 tons, of which 80% derived from semiconductor
manufacturing processes.
In fiscal 2000, Sony initiated various full-scale green-
house gas reduction programs, including the develop-
ment of optimized processes for cleaning semiconductor
equipment and the introduction of abatement tools to
reduce PFC emissions. Even though the total volume of
PFCs purchased in fiscal 2002 was more than 60%
greater than three years earlier as a result of increased
production and differences in production processes,
emissions were successfully reduced to levels below those
recorded in fiscal 1998.
In line with the goal agreed at the World Semiconductor
Council (WSC) of reducing greenhouse gas emissions to
below 90% of fiscal 1995 levels by fiscal 2010, Sony
plans to institute additional measures, starting in fiscal
2003. These include the replacement of heavily used C2F6
with alternatives such as COF2, which has a much less
potent greenhouse effect.
Promotion of Use of Renewable Energy
One method of promoting reductions in CO2 emissions
that the Sony Group has adopted is the greater use of
renewable energy sources. Examples of this approach
include the introduction of solar power generation
systems and the Green Power Certification System, which
promotes the greater use of environmentally conscious
power sources. Sony has also begun purchasing electric
power derived from renewable sources by means of
similar third-party verification schemes in Germany and
the Netherlands.
The Green Power Certification System promotes the
use of wind-generated electricity in Japan by large-scale
consumers, irrespective of the relative locations of power
producer and consumer, by providing purchasers with
certification of power generation from renewable energy
sources. Using this system, Hall Network Inc., an affiliate
of Sony Music Entertainment (Japan) Inc., has successfully
sourced all the electric power used for its “Zepp” venues
located in major cities in Japan from renewable sources.
Thus all the concerts and other events held at “Zepp”
venues are controlled by “Green Power.”
As of the end of fiscal 2002, the total effect of the use
of renewable energy sources around the Sony Group was
equivalent to an annual reduction in CO2 emissions of
approximately 6,900 tons.
■ : CF4
■ : C2F6
■ : C3F8
■ : C4F8
Total Greenhouse Gas Emissions FromSemiconductor Production
(CO2 equivalents, indexed at fiscal 1995 = 100)
For more information about the Green Power Certification System, please visit the website of Japan Natural Energy Co., Ltd.
http://www.natural-e.co.jp/index-e.html
■ : CHF3
■ : SF6
■ : NF3
(Target)
Annual reductionSites/companies involved Year program in CO2 emissions
initiated (ton-CO2)
<Green Power Certification>
Sony Corp. September 2001 1,000
Sony Tower September 2001 800
Sendai Technology Center, Sony Corp. January 2003 370
Hall Network Inc. (Zepp) January 2003 900
SME TV Inc. (Viewsic) April 2003 300
Sony International (Europe) GmbH
Stuttgart Technology Center January 2003 2,000
Sony Logistics Europe B.V. January 2003 1,500
<Solar power generation>
Sony Chemicals Corporation, Kanuma Site February 2000 30
Total: 6,900

Sony Corporation CSR Report 2003 63
100
75
50
25
30 2729 28
26 26
40
20
10
98 99 00 01 02 05 (Fiscal)
300
400
200
256
294 281
258224
100
98 99 00 01 02 05 (Fiscal)
100
75
50
25
Resource Conservation at Sites
Sony sites are actively pursuing ways of making the most effective use of resources while also reducing the
generation of waste. The goal is to promote these types of resource recycling to achieve “zero landfill
waste,” thus minimizing the amounts of waste sent to landfills for disposal.
Total Waste Generatedat Business Sites (Unit: 1,000 tons)
(Target)
Total Water Used atBusiness Sites (Unit: million m3)
(Target)
Total waste generated by Sony sites worldwide amounted to approximately 224,000 tons in the year ended March, 2003.
This figure represented a reduction in waste generated by 22% per sales unit relative to the year ended March, 2001.
Waste reduction achieved at semiconductor plants and consolidation of plants in Asia were the main contributors to the
relative reduction in total waste generated. Total waste sent to landfills for final disposal amounted to approximately 37,000
tons in the year ended March, 2003, producing a recycling ratio of 83.4%. As of mid-2003, a total of 39 Sony manufactur-
ing sites had achieved recycling ratios in excess of 95%.
Total water consumption in the year ended March, 2003, amounted to approximately 26.4 million m3. This represented a
reduction of 2.3 million m3 relative to the year ended March, 2001. Although the most recent year’s data represented a
larger population of Sony sites, the increases in water consumption due to this broader scope were more than outweighed
by reductions in water consumption achieved at semiconductor and CRT manufacturing sites.
Green Management 2005 Targets for Resource Conservation at Business Sites
Target Base Fiscal Year Target Fiscal Year Progress in Fiscal 2002
Reduce total waste generated at sites 2000 2005 Total waste came to 224,000 tons, about 58,000 tonsby 30% per sales unit. less than fiscal 2001, representing an approximate
decline of 22% per sales unit.
Waste reuse/recycle rate of 95% or higher. 2000 2005 The collective waste reuse/recycle rate for all Sony sites was83%. 39 out of 87 manufacturing sites achieved wastereuse/recycle rates of 95% or higher.
Reduce the volume of water purchased or drawn 2000 2005 Fiscal 2002 water use was about 26.4 million m3,from groundwater by 20% per sales unit. a reduction of roughly 2.3 million m3. This represents
a decline of approximately 10% per sales unit.
(%) (%)
■ : Volume of waste disposed ■ : Volume recycled
: Waste generated per sales unit (fiscal 2000 = 100)
■ : Japan ■ : Americas ■ : Europe ■ : Asia ■ : China
: Water consumption per sales unit (Fiscal 2000 = 100)

Sony Corporation CSR Report 200364
Waste Reductions in CRT Production
Through the development of recycling technology and use
of alternatives, American Video Glass Company, a U.S.-
based Sony affiliate, has achieved significant reductions in
the amounts of lead used and produced as waste in the
production of glass for cathode-ray tubes (CRTs). During
1999 to 2000, the company achieved a total reduction in
lead used in glass production of approximately 1,800 tons,
despite a concurrent increase in CRT production volumes
of 20%. The amount of waste containing lead was also
reduced by over 95%. These efforts generated a total of
over $500,000 in cost savings from reduced purchases of
materials and lower waste processing costs. The success of
this resource conservation program was recognized in
October 2002 with an award from the U.S. Environmental
Protection Agency.
Recycling of Waste Plastics
Sony Tochigi Corporation has developed technology for
recycling waste polycarbonate resin generated during
the production of disk substrates. In a pelletized form,
this resin can be reused as a material for the outer
casings of MDs. Through careful control of the
plasticity of the material (which determines the degree
of shock resistance) and improvements in the molds
used, the company was able to boost the proportion of
resin in the collected waste as high as 90%, compared
with a previous normal value of 20%. In the year
ended March 2003, approximately 95% of the
polycarbonate resin produced as waste in production
processes was recycled.
Waste polycarbonate resin produced
from manufacturing processes
Polycarbonate resin for use in
recycled shell casings
An MD made using the recycled resin
Groundwater Cultivation
(Sony Semiconductor Kyushu Corporation)
Since the spring of 2003, Sony Semiconductor Kyushu Corporation, Kumamoto
Technology Center has been working in cooperation with local residents,
agricultural cooperatives and an environmental NGO to replenish the area’s
water table via local rice paddy fields. The Center uses approximately 700,000
tons of water each year at the facility for drinking and industrial applications. To
provide the equivalent amount of water, the Center supported a project to draw
water from a nearby river and return it to rice paddies. Since the soil under the
paddies is highly porous, water diverted from the river is able to quickly return
underground. Under this plan, water is currently drawn from the river twice
yearly, once during the month prior to rice planting in the summer and once
during the month following harvest in the fall. The center also plans to purchase
the rice grown locally to supply the site’s restaurant.
Water diverted from nearby river
Forest
Paddy
Wastewater
Sony
Groundwater collected
Groundwater
1,500
2,000
1,000
1,204
932
753
574672
500
75
100
50
25
97 98 99 00 01
Lead Recycling (1,000 lbs.)
■ : Waste containing recycled lead
■ : Waste containing lead for final disposal
: Lead recycling rate
(%)
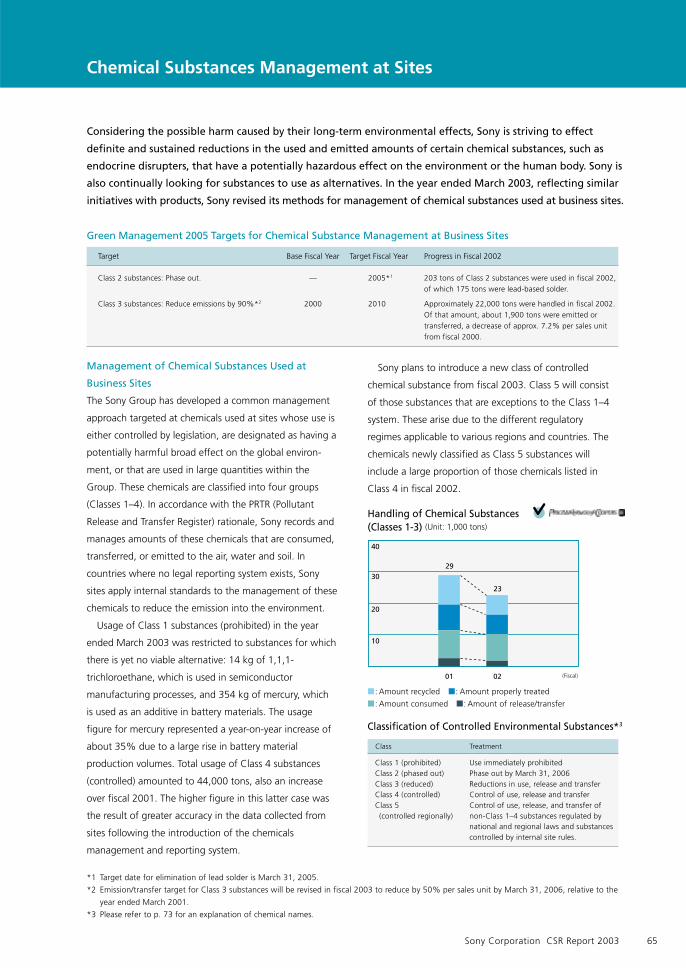
Sony Corporation CSR Report 2003 65
Chemical Substances Management at Sites
Considering the possible harm caused by their long-term environmental effects, Sony is striving to effect
definite and sustained reductions in the used and emitted amounts of certain chemical substances, such as
endocrine disrupters, that have a potentially hazardous effect on the environment or the human body. Sony is
also continually looking for substances to use as alternatives. In the year ended March 2003, reflecting similar
initiatives with products, Sony revised its methods for management of chemical substances used at business sites.
Green Management 2005 Targets for Chemical Substance Management at Business Sites
Target Base Fiscal Year Target Fiscal Year Progress in Fiscal 2002
Class 2 substances: Phase out. — 2005*1 203 tons of Class 2 substances were used in fiscal 2002,of which 175 tons were lead-based solder.
Class 3 substances: Reduce emissions by 90%*2 2000 2010 Approximately 22,000 tons were handled in fiscal 2002.Of that amount, about 1,900 tons were emitted ortransferred, a decrease of approx. 7.2% per sales unitfrom fiscal 2000.
Management of Chemical Substances Used at
Business Sites
The Sony Group has developed a common management
approach targeted at chemicals used at sites whose use is
either controlled by legislation, are designated as having a
potentially harmful broad effect on the global environ-
ment, or that are used in large quantities within the
Group. These chemicals are classified into four groups
(Classes 1–4). In accordance with the PRTR (Pollutant
Release and Transfer Register) rationale, Sony records and
manages amounts of these chemicals that are consumed,
transferred, or emitted to the air, water and soil. In
countries where no legal reporting system exists, Sony
sites apply internal standards to the management of these
chemicals to reduce the emission into the environment.
Usage of Class 1 substances (prohibited) in the year
ended March 2003 was restricted to substances for which
there is yet no viable alternative: 14 kg of 1,1,1-
trichloroethane, which is used in semiconductor
manufacturing processes, and 354 kg of mercury, which
is used as an additive in battery materials. The usage
figure for mercury represented a year-on-year increase of
about 35% due to a large rise in battery material
production volumes. Total usage of Class 4 substances
(controlled) amounted to 44,000 tons, also an increase
over fiscal 2001. The higher figure in this latter case was
the result of greater accuracy in the data collected from
sites following the introduction of the chemicals
management and reporting system.
Sony plans to introduce a new class of controlled
chemical substance from fiscal 2003. Class 5 will consist
of those substances that are exceptions to the Class 1–4
system. These arise due to the different regulatory
regimes applicable to various regions and countries. The
chemicals newly classified as Class 5 substances will
include a large proportion of those chemicals listed in
Class 4 in fiscal 2002.
*1 Target date for elimination of lead solder is March 31, 2005.
*2 Emission/transfer target for Class 3 substances will be revised in fiscal 2003 to reduce by 50% per sales unit by March 31, 2006, relative to the
year ended March 2001.
*3 Please refer to p. 73 for an explanation of chemical names.
30
40
23
29
20
10
01 02 (Fiscal)
■ : Amount recycled ■ : Amount properly treated
■ : Amount consumed ■ : Amount of release/transfer
Handling of Chemical Substances(Classes 1-3) (Unit: 1,000 tons)
Classification of Controlled Environmental Substances*3
Class Treatment
Class 1 (prohibited) Use immediately prohibitedClass 2 (phased out) Phase out by March 31, 2006Class 3 (reduced) Reductions in use, release and transferClass 4 (controlled) Control of use, release and transferClass 5 Control of use, release, and transfer of(controlled regionally) non-Class 1–4 substances regulated by
national and regional laws and substancescontrolled by internal site rules.

Sony Corporation CSR Report 200366
Critical areas for improvement:1. Storage tanks and piping must not be situated underground; existing
infrastructure must be upgraded to secondary containment of tanksand piping.
2. Special measures must be taken to prevent leaks in loading and unloadingareas, particularly where chemicals are stored under vacuum.
3. Blockage valves must be installed to isolate rainwater and wastewater, withprocedures established for operation.
4. Emergency response measures must be established, includingcommunication procedures in the event of an emergency.
Measures to Reduce Use and Release of Chemical
Substances
One key component
of a cathode-ray
tube known as the
stem is responsible
for maintaining the
vacuum inside the
tube and for
supplying current to the electron gun. By re-designing the
stem and by developing an alternative method to prevent
oxidation of the leads, Sony Fukushima Corporation has
found a way of completely eliminating the stem-etching
process, once vital to maintaining the integrity between the
electron gun and the stem, from CRT production. Previously,
this step was indispensable in ensuring the strength of the
welds used. This development has helped to reduce annual
usage of etching acids, including hydrofluoric acid (0.6 tons),
nitric acid (7.8 tons), hydrochloric acid (13 tons) and acetic
acid (19 tons).
Manufacturing processes used at ST Liquid Crystal Display
Corporation*1 to produce LCDs generate two types of liquid
waste: a concentrated waste liquid and a dilute effluent. The
company subcontracts treatment of the former to an
external industrial waste recycler and processes the latter
internally. After analysis of the composition of these wastes,
the company made changes to the wastewater piping
system to alter the balance between the two. This helped to
reduce by nearly 10% the amount of concentrated liquid
sent for processing.
Elimination of Fluorine Contamination Due to Leaks
A voluntary inspection conducted at Sony EMCS Corpora-
tion, Inazawa Technology Center (Inazawa TEC) in June 2001
revealed groundwater contamination due to suspected
fluorine leaks. Besides taking measures to prevent reoccur-
rence of the problem, such as the installation of dual-wall
drainage pipes equipped with sensors to detect leaks,
Inazawa TEC has implemented a comprehensive groundwater
decontamination program. As of the end of March 2003,
the concentration of most fluorine-containing pollutants had
been cut by more than 50%. At the most polluted test site,
where a reading of 58 mg/l had been initially recorded, the
concentration had been reduced to 5.3 mg/l, proving that
the decontamination process is effective. Inazawa TEC has
also reviewed its use of fluorine-containing acids. By switching
to the use of caustic soda, an alkaline alternative, in the panel-
cleaning process that was the suspected source of the
problem, use of such acids has been reduced by 65%. The
*1 A joint venture between Sony Corp. and Toyota Industries Corp.
Storage tank with dual-wall
fittings to prevent leaks
Shanghai Suoguang Visual
Products Co., Ltd. (China)
Wastewater pit installed in trailer yard
to prevent leaks from fuel oil tanks
Sony Display Device (Singapore)
Aboveground tankBuried tank
Tank allowing for six-dimension visual inspection
Electron gun stem
StemWeldingconnection
Electron gun
Illustration from “Regulations for Onsite Environmental Risk Management”
decontamination project is ongoing. Sony EMCS expects the
site to be compliant with environmental standards by the year
ending March 2006.
Environmental Risk Management at Sony Sites
Sony has revised its existing rules for environmental risks and
established “Regulations for Onsite Environmental Risk
Management.” The new rules lay down a common approach
for all Sony sites worldwide to aid in preventing environment-
related incidents. Areas where procedures were updated
include the management of chemical substances and
emergency response measures. The new rules were designed
using non-technical language and clear, explanatory diagrams
to avoid differences or errors in interpretation. On-site
environmental risk management at Sony emphasizes a number
of critical areas, listed below. Sony plans to ensure compliance
with these rules using site environmental risk audits.
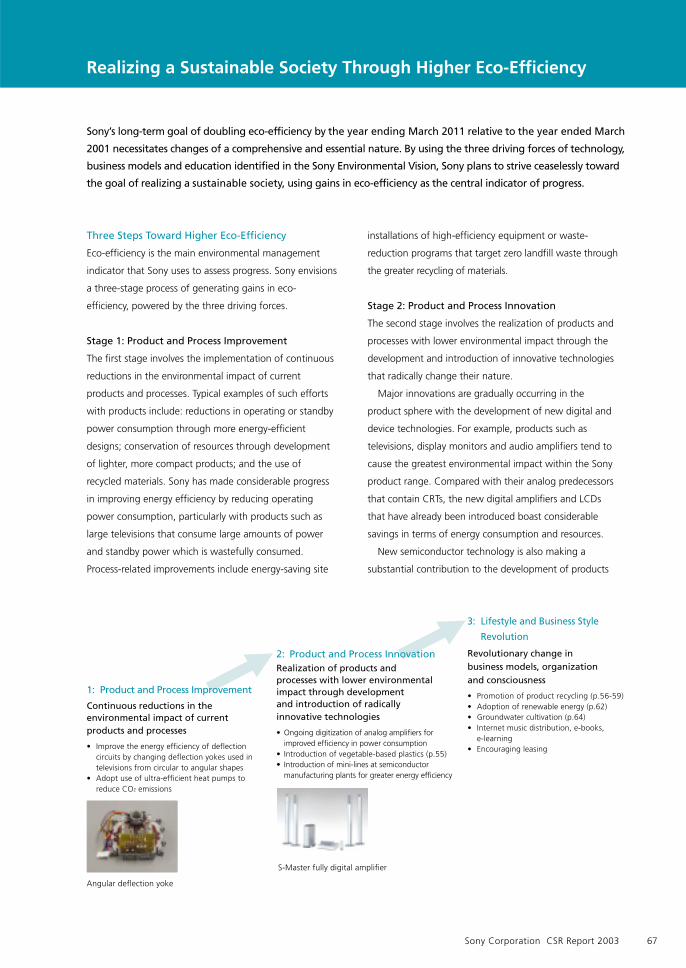
Sony Corporation CSR Report 2003 67
Realizing a Sustainable Society Through Higher Eco-Efficiency
Sony’s long-term goal of doubling eco-efficiency by the year ending March 2011 relative to the year ended March
2001 necessitates changes of a comprehensive and essential nature. By using the three driving forces of technology,
business models and education identified in the Sony Environmental Vision, Sony plans to strive ceaselessly toward
the goal of realizing a sustainable society, using gains in eco-efficiency as the central indicator of progress.
Three Steps Toward Higher Eco-Efficiency
Eco-efficiency is the main environmental management
indicator that Sony uses to assess progress. Sony envisions
a three-stage process of generating gains in eco-
efficiency, powered by the three driving forces.
Stage 1: Product and Process Improvement
The first stage involves the implementation of continuous
reductions in the environmental impact of current
products and processes. Typical examples of such efforts
with products include: reductions in operating or standby
power consumption through more energy-efficient
designs; conservation of resources through development
of lighter, more compact products; and the use of
recycled materials. Sony has made considerable progress
in improving energy efficiency by reducing operating
power consumption, particularly with products such as
large televisions that consume large amounts of power
and standby power which is wastefully consumed.
Process-related improvements include energy-saving site
installations of high-efficiency equipment or waste-
reduction programs that target zero landfill waste through
the greater recycling of materials.
Stage 2: Product and Process Innovation
The second stage involves the realization of products and
processes with lower environmental impact through the
development and introduction of innovative technologies
that radically change their nature.
Major innovations are gradually occurring in the
product sphere with the development of new digital and
device technologies. For example, products such as
televisions, display monitors and audio amplifiers tend to
cause the greatest environmental impact within the Sony
product range. Compared with their analog predecessors
that contain CRTs, the new digital amplifiers and LCDs
that have already been introduced boast considerable
savings in terms of energy consumption and resources.
New semiconductor technology is also making a
substantial contribution to the development of products
1: Product and Process Improvement
Continuous reductions in theenvironmental impact of currentproducts and processes
• Improve the energy efficiency of deflectioncircuits by changing deflection yokes used intelevisions from circular to angular shapes
• Adopt use of ultra-efficient heat pumps toreduce CO2 emissions
Angular deflection yoke
S-Master fully digital amplifier
3: Lifestyle and Business Style
Revolution
Revolutionary change inbusiness models, organizationand consciousness
• Promotion of product recycling (p.56-59)• Adoption of renewable energy (p.62)• Groundwater cultivation (p.64)• Internet music distribution, e-books,
e-learning• Encouraging leasing
2: Product and Process InnovationRealization of products andprocesses with lower environmentalimpact through developmentand introduction of radicallyinnovative technologies
• Ongoing digitization of analog amplifiers forimproved efficiency in power consumption
• Introduction of vegetable-based plastics (p.55)• Introduction of mini-lines at semiconductor
manufacturing plants for greater energy efficiency

Sony Corporation CSR Report 200368
that combine more advanced functionality with enhanced
resource conservation. It is believed that semiconductor
technology will play a more important role in products in
future. But it is also widely acknowledged that chip-
manufacturing processes impose a high environmental
burden as a result of high clean-room power consump-
tion and the copious use of water and chemicals in
cleaning processes. Even in this area, technological
innovations such as partial clean-room technology, re-
engineered process flows and new types of cleaning
equipment that help to conserve resources are expected
to enable substantial reductions in the environmental
impact of production processes. Sony has already
developed, installed and begun operating technical
process innovations of this type in its own semiconductor
manufacturing plants.
Stage 3: Lifestyle and Business Style Revolution
Sony does not believe that the types of product and
process improvements and technical innovations
described above will be sufficient to realize a sustainable
society. Our lifestyles will also need to change in terms of
the paradigms that involve our use of products and
services. Sony believes that new business models and
structures that are fully compatible with the environment
will need to be developed.
The first step in this stage toward a sustainable society
is the conservation of resources through the use of
products in such a way that it directly raises eco-efficiency.
Wider use of leasing and rental arrangements for
products are one way that this could happen. Shifts
toward greater use of renewable energy sources (p. 62)
and cultivation of groundwater (p. 64) are other
examples of new business styles that can achieve the
same objective.
The advent of the network society should also have
positive environmental repercussions. Not only will it lead
to improved products and processes, but it also promises
to transform ordinary lifestyles through the distribution
via the Internet of entertainment (music and movies) and
greater access to online education (e-learning). This opens
up the possibility of generating reductions in environmen-
tal impact that are not contingent on any change in
service or product quality. Although the prospect of
permanent network access as a mass utility raises valid
concerns about large increases in power consumption,
improvements in connectivity are expected to generate
offsetting effects that will help to conserve resources,
in part through reduced demand on non-virtual
distribution processes.
Such lifestyle revolutions will be instrumental in helping
the whole of society to understand and tackle environ-
mental issues. The Sony Group is contributing to this
process through its involvement in the media industry,
which is closely concerned with the issue of content
distribution that is driving many of these changes. For
example, in April 2003, the inaugural issue of a quarterly
magazine, Lingkaran, published by Sony Magazines, Inc.,
included an extensive discussion of the environmental
implications of lifestyle changes, targeted at consumers.
Establishment of Institute for Environmental
Research
In March 2003, Sony established its own Institute for
Environmental Research to formulate a new business
vision to help realize the scenario of sustainable society
described above. As part of its activities, the Institute is
engaged in the generation of ideas and business
proposals for innovative environmental technologies and
new lifestyle-related concepts that can help to reduce
environmental impact.
Sony has been a consistent supporter of long-term
environment-related research. In January 1993, Sony
established a system of environmental funds aimed at
financing long-term research into the development of
important technologies related to environmental themes.
The technology developed for the application of
vegetable-based plastics in products is one example of
environmental research supported by this type of funding.
In the future, the Institute for Environmental Research will
organize the fund with the aim of developing new
breakthrough environmental technologies.

Sony Corporation CSR Report 2003 69
Site Environmental Data
Sony compiles environmental data from its business sites worldwide using an internally developed system.
Below is a summary of the scope of this data and the collection methods used.
Scope, Collection Period and Accuracy of Compiled Data
Collection period:
April 2002–March 2003
• Data from some business sites contain estimates.
• Some values for greenhouse gas emissions other than CO2 are for
calendar 2002.
• Collection and recycling data for post-consumer products in the
United States and Europe is for calendar 2002.
Scope of data collection:
All IS0 14001-certified sites as of March 31, 2002
(including manufacturing and non-manufacturing sites)
• Data is principally collected from consolidated group business sites.
However, data has also been collected from several sites of joint
ventures in which Sony holds a capital stake of 50%*1.
• Data has not been collected from some IS0 14001-certified sites
located outside of Japan; some environmental data voluntarily
compiled and submitted by certain non-certified sites was also
accepted.
• Collective sales and operating income of certified sites accounted
for approximately 75% of Sony Group consolidated sales and
operating income.
Data accuracy:
The chemical substances and environmental cost
data collected from certain sites may be slightly
less accurate than others.
Sites with ISO 14001 Certification
• The number of sites listed represents all sites that have received ISO
14001 certification.
• Sites eligible for ISO 14001 certification, in principle, refer to sites
that have been operating for at least two years, excluding small-
scale sites that meet the conditions outlined below.
• Conditions:
Sites with less than 50 employees that are involved in hardware
research, development or design, in distribution, in warehousing or
in manufacturing.
*1 Includes America Video Glass Company (U.S.) and ST Liquid Crystal Display Corporation (Japan).
Environmental data collected using ecosMonthly: Energy, water, wastes, chemical substances,
environmental costs
Yearly: NOx (nitrogen oxides), SOx (sulfur oxides), BOD
(biochemical oxygen demand), COD (chemical
oxygen demand)
Sites with less than 100 employees that are involved in hardware
sales, in software research, production or sales, in mail-order
sales, in insurance or finance, or sites serving as corporate
headquarters.
Japan Asia Americas Europe China
Verification by management at respective sites
Data entered by authorized personnel
Business
sites
Regional
offices
Headquarters
For a list of IS0 14001-certified sites, please refer to
the following.
http://www.sony.net/eco/book/index.html
Global Data Collection System
Sony uses its own Intranet-based system, “ecos,” to
facilitate the collection of environmental data from Sony
Group sites worldwide. “ecos” enables business sites to
compile environmental performance data automatically.
Internal data-input regulations mandate built-in checking
procedures to minimize errors. During fiscal 2002, the
system became operational at all Sony Group business
sites worldwide.
. . . . . . . . . . . . . . .

Sony Corporation CSR Report 200370
Environmental Data Collection Methods and Rationale
CO2 Emissions at Business Sites
CO2 emissions associated with energy consumption
CO2 emissions for Sony business sites are calculated by
multiplying total consumption of electricity and fuels (including
gas and oil) at each site by a CO2 conversion coefficient.
For sites in Japan, the conversion coefficient used is one
recommended by a Japanese government committee for the
calculation of greenhouse gas emissions, for the year
ended March 2003.
http://www.env.go.jp/earth/ondanka/santeiho/
h1408/index.html (Available only in Japanese)
For sites outside of Japan, the CO2 conversion coefficient
used is based on the GHG protocol.
http://www.ghgprotocol.org/
The conversion coefficient used for electricity consump-
tion at sites in some countries is one developed through
studies conducted by the Japan Electric Machine Industry
Association. As a rule, electricity conversion coefficients are
based on electric power measurements at the point of
receipt, but in some countries this coefficient uses
measurements at the point of transmission.
• Electricity conversion coefficients are zero for any electric power
generated by or purchased from renewable energy sources.
• Any CO2 emission contributions due to the Green Power
Certification System can be used to offset total emissions.
CO2 emissions associated with private vehicle use
CO2 emissions related to private vehicle use at Sony
business sites are calculated by multiplying total fuel
consumption by a CO2 conversion coefficient. For sites in
Japan, the conversion coefficient used is the same
government-recommended coefficient for the year ended
March 2003. For sites outside of Japan, the GHG protocol
coefficient is used.
Non-CO2 greenhouse gas emissions
Emissions of non-CO2 greenhouse gases at Sony business
sites are calculated by multiplying emissions by a global
warming coefficient, which is based on a coefficient
proposed in the Third Assessment Report of the Intergov-
ernmental Panel on Climate Change (IPCC).
Greenhouse Gas Emissions
Resource Calculations
Resource input amount = (1) Weight of products +(2) Total waste generated at Sony sites – ((3) Amountof recycled materials used + (4) Amount of renewablematerials used)
CO2 Emissions in Distribution Phase
CO2 emissions associated with shipments of products
handled by Sony Supply Chain Solutions, Inc. (Japan) are
calculated by multiplying total shipment weights and
distances traveled by relevant CO2 conversion coefficients.
These coefficients are taken from a paper “Carbon
Dioxide Emission Units for Freight Transportation Bodies,”
which was presented at a meeting of the Environmental
Committee of the Central Environmental Council held in
Japan on April 26, 2002.
CO2 Emissions in Product Use Phase
CO2 emissions associated with the use of Sony products
are calculated by multiplying estimates of the total energy
consumed over a lifetime of operation by all the Sony
products manufactured in the year ended March 31,
2003, by relevant CO2 conversion coefficients. Hence, the
figures do not represent actual CO2 emissions in the year
ended March 31, 2003. The energy consumed by
products is calculated using the following formula:
Average product operating and standby times and
years of use are based on several research data.
For Japan, the conversion coefficients used are the
same as those used for CO2 emissions at Sony business
sites. Outside of Japan, the conversion coefficients used
vary according to the product’s intended destination (if
North America, coefficients for the United States are
used; if Europe, coefficients for Germany are used; for
other regions, coefficients for Singapore are used).
Resource Inputs
Resource input amounts are calculated based on data on
resource outputs, according to the equation below.
Production volume x (Operating power consumptionx Estimated hours of operation per year +Standby power consumption x Estimated standbytime per year) x Years used x CO2 conversion coefficents

Sony Corporation CSR Report 2003 71
( )
Calculation Method for Environmental
Conservation Effects
Environmental conservation effects are calculated by
comparing total environmental impact for the years ended
March 31, 2002, and 2003. To improve environmental
impact data comparability between the two years, the
following capacity utilization correction is applied to
environmental impact for the year ended March 31, 2002,
using the ratio of sales recorded in each year. This is based
on an eco-efficiency rationale.
FY2001 sales = ¥7,578,258 million;FY2002 sales = ¥7,473,633 million
Items Included in Environmental Conservation Effects
The items included by Sony as environmental conservation
effects cover the four major categories of greenhouse
gases, resources, water and chemical substances.
Monetary conversion of such effects using coefficients is
described below.
Monetary Conversion of Environmental
Conservation Effects
Greenhouse gases: ¥700 per ton of CO2
Derived from market data on
emissions trading in Europe
Resources: ¥11,600 per ton
Calculated from waste management
and recycling expenses
Water: ¥503 per cubic meter
The average cost of piped water and
drainage
Chemical substances : ¥1,300,000 per ton
Calculated from historical data on
environmental incidents at Sony
Main Points of Difference with Fiscal 2001 Report
• The greenhouse gas conversion coefficient per ton of CO2
has been altered, from ¥3,100 to ¥700 to reflect the fall inprices in the emissions trading market over the year.
• Environmental risks are excluded from effects since relevantquantitative data on a fiscal-year basis are currently difficultto obtain.
• Chemical substances include class 2 and class 3 substancesmarked for reduction or phase-out. Class 4 controlledsubstances have been omitted.
Chemical Substances
Environmental Accounting
Capacity-adjusted value for FY2001 =environmental impact in FY2001 (actual) xFY2002 sales / FY2001 sales
(1) Weight of productsTotal weight of all Sony-branded products sold, including allaccessories and packaging materials
(2) Total waste generated at Sony sitesTotal weight of all waste generated at Sony sites
(3) Amount of recycled materials usedTotal weight of all recycled materials used in products, accessoriesand packaging materials
(4) Amount of renewable materials usedTotal weight of all vegetable-based plastics used in products,accessories and packaging materials
Resource Outputs
Resource output amounts are calculated according to the
equation below.
(1) Amounts of waste sent by Sony sites to landfills for final disposalTotal weight of all wastes generated at Sony sites, less amounts forany recycled or compacted materials
(2) Weight of productsTotal weight of all Sony-branded products sold, including allaccessories and packaging materials
(3) Amount of products collectedTotal weight of all home appliances, PCs, batteries and otherproducts recycled in Japan, the U.S. and Europe; a portion of thisfigure is based on calculations from recycling expenses
(4) Amount of packaging materials collectedTotal weight of portion of packaging materials for product shipmentsthat Sony is legally obliged to collect and recycle, which includescardboard and recyclable containers/packaging materials
Water Consumption
These figures include all purchased water and any
groundwater drawn by each site.
Chemical Usage at Business Sites
Usage values represent amounts handled, less any amounts
recycled. Usage data is not recorded for certain substances
that are not subject to PRTR rules (including various metals,
rare gases and atmospheric constituents) or that cannot be
specified using conventional nomenclature.
Calculation Method for Environmental Conservation Costs
• Aggregate total direct investments and expenses for
environmental conservation activities during the year
ended March 31, 2003.
• Expenses include labor costs, depreciation, leasing fees
and other overheads.
Resource output amount =(1) Amounts of waste sent by Sony sites to landfillsfor final disposal + (2) Weight of products –(3) Amount of products collected –(4) Amount of packaging materials collected

Sony Corporation CSR Report 200372
Environmental Data Available at Sony Website
The following additional data can be found on the Sony website.
• Business site environmental data by region (figures for Japan go back to fiscal 1990)
• Environmental data for products (p.47)
• List of ISO 14001-certified business sites
• List of business sites with OHSMS certifications
• Brief history of environmental activities
• External recognition received by Sony for environmental activities
Greenhouse Gas Emissions From Business Sites (Unit: t-CO2)
CO2 from energyHFCs PFCs SF6 NF3 Others consumption Total
Fiscal 2000 7,823 242,580 51,947 2,780 235 1,937,564 2,242,929
Fiscal 2001 6,553 206,780 43,118 8,669 401 1,897,356 2,162,877
Fiscal 2002 6,754 150,996 39,351 5,988 932 1,975,715 2,179,736
*Some data includes calendar year figures
*Although NF3 is a much less harmful alternative to PFC gas, Sony voluntarily lists this substance due to the large quantity it uses.
Environmental Data for Sony Business Sites
Unit Fiscal 1998 Fiscal 1999 Fiscal 2000 Fiscal 2001*1 Fiscal 2002
Energy*2 Electricityconsumption TJ 28,458 30,610 30,046 29,303 31,385Gas consumption TJ 7,172 7,376 6,287 5,531 7,586Oil consumption TJ 3,094 3,285 3,301 3,368 2,522Vehicle fuel TJ 650
Total TJ 38,724 41,271 39,634 38,202 42,143
Water Water consumption m3 26,907,650 29,420,871 28,624,900 26,364,288 26,389,755
Waste Waste generated t 256,450 293,652 281,450 257,769 223,726Waste recycled/compacted t 180,878 215,150 226,046 212,630 186,528
Sent to landfills forfinal disposal t 75,572 78,502 55,404 45,141 37,198
Controlled Class 2 substances t 42 51 703 468 203Environmental Class 3 substances t 10,799 11,222 17,042 19,221 16,292Chemical Class 4 substances t 23,162 28,824 27,490 26,627 43,408Substances*3
Total 34,003 40,096 45,235 46,306 59,903
*1 Revised figures for estimates first reported in Sony Social & Environmental Report 2002.
*2 Crude oil equivalent of electricity, gas, and petroleum consumed.
*3 Total volume of chemical substances used calculated by subtracting the volume of chemical substances recycled from the volume of chemical
substances handled.
1 Terajoule = 1 trillion Joules
Site Environmental Data
http://www.sony.net/eco/book/

Sony Corporation CSR Report 2003 73
List of Controlled Substances
( )
Class Class 1 Class 2 Class 3 Class 4Prohibited Phase-out by March 2006 Reduction Controlled
Greenhouse Gases PFCs
HFCs
SF6
N2O
CO2 (excluding energy-derived)
Ozone-Depleting CFCs (non-refrigerant) Halon CFC (used as refrigerant
Substances HCFCs (non-refrigerant) CFCs in freezers installed after
Methyl bromide (used as refrigerant in April 1981)
freezers installed HCFCs (refrigerant)
by the end of March 1981) HFCs (refrigerant)
allowed in new freezers
installed by the end of
March 2011
VOCs 1,1,1-Trichloroethane Methanol Acetone
1,1,2-Trichloroethane IPA Cyclohexanone
1,2-Dichloroethane MEK
1,1-Dichloroethylene n-Hexane
1,2-Dichloroethylene Toluene
Methylene chloride Xylene
Chloroform Ethyl acetate
Trichloroethylene Butyl acetate
Tetrachloroethylene
Carbon tetrachloride
Heavy Metal Cadmium and its compounds Lead solder Chromium (VI) compounds Lead-free solder
Compounds Mercury and its compounds (phase-out by March 2005) Lead and its compounds Chromium (VI) compounds
(excluding lead solder) used as rustproofing
Antimony and its compounds materials for refrigerators
Arsenic and its compounds phased out by the end of
Nickel compounds March 2011
Zinc compounds
Manganese and its compounds
Cobalt and its compounds
Carcinogenic Asbestos
Substances Vinyl chloride monomer
PCBs
Benzene
Endocrine Disrupters Nonyl phenol Methyl cellosolve and
and Substances Octyl phenol its acetate
Harmful to Ethyl cellosolve and
Reproductive its acetate
Functions Dioxins and furan
Toxic and Chlorine Ammonia
Dangerous Formaldehyde Acids and alkalis
Substances Hydrofluoric acid
Agrichemicals, Aldrin Polychlorinated naphthalene Effluent treatment agents
Sterilizers, Dieldrin (chlorine index of 3 or higher only)
and Others Endrin Hexachlorobenzene
Chlordane Bis (tributyltin) oxide
Heptachlor Certain para-pheny-
Toxaphene lenediamines
Mirex
DDT
( )

Sony Corporation CSR Report 200374
Glossary
AC-drive equipmentAny equipment powered directly from an electricmains socket.
Advisory boardA group that exchanges opinions with, andprovides advice to, the senior management ofa company. In the case of the Sony Group,this involves periodic discussions with topexecutive officers.
ATRAC3A type of audio compression technology thatenables the data on a music CD to be compressedby over 90% without any loss of quality.
ATRAC3 plusA more advanced form of the ATRAC3 audiocompression algorithm that boosts compressionto 95%.
BOD (Biochemical Oxygen Demand)The amount of oxygen consumed during the microbialdisintegration of organic matter in water.
Business partnerAny company or venture that is involved with thesale of Sony products or services, but that does notsupply parts or products to Sony (see also: Supplier).
Business siteDivided into manufacturing sites (plants whereproducts are manufactured) and non-manufacturingsites (offices and other sites).
C2F6: hexafluoroethane
C3F8: octafluoropropane (perfluoropropane)
C4F8: octafluorocyclobutane (perfluorocyclobutane)
CF4: tetrafluoromethane
CHF3: trifluoromethane (fluoroform)
CO2: carbon dioxide
COD (Chemical Oxygen Demand)The amount of oxygen equivalent to the quantity ofoxidant consumed during the oxidation in water oforganic matter or non-oxidized inorganic matter.
COF2: Carbonyl fluoride
CP: chlorinated paraffin
CSR: Corporate Social ResponsibilityThe responsibilities of a company by virtue of itsbeing a corporate citizen of society.
Contactless IC cardA type of IC card with a magnetic strip whose datacan be read or altered without the need to insert thecard into a special slot for reading.
ComplianceObservance of legislation and regulations. Sony alsoincludes observance of internal rules within thescope of this term.
Corporate governanceInternal systems and rules adopted by companies togovern how they are managed.
Eco-efficiencyAn index obtained by dividing sales by anenvironmental impact figure (see p. 38).
e-learningTraining and other educational programs providedover the Internet or an intranet. As no classrooms isneeded, e-learning allows individuals to study at anytime and place.
Environmental accountingCompares the cost of environmental conservationprograms and corresponding reductions in theenvironmental impact (the combined burden on theenvironment caused by Sony’s business activities andthe use of its products.)
ErgonomicsThe study of human engineering, often related tothe effects on the human body of unnaturalworking environments.
Funnel glassThe funnel-shaped portion of a cathode ray tubebehind the picture surface.
Greenhouse gases (GHG)Gases that absorb solar infrared radiation reflectedfrom the Earth’s surface, raising air temperature. Thiscategory of gases typically refers to the following sixcompounds: CO2, methane, nitrous oxides,hydrofluorocarbons (HFCs), perfluorocarbons (PFCs),and sulfur hexafluoride (SF6).
Green Power Certification SystemA tradable system, introduced in Japan, of certifiedelectric power sourced from wind-based generatingplants. The system is designed to facilitate the use ofwind power by facilities that are not situated closeto the site of power generation.
Global CompactA global forum initiated by the United Nationsto tackle any of a variety of issues stemmingfrom globalization.
Home Appliances Recycling LawA law enacted in April 2001 to promote recycling ofhome appliances in Japan.
Halogenated flame retardantsChlorine, fluorine and other halogen elementsadded to plastics to make them fire resistant.
Hexagonal cartonA shipping carton for large-screen televisions that isshaped to match the profile of the television.
HFCA hydrofluorocarbon (an organic chemicalcontaining fluorine, plus at least onehydrogen atom).
IntranetA part of the Internet that can only be used insidea particular company.
ISO 14001An international standard for environmentalmanagement systems. Certified systems must bebased on a Plan-Do-Check-Act (PDCA) structure.
Lead-free solderSolder that replaces lead-based solder formulationsthat could be harmful to the environment byreleasing lead if disposed of improperly.
Life cycle assessment (LCA)A method for determining environmental impact ofa product or service beginning with the sourcing ofraw materials and ending with recycling or disposal.
LimoneneOil obtained from the peels of citrus fruit.Used mainly for fragrances in food productsand cosmetics.
Limonene-recycled materialsRecycled polystyrene foam that has beenreconstituted using limonene, as part of the OrangeR-net system developed by Sony.
NF3: nitrogen trifluoride
NOx: oxides of nitrogen
Nickel metal hydride batteriesA type of rechargeable dry-cell battery; smaller andmore powerful than nickel-cadmium batteries.
OHSMS (Occupational Health & SafetyManagement System)A system for managing occupational health andsafety based on a “plan-do-check-act” (PDCA)structure.
Panel glassRefers to the television screen onto which CRT-produced images are projected. Panel glass containsno lead.
PBB: polybrominated biphenyl
PBDE: polybrominated diphenyl ether
PCB: polychlorinated biphenyl
PCN: polychlorinated naphthalene
PDCARefers to the Plan-Do-Check-Act cycle.
PFCA perfluorocarbon (an organic chemical in which allthe hydrogen atoms have been substituted byfluorine).
Printed circuit boardA board created by attaching various components tothe top of a piece of silicon onto which an electricalcircuit pattern has been printed.
PRTR (Pollutant Release and TransferRegister)A public system for tracking and recording theamounts of certain chemicals believed to beenvironmental pollutants that are emitted intothe environment or else transferred in the formof waste.
Pulp moldA cushioning component for packaging made fromold newsprint or other reused materials.
PVC: polyvinyl chlorideA type of general plastic, often used for its excellentflame-retardant and insulating properties. Use ofsuch plastics, and of PCV resins as plasticizers, isbeing discontinued because of concerns about theenvironmental harm caused by inappropriatedisposal, which can generate toxic by-products.
Renewable energyForms of energy derived from non-limited, naturalsources (such as solar or wind).
Risk managementAnalyzing potential sources of risk prior tothe occurrence of a problem and takingpreventive measures.
Semiconductor waferA thin, circular piece of pure crystalline siliconthat forms the base for IC-chip production.
SF6: sulfur hexafluoride
SOx: oxides of sulfur
SiteRefers to manufacturing andnon-manufacturing sites.
Sony Green PartnerA term used by Sony for a supplier that satisfiesinternal environmental management standards(see p. 51).
StakeholderAny party that associates with Sony. Examplesinclude but are not limited to shareholders, otherinvestors, suppliers, government agencies, massmedia, research institutions, non-governmentalorganizations, customers, local communities,employees and children.
Standby power consumptionPower consumption of a product while power isswitched off but it remains capable of receiving apower-on command from a remote control unit.
SupplierAny party that supplies parts or products to Sony(see also: Business partner).
VOCVolatile organic compounds, substances that havebeen used as solvents in ink and other products butcontribute to air pollution and acid rain.
WEEE (Waste Electrical and ElectronicEquipment)A recycling directive issued by the EU for electricaland electronic equipment (see p. 57).
Zero landfill wasteAt Sony, this is defined from fiscal 2003 as reducingto less than 1 percent the amount of waste sent tolandfills through waste reduction, reuse andrecycling programs.