s&op outline
TRANSCRIPT

Sales and Operations Planning
Peter KarranFellow IOM
S&OP

What is it?
Formal Business Process spread over 18-24 Months of planning Horizon
Product Families (not items) Volume (not Mix) Monthly review Cycle Both product and financial units
2

Principles
3

More Principles
4

Suggested Process
Buffer Management
5

Inputs by Function
6

Some Rules
7

Agenda
8

Put Simply
End of month
STEP 1Data
Gathering
STEP 5Exec SOPMeeting
STEP 4Pre-SOPMeeting
STEP 3Supply
Planning
STEP 2DemandPlanning
Statistical forecastsField sales worksheet
Management forecast1st pass spreadsheets
Capacity constraints2nd pass spreadsheet
RecommendationsFor executive S&OP
Decisions
Wallace: 2nd edition Sales & Operations Planning
9
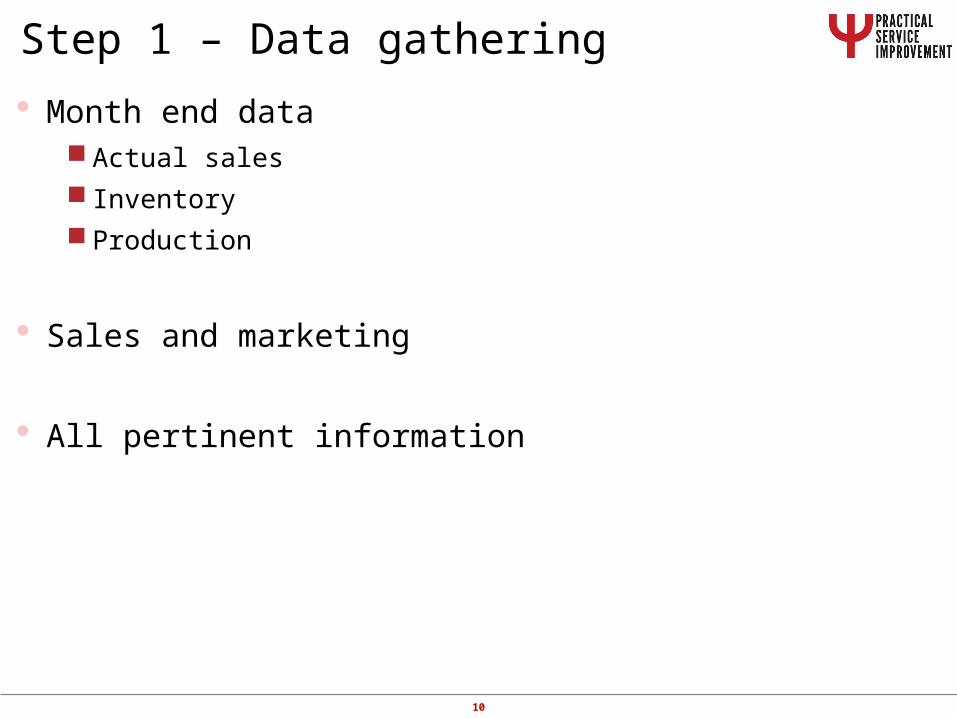
Step 1 – Data gathering
Month end data Actual sales Inventory Production
Sales and marketing
All pertinent information
10

Jan Feb Mar Apr May June Jul AugForecast 100 100 100 120 120 120 120 130Acutal sales 90 95 85Difference -10 -5 -15Cum. difference -15 -30
Jan Feb Mar Apr May June Jul AugPlanned production 100 100 100 110 120 120 120 130Actual production 98 100 101Difference -2 0 1Cum. difference -2 -1
Jan Feb Mar Apr May June Jul AugPlanned inventory 100 100 100 142 142 142 142 142Actual inventory 111* 116 132Difference 11 16 32
*January Inventory=103
Comparing actual to forecast Product Family A
Alternatively Time or Capacity Buffer
Management
History Present FutureVol=Widgets
11

Total S&OP summarises family plans
S&OP
Family A Volume
=> £
Family B
Volume => £
Family C
Volume => £
Family D
Volume => £
Family E Volume
=> £
Family F Volume
=> £
12
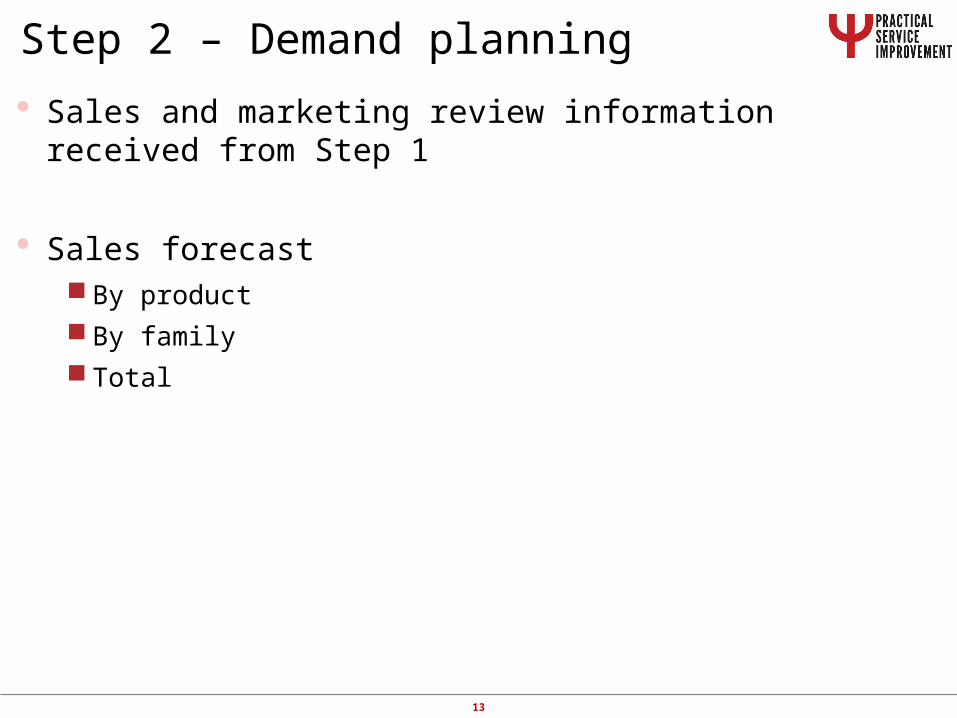
Step 2 – Demand planning
Sales and marketing review information received from Step 1
Sales forecast By product By family Total
13

Demand planning team
Demand manager
Product manager
Forecast analyst
Sales manager
Salesperson
Customer service
Accounting manager
Supply chain manager
14

Forecasting
INPUTS OUTPUTSForecasts That:
• Are reasoned
• Are realistic
• Are reviewed
• Represent demand
THEPROCESS
Current Customers
New customers
Competition
Economy
New products
Pricing
Bids
Promotions
Management directive
History
Other
15
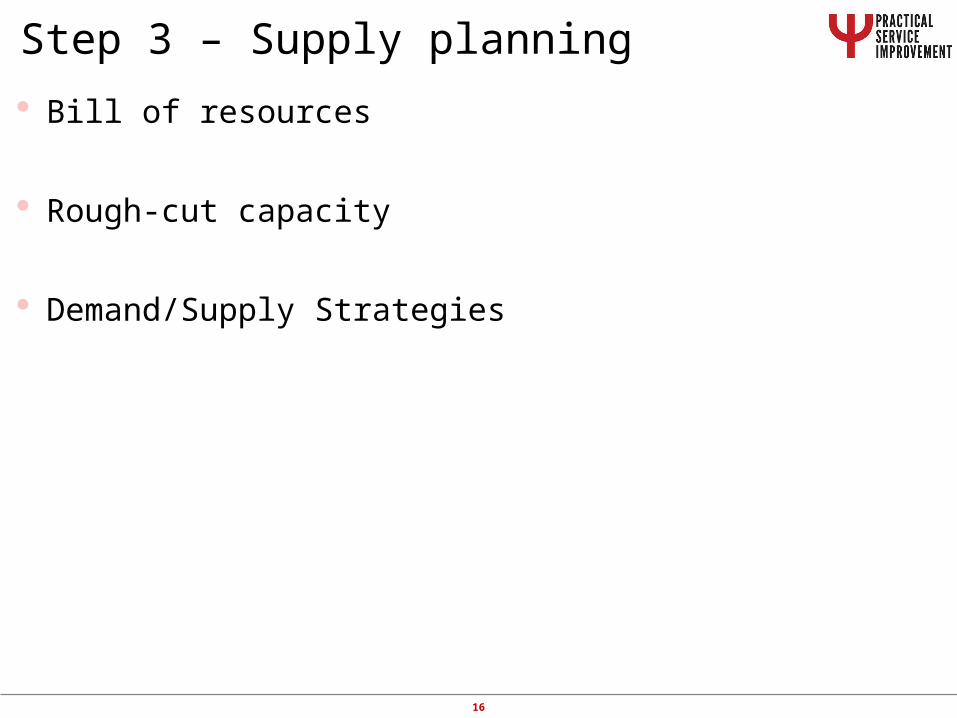
Step 3 – Supply planning
Bill of resources
Rough-cut capacity
Demand/Supply Strategies
16
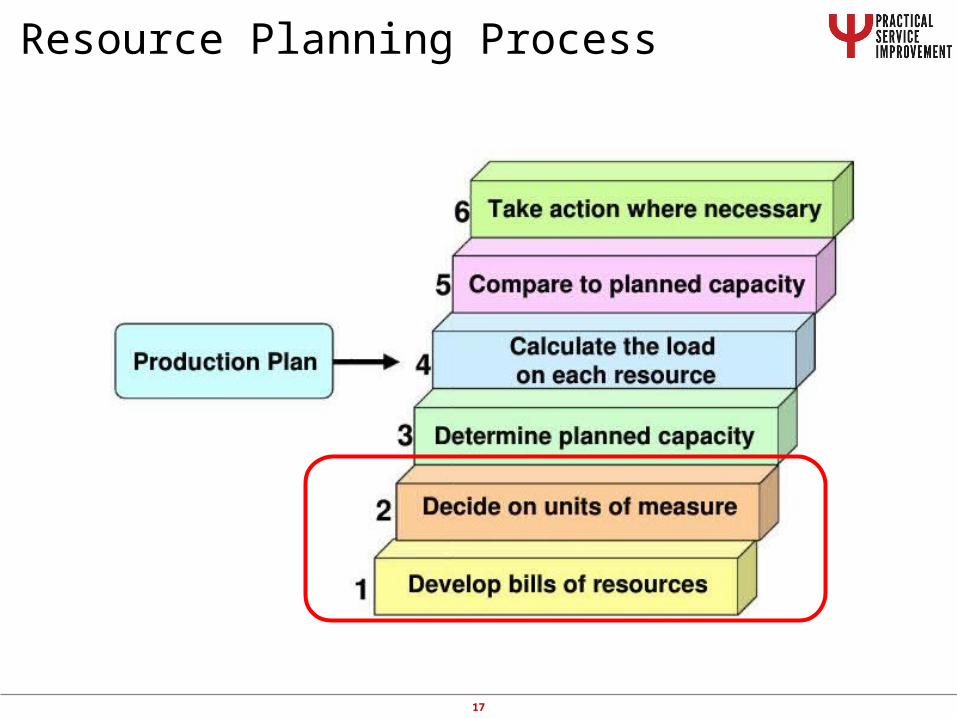
Resource Planning Process
17

Bill of Resource
18

Resource Planning Process
19

Rough-cut capacity planning
Resource Bill
20
If you want this from an ITSM then please contact me

Demand/Supply Strategies-Constraint Management
Product Family: 11. Make-to-stock
2. Target customer service level 99%
3. Target finished goods inventory 1 month
Product Family: 21. Make-to-order
2. Target customer service level 98%
3. Target customer lead time 2 weeks
21

Step 4 – Pre-SOP meeting
Make decisions to balance supply/demand
Resolve differences where possible
Identify areas of disagreement
Develop scenarios
Set agenda for Executive S&OP meeting
22

Step 5 – Executive S&OP meeting
Make decisions
Authorise changes in S&OP plan
Confirm assumptions
Resolve risks and issues
Review performance, product issues, special projects, etc.
23

What are critical success factors for S&OP?
S&OP
Top Management Involvement
Ongoing Routine S&OP
Meetings
Structured meeting agendas
Cross-functional
participationParticipants empowered
to take decisions
Internal Collaborative
process
Measurement of Process
Supported by Integrated
Supply-Demand Planning
Technology
24
25