sorsogon bay 01 - national stock assessment ......fisheries of sorsogon bay (region 5) virginia l....
TRANSCRIPT

ASSESSMENT OF THE FISHERIES OF SORSOGON BAY (REGION 5)
VIRGINIA L. OLAÑO, MARIETTA B. VERGARA and FE L. GONZALES

ASSESSMENT OF THE FISHERIES OF SORSOGON BAY
(REGION 5)
VIRGINIA L. OLAÑO Project Leader, National Stock Assessment Program (NSAP)
Bureau of Fisheries and Aquatic Resources, Region V (BFAR V) San Agustin, Pili, Camarines Sur
MARIETTA B. VERGARA Assistant Project Leader, NSAP
BFAR V, San Agustin, Pili, Camarines Sur
and
FE L. GONZALES Co-Project Leader
BFAR-National Fisheries Research and Development Institute Kayumanggi Press Building, Quezon Avenue, Quezon City

Assessment of the Fisheries of Sorsogon Bay
ii
CONTENTS
List of Tables iii List of Figures iv List of Abbreviations, Acronyms and Symbols vi ACKNOWLEDGMENTS viii ABSTRACT ix INTRODUCTION 1 Objectives of the Study 3 General 3 Specific 3 METHODOLOGY 4 RESULTS AND DISCUSSION 5 Boat and Gear Inventory 5 Dominant Families 5 Dominant Species 6 Catch Composition of Major Fishing Gear 8 Catch Contribution of Major Fishing Gear 11 Seasonality of Species Caught by Major Fishing Gear 12 Seasonality of Catch of Major Fishing Gear 17 Catch, Effort and Catch Per Unit Effort 18 Surplus Production 19 Population Parameters 20 Probability of Capture 21 Virtual Population Analysis 24 Relative Yield Per Recruit 24 CONCLUSION AND RECOMMENDATIONS 30 REFERENCES 31
Assessment of the Fisheries of Sorsogon Bay
iii
TABLES
Table 1 Production estimates of the different types of fishing gear used in Sorsogon Bay (based on boat and gear inventory as of December 2001) 6 Table 2 Catch data on the dominant fish and invertebrate families
in Sorsogon Bay (April 1999- March 2003) 7 Table 3 Annual average number of common and minor types of
fishing gear monitored per month at three landing centers in Sorsogon Bay (April 1999-March 2003) 12
Table 4 Population parameters of dominant species in Sorsogon Bay (April 2001-March 2002) 22 Table 5 Comparative results on population parameters K (growth)
and E (exploitation rate) of Leiognathus splendens and Sillago sihama 23

Assessment of the Fisheries of Sorsogon Bay
iv
FIGURES
Figure 1 Map of Sorsogon Bay showing the location of fish landing centers in the area 2
Figure 2 Dominant families of finfishes and invertebrates caught by major types of fishing gear in Sorsogon Bay, April 1999-
March 2003 7
Figure 3 Dominant species of finfishes and invertebrates caught by major types of fishing gear in Sorsogon Bay, April 1999-
March 2003 8 Figure 4 Dominant species caught by gillnet in Sorsogon Bay, April
1999-March 2003 8
Figure 5 Dominant species caught by otter trawl in Sorsogon Bay, April 1999-March 2003 9
Figure 6 Dominant species caught by stationary liftnet in Sorsogon
Bay, April 1999-March 2003 10 Figure 7 Dominant species caught by bottom set longline in
Sorsogon Bay, April 1999-March 2003 10
Figure 8 Dominant species caught by fish corral in Sorsogon Bay, April 1999-March 2003 11
Figure 9 Catch contribution of the major types of fishing gear in
Sorsogon Bay, April 1999-March 2003 12
Figure 10 Seasonality of Escualosa thoracata, Arius maculatus, Sillago ingenuua, Stolephorus commersoni, Leiognathus splendens and Mugil cephalus in Sorsogon Bay (April 1999-March 2003) 14
Figure 11 Seasonality of Alepes djedaba, Megalaspis cordyla, Himantura uarnak, Sillago sihama, Secutor ruconius and Eleutheronema tetradactylum in Sorsogon Bay (April 1999-March 2003) 15
Figure 12 Seasonality of Portunus pelagicus, Metapenaeus dalli, Trachypenaeus fulvus, Loligo duvauceli and Metapenaeus ensis in Sorsogon Bay (April 1999-March 2003) 16
Figure 13 Seasonality of catch of major fishing gear in Sorsogon
Bay (April 1999-March 2003) 17

Assessment of the Fisheries of Sorsogon Bay
v
Figure 14 Catch per unit effort of major fishing gear in Sorsogon Bay (April 1999-March 2003) 19 Figure 15 Estimates of potential yield (PY) using standardized effort of gillnet units in Sorsogon Bay (April 1999-March 2003) 20
Figure 16 Frequency distribution of E values of eight species of
finfishes and invertebrates in Sorsogon Bay 23
Figure 17 Size distribution of Alepes djedaba, Rastrelliger brachysoma and Megalaspis cordyla in Sorsogon Bay 25
Figure 18 Size distribution of Gerres oyena, Leiognathus splendens and Mugil cephalus in Sorsogon Bay 26 Figure 19 Size distribution of Sillago ingenuua, S. sihama and
Terapon jarbua in Sorsogon Bay 27 Figure 20 Size distribution of Portunus pelagicus, Penaeus merguiensis and Loligo duvauceli in Sorsogon Bay 28
Figure 21 Size distribution of Sepioteuthis lessoniana in Sorsogon
Bay 29 Figure 22 Mortality parameters of key species from three landing
centers in Sorsogon Bay 29

Assessment of the Fisheries of Sorsogon Bay
vi
ABBREVIATIONS, ACRONYMS AND SYMBOLS BFAR - Bureau of Fisheries and Aquatic Resources BSLL - bottom set longline
CL∞ - carapace length infinity CLN - crab liftnet cm - centimeter Coll. - college CP - crab pot CPUE - cath per unit effort CSK - Cooperative Sympoisum on the Kuroshio
CW∞ - carapace width infinity DA - Department of Agriculture DANIDA - Danish International Development Agency Dept. - department DGN - drift gillnet DS - Danish seine E - exploitation rate ed./eds. - editor/s ELEFAN - electronic length frequency analysis F - fishing mortality FAO - Food and Agriculture Organization of the United Nations FC - fish corral Fig. - figure FISAT - FAO-ICLARM stock assessment tools Fish. - fisheries fm - fathom Fmax - maximum level of fishing mortality FP - fish pot fPY - maximum fishing effort FSP - Fisheries Sector Program GN - gillnet HL - hook and line ICLARM - International Center for Living Aquatic Resources
Management J. - journal K - growth rate kg - kilogram L50 - length at 50 percent probability of capture LGU - local government unit
L∞ - length infinity, asymptotic length Lmax - maximum length M - natural mortality Mar. - marine MFARMC - Municipal Fisheries and Aquatic Resources Management
Council MS - Microsoft M. Sc. - Master of Science

Assessment of the Fisheries of Sorsogon Bay
vii
mt - metric ton NGO - non-government organization NORMSEP - normal separation NSAP - National Stock Assessment Program OT - otter trawl p. - page/s Pap. - paper Philipp. - Philippines Proc. - proceedings PY - potential yield RA - Republic Act REA - resource and ecological assessment Rep. - report RP - recruitment pattern SLN - stationary liftnet SM - size at maturity sq km - square kilometer Tech. - technical TN - trammel net UB Tech. Inc. - United Business Technologies, Incorporated Univ. - university UPV - University of the Philippines in the Visayas VBGF - von Bertalanffy growth function Vol. - volume VPA - virtual population analysis yr - year Z - total mortality Ø’ - growth performance index % - percent

Assessment of the Fisheries of Sorsogon Bay
viii
ACKNOWLEDGMENTS We would like to extend our profound gratitude to the following persons
who shared their resources, knowledge and expertise: Director Malcolm Sarmiento (National Director, BFAR), Mr. Noel Barut
(NSAP National Coordinator), and Dir. Jaime de la Vega (Regional Director, BFAR 5) for their approval and support in the implementation of the project;
Mr. Vic Soliman and Prof. Nygiel Armada for their constructive
criticisms to improve the manuscript; Ms. Charmaine A. Malonzo for her technical inputs to the manuscript; Mr. Roderico Cerillo and Ms. Ma. Theresa Ailes for data encoding,
processing and analysis; Gem, Ramil, Effie, Jo, Kring, Mitch, Dona, Quel, Elain, Ziel, Mike, Jeco,
Apin and Ronnie – the enumerators – for their patience, persistence and untiring effort throughout the data gathering; and
All the fishermen who wholeheartedly shared their catch and additional
information to make the project feasible. Above all, the Almighty God deserves our utmost gratitude for His
boundless blessings and spiritual guidance throughout the project.

Assessment of the Fisheries of Sorsogon Bay
ix
ABSTRACT
An analysis of four years of catch, effort and length-frequency data of Sorsogon Bay (from April 1999 to March 2003) was made to characterize the fisheries of the bay. Results of the analysis are useful as basis for the management and conservation of the bay’s resources. Data on catch, effort and seasonality of species were analyzed using the MS Excel program, and the length-frequency data by FISAT (FAO-ICLARM stock assessment tools). Sorsogon Bay is known for commercially important invertebrates, as well as small pelagic and demersal species of fish. The invertebrate species, particularly portunids and penaeids, contributed 33.77 percent of the bay production; the small pelagics, 26.41 percent; and the demersal species, 15.08 percent. Production trend and seasonality of species vary each year. The average catch rate consistently decreases as the effort increases. The estimated potential yield (PY) was observed to be 45 percent beyond the sustainable level of the resource, which strongly suggests that heavy fishing pressure has been exerted in the bay.
Results of the analysis of population parameters of eight species showed high growth rates (K = 0.66-1.58) and high mortality coefficients (Z = 3.21-8.62). These values indicate a very high turnover rate of biomass but low survival rates in the bay. The exploitation rates were relatively high (E = 0.49-0.75) which indicate that the stocks are overfished. Recruitment patterns derived were unimodal and bimodal. Comparison of the probabilities of
capture (L50) with the known size at maturity, ratio to their length infinity (L∞), virtual population analysis (VPA), and the size ranges revealed that most of the species caught by trammel net and stationary liftnet were still immature. The relative yield per recruit showed that the current fishing mortality (F) was higher than the maximum level by 12 percent, and that all the dominant species have already exceeded their allowable limit of exploitation.
Fishery management and regulatory intervention are thus necessary to help resolve the problems on heavy fishing pressure and growth overfishing of Sorsogon Bay.
Assessment of the Fisheries of Sorsogon Bay
1
INTRODUCTION
Sorsogon Bay is situated in the southern part of the Bicol Peninsula. Its area is approximately 201 sq km, bounded by longitudes 123050’ and 12400’ East and latitudes 1300’ and 1305’ North. It opens to a narrow channel leading to Ticao Pass (Fig. 1). The bay is generally shallow with depths ranging from 0.25 fathom to five fathoms. The deeper portion is located at the mouth of the bay with depths of 5.5-16 fm. The bottom is generally characterized by very soft mud and accumulated silt. However, there are areas with sandy bottom and some with coarser sediments. Incarizan River is the major tributary draining into Sorsogon Bay.
Sorsogon Bay is considered as an important fishing ground in the Philippines for small pelagics, demersal fishes, and shellfishes. It is an enclosed bay surrounded by five coastal municipalities, namely, Casiguran, Castilla, Magallanes, Juban and Sorsogon. Castilla and Sorsogon are the biggest fish-producing municipalities, both for capture fisheries and aquaculture. The resource and ecological assessment (REA) of Sorsogon Bay, conducted by Cinco et al. (1995), estimated the production of Sorsogon Bay at about 5,585.62 metric tons, with gillnets as the commonly used gear. There was no report of commercial fishing activity in Sorsogon Bay, although illegal fishing methods, such as blast fishing, use of air compressor and gear with fine-meshed nets, are still rampant. The Provincial Board of Sorsogon unanimously approved on January 14, 1972, Resolution No. 24 declaring Sorsogon Bay as a conservation area and banning the use of trawl and other apparently destructive fishing operations. This consequently led to the exploration of the benthic biomass of the Bay, and started the dominance of shellfish collection in the area, with Paphia undulata as the dominant species (Del Mundo et al. 1987). However, in 1989 there was a noticeable decline in the production of P. undulata, reportedly due to overcollection of the species (R. Dioneda, pers. comm.).
As early as 1972 Sorsogon Bay was already declared as biologically overfished, according to Ordoñez et al. (1972) in their study regarding the relevance of the proposed trawl ban. The results of the REA conducted in the bay also showed high exploitation rates and high fishing mortalities of several dominant demersal fishes. All these suggest overexploitation of the limited resources of the bay. However, there are also interventions from the government and non-government organizations (NGOs), which are geared towards the rehabilitation of the bay. The different Municipal Fisheries and Aquatic Resource Management Councils (MFARMCs) and the respective local government units (LGUs) implement mangrove reforestation and alternative livelihood programs, as well as apprehend illegal fishing operations in the bay. Various NGOs are also involved in the preservation of the bay’s resources.

Assessment of the Fisheries of Sorsogon Bay
2
Studies on the assessment of the status of capture fisheries of
Sorsogon Bay are very limited. This study aims to establish reliable fisheries statistics and baseline data which are useful as basis in the formulation of policy options and management plans essential for the development and sustainability of the bay’s resources.
Figure 1. Map of Sorsogon Bay showing the location of fish landing centers in the area.

Assessment of the Fisheries of Sorsogon Bay
3
Objectives of the Study General
• Develop institutional capability of regional fisheries manpower in resource assessment, management and development;
• Generate reliable data for the formulation of policies, management and conservation of marine resources to achieve sustainable development.
Specific
• Determine the catch composition, effort, and catch per unit effort by gear, of fish and invertebrate resources of Sorsogon Bay;
• Estimate the potential yield (PY) using the Schaefer and Fox models;
• Provide estimates of growth, mortality, exploitation ratio and recruitment pulse of key species of finfishes and invertebrates;
• Estimate the probability of capture of key species of finfishes and invertebrates;
• Determine the relative yield per recruit of key species of finfishes and invertebrates;
• Estimate the fishing mortaliy in relation to size through virtual population analysis (VPA);
• Recommend options to improve fishing for the sustainability of the bay.

Assessment of the Fisheries of Sorsogon Bay
4
METHODOLOGY
The fish landing sites in barangays Cambulaga (Sorsogon), Cawit (Casiguran) and Poblacion (Castilla) were selected as major sampling sites based on the volume of catch being landed, accessibility of the area, and willingness of fishermen to cooperate. Fish landings in these sites were monitored every other two days, including Saturdays, Sundays and holidays, from April 1999 to March 2003. Sampling time coincided with the landing time which usually started early in the morning. Two enumerators were assigned in each landing site to gather information on the total number of fishing boats operating, volume of catch by gear type, length measurements of major species of fish and invertebrates caught by specific fishing gear, etc.
An inventory of fishing boats and gear was conducted in the five municipalities, comprising of 67 barangays bordering the bay. Using the catch per unit effort (CPUE) or catch per trip/boat given by the respondents, the estimated production was computed using the equation:
Estimated Catch per unit annual frequency number of Production effort (CPUE) of operation gear units. Data on the catch composition for each gear by family and by species
were stored, and sorted using a commercial spreadsheet program. However, for the seasonality of species, the Excel program was used for the unraised monthly monitored catch landing of the major gear and species.
The potential yield (PY) was generated using the surplus production models by Schaefer and Fox. The production was estimated per gear type following the equation: Estimated Catch per unit estimated number number of Production effort (CPUE) of boats trips.
Effort was standardized using the equation: Standardized effort Average Catch per Unit Effort Estimated (per gear) Average CPUE of GN number of boats.
The estimated production and standardized effort per gear type were then summed up to get the total production and effort of the whole bay.
Growth parameters (L∞ and K) and mortality coefficients (M, F and Z) of the major species were estimated using the FISAT (FAO-ICLARM stock
assessment tools) software (Gayanilo et al. 1996). Length infinity (L∞) was estimated using the Powell-Wetherall Plot (Powell 1979, Wetherall 1986), while maximum length (Lmax) was approximated using the extreme value theorem (Formacion et al. 1991). The K-Scan routine of the ELEFAN I method (Pauly and David 1981) was used to estimate the growth curvature
X X
X X
= X

Assessment of the Fisheries of Sorsogon Bay
5
parameter (K) of the von Bertalanffy growth function (VBGF), while the Shepherd’s Method was used to confirm the results of the latter which were incorporated in the FISAT software. The number of recruitment pulses was determined from the decomposition of normal distributions using Hasselblad’s NORMSEP.
RESULTS AND DISCUSSION
Boat and Gear Inventory
Results of the inventory of boats and gear in Sorsogon Bay revealed a total of 6,012 units of fishing gear, belonging to 19 types, operating in the bay (Table 1). The bay’s limited resources are shared by 64 barangays from the five municipalities surrounding the bay. The municipality of Sorsogon has more number of fishermen than the other coastal municipalities, and consequently registered the highest number of gear units. There are still gillnets being used with mesh sizes less than three centimeters (when stretched). All boats operating within Sorsogon Bay are classified as municipal or small scale with a capacity of less than three gross tons.
Based on the resource and ecological assessment (REA) conducted by Cinco et al. (1995), the number of fishing gear operating in Sorsogon Bay was 2,926 consisting of 47 types. Compared to the result of the present boat and gear inventory, it shows that in six years time the number of gear units had increased by 105 percent. For trawl alone, for instance, the BFAR in 1972 reported only 24 units; the REA (Cinco et al. 1995), 36 units; and this study, 45 units. Similarly, fish corral/stake trap increased from 44 units in 1972 to 235 in 1995, then to 352 units (this study). Despite the increased number of gear units, the estimated production decreased by 4.54 percent – from 5,585.62 mt (Cinco et al. 1995) to 5,332.22 mt. The tremendous increase in the number of fishing gear and at the same time a decrease in catch reflects the overfished status of the bay’s resources. Dominant Families
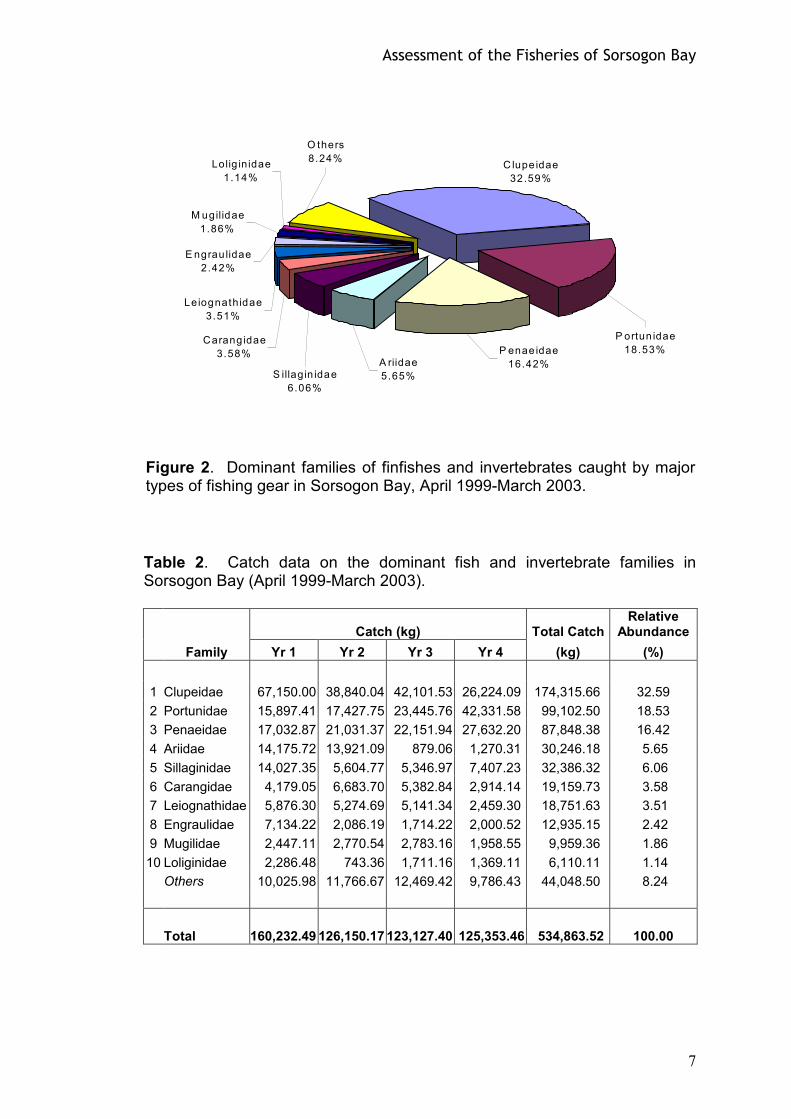
From April 1999 to March 2003, a total of 73 families were recorded – 56 fish families comprising of 223 species, five families of elasmobranchs with 11 species, and 12 invertebrate families with 36 species. Of these, family Clupeidae consistently dominated the catch, sharing 32.59 percent of the total catch (Fig. 2). The voluminous catch of family Clupeidae in Year 1 was boosted by the increased catch of two seasonal species, Sardinella longiceps and S. fimbriata, which contributed 34.29 mt to the total production. Families Ariidae and Sillaginidae consistently occupied the two top ranks for finfishes.
Families Penaeidae and Portunidae also ranked first and second for
invertebrates for four years, with a total landed catch of 87.85 mt and 99.10 mt, respectively (Table 2). Indeed, Sorsogon Bay harbors an abundance of invertebrates, with these two families ranking second and third to Clupeidae in terms of overall dominance in catch.

Assessment of the Fisheries of Sorsogon Bay
6
Dominant Species Selection of dominant species was based on consistency and volume of catch. Twenty-five fish species and 10 invertebrate species were dominant in Sorsogon Bay. Escualosa thorocata of the family Clupeidae dominated the catch, contributing 129.96 mt or 24.30 percent of the total catch. Portunus pelagicus gained over-all dominance for invertebrates with a production of 90.13 mt or 18.35 percent of the total landed catch (Fig. 3).
The bivalve Paphia undulata, locally known as “badoy”, has now regained abundance after its noticeable decline in production starting 1989. Harvesting of “badoy” has been regulated and conservation efforts have been done by different sectors to manage this threatened species. There were only 1,538.80 kg of P. undalata monitored from November 1999 to April 2001. However, from May 2001 to March 2003 there was a disappearance of P. undulata in the designated NSAP sampling stations due to the succession of Placuna placenta and Anadara spp.
Table 1. Production estimates of the different types of fishing gear used in Sorsogon Bay (based on boat and gear inventory as of December 2001).
Fishing Gear
Number of trips per year
Ave. CPUE (kg/trip)
Est. No. of Gear
Estimated Production (mt)
Relative Contribution (%)
Gillnet Encircling gillnet Bottom set gillnet Drift gillnet Trammel net Lift net Stationary liftnet Portable liftnet Hook and line Handline Multiple hook and line Bottom set longline Jigger Traps Stake trap Fish pot Squid pot Seine net Danish seine Beach seine Miscellaneous gear Spear gun Compressor Push net Man push net Trawl Otter trawl
140 252 252 528 252 198 204 168 198 552 200 200 504 228 204 216 168 198 144
19.15 5.39 3.54 3.73 8.14 3.01 2.48 2.94 6.21 2.08 3.67 2.07 3.13 3.81 4.19 2.67 29.5 2.45 5.8
117 803 314 299 65 2950 403 8 67 30 352 35 19 211 24 23 37 210 45
2,273.35 313.68 1,090.70 280.11 588.86 1,891.47 133.33 1758.14 324.66 203.89 3.95 82.38 34.44 302.83 258.37 14.49 29.97 203.81 183.29 20.51 196.63 13.26 183.37 101.87 101.87 37.58 37.58
42.63 35.47 6.09 5.68 3.82 3.69 1.91 0.70
TOTAL
6,012
5,332.22
100.00
Assessment of the Fisheries of Sorsogon Bay
7
C lupe idae
32.59%
M ugilidae
1.86%
E ngrau lidae
2.42%
Leiognathidae
3.51%
Lolig in idae
1.14%
Carang idae
3.58%
S illagin idae
6.06%
O thers
8.24%
A riidae
5.65%
P enae idae
16.42%
P ortun idae
18.53%
Table 2. Catch data on the dominant fish and invertebrate families in Sorsogon Bay (April 1999-March 2003).
Catch (kg) Total Catch Relative Abundance
Family Yr 1 Yr 2 Yr 3 Yr 4 (kg) (%)
1 Clupeidae 67,150.00 38,840.04 42,101.53 26,224.09 174,315.66 32.59
2 Portunidae 15,897.41 17,427.75 23,445.76 42,331.58 99,102.50 18.53
3 Penaeidae 17,032.87 21,031.37 22,151.94 27,632.20 87,848.38 16.42
4 Ariidae 14,175.72 13,921.09 879.06 1,270.31 30,246.18 5.65
5 Sillaginidae 14,027.35 5,604.77 5,346.97 7,407.23 32,386.32 6.06
6 Carangidae 4,179.05 6,683.70 5,382.84 2,914.14 19,159.73 3.58
7 Leiognathidae 5,876.30 5,274.69 5,141.34 2,459.30 18,751.63 3.51
8 Engraulidae 7,134.22 2,086.19 1,714.22 2,000.52 12,935.15 2.42
9 Mugilidae 2,447.11 2,770.54 2,783.16 1,958.55 9,959.36 1.86
10 Loliginidae 2,286.48 743.36 1,711.16 1,369.11 6,110.11 1.14
Others 10,025.98 11,766.67 12,469.42 9,786.43 44,048.50 8.24
Total 160,232.49
126,150.17
123,127.40 125,353.46 534,863.52 100.00
Figure 2. Dominant families of finfishes and invertebrates caught by major types of fishing gear in Sorsogon Bay, April 1999-March 2003.

Assessment of the Fisheries of Sorsogon Bay
8
Catch Composition of Major Fishing Gear Escualosa thorocata dominated the catch of gillnet for four years, contributing 35.59 percent to the total catch (Fig. 4). The invertebrates, Portunus pelagicus and Penaeus merguiensis, were included in the 10 dominant species caught by gillnet.
Es c ua los a
tho rac a ta
24 .30%
Por tunus pe lag ic us
18 .35%
O the rs
24 .74%
M ug i l c epha lus
1 .57%
M etapenaeus da l l i
10 .16%Ar ius m ac u la tus
5 .63%
S i l l ago i ngenuua
5 .66%
Penaeus
m e rgu iens is
2 .90%
S to lepho rus
c omm ers on i
2 .11%
Le iogna thus
s p lendens
2 .22%
T rac hypenaeus
fu l vus
2 .36%
Figure 3. Dominant species of finfishes and invertebrates caught by major types of fishing gear in Sorsogon Bay, April 1999-March 2003.
Mugil cephalus
2.37%
Stolephorus
commersoni
0.62%
Megalaspis cordyla
0.59%
Leiognathus
splendens
2.01%
Sillago sihama
0.57%
Penaeus merguensis
3.87%
Sillago ingenuua
8.05%Portunus pelagicus
19.20%
Arius maculatus
8.05%
Others
19.09%
Escualosa thoracata
35.59%
Figure 4. Dominant species caught by gillnet in Sorsogon Bay, April 1999-March 2003.

Assessment of the Fisheries of Sorsogon Bay
9
Among the species caught by otter trawl, Metapeneaus dalli had the greatest contribution (42.79 percent), followed by Portunus pelagicus (25.09 percent) and Trachypenaeus fulvus (10.19 percent) (Fig. 5). Only two demersal fish species were included in the dominant catch of otter trawl – Sillago ingenuua which is of commercial importance, and Brachyamblyophus coecus which is considered as trashfish.
The trawl survey of Sorsogon Bay by Ordoñez et al. (1972) showed that the leiognathids, particularly Leiognathus splendens, dominated the catch of trawls. This is a probable indication of ecological overfishing, since leiognathids had a cumulative production of only 11.084 mt, ranking sixth among the dominant finfish.
The stationary liftnet is the third major gear in Sorsogon Bay.
Stolephorus commersonii was the dominant species caught by this gear, contributing 19.92 percent to the total catch. This was followed by Escualosa thoracata, which accounted for 18.12 percent of the catch (Fig. 6). Loligo duvauceli was the only invertebrate among the dominant species caught by stationary liftnet.
Himantura uarnak contributed 25.71 percent, dominating the catch of bottom set longline; followed by Arius maculatus (18.55 percent). Another ray species, Dasyatis kuhlii, registered 4.35 percent of the catch of bottom set longline; the rest of the dominant catch of this gear were demersal fish species (Fig. 7).
Metapenaeus dalli
42.79%
Others
10.09%
Trachypenaeus fulvus
10.19%Metapenaeus ensis
2.13%
Loligo duvauceli
1.08%
Sillago ingenuua
1.92%
Anadara granosa
1.94%
Penaeus merguiensis
1.56%
Brachyamblyophus
coecus
1.58%
Octopus sp
1.63%
Portunus pelagicus
25.09%
Figure 5. Dominant species caught by otter trawl in Sorsogon Bay, April 1999-March 2003.

Assessment of the Fisheries of Sorsogon Bay
10
Figure 8 shows the catch composition of fish corrals, with Alepes
djedaba and Megalaspis cordyla giving a combined share of 42.10 percent. The invertebrates Loligo duvauceli and Metapenaeus dalli gave an aggregate contribution of 6.98 percent.
Figure 6. Dominant species caught by stationary liftnet in Sorsogon Bay, April 1999-March 2003.
Himantura uarnak
25.71%
Aetobatus
narinari
2.50%
Plotosus canius
4.17%
Pastinachus
sephen
3.64%
Caranx
sexfasc iatus
1.98%
Others
12.72%
Dasyatis kuhl ii
4.35%
Caranx ignob ilis
4.42%
Arius maculatus
18.55%
Eleutheronema
tetradactylum
5.88%
Muraenesox
c inereus
16.06%
Figure 7. Dominant species caught by bottom set longline in Sorsogon Bay, April 1999-March 2003.
Stolephorus
commersoni
19.92%
Secutor insidiator
2.55%
Alepes vari
2.11%
Leiognathus b indus
2.02%
Megalaspis cordyla
3.03%
Secutor ruconius
4.59% Loligo duvauceli
7.27%
Escualosa thoracata
18.12%
Alepes djedaba
7.73%
Leiognathus
splendens
11.29%
Others
21.37%

Assessment of the Fisheries of Sorsogon Bay
11
Catch Contribution of Major Fishing Gear
The total volume of fish landings monitored from April 1999 to March 2003 was 554.23 mt. Based on the production by gear, five types of fishing gear were identified as major gear, namely, gillnet, otter trawl, stationary liftnet, bottom set longline, and fish corral. Gillnets are of different types: bottom set gillnet, drift gillnet, encircling gillnet, and trammel net. Gillnets contributed 62.38 percent to the total production of Sorsogon Bay. This shows that these gear are widely or commonly used, and are efficient in extracting the resources of the bay. Otter trawl, which is considered as an active gear, is still widely used; it ranked as the second major gear with a contribution of 22.54 percent. Stationary liftnet ranked third, contributing 8.26 percent to the total catch. Bottom set longline gave only 2.04 percent; while fish corral, which is dependent on the onset of tides, generated only 1.28 percent of the total catch. The remaining minor gear contributed 3.49 percent to the total catch (Fig. 9). The annual average number of common and minor types of fishing gear monitored per month from three sampling sites is shown in Table 3.
Alepes djedaba
21.19%
Megalaspis
cordyla
20.91%
Others
24.13%
Metapenaeus dalli
2.00%
Alepes
melanoptera
6.21%
Scomberomorus
commerson
5.00%
Loligo duvauceli
4.98%
Secutor ruconius
4.86%
Leiognathus
splendens
4.52%
Rastrelliger
brachysoma
2.05%
Parastromateus
niger
4.14%
Figure 8. Dominant species caught by fish corral in Sorsogon Bay, April 1999-March 2003.

Assessment of the Fisheries of Sorsogon Bay
12
Table 3. Annual average number of common and minor types of fishing gear monitored per month at three landing centers in Sorsogon Bay (April 1999- March 2003).
Para- Average Number of Fishing Gear Units per Month meter Major Gear Minor Gear
Inclusive Year
Gillnet
Otter trawl
Stationary liftnet
Bottom set longline
Fish Corral
(CLN, HL, DS, CP, FP, etc.)
TOTAL
Year 1
1,098
144
75
27
25
216
1,585
Year 2 1,028 230 52 56 37 1,691
3,094
Year 3 1,046 390 51 52 27 1,039
2,605
Year 4 1,653 489 32 40 12 221 2,447
NOTE: Stationary liftnet (SLN), bottom set longline, and fish corral (FC) (which is dependent on the onset of tides), were found to be lesser in year 4 due to prolonged occurrence of the northeast wind (“amihan”), accompanied by strong winds and typhoons especially on the last quarter, which eventually destroyed most of the SLN and FC. Some owners shifted to other gear and engaged in upland activities due to financial constraints.
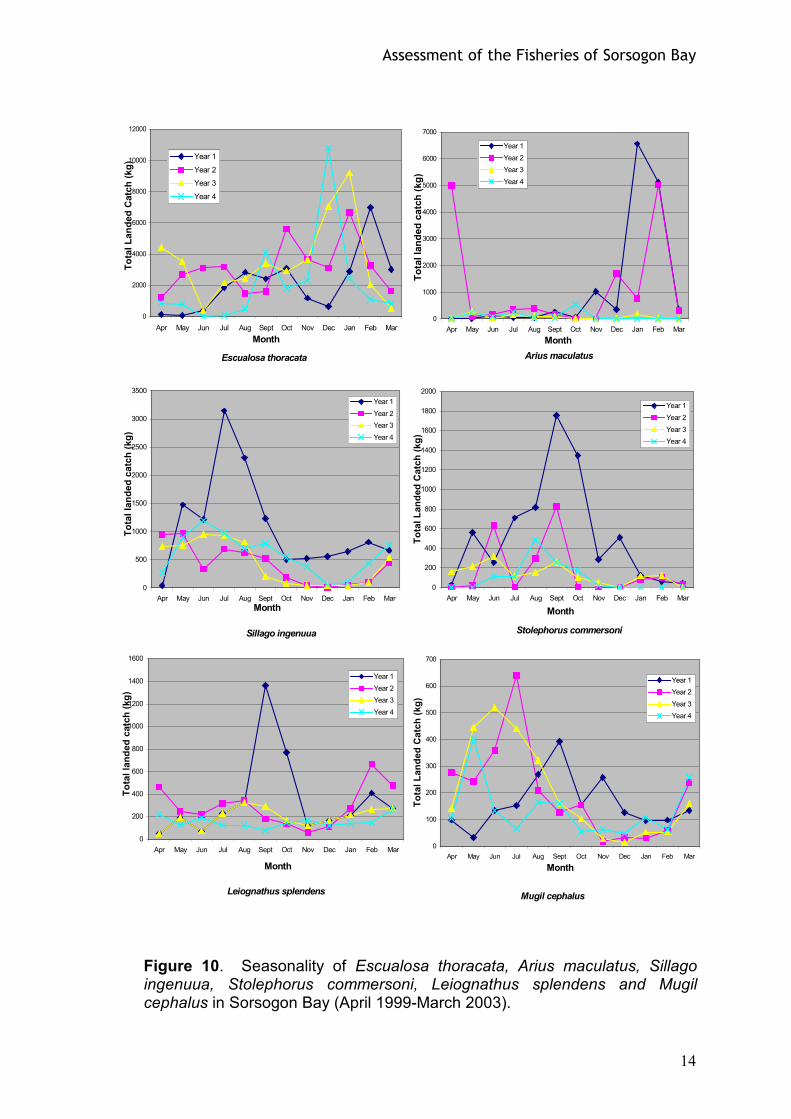
Seasonality of Species Caught by Major Fishing Gear The seasonal abundance of 18 dominant species of fish and invertebrates is shown in Figures 10 to 12.
Figure 9. Catch contribution of the major types of fishing gear in Sorsogon Bay, April 1999-March 2003.
G illnet
62 .38%
O thers
3 .49%
O tter T raw l
22 .54%
S ta tiona ry
L ift N et
8 .26%
B o ttom S et Long
L ine
2 .04%
F ish C o rra l
1 .28%

Assessment of the Fisheries of Sorsogon Bay
13
Figure 10 illustrates the seasonality of Escualosa thoracata, Arius
maculatus, Sillago ingenuua, Stolephorus commersoni, Leiognathus splendens and Mugil cephalus. E. thoracata had peak production months in December (in year 4), January (years 2 and 3) and February (year 1). Production of Arius maculatus was highest in January (in year 1) and February and April (in year 2), while the lean months were from May to August both in years 3 and 4. These species were caught mainly by gillnet and were observed to be abundant during rainy months.
Other species that dominantly contributed to gillnet production were Sillago ingenuua and Sillago sihama. The peak season of Sillago ingenuua was between May and September, while the lean months were from October to April (throughout the four-year sampling period). Stolephorus commersoni had two identified peak periods – August to October, and May to July. The lean period of the species was from January to April.
Leiognathus splendens was abundant in September and October (in
year 1). The bulk of production came from the catch of stationary liftnet. Production peak of Mugil cephalus was in July of year 2, while the lean period was between December and February (in years 1 to 4). The species was dominantly caught by encircling gillnet.
Figure 11 shows the seasonality of Alepes djedaba, Megalaspis cordyla, Himantura uarnak, Sillago sihama, Secutor ruconius and Eleutheronema tetradactylum. A. djedaba, which was dominantly caught by stationary liftnet, had the highest catch in August of year 3. The lean months of the species were from November to January (throughout years 1-4). M. cordyla highly occurred in August (in years 2 and 3); the species was mainly caught by fish corral.
The peak season of H. uarnak was consistent from May to June,
except in year 1; the lean period was from August to March (in all years). The species was predominantly caught by bottom set longline and bottom set gillnet. Sillago sihama was abundant in April and February in years 1 and 2, which could be attributed to the operation of trammel net.
Secutor ruconius, which was mainly caught by stationary liftnet, yielded
the highest catch in year 3. The peak months of E. tetradactylum were November and December of year 1, March of year 2, and June of year 3. The species was dominantly caught during these peak periods by encircling gillnet, bottom set gillnet, and bottom set longline, respectively.
Six species of invertebrates played an important role in the production
of Sorsogon Bay. Catches of Portunus pelagicus were consistently high from 1999 to 2003, except in April and May of year 1 (Fig. 12). Throughout the four-year sampling period, production of Metapenaeus dalli was evidently high from May to October, and low during the months of November to April.
Assessment of the Fisheries of Sorsogon Bay
14
Escualosa thoracata
0
2000
4000
6000
8000
10000
12000
Apr May Jun Jul Aug Sept Oct Nov Dec Jan Feb Mar
Month
Total Landed Catch (kg) Year 1
Year 2
Year 3
Year 4
Arius maculatus
0
1000
2000
3000
4000
5000
6000
7000
Apr May Jun Jul Aug Sept Oct Nov Dec Jan Feb Mar
Month
Total landed catch (kg)
Year 1
Year 2
Year 3
Year 4
Sillago ingenuua
0
500
1000
1500
2000
2500
3000
3500
Apr May Jun Jul Aug Sept Oct Nov Dec Jan Feb Mar
Month
Total landed catch (kg)
Year 1
Year 2
Year 3
Year 4
Stolephorus commersoni
0
200
400
600
800
1000
1200
1400
1600
1800
2000
Apr May Jun Jul Aug Sept Oct Nov Dec Jan Feb Mar
Month
Total Landed Catch (kg)
Year 1
Year 2
Year 3
Year 4
Leiognathus splendens
0
200
400
600
800
1000
1200
1400
1600
Apr May Jun Jul Aug Sept Oct Nov Dec Jan Feb Mar
Month
Total landed catch (kg)
Year 1
Year 2
Year 3
Year 4
Mugil cephalus
0
100
200
300
400
500
600
700
Apr May Jun Jul Aug Sept Oct Nov Dec Jan Feb Mar
Month
Total Landed Catch (kg)
Year 1
Year 2
Year 3
Year 4
Figure 10. Seasonality of Escualosa thoracata, Arius maculatus, Sillago ingenuua, Stolephorus commersoni, Leiognathus splendens and Mugil cephalus in Sorsogon Bay (April 1999-March 2003).

Assessment of the Fisheries of Sorsogon Bay
15
Alepes djedaba
0
100
200
300
400
500
600
700
Apr May Jun Jul Aug Sept Oct Nov Dec Jan Feb Mar
Month
Total landed catch
Year 1
Year 2
Year 3
Year 4
Megalaspis cordyla
0
100
200
300
400
500
600
700
Apr May Jun Jul Aug Sept Oct Nov Dec Jan Feb MarMonth
Total Landed Catch (kg)
Year 1
Year 2
Year 3
Year 4
Himantura uarnak
0
100
200
300
400
500
600
700
Apr May Jun Jul Aug Sept Oct Nov Dec Jan Feb Mar
Month
Total Landed Catch (kg)
Year 1
Year 2
Year 3
Year 4
Sillago sihama
0
100
200
300
400
500
600
Apr May Jun Jul Aug Sept Oct Nov Dec Jan Feb Mar
Month
Total Landed Catch (kg)
Year 1
Year 2
Year 3
Year 4
Secutor ruconius
0
50
100
150
200
250
300
350
400
450
500
Apr May Jun Jul Aug Sept Oct Nov Dec Jan Feb Mar
Month
Total Landed Catch (kg)
Year 1
Year 2
Year 3
Year 4
Eleutheronema tetradactylum
0
20
40
60
80
100
120
140
160
180
Apr May Jun Jul Aug Sept Oct Nov Dec Jan Feb Mar
Month
Total Landed Catch (kg)
Year 1
Year 2
Year 3
Year 4
Figure 11. Seasonality of Alepes djedaba, Megalaspis cordyla, Himantura uarnak, Sillago sihama, Secutor ruconius and Eleutheronema tetradactylum in Sorsogon Bay (April 1999-March 2003).

Assessment of the Fisheries of Sorsogon Bay
16
Portunus pelagicus
0
500
1000
1500
2000
2500
3000
3500
4000
4500
5000
Apr May Jun Jul Aug Sept Oct Nov Dec Jan Feb Mar
Month
Total Landed Catch (kg)
Year 1
Year 2
Year 3
Year 4
Metapenaeus dalli
0
500
1000
1500
2000
2500
3000
3500
4000
Apr May Jun Jul Aug Sept Oct Nov Dec Jan Feb Mar
Month
Total Landed Catch (kg)
Year 1
Year 2
Year 3
Year 4
Penaeus merguiensis
0
200
400
600
800
1000
1200
Apr May Jun Jul Aug Sept Oct Nov Dec Jan Feb Mar
Month
Total Landed Catch (kg)
Year 1
Year 2
Year 3
Year 4
Trachypenaeus fulvus
0
200
400
600
800
1000
1200
Apr May Jun Jul Aug Sept Oct Nov Dec Jan Feb Yr 2
Month
Total landed catch (kg)
Year 1
Year 2
Year 3
Year 4
Loligo duvauceli
0
100
200
300
400
500
600
Apr May Jun Jul Aug Sept Oct Nov Dec Jan Feb Mar
Month
Total Landed Catch(kg)
Year 1
Year 2
Year 3
Year 4
Metapenaeus ensis
0
20
40
60
80
100
120
140
160
180
200
Apr May Jun Jul Aug Sept Oct Nov Dec Jan Feb MarMonth
Total Landed Catch (kg)
Year 1
Year 2
Year 3
Year 4
Figure 12. Seasonality of Portunus pelagicus, Metapenaeus dalli, Penaeus merguiensis, Trachypenaeus fulvus, Loligo duvauceli and Metapenaeus ensis in Sorsogon Bay (April 1999-March 2003).
Production of Penaeus merguiensis was consistently high in years 1
and 2. Trachypenaeus fulvus was abundant in years 3 and 4. Loligo duvauceli had its peak season from May to October, and lean months from

Assessment of the Fisheries of Sorsogon Bay
17
Gill net
0
5000
10000
15000
20000
25000
Apr May Jun Jul Aug Sept Oct Nov Dec Jan Feb Mar
Month
Year 1
Year 2
Year 3
Year 4
Otter trawl
0.0
1000.0
2000.0
3000.0
4000.0
5000.0
6000.0
7000.0
Apr May Jun Jul Aug Sept Oct Nov Dec Jan Feb Mar
Month
Total Landed Catch (kg)
Year 1
Year 2
Year 3
Year 4
Stationary Lift Net
0
1000
2000
3000
4000
5000
6000
Apr May Jun Jul Aug Sept Oct Nov Dec Jan Feb Mar
Month
Total Landed Catch (kg)
Year 1
Year 2
Year 3
Year 4
Bottom set long line
0.00
200.00
400.00
600.00
800.00
1000.00
1200.00
1400.00
Apr May Jun Jul Aug Sept Oct Nov Dec Jan Feb Mar
Month
Total landed catch (kg)
Year 1
Year 2
Year 3
Year 4
Fish Corral
0
100
200
300
400
500
600
700
Apr May Jun Jul Aug Sept Oct Nov Dec Jan Feb Mar
M ont h
Year 1
Year 2
Year 3
Year 4
November to January (in all the sampling years). The production of Metapenaeus ensis did not vary considerably in four years time, although it was consistently more abundant in year 3 than in the other years.
Seasonality of Catch of Major Fishing Gear The seasonality of catch of major fishing gear is dependent on the operation of each gear type (Fig. 13). The production of gillnet for four years did not vary much. The peak months were from December to March. The lean months were from April to November, except in year 1 when production was high (in June and July) which could be attributed to the catches of Sardinella longiceps, Sillago ingenuua, Portunus pelagicus and Penaeus merguiensis.
Figure 13. Seasonality of catch of major fishing gear in Sorsogon Bay (April 1999-March 2003).

Assessment of the Fisheries of Sorsogon Bay
18
Production of otter trawl was highest in July of year 4, and was attributed mainly to the landed catches of Portunus pelagicus and Metapenaeus dalli. The peak season was from March to August when the bloom of penaieds and portunids, such as Metapenaeus dalli, Metapenaeus ensis, Penaeus merguiensis, Trachypenaeus fulvus and Portunus pelagicus, occurred. Production was generally low from September to February.
Abundant catch of stationary liftnet was observed in the first year of the
study, from August to October. The bulk of production was attributed to catches of Stolephorus commersoni, Escualosa thoracata, Leiognathus splendens, Alepes djedaba and Loligo duvauceli.
Production peak of the bottom set longline was in the month of May,
except during the first year. Almost 26 percent of the total production in four years was caught by this particular gear, with the bulk of production attributed to the catch of Himantura uarnak. The lean period of production of the bottom set longline was between November and March throughout the four-year sampling period, as fishers shifted to other gear suited for the species in abundance.
Catches of fish corral were abundant during the months of July and
August, and February to March in the second year of the study. The bulk of fish corral production was attributed to the abundance of Megalaspis cordyla and Alepes djedaba.
Catch, Effort and Catch Per Unit Effort
The catch per unit effort (CPUE) is an important information which, when correlated, would give the state of catches during the study period. Logarithmic transformation was undertaken whenever the set of monthly CPUE did not follow a normal distribution. The CPUE of five major types of fishing gear in Sorosogon Bay is shown in Fig. 14.
The highest annual average CPUE was gained by stationary liftnet, with CPUE values of 7.96-20.69 kg/boat, due to its production of Stolephorus commersonii, Escualosa thoracata and Loligo duvauceli. Otter trawl came in second, with CPUE values of 6.78-10.08 kg/boat; followed by fish corral, 4.33-7.07 kg/boat. Gillnet attained low CPUE values ranging from 3.62 kg/boat to 8.48 kg/boat, whereas the bottom set longline had the lowest CPUE values (2.88-6.00 kg/boat).
Theoretically, as the effort increases the catch increases, but only up to a certain level, that is, the potential yield (PY). This had been observed in the catches of stationary liftnet, bottom set longline and fish corral. However, for otter trawl, which contributed 84.92 percent of the total production, the catch continuously decreased with increased effort. The same trend was observed in gillnet production, especially in year 4 with the abundance of Portunus pelagicus. These observations clearly indicate high fishing pressure which eventually contributed to the overexploitation of the bay.

Assessment of the Fisheries of Sorsogon Bay
19
-
5.0
10.0
15.0
20.0
25.0
0 2000 4000 6000 8000 10000 12000 14000 16000 18000 20000
Total Boat landed
CPUE (kg/boat)
Figure 14. Catch per unit effort of major fishing gear in Sorsogon Bay (April 1999-March 2003). (GN=gillnet, OT=otter trawl, SLN=stationary liftnet, BSLL =bottom set longline, FC=fish corral.)
Surplus Production
The raised data of the production and standardized effort, using gillnet units, were used in the estimation of the potential yield or PY to represent the totality of the production of Sorsogon Bay (Fig. 15). The current annual yield was below the potential yield (PY) and the current level of effort had surpassed the maximum fishing effort (fPY), both in the Schaefer and Fox models, by 37 percent and 54 percent, respectively.
Ideally, the models used require a minimum of 10 years data to be able
to generate a reliable analysis. However, only four years data for this study and one-year data from REA (Cinco et al. 1995) were available for preliminary analysis of the PY of Sorsogon Bay. Although these are insufficient to arrive at a conclusive analysis, nevertheless a preliminary analysis was done, the results of which point out that heavy fishing pressure was being exerted in the bay. This is evident in the considerable decline of CPUE despite increased effort. The situation, if left unattended, could lead to overexploitation of the bay’s resources. Hence, on the part of the policy makers serious management interventions should be done, such as reducing the fishing effort by at least an averqge of 45 percent to allow the bay to recover its sustainable level of the resources.

Assessment of the Fisheries of Sorsogon Bay
20
0
1000
2000
3000
4000
5000
6000
0 1000 2000 3000 4000 5000
Standard effort (gillnet units)
Metric tons
Annual harvest
Schaefer
Fox
02- 03
99 - 00
00 - 01
PY (Schaefer): 5,361PY (Fox): 5,675
fPY (Schaefer):2,407fPY (Fox):1,758
01-02
REA '95
Figure 15. Estimates of potential yield (PY) using standardized effort of gillnet units in Sorsogon Bay (April 1999-March 2003).
Population Parameters
Estimates of population parameters of the eight most dominant species of finfishes and invertebrates are presented in Table 4. The growth coefficient (k) values of six species of finfishes varied from 0.66 –1 to 1.50-1. Their growth performance indices (Ø) are within the range reported on the same species in other fishing grounds of the Philippines. All the six species exhibited high Z values (3.21-7.41), implying very low survival rates especially for Rastrelliger brachysoma and Leiognathus splendens.
There are two species of invertebrates being exploited by otter trawl, a major gear in Sorsogon Bay. These are Portunus pelagicus and Penaeus merguiensis. The estimated values obtained on carapace width infinity
(CW∝), K and Z between male and female P. pelagicus showed no significant difference. The high E-values (0.64 to 0.69) indicate high fishing pressure in the area, particularly for Portunus pelagicus. The recruitment pattern exhibited was bimodal, which conforms with the results of Del Mundo et al.
(1990). Penaeus merguiensis obtained a CL∝ of 3.91 cm to 4.37 cm. The female P. merguiensis were generally larger than the male. There was no significant difference in the K values obtained for male and female P.

Assessment of the Fisheries of Sorsogon Bay
21
merguiensis (1.40-1 and 1.50-1, respectively). Exploitation rates obtained were high, varying from 0.67 to 0.75, which are above the optimum values of exploitation for tropical fishes.
A comparison of results of this study and that of Cinco (1995) on the
growth and exploitation rate of Leiognathus splendens and Sillago sihama is shown in Table 5. According to Cinco (1995), all species in Sorsogon Bay that were analyzed are fast-growing species with high growth rate but with high E-values.
Fifty percent of the species analyzed showed unimodal recruitment peaks, while the other half exhibited bimodal recruitment pulses. Figure 16 shows the frequency distribution of E-values of the analyzed species. Exploitation rates are high, between 0.55 (for Rastrelliger brachysoma) and 0.67 (for Megalaspis cordyla). These values are above the optimum values (E = 0.30-0.50) for maximizing biological yield (Pauly 1984). This could be an indication of high fishing pressure being exerted in Sorsogon Bay.
Different types of gear catch different sizes of fish and invertebrates. There are gear that are designed to catch relatively smaller individuals. For example, otter trawl, trammel net and stationary liftnet commonly catch small-sized finfishes.
The increase in the number of gear units in Sorsogon Bay, as confirmed by the result of the boat and gear inventory, has caused so much fishing pressure on the bay, thus affecting its production significantly. The results of the analysis of population parameters support this observation. Thus, management efforts should focus on measures such as the need to reduce fishing effort by at least 45 percent to increase the yield per recurit. Strict enforcement of fishery laws is necessary, to sustain the use of available resources; as well as rehabilitation of degraded ecosystem, which affects the fishery resources of Sorsogon Bay, to regain the loss from degradation.
Probability of Capture Two fish species (Sillago ingenuua and Leiognathus splendens) were
caught at sizes (lengths at 50 percent probability of capture or L50) less than half of their length infinity (L∞) (see Table 4). S. ingennua was caught by otter trawl, and L. splendens by stationary lift net. As to their size ratio (L50/L∞), S. ingenuua and L. splendens were observed at 41 percent and 49 percent, respectively. These species have not reached maturity or spawning stage for them to contribute to production.
Similarly, the rest of the species analyzed were caught at an early
stage of maturity, thus contributing to the depletion of future breeders in the biomass. The catch of small sizes of fish was an evidence of the use of fine-meshed nets (from 1.45 cm to less than 3.0 cm). The legal size, under RA 8550, is 3.0 cm.

Assessment of the Fisheries of Sorsogon Bay
22
Table 4
. P
op
ula
tio
n p
ara
me
ters
of
do
min
an
t sp
ecie
s in
So
rso
go
n B
ay (
Ap
ril 2
00
1-M
arc
h 2
00
2).
N
Size at
Lmax Loo
L50/
Loo
K
Z
M
E
F
No.
Gear
SPECIES
Maturity (cm) (cm)
L50
(%) (yr-1) (yr-1) (yr-1) (yr-1) Emax (yr-1) Fmax RP
FINFISHES
TN
Leiognathus splendens
29
,41
0
15
.97
1
5.8
1
8
.84
5
6
1.0
0
4.2
3
2.1
4
0.4
9
0.6
1
2.0
9
3.5
4
2
SLN
Leiognathus splendens
60
,65
0
17
.82
1
8.6
7
9
.24
4
9
0.8
1
7.4
1
1.7
8
0.7
6
0.6
2
5.6
3
2.9
0
2
OT
Leiognathus splendens
31
9
8.0
- 1
4.3
0
14
.05
1
5.3
6
8
.34
5
4
1.5
0
7.2
8
2.7
6
0.6
2
0.5
8
4.5
2
3.8
1
1
GN
Megalaspis cordyla
1
,24
3
27
.1 -
48
.60
3
8.0
9
38
.09
2
1.2
3
56
0
.90
4
.71
1
.57
0
.67
0
.63
3
.14
2
.67
2
OT
Sillago ingennua
2,9
94
9
.60
- 1
7.3
0
26
.70
2
6.4
0
10
.74
4
1
1.1
5
5.0
9
2.0
6
0.6
0
0.5
6
3.0
3
2.6
2
1
HL
Sillago sihama
6,5
91
1
2.5
- 2
2.4
0
29
.32
3
0.9
6
17
.19
5
6
0.9
7
4.8
2
1.7
6
0.6
3
0.6
3
3.0
6
3.0
0
1
TN
Rastrelliger brachysoma
2
47
1
1.5
- 2
0.7
0
25
.89
2
5.6
0
17
.29
6
7
0.6
6
3.2
1
1.4
5
0.5
5
0.6
4
1.7
6
2.5
8
2
SLN
Alepes djedaba
54
,72
2
17
.8 -
31
.90
1
7.5
9
17
.21
9.9
8
58
0
.78
4
.96
1
.77
0
.64
0
.63
3
.19
3
.02
1
INVERTEBRATES
Portunus pelagicus (M)
6,9
64
1
0.6
0
20
.84
2
1.0
9
12
.46
5
9
1.5
8
8.6
2
2.7
0
0.6
9
0.6
3
5.9
2
4.6
0
2
OT
Portunus pelagicus (F)
5,8
78
1
0.4
- 1
3.6
5
19
.41
1
9.3
9
11
.57
6
0
1.5
8
7.6
8
2.7
7
0.6
4
0.6
2
4.9
1
4.7
2
2
Penaeus mergueinsis (M)
2,7
32
N
o d
ata
3
.84
3.9
1
2.2
2
51
1
.40
7
.84
1
.98
0
.75
0
.63
5
.86
3
.37
1
O
T
Penaeus mergueinsis (F)
1,9
31
N
o d
ata
4
.17
4
.37
2
.25
5
2
1.5
0
6.2
4
2.0
5
0.6
7
0.6
1
4.1
9
3.2
1
1
So
urc
e o
f d
ata
on
siz
e a
t m
atu
rity
: F
roe
se
an
d P
au
ly (
20
02
).

Assessment of the Fisheries of Sorsogon Bay
23
0
0.5
1
1.5
2
2.5
3
3.5
4
4.5
0.40 0.45 0.50 0.55 0.60 0.65 0.70
E- values
Fre
qu
en
cy
0
1
2
3
4
5
6
7
8
9
Co
mm
ula
tive
fre
qu
en
cy
frequency
Cum. freq
Table 5. Comparative results on population parameters K (growth) and E (exploitation rate) of Leiognathus splendens and Sillago sihama.
Parameters/Species
This Study
Cinco (1995)
K (Growth) Leiognathus splendens Sillago sihama
0.81-1.50 0.97
0.8 1.4
E-values L. splendens S. sihama
0.49-0.76 0.63
0.48 0.59
Figure 16. Frequency distribution of E values of eight species of finfishes and invertebrates in Sorsogon Bay.

Assessment of the Fisheries of Sorsogon Bay
24
Virtual Population Analysis
Results of the virtual population analysis (VPA) showed that there is a reduction in biomass as fishing intensifies. The results also supported the observations on the 50 percent probability of capture. Fishing mortality was high, with a considerable catch at length classes below 50 percent of the
length infinity (L∞) of a number of species caught by otter trawl (OT) and stationary liftnet (SLN). This was observed in Sillago ingenuua, Portunus pelagicus, Loligo duvauceli and Sepioteuthis lessoniana with high fishing mortality at sizes 12.0 cm (OT), 7.13 cm (OT), 5.5 cm (OT) and 8.0 cm (SLN), and 13.0 cm (SLN), respectively. Loligo duvauceli was already caught at 2.25 cm and Sepioteuthis lessoniana at 5.63 cm. This is alarming, since the known sizes at maturity of these species are 11.50 cm and 10.0 cm, respectively.
However, fishing mortality peaks were also observed for larger sizes
although catch was minimal. The same results came out in the use of trammel net and bottom set gillnet; both gear types utilized netting materials with smaller sizes (0.95-10.16 cm). Hooks of small sizes (#572-# 554) were used in the hook and line.
The results are substantiated by the size distribution of some species
caught by different types of fishing gear (Figs. 17-21). Both finfishes and invertebrates registered a high percentage (21-100 percent) at length below the known maturity size. Relative Yield Per Recruit
The current fishing mortality (F) exerted was higher by 12 percent than the maximum level of fishing mortality (Fmax). This was observed in eight dominant species in which 64 percent of the total mortality was attributed to fishing mortality (F) and 36 percent to natural mortality (M) (Fig. 22). This suggests that all species have already surpassed the allowable limit of exploitation or fishing activities critical in sustaining the resources of the bay.

Assessment of the Fisheries of Sorsogon Bay
25
SM: 17.8-31.9 cm
Alepes djedaba
SM: 11.5-20.7 cm
Rastrelliger brachysoma
SM: 27.1-48.6 cm
Megalaspis cordyla
Figure 17. Size distribution of Alepes djedaba, Rastrelliger brachysoma and Megalaspis cordyla in Sorsogon Bay. (SLN=stationary lift net, GN=gill net, TN =trammel net, FC=fish corral, DGN=drift gillnet.)
0
5
10
15
20
25
30
35
40
45
3.75 5.25 6.75 8.25 9.75 11.25 12.75 14.25 15.75 17.25
Total Length (cm)
Percentage
SLN
-
10
20
30
40
50
60
70
10.25 11.75 13.25 14.75 16.25 17.75 19.25 20.75 22.25 23.75 25.25
Total Length (cm)
Percentage
GN
TN
-
10
20
30
40
50
60
8.25 11.25 14.25 17.25 20.25 23.25 26.25 29.25 32.25
Total Length (cm)
Percentage
FC
SLN
DGN

Assessment of the Fisheries of Sorsogon Bay
26
0
5
10
15
20
25
30
35
40
45
50
5.75 7.75 9.75 11.8 13.8 15.8 17.8 19.8 21.8
Total Length (cm)
Percentage
TN
0
10
20
30
40
50
60
70
3.25 5.25 7.25 9.25 11.25 13.25 15.25 17.25
Total Length (cm)
Percentage
TN
FC
OT
SLN
0
10
20
30
40
50
60
70
80
90
100
12.75 15.25 17.75 20.25 22.75 25.25 27.75 30.25 32.75
Total Length (cm)
Percentage
GN
TN
SM: 13.8-24.8 cm
Gerres oyena
SM: 8.0-14.3 cm
Leiognathus splendens
SM: 40.7 - 73.1 cm
Mugil cephalus
Figure 18. Size distribution of Gerres oyena, Leiognathus splendens and Mugil cephalus in Sorsogon Bay. (TN=trammel net, FC=fish corral, OT=otter trawl, SLN=stationary liftnet, GN=gillnet.)

Assessment of the Fisheries of Sorsogon Bay
27
-
5
10
15
20
25
30
35
40
45
50
10.25 12.25 14.25 16.25 18.25 20.25 22.25 24.25 26.25 28.25
Total Length (cm)
Percentage
HL
TN
-
10
20
30
40
50
60
6.25 9.25 12.25 15.25 18.25 21.25 24.25 27.25 30.25
Total Length (cm)
Percentage
HL
TN
-
10
20
30
40
50
60
70
6.25 8.75 11.25 13.75 16.25 18.75 21.25 23.75 26.25 28.75
Total Length (cm)
Percentage
TN
OT
SM: 9.6-17.3 cm
Sillago ingenuua
SM: 12.5-22.4 cm
Sillago sihama
SM: 16.2-29.1 cm
Terapon jarbua
Figure 19. Size distribution of Sillago ingenuua, S. sihama and Terapon jarbua in Sorsogon Bay. (TN=trammel net, OT=otter trawl, HL=hook and line.)

Assessment of the Fisheries of Sorsogon Bay
28
0
10
20
30
40
50
60
2.75 4.75 6.5 8.25 10 11.8 13.5 15.3 17 18.8
Carapace width (cm)
Percentage
BSGNS
OT
0
5
10
15
20
25
30
35
40
45
50
1 1.4 1.8 2.2 2.6 3 3.4 3.8 4.2 4.6
Carapace length (cm)
Percentage
BSGNS
OT
0
5
10
15
20
25
30
35
40
45
50
2.25 4.25 6.25 8.25 10.3 12.3 14.3 16.3 18.3 20.3
Mantle Length (cm)
Percentage
FC
OT
SLN
SM: 10.4-13.65 cm
Portunus pelagicus
Penaeus merguiensis
SM: 11.50 cm
Loligo duvauceli
Figure 20. Size distribution of Portunus pelagicus, Penaeus merguiensis and Loligo duvauceli in Sorsogon Bay. (BSGN=bottom set gillnet, OT=otter trawl, FC=fish corral, SLN=stationary liftnet.)

Assessment of the Fisheries of Sorsogon Bay
29
0
5
10
15
20
25
30
35
5.75 8.5 11.3 14 16.8 19.5 22.3 25 27.8 30.5
Mantle lengh (cm)
Percentage
SLN
-
20.00
40.00
60.00
80.00
100.00
120.00
L. spl
ende
ns
M. c
ordy
la
S. ing
enuua
S. sih
ama
R. b
rach
ysom
a
A. d
jedab
a
P. pel
agicu
s
P. m
ergui
ensi
s
Species
Percentage
Natural Mortality (M)
Fishing Mortality (F)
SM: 10 cm
Sepioteuthis lessoniana
Figure 21. Size distribution of Sepioteuthis lessoniana in Sorsogon Bay. (SLN=stationary liftnet.)
Figure 22. Mortality parameters of key species from three landing centers in Sorsogon Bay.

Assessment of the Fisheries of Sorsogon Bay
30
CONCLUSION AND RECOMMENDATIONS
The present study revealed observations of heavy fishing pressure and growth overfishing in Sorsogon Bay. These observations confirm earlier findings that the bay is biologically overfished (Ordoñez et al. 1972) and that several dominant demersal fishes have high exploitation rates and fishing mortalities (Cinco 1995, Cinco et al. 1995). The situation is a result of laxity in the implementation of fishery laws, most especially on the operation of otter trawl and the use of fine-meshed nets (0.95-10.16 cm) in gillnet, fish corral and stationary liftnet fishing operations.
To address the problems of overexploitation and growth overfishing of
Sorsogon Bay, the following measures are recommended: a) institutionalization of the Integrated Sorsogon Bay Management
Council;
b) provision of an Integrated Coastal Zone Management Plan;
c) institutional building (strengthening the fisherfolk organizations, and cooperative creation of special bodies, committees/technical working groups and other groups/organizations relevant to fisheries);
d) installation of the following resource management options:
o reduction of fishing effort to an average of 45 percent (number of boats and gross tonnage)
o strict enforcement of fishery laws (regarding the use of fine-
meshed nets, active gear and other destructive fishing operations).
o provision of alternative livelihood programs
o advocacy towards resources conservation and sustainable
development.

Assessment of the Fisheries of Sorsogon Bay
31
REFERENCES Beddington, J. and Cooke. 1983. The potential yield of fish stocks. FAO
Fish. Tech. Pap. (242): 47 p. Cheunpan, A. 1988. An assessment of king mackerel (Scomberomorus
commerson) in the Inner Gulf of Thailand. In: S. Venema, J. Moller-Christensen and D. Pauly (eds.), Contributions to Tropical Fisheries Biology: Papers by the Participants of FAO/DANIDA Follow-up Training Courses, p. 401-410. FAO Fish. Rep. (389): 519 p.
Cinco, E. A. 1995. Population parameters and exploitation ratios of fishes
caught in Sorsogon Bay, Philippines. In: E. A. Cinco (ed.), Resource and Ecological Assessment of Sorsogon Bay, Philippines, Vol. I (Situational Analysis). UB Tech. Inc. FSP/DA.
Cinco, E. A. and I. S. Pamintuan. 1995. A checklist of fishes caught in
Sorsogon Bay, Philippines. In: E. A. Cinco (ed.), Resource and Ecological Assessment of Sorsogon Bay, Philippines, Vol. II (Capture Fish. Assessment Tech. Rep.), p. 79-97.
Cinco, E. A. and L. Perez. 1995. Results of the Sorsogon Bay trawl survey.
In: E. A. Cinco (ed.), Resource and Ecological Assessment of Sorsogon Bay, Philippines, Vol. III (Capture Fish. Assessment Tech. Rep.), p. 88-105.
Cinco, E. A., G. C. Trono, D. J. R. Mendoza, N. Bermas, M. Atrigenio, J.
Concepcion and F. Lapuz, Jr. 1995. Coastal resources management issues/problems. In: E. A. Cinco, P. R. Confiado, G. C. Trono and D. J. R. Mendoza (eds.), Resource and Ecological Assessment of Sorsogon Bay, p. 71-86. UB Tech. Inc. FSP/DA.
Cinco, E. A., L. Perez and R. Gatchalian. 1995. Capture technology in the
municipal fisheries of Sorsogon Bay. In: E. A. Cinco (ed.), Resource and Ecological Assessment of Sorsogon Bay, Philippines, Vol. III (Capture Fisheries Assessment Tech. Rep.), p. 1-17.
____. 1995. Catch and effort in the Sorsogon Bay fisheries. In: E. A. Cinco
(ed.), Resource and Ecological Assessment of Sorsogon Bay, Philippines, Vol. III (Capture Fisheries Assessment Tech. Rep.), p. 52-78.
Cinco, E., F. Lapuz, L. Perez and R. Gatchalian. 1995. Results of fishing
gear inventory in Sorsogon Bay. In: E. A. Cinco (ed.), Resource and Ecological Assessment of Sorsogon Bay, Philippines, Vol. I (Situational Analysis), p. 88-105. UB Tech. Inc. FSP/DA.

Assessment of the Fisheries of Sorsogon Bay
32
Concepcion, G., E. Cinco, G. Trono and D. J. Mendoza. 1995. Management
options and strategies to the coastal resources management of Sorsogon Bay. In: Resource and Ecological Assessment of Sorsogon Bay, Vol. II (Inputs to a management plan for Sorsogon Bay). UB Tech. Inc. FSP/DA.
Corpuz, A., J. Saeger and V. Sambilay. 1985. Population parameters of
commercially important fishes in Philippine waters. University of the Philippines in the Visayas (UPV), Coll. of Fish., Dept. of Mar. Fish., Tech. Rep. (6): 99 p.
Del Mundo, C. M., E. V. Agasen and T. P. Ricablanca. 1990. The marine
shrimp resources of Luzon. Philipp. J. Fish. 21: 45-66. Del Mundo, C. M., E. V. Agasen, L. L. Labe, G. O. Matias and D. F. Gabito.
1992. Commercially important marine bivalves of Sorsogon Bay, Philippines. Philipp. J. Fish. 23: 27-40.
Dwiponggo, A., T. Hariati, S. Banon, M. L. Palomares and D. Pauly. 1986.
Growth, mortality and recruitment of commercially important fishes and penaeid shrimps in Indonesian waters. ICLARM Tech. Rep. 17. 91 p.
Federizon, R. 1993. Using Vital Statistics and Survey Catch Composition
Data for Tropical Multispecies Fish Stock Assessment: Application to the Demersal Resources of the Central Philippines. Doctoral Dissertation, Alfred-Wegener-Institut Fur Polar-Und Meeresforschung, Bremerhaven. 201 p.
Froese, R. and D. Pauly (eds.). 2002. FishBase. World Wide Web electronic
publication. www.fishbase.org, version (2002). Gulland, S. 1971. The Fish Resources of the Oceans. FAO/Fishing News
Books Ltd., Survey, England. Ih-Hsiu, Tung. 1970. Studies on the fishery biology of the grey mullet, Mugil
cephalus, in Taiwan. In: J. C. Marr (ed.), The Kuroshio: A Symposium on Japan Current, p. 491-504. East West Center Press, Honolulu.
Ingles, J. and D. Pauly. 1984. An atlas of growth, mortality and recruitment of
Philippine fishes. ICLARM Tech. Rep. 13. 127 p. Lavapie-Gonzales, F., S. R. Ganaden and F. C. Gayanilo, Jr. 1997. Some
Population Parameters of Commercially-Important Fishes in the Philippines. Fisheries Resources Research Division, BFAR, Metro Manila, Philippines. 114 p.
Legasto, R. M. and C. del Mundo. 1977. On the hydro-biological survey of
Sorsogon Bay for the proposed fish nurseries/reservations. Philipp. J. Fish. 14(1): 23-56.

Assessment of the Fisheries of Sorsogon Bay
33
Ordoñez, J. A., F. M. Arce, R. A. Ganaden and N. N. Metrillo, Jr. 1972. On
the hydro-biological and fisheries survey of Sorsogon Bay, Luzon Island. Proc. 3rd CSK Symposium, Bangkok, Thailand. (Reprinted in Philipp. J. Fish. (1975) 13(2): 178-204.)
Padilla, J. E. 1991. Managing Tropical Multispecies Fisheries with Multiple
Objectives. Doctoral Dissertation, Simon Fraser University. 235 p. Pauly, D. 1980. On the interrelationships between natural mortality,
growth parameters and mean environmental temperature in 175 fish stocks. J. Const. Int. Explor. Mer 39(2): 175-192.
Sambilay, V. Jr. C. 1991. Depth-Distribution Patterns of Demersal Fishes of
the Samar Sea, Philippines, and their Use for Estimation of Mortality. M. Sc. Thesis, UPV. 66 p.
Silvestre, G. T. 1986. Preliminary analysis of the growth, mortality and yield-
per-recruit of ten trawl-caught species from the Samar Sea, Philippines. UPV, Coll. of Fish., Dept. of Mar. Fish., Tech. Rep. (7): 1-41.
Silvestre, G. T. and M. L. Soriano. 1988. Effect of incorporating sigmoid
selection on optimum mesh size estimation for the Samar Sea multispecies trawl fishery. In: S. Venema, J. Moller-Christensen and D. Pauly (eds.), Contributions to Tropical Fisheries Biology: Papers by the Participants of FAO/DANIDA Follow-up Training Courses, p. 482-492. FAO Fish. Rep. (389): 519 p.
Soliman, V. S., R. R. Dioneda, S. G. Borbe, L. M. Alcantara. 1999.
Assessment and management of short-necked clam, Paphia undulata Born (Bivalvia: Veneridae), and blue crab, Portunus pelagicus Linnaeus (Crustacea: Portunidae), in Sorsogon Bay, Philippines. Research and Statistics Center, Bicol University, Legazpi City. p. 1-7.
Supongpan, M. 1986. Assessment of Indian squid (Loligo duvauceli) and
mitre squid (L. chinensis) in the Gulf of Thailand. In: S. C. Venema, J. Moller-Christensen and D. Pauly (eds.), Contributions to Tropical Fisheries Biology: Papers by the Participants of FAO/DANIDA Follow-up Training Courses, p. 25-41. FAO Fish. Rep. (389): 519 p.
Tandog-Edralin, D., S. R. Ganaden and P. Fox. 1988. A comparative study of fish mortality rates in moderately and heavily fished areas of the Philippines. In: S. C. Venema, J. Moller-Christensen and D. Pauly (eds.), Contributions to Tropical Fisheries Biology: Papers by the Participants of FAO/DANIDA Follow-up Training Courses, p. 468-481. FAO Fish. Rep. (389): 519 p.