sound production in piranhas is associated with
TRANSCRIPT

RESEARCH ARTICLE
Sound production in piranhas is associated with modifications ofthe spinal locomotor patternMarine Banse1,*, Boris P. Chagnaud2,3, Alessia Huby1, Eric Parmentier1 and Loïc Kever1,2
ABSTRACTIn piranhas, sounds are produced through the vibration of the swimbladder wall caused by the contraction of bilateral sonic muscles.Because they are solely innervated by spinal nerves, these muscleslikely evolved from the locomotor hypaxial musculature. The transitionfrom a neuromuscular system initially shaped for slow movements(locomotion) to a system that requires a high contraction rate (soundproduction) was accompanied with major peripheral structuralmodifications, yet the associated neural adjustments remain to thisdate unclear. To close this gap, we investigated the activity of both thelocomotor and the sonic musculature using electromyography. Thecomparison between the activation patterns of both systemshighlighted modifications of the neural motor pathway: (1) atransition from a bilateral alternating pattern to a synchronousactivation pattern, (2) a switch from a slow- to a high-frequencyregime, and (3) an increase in the synchrony of motor neuronactivation. Furthermore, our results demonstrate that sound featurescorrespond to the activity of the sonic muscles, as both the variationpatterns of periods and amplitudes of sounds highly correspond tothose seen in the sonic muscle electromyograms (EMGsonic).Assuming that the premotor network for sound production inpiranhas is of spinal origin, our results show that the neural circuitassociated with spinal motor neurons transitioned from the slowalternating pattern originally used for locomotion to a much fastersimultaneous activation pattern to generate vocal signals.
KEY WORDS: Activation patterns, Electromyography, Evolution,Locomotion, Pygocentrus nattereri, Social communication
INTRODUCTIONThe ability to produce sounds for social communication (courtship,spawning, agonistic behavior, competitive feeding, etc.) iswidespread across vertebrates, including fishes. It has evolvedindependently in many phylogenetically distinct fish taxa, hence theexistence of several types of sound-producing mechanisms (Fineand Parmentier, 2015). In line with the diversity of sound-production mechanisms comes a variety of neuronal circuitorganizations and activation patterns (for review, see Ladich and
Bass, 1998; Carlson and Bass, 2000; Ladich and Bass, 2005). Whileour knowledge about these neuronal circuits is often limited to thelocation of the motor neurons innervating the sound-producingmuscles, with some notable exceptions (Bass et al., 2015), theactivation patterns recorded at the muscles or the nerves innervatingthose muscles allow us to readily identify some shared and divergentproperties of the sound-generating circuits.
One of the mechanisms to produce such acoustic signalsoriginates from contractions of paired muscles associated with theswim bladder (Parmentier and Fine, 2016). In piranhas, these sonicmuscles insert on transverse enlargements at the base of the secondribs articulating on the third vertebrae and are connected with acommon broad tendon that surrounds the swim bladder ventrally(Ladich and Bass, 2005). Piranha sonic muscles are solelyinnervated by spinal nerves (third, fourth and fifth), meaning thatall vocal motor neurons (ca. 150 per vocal muscle) are located in thespinal cord (Ladich and Bass, 2005; Onuki et al., 2006). In manyother sonic teleosts, sonic swim bladder muscles are innervated byoccipital nerve roots or by a combination of spinal and occipitalnerve roots (for review, see Ladich and Bass, 1998, 2005).
The sonic ability in piranhas apparently resulted from anexaptation process (Mélotte et al., 2019), i.e. the development ofa new function in structures originally shaped for a different purpose(Parmentier et al., 2017). Sonic muscles in piranhas likely originatedfrom modifications of the locomotor hypaxial musculature (Mélotteet al., 2019) as supported by their innervation pattern, composed ofspinal nerves only. These recent findings raise an interestingquestion: which changes to the sound-producing muscles and theirunderlying neural circuit are required to transition a system initiallyinvolved in slowmovements (locomotion) to be able to generate fastmovements – a prerequisite for swim bladder sound production(Fine et al., 2001; Fine, 2012)?
To perform high-speed contractions necessary to become sonic,skeletal muscles usually have to undergo a series of modifications.For instance, they may be characterized by: (1) a reduction in fiberdiameter (Tavolga, 1964; Fine et al., 1990; Parmentier and Diogo,2006); (2) a restricted quantity of myofibrils (Rome et al., 1996;Millot and Parmentier, 2014; Parmentier et al., 2021); and/or (3) anincrease in sarcoplasmic reticulum volume (Fawcett and Revel,1961; Revel, 1962; Josephson and Young, 1985; Appelt et al.,1991; Schaeffer et al., 1996; Rome and Lindstedt, 1998; Syme andJosephson, 2002). Many sonic muscles also have an increasedproportion of mitochondria (Rome et al., 1996; Schaeffer et al.,1996) if sustained calling performances are required (Millot andParmentier, 2014; Nelson et al., 2018; Parmentier et al., 2021). Thesonic muscles of the red-bellied piranha Pygocentrus nattereri showall of the listed adaptative anatomical features (Millot andParmentier, 2014). By bilaterally stimulating the vocal musclesand simultaneously recording vibrations of the swim bladder wall,Millot et al. (2011) moreover highlighted the ability of sonicmuscles to contract at high speed because their contraction rate canReceived 30 January 2021; Accepted 10 March 2021
1Laboratoire de Morphologie Fonctionnelle et Evolutive, Universite de Lie ge, 4000Liege, Belgium. 2Department Biology II, Ludwig-Maximilians-University Munich,82152 Planegg, Germany. 3Institute for Biology, Karl-Franzens-University Graz,8010 Graz, Austria.
*Author for correspondence ([email protected])
M.B., 0000-0001-9689-1079; B.P.C., 0000-0001-5939-8541; A.H., 0000-0002-7547-0125; E.P., 0000-0002-0391-7530; L.K., 0000-0003-3672-5348
This is an Open Access article distributed under the terms of the Creative Commons AttributionLicense (http://creativecommons.org/licenses/by/4.0), which permits unrestricted use,distribution and reproduction in any medium provided that the original work is properly attributed.
1
© 2021. Published by The Company of Biologists Ltd | Journal of Experimental Biology (2021) 224, jeb242336. doi:10.1242/jeb.242336
Journal
ofEx
perim
entalB
iology

reach frequencies (e.g. 150 Hz) higher than the pulse rate of natural‘bark’ sounds. Furthermore, high-speed sonic muscles could beskeletal muscles that were delayed in their normal development(Millot and Parmentier, 2014).Modifications relative to the neural circuit and the activation
patterns are, however, more enigmatic. The paired sonic musclescontract synchronously in batrachoidids, such as in the plainfinmidshipman Porichthys notatus (Bass and Baker, 1991), whereassound production in the sea robin Prionotus carolinus is generatedby an alternating contraction pattern (Bass and Baker, 1991;Connaughton, 2004). In both systems, the innervation pattern of thesonic muscles originates from occipital nerve roots (Evans, 1973;Bass and Baker, 1991, 1997) and the evolutionary origin of thesemuscles remains uncertain. In contrast, the origin of vocal muscleshas been most likely unraveled in piranhas (Mélotte et al., 2019), butthe activation pattern remains to be determined.As piranha motor neurons are exclusively spinal and thus most
likely evolved directly from locomotor motor neurons, one wouldexpect a typical alternate activation of the left and right sonicmuscles as shown for the sea robin, for instance (e.g. Bass andBaker, 1991). Kastberger (1981b) challenged this postulate byshowing that electrical stimulation of the piranha medulla inducedsynchronous contractions of the left and right sonic muscles inSerrasalmus serrulatus. He suggested the existence of strongelectrical coupling of the motor neurons in the vocal system ofpiranhas, similar to the one seen in toadfishes (Bass and Baker,1990; Bass et al., 1994), which could, however, not beexperimentally verified in P. nattereri and Serrasalmus rhombeus(Ladich and Bass, 2005).Assuming that the electrical stimulation ofthe medulla has not resulted in an artificial activation pattern inS. serrulatus, the simultaneous activation of vocal muscles in thisspecies suggests either that simultaneous contractions of the sonicmuscles evolved through different neural paths in piranhas andmidshipman, or that P. nattereri and S. rhombeus, but notS. serrulatus, have retained the primitive activation pattern of fishlocomotor muscles.The objective of this study was to establish whether the
contractions of the left and right sonic muscles in P. nattereri aresynchronous or alternating as would be expected from a locomotor-derived spinal central pattern generator in carangiform swimmingfishes. Using electromyography, we recorded for the first time theactivation patterns of both sonic muscles during voluntary soundproduction in piranhas as well as the activity of locomotor musclesduring swimming. We took advantage of these data to investigatethe link between the activation pattern of the sonic muscles and theacoustic features of the ‘bark’ sound (i.e. signal duration, number ofpulses, variation in periods, amplitudes and latencies). Assumingthat the premotor network for sound production in piranhas is ofspinal origin, our results suggest that part of the neural circuitassociated with spinal motor neurons transitioned from the typicalslow alternating pattern originally used for locomotion to a muchfaster simultaneous activation pattern to generate vocal signals.
MATERIALS AND METHODSAnimalsEight specimens of the red-bellied piranha (Pygocentrus nattereri,Kner 1858) [135–178 mm standard length (SL)] were purchasedfrom ‘Les aquariums de Marbais’ (Belgium) and housed in theLaboratory of Functional and Evolutionary Morphology (LiegeUniversity, Belgium). As sexual dimorphism has never beenreported in their sound-producing apparatus and all individualsproduce similar ‘bark’ sounds when hand-held, sex was not
determined. Fish were maintained in an 840 l freshwater tank at26°C (12 h:12 h light:dark cycle) and fed three times a week withfrozen mussels. All procedures were approved by the ethicalcommission of Liege University (protocol 2110).
ElectromyographyThe red-bellied piranha produces at least three types of sounds withtwo different mechanisms (Millot et al., 2011). Whereas ‘types 1and 2’ sounds are produced by rapid contractions of sound-producing muscles, ‘type 3’ sounds are produced by a rapidsnapping of the jaws. We focused here on this first sound type, alsocalled ‘bark’ sound, composed of several pulses (Millot et al.,2011). This sound is mostly produced during frontal displaybetween two individuals in free-swimming fish (Millot et al., 2011)and when being hand-held (Markl, 1971; Kastberger, 1981a,b;Mélotte et al., 2016).
EMG recordings were carried out in an 84 l tank with bipolarelectrodes fashioned from Synflex enameled copper wires (50 µmouter diameter, 40 µm core diameter; Bervaes & Fils SA, Liege,Belgium), following the method described by Parmentier et al.(2013). Fish were anesthetized with MS-222, removed from waterand covered with wet paper tissue to avoid desiccation during theprocedure of EMG electrode implantation. Electrode wires weresecured to the dorsal fin with a suture and cyanoacrylate glue(histoacryl adhesive glue). Every fish could recover from theanesthesia for∼15 min before the recordings started. Every fish wastested individually and water from the home tank was used to fill theexperimental tank before each trial. Two specimens out of the eightwere used in both experiments.
For sonic muscle electromyograms (EMGsonic), two electrodeswere implanted in the left and right sonic muscles and one electrodewas placed as a reference in the epaxial musculature, dorso-caudallyto the sonic muscles (i.e.∼2 cm above and 1 cm behind the tip of thefirst electrodes). Individuals were gently held in the experimenterhand to stimulate voluntary sound production while simultaneouslyrecording both the emitted sounds and the activity of the muscles.During sound production, we were able to record signals from bothsonic muscle electrodes in four out of six specimens. In the othertwo fish, we obtained signals from one of the two sonic muscleelectrodes. After examination of all sounds and EMGsonic signals,we concluded that for these trials, one electrode was not recording,most likely because it was not well inserted into the sonic muscle.Our conclusion is supported by two observations. (1) In ourrecordings, every sound pulse was preceded by an EMGsonic peak.In case of alternance, this is not the pattern we should have observedbut instead one EMGsonic peak every two sound pulses. (2) Soundsgenerated with one or two sonic muscles are expected to show somedifferences but sound signals associated with the EMGs recorded foronly one or the two sonic muscles were highly similar (see Fig. S1).
For locomotion-related EMGs (i.e. locomotor muscleelectromyograms, EMGloco), we bilaterally recorded the activityof the anterior and caudal body musculature during freelyswimming behavior. Two electrodes were placed into the left andright hypaxial musculature (i.e. just below the lateral line, on avertical axis at the position of the rostral end of the dorsal fin) andtwo electrodes into the left and right musculature of the caudalpeduncle, as close as possible to the midline. The swimmingbehavior was induced by generating a water current in the tank (i.e.water flowing through a tube connected to a tank with a higher waterlevel was used to avoid electrical noise generated by pumps).During this experiment, we simultaneously recorded signals fromthe four electrodes in one individual and signals from the pair of
2
RESEARCH ARTICLE Journal of Experimental Biology (2021) 224, jeb242336. doi:10.1242/jeb.242336
Journal
ofEx
perim
entalB
iology

electrodes inserted into the caudal and anterior body musculature inone and two individuals, respectively. The absence of signals fromthe second pair of electrodes in the latter fishes could be due to: (1)the electrodes not properly recording, as concluded for the EMGsonic
signals; or (2) the muscles in one of the two areas not being activated(e.g. some swimming behaviors may only require activation of themuscles in the peduncle). Moreover, some electric noise sometimesprevented the signals from being analyzed. A variety of muscle-activation patterns could be detected in fish (e.g. station holding,orientation behavior, swimming). Here, we only focused onswimming patterns.The signals from the EMG electrodes were amplified 1000 or
10,000 times based on their intensity, band passed (10−10,000 Hz)and notched filtered (50 Hz) with a differential amplifier (AMSystems model 1700, Sequim, WA, USA). A USB sound card(Motu UltraLite-mk4, Cambridge, MA, USA) digitized the EMGactivity at a sampling rate of 44,100 Hz in Adobe Audition 2.0software (Adobe, San Jose, CA, USA). Sounds were recorded with ahydrophone (sensitivity: −163.7 dB re. 1 V μPa−1; HTI-96-MinSeries; High tech, MS, USA) connected to a Tascam DR-05 digitalaudio recorder (Wiesbaden, Germany) and routed to a channel of theUSB sound card so that sounds and EMGs were synchronized.After the EMG experiments, the fish were euthanized with an
overdose of MS-222 and the electrode wires were cut 1 cm awayfrom the skin. Electrode location was then checked usingdissections or computed tomography. Four fishes were scanned(Scanner Siemens Somaton Sensation 16-slice, Siemens AG,München; maximal resolution of the isotropic voxel: 600 µm) atthe Veterinary Institute of the University of Liege. For twospecimens, electrodes and morphological structures of interestwere reconstructed in AMIRA (version 6.2.0) for illustrationpurposes.EMGs and sound recordings were manually investigated using
the software Avisoft-SAS Lab Pro 5.2.13 (Avisoft Bioacoustics,Glienicke, Germany). Sixty sounds (‘barks’) recorded from sixindividuals (10 sounds per individual) and the associated EMGsonic
were analyzed. Four variables were measured from the signals(Fig. 1): (1) event duration (defined as the beginning of the firstpulse to the end of the last pulse, ms); (2) number of pulses in asignal; (3) pulse periods (measured as the peak-to-peak intervalsbetween two consecutives pulses, ms); and (4) pulse amplitudes (the
maximum amplitude of each pulse). The latency between theEMGsonic and the sound was also measured (as the peak-to-peakinterval between the EMGsonic pulse or activation potential and thehighest peak of the respective pulse in the sound, ms). Sonic musclesynchronization was assessed by measuring the time lag betweenactivation potentials of the left and right EMGsonic signals(Nsignals=40, Nfish=4). We also measured the activation rate onboth sides of the rostral and/or caudal musculature (Nevents=40, 1 sper event, Nfish=4) and the signal-to-noise ratios (SNRs), measuredas the differences between the highest peak in EMGsonic or in a 1 swindow of EMGloco and the highest peak in a same durationwindow in the background noise preceding each signal in EMGsonic
(Nsignals=60, Nfish=6), or in the same swimming event in EMGloco
(Nevents=40, 1 s per event, Nfish=4). The temporal relationshipbetween the activation of the ipsilateral rostral and caudal locomotormusculature was also measured (Nevents=10, 1 s per event, one side).
Statistical analysesFor all statistical tests, Shapiro–Wilk tests were first used to examinethe distribution of the data. Sometimes, normality could be reachedusing log transformations. When the assumption of normality wasmet, Levene’s tests were performed to assess the assumption ofhomoscedasticity. This allowed us to decide if parametric or non-parametric tests should be used in the analyses. We first performedan unpaired t-test to compare the activation rates of the sonic andlocomotor muscles, and an unpaired Welch’s t-test to compare theirSNRs because variances were unequal. In addition to these tests, weperformed an analysis of covariance (ANCOVA) to test the effect ofthe signal type (sound versus EMGsonic signal) and SL on theduration of the signals. We also built statistical models to testwhether the selected parameters (signal type, SL and ‘rank’ whenappropriate) have an effect on the number of pulses, periods andamplitudes. The choice of each model was based on the type of datato analyze and their distribution. The selected models were thosethat best fitted the data as well as their respective predictions. Foreach response variable, the best model required, as independentvariables, both the signal type and SL to properly describe the data.The predictor variable ‘rank’, hereafter explained, was also requiredin the models for periods and amplitudes. It allowed us to investigatethe temporal variation patterns of periods and amplitudes within thesignals and to compare these patterns between sounds and
Event duration
Pulse amplitude
Pulse 6
Period 1
R1
R2
R3
R1
R4 R5
R5 R6 R7 R8 R9
R10
R10
Fig. 1. Variables measured on the waveform of aPygocentrus nattereri sound. Sound composed of 13pulses, duration (ms), periods (measured as the peak-to-peak intervals between two consecutive pulses, ms)and pulse amplitudes. Ranks were used to describeamplitude, period and sonic muscle electromyograms(EMGsonic)-sound latency modulations within signals.The rank assigned to each pulse of the presented soundis also indicated and varies from R1 to R10. They wereassigned to the pulses based on the relative position ofeach pulse in the sound, using this formula: relativeposition of a pulse=(absolute position of the pulse –
absolute position of first pulse) / (absolute position of thelast pulse – absolute position of the first pulse). SeeMaterials and Methods, ‘Statistical analysis’; Table S1.
3
RESEARCH ARTICLE Journal of Experimental Biology (2021) 224, jeb242336. doi:10.1242/jeb.242336
Journal
ofEx
perim
entalB
iology

EMGsonic. For the number of pulses, we built a generalized linearmodel (GLM) using the glm function for Poisson family with a log-link function as this model type is the most suitable for count data.The model that fitted the best periods data under repeated musclecontractions within signals was an exponential decay model as usedby Morel et al. (2019) and Sheng et al. (2021) to model musclefatigue (i.e. the decay in maximum force produced by muscles)under repeated contractions. Therefore, we built a Gamma GLMwith a log-link function using the glm function. The dispersionparameter was fixed to one. Finally, for normalized amplitude(explained below), we ran a second-order polynomial model usingthe lm function. The variable ‘rank’ was used as the second-degreeterm.Because signals were composed of 9–17 pulses, sorting the data
from the different variables (i.e. period, amplitude, latency) basedon the absolute pulse position within an event (i.e. a sound) wouldhave impaired the description of the variation patterns. Therefore,each pulse within a signal was assigned to a rank ranging from 1 to10 based on its relative position [relative position of apulse=(absolute position of the pulse–absolute position of firstpulse)/(absolute position of the last pulse–absolute position of thefirst pulse)] (Fig. 1; Table S1). In addition, relative amplitudes ofsounds and EMGsonic were normalized to allow the comparison ofamplitude modulations between these signal types. First, the‘amplitude delta’ of each pulse in a signal was calculated bysubtracting the amplitude of the smallest pulse in the signal from theamplitude of every other pulse. Second, for each signal type, the‘amplitude deltas’ were normalized using the formula:
Normalized amplitude ¼ ðamplitude delta� amplitude deltaminÞ=ðamplitude deltamax � amplitude deltaminÞ: ð1Þ
For the comparison between the features of the EMGsonic and thesound waves, the number of pulses, the duration of the signals andthe periods were measured on the EMG of one sonic muscle becauseactivation potentials were highly similar and synchronized in bothsonic muscles (i.e. a peak in the EMGsonic of one of the two muscleswas always synchronous with a peak in the EMGsonic of the muscleon the other side). Amplitudes were, however, averaged from theEMG traces of both sonic muscles as they often differed between theleft and right sides.Using a Kruskal–Wallis test, variation in latencies within the
signals was investigated based on the rank they were assigned to.Because we observed variations in periods, amplitudes and latencieswithin the signals, Dunn’s tests for multiple pairwise comparisonswere run between ranks for each signal. Alpha levels were adjustedwith a Bonferroni correction for multiple testing. All statistical testswere performed in R (version 1.2.1335). Results are presented asmeans±s.d. Significance level was determined at P<0.05.
RESULTSSonic EMG analysisDuring sound production, EMGsonic potentials could be detectedfrom both the right and left sonic muscles. Their EMGs (EMGsonic)were characterized by short (2.83±1.13 ms,Nsounds=10,Nfish=4) butlarge amplitude pulses (SNR: 32.23±12.76), suggesting that musclefibers on each side of the body were activated synchronously(Fig. 2A,B). Both sides were also highly synchronized, as theaverage time lag between the activation potentials on either side was∼0.3 ms (0.26±0.28 ms). The contraction frequency of the sonicmuscles, calculated as the proportional inverse of the period,reached on average 78.77±18.66 Hz. The EMGsonic activation
potentials each preceded a sound pulse (Fig. 2B) that lagged onaverage 2.15±0.74 ms.
While there is a significant effect of SL on the number of pulses inthe signals (Table 1, P<0.01), we did not find an effect of the signaltype (Table 1, P>0.05). Similarly, the results of the ANCOVAshowed that the signal type did not affect the duration of the signals(Table 2, P>0.05) nor did SL (Table 2, P>0.05). These data showthat the two signals do not differ in terms of duration (respectively,180.95±27.10 ms and 173.03±26.82 ms for sounds and EMGsonic
signals) nor in their number of pulses (respectively, 13.4±1.82 and12.72±1.81 for sounds and EMGsonic signals). Note that a smallerpulse associated with no activation potential was frequentlyobserved at the end of the sounds (Fig. 2B, black arrow). Soundsand EMGsonic signals do not differ either (Table 3, P>0.05) in theirperiods (respectively, 13.95±6.11 ms and 14.03±6.28 ms). Theseresults support the hypothesis that each sound pulse results from asimultaneous activation potential in both sonic muscles. Sounds andaveraged EMGsonic signals differed in their normalized amplitude(Table 4, P<0.0001). Finally, both periods and normalizedamplitude vary with SL (Tables 3 and 4; P<0.05). We found thatwith an increasing size, the duration of the signals remains stablewhile the number of pulses and the normalized amplitude increaseand the periods decrease.
Both periods and normalized amplitude also vary along thesignals (Tables 3 and 4; P<0.0001). The pulse period decreased overthe course of the first half of the sound and EMGsonic signals(Fig. 2C). Rank 1 periods were longer than rank 3–10 periods inboth sound and EMGsonic signals. Similarly, ranks 2 and 3 periodswere, respectively, longer than rank 4–10 periods and rank 5–10periods in both signals. Finally, ranks 4 and 5 periods were,respectively, longer than rank 6–10 and rank 8–9 periods in bothsound and EMGsonic signals (Dunn’s multiple comparison tests,P<0.05; Table S2). Although normalized amplitude was differentbetween the sounds and averaged EMGsonic signals, a similarpattern of variation was observed within sounds and EMGsonic
(Fig. 2C): normalized amplitude increased, reached a plateau andthen decreased. Averaged EMGsonic normalized amplitude,however, reached a plateau earlier in the signals compared withsounds. For both the sounds and averaged EMGsonic signals,significance tests showed that rank 1 normalized amplitude wassmaller than all the other ranks whereas ranks 2–10 normalized
Table 1. Estimated regression parameters, standard errors (s.e.),z-values and P-values for the Poisson GLM
Estimate s.e. z-value P-value
Intercept 0.974 0.571 1.705 0.088Signal type 0.052 0.051 1.036 0.300SL 0.011 0.004 2.758 0.006
The model was calculated with the number of pulses in the signals as thedependent variable and signal type and standard length (SL) as independentvariables. Significant P-values are in bold. GLM, generalized linear model.
Table 2. Estimated regression parameters, standard errors (s.e.),t-values and P-values for the ANCOVA on the effect of the signal typeand standard length (SL) on the duration of the signals
Estimate s.e. t-value P-value
Intercept 4.993 0.311 16.04 <0.0001Signal type 0.046 0.028 1.652 0.101SL 0.001 0.002 0.479 0.633
The duration of the signals was the dependent variable. Signal type was usedas fixed factor and SL as a continuous independent variable. Significant P-values are in bold.
4
RESEARCH ARTICLE Journal of Experimental Biology (2021) 224, jeb242336. doi:10.1242/jeb.242336
Journal
ofEx
perim
entalB
iology

amplitudes did not differ. The only difference between the twotypes of signals was observed for rank 2 normalized amplitudebeing, in sound, smaller than rank 10 normalized amplitude(Dunn’s multiple comparison tests, P<0.01; Table S2). TheEMGsonic-sound latencies measured between rank 1 pulses were
significantly longer than those measured for the other ranks(Fig. 2C; Kruskal–Wallis test, P<0.0001; Dunn’s multiplecomparison tests, P<0.0001; Table S2).
Sound
Right
Left
cc
SM SE RRE SB
A B Left SM
0.25 s
RE T
Sound
Average SMLeft
Right
C
Sound production
110
15
Perio
d (m
s) 20
25
0Nor
mal
ized
am
plitu
de
0.2
0.4
2.0
Late
ncy
(ms)
2.5
3.0
10 ms
2 3 4 5 6Ranks
7 8 9 10 1 2 3 4 5 6Ranks
7 8 9 10 1 2 3 4 5 6Ranks
7 8 9 10
Fig. 2. Activation patterns of the sonicmuscles inPygocentrus nattereri. (A) Left lateral (top) and dorsal (bottom) views of the location of the EMG recording)electrodes and morphological structures of interest during the recording of the sonic muscles. All 3D reconstructions were done using AMIRA (version 6.2.0). R,ribs; RE, reference electrode; SB, swim bladder; SE, sonic muscle electrode; SM, sonic muscle; T, tag name of the individual. (B) EMGs of the sonic muscles(EMGsonic) and waveform of the associated sound. The activation potentials of the two sonic muscles are highly synchronized. The vertical dashed bars indicatecorrelated peaks between sound and EMGsonic. The small arrow in the sound trace indicates the additional pulse with respect to the EMGsonic. (C) Variation inaverage period (gray line, sound; red line, sonic muscle), normalized amplitude (gray line, sound; orange and red dashed lines, right and left sonic muscles,respectively; solid red line, average of the two sonic muscles) and latency between sound and EMGsonic pulses. Ranks correspond to the normalized positions ofthe pulses in the signals.
Table 3. Estimated regression parameters, standard errors (s.e.),z-values and P-values for the Gamma GLM
Estimate s.e. z-value P-value
Intercept 4.251 0.599 7.096 <0.0001Signal type −0.004 0.053 −0.080 0.936SL −0.009 0.004 −2.149 0.032Rank −0.720 0.085 −8.483 <0.0001
The model was calculated with periods as the dependent variable and signaltype, standard length (SL) and ‘rank’ as independent variables. SignificantP-values are in bold. GLM, generalized linear model.
Table 4. Estimated regression parameters, standard errors (s.e.),z-values and P-values for the second-order polynomial model
Estimate s.e. z-value P-value
Intercept −1.435 0.151 −9.493 <0.0001Signal type −0.057 0.012 −4.902 <0.0001SL 0.011 0.001 9.967 <0.0001Rank 2.603 0.069 37.56 <0.0001Rank2 −1.985 0.067 −29.73 <0.0001
The model was calculated with normalized amplitude as the dependentvariable and signal type, standard length (SL) and ‘rank’ as independentvariables. The variable ‘rank’ was used as the second-degree term. AdjustedR2=0.68. Significant P-values are in bold.
5
RESEARCH ARTICLE Journal of Experimental Biology (2021) 224, jeb242336. doi:10.1242/jeb.242336
Journal
ofEx
perim
entalB
iology

Locomotor EMG analysisBoth the rostral and caudal locomotor muscle pairs exhibited analternate pattern of contraction (i.e. one side of the body contracted at atime) during swimming activity (Fig. 3A,B). The swimming frequencyof locomotor muscles varied from 2.5 to 6 Hz (3.77±0.73 Hz,Nevents=40, 1 s per event, Nfish=4) and was consistent between therostral and caudal musculature (Nevents=10, 1 s per event, Nfish=1).In comparison to sonic muscles (78.77±18.66 Hz), the activation
rate of locomotor muscles was thus more than 20 times lower (t-test,P<0.0001) (Fig. 3C). The mean SNR recorded for EMGloco
(11.79±6.59) was also more than 2 times lower than that of theEMGsonic (32.23±12.76) (Welch’s t-test, P=0.01) (Fig. 3C), most
likely because EMG traces in the locomotor muscles werecomposed of asynchronous activation potentials (Fig. 3B). Weobserved an averaged delay of 63.14±29.31 ms (range: 6–138 ms)between the activation of the ipsilateral rostral and caudal locomotormusculature; a common observation during undulatory activity inthe spinal cord (Grillner and Kashin, 1976).
DISCUSSIONLocomotor circuits as ancestors of vocal circuitsIn most fishes using trunk and caudal fin movements for undulatorypropulsion, swimming is generated by alternating contractions ofthe locomotor muscles on both sides of the body (Grillner and
Locomotion
A B
C
TE PE
T Left LM
Left
Right
100
50
Activ
atio
n ra
te (H
z)
0
60
** ***
40
20
SNR
0LM SM LM SM
0.25 s
100 ms
Fig. 3. Activation patterns of the locomotor muscles in Pygocentrus nattereri. (A) Left lateral (top) and dorsal (bottom) views of the location of the EMGrecording electrodes and morphological structures of interest during the recording of the locomotor muscles. All 3D reconstructions were done using AMIRA(version 6.2.0). PE, electrode located in the caudal musculature; T, tag name of the individual; TE, electrode located in the rostral hypaxial musculature. (B) EMGsof the hypaxial locomotor musculature (EMGloco). The vertical dashed bars indicate the start of correlated activation potentials in the left andright locomotor muscles and highlights their alternate activation pattern. (C) Boxplots representing the signal-to-noise ratio (SNR) and activation rate of the sonicmuscles (SM, n=4) and hypaxial locomotor muscles (LM, n=6). The box boundaries represent the first and third quartiles, the whiskers indicate theminimum andmaximum values, and the lines indicate themedians. The asterisks indicate how statistically significant the differences were between the locomotorand sonic muscles: **P≤0.01; ***P<0.001).
6
RESEARCH ARTICLE Journal of Experimental Biology (2021) 224, jeb242336. doi:10.1242/jeb.242336
Journal
ofEx
perim
entalB
iology

Kashin, 1976) induced by spinal locomotor networks (Kiehn,2016). Our results show that red-bellied piranhas also employ analternating pattern for the generation of locomotor activity, asexpected for carangiform swimming.Although sonic muscles in piranhas likely originated from
hypaxial locomotor muscles (Mélotte et al., 2019) and are alsoinnervated by spinal nerves (Ladich and Bass, 2005; Onuki et al.,2006), our results demonstrate that these muscles involved in soundproduction are synchronously activated. How did a locomotorsystem get transformed into a sonic system? Three majormodifications between the locomotor and the sonic systemsbecame apparent from our experiments: (1) a transition from abilateral alternating to a synchronous activation pattern; (2) a switchfrom a slow- to a high-frequency regime; and (3) an increase in thesynchrony of motor neuron activation, as shown by the large andshort activation potentials in the EMGs of the sonic muscles.These modifications directly relate to the different requirements
for locomotion and acoustic communication. Whereas EMGloco aremostly characterized by broad activation potentials, suggestingasynchronous activations of the fibers within each locomotormuscle, the EMGs of the sonic muscles are characterized by shortbut large activation potentials, which infer synchronous fiberactivation within each muscle; a feature detected in other fishes andrattlesnakes (e.g. Cohen and Winn, 1967; Schaeffer et al., 1996).This transition from activation patterns allowing strengthmodulations (which are necessary for proper locomotion) to aprecise synchronous activation pattern of sonic muscle fibers is aprerequisite to generate high-frequency sound pulses, as the muscleactivation times must be short. Synchronous fiber activations withineach sonic muscle, together with the simultaneous bilateral musclecontraction, likely increase the strength of the sonic musclecontractions, the amplitude of displacement of the swim bladderwall and consequently the uniform compression of the swimbladder. These features allow piranha sonic muscles to generatesounds with adequate amplitude and propagation distance despite alower proportion of myofibrils than that of the epaxial locomotormusculature (see Millot and Parmentier, 2014 for muscle fiberhistology). Superfast sonic muscles and associated spinal motorneurons of piranhas probably evolved under multiple constraints.Here, we present three hypotheses that could explain the reason forthis shift from a slow- to a high-frequency regime. (1) Best hearingsensitivity in piranhas is between 50 and 900 Hz (Mélotte et al.,2018). The shift towards the generation of higher-frequency signalscould be the result of natural selection for individuals producingmore audible signals. (2) The shallow water habitats (i.e. freshwaterrivers and streams) of piranhas have high attenuation rates for lowfrequencies (Rogers and Cox, 1988). On rocky bottoms, the cut-offfrequency (i.e. the lowest frequency that can propagate in a specificaquatic environment) decreases from∼300 Hz in 1 mwater depth to∼30 Hz in 10 mwater depth (Rogers and Cox, 1988). Therefore, theproduction of higher-frequency sounds in piranhas could also be theresult of selection for signals with larger propagation distances.(3) Finally, Fine et al. (2001) showed that the electrically stimulatedsonic muscles of the toadfish Opsanus tau produce maximal soundamplitude and swim bladder wall displacement at frequencies in thevicinity of the fundamental frequency of its boatwhistle (i.e. 150–270 Hz). However, they also found that, despite a significant drop inswim bladder wall displacements for muscle stimulations over150 Hz, the swim bladder actually becomes more efficient (i.e.larger sound amplitude/swim bladder velocity ratios) at higherfrequencies (optimum: 400 Hz). In the red-bellied piranha, Millotet al. (2011) showed that the displacements of the swim bladder wall
dropped when sonic muscle stimulations increase from 1 to 150 Hz,yet the loud ‘bark’ sounds are produced at ∼120 Hz. As it wassuggested for toadfish (Fine et al., 2001), the piranha swim bladdermay be more efficient at high frequency. Therefore, individuals withfaster sonic muscles could have been selected because their sound-producing system could be more efficient. These hypotheses are notmutually exclusive.
Such adjustments (i.e. increased frequency, permanent synchronousactivation of muscle fibers) surely required the reorganization of a partof the ancestral locomotor circuit (motor neurons and interneurons) tobecome sonic. Observations in both vertebrates and invertebrates (Katz,2016) showed that small genetic changes (e.g. gene alteration orsuppression) can induce rewiring responsible for alteration of motorbehaviors. In mice, for instance, a modification of the neuralorganization of interneurons (i.e. spinal neurons crossing the midlineinstead of remaining ipsilateral) in spinal circuits caused a shift from analternating to a synchronous (i.e. hopping) gait (Kullander et al., 2003).Similar changes might have also occurred in piranhas.
Vocal neural circuit organization across fishesSynchronous contraction of the sonic muscles has been observed inmany of the fish species studied, such as for the toadfishes P.notatus (Cohen and Winn, 1967) and O. tau (Tower, 1908;Skoglund, 1961; Elemans et al., 2014), the weakfish Cynoscionregalis (Connaughton et al., 2000) and the pigfish Congiopodusleucopaecilus (Packard, 1960). In toadfishes, the neural circuitassociated with the paired sonic muscles is characterized by a largemidline vocal motor nucleus (VMN) divided in a left and right poolof sonic motor neurons (each one innervating their respectiveipsilateral muscle) whose dendrites extend bilaterally (Fig. 4; Basset al., 1994). Such an organization likely facilitates a concurrentactivation of both muscles, as motor neurons of either populationshare the input of their premotor neurons (Bass and Baker, 1990;Chagnaud et al., 2011). Unlike toadfishes, the activation pattern ofthe sea robin P. carolinus is alternate (Connaughton, 2004) and themotor neurons innervating the right and left sonic muscles arelargely separated on each ventrolateral side of the spinal cord(Fig. 4; Bass and Baker, 1991), which, strictly on anatomical terms,does not facilitate a simultaneous activation. As for the sea robin, thedendrites of the sonic motor neurons in P. nattereri do not extendbilaterally (Fig. 4; Ladich and Bass, 2005; Onuki et al., 2006).Vocal motor neurons in piranhas thus represent a mix of bothconditions, as the neurons are located in two separate but centro-lateral-oriented VMN, each of them innervating the sonic muscle onone side of the body (Fig. 4; Ladich and Bass, 2005; Onuki et al.,2006). Furthermore, the anatomical organization of the sound-producing mechanism in a pair of extrinsic sonic muscles located oneach side of the swim bladder and connected with a broad tendonsurrounding the swim bladder ventrally in piranhas (Ladich andBass, 2005) supports the synchronous contraction of these muscles.Indeed, one would expect this system to be more efficient if, asshown here, both muscles contract simultaneously to evenlypressure the swim bladder to produce sounds.
The role of premotor neurons in maintaining synchrony betweenthe two VMN and therefore between the sonic muscles on oppositesides of the body has been supported by studies on batrachoidids(Bass and Baker, 1990; Bass et al., 1994). In P. notatus, thesynchronous contraction of the sonic muscles is ensured by anelectrical coupling of vocal motor neurons through bilateral inputsfrom premotor neurons adjacent to the VMN (Bass and Baker,1990; Bass et al., 1994). In P. nattereri, the lack of apparentelectrical coupling between motor neurons suggests that the bilateral
7
RESEARCH ARTICLE Journal of Experimental Biology (2021) 224, jeb242336. doi:10.1242/jeb.242336
Journal
ofEx
perim
entalB
iology

synchronization of the sonic muscles is ensured by chemicalcoupling only via shared premotor neuronal inputs to sonic motorneurons. In the lamprey, glutamatergic neurons whose axonscross the midline (commissural neurons) are thought to play arole in promoting left–right synchrony (Grillner, 2003).Similarly, left–right alternation in young tadpoles and adult
lampreys is thought to be organized by inhibitory glycinergiccommissural neurons (Grillner, 2003; Roberts et al., 2008).Transitions of bilaterally alternating to simultaneouslycontracting patterns readily occur in spinal systems, such as indeveloping Xenopus tadpoles, that modify their locomotor stylefrom undulating to kicking (Beyeler et al., 2008).
Piranha
Sea robin Toadfish
VMNv VMNcl VMNm
Left sonic
Right sonic
Left sonicLeft sonic
Locomotion Sound production
Right locomotor
Left locomotor
Right sonicRight sonic
Fig. 4. Schematic representation of the vocalmotor neurons location in the hindbrain and spinal cord of themidshipman fishP. notatus, the red-belliedpiranha P. nattereri and the sea robin P. carolinus and of the activation patterns of the associated muscles. The neural organization of thevocal motor neurons of the three species and the activation patterns of the sonic muscles of P. notatus and P. carolinus are based on Bass and Baker (1991) andLadich and Bass (2005). The location of locomotor motor neurons of P. nattereri and the activation patterns of the associated muscles are also depicted. In thedrawings of the spinal cord, colors indicate motor neurons of the left (red) and right (orange) sonic muscles and of the left (green) and right (blue) locomotormuscles. The same colors were used for the EMGs. The large black arrow indicates the transition from the alternate pattern of activity in the locomotor pathwayin P. nattereri to the synchronous pattern of activity used in acoustic communication. VMN, vocal motor nuclei; v, ventral; cl, centro-lateral; m, midline.
8
RESEARCH ARTICLE Journal of Experimental Biology (2021) 224, jeb242336. doi:10.1242/jeb.242336
Journal
ofEx
perim
entalB
iology

Comparison between sound features and sonic activitySound features reflected the activity of the sonic muscles, as soundduration, the number of pulses and pulse periods varied according tothe duration, number of pulses and pulse periods of EMGsonic
signals. In both sounds and EMGsonic, pulse period decreased overthe course of the first half of the signals. Amplitudes of the firstranks were also smaller than those of the successive ranks. Theseresults are in agreement with other studies on piranhas (Mélotteet al., 2016) and toadfishes (Fine et al., 2001) where the first soundpulses were characterized by longer periods and smaller amplitudesthan the following pulses. Furthermore, we found that the first rankEMGsonic-sound latency was longer than the following latencies.Fine et al. (2001) proposed that the longer duration and loweramplitude of the first activation potentials could be due to the initialtiming in the release and reuptake of calcium from the sarcoplasmicreticulum during the first contractions cycles. Electrophysiologicalrecordings from vocal motor neurons in midshipman fish suggestthat synchronous activity in the motor neuron pool driving the sonicmuscles, essential in the aforementioned timing, must first beestablished (Chagnaud et al., 2012).In the present study, normalized amplitude was different between
the sounds and the averaged EMGsonic but the variation patternwithin the signals was similar: amplitude increased, reached aplateau and then decreased. This interesting observation suggeststhat the number of vocal muscle fibers synchronously activatedvaries during the sound’s emission. Indeed, the small activationpotentials and pulse amplitudes recorded at the beginning of a soundmay indicate that only few motor neurons are activated at this stage.In the middle portion of the sound, the number of activated motorneurons would then gradually increase until a majority of them areactivated, which correlates to the plateau in the EMGsonic pulseamplitude. Such an activation mechanism can be explained by thedifferential recruitment of motor neurons according to the sizeprinciple (Henneman and Mendell, 1981), and as previouslysuggested for the toadfish vocal system (Chagnaud et al., 2012).The size principle predicts that smaller motor neurons are activatedbefore larger ones due to their higher input resistance (increasedexcitability). For comparable excitatory synaptic currents, they thustend to depolarize more and fire earlier than larger motor neurons(Henneman and Mendell, 1981). As vocal motor neurons inpiranhas show a range of sizes (Onuki et al., 2006), this assumptionseems appropriate.The fast decrease in vibrations of the swim bladder wall following
the stop of electrical stimulation of the sonic muscles in P. nattereritestifies the highly damped structure of the swim bladder in piranhas(Millot et al., 2011). However, the small additional pulse observedat the end of most sounds with respect to the EMGsonic activityprobably corresponds to the expansion of the swim bladder that isreturning to its original position after complete relaxation of thesonic muscles (Fine et al., 2001).
ConclusionHow do novel behaviors arise from pre-existing substrates? Ourcomparison between sonic and locomotor activation patternshighlights the modifications of the neural motor pathway thataccompanied the suggested and highly supported exaptation processenabling sound production from originally hypaxial locomotormuscles in piranhas. Due to the spinal origin of piranha motorneurons and the most probable shared ancestry of their sonicmuscle, piranhas make an ideal model to study evolutionarytransitions of motor behaviors, here locomotor to sonic. Futurestudies should aim at determining the changes undergone at the
premotor circuit level and the accompanying changes in intrinsicproperties of the neurons within these two different networks.
AcknowledgementsWe thank G. Bolen who kindly helped with CT scans carried out at the VeterinaryInstitute of the University of Lie ge, and V. Ambroise for his help with the statisticalmodels.We are also grateful to Dr M. Bothe for his fruitful comments on an advancedversion of the manuscript. Finally, we thank the Editor and the three anonymousreferees for their suggestions and constructive remarks which helped improve themanuscript.
Competing interestsThe authors declare no competing or financial interests.
Author contributionsConceptualization: M.B., B.P.C., E.P., L.K.; Methodology: M.B., B.P.C., E.P., L.K.;Formal analysis: M.B.; Investigation: M.B., A.H., L.K.; Resources: B.P.C., E.P.;Writing - original draft: M.B.; Writing - review & editing: B.P.C., A.H., E.P., L.K.;Visualization: M.B., L.K.; Supervision: L.K.; Project administration: B.P.C., E.P.;Funding acquisition: B.P.C., E.P.
FundingThis study was supported by grants from the Fonds De La Recherche Scientifique(FNRS, no. T.0101.15) and by the Deutsche Forschungsgemeinschaft (DFGCRC870 /TP B17 - 118803580) to B.P.C. Deposited in PMC for immediate release.
ReferencesAppelt, D., Shen, V. and Franzini-Armstrong, C. (1991). Quantitation of Ca
ATPase, feet and mitochondria in superfast muscle fibres from the toadfish,Opsanus tau. J. Muscle Res. Cell Motil. 12, 543-552. doi:10.1007/BF01738442
Bass, A. H. and Baker, R. (1990). Sexual dimorphisms in the vocal control systemof a teleost fish: morphology of physiologically identified neurons. J. Neurol. 21,1155-1168. doi:10.1002/neu.480210802
Bass, A. H. and Baker, R. (1991). Evolution of homologous vocal control traits.Brain Behav. Evol. 38, 240-254. doi:10.1159/000114391
Bass, A. H. and Baker, R. (1997). Phenotypic specification of hindbrainrhombomeres and the origins of rhythmic circuits in vertebrates. Brain Behav.Evol. 50, 3-16. doi:10.1159/000113351
Bass, A. H., Marchaterre, M. A. andBaker, R. (1994). Vocal-acoustic pathways in ateleost fish. J. Neurosci. 14, 4025-4039. doi:10.1523/JNEUROSCI.14-07-04025.1994
Bass, A. H., Chagnaud, B. P. and Feng, N. Y. (2015). Comparative neurobiology ofsound production in fishes. InSound Communication in Fishes (ed. F. Ladich), pp.35-75. Vienna: Springer.
Beyeler, A., Metais, C., Combes, D., Simmers, J. and Le Ray, D. (2008).Metamorphosis-induced changes in the coupling of spinal thoraco-lumbar motoroutputs during swimming in Xenopus laevis. J. Neurophysiol. 100, 1372-1383.doi:10.1152/jn.00023.2008
Carlson, B. A. and Bass, A. H. (2000). Sonic/vocal motor pathways in squirrelfish(Teleostei, Holocentridae). Brain Behav. Evol. 56, 14-28. doi:10.1159/000006674
Chagnaud, B. P., Baker, R. and Bass, A. H. (2011). Vocalization frequency andduration are coded in separate hindbrain nuclei. Nat. Commun. 2, 346. doi:10.1038/ncomms1349
Chagnaud, B. P., Zee, M. C., Baker, R. and Bass, A. H. (2012). Innovations inmotoneuron synchrony drive rapid temporal modulations in vertebrate acousticsignaling. J. Neurophysiol. 107, 3528-3542. doi:10.1152/jn.00030.2012
Cohen, M. J. andWinn, H. E. (1967). Electrophysiological observations on hearingand sound production in the fish, Porichthys notatus. J. Exp. Zool. 165, 355-369.doi:10.1002/jez.1401650305
Connaughton, M. A. (2004). Sound generation in the searobin (Prionotuscarolinus), a fish with alternate sonic muscle contraction. J. Exp. Biol. 207,1643-1654. doi:10.1242/jeb.00928
Connaughton, M. A., Taylor, M. H. and Fine, M. L. (2000). Effects of fish size andtemperature on weakfish disturbance calls: implications for the mechanism ofsound generation. J. Exp. Biol. 203, 1503-1512.
Elemans, C. P. H., Mensinger, A. F. and Rome, L. C. (2014). Vocal productioncomplexity correlates with neural instructions in the oyster toadfish (Opsanus tau).J. Exp. Biol. 217, 1887-1893. doi:10.1242/jeb.097444
Evans, R. R. (1973). The swimbladder and associated structures in western Atlanticsea robins (Triglidae). Copeia 1973, 315-321. doi:10.2307/1442970
Fawcett, D. W. and Revel, J. P. (1961). The sarcoplasmic reticulum of a fast-actingfish muscle. J. Biophys. Biochem. Cytol. 10, 89-109. doi:10.1083/jcb.10.4.89
Fine, M. L. (2012). Swimbladder sound production: the forced response versus theresonant bubble. Bioacoustics 21, 5-7. doi:10.1080/09524622.2011.647453
Fine, M. L. and Parmentier, E. (2015). Mechanisms of fish sound production. InSound Communication in Fishes (ed. F. Ladich), pp. 77-126. Vienna: Springer.
9
RESEARCH ARTICLE Journal of Experimental Biology (2021) 224, jeb242336. doi:10.1242/jeb.242336
Journal
ofEx
perim
entalB
iology

Fine, M. L., Burns, N. M. and Harris, T. M. (1990). Ontogeny and sexualdimorphism of sonic muscle in the oyster toadfish. Can. J. Zool. 68, 1374-1381.doi:10.1139/z90-205
Fine, M. L., Malloy, K. L., King, C., Mitchell, S. L. and Cameron, T. M. (2001).Movement and sound generation by the toadfish swimbladder. J. Comp. Physiol.A 187, 371-379. doi:10.1007/s003590100209
Grillner, S. (2003). The motor infrastructure: from ion channels to neuronalnetworks. Nat. Rev. Neurosci. 4, 573-586. doi:10.1038/nrn1137
Grillner, S. and Kashin, S. (1976). On the generation and performance ofswimming in fish. In Neural Control of Locomotion (ed. R. M. Herman, S. Grillner,P. S. G. Stein and D. G. Stuart), pp. 181-201. New York: Plenum.
Henneman, E. and Mendell, L. M. (1981). Functional organization of motoneuronpool and its inputs. In Handbook of Physiology, Sect. 1, Vol. 2, The NervousSystem (ed. V. E. Brooks), pp. 423-507. Bethesda, MD: American PhysiologicalSociety.
Josephson, R. K. and Young, D. (1985). A synchronous insect muscle with anoperating frequency greater than 500 Hz. J. Exp. Biol. 118, 185-208.
Kastberger, G. (1981a). Economy of sound production in piranhas (Serrasalminae,Characidae): I. Functional properties of sonic muscles. Zool. Jb. Physiol. 85,113-125.
Kastberger, G. (1981b). Economy of sound production in piranhas (Serrasalminae,Characidae): II. Functional properties of sound emitter. Zool. Jb. Physiol. 85,383-411.
Katz, P. S. (2016). Evolution of central pattern generators and rhythmic behaviours.Phil. Trans. R. Soc. B Biol. Sci. 371, 20150057. doi:10.1098/rstb.2015.0057
Kiehn, O. (2016). Decoding the organization of spinal circuits that controllocomotion. Nat. Rev. Neurosci. 17, 224-238. doi:10.1038/nrn.2016.9
Kullander, K., Butt, S. J. B., Lebret, J. M., Lundfald, L., Restrepo, C. E.,Rydstrom, A., Klein, R. and Kiehn, O. (2003). Role of EphA4 and EphrinB3 inlocal neuronal circuits that control walking. Science 299, 1889-1892. doi:10.1126/science.1079641
Ladich, F. and H. Bass, A. (1998). Sonic/vocal motor pathways in catfishes:comparisons with other teleosts. Brain Behav. Evol. 51, 315-330. doi:10.1159/000006545
Ladich, F. and Bass, A. H. (2005). Sonic motor pathways in piranhas with areassessment of phylogenetic patterns of sonic mechanisms among teleosts.Brain Behav. Evol. 66, 167-176. doi:10.1159/000087157
Markl, H. (1971). Schallerzeugung bei piranhas (Serrasalminae, Characidae).Z. Vergl. Physiol. 74, 39-56. doi:10.1007/BF00297789
Melotte, G., Vigouroux, R., Michel, C. and Parmentier, E. (2016). Interspecificvariation of warning calls in piranhas: a comparative analysis. Sci. Rep. 6, 36127.doi:10.1038/srep36127
Melotte, G., Parmentier, E., Michel, C., Herrel, A. and Boyle, K. (2018). Hearingcapacities and morphology of the auditory system in Serrasalmidae (Teleostei:Otophysi). Sci. Rep. 8, 1281. doi:10.1038/s41598-018-19812-1
Melotte, G., Raick, X., Vigouroux, R. and Parmentier, E. (2019). Origin andevolution of sound production in Serrasalmidae. Biol. J. Linn. Soc. 128, 403-414.doi:10.1093/biolinnean/blz105
Millot, S. and Parmentier, E. (2014). Development of the ultrastructure of sonicmuscles: a kind of neoteny ? BMCEvol. Biol. 14, 24. doi:10.1186/1471-2148-14-24
Millot, S., Vandewalle, P. and Parmentier, E. (2011). Sound production in red-bellied piranhas (Pygocentrus nattereri, Kner): an acoustical, behavioural andmorphofunctional study. J. Exp. Biol. 214, 3613-3618. doi:10.1242/jeb.061218
Morel, B., Lapole, T., Liotard, C. and Hautier, C. (2019). Critical peripheral fatiguethresholds among different force-velocity conditions: an individual-based modelapproach. Front. Physiol. 10, 875. doi:10.3389/fphys.2019.00875
Nelson, F. E., Hollingworth, S., Marx, J. O., Baylor, S. M. and Rome, L. C. (2018).Small Ca2+ releases enable hour-long high-frequency contractions inmidshipmanswimbladder muscle. J. Gen. Physiol. 150, 127-143. doi:10.1085/jgp.201711760
Onuki, A., Ohmori, Y. and Somiya, H. (2006). Spinal nerve innervation to the sonicmuscle and sonic motor nucleus in red piranha, Pygocentrus nattereri(Characiformes, Ostariophysi). Brain Behav. Evol. 67, 111-122. doi:10.1159/000089185
Packard, A. (1960). Electrophysiological observations on a sound-producing fish.Nature 187, 63-64. doi:10.1038/187063a0
Parmentier, E. and Diogo, R. (2006). Evolutionary trends of swimblader soundmechanisms in some teleost fishes. In Communication in Fishes (ed. F. Ladich,S. P. Collin, P. Moller and B. G. Kapoor), pp. 45-70. Enfield, NH: SciencePublishers.
Parmentier, E. and Fine, M. L. (2016). Fish sound production: insights. InVertebrate Sound Production and Acoustic Communication (ed. R. A. Suthers,W. T. Fitch, R. R. Fay and A. N. Popper), pp. 19-49. Vienna: Springer.
Parmentier, E., Kever, L., Boyle, K., Corbisier, Y.-E., Sawelew, L. and Malavasi,S. (2013). Sound productionmechanism inGobius paganellus (Gobiidae). J. Exp.Biol. 216, 3189-3199. doi:10.1242/jeb.087205
Parmentier, E., Diogo, R. and Fine, M. L. (2017). Multiple exaptations leading tofish sound production. Fish Fish. 18, 958-966. doi:10.1111/faf.12217
Parmentier, E., Marucco Fuentes, E., Millot, M., Raick, X. and Thiry, M. (2021).Sound production, hearing sensitivity, and in-depth study of the sound-producingmuscles in the cowfish (Lactoria cornuta). J. Anat. 238, 956-969. doi:10.1111/joa.13353
Revel, J. P. (1962). The sarcoplasmic reticulum of the bat cricothyroid muscle.J. Cell Biol. 12, 571-588. doi:10.1083/jcb.12.3.571
Roberts, A., Li, W.-C. and Soffe, S. R. (2008). Roles for inhibition: studies onnetworks controlling swimming in young frog tadpoles. J. Comp. Physiol. A 194,185-193. doi:10.1007/s00359-007-0273-3
Rogers, P. H. and Cox, M. (1988). Underwater sounds as a biological stimulus. InSensory biology of aquatic animals (ed. J. Atema, R. R. Fay, A. N. Popper andW. N. Tavolga), pp. 131-149. Vienna: Springer.
Rome, L. C. and Lindstedt, S. L. (1998). The quest for speed: muscles built forhigh-frequency contractions. News Physiol. Sci. 13, 261-268. doi:10.1152/physiologyonline.1998.13.6.261
Rome, L. C., Syme, D. A., Hollingworth, S., Lindstedt, S. L. and Baylor, S. M.(1996). The whistle and the rattle: the design of sound producing muscles. Proc.Natl. Acad. Sci. USA 93, 8095-8100. doi:10.1073/pnas.93.15.8095
Schaeffer, P. J., Conley, K. E. and Lindstedt, S. L. (1996). Structural correlates ofspeed and endurance in skeletal muscle: the rattlesnake tailshaker muscle.J. Exp. Biol. 199, 351-358.
Sheng, Z., Sharma, N. and Kim, K. (2021). Ultra-high-frame-rate ultrasoundmonitoring of muscle contractility changes due to neuromuscular electricalstimulation. Ann. Biomed. Eng. 49, 262-275. doi:10.1007/s10439-020-02536-7
Skoglund, C. R. (1961). Functional analysis of swim-bladder muscles engaged insound production of the toadfish. J. Biophys. Biochem. Cytol. 10, 187-200. doi:10.1083/jcb.10.4.187
Syme, D. A. and Josephson, R. K. (2002). How to build fast muscles: synchronousand asynchronous designs. Integr. Comp. Biol. 42, 762-770. doi:10.1093/icb/42.4.762
Tavolga, W. N. (1964). Sonic characteristics and mechanisms in marine fishes. InMarine Bio-Acoustics (ed. W. N. Tavolga), pp. 195-211. NewYork, NY: PergamonPress.
Tower, R. W. (1908). The production of sound in the drumfishes, the sea robin andthe toadfish. Ann. N. Y. Acad. Sci. 18, 149-180. doi:10.1111/j.1749-6632.1908.tb55101.x
10
RESEARCH ARTICLE Journal of Experimental Biology (2021) 224, jeb242336. doi:10.1242/jeb.242336
Journal
ofEx
perim
entalB
iology

Figure S1. Comparison between the sound waveform obtained when only the EMG of one sonic muscle (SM) was
recorded and the sound waveform obtained when the EMGs of the two SM were recorded in Pygocentrus nattereri. Note
that the two sound waveforms are very similar. Grey line, sound; orange and red lines, right and left sonic muscles, respectively.
Journal of Experimental Biology: doi:10.1242/jeb.242336: Supplementary information
Jour
nal o
f Exp
erim
enta
l Bio
logy
• S
uppl
emen
tary
info
rmat
ion
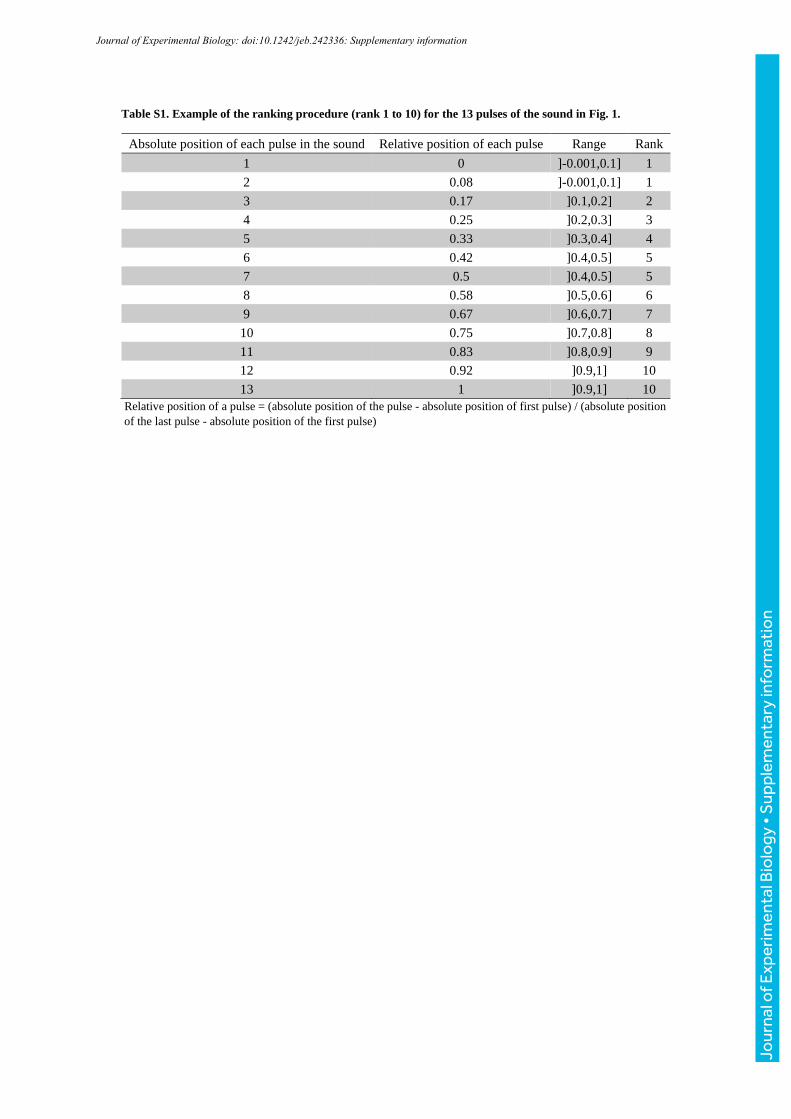
Table S1. Example of the ranking procedure (rank 1 to 10) for the 13 pulses of the sound in Fig. 1.
Absolute position of each pulse in the sound Relative position of each pulse Range Rank
1 0 ]-0.001,0.1] 1
2 0.08 ]-0.001,0.1] 1
3 0.17 ]0.1,0.2] 2
4 0.25 ]0.2,0.3] 3
5 0.33 ]0.3,0.4] 4
6 0.42 ]0.4,0.5] 5
7 0.5 ]0.4,0.5] 5
8 0.58 ]0.5,0.6] 6
9 0.67 ]0.6,0.7] 7
10 0.75 ]0.7,0.8] 8
11 0.83 ]0.8,0.9] 9
12 0.92 ]0.9,1] 10
13 1 ]0.9,1] 10
Relative position of a pulse = (absolute position of the pulse - absolute position of first pulse) / (absolute position
of the last pulse - absolute position of the first pulse)
Journal of Experimental Biology: doi:10.1242/jeb.242336: Supplementary information
Jour
nal o
f Exp
erim
enta
l Bio
logy
• S
uppl
emen
tary
info
rmat
ion

Table S2. Comparisons between periods, normalized amplitudes and latencies within sounds and (averaged) EMGsonic
signals based on the rank they were assigned to.
Rank periods (sound) 1 2 3 4 5 6 7 8 9
2 NS - - - - - - - -
3 <0.0001 NS - - - - - - -
4 <0.0001 0.0029 NS - - - - - -
5 <0.0001 <0.0001 0.0027 NS - - - - -
6 <0.0001 <0.0001 <0.0001 0.0314 NS - - - -
7 <0.0001 <0.0001 <0.0001 0.0007 NS NS - - -
8 <0.0001 <0.0001 <0.0001 <0.0001 0.0064 NS NS - -
9 <0.0001 <0.0001 <0.0001 <0.0001 0.0002 NS NS NS -
10 <0.0001 <0.0001 <0.0001 0.0003 NS NS NS NS NS
Rank periods (EMGsonic) 1 2 3 4 5 6 7 8 9
2 NS - - - - - - - -
3 <0.0001 NS - - - - - - -
4 <0.0001 0.0263 NS - - - - - -
5 <0.0001 <0.0001 0.0059 NS - - - - -
6 <0.0001 <0.0001 <0.0001 0.0082 NS - - - -
7 <0.0001 <0.0001 <0.0001 0.0006 NS NS - - -
8 <0.0001 <0.0001 <0.0001 <0.0001 0.029 NS NS - -
9 <0.0001 <0.0001 <0.0001 <0.0001 0.0029 NS NS NS -
10 <0.0001 <0.0001 <0.0001 <0.0001 NS NS NS NS NS
Rank normalized
amplitudes (sound) 1 2 3 4 5 6 7 8 9
2 0.0066 - - - - - - - -
3 <0.0001 NS - - - - - - -
4 <0.0001 NS NS - - - - - -
5 <0.0001 NS NS NS - - - - -
6 <0.0001 NS NS NS NS - - - -
7 <0.0001 NS NS NS NS NS - - -
8 <0.0001 NS NS NS NS NS NS - -
9 <0.0001 NS NS NS NS NS NS NS -
10 <0.0001 0.0014 NS NS NS NS NS NS NS
Rank normalized
amplitudes (EMGsonic) 1 2 3 4 5 6 7 8 9
2 0.0003 - - - - - - - -
3 <0.0001 NS - - - - - - -
4 <0.0001 NS NS - - - - - -
5 <0.0001 NS NS NS - - - - -
6 <0.0001 NS NS NS NS - - - -
7 <0.0001 NS NS NS NS NS - - -
8 <0.0001 NS NS NS NS NS NS - -
9 <0.0001 NS NS NS NS NS NS NS -
10 <0.0001 NS NS NS NS NS NS NS NS
Rank latencies 1 2 3 4 5 6 7 8 9
2 <0.0001 - - - - - - - -
3 0.0004 NS - - - - - - -
4 <0.0001 NS NS - - - - - -
5 <0.0001 NS NS NS - - - - -
6 <0.0001 NS NS NS NS - - - -
7 <0.0001 NS NS NS NS NS - - -
8 <0.0001 NS NS NS NS NS NS - -
9 <0.0001 NS NS NS NS NS NS NS -
10 <0.0001 NS NS NS NS NS NS NS NS NS, Non-Significant differences. Values in bold indicate significant differences. Results refer to the Dunn’s multiple
comparison tests. Significance level was determined at P<0.05.
Journal of Experimental Biology: doi:10.1242/jeb.242336: Supplementary information
Jour
nal o
f Exp
erim
enta
l Bio
logy
• S
uppl
emen
tary
info
rmat
ion