sound source field verification (ssv) for seic 2010 astokh...
TRANSCRIPT
WGWAP 9/14
WESTERN GRAY WHALE ADVISORY PANEL WGWAP 9/14 9th Meeting 4-6 December 2010 PUBLIC ENGLISH
SEIC 2010 Astokh 4D Seismic Survey
Seismic Sound Source Verification (SSV) report v2.0
Submitted by: SEIC
Astokh 4D Seismic Survey SSV Report v2.0 22-Nov-10
1
Seismic Sound Source Verification (SSV), SEIC 2010 Astokh 4D Seismic Survey Summary Report Version 2.0 Date: 22 November 2010
Prepared By: Pacific Oceanological Insitute, FEBRAS, Russian Federation and JASCO Appplied Sciences, Canada
1. Objectives and Scope
The objective of the Sound Source Verification (SSV) study discussed in this brief report was to measure underwater acoustic levels as a function of distance in the broadside direction from the Astokh 4D seismic survey operations, and thus confirm or revise the conservatively estimated marine mammal exclusion zone radii used in the early portions of the survey. Acoustic recordings were collected on three dedicated mini-AUAR recorders (Pacific Oceanological Institute). The acoustic recordings were processed upon retrieval of the units to compute distances (radii) corresponding to the marine mammal exclusion sound
level thresholds of 180 and 190 dB re Pa rms for cetaceans and pinnipeds used in general practice for implementing shut-down criteria during surveys. The primary goals of the SSV measurements were:
To estimate from direct measurements the 180 and 190 dB re Pa (rms) distances in the broadside direction.
To update the safety radii predicted by pre-season modelling with the corresponding distances from the measurements.
To communicate the adjusted radii to marine mammal observers who will be implementing the safety/exclusion zones.
This expanded second version of the report contains an additional section presenting a more accurate calculation of the relationship between range and levels at the three mini-AUAR sites, making use of geographic tracking data for the seismic survey vessel that were decoded in post-processing from logged AIS (Automatic Identification System) records.
2. Deployment Configuration
The deployment configuration of the SSV acoustic recorders was defined to capture sound levels as a function of distance broadside of the array (perpendicular to shooting direction). The figure on the next page shows a large-scale view of the work area, seismic survey area and mini-AUAR deployment locations. The latter are also shown in greater detail in the inset map and their coordinates are listed in the subsequent table. The mini-AUARs were aligned along a perpendicular to the seismic survey lines.
On 17 June 2010 the seismic vessel sailed from north to south along the most eastern traverse of the survey pattern, identified as 1462A in the seismic operation plan, performing a full geophysical data acquisition (in other words the SSV was conducted during a regular survey line). The line began approximately 1.5 km from the point of closest approach to the row of SSV recorders and extended about 13.5 km past it. Only the shot levels recorded at the closest point of approach were analyzed for the purpose of the SSV study.

Astokh 4D Seismic Survey SSV Report v2.0 22-Nov-10
2
AUAR SSV Deployment Layout SSV transit line markers and AUAR recorder locations for SSV study.
UTM Easting UTM Northing Latitude Longitude
Line Start Point 677032 5849856 52°46’10.1”N 143°37’27.2”E Closest Point of Approach 677277 5848478 52°45’25.3”N 143°37’37.5”E Line End Point 679636 5835236 52°38’14.4”N 143°39’17.2”E mAUAR M1 – 0.75km offset 676539 5848347 52°45'21.9"N 143°36'58.0"E mAUAR M2 – 1.5 km offset 675800 5848215 52°45'18.5"N 143°36'18.3"E mAUAR M3 – 3.0 km offset 674324 5847952 52°45'11.7"N 143°34'59.2"E
Astokh 4D Seismic Survey SSV Report v2.0 22-Nov-10
3
3. Initial Calculation of Safety Radii
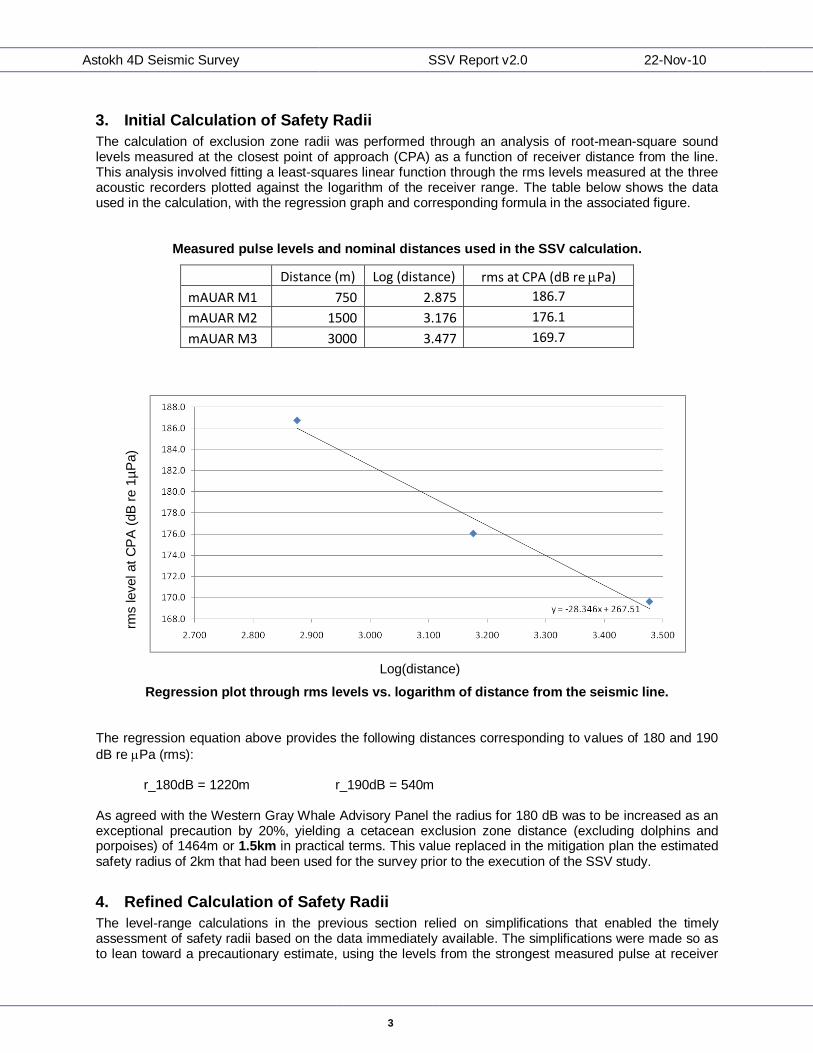
The calculation of exclusion zone radii was performed through an analysis of root-mean-square sound levels measured at the closest point of approach (CPA) as a function of receiver distance from the line. This analysis involved fitting a least-squares linear function through the rms levels measured at the three acoustic recorders plotted against the logarithm of the receiver range. The table below shows the data used in the calculation, with the regression graph and corresponding formula in the associated figure.
Measured pulse levels and nominal distances used in the SSV calculation.
Distance (m) Log (distance) rms at CPA (dB re Pa)
mAUAR M1 750 2.875 186.7
mAUAR M2 1500 3.176 176.1
mAUAR M3 3000 3.477 169.7
rms level at
CP
A (
dB
re 1
µP
a)
Log(distance)
Regression plot through rms levels vs. logarithm of distance from the seismic line. The regression equation above provides the following distances corresponding to values of 180 and 190
dB re Pa (rms):
r_180dB = 1220m r_190dB = 540m As agreed with the Western Gray Whale Advisory Panel the radius for 180 dB was to be increased as an exceptional precaution by 20%, yielding a cetacean exclusion zone distance (excluding dolphins and porpoises) of 1464m or 1.5km in practical terms. This value replaced in the mitigation plan the estimated safety radius of 2km that had been used for the survey prior to the execution of the SSV study.
4. Refined Calculation of Safety Radii
The level-range calculations in the previous section relied on simplifications that enabled the timely assessment of safety radii based on the data immediately available. The simplifications were made so as to lean toward a precautionary estimate, using the levels from the strongest measured pulse at receiver

Astokh 4D Seismic Survey SSV Report v2.0 22-Nov-10
4
M1 as the seismic source transited past the line of recorders. The corresponding range from source to receivers was taken to be the nominal deployment setback of each sensor from the seismic line, which constituted a close approximation given the positional accuracy. At a later date, precise navigational information for the seismic survey vessel was obtained from stored AIS records. This enabled a more formal computation of the level-range formula based on regression through the measured levels for several pulses near CPA, which accounts for pulse strength variability.
The figure below shows the measured rms pulse levels at the three sensors M1-M3 over a period of a few minutes just after the start of the seismic line, as the source passes the CPA. The irregular strength of the pulses, most likely attributable to small operating variations between the two airgun arrays being fired in alternating sequence, is clearly observable through much of these traces.
rms level (d
B r
e 1
µP
a)
Local time (17-Jun-2010)
Received rms levels at the three mAUAR sensors over the period surrounding the CPA. The AIS positional information for the seismic vessel was compensated for the layback of the source from the nominal GPS location of the ship by simply offsetting the time base of the positional data so that the geographic CPA coincided with the well-defined culm of the sound level trace at the proximal sensor M1. This equivalencing of layback with time delay is justifiable over an analysis period spanning only a few minutes, over which the speed of the seismic vessel can be considered to be constant. A subset of received pulse levels at the three sensors for a few consecutive pulses on either side of the CPA time, along with the corresponding computed distances between the seismic source and each of the sensors, was used as the basis for the level-range regression. The subset of levels was truncated at a roll-off of 3 dB from the CPA maximum on receiver M1 and replicated with the same temporal bounds for the other two sensors.
The table on the next page summarizes the pulse levels and ranges used in the regression analysis. The triplet of levels that were used in the original calculation of safety radii described in the previous section is higlighted for reference.

Astokh 4D Seismic Survey SSV Report v2.0 22-Nov-10
5
Measured pulse levels and GPS based ranges used in the refined SSV calculation.
mAUAR M1 mAUAR M2 mAUAR M3
rms (dB re Pa) Range (m) rms (dB re Pa) Range (m) rms (dB re Pa) Range (m)
185.5 781.5 174.8 1527.2 170.2 3023.2
185.4 778.6 175.6 1525.8 168.9 3022.6
186.5 776.6 174.8 1524.8 170.1 3022.2
184.8 774.5 176.5 1523.8 169.2 3021.9
186.7 773.4 176.1 1523.2 169.7 3021.7
184.8 772.3 176.1 1522.7 168.7 3021.6
186.4 771.9 175.8 1522.5 169.7 3021.6
186.2 771.9 176.3 1522.5 169.3 3021.8
186.4 772.3 177.2 1522.7 169.9 3022.0
185.3 773.4 177.2 1523.3 169.8 3022.4
185.1 774.5 176.4 1523.9 170.0 3022.8
186.7 776.5 177.1 1525.0 170.2 3023.5
185.3 778.2 176.7 1525.9 170.2 3024.0
186.3 781.4 175.4 1527.5 170.6 3025.0 In the figure below the massed data in the table are plotted as a semi-log graph of level vs. range; the best-fit regression (solid straight line) and corresponding formula are also shown.
rms level (d
B r
e 1
µP
a)
Distance (m)
Semi-log regression through rms levels vs. range from the source, along with 90% excess line.
The best-fit equation above yields the following distances for values of 180 and 190 dB re Pa (rms):
r_180dB = 1205m r_190dB = 517m These ranges are consistent with the safety radii obtained from the initial analysis (prior to adjustment).

Astokh 4D Seismic Survey SSV Report v2.0 22-Nov-10
6
Whereas for the 2010 Astokh 4D survey the computed safety radius for 180 dB was subjected to an ad hoc precautionary adjustment of 20% as recommended by the Western Gray Whale Advisory Panel, an established standard practice to provide conservative safety range estimates in SSV studies is to adjust upward the best fit function (by adding an offset to the constant term) so that the line exceeds 90% of the measured data. This 90% excess line (dashed) and corresponding formula are also presented in the figure on the previous page. Based on this approach the precautionary safety radius for 180 dB would be prescribed as1322m. Clearly the ad hoc adjustment resulted in a greater safety margin.