source characterization for an explosion during...
TRANSCRIPT
Journal of Volcanology and Geothermal Research 259 (2013) 77–88
Contents lists available at SciVerse ScienceDirect
Journal of Volcanology and Geothermal Research
j ourna l homepage: www.e lsev ie r .com/ locate / jvo lgeores
Source characterization for an explosion during the 2009 eruption of RedoubtVolcano from very-long-period seismic waves
Matthew M. Haney a,⁎, Bernard A. Chouet b, Phillip B. Dawson b, John A. Power a
a Alaska Volcano Observatory, U.S. Geological Survey, Anchorage, Alaska, USAb U.S. Geological Survey, Menlo Park, California, USA
⁎ Corresponding author.E-mail address: [email protected] (M.M. Haney).
0377-0273/$ – see front matter. Published by Elsevier Bdoi:10.1016/j.jvolgeores.2012.04.018
a b s t r a c t
a r t i c l e i n f oArticle history:Received 7 June 2011Accepted 12 April 2012Available online 1 May 2012
Keywords:Explosive eruptionsSeismologyVolcanismVery-long-period seismicity
The 2009 eruption of Redoubt produced several very-long-period (VLP) signals associated with explosions.We invert for the source location and mechanism of an explosion at Redoubt volcano using waveformmethods applied to broadband recordings. Such characterization of the source carries information on the ge-ometry of the conduit and the physics of the explosion process. Inversions are carried out assuming the vol-canic source can be modeled as a point source, with mechanisms described by a) a set of 3 orthogonal forces,b) a moment tensor consisting of force couples, and c) both forces and moment tensor components. We findthat the source of the VLP seismic waves during the explosion is well-described by either a combined mo-ment/force source located northeast of the crater and at an elevation of 1.6 km ASL or a moment source atan elevation of 800 m to the southwest of the crater. The moment tensors for the solutions with momentand force and moment-only share similar characteristics. The source time functions for both moment tensorsbegin with inflation (pressurization) and execute two cycles of deflation-reinflation (depressurization–repressurization). Although the moment/force source provides a better fit to the data, we find that owingto the limited coverage of the broadband stations at Redoubt the moment-only source is the more robustand reliable solution. Based on the moment-only solution, we estimate a volume change of 19,000 m3 anda pressure change of 7 MPa in a dominant sill and an out-of-phase volume change of 5000 m3 and pressurechange of 1.8 MPa in a subdominant dike at the source location. These results shed new light on the magmat-ic plumbing system beneath Redoubt and complement previous studies on Vulcanian explosions at othervolcanoes.
Published by Elsevier B.V.
1. Introduction
Very-long‐period (VLP) seismic radiation, within the frequencyband from 0.01 Hz to 0.5 Hz, is commonly observed with volcanic ac-tivity. By virtue of the fact that seismic waves suffer little path distor-tion in the VLP band at volcanoes (Cesca et al., 2008), VLP events offera window throughwhich important source processes can be observed(Chouet, 2009). The ability to record VLP events in the near-field is arecent development in volcano seismology, but in the decade since itsdiscovery such seismicity has been observed worldwide. Distinct VLPevents, with durations less than 200 s, have been observed at manyvolcanoes, including Kilauea (Ohminato et al., 1998; Chouet et al.,2010; Dawson et al., 2010), Stromboli (Chouet et al., 2003; Auger etal., 2006; Chouet et al., 2008), Popocatepetl (Arciniega-Ceballos etal., 1999; Chouet et al., 2005; Arciniega-Ceballos et al., 2008), Asama(Ohminato et al., 2006), Iwate (Nishimura et al., 2000), Miyake Island(Kumagai et al., 2001), Erebus (Aster et al., 2008), Fuego (Lyons &
.V.
Waite, 2011), Mt. St. Helens (Waite et al., 2008), and Augustine(Dawson et al., 2011). Long-duration VLP seismicity, or VLP tremor,has been observed at Stromboli (DeLauro et al., 2005), Okmok (Haney,2010), and Kilauea (Dawson et al., 2010). VLP signals were also observedto accompany explosions during the 2009 eruption of Redoubt Volcano,Alaska. Quantitative analysis of these VLP signals contributes further in-sights to what is already known about the volcano's shallow magmaticsystem.
Redoubt Volcano is a composite volcano on thewestern side of CookInlet, Alaska, that erupted over 4 months in 2009, beginning on March22 and ending when dome growth ceased in July. The volcano rises toa peak elevation of 3.108 kmand is covered by several glaciers. Previouseruptive periods at Redoubt occurred in 1966–68 and 1989–90 andwere marked by episodes of dome building and destruction. The seis-micity observed during the 1989–90 eruption led to a fundamental ad-vance in the understanding of different types of volcanic seismicity andresulted in a widely-used classification of volcanic earthquakes asvolcano-tectonic (VT), long‐period (LP), and hybrid types. The scientificresults of the 1989–90 sequence have been described in a previous spe-cial issue on the 1989–90 Redoubt eruption (Chouet et al., 1994; Lahr etal., 1994; Power et al., 1994).
−152.99 −152.89 −152.79 −152.69 −152.59
60.4
60.44
60.48
60.52
60.56
60.6
5 km
Longitude (deg)
Lat
itu
de
(deg
)
RD03
RDWB
RD02
RD01RDW
DFR RDE
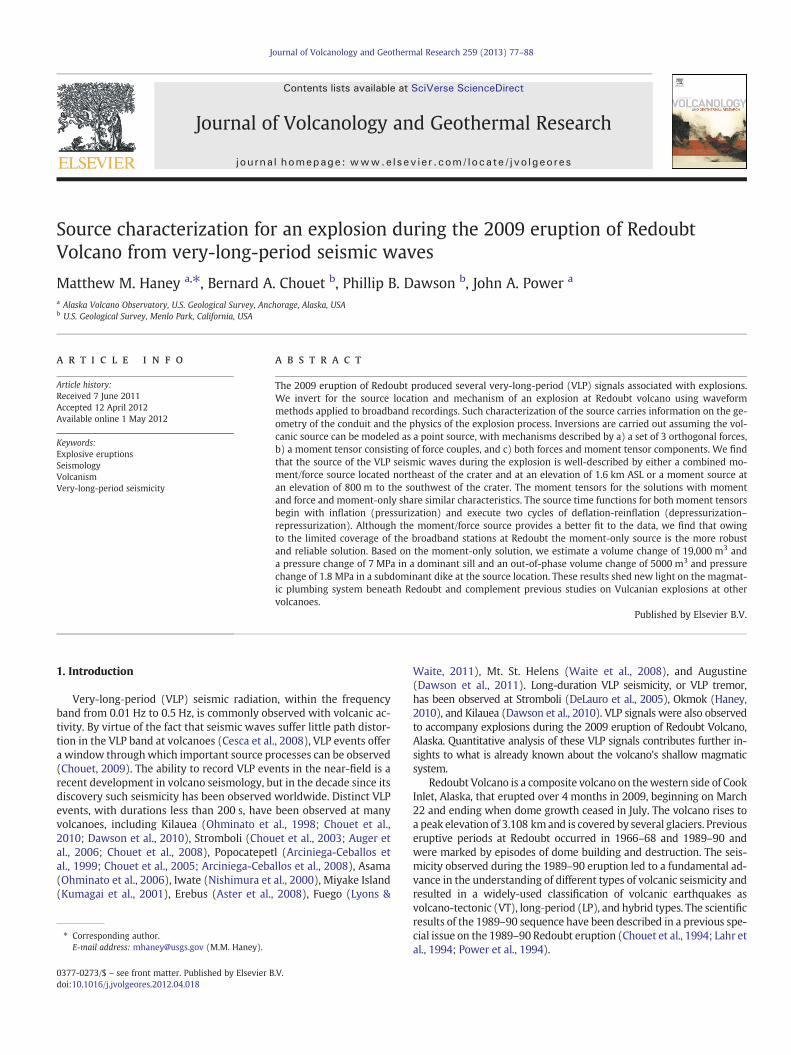
Fig. 1.Map of the 4 broadband seismometers temporarily deployed at Redoubt Volcanofrom March through June 2009. Contours are given at 3000, 6000, and 9000 ft ASL,according to the convention from Chouet et al. (1994) and Lahr et al. (1994). Onebroadband (RDWB) was in operation on the Redoubt edifice within the permanentnetwork, bringing the total number of broadband sensors to 5. Lateral distance fromthe 1989 to 90 dome ranged from as close as 2.9 km (RDW) to 4.4 km (RDWB). Eleva-tions ranged from 1.32 km (RD02) to 1.85 km (RDW). Short period stations DFR andRDE, which are discussed in the caption of Fig. 2, are located on the northern side ofthe Drift River valley. Short period station REF is co-located with RD01.
78 M.M. Haney et al. / Journal of Volcanology and Geothermal Research 259 (2013) 77–88
We describe the source mechanism of VLP signals associated withan explosion at Redoubt during the 2009 eruption. Among severalpossible instances of VLP seismicity, we select a single explosionwith a short duration (b200 s) signal for further analysis. We first dis-cuss the broadband network installed at Redoubt during the 2009eruption and review the main features of the 2009 eruption seismic-ity. Following this broad overview, we focus our attention on the VLPsignals from one explosion and analyze the low-frequency particlemotions observed on the broadband network. An inherent assump-tion in the waveform inversion method we present is that the sourcecan be described by a set of moments and forces acting at one point inthe subsurface. The explosion we select has been chosen since it has ashort duration and compact waveform. Such an explosive event ismore likely to be the result of a source acting at a single point in thesubsurface than explosions with longer signal durations and morecomplex waveforms. We find best-fitting source models based oncombinations of forces and moments by searching over appropriatevolumes within the Redoubt edifice. Two different source models inparticular provide a reasonable fit to the instrument-corrected dis-placement seismograms. We argue that, based on the limited numberof broadband channels at Redoubt (13), the source model with onlymoments and no forces is the most robust solution. These findings re-garding the resolving power of source mechanism inversion with lim-ited observational data agree with previous work on VLP signalsassociated with an explosion during the 2006 eruption of Augustinevolcano (Dawson et al., 2011). The magnitude of the inverted momenttensor at Redoubt is nearly the same as observed at Augustine and thesource time function bears a strong resemblance to VLP sources imagedat other volcanoes during explosions (Chouet et al., 2005; Dawson et al.,2011).
2. Broadband data and VLP signals at Redoubt
VLP signalswere observed to accompany explosions during the 2009eruption of Redoubt. Similar signals were not previously detected at Re-doubt during the1989–90 eruption due to the lack of broadband seismiccoverage at that time. Other novel seismic phenomena observed duringthe2009 eruption consisted of rapid, ascending spectral gliding immedi-ately prior to some explosions dubbed volcanic “screams” (Hotovec etal., 2013) and deep long‐period (DLP) events in the months prior tothe eruption (Power et al., 2013). All three of these phenomena mayhave occurred during the 1989–90 eruption; however, instrumentationand methods at that time were not advanced enough to detect them.The observation of these seismic phenomena during the 2009 eruptionoffers a more complete picture of the Redoubt magmatic system thancould be inferred from the seismicity during the 1989–90 eruption.
In the days leading up to the initial explosions on March 22, scien-tists from the Alaska Volcano Observatory, a partnership between theUniversity of Alaska–Fairbanks Geophysical Institute, the Alaska Divi-sion of Geological and Geophysical Surveys, and the U.S. GeologicalSurvey, placed 4 broadband seismometers on the flanks of the Re-doubt edifice. The locations of these temporary broadband stationsare shown in Fig. 1. The stations varied in elevation from 1.32 to1.85 km and in range to the 1989–90 dome from 2.9 to 4.4 km laterally.The instruments were Guralp 6-TD broadband seismometers (0.02–30 s) that recorded three-component data on site at 50 samples-per-second (sps) from March 21 until the early part of June. In additionto these temporary installations, a single broadband station in the perma-nentmonitoring networkwas in operation on the Redoubt edifice, stationRDWB as seen in Fig. 1. The permanent monitoring network consisted ofseveral other short period instruments — we plot two of these stations,DFR and RDE, in Fig. 1 and show data from these stations in subsequentfigures. Note that station DFR consisted of a co-located short period seis-mometer and infrasound microphone. The temporary broadband stationRD01 was co-located with a three-component short period station REF,which we also show data from in subsequent figures. The 5 three-
component broadband stations on the Redoubt edifice offered as manyas 15 components of VLP recordings; however, the north–south compo-nents of RD02 andRDWwerenot functioning properly during the tempo-rary deployment. This limits the number of available components to 13,one less than the number of components (14) used for sourcemechanisminversions at Augustine Volcano (Dawson et al., 2011). This is an impor-tant point that we will return to in this paper, since the main conclusionof the study by Dawson et al. (2011) concerned the resolution power ofsourcemechanism inversionswhen using a limited amount of broadbanddata.
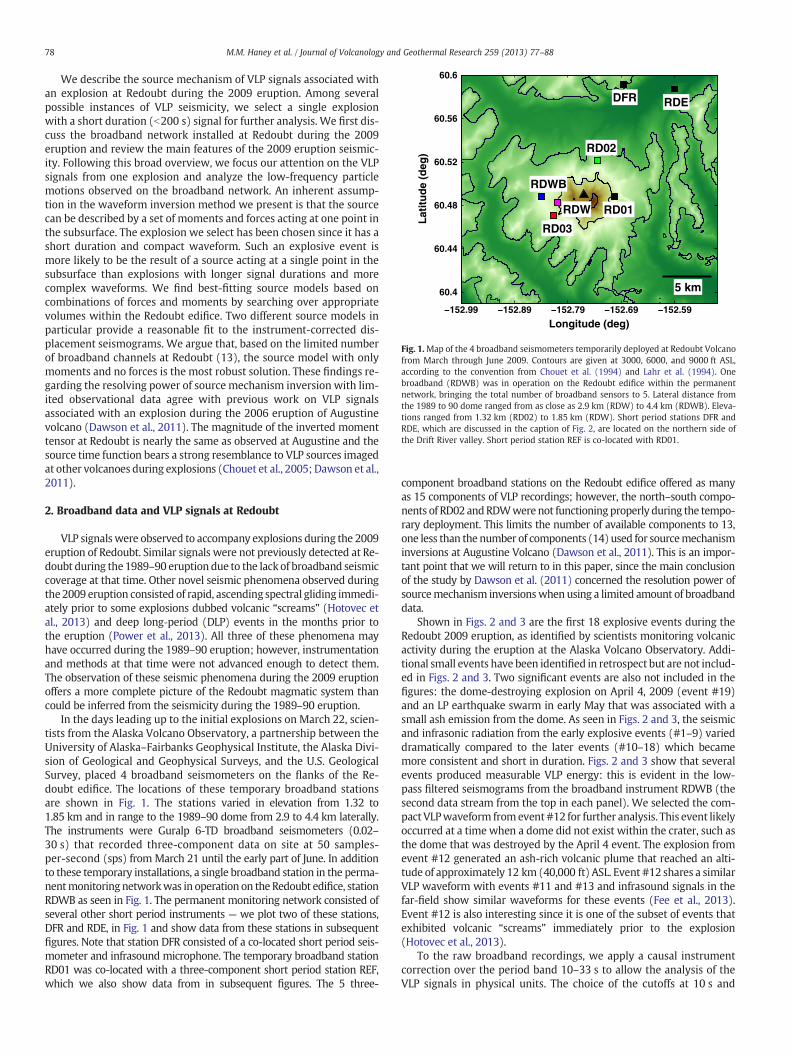
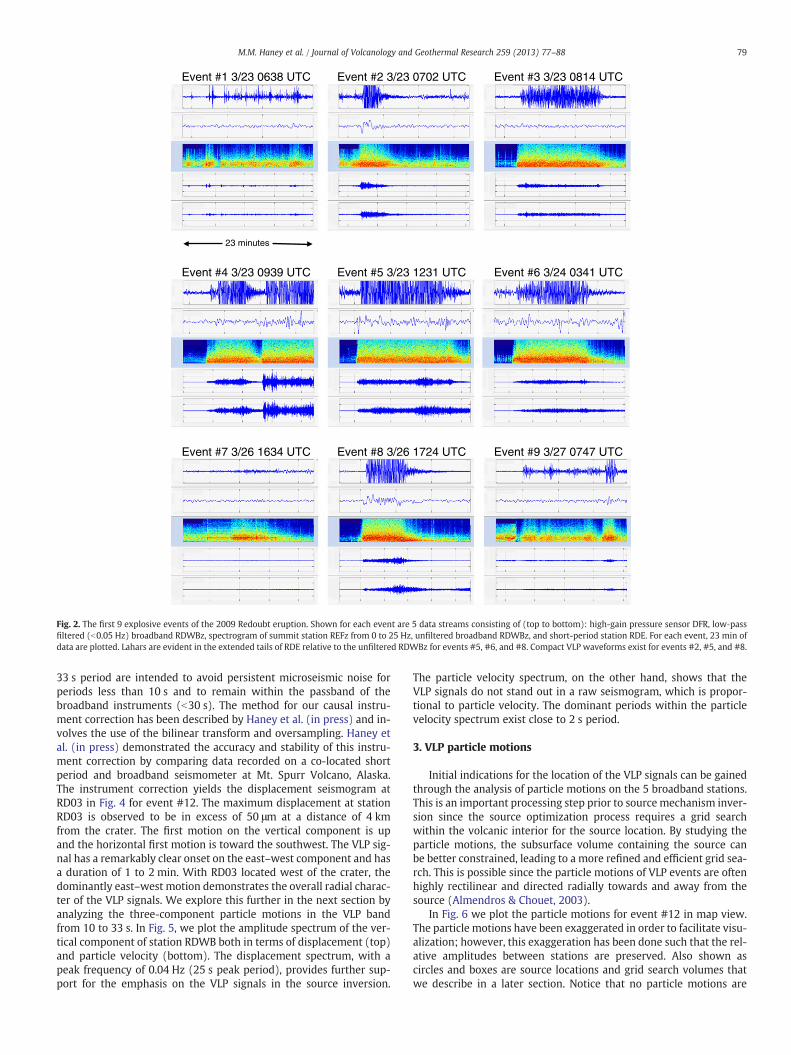
Shown in Figs. 2 and 3 are the first 18 explosive events during theRedoubt 2009 eruption, as identified by scientists monitoring volcanicactivity during the eruption at the Alaska Volcano Observatory. Addi-tional small events have been identified in retrospect but are not includ-ed in Figs. 2 and 3. Two significant events are also not included in thefigures: the dome-destroying explosion on April 4, 2009 (event #19)and an LP earthquake swarm in early May that was associated with asmall ash emission from the dome. As seen in Figs. 2 and 3, the seismicand infrasonic radiation from the early explosive events (#1–9) varieddramatically compared to the later events (#10–18) which becamemore consistent and short in duration. Figs. 2 and 3 show that severalevents produced measurable VLP energy: this is evident in the low-pass filtered seismograms from the broadband instrument RDWB (thesecond data stream from the top in each panel). We selected the com-pact VLPwaveform fromevent#12 for further analysis. This event likelyoccurred at a time when a dome did not exist within the crater, such asthe dome that was destroyed by the April 4 event. The explosion fromevent #12 generated an ash-rich volcanic plume that reached an alti-tude of approximately 12 km (40,000 ft) ASL. Event #12 shares a similarVLP waveform with events #11 and #13 and infrasound signals in thefar-field show similar waveforms for these events (Fee et al., 2013).Event #12 is also interesting since it is one of the subset of events thatexhibited volcanic “screams” immediately prior to the explosion(Hotovec et al., 2013).
To the raw broadband recordings, we apply a causal instrumentcorrection over the period band 10–33 s to allow the analysis of theVLP signals in physical units. The choice of the cutoffs at 10 s and
23 minutes
Event #1 3/23 0638 UTC Event #2 3/23 0702 UTC Event #3 3/23 0814 UTC
Event #4 3/23 0939 UTC Event #5 3/23 1231 UTC Event #6 3/24 0341 UTC
Event #7 3/26 1634 UTC Event #8 3/26 1724 UTC Event #9 3/27 0747 UTC
Fig. 2. The first 9 explosive events of the 2009 Redoubt eruption. Shown for each event are 5 data streams consisting of (top to bottom): high-gain pressure sensor DFR, low‐passfiltered (b0.05 Hz) broadband RDWBz, spectrogram of summit station REFz from 0 to 25 Hz, unfiltered broadband RDWBz, and short-period station RDE. For each event, 23 min ofdata are plotted. Lahars are evident in the extended tails of RDE relative to the unfiltered RDWBz for events #5, #6, and #8. Compact VLP waveforms exist for events #2, #5, and #8.
79M.M. Haney et al. / Journal of Volcanology and Geothermal Research 259 (2013) 77–88
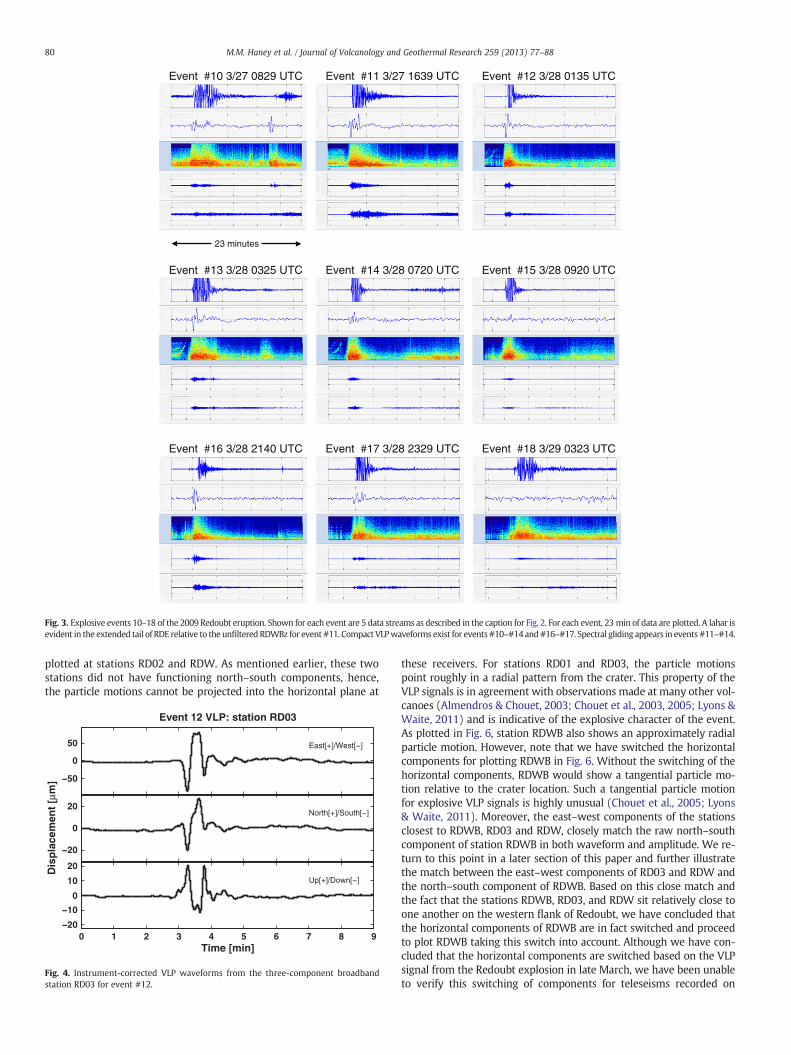
33 s period are intended to avoid persistent microseismic noise forperiods less than 10 s and to remain within the passband of thebroadband instruments (b30 s). The method for our causal instru-ment correction has been described by Haney et al. (in press) and in-volves the use of the bilinear transform and oversampling. Haney etal. (in press) demonstrated the accuracy and stability of this instru-ment correction by comparing data recorded on a co-located shortperiod and broadband seismometer at Mt. Spurr Volcano, Alaska.The instrument correction yields the displacement seismogram atRD03 in Fig. 4 for event #12. The maximum displacement at stationRD03 is observed to be in excess of 50 μm at a distance of 4 kmfrom the crater. The first motion on the vertical component is upand the horizontal first motion is toward the southwest. The VLP sig-nal has a remarkably clear onset on the east–west component and hasa duration of 1 to 2 min. With RD03 located west of the crater, thedominantly east–west motion demonstrates the overall radial charac-ter of the VLP signals. We explore this further in the next section byanalyzing the three-component particle motions in the VLP bandfrom 10 to 33 s. In Fig. 5, we plot the amplitude spectrum of the ver-tical component of station RDWB both in terms of displacement (top)and particle velocity (bottom). The displacement spectrum, with apeak frequency of 0.04 Hz (25 s peak period), provides further sup-port for the emphasis on the VLP signals in the source inversion.
The particle velocity spectrum, on the other hand, shows that theVLP signals do not stand out in a raw seismogram, which is propor-tional to particle velocity. The dominant periods within the particlevelocity spectrum exist close to 2 s period.
3. VLP particle motions
Initial indications for the location of the VLP signals can be gainedthrough the analysis of particle motions on the 5 broadband stations.This is an important processing step prior to source mechanism inver-sion since the source optimization process requires a grid searchwithin the volcanic interior for the source location. By studying theparticle motions, the subsurface volume containing the source canbe better constrained, leading to a more refined and efficient grid sea-rch. This is possible since the particle motions of VLP events are oftenhighly rectilinear and directed radially towards and away from thesource (Almendros & Chouet, 2003).
In Fig. 6 we plot the particle motions for event #12 in map view.The particle motions have been exaggerated in order to facilitate visu-alization; however, this exaggeration has been done such that the rel-ative amplitudes between stations are preserved. Also shown ascircles and boxes are source locations and grid search volumes thatwe describe in a later section. Notice that no particle motions are
23 minutes
Event #10 3/27 0829 UTC Event #11 3/27 1639 UTC Event #12 3/28 0135 UTC
Event #13 3/28 0325 UTC Event #14 3/28 0720 UTC Event #15 3/28 0920 UTC
Event #16 3/28 2140 UTC Event #17 3/28 2329 UTC Event #18 3/29 0323 UTC
Fig. 3. Explosive events 10–18 of the 2009 Redoubt eruption. Shown for each event are 5 data streams as described in the caption for Fig. 2. For each event, 23 min of data are plotted. A lahar isevident in the extended tail of RDE relative to the unfiltered RDWBz for event#11. Compact VLPwaveforms exist for events#10–#14and#16–#17. Spectral gliding appears in events #11–#14.
80 M.M. Haney et al. / Journal of Volcanology and Geothermal Research 259 (2013) 77–88
plotted at stations RD02 and RDW. As mentioned earlier, these twostations did not have functioning north–south components, hence,the particle motions cannot be projected into the horizontal plane at
−50
0
50
Event 12 VLP: station RD03
East[+]/West[−]
−20
0
20
Dis
pla
cem
ent
[µm
]
North[+]/South[−]
0 1 2 3 4 5 6 7 8 9−20
−10
0
10
20
Time [min]
Up[+]/Down[−]
Fig. 4. Instrument-corrected VLP waveforms from the three-component broadbandstation RD03 for event #12.
these receivers. For stations RD01 and RD03, the particle motionspoint roughly in a radial pattern from the crater. This property of theVLP signals is in agreement with observations made at many other vol-canoes (Almendros & Chouet, 2003; Chouet et al., 2003, 2005; Lyons &Waite, 2011) and is indicative of the explosive character of the event.As plotted in Fig. 6, station RDWB also shows an approximately radialparticle motion. However, note that we have switched the horizontalcomponents for plotting RDWB in Fig. 6. Without the switching of thehorizontal components, RDWB would show a tangential particle mo-tion relative to the crater location. Such a tangential particle motionfor explosive VLP signals is highly unusual (Chouet et al., 2005; Lyons& Waite, 2011). Moreover, the east–west components of the stationsclosest to RDWB, RD03 and RDW, closely match the raw north–southcomponent of station RDWB in both waveform and amplitude. We re-turn to this point in a later section of this paper and further illustratethe match between the east–west components of RD03 and RDW andthe north–south component of RDWB. Based on this close match andthe fact that the stations RDWB, RD03, and RDW sit relatively close toone another on the western flank of Redoubt, we have concluded thatthe horizontal components of RDWB are in fact switched and proceedto plot RDWB taking this switch into account. Although we have con-cluded that the horizontal components are switched based on the VLPsignal from the Redoubt explosion in late March, we have been unableto verify this switching of components for teleseisms recorded on

10−1 100 101
10−1 100 101
0
0.1
0.2
0.3
0.4
0.5
0.6
0.7
0.8
0.9
1
Frequency (Hz)
No
rmal
ized
Am
plit
ud
e
Event 12 VLP: displacement spectrum
0
0.1
0.2
0.3
0.4
0.5
0.6
0.7
0.8
0.9
1
Frequency (Hz)
No
rmal
ized
Am
plit
ud
e
Event 12 VLP: particle velocity spectrum
Fig. 5. Displacement (top) and particle velocity (bottom) spectra from the vertical compo-nent of station RDWB for event #12. The VLP frequency band utilized in the inversions,from 0.03 to 0.1 Hz (10–33 s period), dominates the displacement seismogram, with adominant frequency of about 0.04 Hz (25 s period). The VLP frequencies do not, however,dominate raw seismograms which are proportional to particle velocity.
−152.9 −152.8 −152.7 −152.6
60.44
60.48
60.52
60.56
Longitude (deg)
Lat
itu
de
(deg
)
RD03
RDWB
RD02
RD01RDW
Fig. 6.Map of the 5 summit broadband sensors plotted along with exaggerated particlemotions. Stations RDW and RD02 had inoperative north–south components, and arenot represented in this plot. Contours are given as in Fig. 1. The crater is shown as ablack triangle and the VLP particle motions show a more or less radial pattern awayfrom the crater. Also plotted are a solid and open circle showing the epicentral locationof the best‐fit sources using force and moment (solid) and moment-only (open). Thelateral extents of the volumes over which our grid search for best‐fit source locationwas performed are shown by bold-solid, light-solid, and dashed squares.
−152.9 −152.85 −152.8 −152.75 −152.7 −152.65
0
0.5
1
1.5
2
2.5
3
3.5
Longitude (deg)
Ele
vati
on
(km
)
Event #12 VLP motions
Fig. 7. East–west cross-section of Redoubt at 2×vertical exaggeration,with the locations ofthe 5 summit broadbands projected into the east–west vertical plane. Note that stationRD02 (green square) is on the northern flank of the edifice and so appears to be inside ofthe volcano. The crater is shown as a black triangle and the VLP particle motions show amore or less radial pattern away from a point situated below and to the east of the crater.Also plotted are a solid and open circle showing the locations of the best‐fit sources usingforce andmoment (solid) andmoment-only (open). The lateral extents of the two volumesover which grid search was performed are shown by bold-solid, light-solid, and dashedrectangles.
81M.M. Haney et al. / Journal of Volcanology and Geothermal Research 259 (2013) 77–88
April 1 and 7. Thus, the cause of the component switch is unclear. A pos-sible factor is that, of the 5 broadband stations at Redoubt, only RDWBtelemetered data in real-time. The other 4 broadband stations recordeddata on site.
Since the north–south components are lacking on 2 of the 5 stations,we can maximize the number of available stations by looking at particlemotions projected into the east–west vertical plane. In Fig. 7, we showthe projection onto the east–west vertical plane with particle motionsagain exaggerated for visualization. The vertical exaggeration in Fig. 7 isa factor of 2. As in Fig. 6, source locations and grid search volumes thatwe describe in a later section are shown as circles in boxes. The particlemotions point radially towards and away from a source region belowthe crater at roughly 1 km ASL. These observations provide strong evi-dence that the source of event #12 originated at an elevation of approxi-mately 1 km ASL and more or less beneath the crater. We utilize thisinitial indication for the source location to guide the selection of subsur-face volumes for our grid search for best‐fit source.
4. Source mechanism inversion
We seek to invert the VLP signals observed during event #12 atRedoubt for the location and precise mechanism of the explosionwithin the volcano. The method we employ has been applied to many
VLP signals at other volcanoes previously in order to probe source pro-cesses (Ohminato et al., 1998; Nishimura et al., 2000; Chouet et al.,2003, 2005; Auger et al., 2006; Ohminato et al., 2006; Aster et al.,2008; Chouet et al., 2008; Waite et al., 2008; Chouet et al., 2010;Dawson et al., 2011). Although the waveform inversion method hasbeen described in other publications, we discuss its salient featureshere for completeness. Thewaveform inversionmethod is distinctly dif-ferent from conventional seismic analysis techniques that rely on thearrival times of seismic phases. Instead of only fitting the arrival times,waveform inversion for the source mechanism seeks to fit the entireseismogram. As a result, the computational demands of waveform in-version far exceed those of standard earthquake location. The main

82 M.M. Haney et al. / Journal of Volcanology and Geothermal Research 259 (2013) 77–88
advantage of waveform inversion is that it can be applied in principle toany seismic signals, including those at volcanoes that are excited by in-teractions between gas, liquid, and solid.
Waveform inversion relies on accurate and efficientfinite-differencemodeling of the seismic wavefield using the method described byOhminato & Chouet (1997), which includes topography. For Redoubt,we used a 2 arc sec DEM obtained from the USGS seamless server(seamless.usgs.gov) to represent the topography of the volcano. At anominal latitude of 60°, the DEM has a resolution of approximately30 m in the east–west direction and 60 m north–south. We interpolatethe topography onto a uniform40 mgrid for finite-differencemodeling.Whether this resolutionmeets the requirements for theDEM to accurate-ly represent topography in the finite-difference modeling is determinedby considering numerical accuracy. For finite-difference simulations,there should be a certain number of grid points per minimum desiredwavelength to ensure accuracy. A rule of thumb based on the finite‐dif-ference algorithmofOhminato&Chouet (1997) states that 25 grid pointsperwavelength are necessary for accuratemodeling. To test this criterionat Redoubt requires that we adopt a subsurface model for the volcano.Based on previous tomography at Redoubt, the P-wave velocity isknown to vary from 3.5 km/s at shallow depths to 5 km/s at sea level(Benz et al., 1996; Chouet, 1996). Based on this gross P-wave velocitystructure, we take an average P-wave velocity to be 4 km/s. For theother two elastic parameters, S-wave velocity and density, we assume aVp/Vs ratio of 1.73 to arrive at an S-wave velocity of 2.3 km/s and takethe density to be equal to a value typical of the Earth's crust, 2650 kg/m3. Given thesemodel parameters, a grid spacing of 40 m provides accu-rate finite‐differencemodeling of S-waves to frequencies as high as 2 Hz,well above our frequency band of interest for VLP signals. In order toavoid ghost edge effects in the finite‐difference simulations, we haveextended the model 7.6 and 7.2 km away from the crater in the east–west and north–south directions. In addition, the model extends 8 kmin depth below the peak of Redoubt, which sits at an elevation of3.108 km ASL (Chouet et al. 1994). These model dimensions provide a3D model of Redoubt with 381×361×201 grid nodes in the east–west, north–south, and vertical directions.
Since elastic wave propagation is a linear problem, any source with ageneral source time function can be computed provided impulse re-sponses, or Green's functions, are available for all the interior nodes ofthe model. In finite‐difference modeling, a true impulse response can becontaminated by artificial numerical dispersion since the impulse con-tains high frequencies that do not satisfy the criterion of 25 grid pointsper wavelength. For this reason, wemodel approximate impulses to syn-thesize a general source time function. The approximate impulse is givenby (Chouet et al., 2005):
S tð Þ ¼12
1− cos2πttp
!" #0≤ t ≤ tp;
0; t > tp;
8><>: ð1Þ
where t is time, S(t) is the elementary source time function, tp is the char-acteristic period of this elementary source time function. For our applica-tion at Redoubt, we used tp=2 s.
Now consider that, at a single grid point in the subsurface at Redoubt,we excite seismic sources using the basic source time function given inEq. (1). At that grid point, we must consider two primary types of seis-mic sources— a force vector and a symmetric moment tensor. Together,these two types of sources comprise 9 independent components: 3 dueto the force and 6 from the symmetric moment tensor. By exciting eachof these 9 source components with the basic source time function givenin Eq. (1) and saving the Green's functions, the response of any sourcewith a general source time function can be computedwith the followingmatrix–vector equation:
d ¼ Gm ð2Þ
where d is the data vector, G is a matrix containing time-shifted Green'sfunctions in each column, and m is the source mechanism vector. Thesize of the data vector in Eq. (2) is NtNs×1 where Nt is the number oftraces (i.e., data channels) and Ns is the number of time samples. Thesource mechanism vector is of size NmNb×1 where Nm is the numberof possible source types (e.g., 3 forces and 6 moments give m=9) andNb is the number of elementary functions used to represent the sourcetime functions. This means that matrix G is a NtNs×NmNb matrix.
The procedure for source mechanism inversion consists of solvingEq. (2) for many grid points in the subsurface by least-squares with-out damping. This requires that Green's functions are known over avolume in the subsurface model. Once the responses at the seismicstations are computed for a source at a particular grid point, errors(in %) between the synthetics and the data are measured accordingto two definitions given by (Ohminato et al., 1998)
E1 ¼
PNt
n¼1
PNs
p¼1u0n pΔtð Þ−us
n pΔtð Þ� �2PNt
n¼1
PNs
p¼1u0n pΔtð Þ� �2 � 100; ð3Þ
and
E2 ¼ 1Nr
XNr
n¼1
P31
PNs
p¼1u0n pΔtð Þ−us
n pΔtð Þ� �2P31
PNs
p¼1u0n pΔtð Þ� �2 � 100: ð4Þ
where un0 is the data for channel n, uns is the synthetic or modeled data
for the n-th channel, and Δt is the sample rate of the seismograms. Fora source mechanism given by either 3 forces, 6 moment tensor com-ponents, or 3 forces and 6moments, the grid point with the minimumerror corresponds to the optimal source location for that particularmechanism. The two definitions for error in Eqs. (3) and (4) measurethe error in different ways. The first definition in Eq. (3) weighs theerrors on the data channels with the largest signals most heavily.Since radial motions are typically large for explosive events, E1tends to focus on the errors associated with the radial components.In contrast, the second definition in Eq. (4) attempts to normalizethe signals between all the components and thus offers a more bal-anced measure of the errors on all data channels. For this reason weuse E2 to select between different candidate sources that share thesame mechanism.
Once the optimal source locations are found for each of the threetypes of source mechanisms, the best fit among the three differentmechanisms can be chosen according to the one that minimizes theAkaike Information Criterion (AIC) (Akaike, 1974)
AIC ¼ NtNs lnE þ 2NmNb ð5Þ
where NtNs, Nm, and Nb have been described previously and either E1or E2 can be used in place of the error E. The AIC criterion penalizespossible solutions for having both large errors compared to the dataand having too many free parameters. The solution that minimizesthe AIC criterion in principle captures the optimal tradeoff betweenerror reduction and model complexity. As discussed by Dawson etal. (2011), other types of judgment can be used as well in the final se-lection, especially when there is limited observational data.
In summary, the procedure for source mechanism inversion is toperform a grid search over the spatial location coordinates while solv-ing Eq. (2) for each possible source location using least-squares. Gridsearch is themost robust type of inversion procedure because in princi-ple it samples all of the parameter space. Furthermore, the linear inver-sion of Eq. (2) means that an initial guess for the source mechanism isnot needed.

Table 1Residual errors for free inversions and corresponding AIC.
Source mechanism Error E1% Error E2% AIC(E1) AIC(E2)
Force only 70.8 105.6 −6099 15,189Moment only 7.1 14.2 −116,270 −79,360Moment and force 3.6 3.8 −140,140 −137,270
83M.M. Haney et al. / Journal of Volcanology and Geothermal Research 259 (2013) 77–88
Although the above description of the inversion is valid in princi-ple, three crucial considerations make the procedure drastically morenumerically efficient. These considerations involve a) the use of reci-procity to obtain Green's functions over a volume in the subsurface,b) the construction of moment tensor Green's functions from combi-nations of force Green's functions, and c) the reformulation of Eq. (2)in the frequency domain, as described by Auger et al. (2006) andimplemented by Waite et al. (2008) and Chouet et al., (2010). Thereciprocity property (Aki & Richards, 1980) involves switching thesource and receiver locations and components according to
Gmn x1; x2ð Þ ¼ Gnm x2; x1ð Þ: ð6Þ
This equation states that the m-component of displacement at x1due to a force source applied in the n-direction at x2 (Gmn(x1, x2)) isequal to the n-component of displacement at x2 due to a force sourceapplied in the m-direction at x1 (Gnm(x2, x1)). The reciprocity proper-ty means that receivers can be interchanged for sources in the numer-ical modeling. This is important since there are typically many morepossible source locations than seismic stations. For instance, at Re-doubt, there are 13 data channels and we searched for the source lo-cation over a subsurface volume of 21×21×31 grid points. Usingreciprocity, only 13 finite-difference modeling runs need to be com-pleted instead of over 40,000. We obtain the estimate of over40,000 by considering three orthogonal forces individually sourcedat each of the 21×21×31 grid points. Note that the need for diskspace to store the Green's functions is not removed by using reciproc-ity. Additional computational savings are obtained by only modelingGreen's functions using force sources. The moment tensor Green'sfunctions are then formed from the different force components.
The final gain in numerical efficiency is achieved by using the fre-quency domain version of Eq. (2). The efficiency in this case arisesfrom the fact that the finite-difference model is time invariant.Eq. (2), being in the time domain, could hypothetically accommodatea Green's function for a mediumwhose properties changed with time.Note that we are specifically discussing medium properties thatchange over the short time scale it takes for waves to propagatefrom the volcanic source to the receivers. Since the subsurfacemodel at Redoubt is taken to be constant with time, the ability to ac-commodate time-changing material properties is not needed. Thus, itmakes sense to take a Fourier transform over time since the matrix Gis time invariant. In the frequency domain, many smaller matrices areinverted as opposed to one single large matrix in the time domain.Note that, when working in the frequency domain, the parameterNb is replaced by the number of frequencies Nf and the AIC criterionbecomes
AIC ¼ NtNs lnE þ 2NmNf : ð7Þ
5. Results
We conducted grid searches for the optimal source composed of 3forces, 6 moments, and 3 forces and 6 moments within four volumesat Redoubt. The four volumes are shown as bold-solid, light-solid, anddashed boxes in Figs. 6 and 7. Each volume consisted of 21×21×31gridpoints in the east–west, north–south, and vertical directions.The four volumes overlapped in some regions of the subsurface. Theresults of the 3 types of source mechanism inversions are summa-rized in Table 1. Although source time functions are computed overa full time window of 204.75 s, the errors are only computed from10 to 195 s. From the error and AIC reduction, a source at Redoubtthat is based on a single force can be ruled out immediately. The loca-tions of the optimal sources based on force and moment andmoment-only are also shown in Figs. 6 and 7. The force and momentand moment-only solutions are located in the bold-solid and dashed
boxes in Figs. 6 and 7, respectively. A distinct difference in the loca-tions exists in the vertical direction, as seen in Fig. 7, with the solutionbased on force and moment being shallower (1.6 km ASL) than themoment-only solution (0.8 km ASL). Even when considering a vol-ume of source locations within 1% of the minimum error, the errorvolumes for the two mechanisms do not overlap. The two solutionsare also in different lateral locations as shown in Fig. 6. The forceand moment solution sits to the northeast of the crater whereas themoment-only solution lies to the southwest.
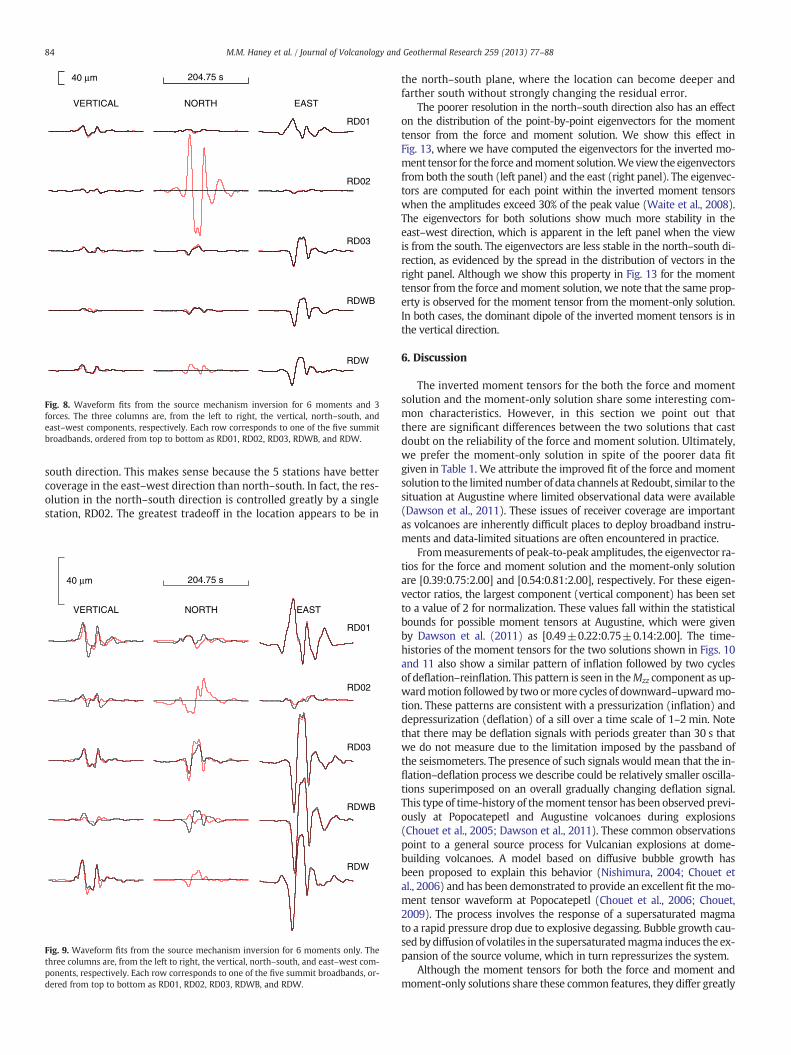
Simply based on considering AIC reduction in Table 1, the forceand moment solution would be chosen as the best‐fitting mechanism.The excellent fit of the force and moment solution can be observed inFig. 8, which shows the waveformmatch between the data and finite-difference modeling. All waveforms are well-matched, except for pos-sibly the vertical component of RDWB. By comparison, the fit be-tween the moment-only solution and the data in Fig. 9 is noticeablyworse, although still overall capable of matching the largest signals.Based on the AIC, the improved data-fitting in Fig. 8 is apparentlyworth the cost of introducing 3 new model parameters. In the nextsection, we discuss the merits of the force and moment solution inlight of the limited amount of data (13 channels) at Redoubt. The sit-uation is similar to that encountered at Augustine Volcano (Dawsonet al., 2011), where only 14 data channels were available. Finally,note the strong similarity between the east–west components ofRD03, RDWB, and RDW in either Fig. 8 or Fig. 9. We point this outin light of the earlier discussion on the switching of the horizontalcomponents for station RDWB. Had this switching not been takeninto account, the large east–west component for RDWB would haveinstead been associated with the north–south component, as seen inthe raw data. Due to the proximity of RD03, RDWB, and RDW, we be-lieve the switching of the horizontal components for RDWB makessense, although we are unable to identify the specific cause of theswitch.
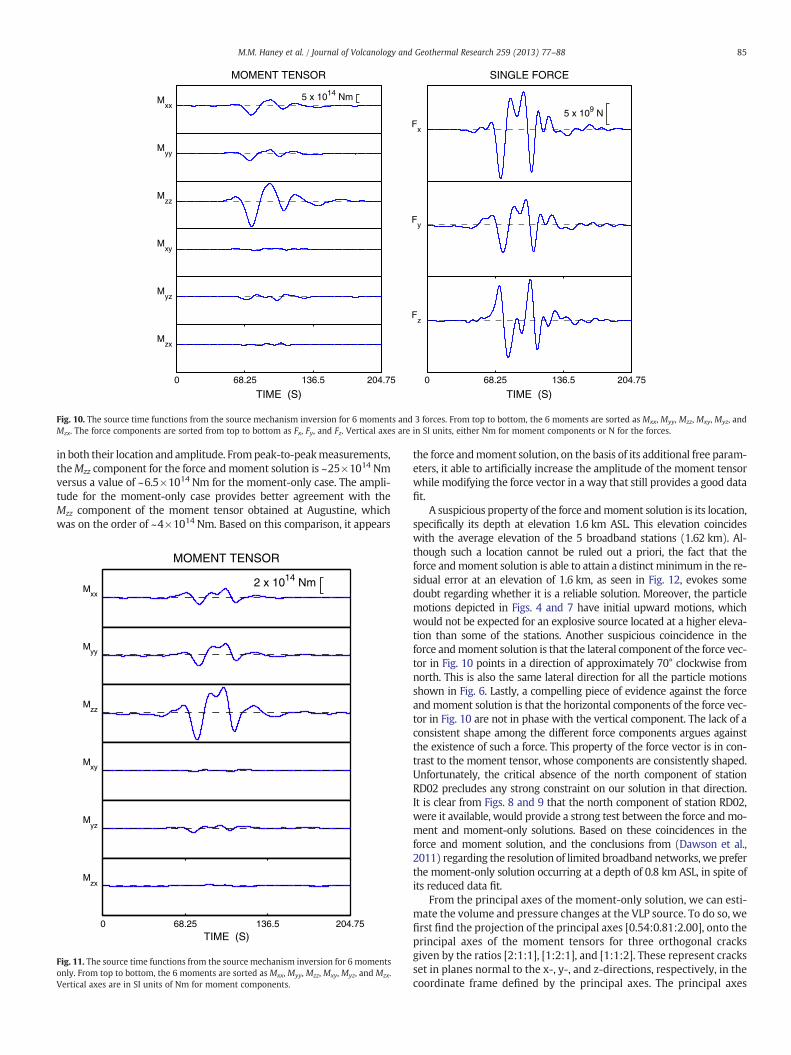
Fig. 10 shows the source time functions for the force and momentsolution. The waveforms for the individual moments are consistentlyshaped and are dominated by the volumetric opponents along themain diagonal. In addition, the Mzz component dominates over thetwo horizontal components Mxx and Myy. The average amplitude ratiosof the force components to the moment components, Fx/Mxx, Fy/Myy,and Fz/Mzz, are approximately 8×10⁻⁵ m−1, suggesting that the singleforce contributed less than 10% to thewaveforms (Dawson et al., 2011).The inverted source time functions for the moment-only solution(Fig. 11) shows similar characteristics consistent with those seen forthe moments in Fig. 10. The moment tensor is again observed to bedominated by the diagonal components, indicating a volumetric sourcewith Mzz as dominant component. However, notice that the amplitudeof the Mzz component of the moment tensor is 4 times smaller in themoment-only solution, which has a peak-to-peak amplitude of~6.5×10¹⁴ Nm instead of ~25×1014 Nm in the force andmoment solu-tion in Fig. 10. In the next section, we discuss this discrepancy whenjudgingwhich of the two solutions is ultimately themost robust and re-liable at Redoubt.
Since the location of the best-fit source is found through grid sea-rch, the uncertainties in source location can be visualized by plottingthe error in the volume within the finite‐difference model over whichthe search was completed. This error volume for E2 is plotted for theforce and moment solution in Fig. 12. It is clear that the source loca-tion is better constrained in the east–west direction than the north–
RDW
RDWB
RD03
RD02
VERTICAL NORTH
RD01
EAST
40 µm 204.75 s
Fig. 8. Waveform fits from the source mechanism inversion for 6 moments and 3forces. The three columns are, from the left to right, the vertical, north–south, andeast–west components, respectively. Each row corresponds to one of the five summitbroadbands, ordered from top to bottom as RD01, RD02, RD03, RDWB, and RDW.
84 M.M. Haney et al. / Journal of Volcanology and Geothermal Research 259 (2013) 77–88
south direction. This makes sense because the 5 stations have bettercoverage in the east–west direction than north–south. In fact, the res-olution in the north–south direction is controlled greatly by a singlestation, RD02. The greatest tradeoff in the location appears to be in
RDW
RDWB
RD03
RD02
VERTICAL NORTH
RD01
EAST
40 µm 204.75 s
Fig. 9. Waveform fits from the source mechanism inversion for 6 moments only. Thethree columns are, from the left to right, the vertical, north–south, and east–west com-ponents, respectively. Each row corresponds to one of the five summit broadbands, or-dered from top to bottom as RD01, RD02, RD03, RDWB, and RDW.
the north–south plane, where the location can become deeper andfarther south without strongly changing the residual error.
The poorer resolution in the north–south direction also has an effecton the distribution of the point-by-point eigenvectors for the momenttensor from the force and moment solution. We show this effect inFig. 13, where we have computed the eigenvectors for the inverted mo-ment tensor for the force andmoment solution.Weview the eigenvectorsfrom both the south (left panel) and the east (right panel). The eigenvec-tors are computed for each point within the inverted moment tensorswhen the amplitudes exceed 30% of the peak value (Waite et al., 2008).The eigenvectors for both solutions show much more stability in theeast–west direction, which is apparent in the left panel when the viewis from the south. The eigenvectors are less stable in the north–south di-rection, as evidenced by the spread in the distribution of vectors in theright panel. Although we show this property in Fig. 13 for the momenttensor from the force andmoment solution, we note that the same prop-erty is observed for the moment tensor from the moment-only solution.In both cases, the dominant dipole of the inverted moment tensors is inthe vertical direction.
6. Discussion
The inverted moment tensors for the both the force and momentsolution and the moment-only solution share some interesting com-mon characteristics. However, in this section we point out thatthere are significant differences between the two solutions that castdoubt on the reliability of the force and moment solution. Ultimately,we prefer the moment-only solution in spite of the poorer data fitgiven in Table 1. We attribute the improved fit of the force and momentsolution to the limited number of data channels at Redoubt, similar to thesituation at Augustine where limited observational data were available(Dawson et al., 2011). These issues of receiver coverage are importantas volcanoes are inherently difficult places to deploy broadband instru-ments and data-limited situations are often encountered in practice.
Frommeasurements of peak-to-peak amplitudes, the eigenvector ra-tios for the force and moment solution and the moment-only solutionare [0.39:0.75:2.00] and [0.54:0.81:2.00], respectively. For these eigen-vector ratios, the largest component (vertical component) has been setto a value of 2 for normalization. These values fall within the statisticalbounds for possible moment tensors at Augustine, which were givenby Dawson et al. (2011) as [0.49±0.22:0.75±0.14:2.00]. The time-histories of the moment tensors for the two solutions shown in Figs. 10and 11 also show a similar pattern of inflation followed by two cyclesof deflation–reinflation. This pattern is seen in theMzz component as up-wardmotion followed by two ormore cycles of downward–upwardmo-tion. These patterns are consistent with a pressurization (inflation) anddepressurization (deflation) of a sill over a time scale of 1–2 min. Notethat there may be deflation signals with periods greater than 30 s thatwe do not measure due to the limitation imposed by the passband ofthe seismometers. The presence of such signals would mean that the in-flation–deflation process we describe could be relatively smaller oscilla-tions superimposed on an overall gradually changing deflation signal.This type of time-history of themoment tensor has been observed previ-ously at Popocatepetl and Augustine volcanoes during explosions(Chouet et al., 2005; Dawson et al., 2011). These common observationspoint to a general source process for Vulcanian explosions at dome-building volcanoes. A model based on diffusive bubble growth hasbeen proposed to explain this behavior (Nishimura, 2004; Chouet etal., 2006) and has been demonstrated to provide an excellent fit themo-ment tensor waveform at Popocatepetl (Chouet et al., 2006; Chouet,2009). The process involves the response of a supersaturated magmato a rapid pressure drop due to explosive degassing. Bubble growth cau-sed by diffusion of volatiles in the supersaturatedmagma induces the ex-pansion of the source volume, which in turn repressurizes the system.
Although the moment tensors for both the force and moment andmoment-only solutions share these common features, they differ greatly
MOMENT TENSOR
Mxx
5 x 10¹⁴ Nm
Myy
Mzz
Mxy
Myz
0 68.25 136.5 204.75
TIME (S)
Mzx
SINGLE FORCE
Fx
5 x 10⁹ N
Fy
0 68.25 136.5 204.75
TIME (S)
Fz
Fig. 10. The source time functions from the source mechanism inversion for 6 moments and 3 forces. From top to bottom, the 6 moments are sorted as Mxx, Myy, Mzz, Mxy, Myz, andMzx. The force components are sorted from top to bottom as Fx, Fy, and Fz. Vertical axes are in SI units, either Nm for moment components or N for the forces.
85M.M. Haney et al. / Journal of Volcanology and Geothermal Research 259 (2013) 77–88
in both their location and amplitude. Frompeak-to-peakmeasurements,theMzz component for the force andmoment solution is ~25×1014 Nmversus a value of ~6.5×10¹⁴ Nm for the moment-only case. The ampli-tude for the moment-only case provides better agreement with theMzz component of the moment tensor obtained at Augustine, whichwas on the order of ~4×10¹⁴ Nm. Based on this comparison, it appears
MOMENT TENSOR
Mxx
2 x 10¹⁴ Nm
Myy
Mzz
Mxy
Myz
0 68.25 136.5 204.75TIME (S)
Mzx
Fig. 11. The source time functions from the source mechanism inversion for 6 momentsonly. From top to bottom, the 6 moments are sorted as Mxx, Myy, Mzz, Mxy, Myz, and Mzx.Vertical axes are in SI units of Nm for moment components.
the force andmoment solution, on the basis of its additional free param-eters, it able to artificially increase the amplitude of the moment tensorwhile modifying the force vector in a way that still provides a good datafit.
A suspicious property of the force andmoment solution is its location,specifically its depth at elevation 1.6 km ASL. This elevation coincideswith the average elevation of the 5 broadband stations (1.62 km). Al-though such a location cannot be ruled out a priori, the fact that theforce andmoment solution is able to attain a distinct minimum in the re-sidual error at an elevation of 1.6 km, as seen in Fig. 12, evokes somedoubt regarding whether it is a reliable solution. Moreover, the particlemotions depicted in Figs. 4 and 7 have initial upward motions, whichwould not be expected for an explosive source located at a higher eleva-tion than some of the stations. Another suspicious coincidence in theforce andmoment solution is that the lateral component of the force vec-tor in Fig. 10 points in a direction of approximately 70° clockwise fromnorth. This is also the same lateral direction for all the particle motionsshown in Fig. 6. Lastly, a compelling piece of evidence against the forceandmoment solution is that the horizontal components of the force vec-tor in Fig. 10 are not in phase with the vertical component. The lack of aconsistent shape among the different force components argues againstthe existence of such a force. This property of the force vector is in con-trast to the moment tensor, whose components are consistently shaped.Unfortunately, the critical absence of the north component of stationRD02 precludes any strong constraint on our solution in that direction.It is clear from Figs. 8 and 9 that the north component of station RD02,were it available, would provide a strong test between the force andmo-ment and moment-only solutions. Based on these coincidences in theforce and moment solution, and the conclusions from (Dawson et al.,2011) regarding the resolution of limited broadband networks, we preferthe moment-only solution occurring at a depth of 0.8 km ASL, in spite ofits reduced data fit.
From the principal axes of the moment-only solution, we can esti-mate the volume and pressure changes at the VLP source. To do so, wefirst find the projection of the principal axes [0.54:0.81:2.00], onto theprincipal axes of the moment tensors for three orthogonal cracksgiven by the ratios [2:1:1], [1:2:1], and [1:1:2]. These represent cracksset in planes normal to the x-, y-, and z-directions, respectively, in thecoordinate frame defined by the principal axes. The principal axes

Longitude (deg)
Lat
itu
de
(deg
)
−152.755 −152.75 −152.74560.49
60.492
60.494
60.496
Longitude (deg)
Ele
vati
on
(km
)
−152.755 −152.75 −152.7451
1.2
1.4
1.6
1.8
Latitude (deg)
Ele
vati
on
(km
)
60.49 60.492 60.494 60.4961
1.2
1.4
1.6
1.8
−152.755−152.75
−152.74560.49
60.4951
1.5
E2 percent error
4 6 8 10
Fig. 12. Slices from the error volume for the inversion for 6 moments and 3 forces. The minimum error solution is shown as a white circle. The slices are through the error volumeoutlined by the solid square and rectangle in Figs. 6 and 7.
86 M.M. Haney et al. / Journal of Volcanology and Geothermal Research 259 (2013) 77–88
estimated from the source time functions that we use here are nor-malized to have a maximum component equal to 2. The actual princi-pal axes we estimate are equal to [0.54:0.81:2.00]×3.3×1014 Nm.The principal axes of the moment tensor for a tensile crack have am-plitudes λΔV, λΔV, and (λ+2μ)ΔV, where ΔV is the volume change
−4 −2 0 2 4−2
0
2
−10
−5
0
5
EW
NS
Mo
men
t [1
014 N
m]
UD
−4
−2
0
2
4−2 0 2
−10
−5
0
5
NS
EW
Mo
men
t [1
014 N
m]
UD
Fig. 13. (Left panel) Moment tensor eigenvectors viewed from the south for the forceand moment solution. (Right panel) The same eigenvectors as in the left panel, exceptviewed from the east. The color scheme in the panels is as follows: major eigenvector(blue), intermediate eigenvector (green), and minor eigenvector (red).
due to the crack opening or closing, λ is Lamé's first coefficient ofthe rock matrix, and μ is the shear modulus (Chouet et al., 2005). Asa result, the above ratios for the cracks assume a Poisson ratio of 1/3at the source (λ = 2 μ), a value appropriate for volcanic rock at ornear liquidus temperatures (Murase & McBirney, 1973; Chouet,1996). The principal axes in this case are equal to 2μΔV [1:1:2], for ex-ample. To find the projection onto the 3 orthogonal cracks, we solvethe matrix equation
0:540:812:00
24
35 ¼
2 1 11 2 11 1 2
24
35 Cx
CyCy
24
35 ð8Þ
for the coefficients of the 3 cracks, Cx, Cy, and Cz. The solution givesCx=−0.30, Cy=− .03, and Cz=1.16. From these ratios, the cracknormal to the y-direction contributes little compared to the othercracks and can be ignored. The ratio of the other two cracks givesCx/Cz=− .26. By combining two cracks in this ratio, we obtain
22−:26
� 1 : 1 : 2½ �−:26� 2 : 1 : 1½ �ð Þ ¼ :55 : :85 : 2:00½ �; ð9Þ
which is close to the principal axes derived from the source timefunction, [0.54:0.81:2.00]. This decomposition suggests that a domi-nant sill and a subdominant dike exist at the source location, withthe dike contributing 26% of the volume change of the sill. Since thesill and dike are combined with a ratio equal to − .26, the sill anddike are out of phase with one inflating while the other is deflating.Recall that the principal axes derived from the source time functioninclude the multiplier 3.3×10¹⁴ Nm. This multiplier is equal to theproduct 2μΔV×(2− .26)/2, where ΔV is the volume change in thesill. By assuming μ=10 GPa (Chouet et al., 2005), this gives a volumechange in the sill of 19,000 m3. As discussed by Chouet et al., (2005),the volume change in the sill can be related to the associated pressure
87M.M. Haney et al. / Journal of Volcanology and Geothermal Research 259 (2013) 77–88
change according to ΔP=(9 μ/16)(ΔV/R3), where R is the radius ofthe sill. If we take R=250 m as a characteristic length scale for thesill, the pressure change is equal to 7 MPa. For the subdominantdike, we similarly compute ΔV=5000m3 and ΔP=1.8 MPa. Thedominant sill and subdominant dike are oriented such that the nor-mal vector to the sill is in the z-direction and the normal vector tothe dike is in the x-direction within the coordinate frame defined bythe principal axes of the moment tensor.
To gain a clearer picture of the geometry of the sill and dike, we needto describe the orientations of the principal axes computed from themo-ment tensor in geographical coordinates.We find that the normal vectorto the sill has an azimuth of ϕ=80° and forms an angle of ϕ=77°withthe horizontal plane. Note that our convention for the ϕ and θ angles fol-lows Chouet et al. (2005): azimuth ϕ is degrees counterclockwise fromeast and elevation angle θ is degrees above the horizontal plane. Giventhese conventions, the dominant sill is subhorizontal and tilted slightlyto the NE. In addition to the sill, the normal vector for the dike has an az-imuth of ϕ=112° and an elevation angle of ϕ=−10°. Thus, the dikestrikes in the WSW–ENE direction.
Finally, it is interesting to compare the depth we find for the VLPsource to the depth of the source of the 23-hour-long precursoryswarm of LP events during the 1989–90 Redoubt eruption. Based oncareful analysis of the repetitive earthquakes, Lahr et al. (1994) arguedthat the entire swarm likely originated from a single point 1.4 kmbelow the crater floor, which corresponds to an elevation of approxi-mately 0.9 km ASL. We find the VLP source from the 2009 eruption isat an elevation of 0.8 km ASL, at an almost identical depth to the 1989LP source. Moreover, the lateral location of the 1989 LP source (Lahr etal., 1994) virtually overlaps with the location we find for the VLP signalfrom the 2009 eruption. Our interpretation of this consistency in the2009 VLP and 1989 LP locations is that the VLP source is composed ofa dominant sill that acts as a shallow magma storage reservoir, whilethe 1989 LP source may have involved a crack-like conduit connectingthe sill to the shallowermagmatic and hydrothermal system at Redoubt.We interpret the commonVLP/LP location to be a long-lived feature thatsits at the base of the volcanic edifice, at the contact of the volcanic pilewith the batholith beneath Redoubt. Thus, both the 1989 LP source andthe 2009VLP source sit at an important structural location in the subsur-face. The differences in the precursory seismicity from the 1989 and2009 eruptions may be the result of variability in the conduit abovethe VLP/LP location. This point is consistent with the results of Benz etal. (1996), who showed that earthquake locations from the 1989 se-quence cluster above the location of the 1989 LP source. We hold offon more quantitative interpretations of the VLP source until completesource reconstructions can be performed using forward modeling ofwaveforms with composite source with crack and/or pipe components(Chouet et al., 2005, 2008, 2010; Dawson et al., 2011).
7. Conclusion
We have analyzed VLP signals from an explosion at Redoubt Vol-cano during the 2009 eruption and find a preferred model for theevent based on a moment tensor source acting to the southwest ofthe crater at a depth of 0.8 km ASL. The limited network of broadbandseismometers at Redoubt posed a challenge for the interpretation ofthe solutions based on force and moment versus moment-only. Thetime-history of the moment tensor from the preferred source modelshows a pattern of pressurization and depressurization that agreeswith previous studies of VLP signals associated with explosions at Po-pocatepetl and Augustine volcanoes. Open questions about the VLPsignals at Redoubt remain concerning which reconstructed sourcemodel provides the best fit to the data. In addition, the relation be-tween the excitations of the VLP signals and the 2009 LP swarms isan interesting challenge for future work. Finally, the inversion ofother explosive events during the 2009 Redoubt eruption shouldshed light on the evolution of the magmatic system during the early
stages of the eruption, from March 23 until the final dome-destroying explosion on April 4. We have demonstrated how to pro-ceed with the interpretation of source mechanism inversions in thepresence of limited broadband seismic data and have shown thatthe methodology can still provide valuable characterization of VLPsource processes.
Acknowledgments
This work has benefited from the comments of 3 anonymous re-viewers. We thank Helena Buurman and Cyrus Read from AVO forbravely deploying the temporary broadbands at Redoubt in the daysbefore the explosive phase of the eruption began. The computationalmodeling for this study was performed on the Sonic cluster at BoiseState University.
References
Akaike, H., 1974. A new look at the statistical model identification. IEEE Transactions onAutomatic Control 19, 716–723.
Aki, K., Richards, P., 1980. Quantitative Seismology. W. H. Freeman and Company, SanFrancisco.
Almendros, J., Chouet, B., 2003. Performance of the radial semblance method for the lo-cation of very long period volcanic signals. Bulletin of the Seismological Society ofAmerica 93, 1890–1903.
Arciniega-Ceballos, A., Chouet, B.A., Dawson, P., 1999. Very long-period signals associ-ated with Vulcanian explosions at Popocatepetl, Volcano, Mexico. Geophysical Re-search Letters 26, 3013–3016.
Arciniega-Ceballos, A., Chouet, B., Dawson, P., Asch, G., 2008. Broadband seismic mea-surements of degassing activity associated with lava effusion at Popocatepetl, Vol-cano, Mexico. Journal of Volcanology and Geothermal Research 170, 12–23.
Aster, R., Zandomeneghi, D., Mah, S., McNamara, S., Henderson, D.B., Knox, H., Jones, K.,2008. Moment tensor inversion of very long period seismic signals fromStrombolian eruptions of Erebus Volcano. Journal of Volcanology and GeothermalResearch 177, 635–647.
Auger, E., D'Auria, L., Martini, M., Chouet, B., Dawson, P., 2006. Real-time monitoring andmassive inversion of source parameters of very long period seismic signals: an appli-cation to Stromboli Volcano, Italy. Geophysical Research Letters 33, L04301.
Benz, H.M., Chouet, B.A., Dawson, P.B., Lahr, J.C., Page, R.A., Hole, J.A., 1996. Three-di-mensional P and S wave velocity structure of Redoubt Volcano, Alaska. Journal ofGeophysical Research 101, 8111–8128.
Cesca, S., Battaglia, J., Dahm, T., Tessmer, E., Heimann, S., Okubo, P., 2008. Effects of to-pography and crustal heterogeneities on the source estimation of LP event at Kilaueavolcano. Geophysical Journal International 172, 1219–1236.
Chouet, B., 1996. New methods and future trends in seismological volcano monitoring.In: Scarpa, R., Tilling, R.I. (Eds.), Monitoring and Mitigation of Volcano Hazards.Springer, New York, pp. 23–97.
Chouet, B., 2009. Nonlinear processes in volcanoes. In: Meyers, R.A. (Ed.), Encyclopedia ofComplexity and Systems Science., volume 10. Springer, New York, pp. 9872–9899.
Chouet, B.A., Page, R.A., Stephens, C.D., Lahr, J.C., Power, J.A., 1994. Precursory swarmsof long-period events at Redoubt Volcano (1989–1990), Alaska: their origin anduse as a forecasting tool. Journal of Volcanology and Geothermal Research 62,95–135.
Chouet, B., Dawson, P., Ohminato, T., Martini, M., Saccorotti, G., Giudicepietro, F., Luca,G.D., Milana, G., Scarpa, R., 2003. Source mechanisms of explosions at StromboliVolcano, Italy, determined from moment-tensor inversions of very-long-perioddata. Journal of Geophysical Research 108, 2019.
Chouet, B., Dawson, P., Arciniega-Ceballos, A., 2005. Source mechanism of Vulcaniandegassing at Popocatépetl Volcano, Mexico, determined from waveform inversionof very long period signals. Journal of Geophysical Research 110, B07301.
Chouet, B., Dawson, P., Nakano, M., 2006. Dynamics of diffusive bubble growth andpressure recovery in a bubbly rhyolitic melt embedded in an elastic solid. Journalof Geophysical Research 111, B07310.
Chouet, B., Dawson, P., Martini, M., 2008. Shallow-conduit dynamics at Stromboli Vol-cano, Italy, imaged fromwaveform inversions. In: Lane, S.J., Gilbert, J.S. (Eds.), FluidMotions in Volcanic Conduits: a Source of Seismic and Acoustic Signals. GeologicalSociety of London, London, pp. 57–84.
Chouet, B.A., Dawson, P.B., James, M.R., Lane, S.J., 2010. Seismic source mechanism ofdegassing bursts at Kilauea Volcano, Hawaii: results from waveform inversion inthe 10–50 s band. Journal of Geophysical Research 115, B09311.
Dawson, P.B., Benitez, M.C., Chouet, B.A., Wilson, D., Okubo, P.G., 2010. Monitoringvery-long-period seismicity at Kilauea Volcano, Hawaii. Geophysical Research Let-ters 37, L18306.
Dawson, P.B., Chouet, B.A., Power, J., 2011. Determining the seismic source mechanismand location for an explosive eruption with limited observational data: AugustineVolcano, Alaska. Geophysical Research Letters 38, L03302.
DeLauro, E., DeMartino, S., Falanga, M., Palo, M., Scarpa, R., 2005. Evidence of VLP vol-canic tremor in the band [0.2–0.5] Hz at Stromboli volcano, Italy. Geophysical Re-search Letters 32, L17303.

88 M.M. Haney et al. / Journal of Volcanology and Geothermal Research 259 (2013) 77–88
Fee, D., McNutt, S., Arnoult, K., Szuberla, C., Olson, J., Lopez, T., 2013. Combining localand remote infrasound recordings from the 2009 Redoubt Volcano Eruption. Jour-nal of Volcanology and Geothermal Research 259, 100–114.
Haney, M.M., 2010. Location and mechanism of very long period tremor during the2008 eruption of Okmok Volcano from interstation arrival times. Journal of Geo-physical Research 115, B00B05.
Haney, M.M., Power, J., West, M., Michaels, P., in press. Causal instrument correctionsfor short-period and broadband seismometers. Seismological Research Letters.
Hotovec, A., Prejean, S., Vidale, J., Gomberg, J., 2013. Strongly gliding harmonic tremorduring the 2009 Eruption of Redoubt Volcano. Journal of Volcanology and Geother-mal Research 259, 89–99.
Kumagai, H., Ohminato, T., Nakano, M., Ooi, M., Kubo, A., Inoue, H., Oikawa, J., 2001.Very-long-period seismic signals and Caldera Formation at Miyake Island, Japan.Science 293, 687–690.
Lahr, J.C., Chouet, B.A., Stephens, C.D., Power, J.A., Page, R.A., 1994. Earthquake classifi-cation, location, and error analysis in a volcanic environment: implications for themagmatic system of 1989–90 eruptions of Redoubt Volcano, Alaska. Journal of Vol-canology and Geothermal Research 62, 137–151.
Lyons, J.J., Waite, G.P., 2011. Dynamics of explosive volcanism at Fuego volcano imagedwith very long period seismicity. Journal of Geophysical Research 116, B09303.
Murase, T., McBirney, A.R., 1973. Properties of some common igneous rocks and theirmelts at high temperatures. Geological Society of America Bulletin 84, 3563–3592.
Nishimura, T., 2004. Pressure recovery in magma due to bubble growth. GeophysicalResearch Letters 31, L12613.
Nishimura, T., Kobayashi, T., Ohtake, M., Sato, H., Nakamichi, H., Tanaka, S., Sato, M.,Ueki, S., Hamaguchi, H., 2000. Source processes of very long period seismic events
associated with the 1998 activity of Iwate Volcano, northeastern Japan. Journal ofGeophysical Research 105, 19135–19147.
Ohminato, T., Chouet, B.A., 1997. A free-surface boundary condition for including 3Dtopography in the finite-difference method. Bulletin of the Seismological Societyof America 87, 494–515.
Ohminato, T., Chouet, B.A., Dawson, P., Kedar, S., 1998. Waveform inversion of verylong period impulsive signals associated with magmatic injection beneath KiluaeaVolcano, Hawaii. Journal of Geophysical Research 103 23,869–23,862.
Ohminato, T., Takeo, M., Kumagai, H., Yamashina, T., Oikawa, J., Koyama, E., Tsuji, H.,Urabe, T., 2006. Vulcanian eruptions with dominant single force components ob-served during the Asama 2004 volcanic activity in Japan. Earth Planets Space 58,583–593.
Power, J.A., Lahr, J.C., Page, R.A., Chouet, B.A., Stephens, C.D., Harlow, D.H., Murray, T.L.,Davies, J.N., 1994. Seismic evolution of the 1989–1990 eruption sequence of Re-doubt Volcano, Alaska. Journal of Volcanology and Geothermal Research 62, 69–94.
Power, J.A., Stihler, S.D., Chouet, B.A., Haney, M.M., Ketner, D.M., 2013. Seismic observa-tions of Redoubt Volcano, Alaska — 1989–2010 and a conceptual model of the Re-doubt magmatic system. Journal of Volcanology and Geothermal Research 259,31–44.
Waite, G.P., Chouet, B.A., Dawson, P.B., 2008. Eruption dynamics at Mount St. Helensimaged from broadband seismic waveforms: interaction of the shallow magmaticand hydrothermal systems. Journal of Geophysical Research 113, B02305.