source: proceedings of the american philosophical … · history of medical imaging author(s):...
TRANSCRIPT

History of Medical ImagingAuthor(s): William G. BradleySource: Proceedings of the American Philosophical Society, Vol. 152, No. 3 (Sep., 2008), pp.349-361Published by: American Philosophical SocietyStable URL: http://www.jstor.org/stable/40541591 .
Accessed: 02/01/2015 11:00
Your use of the JSTOR archive indicates your acceptance of the Terms & Conditions of Use, available at .http://www.jstor.org/page/info/about/policies/terms.jsp
.JSTOR is a not-for-profit service that helps scholars, researchers, and students discover, use, and build upon a wide range ofcontent in a trusted digital archive. We use information technology and tools to increase productivity and facilitate new formsof scholarship. For more information about JSTOR, please contact [email protected].
.
American Philosophical Society is collaborating with JSTOR to digitize, preserve and extend access toProceedings of the American Philosophical Society.
http://www.jstor.org
This content downloaded from 141.213.236.110 on Fri, 2 Jan 2015 11:00:38 AMAll use subject to JSTOR Terms and Conditions

History of Medical Imaging1 WILLIAM G. BRADLEY
Professor and Chairman, Department of Radiology University of California, San Diego
IMAGING began in November 1895 with Wil- helm Conrad Roentgen's discovery of the X-ray. Working with an early cathode ray tube called a Crooke's tube, he
noticed that the invisible rays were able to penetrate some solids (like human flesh) better than others (like bone or metal). He confined himself to his basement laboratory in Würzburg, Germany, for six weeks while Frau Roentgen brought him meals. During that time he discovered most of what the world would know about X-rays for the next twenty years. For his efforts he was awarded the first Nobel Prize in 1901.
X-ray is the basis for what we radiologists call "plane films" or sim- ply "X-rays" used commonly for evaluating the chest and bone frac- tures. The original X-ray films had to go through a wet developer pro- cess in a dark room. If the study was crucial, the radiologist would read it while it was still dripping wet. The term "wet reading" is still used for an emergency radiology report even though many X-rays today are ac- quired digitally without any film at all.
As the X-ray beam became more powerful, patient motion could be visualized and "fluoroscopy" became possible. In the 1920s, radiolo- gists began giving patients radio-opaque barium as a swallow or an en- ema and taking films as the barium traversed the gastrointestinal tract. That is how cancers of the esophagus, stomach, and bowel as well as ulcers, diverticulitis, and appendicitis were initially diagnosed by radi- ologists. Fluoroscopy is still in common use today, but it has advanced considerably. In the early days the images were so dim that radiologists had to wear red goggles all day to minimize the time needed to accom- modate to the dim light when they went back into the fluoroscopy suite. Today, with modern image intensifies, that is no longer necessary. In addition, many of the diseases initially diagnosed by fluoroscopy are now diagnosed by computed tomography (CT: see below).
1 Read 26 April 2007.
PROCEEDINGS OF THE AMERICAN PHILOSOPHICAL SOCIETY VOL. 152, NO. 3, SEPTEMBER 2008
[349]
This content downloaded from 141.213.236.110 on Fri, 2 Jan 2015 11:00:38 AMAll use subject to JSTOR Terms and Conditions

350 WILLIAM G. BRADLEY
X-ray is also the basis of mammography, which is a dedicated sys- tem that takes high-resolution images of the breasts, looking for breast cancer. Over the years, the X-ray dose of the mammograms has de- creased, making the examination safer. In addition, the film of the old days has been replaced with digital plates of charge-coupled detectors that feed the images directly to high-resolution workstations (so-called "full field digital mammography").
X-ray tomography was introduced in the 1940s, allowing "tomo- grams" or slices to be obtained through tissues without the over- or under-lying tissue's being seen. This was achieved by rotating the X-ray tube so that only the desired slice of tissue stayed in focus during tube rotation. Tomography per se is no longer performed, having been re- placed with CAT (computerized axial tomography) scanning or CT (see below). Both CT and MRI are tomographic techniques that display the anatomy in slices rather than through and through projections (like an X-ray).
X-ray is also the basis of "angiography," or the imaging of blood vessels. In the early days a radiodense contrast agent like iodine was in- jected directly into the artery of interest. When imaging the brain for a suspected stroke, brain tumor, or vascular malformation, this usually required a direct carotid puncture with a needle somewhat larger than a soda straw. In the late 1950s, the Seldinger technique, in which the arterial puncture takes place in the femoral artery in the groin, was im- ported from the Karolinska Institute in Stockholm. A flexible guide wire is inserted through the puncture needle and a plastic catheter is passed over the guide wire and run through the blood vessels to the organ of interest. Iodinated contrast can then be injected to make a diagnosis, e.g., vascular narrowing of the carotid artery (which could lead to a stroke) or narrowing of the coronary arteries (which could lead to a heart at- tack). Today, interventional radiologists and cardiologists routinely ex- pand narrowed vessels with a balloon ("balloon angioplasty"), often followed by a coil of wire (called a "stent") to keep the vessel open after the procedure.
In the 1950s nuclear medicine entered our armamentarium of diag- nostic imaging tests. In these tests, the source of the X-rays is not an X-ray tube but rather radioactive compounds, which typically emit gamma rays as they decay. They are combined with other compounds that are taken up as part of the disease process to study a particular problem. For example, Technicium 99m can be combined with méthy- lène diphosphonate, which is taken up by bone being invaded by a tumor. So, for example, cancer of the breast or lung, which tends to spread ("metastasize") to the bones, can be easily detected by such a nuclear bone scan.
This content downloaded from 141.213.236.110 on Fri, 2 Jan 2015 11:00:38 AMAll use subject to JSTOR Terms and Conditions
HISTORY OF MEDICAL IMAGING 351
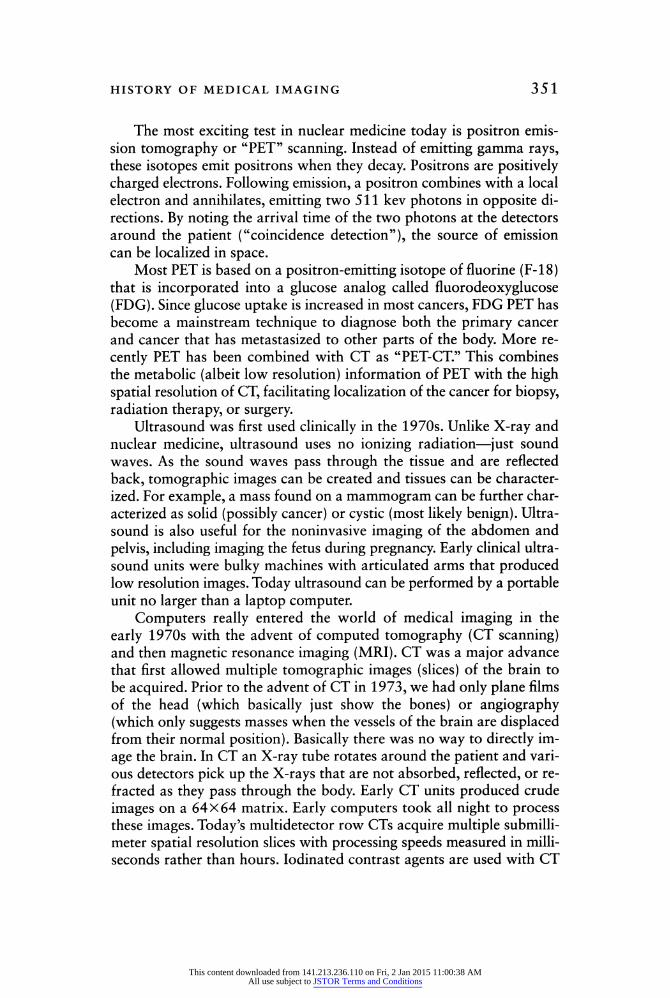
The most exciting test in nuclear medicine today is positron emis- sion tomography or "PET" scanning. Instead of emitting gamma rays, these isotopes emit positrons when they decay. Positrons are positively charged electrons. Following emission, a positron combines with a local electron and annihilates, emitting two 511 kev photons in opposite di- rections. By noting the arrival time of the two photons at the detectors around the patient ("coincidence detection"), the source of emission can be localized in space.
Most PET is based on a positron-emitting isotope of fluorine (F-18) that is incorporated into a glucose analog called fluorodeoxyglucose (FDG). Since glucose uptake is increased in most cancers, FDG PET has become a mainstream technique to diagnose both the primary cancer and cancer that has metastasized to other parts of the body. More re- cently PET has been combined with CT as "PET-CT." This combines the metabolic (albeit low resolution) information of PET with the high spatial resolution of CT, facilitating localization of the cancer for biopsy, radiation therapy, or surgery.
Ultrasound was first used clinically in the 1970s. Unlike X-ray and nuclear medicine, ultrasound uses no ionizing radiation - just sound waves. As the sound waves pass through the tissue and are reflected back, tomographic images can be created and tissues can be character- ized. For example, a mass found on a mammogram can be further char- acterized as solid (possibly cancer) or cystic (most likely benign). Ultra- sound is also useful for the noninvasive imaging of the abdomen and pelvis, including imaging the fetus during pregnancy. Early clinical ultra- sound units were bulky machines with articulated arms that produced low resolution images. Today ultrasound can be performed by a portable unit no larger than a laptop computer.
Computers really entered the world of medical imaging in the early 1970s with the advent of computed tomography (CT scanning) and then magnetic resonance imaging (MRI). CT was a major advance that first allowed multiple tomographic images (slices) of the brain to be acquired. Prior to the advent of CT in 1973, we had only plane films of the head (which basically just show the bones) or angiography (which only suggests masses when the vessels of the brain are displaced from their normal position). Basically there was no way to directly im- age the brain. In CT an X-ray tube rotates around the patient and vari- ous detectors pick up the X-rays that are not absorbed, reflected, or re- fracted as they pass through the body. Early CT units produced crude images on a 64x64 matrix. Early computers took all night to process these images. Today's multidetector row CTs acquire multiple submilli- meter spatial resolution slices with processing speeds measured in milli- seconds rather than hours. Iodinated contrast agents are used with CT
This content downloaded from 141.213.236.110 on Fri, 2 Jan 2015 11:00:38 AMAll use subject to JSTOR Terms and Conditions
352 WILLIAM G. BRADLEY
since they block X-rays based on their density compared with that of normal tissue.
Magnetic Resonance Imaging
MRI also evolved during the 1970s, initially on resistive magnets with weak magnetic fields, producing images with low spatial resolution. Even then, however, it was obvious that the soft tissue discrimination of MRI was superior to that of CT, allowing earlier diagnoses. MR also had the advantage that it did not require ionizing radiation like X-ray- based CT. Over the 1980s and 1990s, superconducting magnets became common, initially at 1.5 Tesla and now at 3 Tesla. (Tesla is a measure of magnetic field strength. The earth's magnetic field, for example, is .00005 Tesla. Thus a 1.5 T magnet has a field strength 30,000 times stronger than that of the earth.)
Most clinical MRI today uses the hydrogen nucleus because it is so abundant in water and because its nucleus has a property known as spin. Hydrogen nuclei (single protons) resonate at frequencies in the radio- frequency range. The exact resonance frequency depends on the local value of the magnetic field. When a proton resonates, it emits a radio- frequency signal that can be detected by a radio antenna (usually in the form of an RF coil around the body part being imaged).
An MRI scanner consists of a large (usually solenoidal, supercon- ducting) magnet with a 100-centimeter room-temperature bore and a very uniform magnetic field (like 1 part per million [ppm] variation over a 30 cm volume). When imaging is performed, resistive electro- magnets just inside this bore are temporarily activated, generating mag- netic field gradients along the x, y, or z axes in the magnet. These weaker gradient fields add or subtract from the main magnetic field, creating a linear variation in net magnetic field along the three axes. Just inside the gradient coils are radiofrequency (RF) transmit and re- ceive coils.
When exposed to radiowaves at a particular frequency, only those protons at the right value of the magnetic field resonate. Since the strength of the gradient fields and the frequencies being transmitted are known, the location of the hydrogen nuclei can be determined. For ex- ample, if one gradient coil along, say, the x axis is activated, there is a linear variation in magnetic field, and therefore resonance frequency, along the x axis. In practice the body is exposed to an RF pulse con- taining multiple frequencies. By separating the complex radio signals coming from the body into different frequencies (using a Fourier trans- form), each hydrogen nucleus's position along a particular gradient axis can be inferred. The greater the number of protons at a point, the
This content downloaded from 141.213.236.110 on Fri, 2 Jan 2015 11:00:38 AMAll use subject to JSTOR Terms and Conditions

HISTORY OF MEDICAL IMAGING 353
Figure 1. Seventy-four-year-old man who arrived at the hospital seven hours following a stroke (not in time for tPA). A. T2WI on admission is normal. B. Diffu- sion image on admission shows restricted motion of water in the hyperintense basal ganglia - which is the core of the stroke. C. Perfusion image (mean transit time map) shows the larger area at risk for extension of the stroke if there is no treatment. The difference between B and C is called the "ischemie penumbra" and is the brain at risk for the extension of the stroke. D. T2WI twelve weeks later shows that the initial perfusion (MTT) map accurately predicted the size of the resulting infarcì (stroke).
greater the amplitude of the signal at a particular frequency. By know- ing position and amplitude, one can produce an MR image (fig. 1).
Conventional MR imaging assumes that all protons resonate at ex- actly the same frequency at a given field strength. In actuality, protons in different chemical environments may resonate at slightly different frequencies even if the field strength is the same. (This is the basis for nuclear magnetic resonance or "NMR" in chemistry.) By making the magnetic field 10 times more uniform, e.g., 0.1 ppm, over a small re- gion of the brain and by suppressing water, different chemical species with slightly different resonance frequencies (or "chemical shifts") can be detected. This is known as "MR Speçtroscopy" (MRS). It gives us the ability to perform chemical analysis of the brain noninvasively (fig. 2). For example, with MRS we can detect N-acetyl aspartate (NAA), which is a marker of normal neurons. When normal brain is replaced by tu- mor or infection, the NAA in that part of the brain is decreased. NAA is also decreased in dementia. We can also detect choline, which arises from membrane turnover. It is elevated in tumors but not in abscesses. Thus two processes that might appear similar on conventional MRI,
This content downloaded from 141.213.236.110 on Fri, 2 Jan 2015 11:00:38 AMAll use subject to JSTOR Terms and Conditions

354 WILLIAM G. BRADLEY
e.g., tumor and abscess, can be differentiated on the basis of the choline level by using MRS. In fact, the more malignant the brain tumor, the higher the choline and the lower the NAA levels.
By varying the timing of the RF pulses, different types of MR con- trast can be produced. These can be based on fundamental NMR pa- rameters like the Tl and T2 relaxation times, or they can be based on motion of water or blood (just to name a few). For example, on an im- age that is sensitive to T2 differences (a "T2-weighted image"), we can distinguish different forms of hemoglobin and tell when bleeding oc- curred. Oxyhemoglobin (the circulating form of blood), for example, has a longer T2 than deoxyhemoglobin, which is found in hematomas in the brain after twenty-four hours. The short T2 of deoxyhemoglobin makes it dark on a T2-weighted image and allows us to distinguish ischemie strokes (which might respond to clot-busting drugs like tPA [tissue plasminogen activase]) from hemorrhagic strokes (which are a contraindication to tPA).
When a task (like finger tapping) is performed, the part of the brain that controls the fingers paradoxically gets more blood than it needs, leading to less oxygen extraction. Since oxygenated blood has a longer T2 than deoxygenated blood, subtraction of images with finger tapping vs. those performed at rest shows the part of the brain involved in the task. This permits us to perform a technique called "functional MRI" (fMRI), which allows us to see the parts of the brain involved in any task. This richness of contrast mechanisms is the primary advantage of MRI over CT.
Functional MRI is complementary to another imaging technique called "magnetoencephalography" or "MEG." MEG is similar to the more familiar EEG (electroencephalograpy) although it is better than EEG for localizing signals coming out of the brain. The electrical sig- nals of EEG are distorted by the scalp and other conducting tissues be- tween the brain and the electrodes on the skin. The electrical currents picked up by EEG also produce weak magnetic fields picked up by MEG - but without the distortion caused by the scalp. Because the magnetic fields coming out of the brain are many orders of magnitude less than the earth's magnetic field, MEG needs to be performed in a special magnetically shielded room. MEG can be used to localize seizure activity for possible surgery. Like fMRI, it can be used to show brain activation with a certain task. While fMRI is based on blood flow, its temporal resolution is on the order of seconds. MEG, on the other hand, has temporal resolution on the order of milliseconds. The magnetic sig- nals detected by MEG are usually displayed on a three-dimensional MRI that has been blown up like a balloon (see avi #1 in the link in the Suggested Readings below).
This content downloaded from 141.213.236.110 on Fri, 2 Jan 2015 11:00:38 AMAll use subject to JSTOR Terms and Conditions

HISTORY OF MEDICAL IMAGING 355
The sensitivity of MRI to motion allows us to image microscopic water motion ("diffusion imaging") and macroscopic blood flow ("MR angiography"). In diffusion imaging, strong gradient pulses cause wa- ter diffusing randomly in the extracellular space of the brain to get out of phase and to lose signal. In acute stroke, water in the extracellular space of the brain moves into the cells as cytotoxic edema where its mo- tion is limited. Since the water no longer diffuses normally in this area of stroke, it no longer gets out of phase and shows up on a diffusion im- age as an area of brightness (fig. 1). By performing a related technique known as "diffusion tensor imaging," both the magnitude and the di- rection of diffusion can be shown. Major white matter tracts (axons) in the brain can be demonstrated, since water tends to diffuse parallel (rather than perpendicular) to axons. Diffusion tensor imaging (DTI) can be used to show the white matter connections between the parts of the brain that light up on fMRI during a task. DTI (fig. 3) can also show whether white matter tracts are intact next to a brain tumor, or have already been invaded. This allows the neurosurgeon to avoid cutting intact white matter tracts during surgery (fig. 3).
Like the use of iodinated contrast agents in CT, MR also has an in- travenous contrast agent based on paramagnetic gadolinium (Gd). Brain tumors that turn bright, i.e., "enhance," using iodine on CT also en- hance using gadolinium on MRI. Gadolinium (Gd) can also be used to perform "perfusion" imaging of the brain, which provides a measure of cerebral blood flow, mean transit time, and cerebral blood volume. By comparing the diffusion and perfusion scans in stroke patients, thera- peutic decisions (like giving the thrombolytic agent tPA) can be made (fig. 1). The relative cerebral blood volume (rCBV) is decreased in strokes, but is increased in brain tumors. The rCBV represents the capillary density, which is increased by new blood vessel formation ("angiogene- sis") in brain tumors. Thus the area of the tumor with the highest rCBV reflects the most malignant part of the tumor and becomes the target for the neurosurgeon's biopsy (fig. 4).
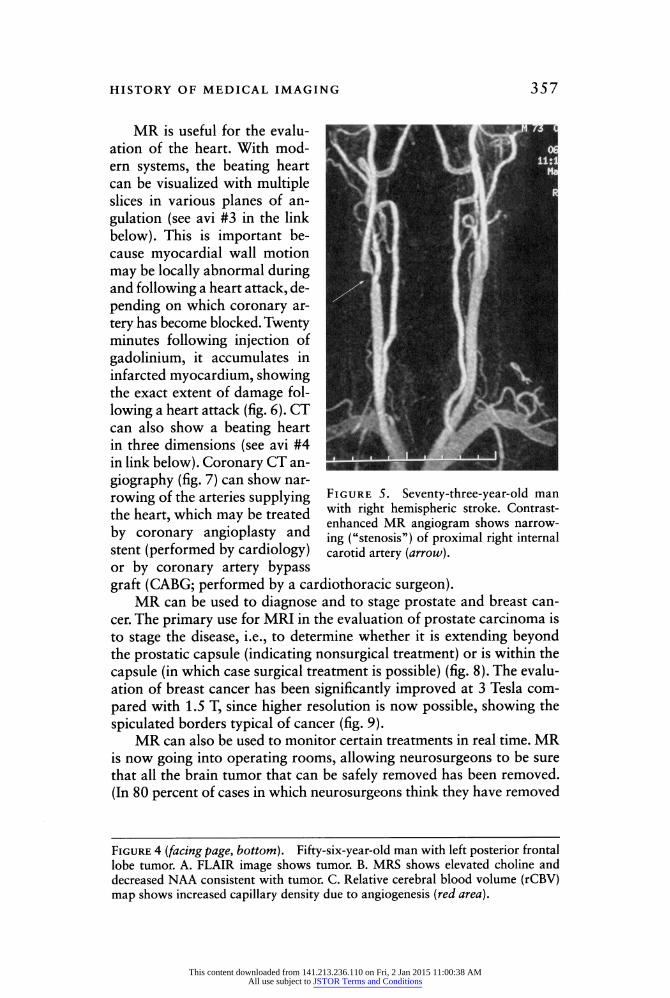
MR angiography can be performed with or without Gd. We typi- cally perform it without Gd in the brain and with Gd when evaluating the carotid arteries or other arteries throughout the body (fig. 5). In the setting of stroke, for example, we may be able to see a narrowed ca- rotid artery, which can be treated either by surgery or by an angioplasty and stent. A major difference between contrast-enhanced MR angiog- raphy and the catheter angiography described above is that the former involves a low-risk venous injection, while the latter involves a more invasive arterial injection. Both catheter angiography and contrast- enhanced MR angiography can show the flow of blood over time (see avi #2 in the link below).
This content downloaded from 141.213.236.110 on Fri, 2 Jan 2015 11:00:38 AMAll use subject to JSTOR Terms and Conditions
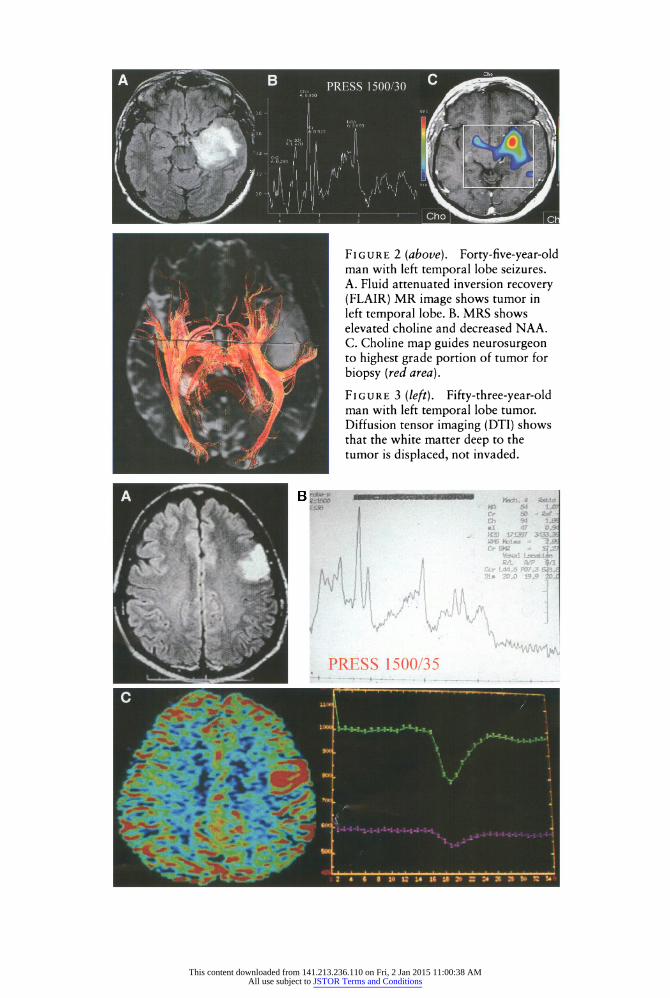
Figure 2 (above). Forty-five-year-old man with left temporal lobe seizures. A. Fluid attenuated inversion recovery (FLAIR) MR image shows tumor in left temporal lobe. B. MRS shows elevated choline and decreased NAA. C. Choline map guides neurosurgeon to highest grade portion of tumor for biopsy (red area). Figure 3 (left). Fifty-three-year-old man with left temporal lobe tumor. Diffusion tensor imaging (DTI) shows that the white matter deep to the tumor is displaced, not invaded.
This content downloaded from 141.213.236.110 on Fri, 2 Jan 2015 11:00:38 AMAll use subject to JSTOR Terms and Conditions
HISTORY OF MEDICAL IMAGING 357
MR is useful for the evalu- ation of the heart. With mod- ern systems, the beating heart can be visualized with multiple slices in various planes of an- gulation (see avi #3 in the link below). This is important be- cause myocardial wall motion may be locally abnormal during and following a heart attack, de- pending on which coronary ar- tery has become blocked. Twenty minutes following injection of gadolinium, it accumulates in infarcted myocardium, showing the exact extent of damage fol- lowing a heart attack (fig. 6). CT can also show a beating heart in three dimensions (see avi #4 in link below). Coronary CT an- giography (fig. 7) can show nar- rowing of the arteries supplying the heart, which may be treated by coronary angioplasty and stent (performed by cardiology)
Figure 5. Seventy-three-year-old man with right hemispheric stroke. Contrast- enhanced MR angiogram shows narrow- ing ("stenosis") of proximal right internal carotid artery (arrow).
or by coronary artery bypass graft (CABG; performed by a cardiothoracic surgeon).
MR can be used to diagnose and to stage prostate and breast can- cer. The primary use for MRI in the evaluation of prostate carcinoma is to stage the disease, i.e., to determine whether it is extending beyond the prostatic capsule (indicating nonsurgical treatment) or is within the capsule (in which case surgical treatment is possible) (fig. 8). The evalu- ation of breast cancer has been significantly improved at 3 Tesla com- pared with 1.5 T, since higher resolution is now possible, showing the spiculated borders typical of cancer (fig. 9).
MR can also be used to monitor certain treatments in real time. MR is now going into operating rooms, allowing neurosurgeons to be sure that all the brain tumor that can be safely removed has been removed. (In 80 percent of cases in which neurosurgeons think they have removed
Figure 4 (facing page, bottom). Fifty-six-year-old man with left posterior frontal lobe tumor. A. FLAIR image shows tumor. B. MRS shows elevated choline and decreased NAA consistent with tumor. C. Relative cerebral blood volume (rCBV) map shows increased capillary density due to angiogenesis (red area).
This content downloaded from 141.213.236.110 on Fri, 2 Jan 2015 11:00:38 AMAll use subject to JSTOR Terms and Conditions
358 WILLIAM G. BRADLEY
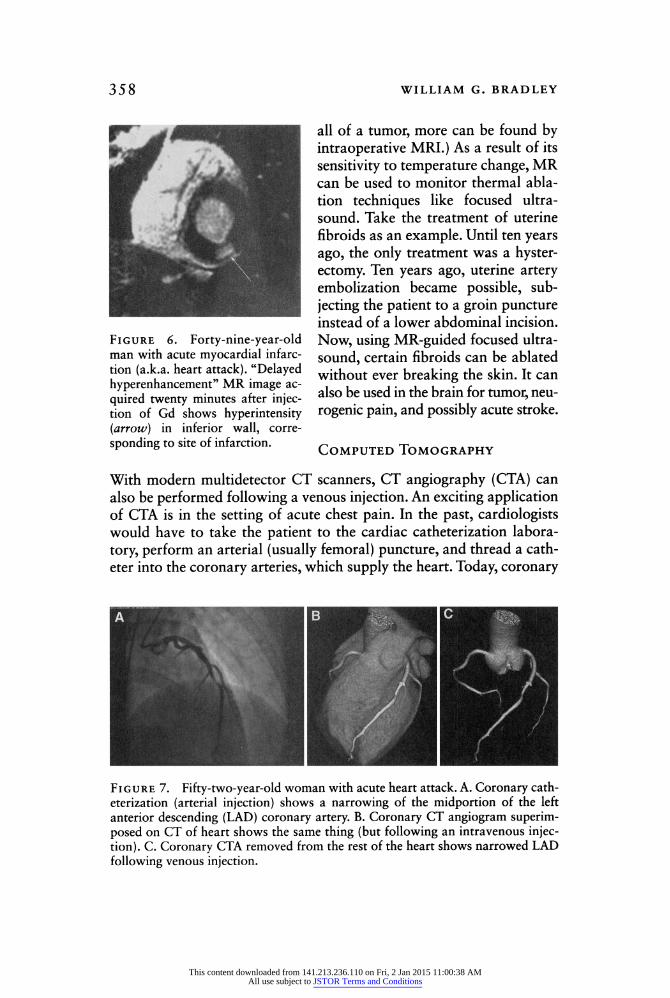
Figure 6. Forty-nine-year-old man with acute myocardial infarc- tion (a.k.a. heart attack). "Delayed hyperenhancement" MR image ac- quired twenty minutes after injec- tion of Gd shows hyperintensity (arrow) in inferior wall, corre- sponding to site of infarction.
all of a tumor, more can be found by intraoperative MRI.) As a result of its sensitivity to temperature change, MR can be used to monitor thermal abla- tion techniques like focused ultra- sound. Take the treatment of uterine fibroids as an example. Until ten years ago, the only treatment was a hyster- ectomy. Ten years ago, uterine artery embolization became possible, sub- jecting the patient to a groin puncture instead of a lower abdominal incision. Now, using MR-guided focused ultra- sound, certain fibroids can be ablated without ever breaking the skin. It can also be used in the brain for tumor, neu- rogenic pain, and possibly acute stroke.
Computed Tomography
With modern multidetector CT scanners, CT angiography (CTA) can also be performed following a venous injection. An exciting application of CTA is in the setting of acute chest pain. In the past, cardiologists would have to take the patient to the cardiac catheterization labora- tory, perform an arterial (usually femoral) puncture, and thread a cath- eter into the coronary arteries, which supply the heart. Today, coronary
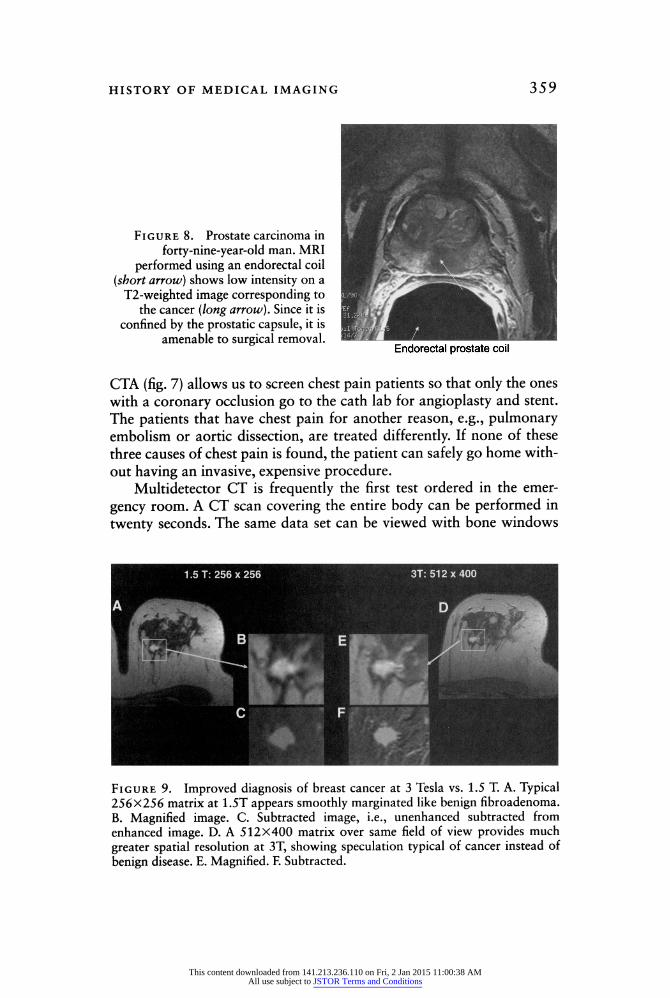
Figure 7. Fifty-two-year-old woman with acute heart attack. A. Coronary cath- eterization (arterial injection) shows a narrowing of the midportion of the left anterior descending (LAD) coronary artery. B. Coronary CT angiogram superim- posed on CT of heart shows the same thing (but following an intravenous injec- tion). C. Coronary CTA removed from the rest of the heart shows narrowed LAD following venous injection.
This content downloaded from 141.213.236.110 on Fri, 2 Jan 2015 11:00:38 AMAll use subject to JSTOR Terms and Conditions
HISTORY OF MEDICAL IMAGING 359
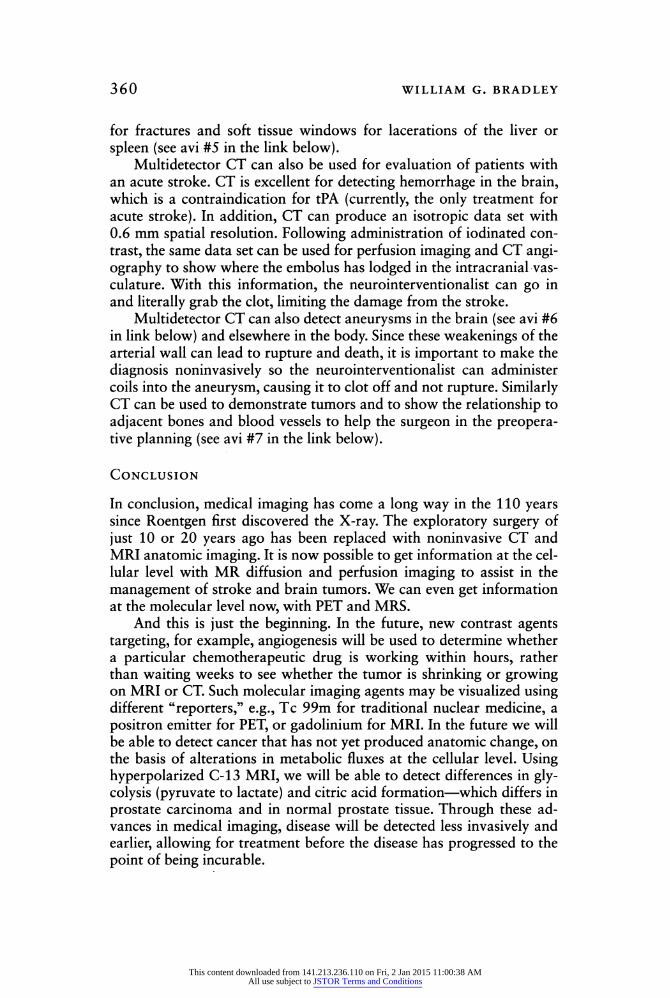
Figure 8. Prostate carcinoma in forty-nine-year-old man. MRI
performed using an endorectal coil (short arrow) shows low intensity on a T2-weighted image corresponding to
the cancer (long arrow). Since it is confined by the prostatic capsule, it is
amenable to surgical removal.
CTA (fig. 7) allows us to screen chest pain patients so that only the ones with a coronary occlusion go to the cath lab for angioplasty and stent. The patients that have chest pain for another reason, e.g., pulmonary embolism or aortic dissection, are treated differently. If none of these three causes of chest pain is found, the patient can safely go home with- out having an invasive, expensive procedure.
Multidetector CT is frequently the first test ordered in the emer- gency room. A CT scan covering the entire body can be performed in twenty seconds. The same data set can be viewed with bone windows
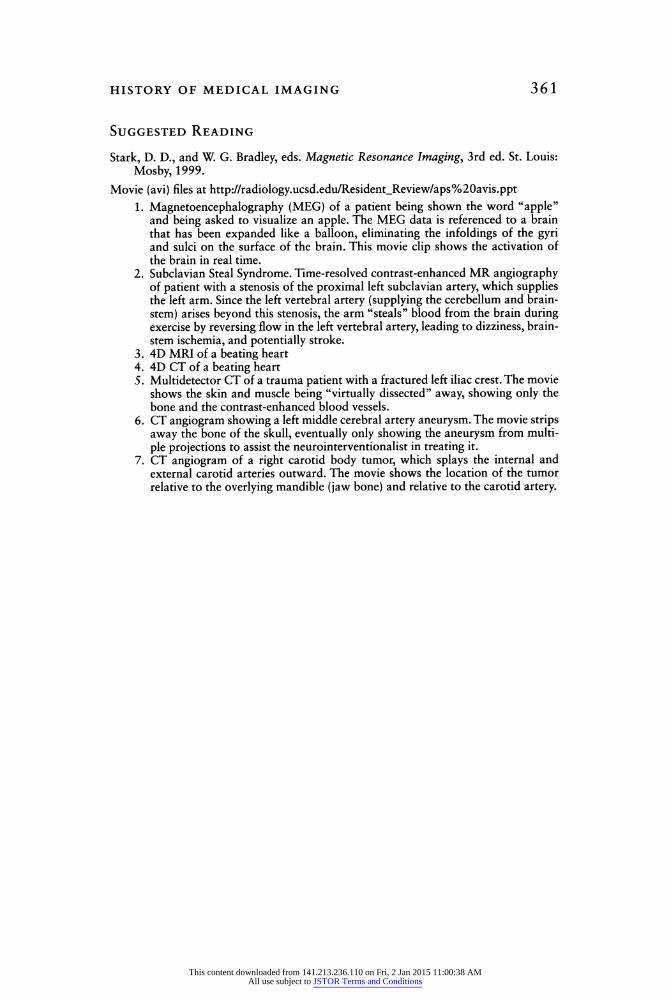
Figure 9. Improved diagnosis of breast cancer at 3 Tesla vs. 1.5 T. A. Typical 256X256 matrix at 1.5T appears smoothly marginated like benign fibroadenoma. B. Magnified image. C. Subtracted image, i.e., unenhanced subtracted from enhanced image. D. A 512X400 matrix over same field of view provides much greater spatial resolution at 3T, showing speculation typical of cancer instead of benign disease. E. Magnified. F. Subtracted.
This content downloaded from 141.213.236.110 on Fri, 2 Jan 2015 11:00:38 AMAll use subject to JSTOR Terms and Conditions
360 WILLIAM G. BRADLEY
for fractures and soft tissue windows for lacerations of the liver or spleen (see avi #5 in the link below).
Multidetector CT can also be used for evaluation of patients with an acute stroke. CT is excellent for detecting hemorrhage in the brain, which is a contraindication for tPA (currently, the only treatment for acute stroke). In addition, CT can produce an isotropie data set with 0.6 mm spatial resolution. Following administration of iodinated con- trast, the same data set can be used for perfusion imaging and CT angi- ography to show where the embolus has lodged in the intracranial vas- culature. With this information, the neurointerventionalist can go in and literally grab the clot, limiting the damage from the stroke.
Multidetector CT can also detect aneurysms in the brain (see avi #6 in link below) and elsewhere in the body. Since these weakenings of the arterial wall can lead to rupture and death, it is important to make the diagnosis noninvasively so the neurointerventionalist can administer coils into the aneurysm, causing it to clot off and not rupture. Similarly CT can be used to demonstrate tumors and to show the relationship to adjacent bones and blood vessels to help the surgeon in the preopera- tive planning (see avi #7 in the link below).
Conclusion
In conclusion, medical imaging has come a long way in the 110 years since Roentgen first discovered the X-ray. The exploratory surgery of just 10 or 20 years ago has been replaced with noninvasive CT and MRI anatomic imaging. It is now possible to get information at the cel- lular level with MR diffusion and perfusion imaging to assist in the management of stroke and brain tumors. We can even get information at the molecular level now, with PET and MRS.
And this is just the beginning. In the future, new contrast agents targeting, for example, angiogenesis will be used to determine whether a particular chemotherapeutic drug is working within hours, rather than waiting weeks to see whether the tumor is shrinking or growing on MRI or CT. Such molecular imaging agents may be visualized using different "reporters," e.g., Tc 99m for traditional nuclear medicine, a positron emitter for PET, or gadolinium for MRI. In the future we will be able to detect cancer that has not yet produced anatomic change, on the basis of alterations in metabolic fluxes at the cellular level. Using hyperpolarized C-13 MRI, we will be able to detect differences in gly- colysis (pyruvate to lactate) and citric acid formation - which differs in prostate carcinoma and in normal prostate tissue. Through these ad- vances in medical imaging, disease will be detected less invasively and earlier, allowing for treatment before the disease has progressed to the point of being incurable.
This content downloaded from 141.213.236.110 on Fri, 2 Jan 2015 11:00:38 AMAll use subject to JSTOR Terms and Conditions
history of medical imaging 361
Suggested Reading
Stark, D. D., and W. G. Bradley, eds. Magnetic Resonance Imaging, 3rd ed. St. Louis: Mosby, 1999.
Movie (avi) files at http://radiology.ucsd.edu/Resident_Review/aps%20avis.ppt 1. Magnetoencephalography (MEG) of a patient being shown the word "apple"
and being asked to visualize an apple. The MEG data is referenced to a brain that has been expanded like a balloon, eliminating the infoldings of the gyri and sulci on the surface of the brain. This movie clip shows the activation of the brain in real time.
2. Súbela vian Steal Syndrome. Time-resolved contrast-enhanced MR angiography of patient with a stenosis of the proximal left subclavian artery, which supplies the left arm. Since the left vertebral artery (supplying the cerebellum and brain- stem) arises beyond this stenosis, the arm "steals" blood from the brain during exercise by reversing flow in the left vertebral artery, leading to dizziness, brain- stem ischemia, and potentially stroke.
3. 4D MRI of a beating heart 4. 4D CT of a beating heart 5. Multidetector CT of a trauma patient with a fractured left iliac crest. The movie
shows the skin and muscle being "virtually dissected" away, showing only the bone and the contrast-enhanced blood vessels.
6. CT angiogram showing a left middle cerebral artery aneurysm. The movie strips away the bone of the skull, eventually only showing the aneurysm from multi- ple projections to assist the neurointerventionalist in treating it.
7. CT angiogram of a right carotid body tumor, which splays the internal and external carotid arteries outward. The movie shows the location of the tumor relative to the overlying mandible (jaw bone) and relative to the carotid artery.
This content downloaded from 141.213.236.110 on Fri, 2 Jan 2015 11:00:38 AMAll use subject to JSTOR Terms and Conditions