source reduction by european testing schedules … source reduction by...source reduction by...
TRANSCRIPT
Source Reduction by European Testing Schedules
(SRETS)
Final Report
1. February 1996 - 31. January 1999
Contract N° SMT4-CT95-2005 (DG 12 - RSMT)
Project partner:
Fraunhofer-Institut Chemische Technologie (Co-ordinator)
Pira International
Packforsk - Swedish Packaging Research Institute
Fraunhofer-Institut Materialfluß und Logistik
Laboratoire National D´Essais
Beratung, Forschung, Systemplanung, Verpackung e.V.
Robert Bosch GmbH
Tetra Pak Carton Systems (replaced Tetra Pak affiliated company Alfa Laval Materials,
who left the project within the first year)
J&B Scotland LTD
Hunting Engineering Ltd

SRETS
Final Report
SRETS
Final Report
Source Reduction by European Testing Schedules
(SRETS)
Final Report
1. February 1996 - 31. January 1999
Contract N° SMT4-CT95-2005 (DG 12 - RSMT)
Ulrich Braunmiller
Editor
Fraunhofer ICT
Postfach 1240, D-76318 Pfinztal, Germany

SRETS
Final Report
SRETS (Source Reduction by European Testing Schedules) is supported by the EC (European Commission) Stan-dards, Measurements and Testing Programme (SM&T). Subordinated to Contract No SMT4-CT95-2005, SRETS is project No 2109.
SRETS
Final Report
Foreword SRETS (Source Reduction by European Testing Schedules) was supported by the EC (European Commission) Standards, Measurements and Testing Programme (SM&T). Subordinated to Contract No SMT4-CT95-2005, SRETS was project No 2109. It was the aim of the SRETS project to complete the existing standards concerning the testing of package through the “random vibration“ test. Furthermore should a test schedule be made. Partial aims of the project were:
• To examine the correlation between damages and products, and to classify the products by means of sensitiveness.
• To make a database with measured data. • To define mechanic-dynamic transporting tests and to verify these tests. • To assemble the results in a test schedule. • To make suggestions for transportation standards.
Co-ordinator of the SRETS project was Dr.-Ing. Ulrich Braunmiller, Fraunhofer ICT, Pfinztal, Germany. All project partners contributed to the content of this report, which was written in co-operation by the following taskleaders:
Ulrich Braunmiller, Fraunhofer ICT, DE Richard Roberts, Pira International, UK Thomas Trost, Packforsk - Swedish Packaging Research Institute, SE Torsten Schreiber, Fraunhofer-Institut Materialfluß und Logistik, DE Bertrand Legue, Laboratoire National D´Essais, FR Thomas Blome, Beratung, Forschung, Systemplanung, Verpackung e.V., DE
The remarks, suggestions, and thoughts of the following members of the SRESTS consortium also contributed to the final report:
Ihsan Karaoguz and Johannes Bohrer, Robert Bosch GmbH, DE Filippo Romanini, Tetra Pak Carton Systems, IT George Wardrop, J&B Scotland LTD, UK David Richards, Hunting Engineering Ltd, UK
The whole consortium is grateful for the support and the instruction by Dr. Achim Boenke, Commission of the European Communities, DG XII - Science, Research and Development. Furthermore we want to thank all those people from the participating institutions who were involved in the project. Without the persevering and fruitful co-operation of all partners above this project would not have been realised.
SRETS
Final Report
Content
1 Introduction...............................................................................................................1
2 Technical Approach and Results .................................................................................6 2.1 Opinion Poll of European Testing Houses and Product Manufacturers by a
Questionnaire ....................................................................................................6 2.1.1 Procedure..................................................................................................6 2.1.2 The structure of the questionnaire .............................................................7 2.1.3 The results of the questionnaire...............................................................11
2.2 Identification of damage inducing mechanisms .................................................13
2.2.1 Objective.................................................................................................13 2.2.2 General results ........................................................................................14
2.2.2.1 Introduction ................................................................................14 2.2.2.2 Causes of damage.......................................................................15 2.2.2.3 Corrugated material due to impacts and vibration during
shipment ...................................................................................21 2.2.2.4 Corrosion-sensitive products exposed to moisture ........................23
2.2.3 Summary and discussion..........................................................................27 2.3 Measurements and Data...................................................................................32
2.3.1 Objective.................................................................................................32 2.3.2 Performance of the measurements ..........................................................32
2.3.2.1 Method .......................................................................................32 2.3.2.2 Covert measurements..................................................................32 2.3.2.3 Overt measurements ...................................................................34 2.3.2.4 Comparison of data sets ..............................................................36 2.3.2.5 Literature Data ............................................................................39
2.3.3 Methodological Strategies .......................................................................40 2.3.3.1 Data evaluation procedures .........................................................40
2.3.3.1.1 Validation of data.........................................................40 2.3.3.1.2 Selection of Data..........................................................40 2.3.3.1.3 Non stationary data......................................................41 2.3.3.1.4 Identification of events .................................................41 2.3.3.1.5 Identification and treatment of shocks..........................41 2.3.3.1.6 Identification and treatment of periodic parts ...............42
2.3.3.2 Analysis Procedures .....................................................................42 2.3.3.2.1 Values and Counting....................................................43 2.3.3.2.2 Time domain methods..................................................43
SRETS
Final Report
2.3.3.2.3 Frequency domain methods..........................................44 2.3.4 Analysed data .........................................................................................45
2.3.4.1 Evaluation of Discrete Measured Data..........................................45 2.3.4.1.1 Verification of Covert Data ...........................................46 2.3.4.1.2 Relationship Between The Data From The Two Capture
Options........................................................................47 2.3.4.1.3 Results .........................................................................49
2.3.4.2 Evaluation of Simulated Transport Measurements ........................52 2.3.4.2.1 Relationship Between Vibration and Shock ...................52 2.3.4.2.2 Spectral Content of Vibrations......................................52 2.3.4.2.3 Spread of Vibration Amplitudes ....................................52 2.3.4.2.4 Shock Amplitudes ........................................................55 2.3.4.2.5 Shock Occurrence Rates ...............................................55 2.3.4.2.6 Relationship Between Axes, influence of vehicle types
and roads ....................................................................56 2.3.5 Conclusions and recommendations..........................................................57
2.4 Test Derivation..................................................................................................59
2.4.1 Objective.................................................................................................59 2.4.2 Results ....................................................................................................59
2.4.2.1 Test spectra .................................................................................59 2.4.2.1.1 Grms method...............................................................59 2.4.2.1.2 APD method ................................................................61 2.4.2.1.3 Conventional PSD approach .........................................62 2.4.2.1.4 FDS method .................................................................65
2.4.2.2 Shock profiles..............................................................................67 2.4.2.2.1 FDS method .................................................................67 2.4.2.2.2 Statistical approach to derive shock profiles ..................67
2.4.3 Proposed test schedules...........................................................................68 2.4.3.1 Known transport conditions.........................................................68 2.4.3.2 Unknown transport conditions.....................................................69
2.4.4 Conclusions and recommendations..........................................................70 2.5 Field and Lab Tests............................................................................................71
2.5.1 Objective.................................................................................................71 2.5.2 Effect of practical testing limitations ........................................................71 2.5.3 Laboratory Tests ......................................................................................73
2.5.3.1 Results.........................................................................................73 2.5.3.1.1 Conventional PSD approach .........................................73 2.5.3.1.2 grms method ...............................................................78
2.5.4 Summary.................................................................................................80 2.6 Proposed Methods............................................................................................80
2.6.1 Evaluation of the test schedules...............................................................80 2.6.1.1 The conventional PSD approach...................................................80 2.6.1.2 The GRMS method ......................................................................81
SRETS
Final Report
2.6.1.3 The APD method .........................................................................81 2.6.1.4 The FDS method..........................................................................82 2.6.1.5 The shock testing ........................................................................82
2.6.2 Discussion of the results ..........................................................................83 2.6.3 Conclusions and recommendations..........................................................84
3 Databases ................................................................................................................85 3.1 Measured Data .................................................................................................85 3.2 Analysed Data ..................................................................................................86
4 Project Summary......................................................................................................88 4.1 Tasks and aim of the project .............................................................................88 4.2 Results..............................................................................................................89
4.2.1 Transportation damages ..........................................................................89 4.2.2 Data acquisition and data analysis............................................................90 4.2.3 Test spectra diversion ..............................................................................90 4.2.4 Verification of the test spectra .................................................................91 4.2.5 Suggested test spectras ...........................................................................92
5 Literature and references .........................................................................................93
6 Annex 1: Literature Data ..........................................................................................96
7 Annex 2: Test Method on Random Vibration Test...................................................110
8 Annex 3: Test Schedules ........................................................................................117
SRETS
Final Report 1
1 Introduction
The aim of the project SRETS (Source Reduction by European Testing Schedules) was to gather data from a number of sources and a wide range of packed products being transported throughout Europe. The collected data formed the basis for setting up state-of-the-art in Europe for test methods and test schedules of packages and prod-ucts. Selected measured data were the basis for vibration analyses and simulation in the packaging laboratory, as well as complete testing schedules for different distribution chains and even the use of products during their life-cycle. This pre-normative project results also in a method for random vibration testing and testing schedules on packages. The methods are to be submitted to CEN. The background for this project illustrated in multiple reports and magazines are the very high costs that are associated with damage occurring during the distribution of products. Among the older, more systematic approaches in analyzing damage costs and damage ratios for different products/trades should be mentioned [1,2 and 24]. More recently, especially Scandinavian research organisations such as the Danish Packaging and Transportation Research Institute, Lund University and the Swedish Packaging Re-search Institute have attempted to quantify and illustrate direct or indirect costs caused by damage or fatigue during transportation. One rough, though realistic, concluding estimate of direct distribution damage costs on a European level was presented at the CEEES (Committee of European Environmental Engineering Societies) workshop in Brussels in February 1996, which was concluded from a group of European experts. In figure 1, a modified version with respect to the SRETS project is given.
• Very high damage• Systematic assessment of product/package/distribution
40 x 300,000 = 12,000,000 per day1%100 Euro2503,000,000,000 Euro per year300,000,000 Euro per year
No of packagesDamage rateDamage costDays per yearTotal damage cost10% saving (due to SRETS)
Example
Figure 1: Estimate of European direct transportation damage costs and potential savings
with a systematic environmental engineering approach (SRETS).
It should be observed from figure 1 that the estimated ‘efficiency’ to be obtained from tailoring the product/package performance, as a result of the systematic approach of the SRETS project, is a conservative 10%.
SRETS
Final Report 2
It should further be noticed about the numbers figure 1 that the given damage rate of 1% is normally a little too high, especially in the well developed countries. As a thumb rule, domestic transportation of non-sensitive goods on well developed routes (so-called door-to-door-transports) in the Nordic countries has a damage rate of 0.25%. Where different modes of transportation are involved, in cases of for example mixed cargo or many long-hauled transports, the damage rate is higher. The given damage cost per occurrence (100 Euro) is obviously too low, even if it is intended to illustrate direct costs only (which means that for example costs due to customers lost, reduced goodwill, pro-duction disturbances, etc. are not included). So, the direct damage cost is just the tip of the iceberg. Today, the indirect costs, caused by inadequate packaging/transportation, are a still greater problem for the companies as the fight for market shares is getting tougher. To summarize, the important thing illustrated in figure 1 is that much money is wasted in the distribution and that a systematic approach to these problems offers a great po-tential for both industry, society and consumers. The work of this project was divided into 7 tasks, see figure 2. For each task there is a box telling that focus will be placed either on random vibration or on random vibration and test schedules. For example, Task 2, Environmental data, will only be covering ran-dom data.
SRETS
Final Report 3
Random Vibration& Test Schedules
Random Vibration
Random Vibration& Test Schedules
Random Vibration& Test Schedules
Random Vibration& Test Schedules
Random Vibration
Random Vibration
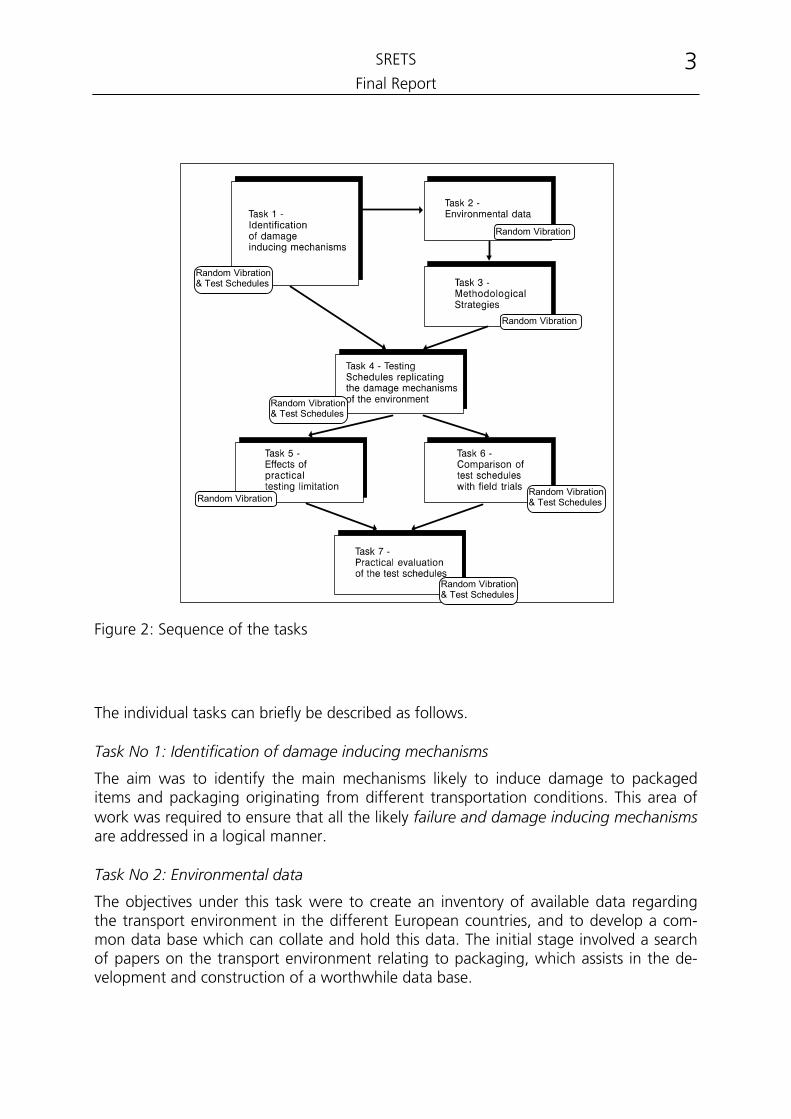
Figure 2: Sequence of the tasks
The individual tasks can briefly be described as follows. Task No 1: Identification of damage inducing mechanisms
The aim was to identify the main mechanisms likely to induce damage to packaged items and packaging originating from different transportation conditions. This area of work was required to ensure that all the likely failure and damage inducing mechanisms are addressed in a logical manner. Task No 2: Environmental data
The objectives under this task were to create an inventory of available data regarding the transport environment in the different European countries, and to develop a com-mon data base which can collate and hold this data. The initial stage involved a search of papers on the transport environment relating to packaging, which assists in the de-velopment and construction of a worthwhile data base.
SRETS
Final Report 4
Task No 3: Methodological strategies
The main objectives of this task were to determine methodological strategies and to develop theories for using the environmental data to create procedures replicating the damage inducing mechanisms. The first step in this task was the validation of data. Problems like non-stationarity were treated. The second step was the processing of available data from Task 2 and to com-pare it with data from other sources. For the analysis, time and frequency domain were mapped out. Task No 4: Testing schedules replicating the damage mechanisms of the environment
The objective of this task was to design test schedules that can be used to identify and qualify the effects of transport on packages and products given a first level of impor-tance to random vibration. The logical solution was to design testing schedules for a few major groups of products and packages characterised by their own sensitivity to damage inducing mechanisms. Task No 5: Effects of practical testing limitation
This task used the result of Task 4 to verify the analysis ”groups” against practical test-ing limitations. Here limitations were imposed by practical testing constraints. Tradition-ally, packages had been evaluated in a relatively limited number of ways. These con-ditions mean many limitations that influence the test methods and how accurately they reproduce the potential damage mechanisms. The objective of this task was to identify how current test methods limit the application of the tests developed from the con-sideration of the various damage mechanisms. Task No 6: Comparison of test schedules with field trials
The ultimate demonstration of the validity of the test schedules is the comparison with reality. The objective of this task was to perform field trials in parallel with laboratory testing of items representing the major groups of packaged products and compare the damage incurred. Task No 7: Practical evaluation of the test schedules
This task considered the collection of the developed test schedules in the course, the check of these schedules by other independent European laboratories, and work out European test schedules for packaging source reduction. The output of the work, with the test schedules, was transferred to the CEN standardisation body, particularly CEN TC 261 ”Packaging”, to be used by all the package testing laboratories throughout Europe. Hopefully, it should also, through the Vienna agreement, be available as an ISO standard or form the input for one. The whole SRETS -SMT- project results in many benefits, project goals, for the European society, such as
SRETS
Final Report 5
• collection of environmental data
• preparation of an open data base for European testing methods and testing schedules. This means that future data could easily be implemented in the da-tabase.
• development of methodological strategies to interpret measured data into relevant test programs
• comparison of damage caused by simulation in the packaging laboratory with damage incurred in field trials
• development of standardised test programs according to the scope of CEN TC 261 ”Packaging” and specifically to CEN/TC 261/SC 1/WG 4 ”Test methods and test schedules”.
SRETS
Final Report 6
2 Technical Approach and Results
2.1 Opinion Poll of European Testing Houses and Product Manufacturers by a
Questionnaire
2.1.1 Procedure
Even though there were 10 European Companies and Research Institutes involved in deriving the testing schedules and in checking and validating the results a much broader basis of acceptance is required in order to implement the testing schedules in the every day testing routines of laboratories and other potential users all over Europe. In order to ensure a broad acceptance of the testing schedules by laboratories all over Europe the SRETS partners tried to involve as many experts on transport simulation and packaging as possible. For this a questionnaire was developed with the intention to gain a general impression of the testing routines and testing limitations of laboratories in countries all over Europe. This way the testing reality could be compared to the testing approach of the partners that were involved in the project and it could be ensured that the approaches that were chosen were representative. Thus the expert-information re-ceived through this questionnaire was helpful in evaluating the results especially with regard to the testing reality in European laboratories. The questionnaire was distributed by the project partners to about 600 European com-panies and organisations that were in some way related to package testing and trans-port simulation. Furthermore a number of specific telephone interviews was conducted to obtain the opinion of experts who were not reached by the distribution of the questionnaire. After gaining a much broader and detailed insight in the general testing approach of European testing laboratories and companies the defined testing schedules picked up and compared with the results of the practical testings.

SRETS
Final Report 7
2.1.2 The structure of the questionnaire
General information (if applicable, more than one box can be checked for each question)
1. What kind of business are you engaged in?Package manufacturerProduct manufacturer (please specify, e.g. electronics, foods, furniture etc.)
________________________________ ___________________Other (please specify, e.g. insurance, research institute etc.)
________________________________ ___________________
2. How frequently do you undertake tests on packages or packaged equipment?Packages Packaged Equipment
DailyWeeklyMonthlyLess than once a month
3. In general, what are your motives for package testing?Ensure that packages or packaged products meet specificquality standards of customersEnsure that packages or packaged products meet specificin-house or national / international standardsSolve specific problems with regard todamaged products or packagingsTesting of new packaging developmentsOther (please specify)
________________________________ __________________________________
4. What are roughly the range of mass and the dimensions of the packagedequipment that is tested?Mass: Minimum ____ [kg] Maximum ____ [kg]Width x Lenght x Height: Minimum ____ [mm] x ____[mm] x ____ [mm]
Maximum____ [mm] x ____[mm] x ____ [mm]
Does this include palletized units? Yes No

SRETS
Final Report 8
Testing facilities (if applicable, more than one box can be checked for each question)
5. What kind of testing facilities do you use?We use our own test laboratory.We use external testing facilities.
6. Which of the following equipment does the laboratory you use include?Hydraulic shaker Electrodynamic shaker Bump test machineBounce test table Drop tower Shock test machineOther (please specify)_________________________________________________
Testing approach (if applicable, more than one box can be checked for each question)
7. Could you please indicate which test standards you refer to when testingagainst road transportation?
Numbers Seldom FrequentlyCEN________________________ISO_________________________IEC_________________________ASTM_______________________DIN_________________________MIL-STD_____________________Others:______________________In-house-standard (please indicate, if based uponany national or international standards)____________________________ ___________________________
8. Which of the following types of tests do you currently use for road transporttesting? What type of test would you prefer given the opportunity?
Currently use Prefer to useSinusoidal test with fixed frequencySinusoidal test with variable frequencyRandom vibration test with one levelMulti level random vibration schedule

SRETS
Final Report 9
9. Which of the following test approaches do you currently use for road transport
testing? What type of test approach would you prefer given the opportunity?Currently use Prefer to use
Vibrations and shocks combined in the same testVibrations and shocks applied separately, but
on the same vibration tableUse of different equipment for shocks and vibration
(i.e. shaker and separate shock test machine)
10 What type of shock testing do you currently use to represent road transportation?What would you prefer given the opportunity?
Currently use Prefer to useHalf sine pulseTrapezoidal pulsSawtooth pulse-----------------------------------------------------------------------------------------------------------------Shock response spectrumReal time signal
11 How do you ususally proceed when simulating road transport by random vibrationtesting?Testing with loose cargo (the test item is not fixed on the platform and may bounce)Testing with secured cargo (the test item is fixed on the platform)Both according to testing circumstances
12 When testing against road transportation do you also test stacked products orpallets? Do you think the tests should include stacking if it was practicable?
Already consider Tests should Tests should notstacking include stacking include stacking
Vibration testingShock testing

SRETS
Final Report 10
Testing parameters
13 What frequency range for vibration testing do you currently usea) for packagesLower bound: _______ Hz Upper bound: _______ Hz
b) for packaged equipment?Lower bound: _______ Hz Upper bound: _______ Hz
14 What amplitudes and durations would you currently use for random vibrationtesting against road transport. (Suppose the frequency range is within 3-100 HzgRMS: _______ g Testing time per 1000 km _______ min
15 What parameters do you currently use for simulating the maximum accelerationand duration of the main shock impacts during road transport (please do notconsider handling)?Peak g value: _______ g Pulse duration: _______ ms
Overall impression on road transport testing
16 How well do you think actual transport tests for road transport reflect the realtransport conditions?The testing severity is too lowThe testing severity is realisticThe testing severity is too strong
17 Do you think there is a need for a new testing standard for road transport?Yes No
Thank you very much for your cooperation!
SRETS
Final Report 11
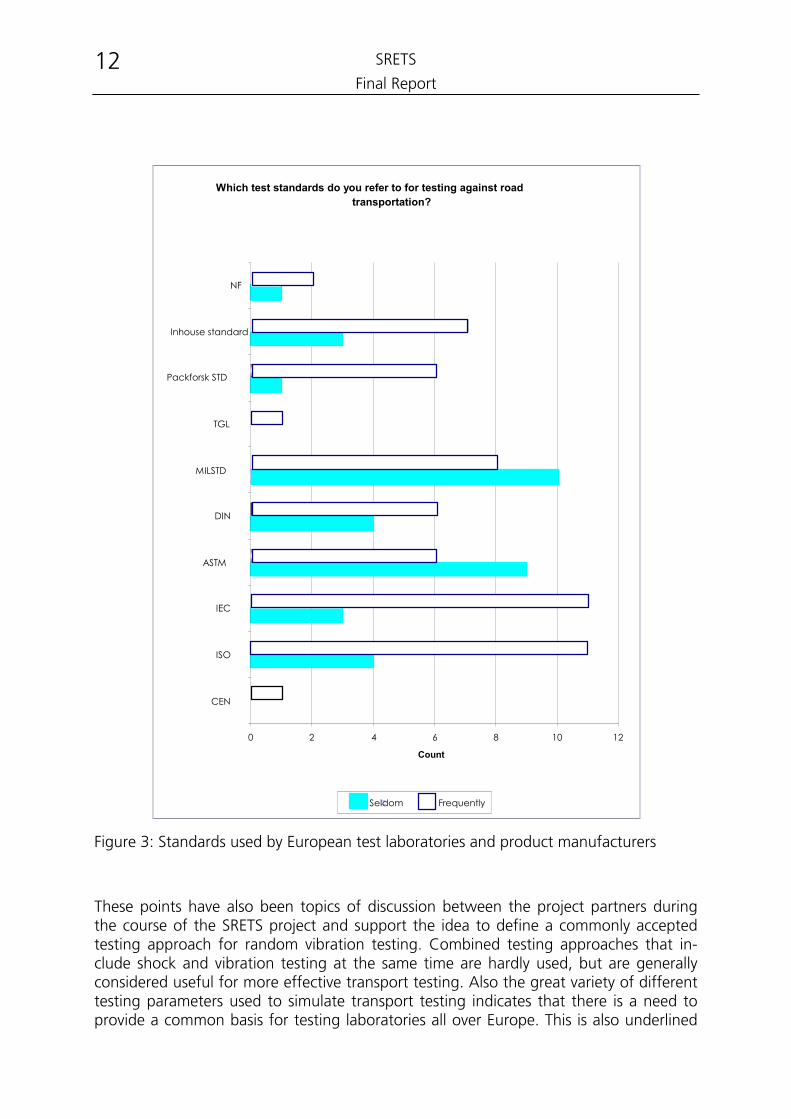
2.1.3 The results of the questionnaire
The questionnaire included sections referring to general information, testing facilities, testing approach, testing parameters and the overall impression on road transport test-ing. From the roughly 600 questionnaires that were distributed by the partners of the SRETS project the total feedback was 48 questionnaires or roughly 8 %, including most of the SRETS project partners. The participants included 16 research institutes or testing laboratories and 25 product manufacturers that are engaged in various business areas ranging from electronics, opto-electronics over liquids, chemicals and various household appliances to aviation and automotive. The feedback to the questionnaire included par-ticipants from the following countries: Sweden, Germany, Switzerland, France, England, Denmark and Tunesia. One of the main outcomes of the questionnaire is the confirmation that the major part of the participants uses a great variety of different testing approaches for road transport testing which indicates a partly confuse testing reality in European testing laboratories. The answers to the questionnaire show the widely spread use of different standards and clearly indicate that the practical use of road transport testing is far from using one commonly accepted standard approach. Companies and laboratories use their specific testing variations and their own testing parameters according to personal experience and assumed product requirements. It turned out that most companies and testing laboratories frequently refer to ISO and IEC standards when testing against road trans-portation. This might be due to the fact that a significant number of the participants had in some way to do with electronic devices. Also ASTM and MILSTD played an im-portant part and a little less often DIN and NF standards were mentioned. It is obvious that depending on the product and business area several national and international standards are used to fulfill the testing requirements. In total 49 times the participants mentioned international standards they would refer to seldom or frequently. The count for these international standards also included American standards, since the question-naire was only distributed within Europe. The total number that national standards were referred to is almost equally high and adds up to 45. These standards include a signifi-cant number of individual in-house standards partly based on ISO, IEC, DIN or US-specifications. With the participants of the questionnaire representing a great variety of experienced research laboratories and product manufacturers from numerous European countries it becomes clear that the diversified approach to transport simulation is not restricted to certain countries or product branches, but is typical for the whole testing industry. At the same time a substantial number of participants is unsatisfied with the present testing situation and does not think that the present testing conditions reflect the reality. Other points of concern to the participants are combined test approaches for shock and vibration testing and the use of multi-level random vibration tests or random vibration tests with one level. The consideration of stacked products or pallets during testing and the approach with fixed or loose cargo when performing the transport simulation are also related points of diversified discussions.
SRETS
Final Report 12
Which test standards do you refer to for testing against roadtransportation?
0 2 4 6 8 10 12
CEN
ISO
IEC
ASTM
DIN
MILSTD
TGL
Packforsk STD
Inhouse standard
NF
Count
Seldom Frequently
Figure 3: Standards used by European test laboratories and product manufacturers
These points have also been topics of discussion between the project partners during the course of the SRETS project and support the idea to define a commonly accepted testing approach for random vibration testing. Combined testing approaches that in-clude shock and vibration testing at the same time are hardly used, but are generally considered useful for more effective transport testing. Also the great variety of different testing parameters used to simulate transport testing indicates that there is a need to provide a common basis for testing laboratories all over Europe. This is also underlined
SRETS
Final Report 13
by the clear vote for the need of a new standard for road transport testing and the scepticism with regard to the testing severity of the existing standards. The results of the questionnaire underline the fact that regardless of the variety of products and consumer markets that were represented by the questionnaire participants there is an enormous potential for individual and non-standardised testing approaches which don't completely satisfy the expectations of the potential users with regard to realistic transport simulation. The approach chosen by the SRETS partners during the project seems to be a representative goal.
2.2 Identification of damage inducing mechanisms
2.2.1 Objective
The aim was to identify the main mechanisms likely to cause damage to packed items and packaging originating from different transportation conditions. Data from literature and companies were collected, compared and analysed in order to get a state-of-the-art description of how damage occurs with respect to products, packaging, secondary packaging, pallet loads, etc. The main work was to establish and describe the most important damage mechanisms and the damage frequency for a selection of products and packages. The direct con-nection between damage mechanisms and the actual damage occurred was searched for. The damage mechanisms vary considerably depending on the packed product but also on the type of transport stress. The following nine important damage mechanisms were studied together with a general part:
1. Equipment containing electronic and mechanical products exposed to impacts and vibration
2. Products with high finish surfaces exposed to vibration 3. Liquid and semiliquid products exposed to impacts 4. Powders and granules exposed to vibration 5. Liquids, semi-liquid products, powders and granules exposed to impacts from
sharp objects 6. Pressure-sensitive products, powders and granules exposed to impacts from
sharp objects 7. Corrugated material due to impacts and vibration during shipment 8. Corrosion-sensitive products exposed to moisture 9. Hygroscopic products exposed to moisture
SRETS
Final Report 14
2.2.2 General results
2.2.2.1 Introduction
Both natural and induced stress mechanisms occur during transportation. Failure criteria for a product could be defined as:
a) deviation of monitored functional parameter levels beyond acceptable limits (which have to be defined)
b) non-fulfilment of safety requirements of specific test item requirements or the development of safety hazards
c) non-fulfilment of specific test item requirements
d) changes to the test item which could prevent the equipment from meeting its intended service life or maintenance requirements
e) deviation from established environmental requirements. Damage could occur for many reasons, such as
• low pressure (altitude) • high temperature • low temperature • temperature shock • solar radiation (actinic and thermal effects) • rain • humidity • fungi, bacteria and algae • insects, rodents and marine organisms • salt fog • chemical and corrosive contaminants • sand and dust • explosive atmosphere • leakage (immersion) • acceleration • vibration • acoustic noise • shock • icing/freezing rain
plus any combination of the above. When transport damage is concerned, it is as simplest when the releasing causes for damage can be concluded directly by observation of the phases - transport, storage and handling - which the cargo is subjected to. As a rule it is not feasible, instead one must make an investigation afterwards, based on the facts that can be collected. The proce-
SRETS
Final Report 15
dure will then have a forensic engineering character, with securing evidence, informa-tion gathering, complementary experiments and investigations and reporting of conclu-sions. Often several factors cooperate for the creation of damage and then give so called syn-ergy effects. As an example high temperature promotes both the grow of mildew on organic material and creep rupture in stacked plastic receptacles.
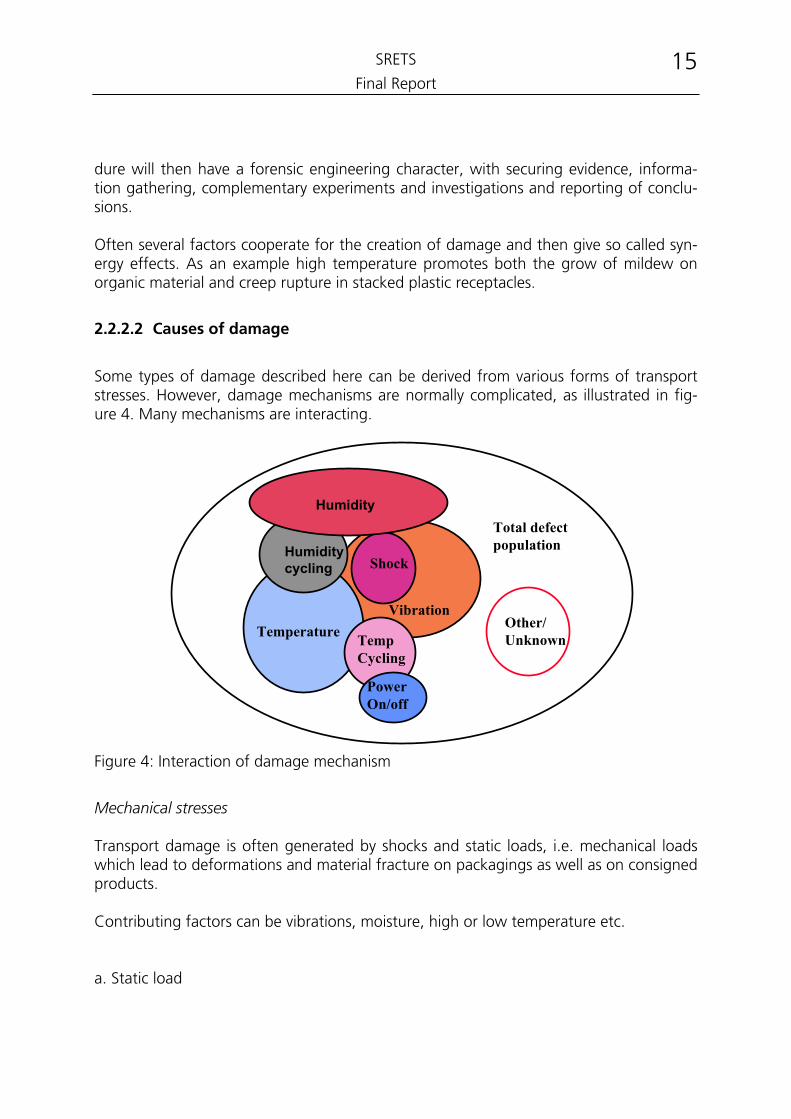
2.2.2.2 Causes of damage
Some types of damage described here can be derived from various forms of transport stresses. However, damage mechanisms are normally complicated, as illustrated in fig-ure 4. Many mechanisms are interacting.
Total defectpopulation
Vibration
Shock
Temperature TempCycling
PowerOn/off
Other/Unknown
Humiditycycling
Humidity
Figure 4: Interaction of damage mechanism
Mechanical stresses Transport damage is often generated by shocks and static loads, i.e. mechanical loads which lead to deformations and material fracture on packagings as well as on consigned products. Contributing factors can be vibrations, moisture, high or low temperature etc. a. Static load
SRETS
Final Report 16
Static forces are such forces which form an equilibrium system of forces with a certain duration, such as that the system they act on is at rest or moves with constant velocity in a certain direction. Forces which cause movement in the form of change in velocity or changed direction, or which are a consequence hereof (inertia forces) can then be de-fined dynamic. There is a diffuse delimitation, for example inertia forces such as cen-trifugal force can have a static character. Also the relatively slow varying loads caused by rough sea can be regarded as (quasi-)static. A pragmatic classification of quasi-static loadings would be those occasions up to for example two thirds of the first natural frequency of the item under consideration. Stacking load, internal or external overpressure and lateral loads are types of static forces which often are present in the transportation phase. In stacks one gets a primarily vertical load, which of course has its maximum on the lower layers. At overload one gets deformations of the types staving and buckling of the packagings, and their contents can be damaged in different ways. If overload is the re-leasing factor, contributing causes can be unsuitable choice of materials, high tempera-ture, moisture, coinciding attacks of chemicals, rust, stress, corrosion. In the following a number of examples will be given. The overload can be a consequence of inertia forces which one has not taken into ac-count for example at rough sea. The actual stacking load can here because of the mo-tion get an increment of up to 0.8 times the load (0.8 g). Moisture or high temperature in, say fibreboard or plastics, reduces the stiffness and increases the risk of buckling. The contents of the packagings has a very varying ability to carry stacking loads. For some types of cargo this ability can be utilized in a constructive manner for packaging and transport. Other types, for example granules with low internal friction, practically lack this ability. In closed jerricans and drums an overpressure can be created, which contributes to the ability to carry stacking loads. The risk is large however, that leakage occurs by deformation of the closure, formation of stress cracks or otherwise, then the pressure disappears. In visco-elastic materials (plastics, fibreboard) there is also a risk for creep buckling, which means that the buckling sequence described above is developed during a long time because of creep (slow extension under constant load) in the material. The stacking load can release stress cracking in plastics. It can also be noted that the damping material in a packaging can have its properties changed by the stacking load (setting), which for example can change resonance frequencies. b. Shocks

SRETS
Final Report 17
Shocks are dynamic loads which occur on transported goods because the road surface is of poor quality, the vehicle is braked, accelerated, shunted or has an uneven motion, or because the cargo falls, topples, is dropped, is thrown or hit by a vehicle. The most common direct cause of transport damage is probably a shock event. The effect of a shock depends on the size of the force as well as its duration. The direct measure of a shock is usually the term impulse. The impulse is related to a velocity change of a mass (change in momentum). But it is not always that a larger impulse causes a larger damage. The largest mechanical stresses are often obtained during handling, irrespective of the chosen mode of transportation. Occurring shocks are the result of the goods (the pack-age) being dropped onto a floor or a platform. When a package with product collides with a rigid body (floor), very high acceleration levels, above 100 g, can occur. It is known that larger packages and unit loads as an average imply lower drop heights, among other things because they are not as easy to handle manually, cannot be thrown etc. The assembly to unit loads is therefore an efficient preventive measure. The damage occurring is typically of the type deformations and fracture, either in the packaging material or in the product. They occur when the shock force and hence the stress in exposed parts becomes so high that the yield strength or the breaking strength respectively, in materials and joints is exceeded. Components can also become detached and cause performance malfunction. c. Vibrations Vibrations are periodic, non periodic or stochastic occurring in dynamic loads. They can be temporarily occurring or rapidly damped-out, so called transient vibrations, which in principle correspond to shock events. Here are meant steady state vibrations, which continue for a relatively long period of time (>1 second) in oscillating systems, and which are excited by for example engine vibrations in ships, uneven road surfaces at road transport or lateral oscillation in rail vehicles. At high load levels of this kind fatigue phenomena can occur. Such levels are seldom reached during transport, but may excite a resonance. Resonance occurs when the natural frequency of the vibrating system (for example a transport package) coincides with the excitation frequency. Many materials show a relationship between strength and the number of load cycles according to an S/N curve, described for example by Fackler [4].
SRETS
Final Report 18
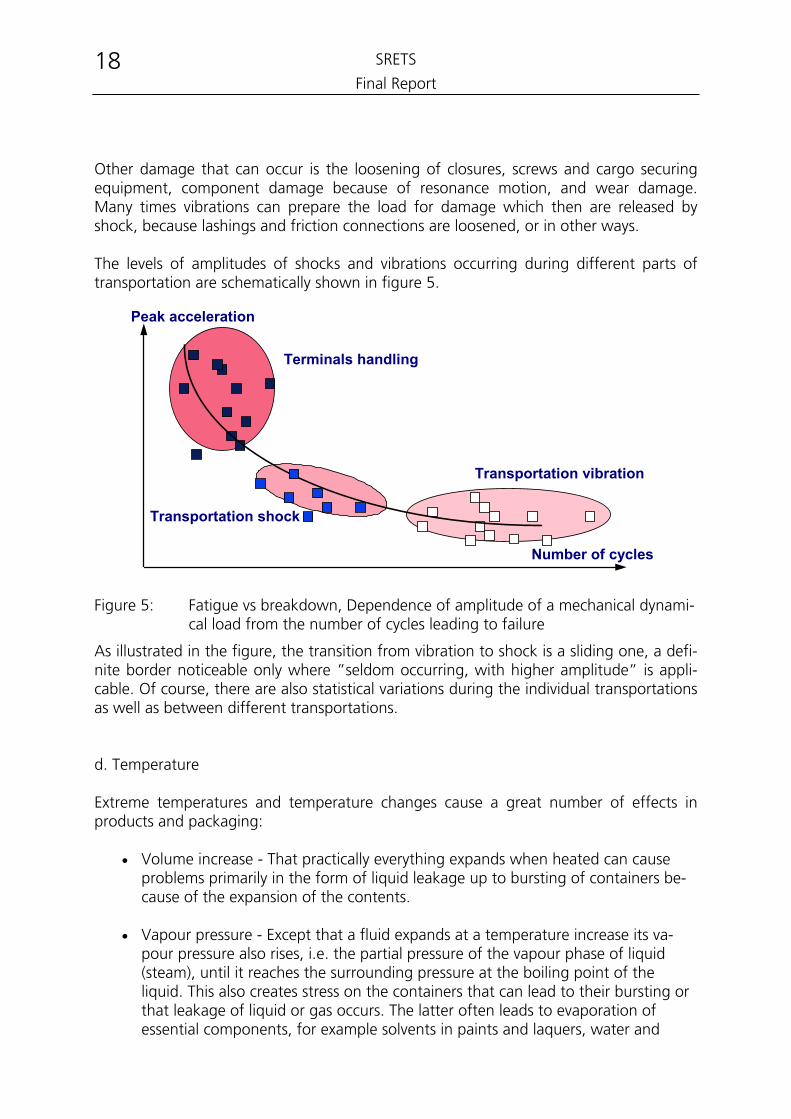
Other damage that can occur is the loosening of closures, screws and cargo securing equipment, component damage because of resonance motion, and wear damage. Many times vibrations can prepare the load for damage which then are released by shock, because lashings and friction connections are loosened, or in other ways. The levels of amplitudes of shocks and vibrations occurring during different parts of transportation are schematically shown in figure 5.
Peak acceleration
Number of cycles
Terminals handling
Transportation shock
Transportation vibration
Figure 5: Fatigue vs breakdown, Dependence of amplitude of a mechanical dynami-
cal load from the number of cycles leading to failure
As illustrated in the figure, the transition from vibration to shock is a sliding one, a defi-nite border noticeable only where ”seldom occurring, with higher amplitude” is appli-cable. Of course, there are also statistical variations during the individual transportations as well as between different transportations. d. Temperature Extreme temperatures and temperature changes cause a great number of effects in products and packaging:
• Volume increase - That practically everything expands when heated can cause problems primarily in the form of liquid leakage up to bursting of containers be-cause of the expansion of the contents.
• Vapour pressure - Except that a fluid expands at a temperature increase its va-
pour pressure also rises, i.e. the partial pressure of the vapour phase of liquid (steam), until it reaches the surrounding pressure at the boiling point of the liquid. This also creates stress on the containers that can lead to their bursting or that leakage of liquid or gas occurs. The latter often leads to evaporation of essential components, for example solvents in paints and laquers, water and
SRETS
Final Report 19
aroma substances in foodstuffs etc. At a temperature decrease one can instead get an underpressure in containers, which destroys them (implosion).
• Phase changes - By a phase change is meant the transformation between the
states solid - liquid - gaseous. Many products have a low melting point, for ex-ample fats. A temperature rise can here lead to melting and thus unwanted shape changes, appearance deterioration or taste deterioration. One can also have a transformation directly from a solid phase to the gaseous phase, which sometimes gives damage, for example freeze burns on frozen foodstuff. Temperature decreases can give frost damage in products which contain liquids, primarily water, which for one thing can give an unwanted separation (can for example cause dregginess in liquids), and also because of the volume increase can lead to the bursting of containers. Water increases its volume with 9% when it freezes to ice. Emulsions are often sensitive to high as well as to low tempera-ture.
• Reactions - Products and systems which are subjected to chemical reactions and
degradation will change more rapidly if the temperature is increased. A rule of thumb is that the reaction rate will double for each 10°C increase of tempera-ture, according to Arrhenius’ equation. Even if the exact velocity increase can have a factor between about 1.5 and 7 this gives a qualitative estimate of the course of the reaction. It applies to for example degradation of polymer materials and foodstuff, fats going rancid, and influence from incompatible contents in re-ceptables.
• Biological factors - When temperature rises, the rate of metabolism increases in
biological material, which often speeds up the degradation. For example for fruit, the carbon dioxide emission increases 4-5 times if temperature rises from 0 to 15°C, and then decreases at 35-40°C and at higher temperatures ceases again because enzymes are destroyed. Insects also develop more rapidly in certain temperature intervals. Oviposition ceases for most species at 10-14°C. Rodents, especially rats, cause a large part of damage and loss.
• Material properties - Construction materials are also in their solid phase tempera-
ture dependent, which is especially evident with polymers and other strongly visco-elastic materials (plastics, rubber, fibreboard etc).
e. Moisture
SRETS
Final Report 20
Water in different forms can very rapidly give damage on transport goods if it is sub-jected to rain, sea water or the similar. Humidity in the air - or absence of it - can also cause damage, perhaps in the longer run. Hygroscopic materials (which interact with the surrounding moisture) can absorb moisture so that they get unsuitable properties (become meshy, sticky, flow apart, conglomerate). From so called sorption isotherm diagrams can be seen how the humidity of the material depends on air humidity. Corrosion is a problem when the air humidity exceeds 60-70%. Already minute traces of condensed water on unprotected metal surfaces give corrosion. On organic materials other types of damage occur, for example accelerated degradation through activation of enzymes, growth of mildew or other microorganisms, or miscolouring. Climatic changes are a common cause of damage with two typical scenarios.
• Cargo (possibly hygroscopic) is loaded into a container in tropical atmosphere (high temperature, high humidity). The atmosphere in the closed container will in this way contain much water vapour. When the temperature decreases the mois-ture condenses, primarily on the roof and walls of the container (which cool off first). Here the condensed water then flows down and wets the contents of the container. Closed packaging can in the corresponding way get condensed water damage on the inside.
• Cargo with relatively high heat capacity, for example metal products, are loaded
in a cool climate. When it is transported to warmer and more humid zones, mois-ture will condense on the cargo that is still cold and cause for example corrosion. The pumping effect is a very serious problem with closed, not ventilated pack-ages, or packages which are not tight.
Especially when transporting containers at sea a lot of moisture and condensation re-lated to damage could occur. The outer protection, the container, can be holed during handling. There are generally five causes for holing:
1. Puncture from exterior sources, i.e., racking against ship superstructure or pier equipment.
2. Puncture from interior sources, i.e., cargo shifting, dunnage breaking loose.
3. The transit locks of the lifting frame come down into the corner castings to handle the container and, if not aligned properly, could puncture holes in the container ceiling.
4. Normal wear, tear and rusting through of the container's celing, sidewalls, or flooring.
5. During the stowage and off-loading process, longshoremen can walk on top of the container. Should they step on or near the roof bows, they could easily puncture a pinhole where the roof bow is secured to the ceiling.
6. Water can enter through worn seals around the container doores, vent places, and so on, or through the deck of the container.
SRETS
Final Report 21
Condensation which can cause severe damage occurs whenever the three following conditions prevail simultaneously:
• There is a source of water vapour. • There is a temperature differential. • There is a clear path for excess water vapour to move from the source to a cold
surface. f. Light Light, and especially the ultraviolet radiation from for example sunlight, has because of its energy contents degrading properties in several ways. When direct sunlight is ab-sorbed in the material, the reaction may make polymers brittle, colours bleached, paper yellow or vitamins destroyed. Biological material is influenced in different ways, for ex-ample by green colouring and solamin production in potatoes, formation of sprouts, etc. g. Other factors Several other factors can under unsuitable circumstances cause damage. Examples are salt spray, air pollution, strong winds, dust and sand, radioactive radiation. Fire may occur as a consequent damage in a complex course of damage, and has in it-self strongly damaging properties. Moisture can promote growth of microorganisms which release selfheating in the cargo so that it finally self-ignites. Among specific results from task 1, two items are chosen to describe some very impor-tant, and although that, not so well-known damage mechanisms.
2.2.2.3 Corrugated material due to impacts and vibration during shipment
This materials behaviour is strongly influenced by the relative humidity. Important properties affected are
— compression strength — box compression strength — bending stiffness — tensile stiffness — bursting strength
One study demonstrated the so called mechanosorptive effects in papers and corru-gated board [12]. This is to say that, for example, a corrugated container in a pallet load during transportation will have a much higher deformation when subjected to a cyclic climate than if the climate is constant at a high relative humidity, see figure 6.
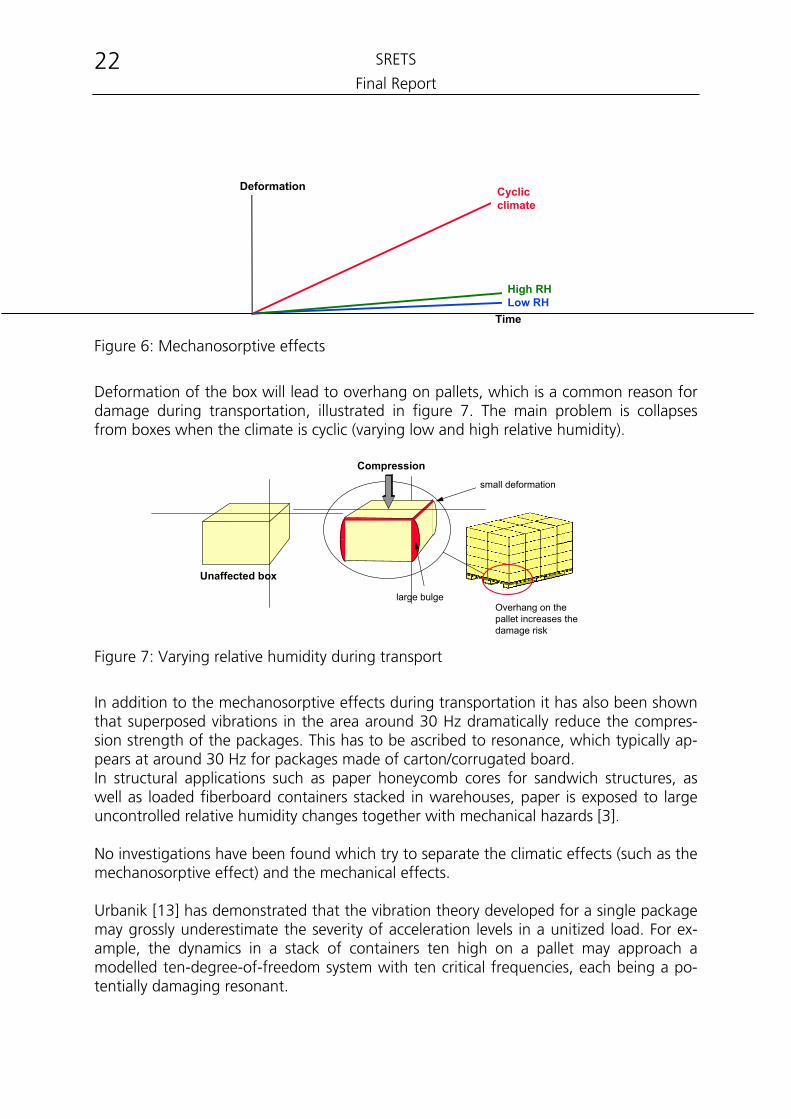
SRETS
Final Report 22
Deformation Cyclic
climate
High RHLow RH
Time Figure 6: Mechanosorptive effects
Deformation of the box will lead to overhang on pallets, which is a common reason for damage during transportation, illustrated in figure 7. The main problem is collapses from boxes when the climate is cyclic (varying low and high relative humidity).
Unaffected box
large bulge
small deformation
Compression
Overhang on the pallet increases thedamage risk
Figure 7: Varying relative humidity during transport
In addition to the mechanosorptive effects during transportation it has also been shown that superposed vibrations in the area around 30 Hz dramatically reduce the compres-sion strength of the packages. This has to be ascribed to resonance, which typically ap-pears at around 30 Hz for packages made of carton/corrugated board. In structural applications such as paper honeycomb cores for sandwich structures, as well as loaded fiberboard containers stacked in warehouses, paper is exposed to large uncontrolled relative humidity changes together with mechanical hazards [3]. No investigations have been found which try to separate the climatic effects (such as the mechanosorptive effect) and the mechanical effects. Urbanik [13] has demonstrated that the vibration theory developed for a single package may grossly underestimate the severity of acceleration levels in a unitized load. For ex-ample, the dynamics in a stack of containers ten high on a pallet may approach a modelled ten-degree-of-freedom system with ten critical frequencies, each being a po-tentially damaging resonant.
SRETS
Final Report 23
Because corrugated boxes yield in compression due to their contained weights, they act like springs and the resulting stack’s natural frequencies may fall within the range of the transportation environment. There are three predominating effects in the transportation environment likely to dam-age a unitized load. Specifically, they are:
1. The natural frequency of the stack coincides with a frequency known to overload the product (i.e. if a cantilevered transformer in an electronic assembly resonates at 20 cycles, it would be unwise to stack containers such that they also resonate at this frequency).
2. The containers in a stack respond to vehicle vibrations at an acceleration level
greater than one g. In this state the containers float and will drift with vehicle sideways.
3. The vibration forces combine with the stack’s dead weight to exceed the load
carrying capacity of the bottom container. Transportation can cause or increase many defects on corrugated, such as (following an example for corrugated box for canned pineapples, Ramsland, Selin,[10]):
2.2.2.4 Corrosion-sensitive products exposed to moisture
Moisture and corrosion in electronic and machinery products is a subject of great con-cern. Damage occurs during manufacturing, transport, storing and use of the products. It is difficult to make an exact assessment of the size of the costs, but in many cases American figures showing that corrosion damage constitutes about 4% of the Gross National Product (GNP) are used as a rule of thumb [25]. Further, it is estimated that - depending on how you calculate - between 15% and 45% of the costs caused by corrosion could be avoided by utilizing known techniques such as alternate designs, alternate materials, corrosion protection or improved environmental conditions. Unfortunately, the problems within this area are not diminishing. On the contrary, the fact is that e.g. the increased use of metal structural materials and the miniturization in the electronics area have resulted in the sensitivity to corrosion stresses being increased. Further, there is a trend towards customizing mechanical constructions, making them lighter and cheaper but in some cases more sensitive to corrosion. In addition to this, there is also the negative influence from air pollution on both men and machinery. Among the factors which increase corrosion rate are:
• increased temperature
SRETS
Final Report 24
• risk for condensation due to variation in temperature and moisture • dampness due to rain, sprinkling and so on • air pollution such as salt, dust, sulphur and nitric oxide • time of exposure • the number and nature of temperature and moisture cycles.
The moisture conditions form the most important factor from corrosion point of view. They are included in several of the stresses mentioned above. Air pollution, such as sulphur dioxide, nitric oxides and chloride ions accelerates corrosion. Corrosion is always affected by a combination of temperature, relative humidity, air pollutants and the rate of exchange of air. For contacts and switches in cars, telecommunication equipment, machinery products and so on, it is very important that corrosion agents such as oxides are not formed, causing electrical contact problems. ‘Standard boxes’ with electronics are especially vulnerable to leakage of moist air. Extensive studies of this have been made by Zachariassen, among others [14]. Different metals have different sensitivity to corrosion, depending on the size of leakage hole, see table 1. In some cases it was found advantageous to have drainage holes instead of a hermetic design or small holes. In this connection, it should be mentioned that in practice her-metic closure is only possible for tins [6].
Table 1: Experimental evaluation of corrosion depending on the size of hole in the chassis [14]
Leakage size
Corrosion of metal sheets on a 0 to 5 scale
Box No (mm²) Au Ag Cu Ni Sn
4 0 0 0 0 - 1 0 0
5 10 1 1 1 0 0
6 100 1 1 1 0 - 1 0
7 1000 4 1 4 - 5 1 1
8 Open 2 - 3 2 4 - 5 1 0 - 1
An important damage mechanism during transport, especially sea transport, is high temperature inertia in large products. During an oversea transport, containers with tooling machines, for example, are easily exposed to condensation due to a great heat capacity in the machine. A combined effect occurs also due to the pumping effect. The most famous description of this is by Hoppe [26] at Siemens, 1979.
SRETS
Final Report 25
In principle, during transportation there are three mechanisms contributing to unac-ceptably high moisture percentages and resulting corrosion problems:
• temperature reduction in a closed container increases the relative humidity • leakage in a container allows moist air to enter • hygroscopic materials in the container (e.g. corrugated board and wood) may
under certain circumstances release moisture to the air, which can condensate on other surfaces.
When the temperature drops, the temperature levelling process varies, depending for instance upon how much the container is filled and with what. Contents with a high thermal capacity give slower temperature changes and the fastest changes in tempera-ture take place when the container is empty. There might be a risk for condensation, e.g. on large metal objects. Great temperature variations result in great moisture varia-tions. When there is a leakage there is also a risk for accumulation of water due to the so called pumping effect. As a rule, containers are not completely tight. The degree of un-wanted ventilation is determined by the size of the leakage openings and wind sensitiv-ity. If an untight cavity containing thermally inert details is exposed to increasing tem-perature in combination with high relative humidity there will be condensation on those parts that adapt more slowly to the surrounding temperature. Thus part of the moisture is trapped, the part that would otherwise have followed the airflow out of the cavity caused by the increased pressure inside the cavity resulting from the rise in temperature and not generally corresponding with an increase in pressure in the surrounding atmos-phere. If instead the temperature gets lower water condenses on the cavity walls at the same time as moist air flows in as a result of the pressure reduction that takes place in the cavity. Thus there is an addition of moisture in the cavity when the temperature gets lower which is not equivalent to the outflow when the temperature rises. This is the so called pumping effect, see figure 8 that manifests itself as pools of water in untight, un-drained and poorly ventilated cavities. Containers, for example during sea transports, often go through clearly defined temperature and moisture cycles each 24 hours. At container transports hygroscopic materials and especially wooden pallets should be observed. Wooden pallets of freshly sawed wood can contain as much as 20 weight percents water which means that considerable amounts of water can be vaporised and then condense on the products.
SRETS
Final Report 26
time
time
Figure 8: Mechanisms at moisture accumulation (amount of water flowing in and out the hole respectively)
A printed circuit board can be exposed to a number of different environments that may jeopardise its function. The following different environmental types, all of them present during transportation, have been discerned [11]:
− air pollution and moisturemoisture with or without dissolved or suspended salts, e.g. in marine or seaside environment
− condensation resulting from cold or rapid temperature changes − airborne pollution, e.g. soot and dust that might become conductive when
moisture is present − gases and chemicals − sulphurous gases (e.g. hydrogen sulphide and sulphur dioxide), chlorinous
gases (e.g. chlorine and hydrogen chloride), acids and alkalis − mechanical stresses − vibrations, abrasions and impacts
An example of the complex interaction of water in equipment and the ways for water to get into equipment is shown in figure 9.
SRETS
Final Report 27
Water
Breathing
EquipmentDiffusion
Air flow Solar radiation
Temp. changes
Water vapor
Intern. generated
Pressure changes
Capillary water
Figure 9: Water in equipment
Shipping of canned products, such as pineapple, especially when passage goes from tropical waters into arctic waters, which effects the relative humidity level and mois-ture/condensation rate. In this case, condensation was forming inside the enclosed shipping containers, causing the metal cans to rust and the paper labels to discolour [8]. One damage type occurs from water vapour absorption. All materials, except certain metals and glass, have the ability to absorb water [6, 7]. The water vapour transmission rate (WVTR) is decided by a weight increase and thus can be decided by a "gravimetric" method. However, the timescale for this failure is normally relatively long.
2.2.3 Summary and discussion
It has been shown in this report that the mechanisms of damage that occurs during dis-tribution are often very complicated. Many factors are involved, for example environ-mental parameters such as temperature, moisture, shock and vibration. In order to reduce the damage ratio there are three elements to work on:
1) The product and its robustness 2) The packaging and its ability to withstand outer influences 3) The distribution environment (including the organisation of the flow of cargo)
SRETS
Final Report 28
Distribution system today and tomorrow
As a conclusion, everything points to increasing transport volumes in the future. Trans-ports will account for an increasingly greater part of the value added in the companies because
• stocks are decreasing • stocks are being centralized • the lead time is in focus, increasing the demands for high transport frequency • the dependance on subsuppliers is increasing. Companies concentrate on their
core activities • the opportunities for joint-cargo systems are diminishing as a result of an in-
creasing number of special transports. The environmental issue may, however, encourage joint-cargo.
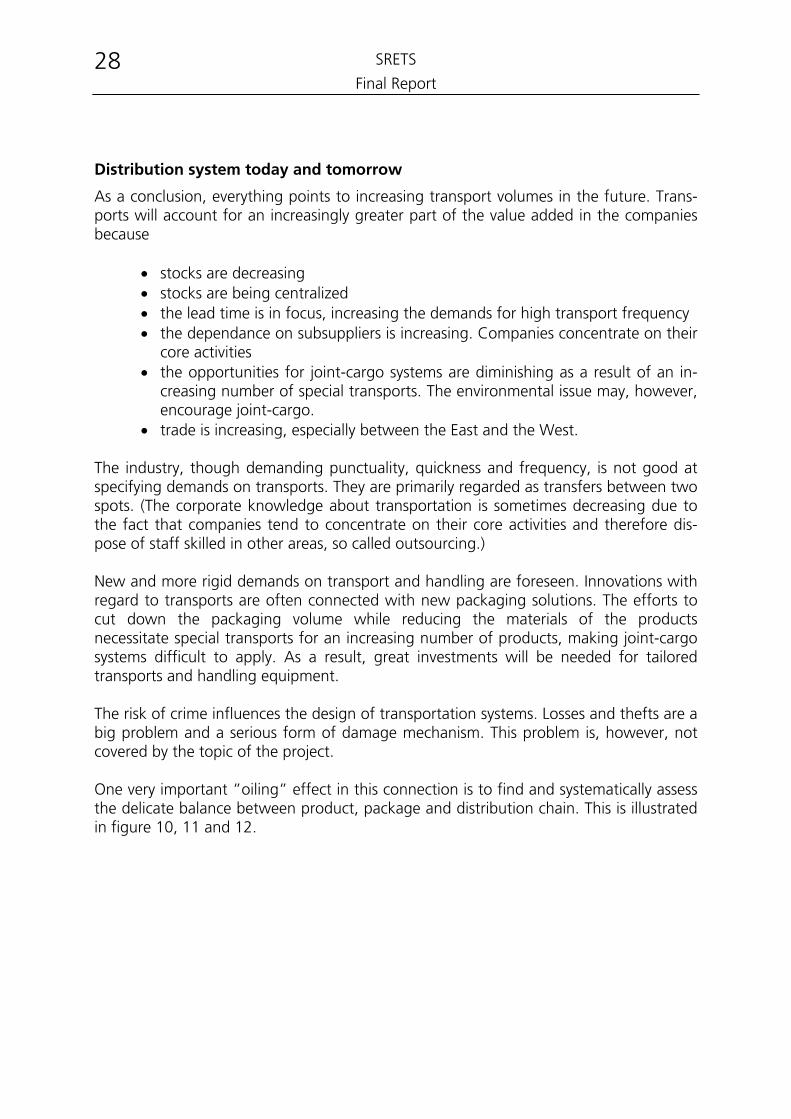
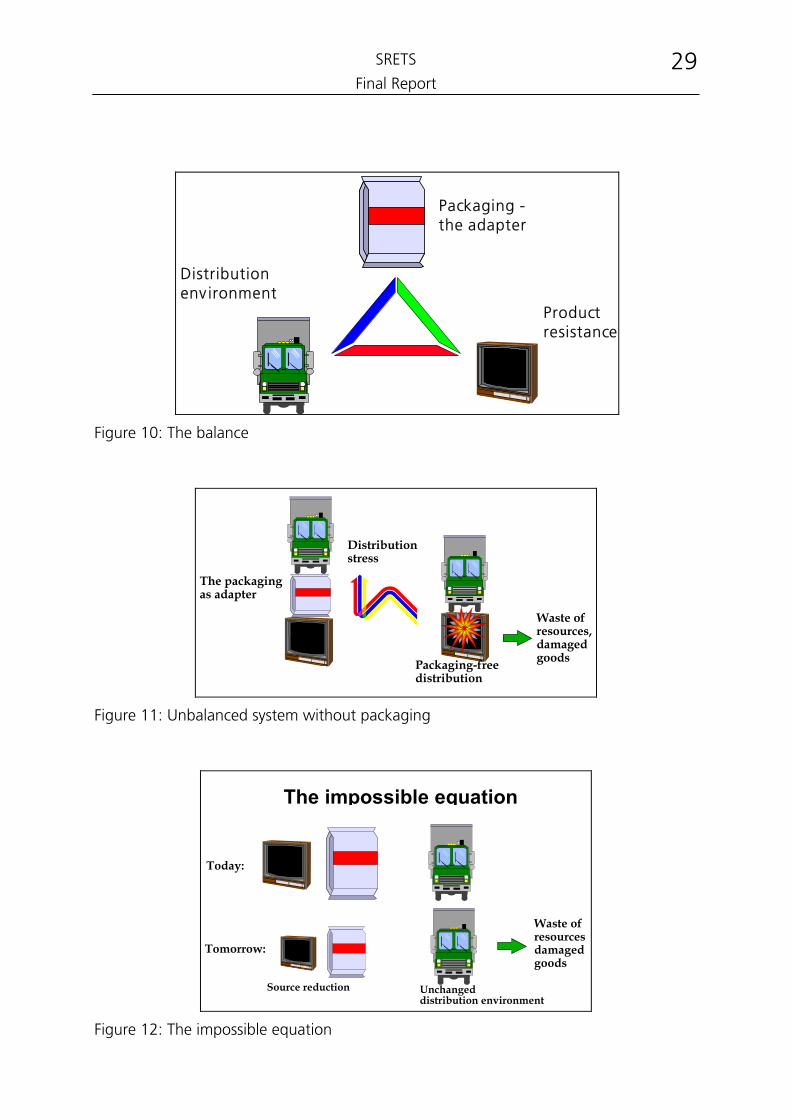
• trade is increasing, especially between the East and the West. The industry, though demanding punctuality, quickness and frequency, is not good at specifying demands on transports. They are primarily regarded as transfers between two spots. (The corporate knowledge about transportation is sometimes decreasing due to the fact that companies tend to concentrate on their core activities and therefore dis-pose of staff skilled in other areas, so called outsourcing.) New and more rigid demands on transport and handling are foreseen. Innovations with regard to transports are often connected with new packaging solutions. The efforts to cut down the packaging volume while reducing the materials of the products necessitate special transports for an increasing number of products, making joint-cargo systems difficult to apply. As a result, great investments will be needed for tailored transports and handling equipment. The risk of crime influences the design of transportation systems. Losses and thefts are a big problem and a serious form of damage mechanism. This problem is, however, not covered by the topic of the project. One very important ”oiling” effect in this connection is to find and systematically assess the delicate balance between product, package and distribution chain. This is illustrated in figure 10, 11 and 12.
SRETS
Final Report 29
Distributionenv ironment
Productresistance
Packaging -the adapter
Figure 10: The balance
Waste ofresources,damagedgoods
Distributionstress
Packaging-freedistribution
The packagingas adapter
Figure 11: Unbalanced system without packaging
The impossible equation
Today:
Tomorrow:
Source reduction Unchangeddistribution environment
Waste ofresourcesdamagedgoods
Figure 12: The impossible equation
SRETS
Final Report 30
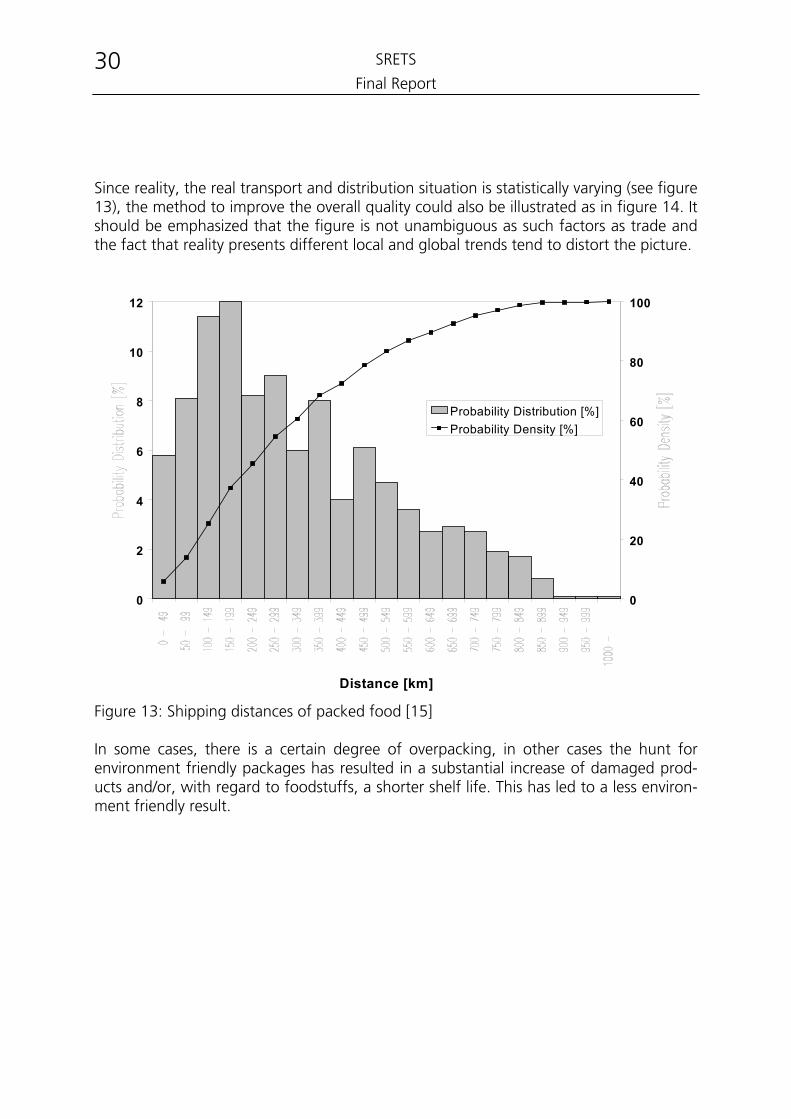
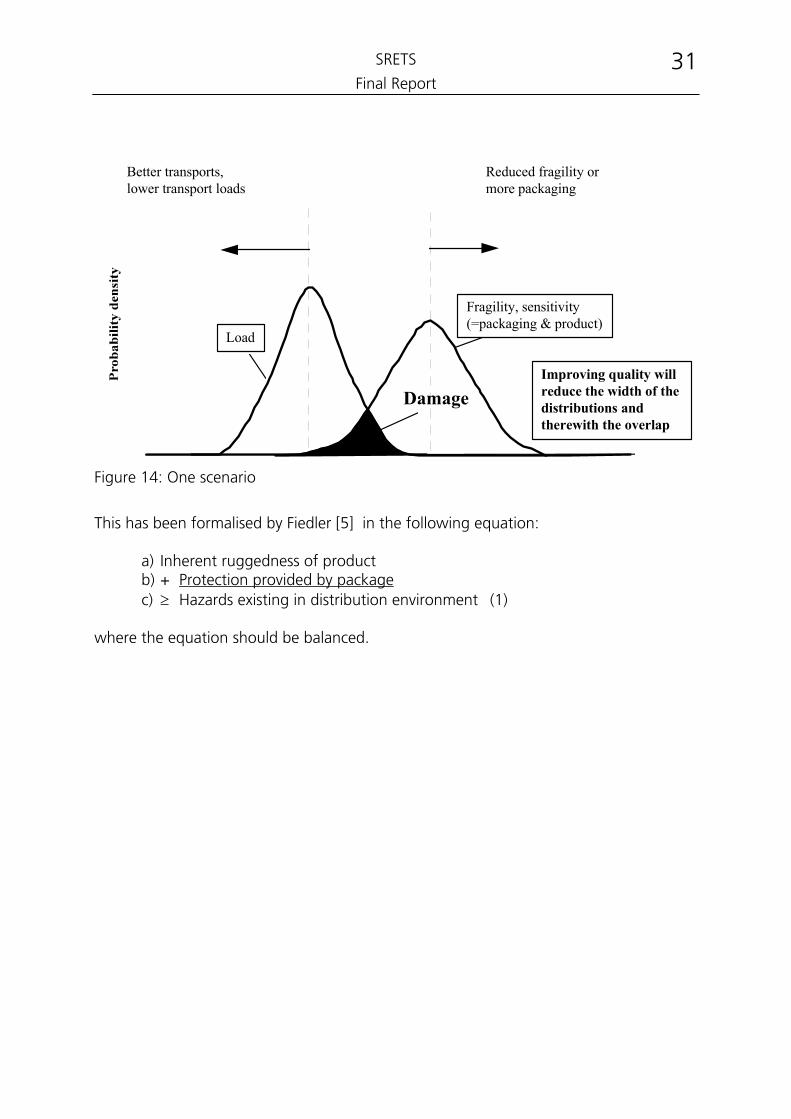
Since reality, the real transport and distribution situation is statistically varying (see figure 13), the method to improve the overall quality could also be illustrated as in figure 14. It should be emphasized that the figure is not unambiguous as such factors as trade and the fact that reality presents different local and global trends tend to distort the picture.
0
2
4
6
8
10
12
Distance [km]
0
20
40
60
80
100
Probability Distribution [%]Probability Density [%]
Figure 13: Shipping distances of packed food [15] In some cases, there is a certain degree of overpacking, in other cases the hunt for environment friendly packages has resulted in a substantial increase of damaged prod-ucts and/or, with regard to foodstuffs, a shorter shelf life. This has led to a less environ-ment friendly result.
SRETS
Final Report 31
Better transports,lower transport loads
Reduced fragility ormore packaging
Load
Fragility, sensitivity(=packaging & product)
DamageImproving quality willreduce the width of thedistributions andtherewith the overlap
Figure 14: One scenario
This has been formalised by Fiedler [5] in the following equation:
a) Inherent ruggedness of product b) + Protection provided by package c) ≥ Hazards existing in distribution environment (1)
where the equation should be balanced.
SRETS
Final Report 32
2.3 Measurements and Data
2.3.1 Objective The main objectives were:
• to perform measurements • to determine methodological strategies • to analyse the data • to compare the results with literature • and to compare the results regarding axis, roads, vehicles, and measurement
condition.
2.3.2 Performance of the measurements
2.3.2.1 Method Initially a literature search was performed of papers on the transport environment relat-ing to packaging in order to collect data already available. This work was followed by collection of further environmental data by the two distinct measurement paths:
• covertly, with real transport distribution undertaken by Pira International in collaboration with its co-partner J & B Scotland • overtly, with simulated transport, undertaken by Bosch.
This vibration and shock data formed the basis of the common database which was pre-sented as raw data and in the form of Power Spectral Densities (PSD’s) for subsequent analysis.
2.3.2.2 Covert measurements Pira, in collaboration with J & B Scotland, collected data from scheduled deliveries to International Distillers and Vintners (IDV) distribution centres. These journeys all origi-nated from J & B’s distribution facility at Dumbarton, Scotland, and the destinations fell into two categories:
• a UK distribution centre at Daventry (collected data was predominantly from motorway and A-class roads)
• two European destinations, both IDV distribution centres, at Madrid and Lisbon (journeys incorporated transport by road and sea and in some
cases, rail). These journeys are summarised in Table 2.
SRETS
Final Report 33
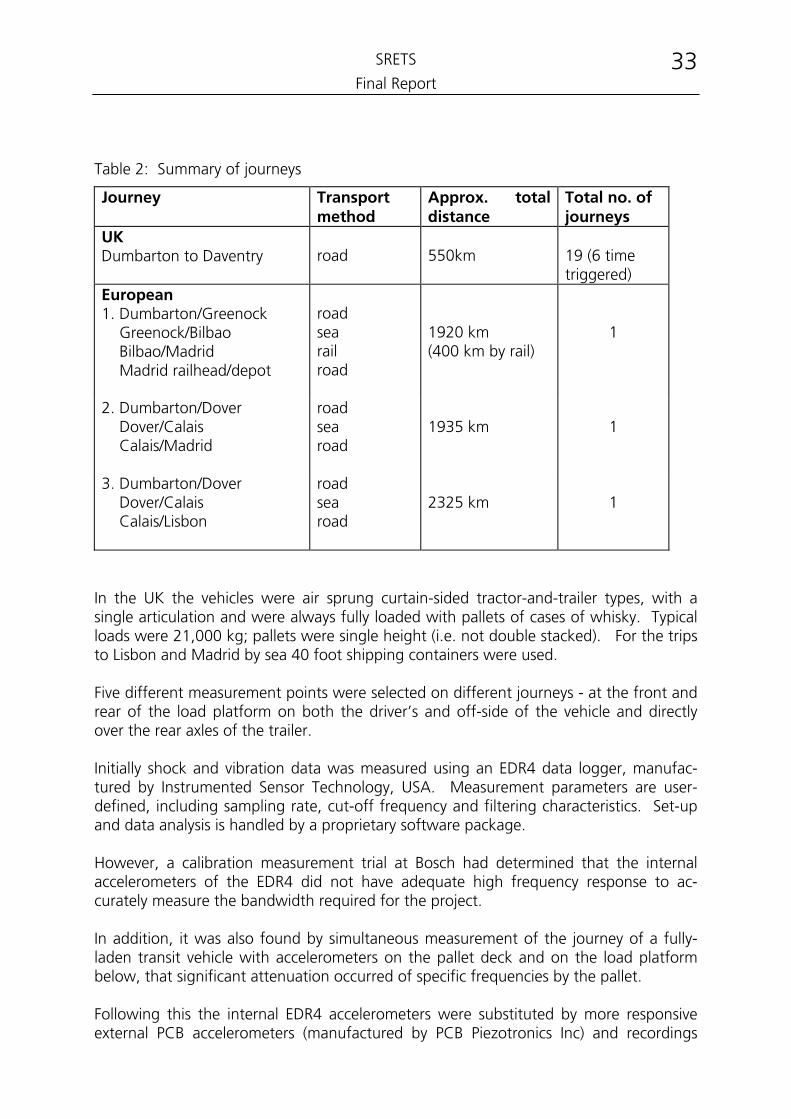
Table 2: Summary of journeys
Journey Transport method
Approx. total distance
Total no. of journeys
UK Dumbarton to Daventry
road
550km
19 (6 time triggered)
European 1. Dumbarton/Greenock Greenock/Bilbao Bilbao/Madrid Madrid railhead/depot
road sea rail road
1920 km (400 km by rail)
1
2. Dumbarton/Dover Dover/Calais Calais/Madrid
road sea road
1935 km
1
3. Dumbarton/Dover Dover/Calais Calais/Lisbon
road sea road
2325 km
1
In the UK the vehicles were air sprung curtain-sided tractor-and-trailer types, with a single articulation and were always fully loaded with pallets of cases of whisky. Typical loads were 21,000 kg; pallets were single height (i.e. not double stacked). For the trips to Lisbon and Madrid by sea 40 foot shipping containers were used. Five different measurement points were selected on different journeys - at the front and rear of the load platform on both the driver’s and off-side of the vehicle and directly over the rear axles of the trailer. Initially shock and vibration data was measured using an EDR4 data logger, manufac-tured by Instrumented Sensor Technology, USA. Measurement parameters are user-defined, including sampling rate, cut-off frequency and filtering characteristics. Set-up and data analysis is handled by a proprietary software package. However, a calibration measurement trial at Bosch had determined that the internal accelerometers of the EDR4 did not have adequate high frequency response to ac-curately measure the bandwidth required for the project. In addition, it was also found by simultaneous measurement of the journey of a fully-laden transit vehicle with accelerometers on the pallet deck and on the load platform below, that significant attenuation occurred of specific frequencies by the pallet. Following this the internal EDR4 accelerometers were substituted by more responsive external PCB accelerometers (manufactured by PCB Piezotronics Inc) and recordings
SRETS
Final Report 34
were made directly on the load platform. This fitted the approach of Bosch who utilized fixed measurement sites on or below the load platform, measuring accelerations in 3 orthogonal axes. The mount for the accelerometers was screwed to the load platform of the transit vehicle. The use of the external triaxial accelerometers allowed the definition of measurement and recording parameters which could be set to:
• facilitate measurements at a frequency bandwidth from 4 - 1000 Hz at a high sampling rate to avoid aliasing
• coincide with the measurement capabilities of Bosch. The EDR4 memory was configured into 500 sections, each section capable of recording one ‘event’. Data from UK journeys was recorded in either ”signal triggered” or ”time triggered” form. For ”signal triggered” recording the instrument was configured to record continuously in ”overwrite” mode such that after 500 events had been recorded, incoming events continued to be monitored and the ”lowest” root mean square (rms) event recorded to date could be overwritten by a ”higher” rms event. For ”time trig-gered” data the instrument was configured to wake up at regular time intervals in order to capture short periods of data; between data capture periods the instrument was sleeping. For European journeys, in order to accommodate the longer distances, a ”sliding win-dow overwrite” mode was used. This enabled the 500 total events to be split into 50 ”windows” (each two hours long), such that in each ”window” the 10 ”highest” rms events were recorded. Raw data was processed and analysed by the proprietary software of the EDR4. For further analysis the data was required in ASCII format, presented so that it could be easily manipulated by other project partners. Consequently, for each journey a set of six files was generated, each uniquely identified by a journey designation and number. This data was saved on 100Mb zip disks and circulated to the project partners.
2.3.2.3 Overt measurements Bosch carried out overt measurements of shock and vibration in order to investigate the effects of road category, vehicle speed and load factor. Tests were performed using vehicles on both test tracks and specified roads (motorways and class A roads). Test tracks consisted of a bumpy, rough road, and a road with specified bumps set at de-fined intervals. The test tracks were travelled at 30 and 50 km/h in three different ve-hicles at different loadings. Defined stretches of primary roads and motorways were
SRETS
Final Report 35
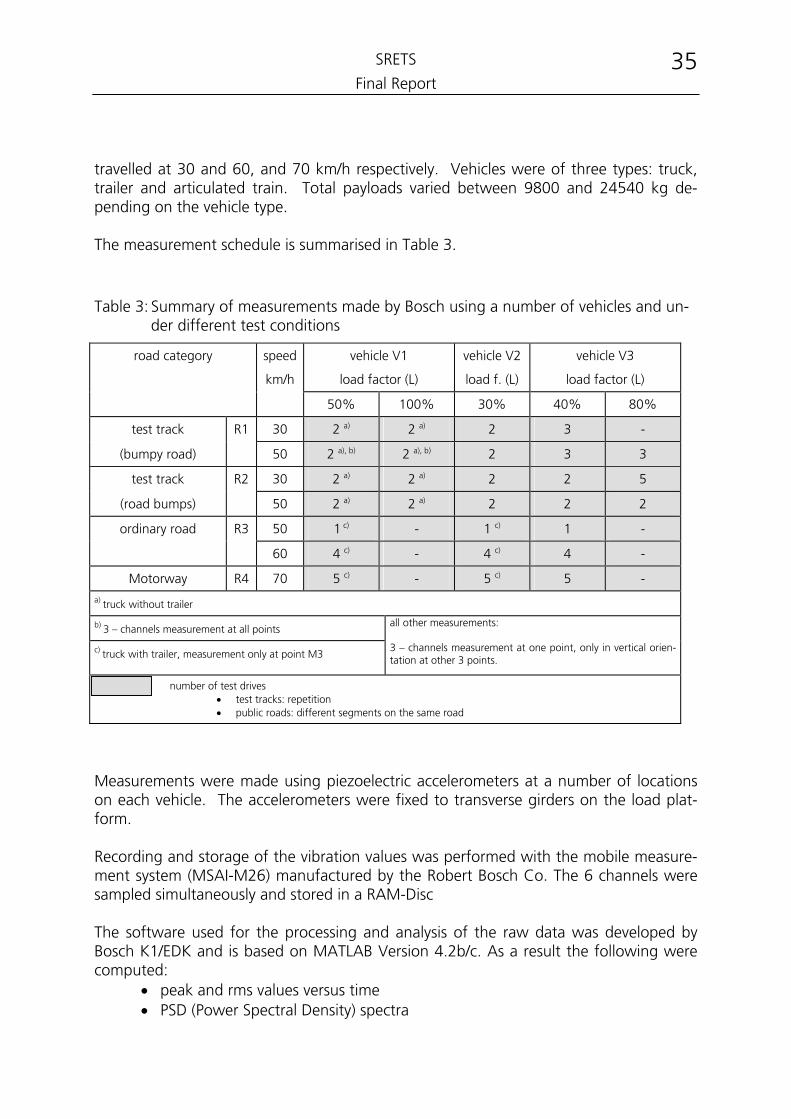
travelled at 30 and 60, and 70 km/h respectively. Vehicles were of three types: truck, trailer and articulated train. Total payloads varied between 9800 and 24540 kg de-pending on the vehicle type. The measurement schedule is summarised in Table 3.
Table 3: Summary of measurements made by Bosch using a number of vehicles and un-der different test conditions
road category speed
km/h
vehicle V1
load factor (L)
vehicle V2
load f. (L)
vehicle V3
load factor (L)
50% 100% 30% 40% 80%
test track R1 30 2 a) 2 a) 2 3 -
(bumpy road) 50 2 a), b) 2 a), b) 2 3 3
test track R2 30 2 a) 2 a) 2 2 5
(road bumps) 50 2 a) 2 a) 2 2 2
ordinary road R3 50 1 c) - 1 c) 1 -
60 4 c) - 4 c) 4 -
Motorway R4 70 5 c) - 5 c) 5 -
a) truck without trailer
b) 3 – channels measurement at all points all other measurements:
c) truck with trailer, measurement only at point M3 3 – channels measurement at one point, only in vertical orien-tation at other 3 points.
number of test drives • test tracks: repetition • public roads: different segments on the same road
Measurements were made using piezoelectric accelerometers at a number of locations on each vehicle. The accelerometers were fixed to transverse girders on the load plat-form. Recording and storage of the vibration values was performed with the mobile measure-ment system (MSAI-M26) manufactured by the Robert Bosch Co. The 6 channels were sampled simultaneously and stored in a RAM-Disc The software used for the processing and analysis of the raw data was developed by Bosch K1/EDK and is based on MATLAB Version 4.2b/c. As a result the following were computed:
• peak and rms values versus time • PSD (Power Spectral Density) spectra
SRETS
Final Report 36
Additionally, raw data in ASCII format was distributed to all project partners for analysis in subsequent tasks. The initial analysis of results of these overt measurements clearly demonstrated the in-fluence of measurement conditions such as road category, vehicle type or loading fac-tor.
2.3.2.4 Comparison of data sets
As already noted two different agencies acquired data as part of the SRETS data col-lection exercise. However, in reality this data can be better described as falling into three categories. Whilst, these three categories are intrinsically different from each other, it will be seen in the following discussions that a ‘bridge’ exists linking the overt test track measurements to the covert real road data. The categories are: (a) Information acquired overtly on the Bosch test track. This information related to
several vehicles (trucks, trailers and semi-trailers), payload configurations, measurement locations and vehicle speeds.
(b) Information acquired overtly on public roads adjacent to the Bosch test track.
This information related to several vehicles (trucks, trailers and semi-trailers) from ordinary and motorway class roads.
(c) Information acquired covertly by Pira/J&B from ordinary and motorway class pub-
lic roads. This exercise used different drivers and vehicles, although the vehicles were essentially of the same class and payload configuration. Most of the data relate to a similar journey within the UK but three relate to journeys from the UK to Spain or Portugal.
Establishing the validity of the acquired data was undertaken both by considering each individual category of data and by comparison between categories. The most difficult data category to validate was the covert real road measurements. As would be ex-pected from an exercise of this type the assessment identified a few problems with spe-cific blocks of data (which were also independently identified during the Fatigue Dam-age Spectra analysis). Compared to the covert real road measurements the quality and validity of the overt test track data was somewhat easier to establish. This is because repeatable and consis-tent track conditions are relatively easy to arrange. As repeatable and consistent vibra-tion data can be expected, the capability existed for data quality and validity to be re-viewed as an integral part of the measurement exercise. In practice the review of data quality and validity indicated a few runs of doubtful quality. In such cases the run was simply repeated.
SRETS
Final Report 37
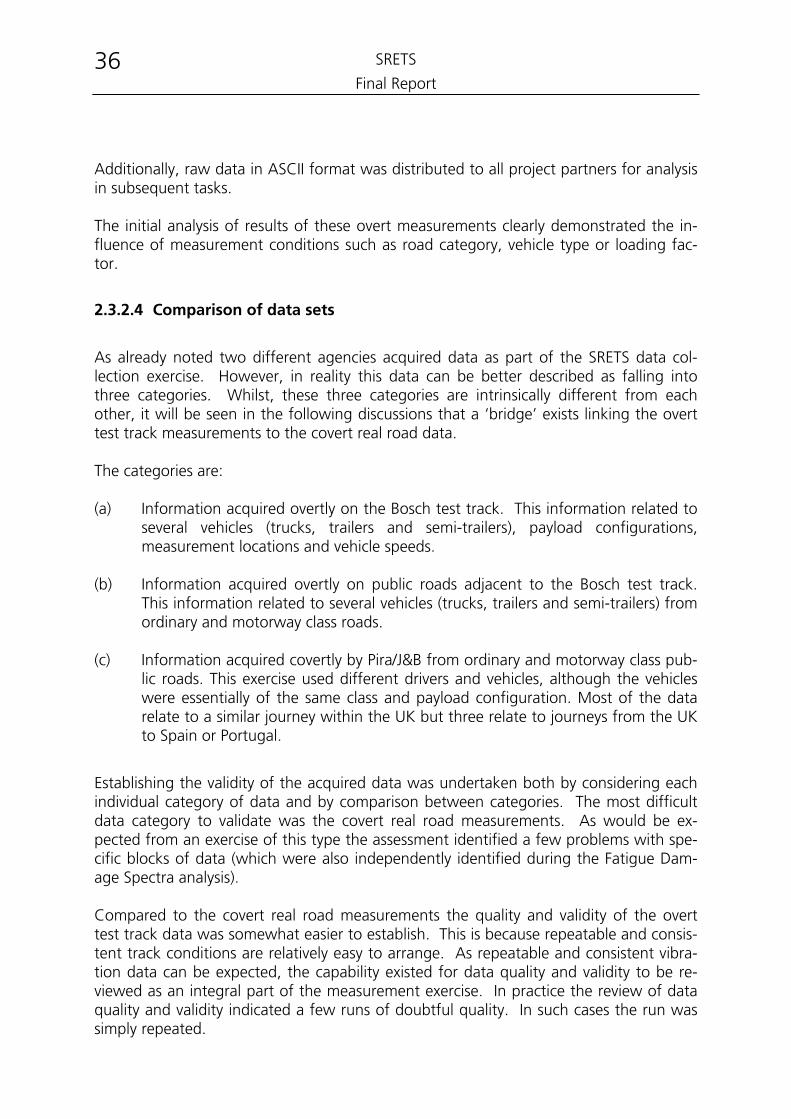
Establishing the quality and validity of the overt real road measurements was essentially an extension of the approach used for the test track measurements. In short establish-ing the quality and validity of the overt test track and road measurements was an inte-gral part of the measurement procedures adopted. These procedures have ensured that the resultant data set is sound, valid and fit for the purpose for which they were gath-ered.
Having reviewed the validity of the separate data sets, the consistency of the entire da-tabase needs to be established. As a range of different vehicles was used to acquire the data a simple comparison of spectra is problematic. This is because different vehicles have different suspension frequencies and structural dynamic characteristics. This problem has been encountered previously and resolved by significantly broadening the frequency range considered. For the purpose of this quality, validity and consistency check the parameter used was the overall root mean square value (rms) computed from the averaged Power Spectral Density for each run. In effect the frequency range considered has been broadened to the entire frequency range considered (0 to 2000 Hz). The use of the overall root mean square value has the advantage that it is the most statistically sound parameter available (remembering that the actual data is random in nature). Assessing the consistency of information across the entire database was achieved with the aid of Analysis of Variance (ANOVA) statistical methods. Initially, for this purpose, the information was divided into three main groups already identified. The work ad-dressed both vertical and horizontal measurements separately. Comparison of the group rms values is set out in table 4. For the purpose of this consistency check the two Pira / J&B runs from Glasgow to Madrid were not included as including only two runs is considered statistically unsound.
Table 4: Comparison of the group rms values
Overall Group rms (g) and Variance (g²)
Measurement Group Vertical Horizontal
Mean Variance Mean Variance
Bosch Test Track (overt) 0.472 0.10 0.342 0.099 Bosch Public Roads (overt) 0.141 0.004 0.127 0.004 Pira / J&B (covert) 0.202 0.013 0.143 0.007
Table 4 suggests that the rms values for the test track are noticeably different to those from public roads (which are broadly similar). The ANOVA indicates that the test track data is significantly different from the Bosch and Pira public road data, in all axes, at a 95% level of significance. The ANOVA also indicates that, whilst the horizontal public
SRETS
Final Report 38
road measurements (from Bosch and Pira) are not significantly different, those from the vertical axis are significantly different (again both at a 95% level of confidence). This apparent inconsistency in results can be explained by consideration of the meas-urement conditions. The Bosch data was all time triggered. However, the Pira / J&B data includes both time triggered and signal triggered data. The signal trig-gered data would be expected to increase the overall rms of the Pira ensemble average. In addition to the above check of consistency, ANOVA can also be used to establish the existence of differences or similarities in the data. Table 5 sub-divides the Bosch and Pira public road data.
Table 5: Sub-division of the Bosch and Pira public road data
Measurement Group Overall Group rms (g) and Variance (g²) Vertical Horizontal Mean Variance Mean Variance Bosch Public All 0.141 0.004 0.127 0.004Roads (overt) Ordinary Roads 0.132 0.004 0.121 0.003 Motorways 0.152 0.004 0.133 0.004 Pira / J&B All UK runs 0.202 0.013 0.143 0.007 (covert) UK Signal Triggered 0.266 0.010 0.187 0.004 UK Time Triggered 0.096 0.001 0.071 0.003 All runs (including
UK to Madrid) 0.247 0.021 0.164 0.017
In this case ANOVA calculations indicate that the Bosch ordinary road data and motor-way data are not different at the 95% level of confidence. For the combined data and each of the two sub-divisions, the ANOVA indicates no significant difference (again at 95% level of confidence) between vertical and horizontal measurements in terms of overall rms. The ANOVA also indicates no significant difference between vertical and horizontal measurements in terms of overall rms for the Pira / J&B data, and that the Pira / J&B data is not significantly altered when the two runs to Madrid are included. The overall rms information indicates a marked difference between the time and signal triggered information from the Pira / J&B runs. This was confirmed by the ANOVA, in both axes, at the 95% level of confidence. This difference is not surprising as the use of signal triggering is to acquire the (500 or so) most severe conditions from the entire run rather that just data at specific time win-dows. The Pira / J&B runs also show significantly greater variations between runs than the Bosch public road data. Whilst this could be for several reasons, the covert acquisition of the Pira data is the most likely reason for this difference.

SRETS
Final Report 39
Although, both sets of public road data show no significant difference between measurement axes, this is not the case for the test track information. In that case the ANOVA indicates a significant difference between vertical and horizontal axes at a 95% level of confidence. Again this is not surprising as the test track data is also of sig-nificantly greater amplitude than the public road information. Generally, increased ve-hicle excitation amplitudes result in greater dominance of the vehicle suspension modes in the vertical axis. As such the vertical axis responses become significantly different to the responses in the horizontal axes. In summary the data acquired for the SRETS work by the two different agencies have been checked for validity. Whilst different approaches were used to verify the two data sets, these were dictated by the different acquisition approaches used. Checks indicate that both data sets are sound, valid and fit for the purpose for which they were gath-ered. Comparison work between data sets indicates the two data sets are consistent when similar information is compared. As such, significant confidence exists that the SRETS data comprises of a consistent database.
2.3.2.5 Literature Data
An extensive literature search on transportation load data was performed. For all four transportation modes (road, rail, air and sea) the literature data was divided into measured data and derived test spectra. Unfortunately test spectra can not easily be compared with measured data due to the effects of complicating factors such as time reduction. In addition, a classification was found for road transportation. This classification does not represent measured data or test spectra and hence was treated separately. A summary of full data with respect to transportation mode is included as an annex to this report. In some cases the horizontal (longitudinal and lateral) vibrations were measured as well as vertical vibrations.
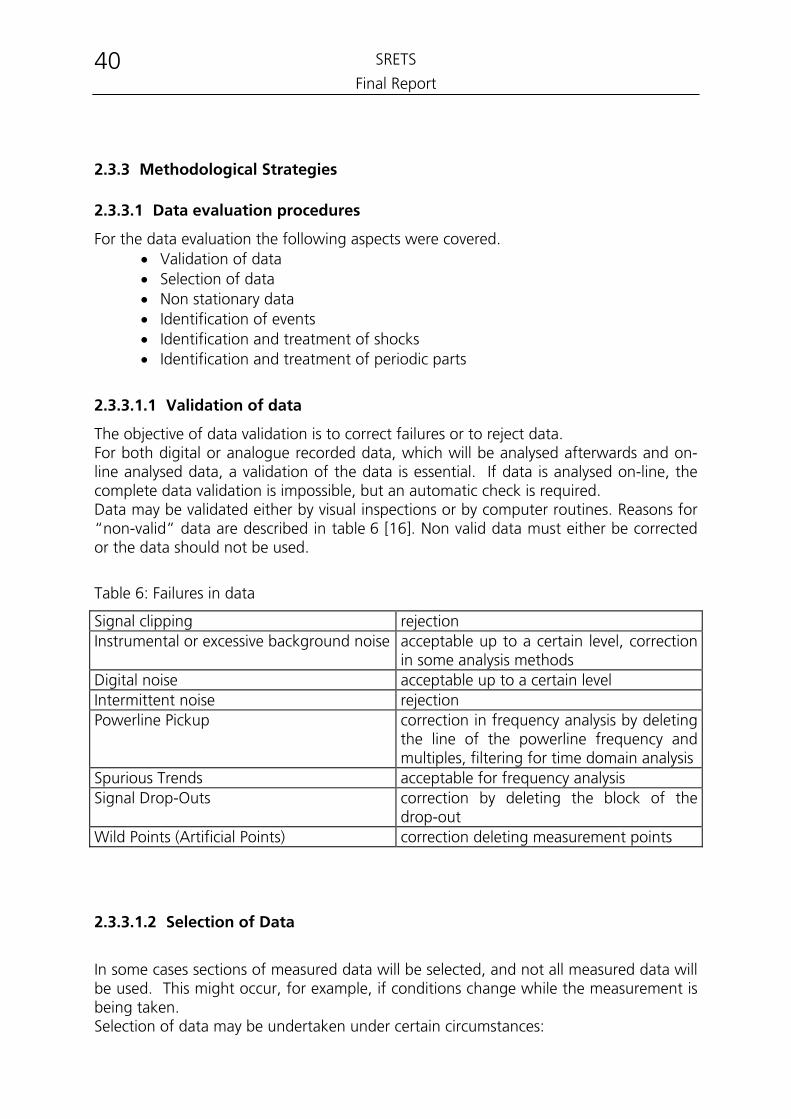
SRETS
Final Report 40
2.3.3 Methodological Strategies
2.3.3.1 Data evaluation procedures
For the data evaluation the following aspects were covered. • Validation of data • Selection of data • Non stationary data • Identification of events • Identification and treatment of shocks • Identification and treatment of periodic parts
2.3.3.1.1 Validation of data
The objective of data validation is to correct failures or to reject data. For both digital or analogue recorded data, which will be analysed afterwards and on-line analysed data, a validation of the data is essential. If data is analysed on-line, the complete data validation is impossible, but an automatic check is required. Data may be validated either by visual inspections or by computer routines. Reasons for “non-valid” data are described in table 6 [16]. Non valid data must either be corrected or the data should not be used.
Table 6: Failures in data
Signal clipping rejection Instrumental or excessive background noise acceptable up to a certain level, correction
in some analysis methods Digital noise acceptable up to a certain level Intermittent noise rejection Powerline Pickup correction in frequency analysis by deleting
the line of the powerline frequency and multiples, filtering for time domain analysis
Spurious Trends acceptable for frequency analysis Signal Drop-Outs correction by deleting the block of the
drop-out Wild Points (Artificial Points) correction deleting measurement points
2.3.3.1.2 Selection of Data
In some cases sections of measured data will be selected, and not all measured data will be used. This might occur, for example, if conditions change while the measurement is being taken. Selection of data may be undertaken under certain circumstances:
SRETS
Final Report 41
• Selection of blocks with definite features • Reduction of the amount of data
For the selection of blocks with definite features, criterias for the identification of the features and a strategy for the selection of the start and size of the block, must be given. The criterias depend on features like shocks, events, non-stationary or high level data. For the reduction, of the amount of values, blocks of data could be selected randomly by measuring in a short time interval and resting for a long time interval.
2.3.3.1.3 Non stationary data
Theoretically all types of random vibration encountered in practice are non-stationary [17]. Transportation vibrations are especially influenced by changing conditions like ve-locity, road conditions, potholes, turns, bumps, etc. Data can be treated as stationary if they are “quasi-stationary”, meaning not far from stationary. Some statistical tests exist for the proof of stationary calculating average properties of blocks from the measured data. In some cases they are plotted sliding over the time. For non-stationary data this value will change within time. Random vibration data often is threaded as ´quasi-stationary´ data that means all the events are eliminated, and the rest is used for all types of analysis even if stationary data is required for the analysis.
2.3.3.1.4 Identification of events
Each event, for example driving through a pothole, should be marked and identified. In older measurements with analogue recorders, a voice channel was used and the driver gave his remarks on the measurement. Furthermore index marks give a good sur-vey. In the time history events could be identified by changes in the amplitude, this is the only method that could be used in covered measurements.
2.3.3.1.5 Identification and treatment of shocks
Shocks are often stimulated with other devices. It is accordingly necessary to identify and separate shocks from measured transportation vibration data. The second objective is to remove non stationary parts from measurements. The definition of shock from vibration measurement data is a problem. Nevertheless there are some starting points:
• Short interruption of stationarity and at the same time higher values of accel-eration
• Passing the 3-sigma-border. This is obtained from a determined section of peaks, in the case of Gaussian noise from 0,3%, and which is not suitable to partial shocks and vibrations.
• The pass over of peaks on the mean of time blocks or the whole data The separation of shock and vibration is possible only with subjective estimation by use of its critical peaks.
SRETS
Final Report 42
2.3.3.1.6 Identification and treatment of periodic parts
Periodic components often occur with measurements of mechanical machines. The movement of transport vehicles may also stimulate these periodic components. At least the vibration response of moving parts contain an important periodic element. Periodical parts should be simulated by a sine test, whereas random vibration should be simulated be a random vibration test. The identification of periodical parts and the cal-culation of the amount of periodicity is used to select the kind of test: sine, random, or even sine on random test. In PSD analysis periodic parts will give peaks with the amplitude depending on the bandwidth of the filter. This is not a real amplitude and has to be corrected. An analysis with different frequency band widths is a possible method to recognise PSD periodic components. Peaks come from periodic signals, and if they vary their ampli-tude, it is due to the theoretical bandwidth that is infinitely small. These periodic peaks are to be ignored, because their value is implied in the calculation. Another possibility is the autocorrelation function [18], to recognise periodicity. The autocorrelation R(τ) states how far a signal is in correlation to itself. In the case of white noise, it has the autocorrelation peak at τ=0, in other non periodic signals the autocor-relation signal has a maximum at τ=0 and falls sharply downward. Periodic signals exist for all τ not equal to zero.
2.3.3.2 Analysis Procedures
The data are analysed for presentation, comparison and assessment. Generally three different types of analysis procedures exist: The first type is to indicate several simple values or count the levels in classes, the time or frequency information is totally lost. The second and third class of methods do not lose this kind of information. They describe the mechanical-dynamical transportation environment with respect to the time or the frequency.
Table 7: Overview of compilation methods
Values, Counting • Shock duration, Shock integral • Classification Methods, one and two
dimensional • Probability Density (Distribution, Func-
tion) • Maximum Amplitude • Frequency and amplitude
Time domain • RMS versus time • Kurtosis, Skewness versus time Frequency domain • Power Spectral Density • Peak Hold PSD • Spectral Map • SRS, VRS • Fatigue Damage
SRETS
Final Report 43
2.3.3.2.1 Values and Counting
Shock integral A mechanical shock could be described by:
• Time domain shock pulse a(t) • amax and ∆t for simple shock testing (halfsine, ...) • Integral (velocity transfer), fall energy • fall height
Classification methods The objective of a classification is the characterisation of the measured signal by count-ing in several classes. This means a drastic reduction of the number of values. Methods are:
• Spot check • Duration in a class • Peak counting • Level Crossing • Range counting • Range-pair counting
The procedure of classification is used for the description of random oscillations. By using numbering we have information about the distribution of the transient value or amplitude. The level crossing, or peak between two zero crossings and sampling are the most generally used method. For stationary noise the plot of occurrence has the shape of a gaussian distribution curve. Only this gaussian noise can be imitated today in a lab for transport simulation. This classification method looses, like every other statistic method, the frequency information totally. More sophisticated are two dimensional classification methods. Beside a simple charac-terisation of signals, correlations could be discovered. The best known two dimensional counting method is a rainflow analysis. Maximum Amplitude This is a very simple method to characterise a loadplatform vibration. From each time segment the maximum and minimum (that means the maxima for both directions) or the maximum absolute value is recorded sliding over the time (or over time blocks). Frequency and amplitude Objective is to characterise a sine vibration or main sinusoidal components by the indica-tion of the main frequency of frequencies and their amplitude.
2.3.3.2.2 Time domain methods
RMS versus time The root mean square value RMS gives information about the integral acceleration am-plitude over all frequencies. It is calculated from PSD or the time signal (2). The RMS does not contain any information about the frequency.
g
na tRMS k
k
= ∑1 2 ( ) (2)
SRETS
Final Report 44
B : Frequency band width a k (t) : digitally measured data of acceleration n : number of measurement values
Sliding central moments The centred Moments of a distribution are defined according to [19]:
z
i
n
izM =
1n
( a - a )∑
(3)
a =
1n
ai
n
i∑ (4)
ai : digital measured value z = 1 : mean z = 2 : variance z = 3 : skewness z = 4 : kurtosis n : number of measurement values
The calculation of sliding centred moments is a test for a stationary or quasi- stationary oscillating load. A random proceeding is named stationary, if the characteristic i.e. cen-tred moments are independent from time, otherwise it is called non- stationary.
2.3.3.2.3 Frequency domain methods
PSD The Power Spectral Density, PSD became the most popular type of evaluation by vibra-tion. The calculation from the Power Spectral Density S(fk) continue the Fourier trans-form. Therefor the average from many sections of a route is calculate (5) by
S( f ) =
1n * B
|a ( f )|kd i=1
n
k2
d
∑ (5)
S : Power Spectral Density of the Lorry nd : number by section of a route fk : discrete frequencies a ( fk ) : Measured data that transformed in the frequency range B : frequency band width
Because the calculation for PSD is taking the mean, the result calculated depends on the range in which the mean is taken. An average taken over long sections of a route will compensate for any anomalies. Peak Hold PSD A special form of PSD is the Peak-hold-Power-Spectral-Density. It contains every fre-quency band in the peak, from every evaluated spectrum and gives information about
SRETS
Final Report 45
the highest stress in the frequency band. An average evaluation in Peak-Hold-PSD is about the length of a data block. If the peaks have small time differences from fre-quency band to frequency band, the Peak-Hold-PSD shows a higher stress than the load actually sustains at each moment. Spectral Map Spectral maps are three-dimensional plots of the PSD against the driving speed or other values. When plotted against time it should be recognised, that spectrums differ greatly in form. SRS, VRS The Shock Response Spectrum, SRS is a model for the effect from a shock. The Vibra-tion Response Spectrum, VRS is a model for the effect from vibrations to the dynamic parts of an unknown object. Both describe the damage potential of shock and vibra-tion. The behaviour is described with a series of single degrees of freedom, SDoF, which are stimulated by a shock or vibrational signal. The amplitude characteristic will project for SRS. The peak from the amplitude characteristic will project for VRS as a function of the resonance frequency from the single degree of freedom. The magnification, or Q-factor, is accepted as constant, generally 10, sometimes 5 or 20. SRS and VRS are calculable from time functions a(t) or PSD. Fatigue Damage The fatigue damage spectrum is a model, which describes the fatigue suffered by an object or its components from an oscillation load.[20] Like the shock response spectrum, SRS, uses a series of single degrees of freedom (SDoF). According to Wöhler´s hypothesis of material fatigue which describes a straight line for a defined range of loading and stresses in double logarithm diagram of mechanical stress about the loading number N. This straight line describes the breaking limit [21]. The material fatigue can be treated analogue to Wöhler´s description as a non-sinus form with an alternating load like narrow or wide band noise.[22, 23] Table 8 shows the concept of fatigue damage spectrums, which describes the various simplifications of reality.
Table 8: Fatigue damage spectrums
Assumptions Conclusions SDoF very simple model, too simple for many structures Wöhler´s Hypothesis for Metals verified
for polymers possible too Miner´s Concept for metals verified
for polymers applied too linearity for metals
for polymers, too great a simplification
2.3.4 Analysed data
2.3.4.1 Evaluation of Discrete Measured Data
SRETS
Final Report 46
The use of covert measurements has a substantial advantage because it ensures the inclusion of the potential effects that could be influenced by the manner in which the vehicle is driven. However, it does mean that it is significantly (T0,95-Test) more difficult to identify defective measurements arising from causes within the measurement chain. In this case the measurement system also introduces another difficulty in that it can be set to capture the worst case conditions or to capture data at discrete intervals. In order to obtain a valid test schedule information from both capture methods are required. As a consequence a relationship between the measured data from the two capture options needs to be established.
2.3.4.1.1 Verification of Covert Data
Techniques to assist in the verification of the covertly acquired data were need simply because of the large quantity of data involved. Data from each of the covert measure-ment runs was acquired in individual blocks of 2048 time data values. A typical run would acquire 500 such blocks for each measurement axis. With 18 runs and three axes a total of 27 000 data blocks or 55 million individual values needed to be reviewed. The data acquisition system was capable of operation in "signal triggered" mode in which case only the worst amplitude blocks were recorded or in "time triggered" mode in which the measurements were acquired at fixed intervals. Generally the checks adopted remained the same regardless of the acquisition mode. However, comparison of the data from each method was only undertaken after the data had been compared with data from the same acquisition method first. For the most part the checks were used to identify specific blocks worthy of further investigation. That is they were used as indicators of defective data rather arbitrators of data quality, The following time History Methods were used
• Relative amplitudes • Consistency of peaks and Statistical Moments • Asymmetry of peaks • Consistency Between Measurement Axes • Amplitude Probability Density Checks
Also Power Spectral Density Comparison Checks were used. The comparison of computed Power Spectral Density (PSD) values for each run is a use-ful way of identifying runs with markedly different response spectral characteristic. Whilst, changes in response spectral characteristic can occur due to legitimate and real reasons, for the most part such changes occur due to instrumentation faults (the meas-urement accelerometer becoming detached from its mounting is a classic fault that can usually be detected in this way).
Another method is the Verification of Results. The verification exercise generated a significant degree of confidence (at the 95% level) with the data from the covert measurement exercise. Three particular runs contained data that had "doubtful" aspects although specific inspection suggested no identifiable
SRETS
Final Report 47
problems. Moreover, the questionable aspects related only to a part of the data. Nevertheless the three blocks were removed when undertaking specific comparative exercises if for no other reason than to allow the affect of these blocks to be quantified. The main effect these runs had was on the higher amplitude region of the Amplitude Probability Density and the low frequency region of the PSD's.
2.3.4.1.2 Relationship Between The Data From The Two Capture Options
As already explained the data acquisition system was capable of operation in two modes. The "signal triggered" mode retained the blocks containing the most severe amplitudes permitting overwriting of any lesser blocks. In effect the final record com-prised the most severe 3 minutes of the entire journey. In the "time triggered" mode the blocks were acquired at fixed regular intervals. In effect the final record comprised a "snap shot" of the conditions occurring throughout the entire journey. The "signal triggered" mode has advantage if the worst case events are required. This is the case when setting the amplitude of any test schedules. The "time triggered" mode has ad-vantage if a realistic distribution of amplitudes are required. This is the case when set-ting the duration of application of any test schedules. As both amplitude and duration are required to set a test schedule, both measurement modes are required. The difference between the two capture options is clearly visible when the data are compared using Amplitude Probability Density (see figure 15). For the most part higher amplitudes occur at low probability levels for the majority of the "signal triggered" data than the "time triggered". This is as would be expected as in "signal triggered" mode the highest amplitudes blocks are specifically selected. The "time triggered" distribution can, for practical purposes, be assumed to represent a realistic amplitude probability distribution of a real journey. The difference between the two capture options is also clearly visible when the data are compared using Power Spectral Densities (see figure 16 and 17). However, the main difference is in overall level rather than in spectral content. The fact that the rms for the "signal triggered" data is typically twice that for the "time triggered" quantifies the dif-ference almost entirely. Other than that a slight difference in spectral content does exist between the two sets of data in the mid frequency region (50 to 100 Hz). This would suggest the higher amplitudes of the "signal triggered" data was partly caused by exci-tation of vehicle flexible body modes (as opposed to vehicle suspension modes). The difference between the two capture options is apparent in the data from all three vehi-cle axes to broadly the same extent.
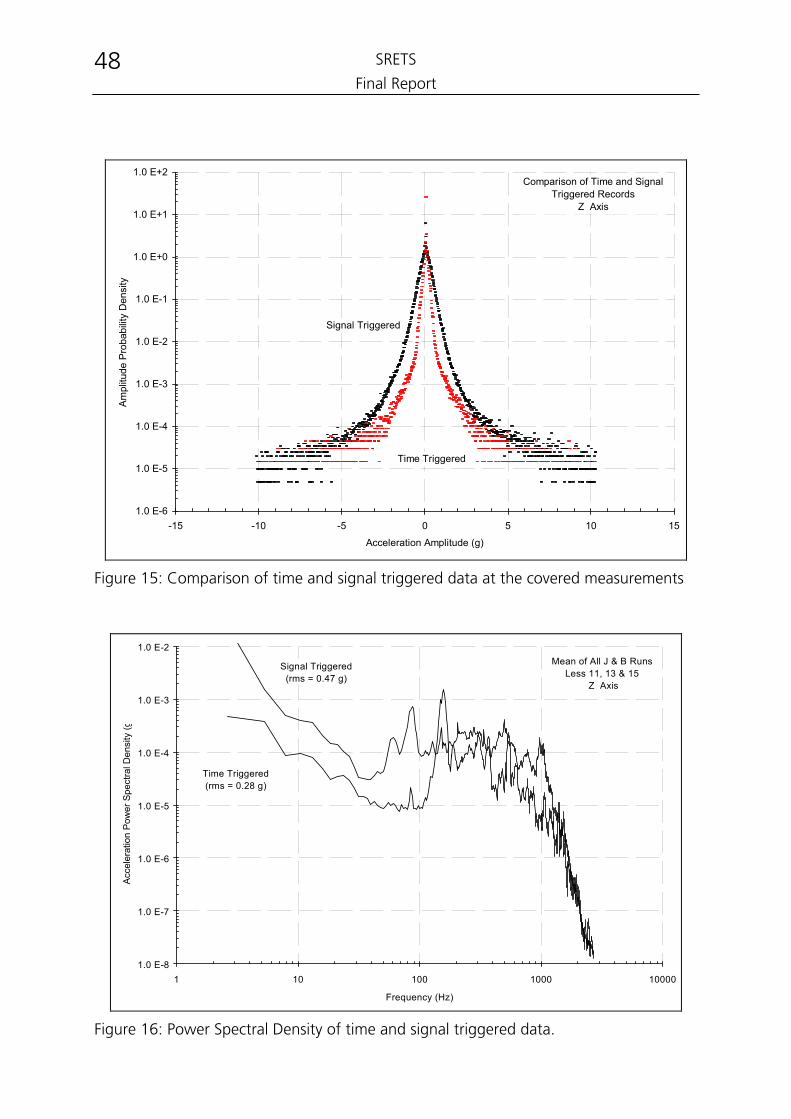
SRETS
Final Report 48
1.0 E-6
1.0 E-5
1.0 E-4
1.0 E-3
1.0 E-2
1.0 E-1
1.0 E+0
1.0 E+1
1.0 E+2
-15 -10 -5 0 5 10 15Acceleration Amplitude (g)
Ampl
itude
Pro
babi
lity
Den
sity
Comparison of Time and SignalTriggered Records
Z Axis
Time Triggered
Signal Triggered
Figure 15: Comparison of time and signal triggered data at the covered measurements
1.0 E-8
1.0 E-7
1.0 E-6
1.0 E-5
1.0 E-4
1.0 E-3
1.0 E-2
1 10 100 1000 10000
Frequency (Hz)
Acce
lera
tion
Pow
er S
pect
ral D
ensi
ty (g
Time Triggered(rms = 0.28 g)
Mean of All J & B RunsLess 11, 13 & 15
Z Axis
Signal Triggered(rms = 0.47 g)
Figure 16: Power Spectral Density of time and signal triggered data.
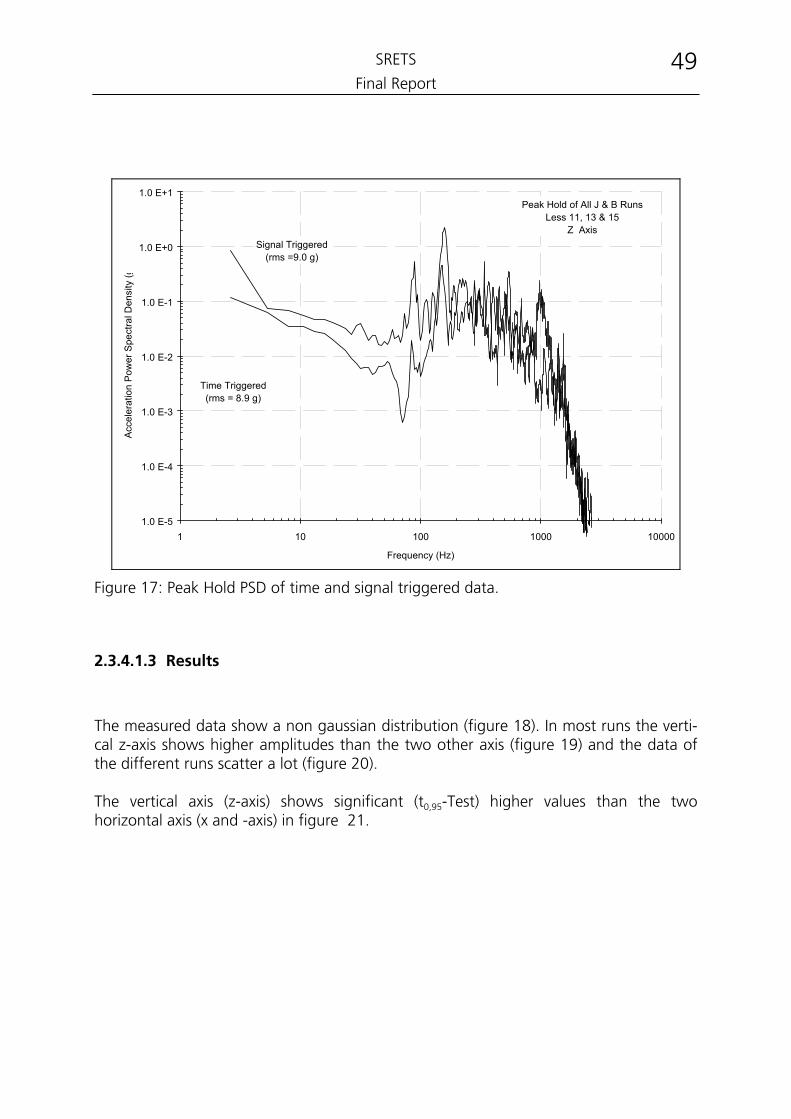
SRETS
Final Report 49
1.0 E-5
1.0 E-4
1.0 E-3
1.0 E-2
1.0 E-1
1.0 E+0
1.0 E+1
1 10 100 1000 10000
Frequency (Hz)
Acce
lera
tion
Pow
er S
pect
ral D
ensi
ty (g
Time Triggered(rms = 8.9 g)
Peak Hold of All J & B RunsLess 11, 13 & 15
Z AxisSignal Triggered
(rms =9.0 g)
Figure 17: Peak Hold PSD of time and signal triggered data.
2.3.4.1.3 Results
The measured data show a non gaussian distribution (figure 18). In most runs the verti-cal z-axis shows higher amplitudes than the two other axis (figure 19) and the data of the different runs scatter a lot (figure 20). The vertical axis (z-axis) shows significant (t0,95-Test) higher values than the two horizontal axis (x and -axis) in figure 21.
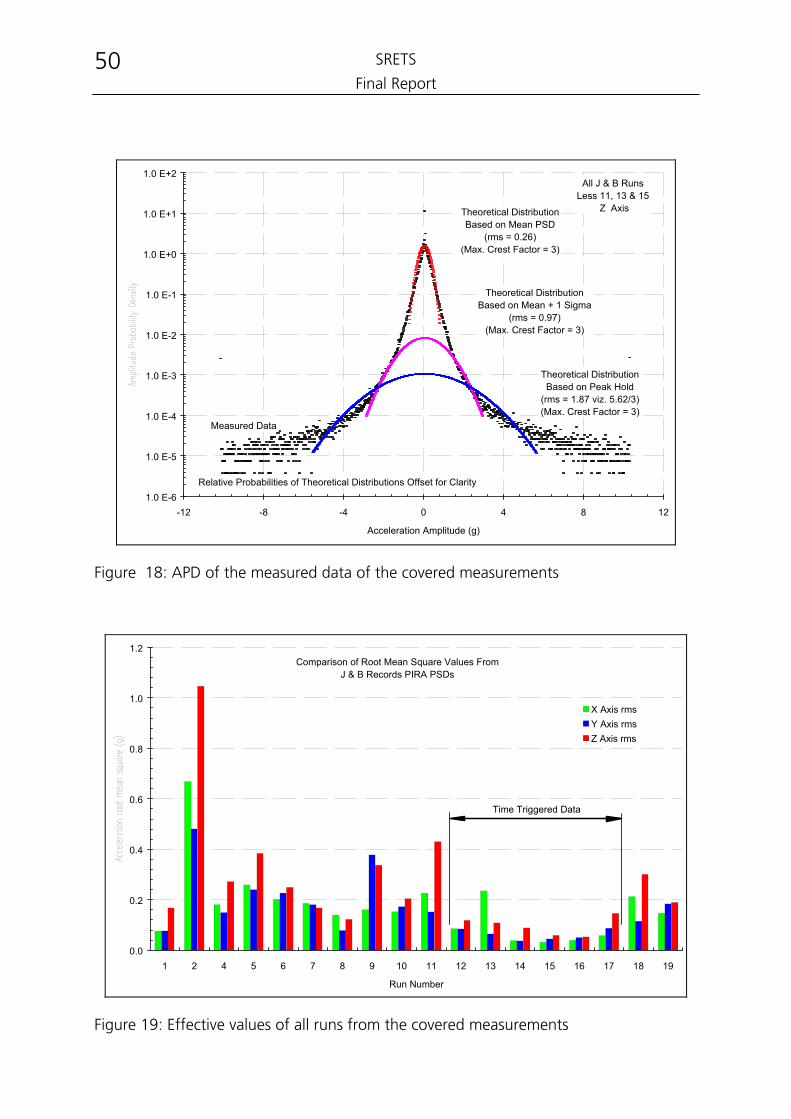
SRETS
Final Report 50
1.0 E-6
1.0 E-5
1.0 E-4
1.0 E-3
1.0 E-2
1.0 E-1
1.0 E+0
1.0 E+1
1.0 E+2
-12 -8 -4 0 4 8 12
Acceleration Amplitude (g)
All J & B RunsLess 11, 13 & 15
Z Axis
Measured Data
Theoretical DistributionBased on Mean PSD
(rms = 0.26)(Max. Crest Factor = 3)
Theoretical DistributionBased on Mean + 1 Sigma
(rms = 0.97)(Max. Crest Factor = 3)
Theoretical DistributionBased on Peak Hold
(rms = 1.87 viz. 5.62/3)(Max. Crest Factor = 3)
Relative Probabilities of Theoretical Distributions Offset for Clarity
Figure 18: APD of the measured data of the covered measurements
0.0
0.2
0.4
0.6
0.8
1.0
1.2
1 2 4 5 6 7 8 9 10 11 12 13 14 15 16 17 18 19
Run Number
X Axis rmsY Axis rmsZ Axis rms
Time Triggered Data
Comparison of Root Mean Square Values FromJ & B Records PIRA PSDs
Figure 19: Effective values of all runs from the covered measurements
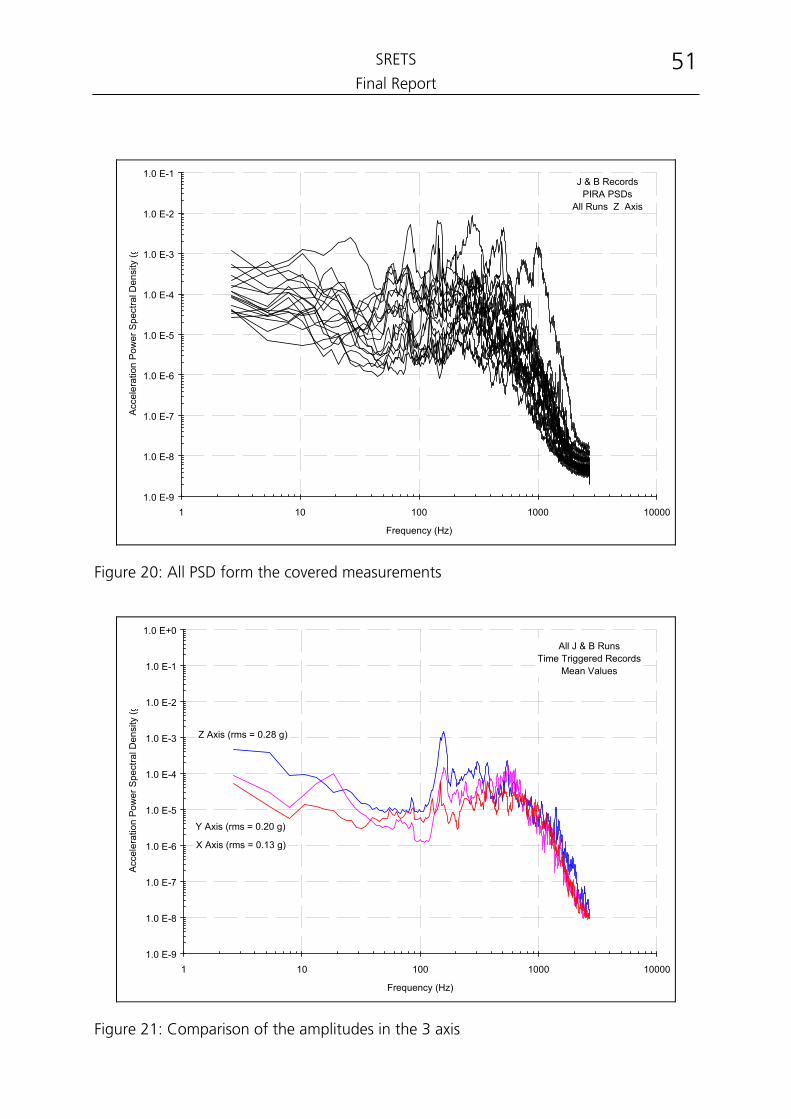
SRETS
Final Report 51
1.0 E-9
1.0 E-8
1.0 E-7
1.0 E-6
1.0 E-5
1.0 E-4
1.0 E-3
1.0 E-2
1.0 E-1
1 10 100 1000 10000
Frequency (Hz)
Acce
lera
tion
Pow
er S
pect
ral D
ensi
ty (g
J & B RecordsPIRA PSDs
All Runs Z Axis
Figure 20: All PSD form the covered measurements
1.0 E-9
1.0 E-8
1.0 E-7
1.0 E-6
1.0 E-5
1.0 E-4
1.0 E-3
1.0 E-2
1.0 E-1
1.0 E+0
1 10 100 1000 10000
Frequency (Hz)
Acce
lera
tion
Pow
er S
pect
ral D
ensi
ty (g
All J & B RunsTime Triggered Records
Mean Values
Z Axis (rms = 0.28 g)
X Axis (rms = 0.13 g)
Y Axis (rms = 0.20 g)
Figure 21: Comparison of the amplitudes in the 3 axis
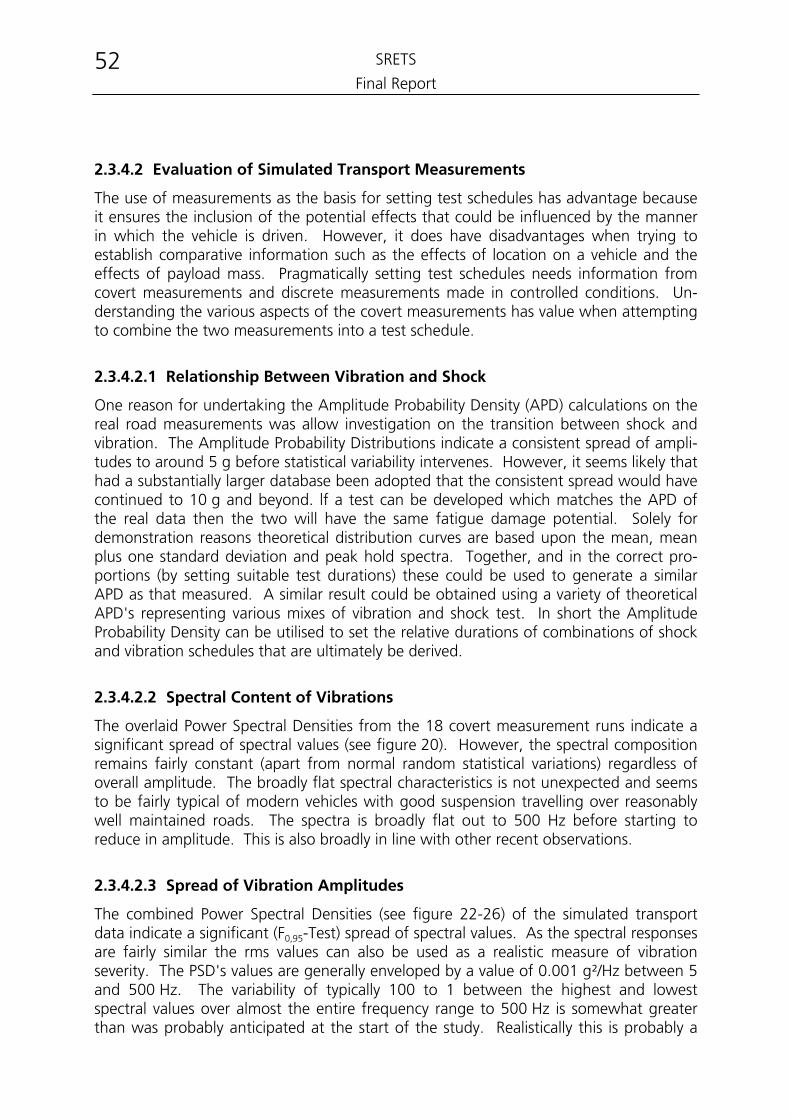
SRETS
Final Report 52
2.3.4.2 Evaluation of Simulated Transport Measurements
The use of measurements as the basis for setting test schedules has advantage because it ensures the inclusion of the potential effects that could be influenced by the manner in which the vehicle is driven. However, it does have disadvantages when trying to establish comparative information such as the effects of location on a vehicle and the effects of payload mass. Pragmatically setting test schedules needs information from covert measurements and discrete measurements made in controlled conditions. Un-derstanding the various aspects of the covert measurements has value when attempting to combine the two measurements into a test schedule.
2.3.4.2.1 Relationship Between Vibration and Shock
One reason for undertaking the Amplitude Probability Density (APD) calculations on the real road measurements was allow investigation on the transition between shock and vibration. The Amplitude Probability Distributions indicate a consistent spread of ampli-tudes to around 5 g before statistical variability intervenes. However, it seems likely that had a substantially larger database been adopted that the consistent spread would have continued to 10 g and beyond. lf a test can be developed which matches the APD of the real data then the two will have the same fatigue damage potential. Solely for demonstration reasons theoretical distribution curves are based upon the mean, mean plus one standard deviation and peak hold spectra. Together, and in the correct pro-portions (by setting suitable test durations) these could be used to generate a similar APD as that measured. A similar result could be obtained using a variety of theoretical APD's representing various mixes of vibration and shock test. In short the Amplitude Probability Density can be utilised to set the relative durations of combinations of shock and vibration schedules that are ultimately be derived.
2.3.4.2.2 Spectral Content of Vibrations
The overlaid Power Spectral Densities from the 18 covert measurement runs indicate a significant spread of spectral values (see figure 20). However, the spectral composition remains fairly constant (apart from normal random statistical variations) regardless of overall amplitude. The broadly flat spectral characteristics is not unexpected and seems to be fairly typical of modern vehicles with good suspension travelling over reasonably well maintained roads. The spectra is broadly flat out to 500 Hz before starting to reduce in amplitude. This is also broadly in line with other recent observations.
2.3.4.2.3 Spread of Vibration Amplitudes
The combined Power Spectral Densities (see figure 22-26) of the simulated transport data indicate a significant (F0,95-Test) spread of spectral values. As the spectral responses are fairly similar the rms values can also be used as a realistic measure of vibration severity. The PSD's values are generally enveloped by a value of 0.001 g²/Hz between 5 and 500 Hz. The variability of typically 100 to 1 between the highest and lowest spectral values over almost the entire frequency range to 500 Hz is somewhat greater than was probably anticipated at the start of the study. Realistically this is probably a
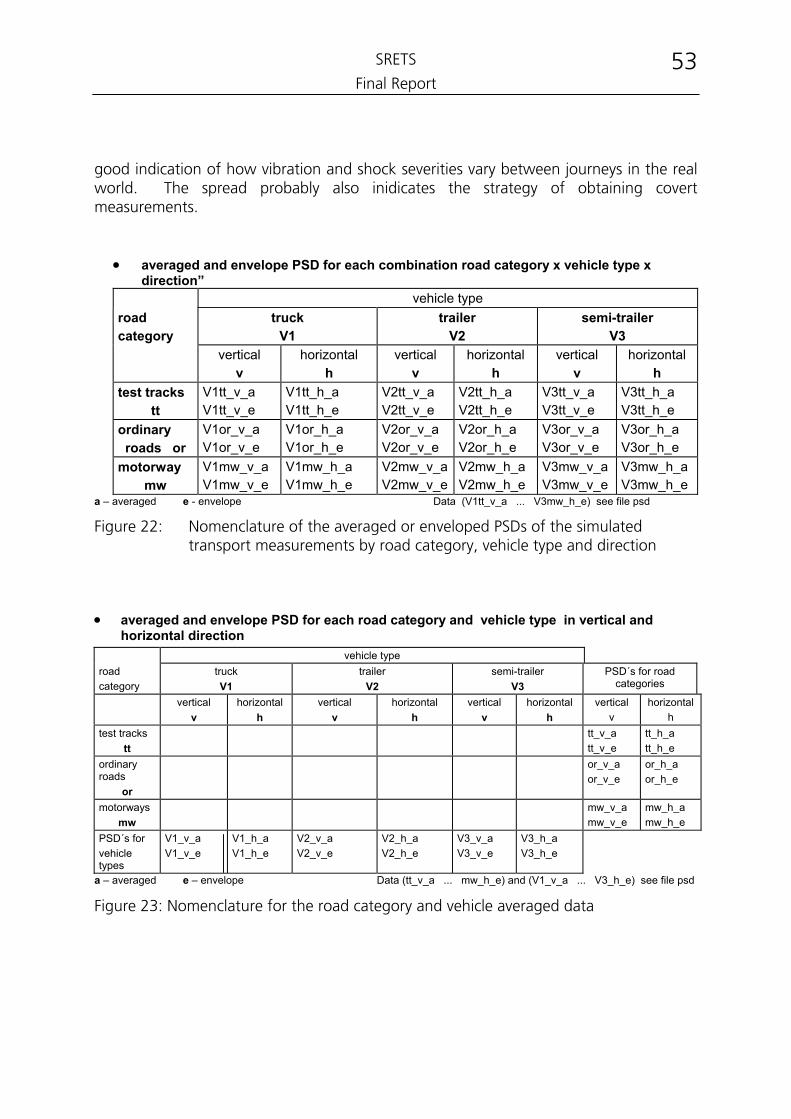
SRETS
Final Report 53
good indication of how vibration and shock severities vary between journeys in the real world. The spread probably also inidicates the strategy of obtaining covert measurements.
• averaged and envelope PSD for each combination road category x vehicle type x direction”
vehicle type road category
truck V1
trailer V2
semi-trailer V3
vertical v
horizontal h
vertical v
horizontal h
vertical v
horizontal h
test tracks tt
V1tt_v_a V1tt_v_e
V1tt_h_a V1tt_h_e
V2tt_v_a V2tt_v_e
V2tt_h_a V2tt_h_e
V3tt_v_a V3tt_v_e
V3tt_h_a V3tt_h_e
ordinary roads or
V1or_v_a V1or_v_e
V1or_h_a V1or_h_e
V2or_v_a V2or_v_e
V2or_h_a V2or_h_e
V3or_v_a V3or_v_e
V3or_h_a V3or_h_e
motorway mw
V1mw_v_a V1mw_v_e
V1mw_h_a V1mw_h_e
V2mw_v_aV2mw_v_e
V2mw_h_a V2mw_h_e
V3mw_v_a V3mw_v_e
V3mw_h_a V3mw_h_e
a – averaged e - envelope Data (V1tt_v_a ... V3mw_h_e) see file psd Figure 22: Nomenclature of the averaged or enveloped PSDs of the simulated
transport measurements by road category, vehicle type and direction
• averaged and envelope PSD for each road category and vehicle type in vertical and horizontal direction
vehicle type road category
truck V1
trailer V2
semi-trailer V3
PSD´s for road categories
vertical v
horizontal h
vertical v
horizontal h
vertical v
horizontal h
vertical v
horizontal h
test tracks tt
tt_v_a tt_v_e
tt_h_a tt_h_e
ordinary roads
or
or_v_a or_v_e
or_h_a or_h_e
motorways mw
mw_v_a mw_v_e
mw_h_a mw_h_e
PSD´s for vehicle types
V1_v_a V1_v_e
V1_h_a V1_h_e
V2_v_a V2_v_e
V2_h_a V2_h_e
V3_v_a V3_v_e
V3_h_a V3_h_e
a – averaged e – envelope Data (tt_v_a ... mw_h_e) and (V1_v_a ... V3_h_e) see file psd
Figure 23: Nomenclature for the road category and vehicle averaged data
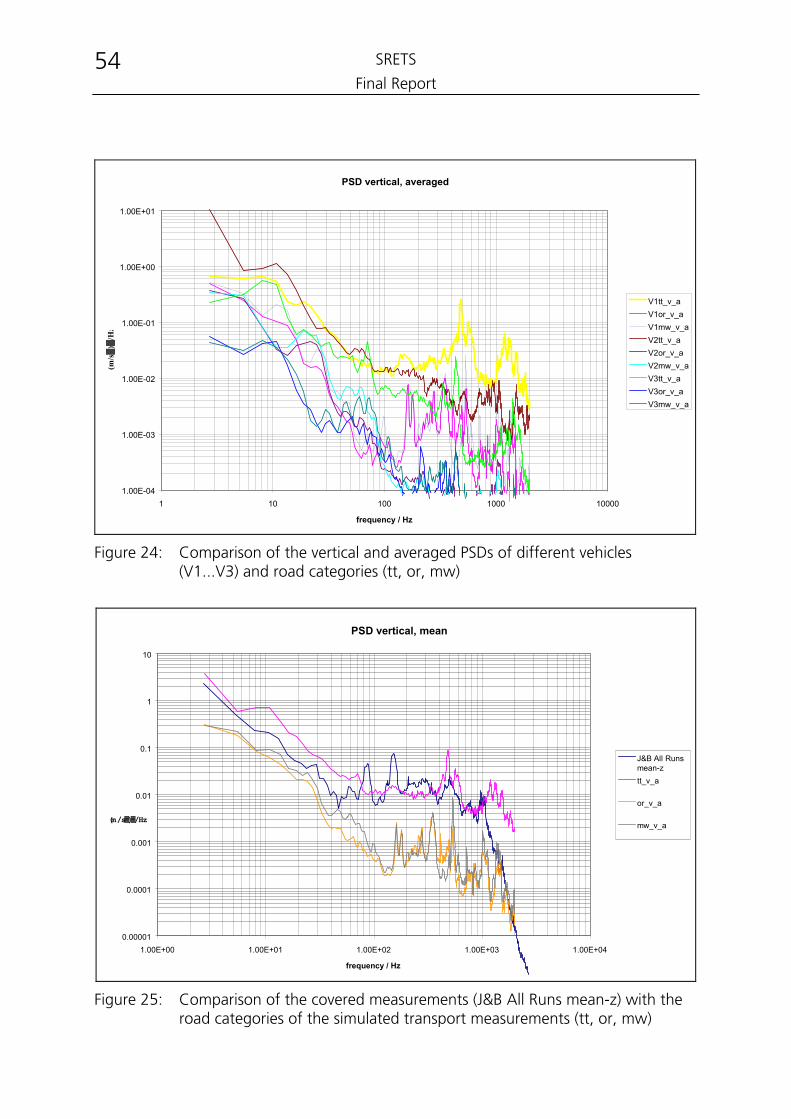
SRETS
Final Report 54
PSD vertical, averaged
1.00E-04
1.00E-03
1.00E-02
1.00E-01
1.00E+00
1.00E+01
1 10 100 1000 10000
frequency / Hz
(m/s▓
)▓/H
z
V1tt_v_aV1or_v_aV1mw_v_aV2tt_v_aV2or_v_aV2mw_v_aV3tt_v_aV3or_v_aV3mw_v_a
Figure 24: Comparison of the vertical and averaged PSDs of different vehicles
(V1...V3) and road categories (tt, or, mw)
PSD vertical, mean
0.00001
0.0001
0.001
0.01
0.1
1
10
1.00E+00 1.00E+01 1.00E+02 1.00E+03 1.00E+04
frequency / Hz
(m/s▓)▓/Hz
J&B All Runsmean-ztt_v_a
or_v_a
mw_v_a
Figure 25: Comparison of the covered measurements (J&B All Runs mean-z) with the
road categories of the simulated transport measurements (tt, or, mw)
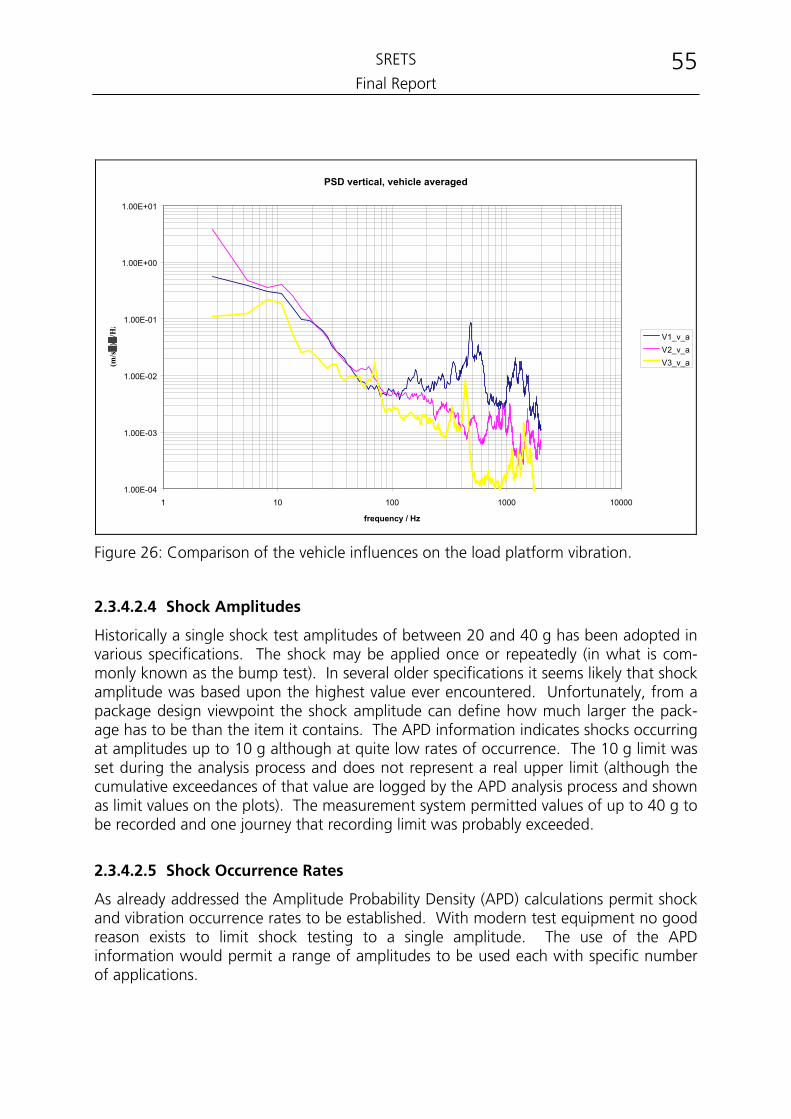
SRETS
Final Report 55
PSD vertical, vehicle averaged
1.00E-04
1.00E-03
1.00E-02
1.00E-01
1.00E+00
1.00E+01
1 10 100 1000 10000
frequency / Hz
(m/s▓
)▓/H
z
V1_v_aV2_v_aV3_v_a
Figure 26: Comparison of the vehicle influences on the load platform vibration.
2.3.4.2.4 Shock Amplitudes
Historically a single shock test amplitudes of between 20 and 40 g has been adopted in various specifications. The shock may be applied once or repeatedly (in what is com-monly known as the bump test). In several older specifications it seems likely that shock amplitude was based upon the highest value ever encountered. Unfortunately, from a package design viewpoint the shock amplitude can define how much larger the pack-age has to be than the item it contains. The APD information indicates shocks occurring at amplitudes up to 10 g although at quite low rates of occurrence. The 10 g limit was set during the analysis process and does not represent a real upper limit (although the cumulative exceedances of that value are logged by the APD analysis process and shown as limit values on the plots). The measurement system permitted values of up to 40 g to be recorded and one journey that recording limit was probably exceeded.
2.3.4.2.5 Shock Occurrence Rates
As already addressed the Amplitude Probability Density (APD) calculations permit shock and vibration occurrence rates to be established. With modern test equipment no good reason exists to limit shock testing to a single amplitude. The use of the APD information would permit a range of amplitudes to be used each with specific number of applications.
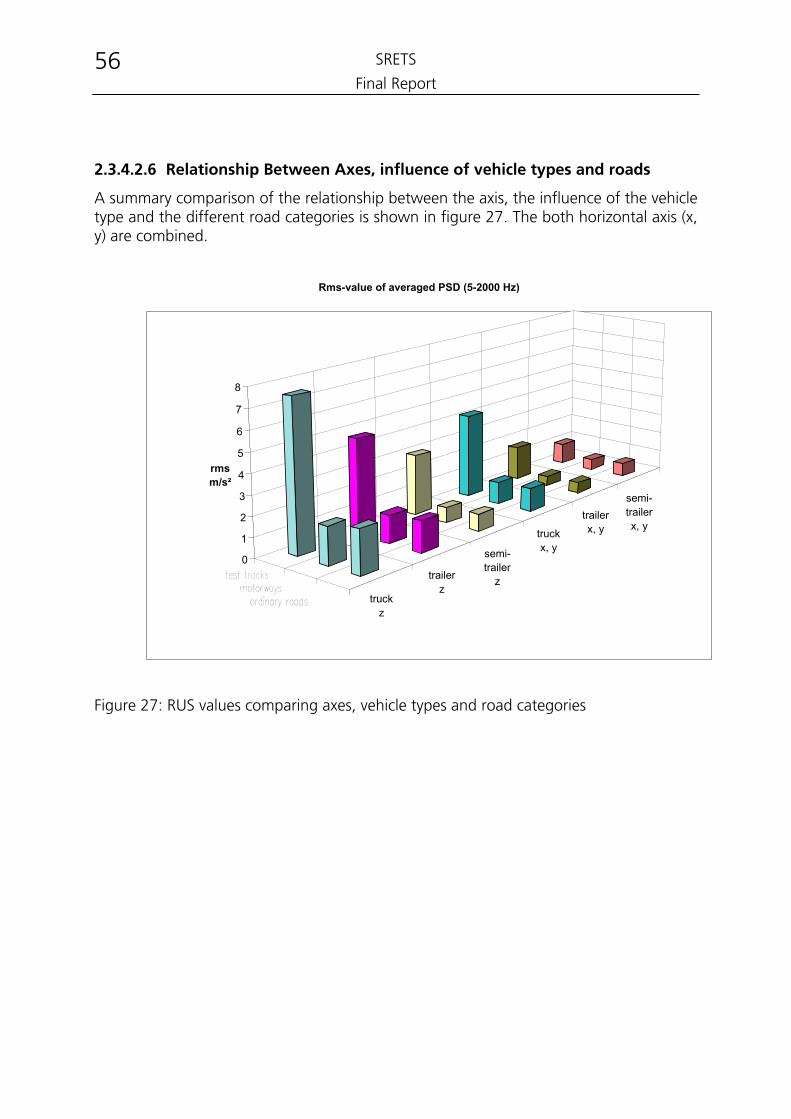
SRETS
Final Report 56
2.3.4.2.6 Relationship Between Axes, influence of vehicle types and roads
A summary comparison of the relationship between the axis, the influence of the vehicle type and the different road categories is shown in figure 27. The both horizontal axis (x, y) are combined.
truckz
trailerz
semi-trailer
z
truckx, y
trailerx, y
semi-trailerx, y
0
1
2
3
4
5
6
7
8
rmsm/s²
Rms-value of averaged PSD (5-2000 Hz)
Figure 27: RUS values comparing axes, vehicle types and road categories
SRETS
Final Report 57
2.3.5 Conclusions and recommendations
Task 2 provided the project with raw data. Task 3 evaluated and processed the data for the later tasks (4, 6 and 7). Task 4 used both processed and raw data.
• The measured data represents a number of examples of real transport. To in-clude all transport modes and conditions would cost several million Euro. In the short term the literature data could be used to broaden the data base; in the long term more extensive data could be added through further measure-ments.
• There are no standardised measurement procedures in Europe. A series of
standards for performing measurement trips is required. • Two types of measurements were performed: simulated transport (overt) and
real transport (covert); these complemented each other. For consistency both measurement types were calibrated together at the start of the project. For further measurement campaigns it is recommended that at least one measure-ment trip is performed with both overt and covert measurements in parallel.
• Measurements differ for a number of reasons including routes, roads, vehicles,
loads and velocities. If these conditions are known the data measured may be used to simulate journeys of similar nature. Without knowledge of these con-ditions data is not suitable for derivation of test spectra.
• The data of simulated transport measurements according to the project results
were classified in 18 categories due to direction of vibration (horizontal or vertical), vehicle type (truck, trailer, semi-trailer) and road category (test track or bad road, ordinary road, motorways).
• The data of the covert measurements contain also some parts of ship and rail
transport. Other measurement trips on ships, rail or aircraft were not content of the project. The measured data from ship and rail are not statistical secured because they content only some seconds of vibration data. The statistical error, a function of the quantity of data, is very high for the few data from ship and rail. So the ship and rail data were not used in the project.
• There are a lot of possible methods for the evaluation of data. It is recom-
mended to derive at least Power Spectral Densities. First reason is that nearly all measured data are presented as PSDs and only such analysis are able to be compared in an easy and complete way. The second reason is that today all test procedures are also presented in PSDs. There are different ways to evaluate PSD test levels from measured data, even methods exist (FDS analysis and derivation of test PSD) which do not use PSD analysis and result in PSD test spectra. In this case it is very important to compare the PSDs from the data analysis with that of the derived test.
SRETS
Final Report 58
• It is recommended to add to the database, both measured data and analysed
data (spectra) with data of other vehicles like ships, railway or aircraft. Also several categories should be made.
• The database for road data should also be complemented by measurements in
other regions than Europe. Other categories of vehicles, road e.g. may be added.
• Automatic procedures for the validation of measured data are missing in the
standard software and should be added. Especially devices for covered measurements should be able to validate their gathered data.
• The measurement devices for covered measurements offer an increasing po-
tential for the future. The development of such devices should be forced. Some of these devices are made for special purposes for example the super-vision of transports and therefore record only special events. Such devices are not suitable for the measurement of dynamic transportation loads.
• Covered measurements give time and signal triggered data. Analysis shows
that the results are significant different (as expected) at the 95% level. For shock testing signal triggered data should be used, for vibration testing stationary time triggered data are suitable.
• Measurements and data analysis could be separated in both cases, covered
and simulated transport measurements but parameters for the data capture and first handling (data validation, selection of parts, mode of operation) are set at the measurements and restrict the evaluation. Therefore both, measure-ments and analysis should be planned together. An evaluation of foreign data is only useful if all information about the measurements (i.e. vehicle types, roads, velocities, location of sensor, measurement chain and parameters) are given. It is recommended for all data bases of measured data to include this information. Also analysed data should include this information together with the details of the analysing parameters.
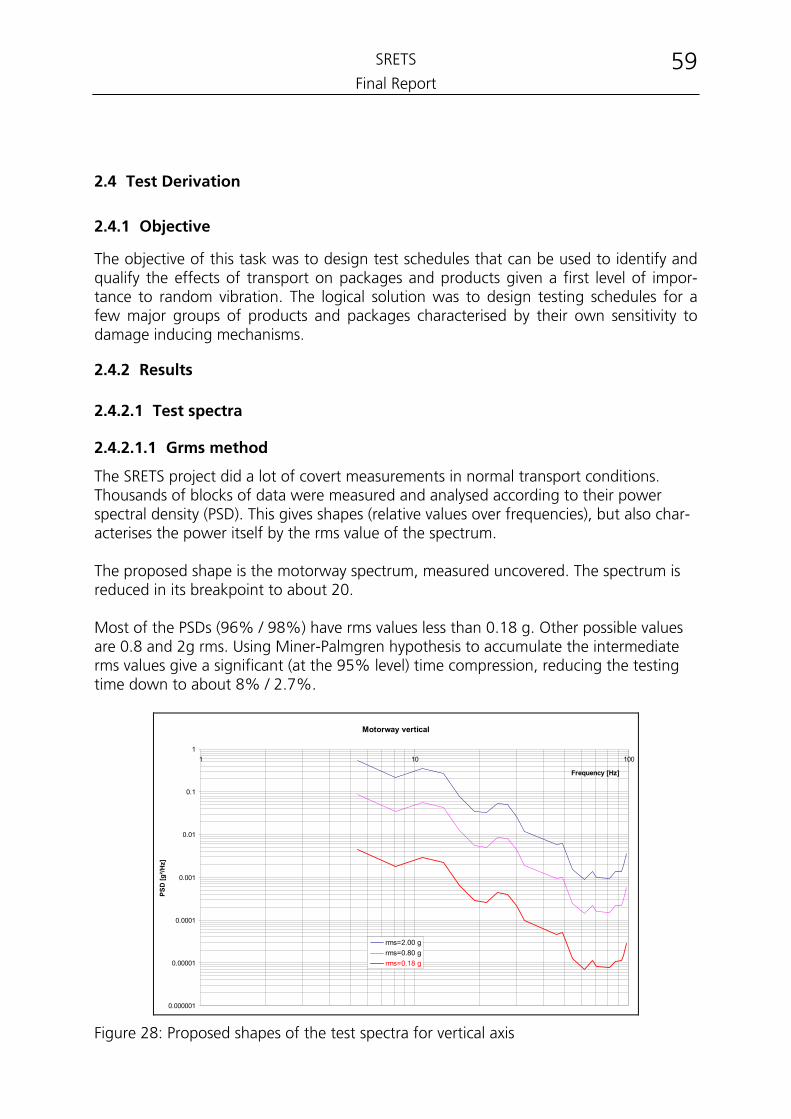
SRETS
Final Report 59
2.4 Test Derivation
2.4.1 Objective
The objective of this task was to design test schedules that can be used to identify and qualify the effects of transport on packages and products given a first level of impor-tance to random vibration. The logical solution was to design testing schedules for a few major groups of products and packages characterised by their own sensitivity to damage inducing mechanisms.
2.4.2 Results
2.4.2.1 Test spectra
2.4.2.1.1 Grms method
The SRETS project did a lot of covert measurements in normal transport conditions. Thousands of blocks of data were measured and analysed according to their power spectral density (PSD). This gives shapes (relative values over frequencies), but also char-acterises the power itself by the rms value of the spectrum. The proposed shape is the motorway spectrum, measured uncovered. The spectrum is reduced in its breakpoint to about 20. Most of the PSDs (96% / 98%) have rms values less than 0.18 g. Other possible values are 0.8 and 2g rms. Using Miner-Palmgren hypothesis to accumulate the intermediate rms values give a significant (at the 95% level) time compression, reducing the testing time down to about 8% / 2.7%.
Motorway vertical
0.000001
0.00001
0.0001
0.001
0.01
0.1
11 10 100
Frequency [Hz]
PSD
[g²/H
z]
rms=2.00 grms=0.80 g
rms=0.18 g
Figure 28: Proposed shapes of the test spectra for vertical axis
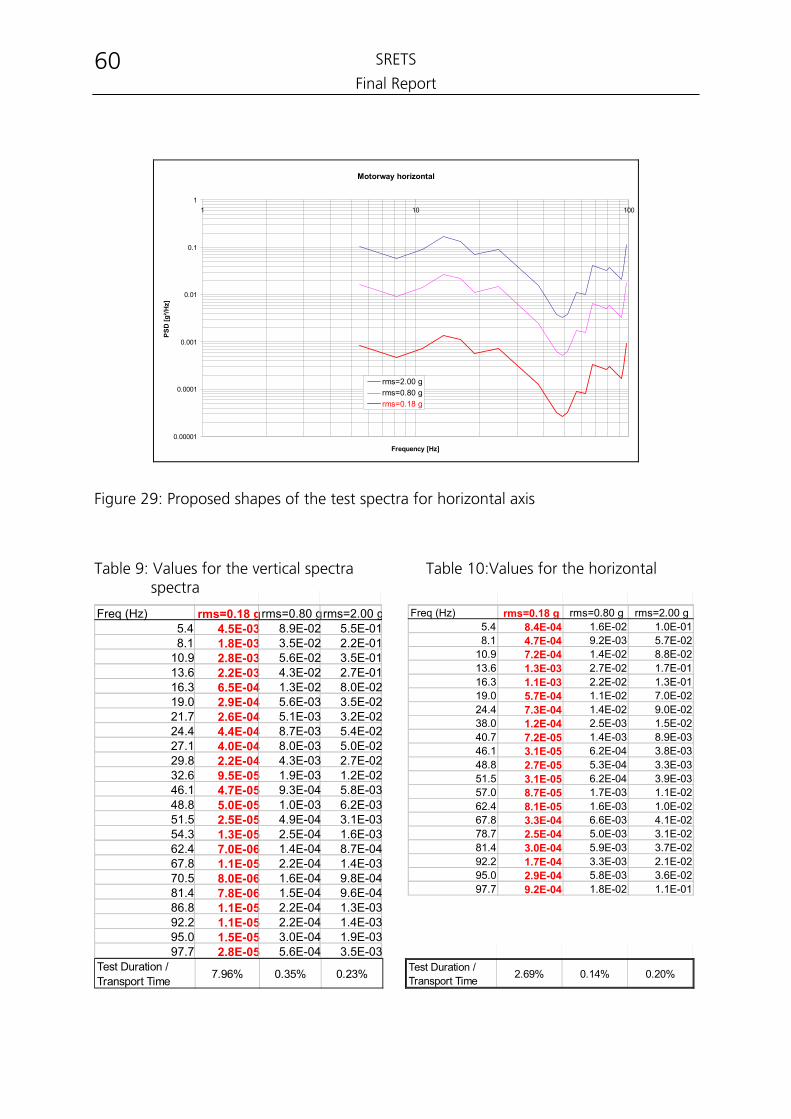
SRETS
Final Report 60
Motorway horizontal
0.00001
0.0001
0.001
0.01
0.1
11 10 100
Frequency [Hz]
PSD
[g²/H
z]
rms=2.00 grms=0.80 g
rms=0.18 g
rms=0.18 grms=0.80 g4.5E-031.8E-032.8E-032.2E-036.5E-042.9E-042.6E-044.4E-044.0E-042.2E-049.5E-054.7E-055.0E-052.5E-051.3E-057.0E-061.1E-058.0E-067.8E-061.1E-051.1E-051.5E-052.8E-05
rms=0.18 g8.4E-044.7E-047.2E-041.3E-031.1E-035.7E-047.3E-041.2E-047.2E-053.1E-052.7E-053.1E-058.7E-058.1E-053.3E-042.5E-043.0E-041.7E-042.9E-049.2E-04
Figure 29: Proposed shapes of the test spectra for horizontal axis
Table 9: Values for the vertical spectra Table 10:Values for the horizontal spectra
Freq (Hz) rms=2.00 g5.4 8.9E-02 5.5E-018.1 3.5E-02 2.2E-01
10.9 5.6E-02 3.5E-0113.6 4.3E-02 2.7E-0116.3 1.3E-02 8.0E-0219.0 5.6E-03 3.5E-0221.7 5.1E-03 3.2E-0224.4 8.7E-03 5.4E-0227.1 8.0E-03 5.0E-0229.8 4.3E-03 2.7E-0232.6 1.9E-03 1.2E-0246.1 9.3E-04 5.8E-0348.8 1.0E-03 6.2E-0351.5 4.9E-04 3.1E-0354.3 2.5E-04 1.6E-0362.4 1.4E-04 8.7E-0467.8 2.2E-04 1.4E-0370.5 1.6E-04 9.8E-0481.4 1.5E-04 9.6E-0486.8 2.2E-04 1.3E-0392.2 2.2E-04 1.4E-0395.0 3.0E-04 1.9E-0397.7 5.6E-04 3.5E-03
Freq (Hz) rms=0.80 g rms=2.00 g5.4 1.6E-02 1.0E-018.1 9.2E-03 5.7E-02
10.9 1.4E-02 8.8E-0213.6 2.7E-02 1.7E-0116.3 2.2E-02 1.3E-0119.0 1.1E-02 7.0E-0224.4 1.4E-02 9.0E-0238.0 2.5E-03 1.5E-0240.7 1.4E-03 8.9E-0346.1 6.2E-04 3.8E-0348.8 5.3E-04 3.3E-0351.5 6.2E-04 3.9E-0357.0 1.7E-03 1.1E-0262.4 1.6E-03 1.0E-0267.8 6.6E-03 4.1E-0278.7 5.0E-03 3.1E-0281.4 5.9E-03 3.7E-0292.2 3.3E-03 2.1E-0295.0 5.8E-03 3.6E-0297.7 1.8E-02 1.1E-01
Test Duration / Transport Time 7.96% 0.35% 0.23%
Test Duration / Transport Time 2.69% 0.14% 0.20%
SRETS
Final Report 61
2.4.2.1.2 APD method
The APD-Method analysed the acceleration of the covert measurements. The Amplitude Probability Density (APD) gives information how often a certain acceleration can be ex-pected: For the spectral shape again the measured PSD of the motorway is used, again reduced in the amount of breakpoints.
Motorway vertical
1.0E-08
1.0E-07
1.0E-06
1.0E-05
1.0E-04
1.0E-03
1.0E-02
1.0E-01
1.0E+00
1.0E+01
1 10 100
Frequency [Hz]
PSD
[g²/H
z]
rms=3.00 grms=0.80 g
rms=0.008 g
rms=0.18 g
rms=0.09 g
Figure 30: Modified levels for the test spectra for vertical axis
Motorway horizontal
0.00000001
0.0000001
0.000001
0.00001
0.0001
0.001
0.01
0.1
11 10 100
Frequency [Hz]
PSD
[g²/H
z]
rms=2.00 grms=0.48 g
rms=0.01 g
Figure 31: Modified levels for the test spectra for horizontal axis
The APD Method fits different theoretical curves into the APD. Those APD of the theo-retical curves are determined by the Gaussian distribution (σ = 3) generated by a con-
SRETS
Final Report 62
ventional vibration system. The fitting is done by modifying the rms value of the curve and weighing in time. The first curve is of a very low rms value of 0.008 g / 0.01 g, whereas the next curve give again 0.18 g for vertical and horizontal direction. These are the same levels as of the Grms Method, but with other time compression factors (see figures 30 and 31 as well as table11 and 12).
Table 11: Values for the vertical spectra after APD method
Vertical
Table 12: Values for the horizontal spectra after APD method
Horizontal Freq (Hz) rms=0.008 g rms=0.80 g rms=3.00 g
5.4 8.9E-06 8.9E-02 1.2E+008.1 3.5E-06 3.5E-02 4.9E-01
10.9 5.6E-06 5.6E-02 7.8E-0113.6 4.3E-06 4.3E-02 6.1E-0116.3 1.3E-06 1.3E-02 1.8E-0119.0 5.6E-07 5.6E-03 7.9E-0221.7 5.1E-07 5.1E-03 7.2E-0224.4 8.7E-07 8.7E-03 1.2E-0127.1 8.0E-07 8.0E-03 1.1E-0129.8 4.3E-07 4.3E-03 6.1E-0232.6 1.9E-07 1.9E-03 2.6E-0246.1 9.3E-08 9.3E-04 1.3E-0248.8 1.0E-07 1.0E-03 1.4E-0251.5 4.9E-08 4.9E-04 6.9E-0354.3 2.5E-08 2.5E-04 3.5E-0362.4 1.4E-08 1.4E-04 2.0E-0367.8 2.2E-08 2.2E-04 3.1E-0370.5 1.6E-08 1.6E-04 2.2E-0381.4 1.5E-08 1.5E-04 2.2E-0386.8 2.2E-08 2.2E-04 3.0E-0392.2 2.2E-08 2.2E-04 3.1E-0395.0 3.0E-08 3.0E-04 4.2E-0397.7 5.6E-08 5.6E-04 7.9E-03
Freq (Hz) rms=0.01 g rms=0.48 g rms=2.00 g5.4 2.6E-06 5.9E-03 1.0E-018.1 1.4E-06 3.3E-03 5.7E-02
10.9 2.2E-06 5.1E-03 8.8E-0213.6 4.2E-06 9.6E-03 1.7E-0116.3 3.4E-06 7.8E-03 1.3E-0119.0 1.8E-06 4.0E-03 7.0E-0224.4 2.3E-06 5.2E-03 9.0E-0238.0 3.9E-07 8.9E-04 1.5E-0240.7 2.2E-07 5.1E-04 8.9E-0346.1 9.6E-08 2.2E-04 3.8E-0348.8 8.3E-08 1.9E-04 3.3E-0351.5 9.7E-08 2.2E-04 3.9E-0357.0 2.7E-07 6.2E-04 1.1E-0262.4 2.5E-07 5.8E-04 1.0E-0267.8 1.0E-06 2.4E-03 4.1E-0278.7 7.9E-07 1.8E-03 3.1E-0281.4 9.1E-07 2.1E-03 3.7E-0292.2 5.2E-07 1.2E-03 2.1E-0295.0 9.1E-07 2.1E-03 3.6E-0297.7 2.8E-06 6.5E-03 1.1E-01
Test Duration / Transport Time 96.49% 3.50% 0.014% 0.001%
Test Duration / Transport Time 89.97% 10.00% 0.03% 0.001%
rms=0.18 g4.5E-031.8E-032.8E-032.2E-036.5E-042.9E-042.6E-044.4E-044.0E-042.2E-049.5E-054.7E-055.0E-052.5E-051.3E-057.0E-061.1E-058.0E-067.8E-061.1E-051.1E-051.5E-052.8E-05
rms=0.09 g2.1E-041.2E-041.8E-043.4E-042.7E-041.4E-041.8E-043.1E-051.8E-057.8E-066.7E-067.8E-062.2E-052.0E-058.3E-056.4E-057.4E-054.2E-057.3E-052.3E-04
2.4.2.1.3 Conventional PSD approach
The input was approximately 400 averaged PSD´s of single measurements of the simulated transport measurement. Initially averaged PSD´s were calculated for each combination of road category, vehicle type and orientation. That means, an account of
• 3 road categories • 3 vehicle types • 2 orientation (vertical, horizontal),
altogether 2 x 18 PSD´s. It is very seldom that the correct position of the transport item is known. Therefore there is no differentiation between longitudinal and lateral direc-tion. The collection of these PSD-spectra makes possible to characterize transport envi-ronment individually for each event according to the above mentioned three variables. The necessity of tests having regard on vehicle type has lower priority. Therefore enve-lope PSD´s were calculated in order to eliminate the variable ”vehicle type”. As a result 6 road specific test spectras are defined:
SRETS
Final Report 63
Table 13: Road specific test spectra
road category description test spectra vertical horizontal
1 common good to very good road condition, as a rule on motorways and other arterial roads
test v1 test h1
2 bad road conditions, as a rule on by-streets, on section of road category 1 under need of repair
test v2 test h2
3 very bad road conditions test v3 test h3
Table 14: Test spectra for vertical orientation (values)
freq. Test v1 test v2 freq. test v3 Hz (m/s²)²/Hz (m/s²)²/Hz Hz (m/s²)²/Hz
5 0,3221 0,6313 5 1,0000 14 0,1216 0,2384 11 1,1298 24 0,0492 0,0964 48 0,0289 38 0,0052 0,0102 71 0,0478 61 0,0044 0,0087 80 0,0153 98 0,0014 0,0028 125 0,0161 131 0,0004 0,0008 136 0,0265 158 0,0075 0,0148 150 0,0279 178 0,0051 0,0100 200 0,0170 203 0,0012 0,0024 254 0,0251 276 0,0055 0,0108 340 0,0325 350 0,0110 0,0216 443 0,0598 417 0,0022 0,0043 469 0,2649 450 0,0008 0,0015 500 0,2649 500 0,0029 0,0057
aeff in m/s² 2,1 3,0 aeff in m/s² 6,1
0,0001
0,001
0,01
0,1
1
10
1 10 100 1000
frequency (Hz)
test v1
test v2
test v3
Figure 32: Test spectra for vertical orientation (diagramme)
SRETS
Final Report 64
Table 15: Test spectra for horizontal orientation (values)
freq. test h1 test h2 freq. test h3 Hz (m/s²)²/Hz (m/s²)²/Hz Hz (m/s²)²/Hz
5 0,0303 0,0436 5 0,0560 19 0,0100 0,0144 22 0,0560 38 0,0015 0,0022 45 0,0076 43 0,0012 0,0017 67 0,0076 59 0,0033 0,0048 72 0,0114 74 0,0033 0,0048 87 0,0117 90 0,0022 0,0031 96 0,0068
100 0,0043 0,0061 138 0,0096 128 0,0004 0,0006 158 0,0514 140 0,0004 0,0006 173 0,0459 158 0,0079 0,0113 200 0,0102 182 0,0036 0,0051 260 0,0133 202 0,0004 0,0006 290 0,0081 225 0,0010 0,0015 390 0,0082 261 0,0004 0,0005 422 0,0115 280 0,0012 0,0017 500 0,0082 300 0,0006 0,0008 335 0,0012 0,0017 392 0,0003 0,0005 434 0,0023 0,0032 500 0,0035 0,0051
aeff in m/s² 1,0 1,3 aeff in m/s² 2,7
0,0001
0,001
0,01
0,1
1 10 100 1000frequency (Hz)
test h1
test h2
test h3
Figure 33: Test spectra for horizontal orientation (diagramme)
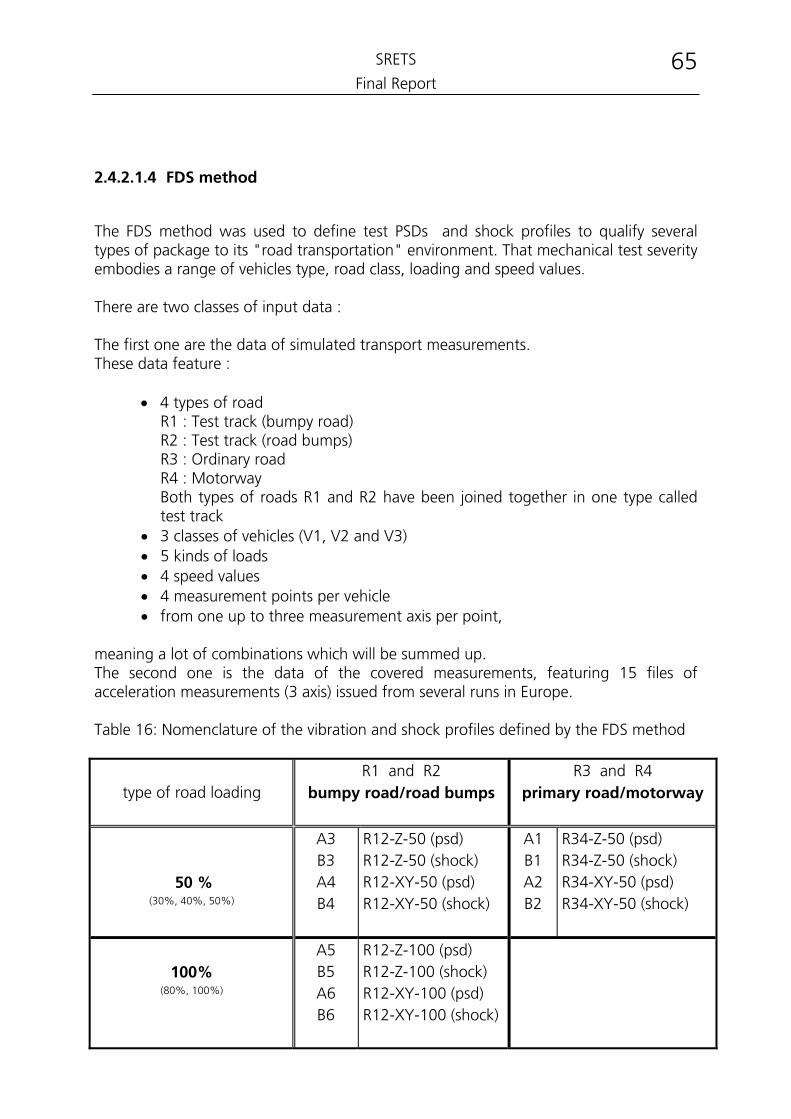
SRETS
Final Report 65
2.4.2.1.4 FDS method
The FDS method was used to define test PSDs and shock profiles to qualify several types of package to its "road transportation" environment. That mechanical test severity embodies a range of vehicles type, road class, loading and speed values. There are two classes of input data : The first one are the data of simulated transport measurements. These data feature :
• 4 types of road R1 : Test track (bumpy road) R2 : Test track (road bumps) R3 : Ordinary road R4 : Motorway Both types of roads R1 and R2 have been joined together in one type called test track
• 3 classes of vehicles (V1, V2 and V3) • 5 kinds of loads • 4 speed values • 4 measurement points per vehicle • from one up to three measurement axis per point,
meaning a lot of combinations which will be summed up. The second one is the data of the covered measurements, featuring 15 files of acceleration measurements (3 axis) issued from several runs in Europe. Table 16: Nomenclature of the vibration and shock profiles defined by the FDS method
type of road loading
R1 and R2 bumpy road/road bumps
R3 and R4 primary road/motorway
50 % (30%, 40%, 50%)
A3 B3 A4 B4
R12-Z-50 (psd) R12-Z-50 (shock) R12-XY-50 (psd) R12-XY-50 (shock)
A1 B1 A2 B2
R34-Z-50 (psd) R34-Z-50 (shock) R34-XY-50 (psd) R34-XY-50 (shock)
100%
(80%, 100%)
A5 B5 A6 B6
R12-Z-100 (psd) R12-Z-100 (shock) R12-XY-100 (psd) R12-XY-100 (shock)
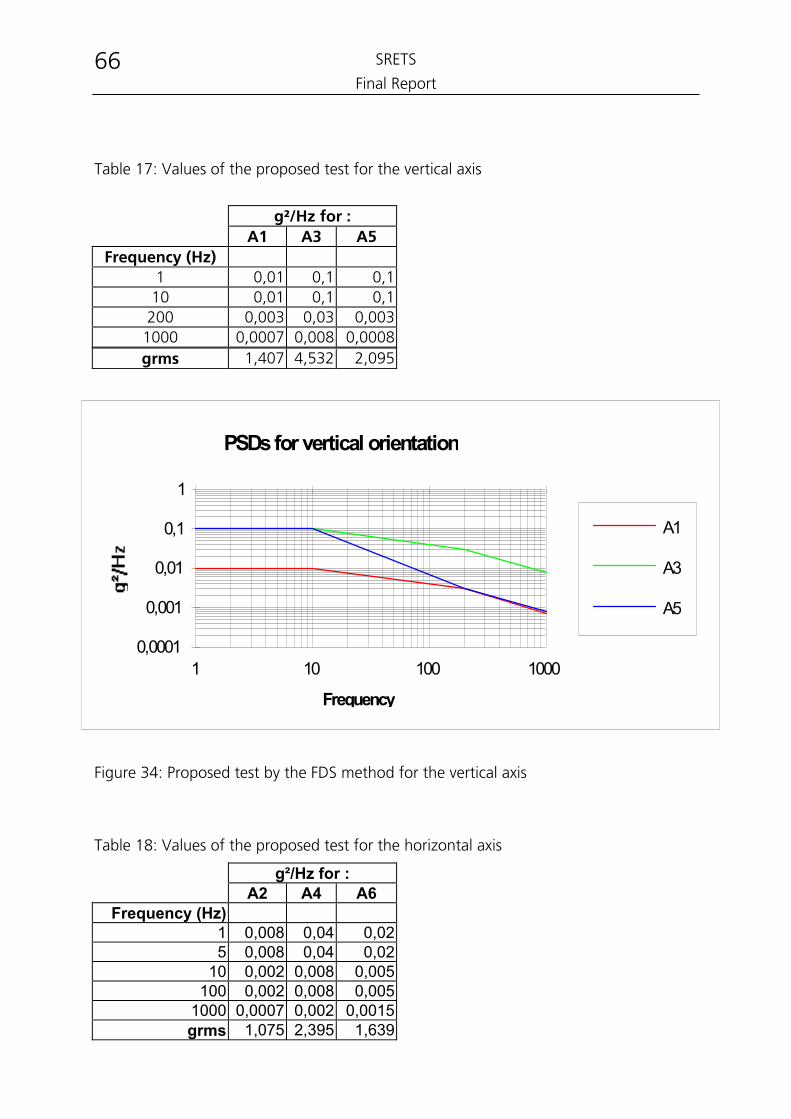
SRETS
Final Report 66
Table 17: Values of the proposed test for the vertical axis
g²/Hz for : A1 A3 A5
Frequency (Hz) 1 0,01 0,1 0,1
10 0,01 0,1 0,1200 0,003 0,03 0,003
1000 0,0007 0,008 0,0008grms 1,407 4,532 2,095
PSDs for vertical orientation
Frequency
0,0001
0,001
0,01
0,1
1
1 10 100 1000
A1
A3
A5
Figure 34: Proposed test by the FDS method for the vertical axis
Table 18: Values of the proposed test for the horizontal axis
g²/Hz for : A2 A4 A6
Frequency (Hz) 1 0,008 0,04 0,025 0,008 0,04 0,02
10 0,002 0,008 0,005100 0,002 0,008 0,005
1000 0,0007 0,002 0,0015grms 1,075 2,395 1,639
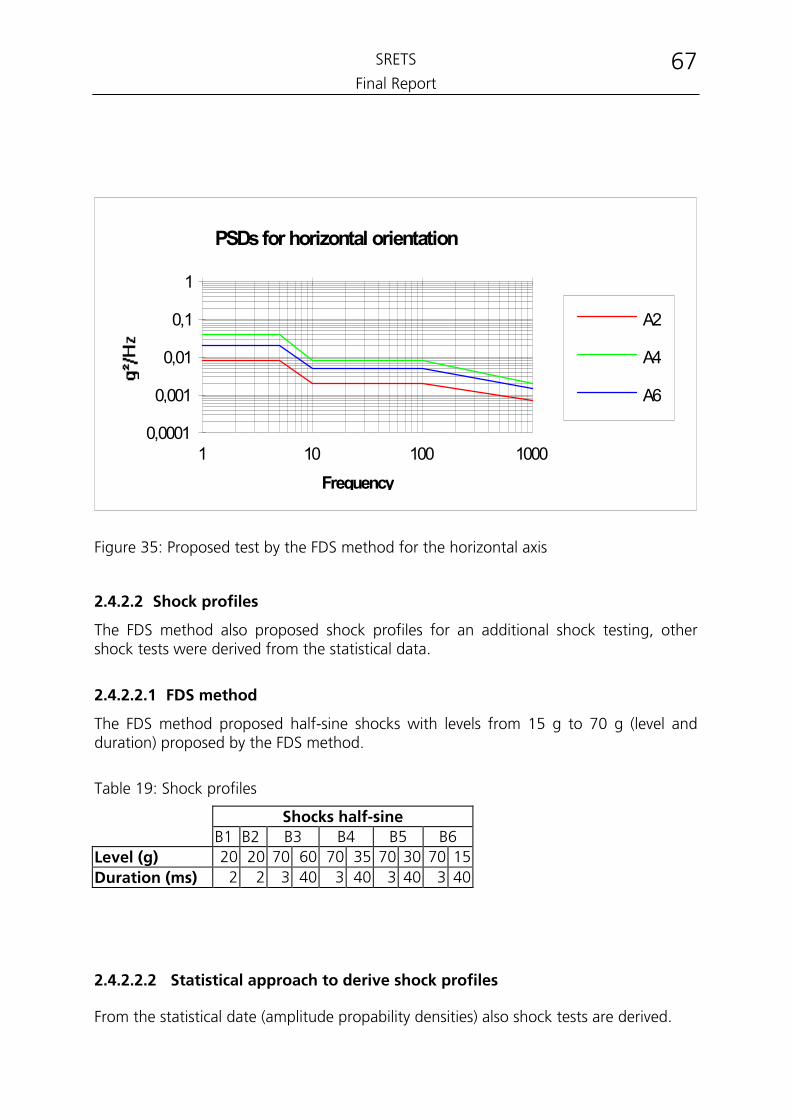
SRETS
Final Report 67
PSDs for horizontal orientation
Frequency
0,0001
0,001
0,01
0,1
1
1 10 100 1000
A2
A4
A6
Figure 35: Proposed test by the FDS method for the horizontal axis
2.4.2.2 Shock profiles
The FDS method also proposed shock profiles for an additional shock testing, other shock tests were derived from the statistical data.
2.4.2.2.1 FDS method
The FDS method proposed half-sine shocks with levels from 15 g to 70 g (level and duration) proposed by the FDS method.
Table 19: Shock profiles
Shocks half-sine B1 B2 B3 B4 B5 B6
Level (g) 20 20 70 60 70 35 70 30 70 15Duration (ms) 2 2 3 40 3 40 3 40 3 40
2.4.2.2.2 Statistical approach to derive shock profiles
From the statistical date (amplitude propability densities) also shock tests are derived.
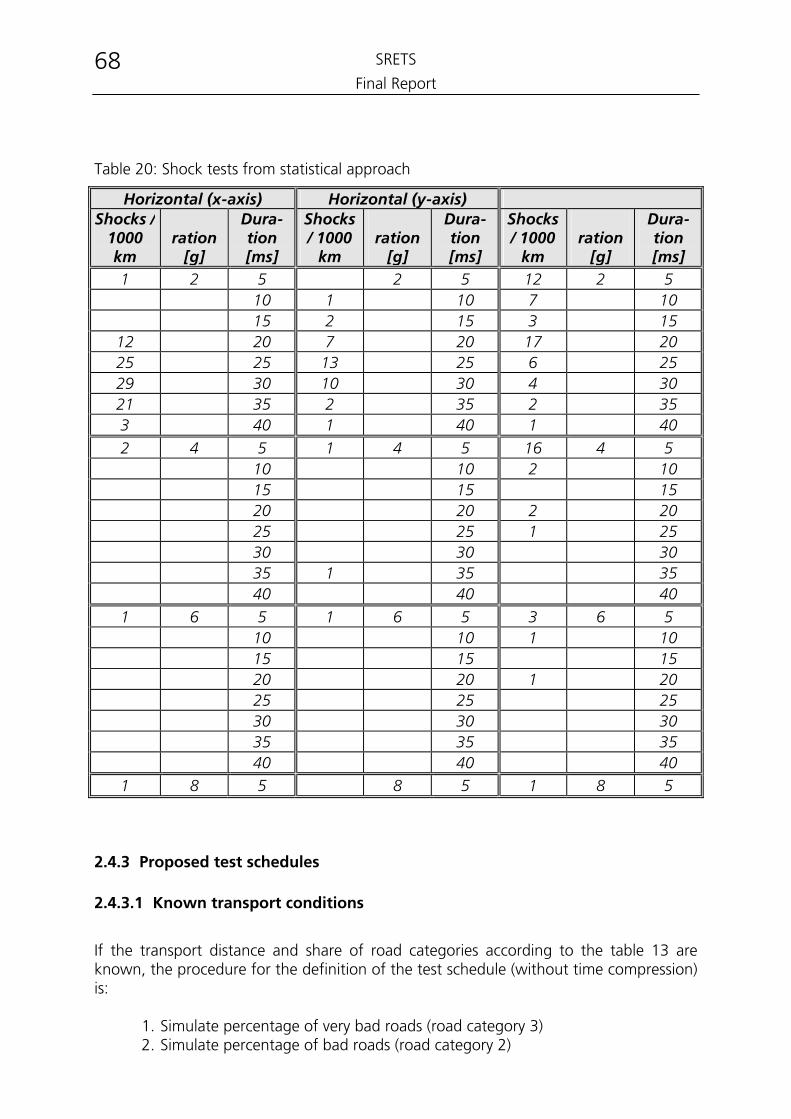
SRETS
Final Report 68
Table 20: Shock tests from statistical approach
Horizontal (x-axis) Vertical (z-axis) Accele-ration
[g]
Dura-tion [ms]
Accele-ration
[g]
Dura-tion [ms]
Accele-ration
[g]
Dura-tion [ms]
Horizontal (y-axis) Shocks /
1000 km
Shocks / 1000
km
Shocks / 1000
km 1 2 5 2 5 12 2 5 10 1 10 7 10 15 2 15 3 15
12 20 7 20 17 20 25 25 13 25 6 25 29 30 10 30 4 30 21 35 2 35 2 35 3 40 1 40 1 40 2 4 5 1 4 5 16 4 5 10 10 2 10 15 15 15 20 20 2 20 25 25 1 25 30 30 30 35 1 35 40 40 40
1 6 5 1 6 3 6 5 10 10 1 10 15 15 20 20 1 20 25
35
5
15
25 25
30 30 30 35 35 35 40 40
1 8 5 8 5 1 8 5 40
2.4.3 Proposed test schedules
2.4.3.1 Known transport conditions
If the transport distance and share of road categories according to the table 13 are known, the procedure for the definition of the test schedule (without time compression) is:
1. Simulate percentage of very bad roads (road category 3) 2. Simulate percentage of bad roads (road category 2)
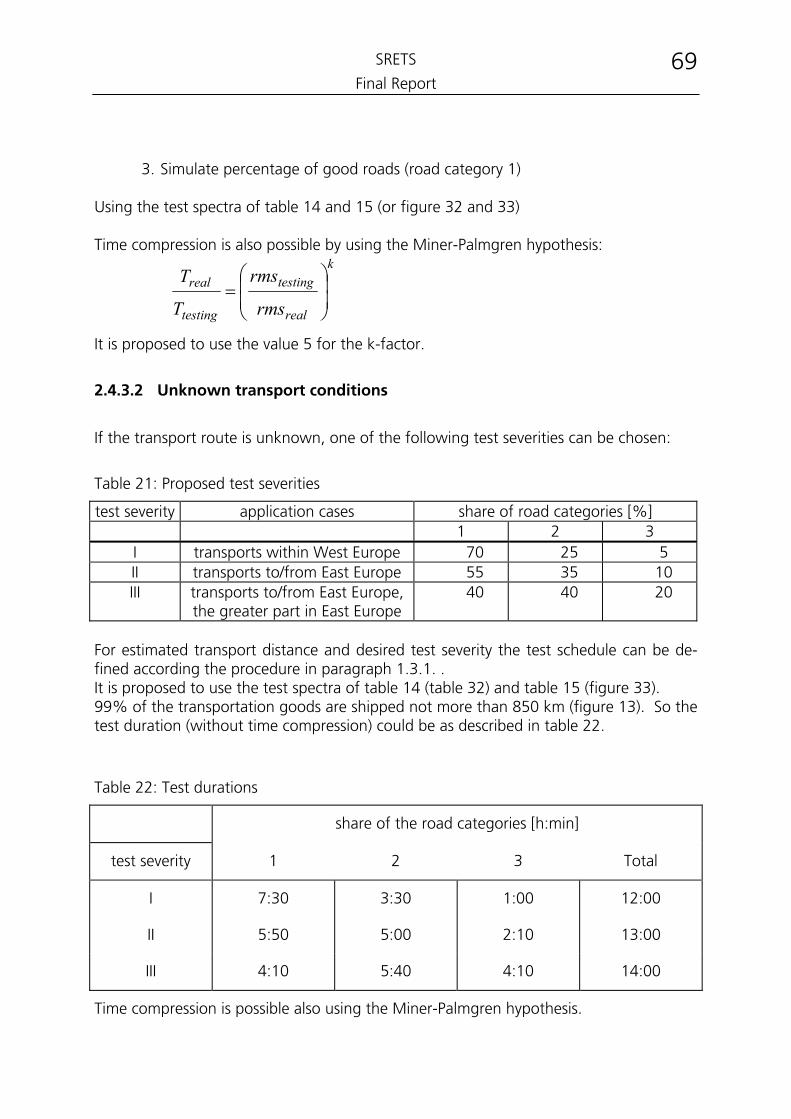
SRETS
Final Report 69
3. Simulate percentage of good roads (road category 1) Using the test spectra of table 14 and 15 (or figure 32 and 33) Time compression is also possible by using the Miner-Palmgren hypothesis:
k
real
testing
testing
real
rms
rms
T
T
=
It is proposed to use the value 5 for the k-factor.
2.4.3.2 Unknown transport conditions
If the transport route is unknown, one of the following test severities can be chosen:
Table 21: Proposed test severities
test severity application cases share of road categories [%] 1 2 3 I transports within West Europe 70 25 5 II transports to/from East Europe 55 35 10 III transports to/from East Europe,
the greater part in East Europe 40 40 20
For estimated transport distance and desired test severity the test schedule can be de-fined according the procedure in paragraph 1.3.1. . It is proposed to use the test spectra of table 14 (table 32) and table 15 (figure 33). 99% of the transportation goods are shipped not more than 850 km (figure 13). So the test duration (without time compression) could be as described in table 22.
Table 22: Test durations
share of the road categories [h:min]
test severity 1 2 3 Total
I 7:30 3:30 1:00 12:00
II 5:50 5:00 2:10 13:00
III 4:10 5:40 4:10 14:00
Time compression is possible also using the Miner-Palmgren hypothesis.
SRETS
Final Report 70
2.4.4 Conclusions and recommendations
RANDOM VIBRATION By vibration testing we have to distinct between the shape of the Test-PSD and its duration and level. That means: • different shapes obtained from the conventional PSD approach • different duration and level obtained from both Grms and APD methods • different shapes and levels obtained from the FDS method • different testing shock profiles obtained from 'statistical approach to derive shock
profiles' and FDS method. Furthermore a characterisation of the transport route is necessary to propose multi-level random vibration tests to replicate the damage mechanisms of the environment. To define random vibration test conditions two different ways can be recommended: 1. Characterisation of the road conditions by the distribution of the Grms-values.
shape test v1, test h1 levels according to the distribution of the Grms-values (e.g. 0,2g...
0,6g, in steps of 0,1g) duration according to the share of single levels on the real transport time
2. Characterisation of the road conditions by different road categories
shape test v1 -v3, test h1 -h3 levels 3 levels according to the 3 road categories duration according to the share of single levels on the real transport time
Still the distinction between known and unknown road transport conditions is necessary If the Grms-value is known, procedure 1 will reproduce the real transport stress well. The averaged or peak hold of the covert measurements can be taken, if it is to be expected that these offer a better description of the vehicles. For the FDS method, it is suggested to apply the test PSD's for a duration equal to the real transport duration. By unknown conditions, the procedure 2 should be taken for an estimated time. We suggest to apply the severity for duration ranging in-between 2 hours and 5 hours if the transport duration is not known. It appears that both Grms and the APD methods give comparable results. SHOCKS It is recommends to apply the suggested testing shock profile to truck transports on ordinary motorways. The testing shock profile has to be adjusted according the road condition. CONCLUSION The laboratory tests will allow optimisation and implementation of packaging and thus we recommend further research in this area.
SRETS
Final Report 71
2.5 Field and Lab Tests
2.5.1 Objective
This task used the derived test levels to verify the analysis ”groups” against practical testing limitations. Here limitations were imposed by practical testing constraints. Traditionally, packages had been evaluated in a relatively limited number of ways. These conditions mean many limitations that influence the test methods and how accurately they reproduce the potential damage mechanisms. The objective of this task was to identify how current test methods limit the application of the tests developed from the consideration of the various damage mechanisms. The ultimate demonstration of the validity of the test schedules is the comparison with reality. The objective of this task was to perform field trials in parallel with laboratory testing of items representing the major groups of packaged products and compare the damage incurred.
2.5.2 Effect of practical testing limitations
Three major different methods to derive test spectra out of the measured data are developed. Now it should be verified, whether the designed Test Schedules and calculated Test-PSDs are practical for the laboratory or not. RANDOM VIBRATION The most challenging part of the task was to use the developed Test-PSDs in the labora-tory. Real equipment here is typically limited by
• bandwidth The bandwidth of the measuring technique is (ever) broader than of the test facilities.
• reducing “knots” for practical testing The Power Spectral Density calculates several hundred values. From a practical viewpoint, those can not be taken directly into a CEN standard. From a techni-cal viewpoint, those data contain too specific information about the transport conditions, mainly the used truck.
• Typical European laboratory equipment combination of vibration and superposed shocks can not run such complex tests.
• vibration on a vibration table, shock test on a separate machine The analysis of the measured data give clear information about levels of vibra-tion and the probability for such levels. As vibration tables are slow machines, they can only be used when the desired probability is equivalent to some ten seconds. For shorter events, the vibration tables - run in vibration mode - are not useful. This effect defines the distinction between both modes.
• “fixing” of shipments / “bouncing” of parcels The statistic of the measurement shows that the most vibration levels are be-
SRETS
Final Report 72
low 0.18 g rms. And all events with higher acceleration should be run on a separate machine (shock tester or shaker in shock mode). This “moderate” level of vibration allows to leave the shipment unfixed, because bouncing does not happen.
The results of the APD-Method and the Grms-Method correspond in a good way. The proposed test spectra are not significant different. This was also improved by statistical analysis of both sets of test spectra. The error levels within each method is larger than the difference between both methods. The third method (FDS method) was not followed later because the test levels without time compression were much higher than the measured data. That is obviously a fault. The Test-PSDs have been run in four of those laboratories of R&D and of Industry, to see the shipments behaviour and the practical limitations. For this purpose, real products were - on one hand - stressed in real environment, and - on the other hand - were used as samples for laboratory tests. After the real transport and during the laboratory tests, the samples were compared. The laboratories used dif-ferent acceptability criteria:
• Measurements on the shaker Comparable to the measurements undertaken in the project acceleration values were taken directly from the shaker. The desired behaviour has to be checked. The analysis methods of the project were also used to verify the dynamic calibration.
• Measurements on the pallet of the shipment During some real transport, measurements were taken from the topside of the pallet to be compared with the behaviour in the laboratory.
• High-Speed-Video Additionally, a high-speed video was produced with 250 frames per seconds, shown at a project meeting, discussed in the Project Group, and also those results are considered here.
• Counting method Some of the partners have reliable information about a harmful damage of the packaging. The Test-PSDs of the Grms-Method replicated this behaviour.
• Inspection Industrial Partner often see their product in a broad range of application. Their experiences are reliable and inspection is a valid method.
SHOCK TESTING The measurements were analysed for shocks and replicated in the laboratory. The stress during the European transport were about 20% higher than for the national transports. All the shock tests can be performed in a usual equipped laboratory. Available shock test facilities are sufficient. TESTING SCHEDULES The testing schedules give clear advice how to run single tests, with their specific pa-rameters, their sequence and their duration. Each of those parameters can easily be de-
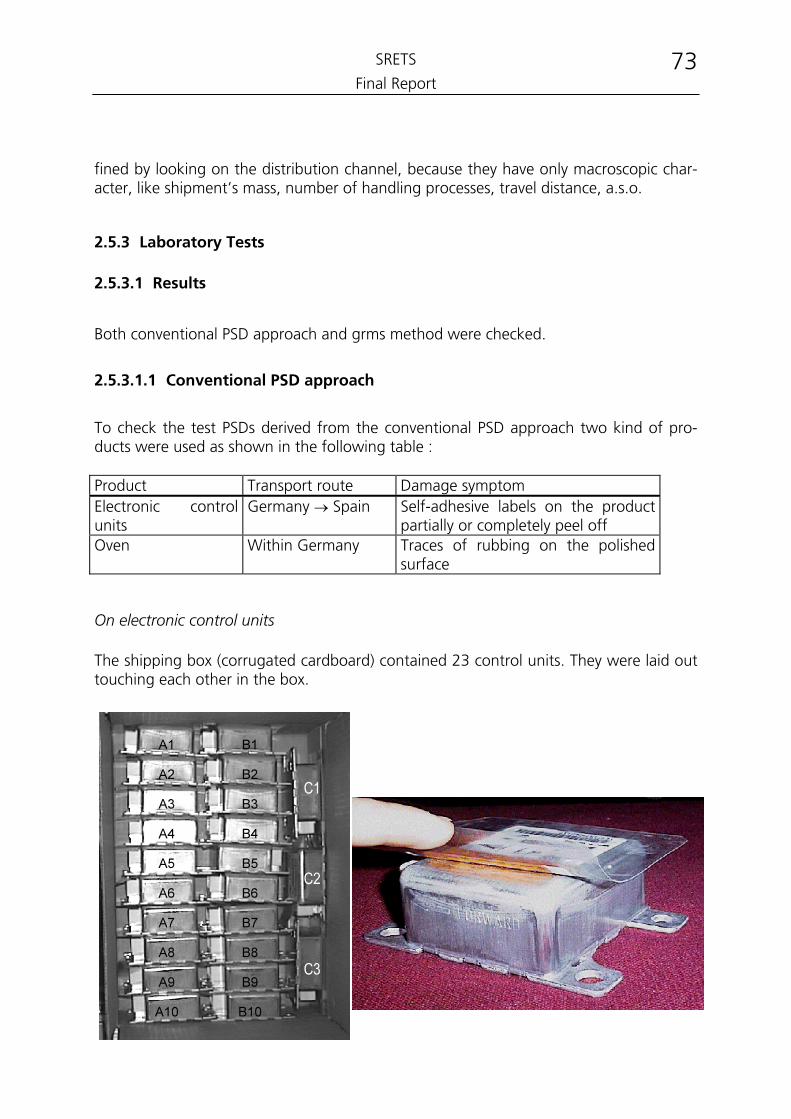
SRETS
Final Report 73
fined by looking on the distribution channel, because they have only macroscopic char-acter, like shipment’s mass, number of handling processes, travel distance, a.s.o.
2.5.3 Laboratory Tests
2.5.3.1 Results
Both conventional PSD approach and grms method were checked.
2.5.3.1.1 Conventional PSD approach
To check the test PSDs derived from the conventional PSD approach two kind of pro-ducts were used as shown in the following table : Product Transport route Damage symptom Electronic control units
Germany → Spain Self-adhesive labels on the product partially or completely peel off
Oven Within Germany Traces of rubbing on the polished surface
On electronic control units The shipping box (corrugated cardboard) contained 23 control units. They were laid out touching each other in the box.
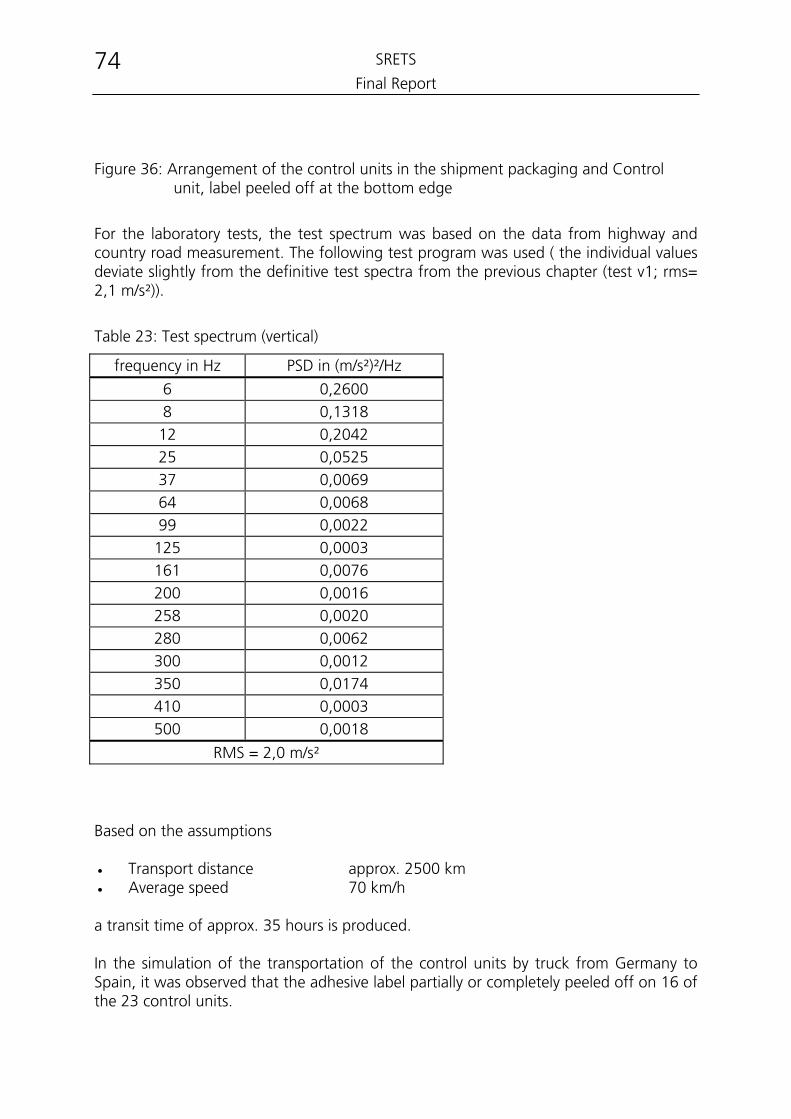
SRETS
Final Report 74
Figure 36: Arrangement of the control units in the shipment packaging and Control unit, label peeled off at the bottom edge
For the laboratory tests, the test spectrum was based on the data from highway and country road measurement. The following test program was used ( the individual values deviate slightly from the definitive test spectra from the previous chapter (test v1; rms= 2,1 m/s²)).
Table 23: Test spectrum (vertical)
frequency in Hz PSD in (m/s²)²/Hz
6 0,2600 8 0,1318 12 0,2042 25 0,0525 37 0,0069 64 0,0068 99 0,0022
125 0,0003 161 0,0076 200 0,0016 258 0,0020 280 0,0062 300 0,0012 350 0,0174 410 0,0003 500 0,0018
RMS = 2,0 m/s²
Based on the assumptions • Transport distance approx. 2500 km • Average speed 70 km/h a transit time of approx. 35 hours is produced. In the simulation of the transportation of the control units by truck from Germany to Spain, it was observed that the adhesive label partially or completely peeled off on 16 of the 23 control units.
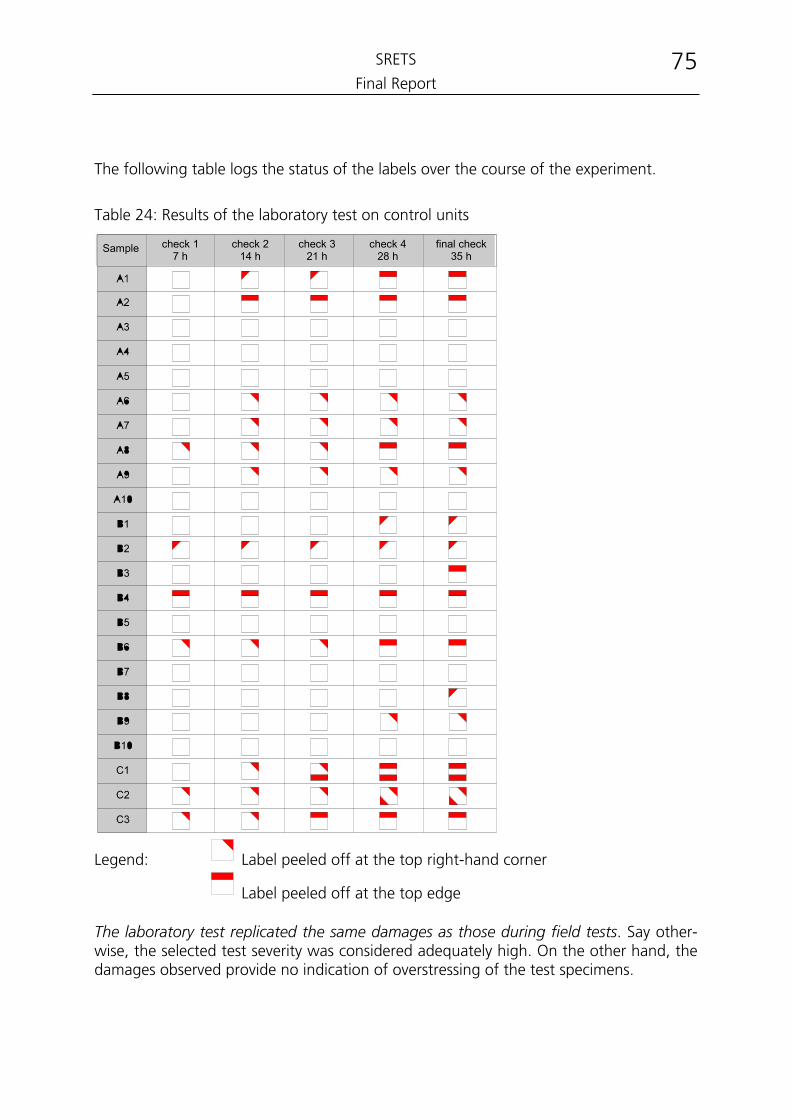
SRETS
Final Report 75
The following table logs the status of the labels over the course of the experiment.
Table 24: Results of the laboratory test on control units
Sample check 17 h
check 214 h
check 321 h
check 428 h
final check35 h
Legend: Label peeled off at the top right-hand corner
Label peeled off at the top edge The laboratory test replicated the same damages as those during field tests. Say other-wise, the selected test severity was considered adequately high. On the other hand, the damages observed provide no indication of overstressing of the test specimens.
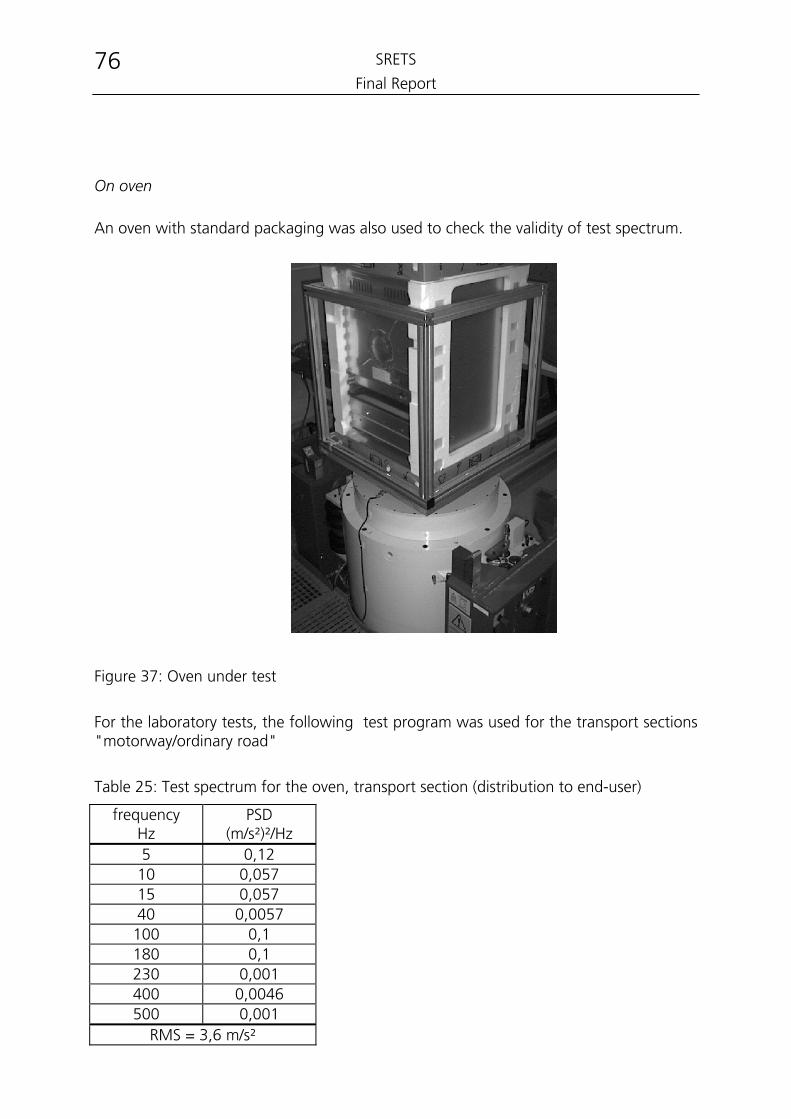
SRETS
Final Report 76
On oven
An oven with standard packaging was also used to check the validity of test spectrum.
Figure 37: Oven under test
For the laboratory tests, the following test program was used for the transport sections "motorway/ordinary road"
Table 25: Test spectrum for the oven, transport section (distribution to end-user)
frequency Hz
PSD (m/s²)²/Hz
5 0,12 10 0,057 15 0,057 40 0,0057 100 0,1 180 0,1 230 0,001 400 0,0046 500 0,001
RMS = 3,6 m/s²
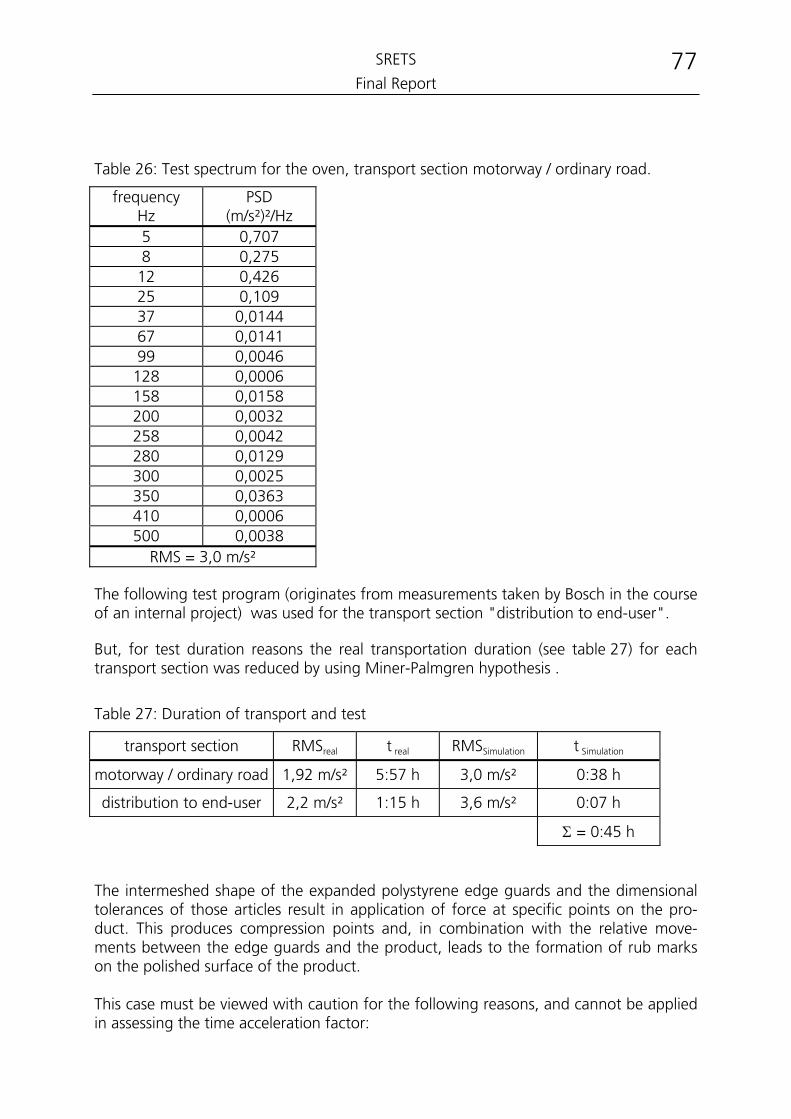
SRETS
Final Report 77
Table 26: Test spectrum for the oven, transport section motorway / ordinary road.
frequency Hz
PSD (m/s²)²/Hz
5 0,707 8 0,275
12 0,426 25 0,109 37 0,0144 67 0,0141 99 0,0046 128 0,0006 158 0,0158 200 0,0032 258 0,0042 280 0,0129 300 0,0025 350 0,0363 410 0,0006 500 0,0038
RMS = 3,0 m/s² The following test program (originates from measurements taken by Bosch in the course of an internal project) was used for the transport section "distribution to end-user". But, for test duration reasons the real transportation duration (see table 27) for each transport section was reduced by using Miner-Palmgren hypothesis .
Table 27: Duration of transport and test
transport section RMSreal t real RMSSimulation t Simulation
motorway / ordinary road 1,92 m/s² 5:57 h 3,0 m/s² 0:38 h
distribution to end-user 2,2 m/s² 1:15 h 3,6 m/s² 0:07 h
Σ = 0:45 h
The intermeshed shape of the expanded polystyrene edge guards and the dimensional tolerances of those articles result in application of force at specific points on the pro-duct. This produces compression points and, in combination with the relative move-ments between the edge guards and the product, leads to the formation of rub marks on the polished surface of the product. This case must be viewed with caution for the following reasons, and cannot be applied in assessing the time acceleration factor:
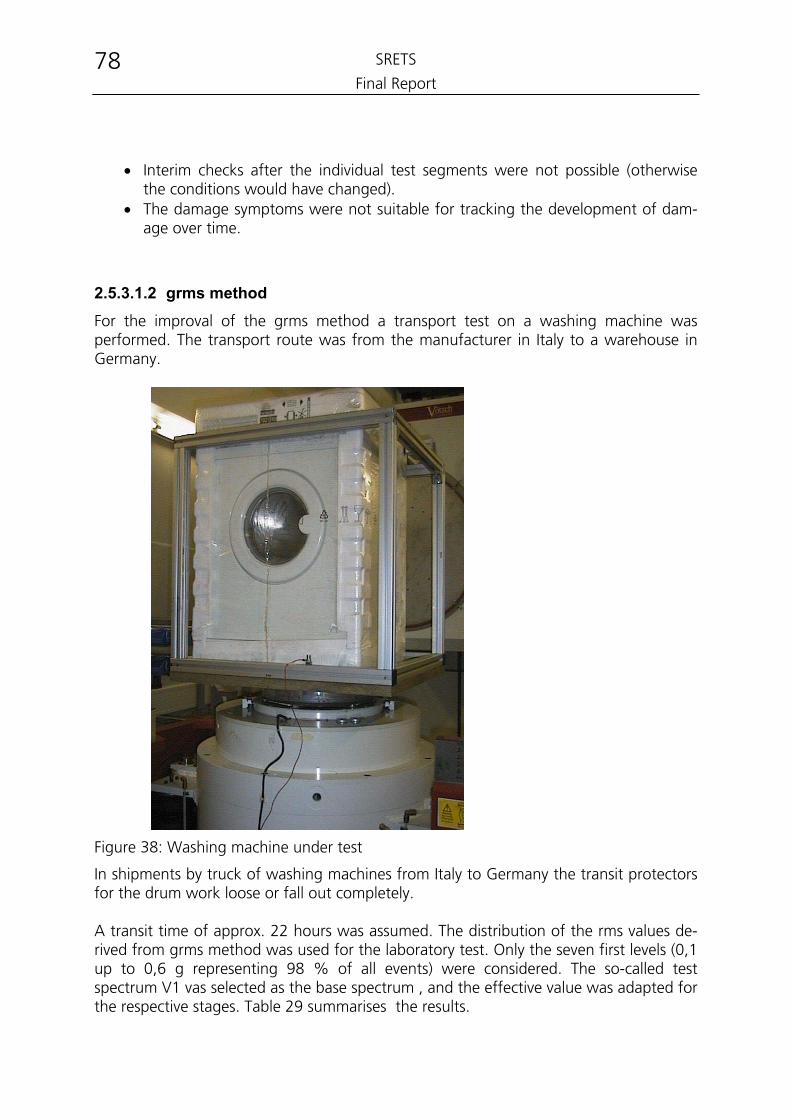
SRETS
Final Report 78
• Interim checks after the individual test segments were not possible (otherwise the conditions would have changed).
• The damage symptoms were not suitable for tracking the development of dam-age over time.
2.5.3.1.2 grms method For the improval of the grms method a transport test on a washing machine was performed. The transport route was from the manufacturer in Italy to a warehouse in Germany.
Figure 38: Washing machine under test
In shipments by truck of washing machines from Italy to Germany the transit protectors for the drum work loose or fall out completely. A transit time of approx. 22 hours was assumed. The distribution of the rms values de-rived from grms method was used for the laboratory test. Only the seven first levels (0,1 up to 0,6 g representing 98 % of all events) were considered. The so-called test spectrum V1 vas selected as the base spectrum , and the effective value was adapted for the respective stages. Table 29 summarises the results.
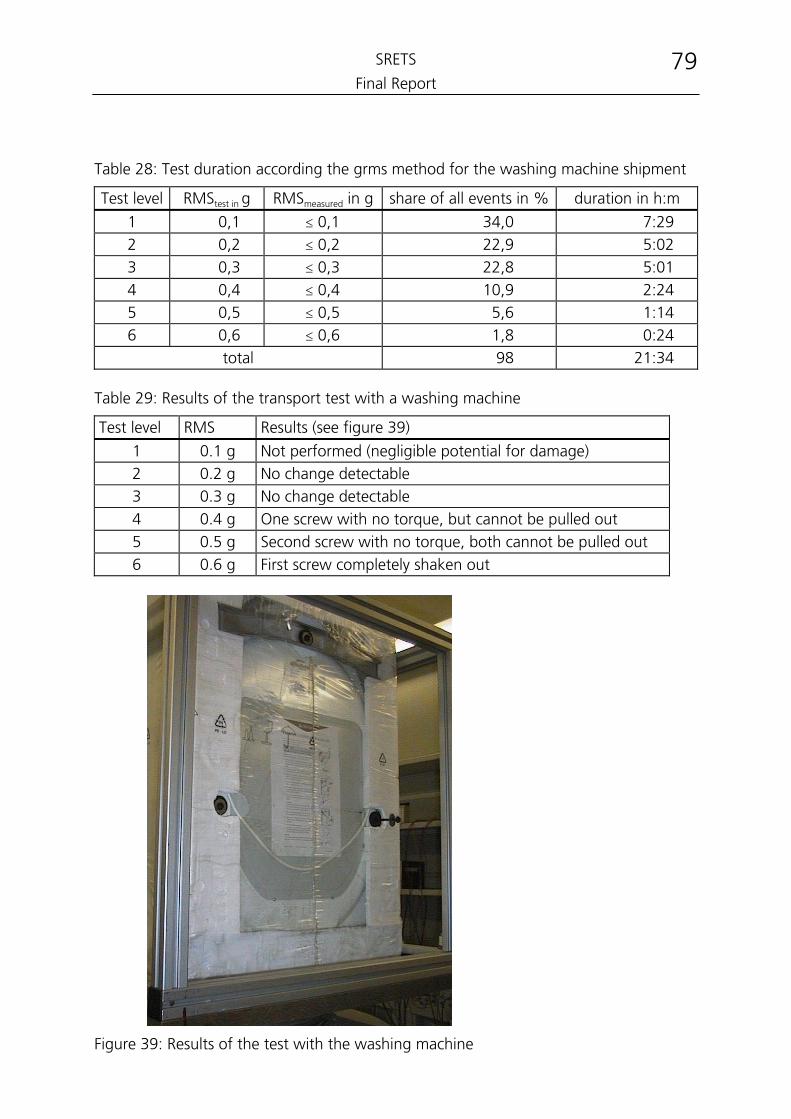
SRETS
Final Report 79
Table 28: Test duration according the grms method for the washing machine shipment
Test level RMStest in g RMSmeasured in g share of all events in % duration in h:m
1 0,1 ≤ 0,1 34,0 7:29 2 0,2 ≤ 0,2 22,9 5:02 3 0,3 ≤ 0,3 22,8 5:01 4 0,4 ≤ 0,4 10,9 2:24 5 0,5 ≤ 0,5 5,6 1:14 6 0,6 ≤ 0,6 1,8 0:24
total 98 21:34 Table 29: Results of the transport test with a washing machine
Test level RMS Results (see figure 39)
1 0.1 g Not performed (negligible potential for damage) 2 0.2 g No change detectable 3 0.3 g No change detectable 4 0.4 g One screw with no torque, but cannot be pulled out 5 0.5 g Second screw with no torque, both cannot be pulled out 6 0.6 g First screw completely shaken out
Figure 39: Results of the test with the washing machine
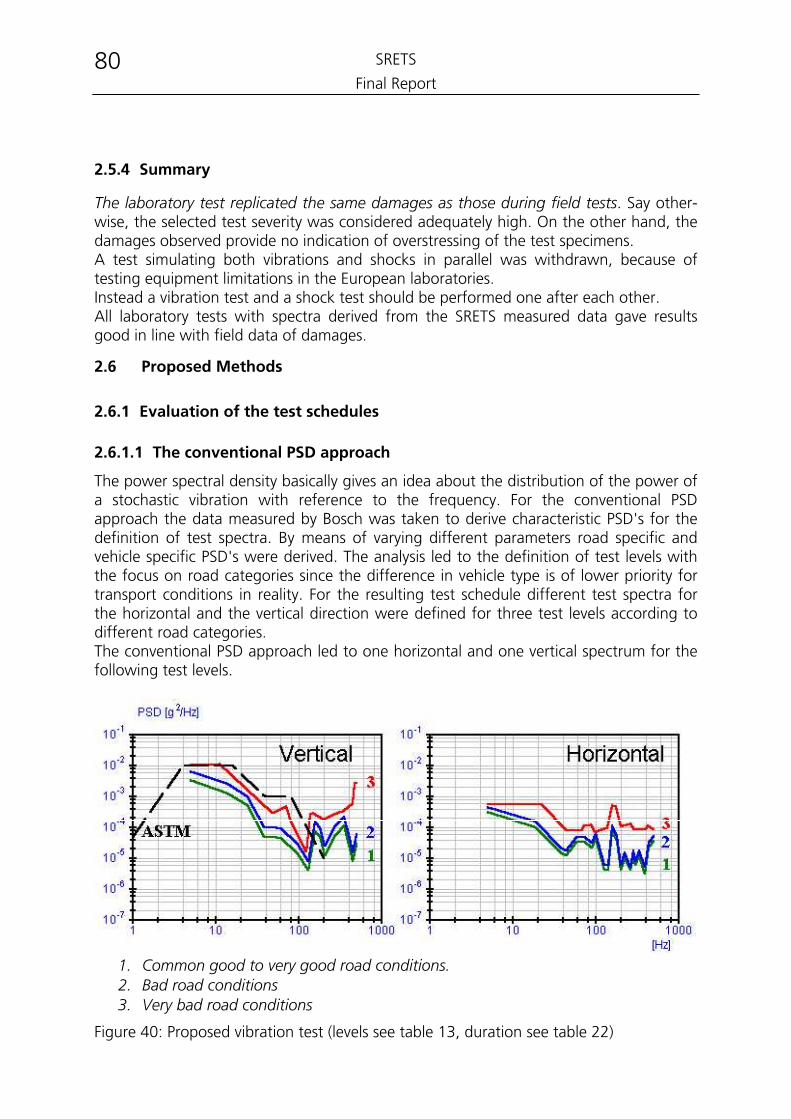
SRETS
Final Report 80
2.5.4 Summary
The laboratory test replicated the same damages as those during field tests. Say other-wise, the selected test severity was considered adequately high. On the other hand, the damages observed provide no indication of overstressing of the test specimens. A test simulating both vibrations and shocks in parallel was withdrawn, because of testing equipment limitations in the European laboratories. Instead a vibration test and a shock test should be performed one after each other. All laboratory tests with spectra derived from the SRETS measured data gave results good in line with field data of damages.
2.6 Proposed Methods
2.6.1 Evaluation of the test schedules
2.6.1.1 The conventional PSD approach
The power spectral density basically gives an idea about the distribution of the power of a stochastic vibration with reference to the frequency. For the conventional PSD approach the data measured by Bosch was taken to derive characteristic PSD's for the definition of test spectra. By means of varying different parameters road specific and vehicle specific PSD's were derived. The analysis led to the definition of test levels with the focus on road categories since the difference in vehicle type is of lower priority for transport conditions in reality. For the resulting test schedule different test spectra for the horizontal and the vertical direction were defined for three test levels according to different road categories. The conventional PSD approach led to one horizontal and one vertical spectrum for the following test levels.
1. Common good to very good road conditions. 2. Bad road conditions 3. Very bad road conditions
Figure 40: Proposed vibration test (levels see table 13, duration see table 22)
SRETS
Final Report 81
Compared to the ASTM D-4728 standard for commercial transport with trucks, all the vertical spectra are lower, even the spectrum for very bad road conditions. Probably be-cause the ASTM spectra include handling as well. Regarding the shapes of the spectra there are close points of similarity between them. But one obvious difference is the fre-quency range, the ASTM spectrum is more suitable for hydraulic shakers because the upper frequency is only 200 Hz.
2.6.1.2 The GRMS method
The GRMS method defined test levels by focusing on the computed power of the covertly measured PSD's only. Since the power of the PSD is directly related to the transport condition the distribution of the RMS values of all PSD's was build in order to gain a representative idea about the severity of the transport conditions that were en-countered during the data recording. A reduction of the data was achieved by cate-gorising the RMS values in a 20 discrete classes. The distribution of these values was taken as a basis for defining three test levels for each axis. The reduction of testing time was calculated using the Miner-Palmgren hypothesis while the shape of the test-PSD can be deducted from the openly recorded data taking the road conditions and vehicle types into consideration.
While trying to replicate real transportation damages on a vibration table, this spectrum lies below the ASTM standard. On the other hand only the 0.18 grms level was used, though the duration for the 0.8 grms level was too short. At severe levels of 0.8 grms resonances and the bouncing effect cause accelerations up to 20 g, which is not a correct replication of a real transportation environment. This is why the levels of 0.8 grms (in the vertical axis) have to be considered separately and probably tested as shocks.
The comparison between real transportation, ASTM spectrum and SRETS spectrum shows that the SRETS spectrum replicates the reality better than ASTM. But still it seems to be too kind to the packaging, at least without the “shocks” of the 0.8 and 2.0 grms level.
2.6.1.3 The APD method The APD method calculated the test levels and durations from the time triggered, covertly acquired data recordings. By means of applying a Gaussian distribution of ac-celeration in time the distribution of the APD's of the data was approximated by theo-retical curves that for testing purposes will have to be weighed with the relevant Crest factors. This procedure resulted in three proposals for the calculation of the testing time with distinct GRMS testing levels for each axis. As in the GRMS method the shape of the test spectra can be deducted from the openly acquired Bosch data. The output from the APD method is like the result from the grms method no spectra, just test levels and the duration for each level. The proposal to include the very low level of 0.008 grms in the 0.18 grms level, using time compression, is understandable, though such low levels have very little influence on the cargo. Another reason is that the
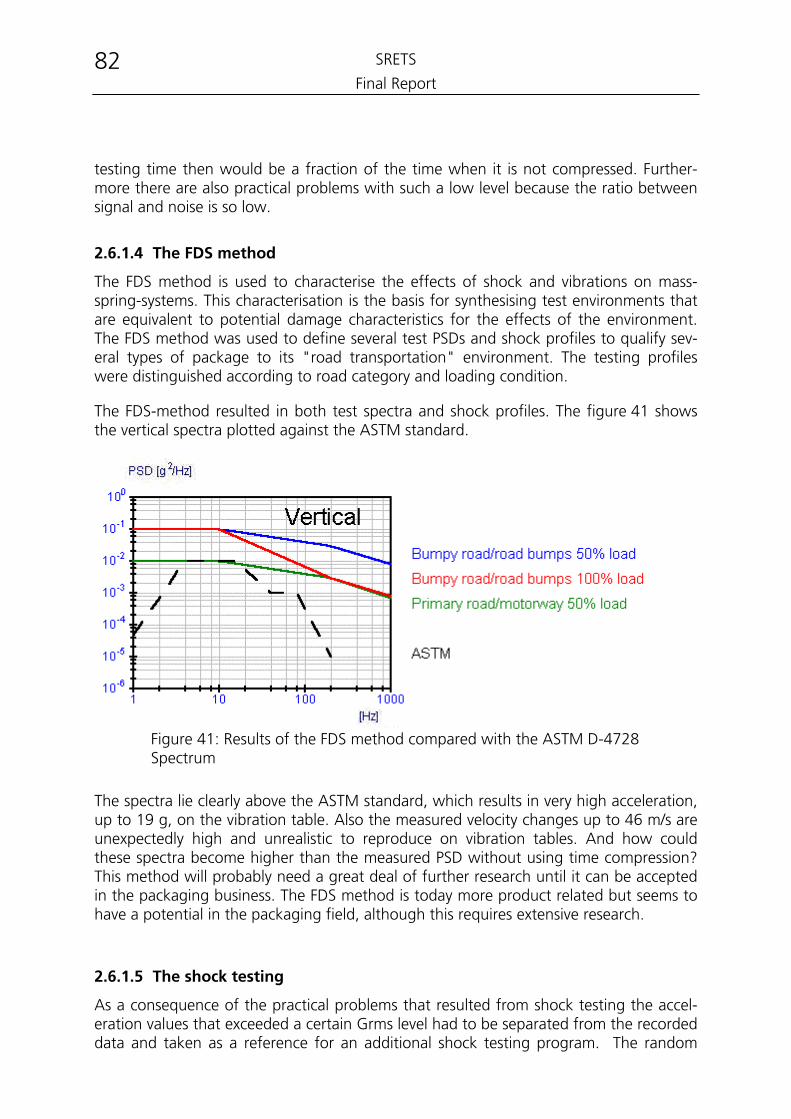
SRETS
Final Report 82
testing time then would be a fraction of the time when it is not compressed. Further-more there are also practical problems with such a low level because the ratio between signal and noise is so low.
2.6.1.4 The FDS method
The FDS method is used to characterise the effects of shock and vibrations on mass-spring-systems. This characterisation is the basis for synthesising test environments that are equivalent to potential damage characteristics for the effects of the environment. The FDS method was used to define several test PSDs and shock profiles to qualify sev-eral types of package to its "road transportation" environment. The testing profiles were distinguished according to road category and loading condition.
The FDS-method resulted in both test spectra and shock profiles. The figure 41 shows the vertical spectra plotted against the ASTM standard.
Figure 41: Results of the FDS method compared with the ASTM D-4728 Spectrum
The spectra lie clearly above the ASTM standard, which results in very high acceleration, up to 19 g, on the vibration table. Also the measured velocity changes up to 46 m/s are unexpectedly high and unrealistic to reproduce on vibration tables. And how could these spectra become higher than the measured PSD without using time compression? This method will probably need a great deal of further research until it can be accepted in the packaging business. The FDS method is today more product related but seems to have a potential in the packaging field, although this requires extensive research.
2.6.1.5 The shock testing
As a consequence of the practical problems that resulted from shock testing the accel-eration values that exceeded a certain Grms level had to be separated from the recorded data and taken as a reference for an additional shock testing program. The random
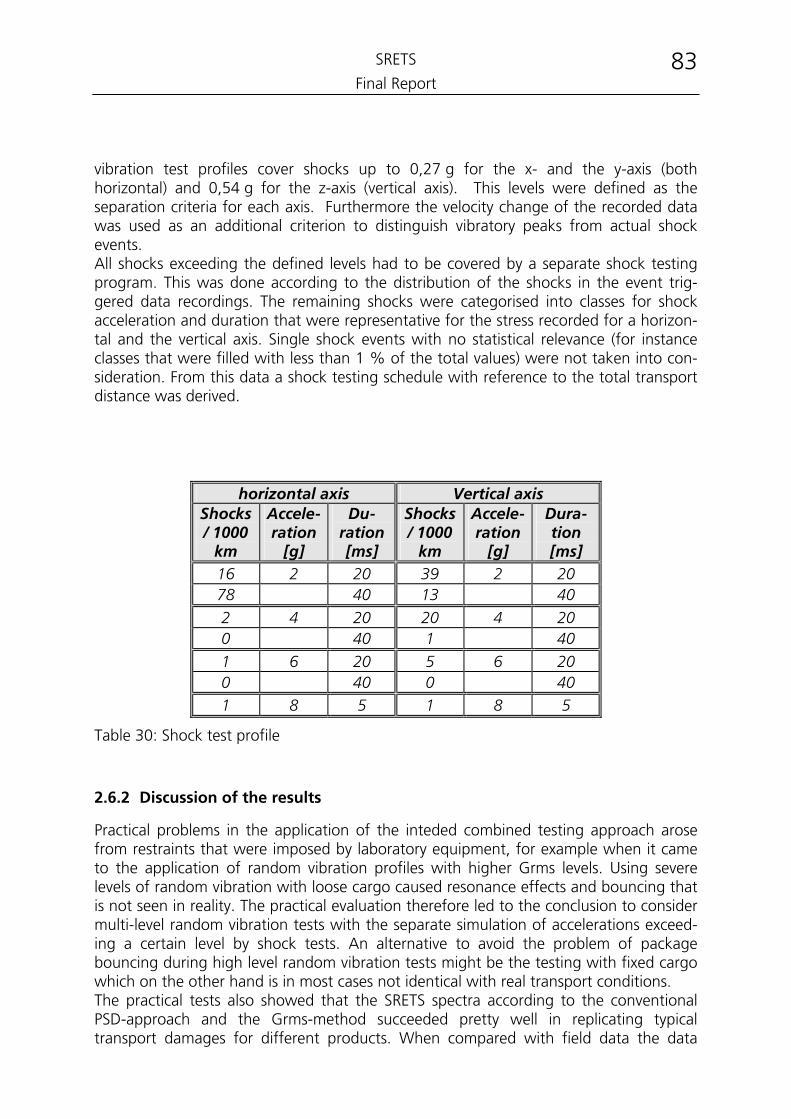
SRETS
Final Report 83
vibration test profiles cover shocks up to 0,27 g for the x- and the y-axis (both horizontal) and 0,54 g for the z-axis (vertical axis). This levels were defined as the separation criteria for each axis. Furthermore the velocity change of the recorded data was used as an additional criterion to distinguish vibratory peaks from actual shock events. All shocks exceeding the defined levels had to be covered by a separate shock testing program. This was done according to the distribution of the shocks in the event trig-gered data recordings. The remaining shocks were categorised into classes for shock acceleration and duration that were representative for the stress recorded for a horizon-tal and the vertical axis. Single shock events with no statistical relevance (for instance classes that were filled with less than 1 % of the total values) were not taken into con-sideration. From this data a shock testing schedule with reference to the total transport distance was derived.
horizontal axis Vertical axis Shocks / 1000
km
Accele-ration
[g]
Du-ration [ms]
Shocks / 1000
km
Accele-ration
[g]
Dura-tion [ms]
16 2 20 39 2 20 78 40 13 40 2 4 20 20 4 20 0 40 1 40 1 6 20 5 6 20 0 40 0 40 1 8 5 1 8 5
Table 30: Shock test profile
2.6.2 Discussion of the results
Practical problems in the application of the inteded combined testing approach arose from restraints that were imposed by laboratory equipment, for example when it came to the application of random vibration profiles with higher Grms levels. Using severe levels of random vibration with loose cargo caused resonance effects and bouncing that is not seen in reality. The practical evaluation therefore led to the conclusion to consider multi-level random vibration tests with the separate simulation of accelerations exceed-ing a certain level by shock tests. An alternative to avoid the problem of package bouncing during high level random vibration tests might be the testing with fixed cargo which on the other hand is in most cases not identical with real transport conditions. The practical tests also showed that the SRETS spectra according to the conventional PSD-approach and the Grms-method succeeded pretty well in replicating typical transport damages for different products. When compared with field data the data
SRETS
Final Report 84
obtained from practical testing still more severe than the real data with the FDS-method being the farthest off reality and at present not suitable as a basis for transport simulation. In total the practical vibration tests showed better results with regard to the repro-duction of real transport damages than the practical shock test. This means that the supplementary shock testing profile needs further validation as well as the vibration pro-files. The statistical relevance is a problem that can be applied to the number of practical evaluations and be used also the participants filling in the questionnaire. Another problem regarding the validity of the testing profiles may result from the data it was based on. The vast majority of the data only give an idea about the conditions of English and German motorways and ordinary roads but might not be representative for the quality of roads in a lot of other European countries. Also with regard to the influence of the transport load a broader database would increase the validity of the derived testing programs.
2.6.3 Conclusions and recommendations
Based on the good results in the field and laboratory tests the SRETS testing schedule according to the conventional PSD approach is considered to be most suitable for road transport testing and is suggested for practical use in laboratories. The method for proceeding should be in accordance with the ISO proposal (ISO/DIS 13355). Nevertheless further data recordings should be considered for the refinement of the derived testing approach. A broader knowledgebase with practical experiences would be available as more and more laboratories actually apply the new transport testing which would give more valuable hints for practical evaluation and optimisation. It is ob-vious that also the additional or supplementary shock testing needs to be put on a broader basis of different data input and practical evaluation. In this context further re-search might focus on the question if the packages should be generally fixed on the vibration table. This would allow to operate with a higher vibration level and enable the random vibration simulation to cover shocks of a higher g-level. In general it can be stated that since the behaviour of the packages is dependent on the characteristics of the package and on the vibration equipment also from this point of view additional re-search work is recommended. It should also be kept in mind that a qualified workshop on the subject of transport simulation remains a good project to extend the knowledgebase by getting the input of a lot of experts at once and at the same time promoting the practical use of the SRETS testing schedule.
SRETS
Final Report 85
3 Databases
3.1 Measured Data
The data base on measured data contains raw data from both covert (real transport) and overt (simulated transport) measurements in ASCII format, so that it is easily read and used by other project partners. For the covert measurements a set of files was generated, each uniquely identified by a journey designation and a run numbering (journeys see table 2). Each journey set comprised six files in ASCII format. The first three files contain raw, unfiltered acceleration data recorded in the x, y and z axis. Each file was recorded with a time window of 2048 values. The fourth file contains the average PSD´s of the whole journey in all three directions. However, zero (stationary) or transient events were removed prior to this PSD averaging. Information detailing which events were removed are contained in the fifth file and the sixth file contains the exported event data, summary data on each individual event such as peak acceleration, minimum and maximum acceleration, time, date, root mean square value, crest factor and other supporting information. For the overt measurements a set of ASCII files was equally generated. For this kind of measurement more supporting information is available. Variations were made within the kind of vehicle, track, velocity, load, and location of the accelerometer on the load platform (see table 3). Therefore this data was stored in an other file pattern than the covered data. The file hierarchy is Vehicle type road category measuring point The file names contain the velocity (30, 50, 60 or 70), the measuring axis (x, y, or z), the load factor (030, 040, 050, 080 or 100) and the current number of the measurement (two digits). Each file contains up to 164 time windows with 2048 values.
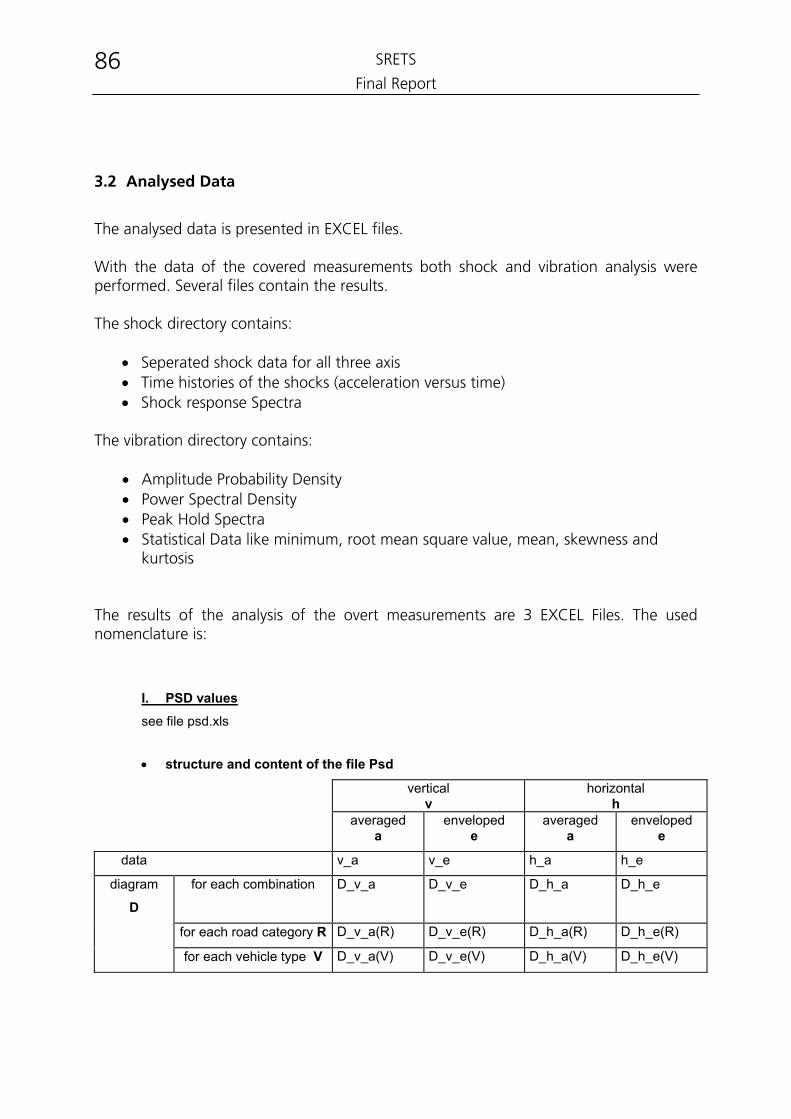
SRETS
Final Report 86
3.2 Analysed Data
The analysed data is presented in EXCEL files. With the data of the covered measurements both shock and vibration analysis were performed. Several files contain the results. The shock directory contains:
• Seperated shock data for all three axis • Time histories of the shocks (acceleration versus time) • Shock response Spectra
The vibration directory contains:
• Amplitude Probability Density • Power Spectral Density • Peak Hold Spectra • Statistical Data like minimum, root mean square value, mean, skewness and
kurtosis The results of the analysis of the overt measurements are 3 EXCEL Files. The used nomenclature is:
I. PSD values
see file psd.xls
• structure and content of the file Psd
vertical v
horizontal h
averaged a
enveloped e
averaged a
enveloped e
data v_a v_e h_a h_e
diagram
D for each combination D_v_a D_v_e D_h_a D_h_e
for each road category R D_v_a(R) D_v_e(R) D_h_a(R) D_h_e(R)
for each vehicle type V D_v_a(V) D_v_e(V) D_h_a(V) D_h_e(V)
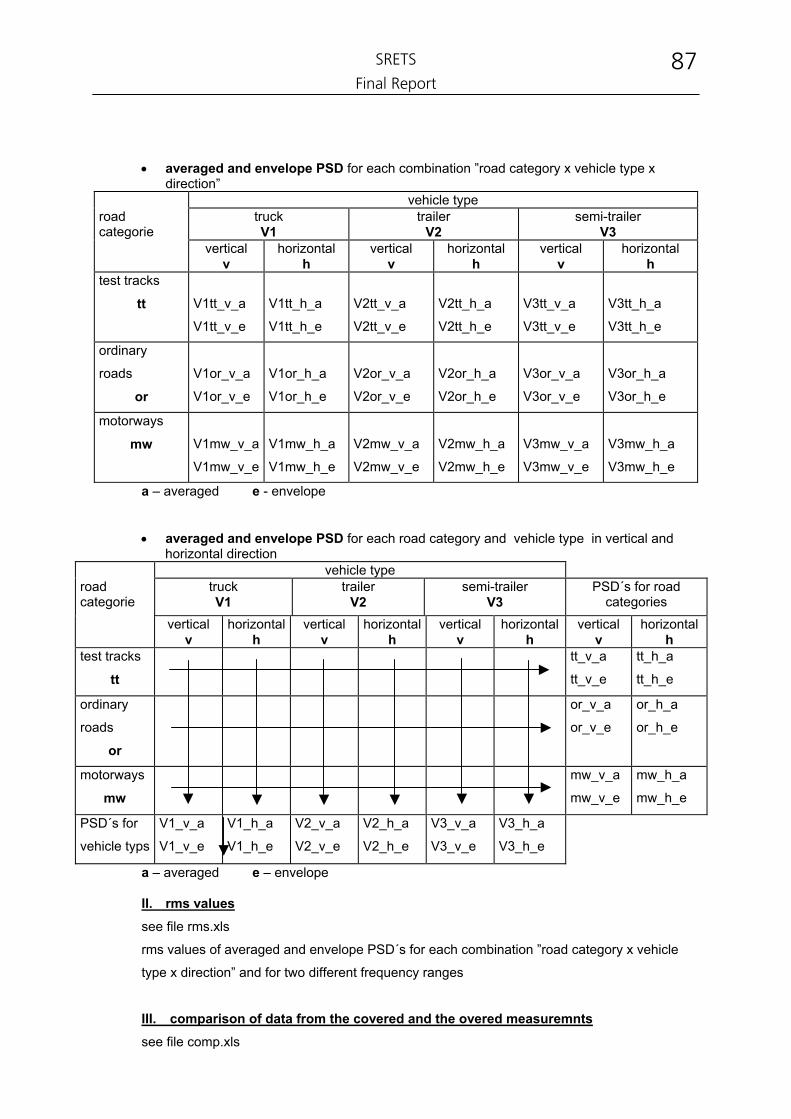
SRETS
Final Report 87
• averaged and envelope PSD for each combination ”road category x vehicle type x direction”
vehicle type road categorie
truck V1
trailer V2
semi-trailer V3
vertical v
horizontal h
vertical v
horizontal h
vertical v
horizontal h
test tracks
tt
V1tt_v_a
V1tt_v_e
V1tt_h_a
V1tt_h_e
V2tt_v_a
V2tt_v_e
V2tt_h_a
V2tt_h_e
V3tt_v_a
V3tt_v_e
V3tt_h_a
V3tt_h_e
ordinary
roads
or
V1or_v_a
V1or_v_e
V1or_h_a
V1or_h_e
V2or_v_a
V2or_v_e
V2or_h_a
V2or_h_e
V3or_v_a
V3or_v_e
V3or_h_a
V3or_h_e
motorways
mw
V1mw_v_a
V1mw_v_e
V1mw_h_a
V1mw_h_e
V2mw_v_a
V2mw_v_e
V2mw_h_a
V2mw_h_e
V3mw_v_a
V3mw_v_e
V3mw_h_a
V3mw_h_e
a – averaged e - envelope
• averaged and envelope PSD for each road category and vehicle type in vertical and horizontal direction
vehicle type road categorie
truck V1
trailer V2
semi-trailer V3
PSD´s for road categories
vertical v
horizontal h
vertical v
horizontalh
vertical v
horizontalh
vertical v
horizontal h
test tracks
tt tt_v_a
tt_v_e
tt_h_a
tt_h_e
ordinary
roads
or
or_v_a
or_v_e
or_h_a
or_h_e
motorways
mw mw_v_a
mw_v_e
mw_h_a
mw_h_e
PSD´s for
vehicle typs
V1_v_a
V1_v_e
V1_h_a
V1_h_e
V2_v_a
V2_v_e
V2_h_a
V2_h_e
V3_v_a
V3_v_e
V3_h_a
V3_h_e
a – averaged e – envelope II. rms values
see file rms.xls
rms values of averaged and envelope PSD´s for each combination ”road category x vehicle
type x direction” and for two different frequency ranges
III. comparison of data from the covered and the overed measuremnts see file comp.xls
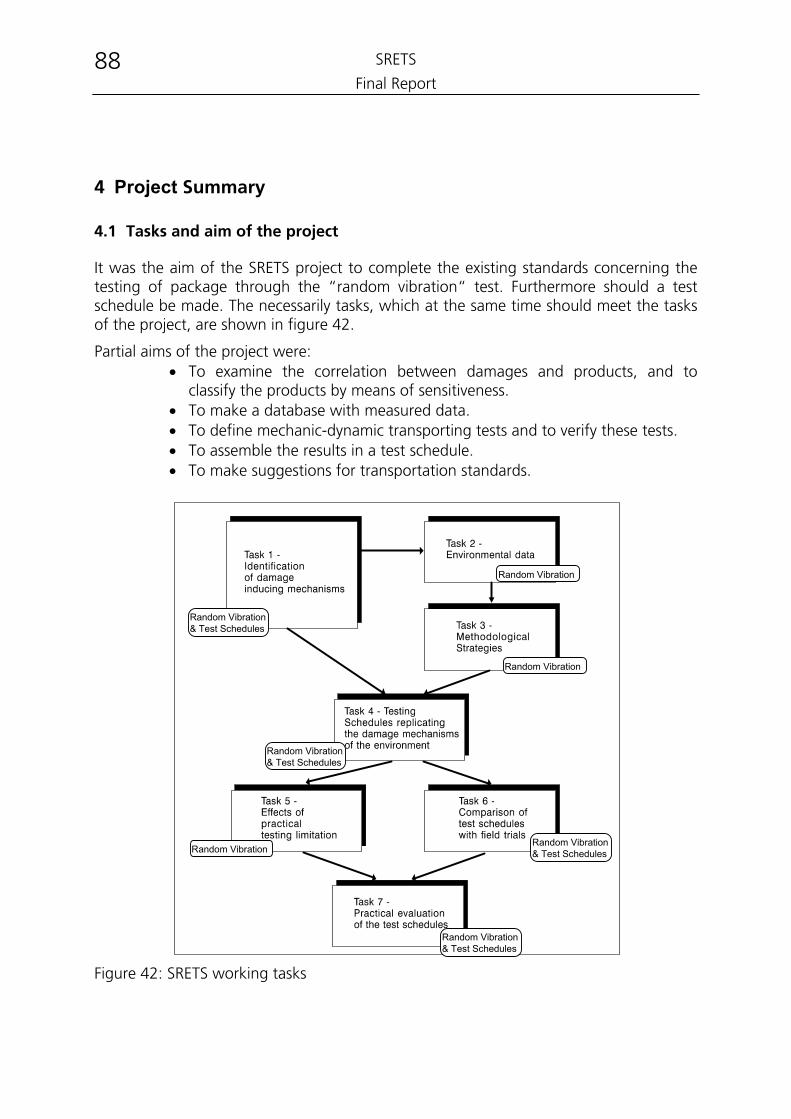
SRETS
Final Report 88
4 Project Summary
4.1 Tasks and aim of the project
It was the aim of the SRETS project to complete the existing standards concerning the testing of package through the “random vibration“ test. Furthermore should a test schedule be made. The necessarily tasks, which at the same time should meet the tasks of the project, are shown in figure 42.
Partial aims of the project were: • To examine the correlation between damages and products, and to
classify the products by means of sensitiveness. • To make a database with measured data. • To define mechanic-dynamic transporting tests and to verify these tests. • To assemble the results in a test schedule. • To make suggestions for transportation standards.
Random Vibration& Test Schedules
Random Vibration
Random Vibration& Test Schedules
Random Vibration& Test Schedules
Random Vibration& Test Schedules
Random Vibration
Random Vibration
Figure 42: SRETS working tasks
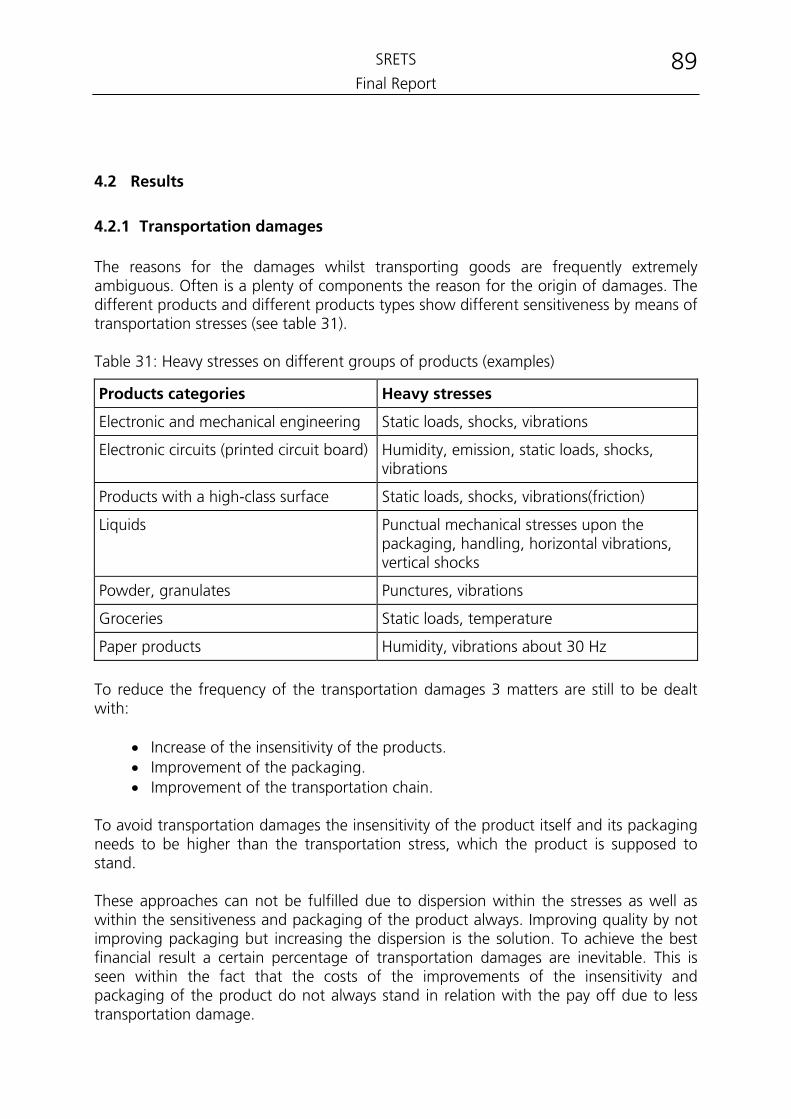
SRETS
Final Report 89
4.2 Results
4.2.1 Transportation damages
The reasons for the damages whilst transporting goods are frequently extremely ambiguous. Often is a plenty of components the reason for the origin of damages. The different products and different products types show different sensitiveness by means of transportation stresses (see table 31). Table 31: Heavy stresses on different groups of products (examples)
Products categories Heavy stresses
Electronic and mechanical engineering Static loads, shocks, vibrations
Electronic circuits (printed circuit board) Humidity, emission, static loads, shocks, vibrations
Products with a high-class surface Static loads, shocks, vibrations(friction)
Liquids Punctual mechanical stresses upon the packaging, handling, horizontal vibrations, vertical shocks
Powder, granulates Punctures, vibrations
Groceries Static loads, temperature
Paper products Humidity, vibrations about 30 Hz
To reduce the frequency of the transportation damages 3 matters are still to be dealt with:
• Increase of the insensitivity of the products. • Improvement of the packaging. • Improvement of the transportation chain.
To avoid transportation damages the insensitivity of the product itself and its packaging needs to be higher than the transportation stress, which the product is supposed to stand. These approaches can not be fulfilled due to dispersion within the stresses as well as within the sensitiveness and packaging of the product always. Improving quality by not improving packaging but increasing the dispersion is the solution. To achieve the best financial result a certain percentage of transportation damages are inevitable. This is seen within the fact that the costs of the improvements of the insensitivity and packaging of the product do not always stand in relation with the pay off due to less transportation damage.
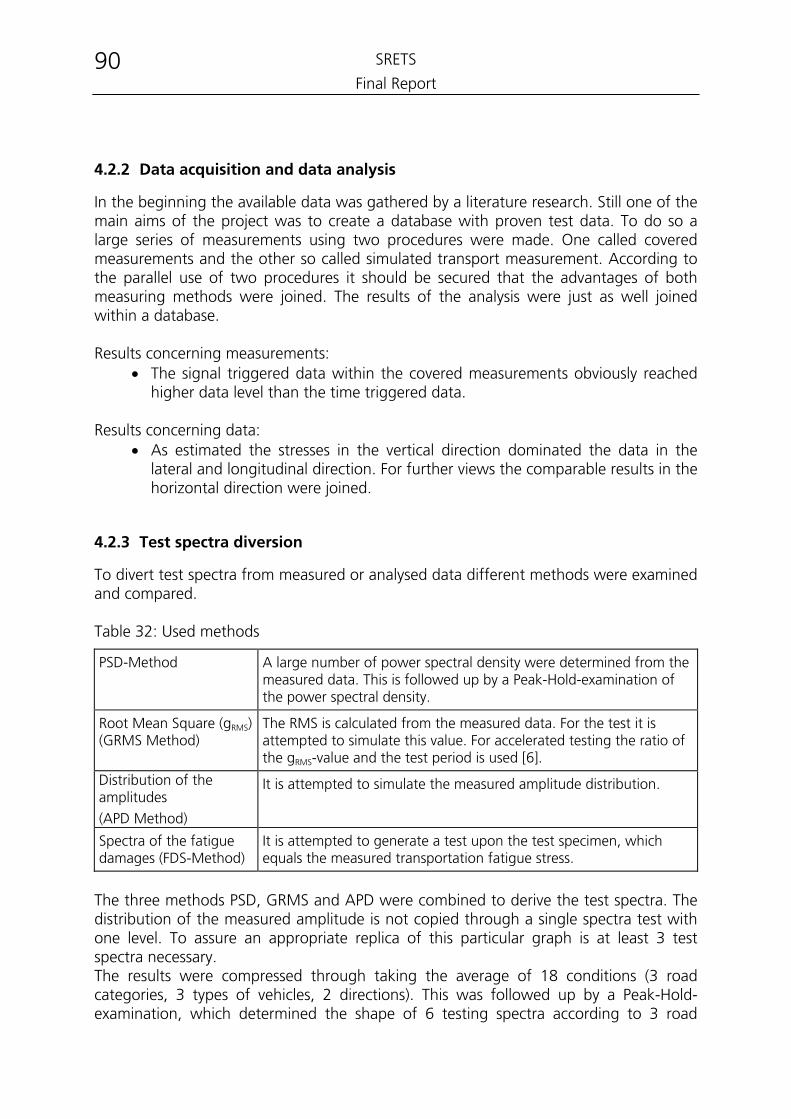
SRETS
Final Report 90
4.2.2 Data acquisition and data analysis
In the beginning the available data was gathered by a literature research. Still one of the main aims of the project was to create a database with proven test data. To do so a large series of measurements using two procedures were made. One called covered measurements and the other so called simulated transport measurement. According to the parallel use of two procedures it should be secured that the advantages of both measuring methods were joined. The results of the analysis were just as well joined within a database. Results concerning measurements:
• The signal triggered data within the covered measurements obviously reached higher data level than the time triggered data.
Results concerning data:
• As estimated the stresses in the vertical direction dominated the data in the lateral and longitudinal direction. For further views the comparable results in the horizontal direction were joined.
4.2.3 Test spectra diversion
To divert test spectra from measured or analysed data different methods were examined and compared. Table 32: Used methods
PSD-Method A large number of power spectral density were determined from the measured data. This is followed up by a Peak-Hold-examination of the power spectral density.
Root Mean Square (gRMS) (GRMS Method)
The RMS is calculated from the measured data. For the test it is attempted to simulate this value. For accelerated testing the ratio of the gRMS-value and the test period is used [6].
Distribution of the amplitudes
(APD Method)
It is attempted to simulate the measured amplitude distribution.
Spectra of the fatigue damages (FDS-Method)
It is attempted to generate a test upon the test specimen, which equals the measured transportation fatigue stress.
The three methods PSD, GRMS and APD were combined to derive the test spectra. The distribution of the measured amplitude is not copied through a single spectra test with one level. To assure an appropriate replica of this particular graph is at least 3 test spectra necessary. The results were compressed through taking the average of 18 conditions (3 road categories, 3 types of vehicles, 2 directions). This was followed up by a Peak-Hold-examination, which determined the shape of 6 testing spectra according to 3 road
SRETS
Final Report 91
categories and 2 axis direction. Through the APD-Method and the GRMS-Method the 3 level (gRMS) as well as the testing period were set. Furthermore the FDS method (Spectra of the fatigue damages) suggested 6 test levels (shape and gRMS and value), but this method led, compared with the measured data, to very high amplitudes even by the tests without time acceleration. Accordingly the suggestions made by this method were rejected. The level with the lowest amplitude is to be tested for the longest time and accordingly the one with the highest amplitude only for a very short period of time. This is very often only a few seconds so that this test can not be run with a control system for vibration tests. Instead a shock test is suggested to simulate the quite rare high values of the amplitude distribution. These could be combined with other shock tests run at the packaging examination (simulation of Handling etc.). Furthermore remarkable is that the vibration stresses with very low level make only a minor part of the testing time when the value is increasing for time acceleration according Palmgren and Miner. This could led to the conclusion to leave the lowest level of the test out because they are well covered by testing the higher levels. To set the vibration spectra the number of values (auxiliary points) frequently needs to be reduced. To do so a program was developed, which reduces the number of auxiliary points to the number wished by minimising the number of static errors.
4.2.4 Verification of the test spectra
The suggested tests were examined concerning their feasibility on the standing test plants. The comparison between the field and laboratory outcomes were made at the same time. At the simulation different products were used as test specimen. These were electronic control units, boiler, washing machines, and palletised drinking packaging Boiler: The distribution of the amplitudes of the measured values taken from the database were quite close reproduced, but the field tests burdened the boilers less. This result is seen within the bouncing of the test specimen (not tightened onto the vibration exciting equipment) at the highest test level. Beverage packaging: The tests were compared with ASTM D 4728-91. Using the ASTM and SRETS test spectra tests on 3 different loading units in the laboratory as well as a testing dispatch laboratory tests were run. The results of the SRETS tests came closer to the ones of the field tests than ASTM results, which turned out to be harsh. Electronic control units: Whilst transporting these mechanisms from Germany to Spain the labels on the top of the case went loose. These damages were successfully simulated by the SRETS test spectra. Washing machine: The loosen of the drum were the results of transporting the products by truck within Europe. To simulate the transporting stresses a test program, which
SRETS
Final Report 92
based upon gRMS data made by SRETS, was worked out. The test produced exactly the same damages as the ones from the real transportation.
4.2.5 Suggested test spectras
3 different test levels for horizontal and vertical stresses are suggested. The classification of the levels follows the street categories:
1. Good road condition 2. Bad road condition, evidently worse than the average road condition in middle
Europe 3. Extremely poor road condition (building ground, cobblestone pavement etc.)
SRETS
Final Report 93
5 Literature and references
[1] Almlöf, G., Axelsson, B., Lundin, M., Sjöstedt, L.: Strukturering och analys av
godsskador, Forskningsrapport nr 77, Tekniska Högskolan i Linköping, Ek inst., 1977
[2] Almlöf, G., Johansson, T.: Analys av godsskador, Forskningsrapport nr 86, Tekniska Högskolan i Linköping, Ek inst., 1979
[3] Byrd, Von L.: Effect of Relative Humidity Changes on Compressive Creep Response of Paper, Tappi, Vol 55, No. 11, November 1972, pp 1612-1613
[4] Fackler, Warren C.: Equivalence Techniques for vibration testing, The Shock and Vibration Information Center, United States Department of Defense, 1972
[5] Fiedler, R.M., ed.: Distribution Hazards and Environmental Conditions, Institute of Packaging Professionals, 1995
[6] Hooper, G.G.: A Method of Measuring the Moisture Vapour Transmission Rate of an Equipment, Institute of Environmental Sciences, USA Proceedings 1987.
[7] Hooper, G.G.: The Determination of Moisture Vapour Transmission into an Equipment, Brownell Limited
[8] Kidwell, K.E.: Can Shipping. Dry cans = no more rust, CanTech International Oct/Nov 1995
[9] Kölgran, M.: Clamping can Seriously Damage your Roll, Pulp & Paper International, vol. 36, no. 8, Aug. 1994, pp 40-41
[10] Ramsland, T., Selin, J.: Handbook on Procurement of Packaging, second edition, Helsinki 1993
[11] Skyddslackering av kretskort, IVF-resultat 77602, 1977
[12] Söremark, C.: Rate of Deformation during Cyclical Climatic Conditions, FEFCO, spring 1995
[13] Urbanik, T.J.: Transportation vibration effects on unitized corrugated containers, 1979
[14] Zachariassen, K.: Corrosion of electronics in practical use, ECR-213, Elektronikcentralen, Horsholm, Denmark, 1988
SRETS
Final Report 94
[15] FKV: Mengenpotentiale des Kombinierten Verkehrs, Forschungskonsortium Kombinierter Verkehr, Verlag für Publikationen im Kombinierten Verkehr, Neu-Isenburg, 1990
[16] Himelblau, Harry et all: Handbook of Dynamic Data Acquisition and Analysis, IES Recommended Practice 012.1, IES, ISBN 1-877862-49-9
[17] Broch J.T.: Mechanical Vibration and Shock Measurements, Bruel & Kjær, Søborg,
Larsen & Søn, 1980 [18] Randal, R.,B.: Frequency Analysis, Brüel & Kjær, Nærum, 1977 [19] Bronstein, I.N.; Semendjajew,K.A.: Taschenbuch der Mathematik, Verlag Harri
Deutsch, Frankfurt/Main, 1983 [20] Winne, J. de: Équivalence des dommages par fatigue crées sous vibrations, Envi-
ronmental Testing in the 90's, 18th Jahrestagung der GUS, Karlsruhe, 1989 [21] Lenk, A.; Rehnitz, J.: Schwingungsprüftechnik, VEB Verlag Technik, Berlin, 1974 [22] Lambert, R.G.: Plastic Work Interaction Damage Rule Applied to Narrow-Band
Gaussian Random Stress Situations, Transactions of the ASME, Vol. 110, February, 1988
[23] Lambert, R.G.: Fatigue under Random Vibration, The Shock and Vibration
Bulletin, Naval Research Laboratory, August, 1976
[24] Trost, Thomas: Varutransport och godsskadekostnader. Packforsk report No 121, 1988. (Goods transport and damage costs, in Swedish with summary in English)
[25] Economic Effects of Metallic Corrosion in the United States, National Bureau of
Standards, Special Publication 511, 1978 [26] Hoppe, W.: Mechanische und Klimatische Beanspruchungen von
Transportgütern, Verpackungs-Rundschau 2/1979, pp. 142-149

SRETS
Final Report 95
SRETS
Final Report 96
6 Annex 1: Literature Data
Table A1: Sources of the Air Tansportation measured data (see also figure A1)
DEF STAN 00 - 35 (Part 5); 1992, Draft [A10]
A,B Vibration spectrum of a VC 10 Jet (A)/ Herkules MK 3 Turbo-Prop (B) aircraft
during landing including reverse thrust.
GAM - EG - 13; 1985, Draft [A8]
C,D,E Vibration spectrum of a Turbo-Prop aircraft under different flight conditions.
(C: take off and climb to cruising attitude, D: cruising attitude, E: In turbulence)
GAM - EG 13; 1985, Draft [A8]
F,G Vibration spectra of different sized helicopters, sidewise take off. (F: Mass <
6 to, G: Mass > 6 to)
Trost Tho., Air Cargo Transportation, Jan. 1988 [A16]
H,I,J Load measured on a pallet in a Boeing 747 combi aircraft. V1. (H: taxiing, I:
take off, J: climb)
K,L,M Load measured on a pallet in a Boeing 747 combi aircraft. V2. (K: taxiing, L:
take off, M: climb)
Trost Tho.; Airport ground Transportation, Oct. 1988 [A17]
N,O,P Load measured on a pallet during ground transportation at different airports.
V2. (N; Transport from terminal to ramp, Arlanda Airport Sweden, O; Transport
from aircraft to terminal, J.F.K. Airport, P; Transport from terminal to aircraft,
J.F.K. Airport)
Q,R,S Load measured on a pallet during ground transportation at different airports.
V1. (Q; Transport from terminal to ramp, Arlanda Airport Sweden, R; Transport
from aircraft to terminal, J.F.K. Airport, S; Transport from terminal to aircraft,
J.F.K. Airport)
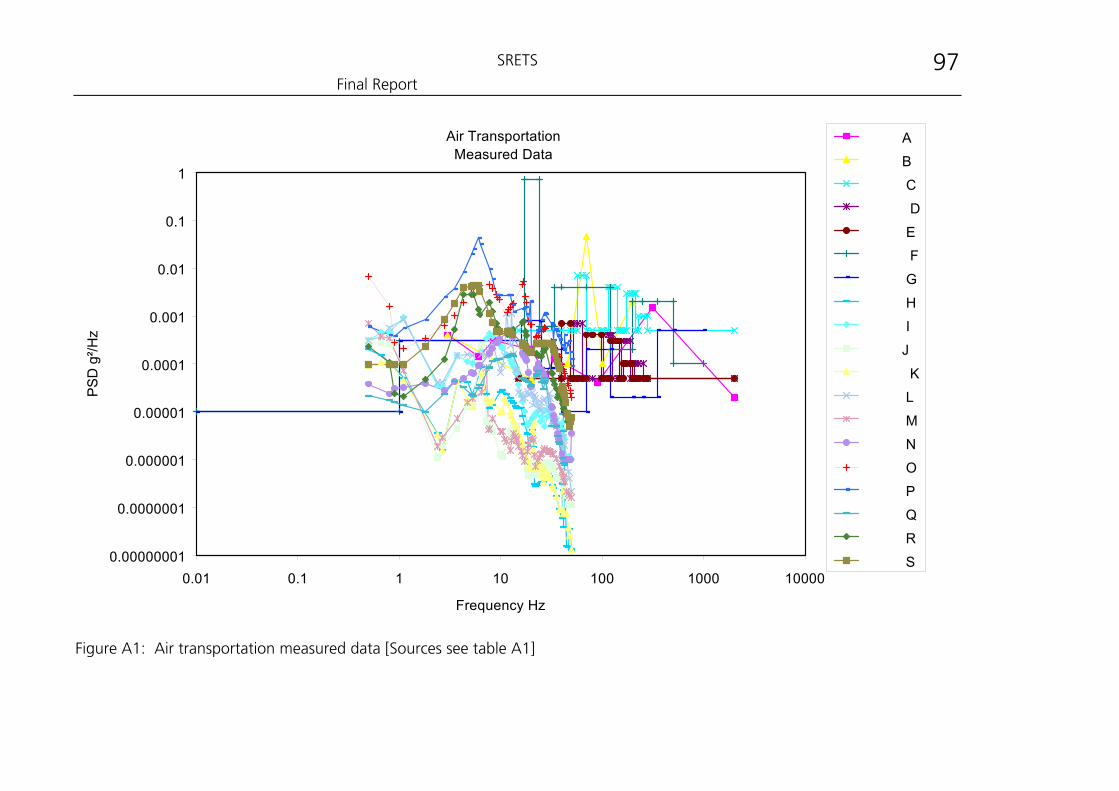
SRETS
Final Report 97
Air TransportationMeasured Data
0.00000001
0.0000001
0.000001
0.00001
0.0001
0.001
0.01
0.1
1
0.01 0.1 1 10 100 1000 10000
Frequency Hz
PSD
g²/H
z
A B C D E F G H I J K L M N O P Q R S
Figure A1: Air transportation measured data [Sources see table A1]
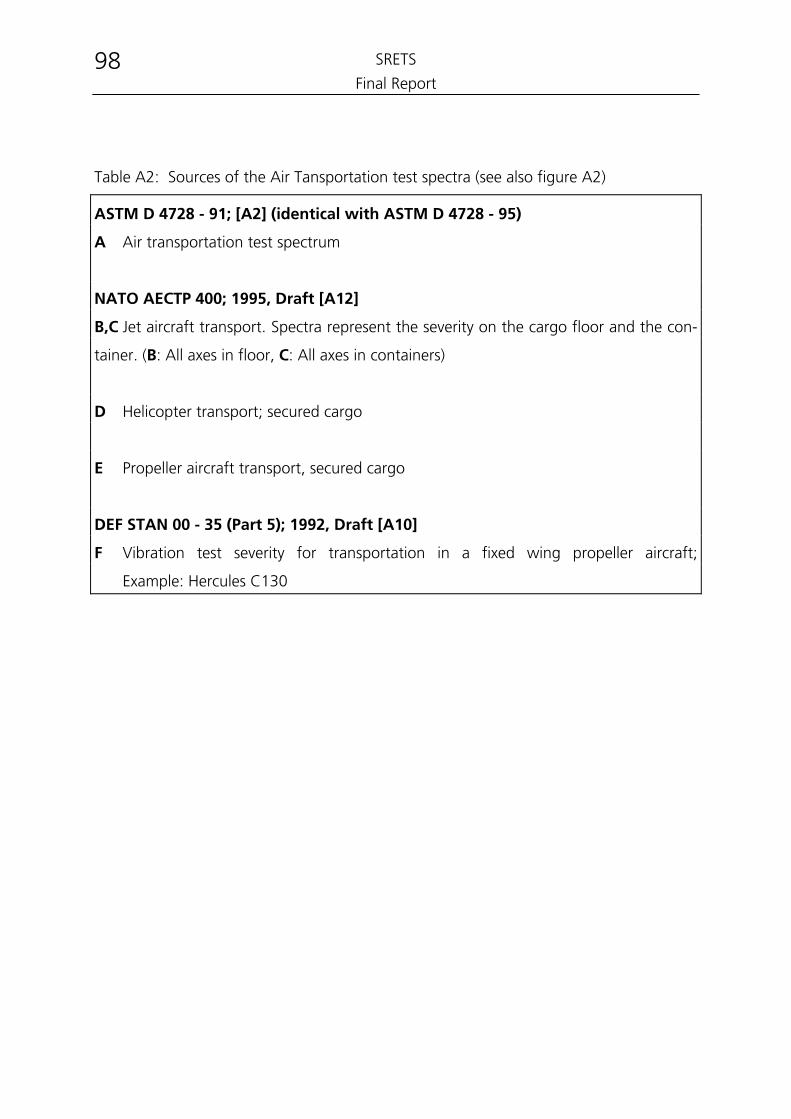
SRETS
Final Report 98
Table A2: Sources of the Air Tansportation test spectra (see also figure A2)
ASTM D 4728 - 91; [A2] (identical with ASTM D 4728 - 95)
A Air transportation test spectrum
NATO AECTP 400; 1995, Draft [A12]
B,C Jet aircraft transport. Spectra represent the severity on the cargo floor and the con-
tainer. (B: All axes in floor, C: All axes in containers)
D Helicopter transport; secured cargo
E Propeller aircraft transport, secured cargo
DEF STAN 00 - 35 (Part 5); 1992, Draft [A10]
F Vibration test severity for transportation in a fixed wing propeller aircraft;
Example: Hercules C130
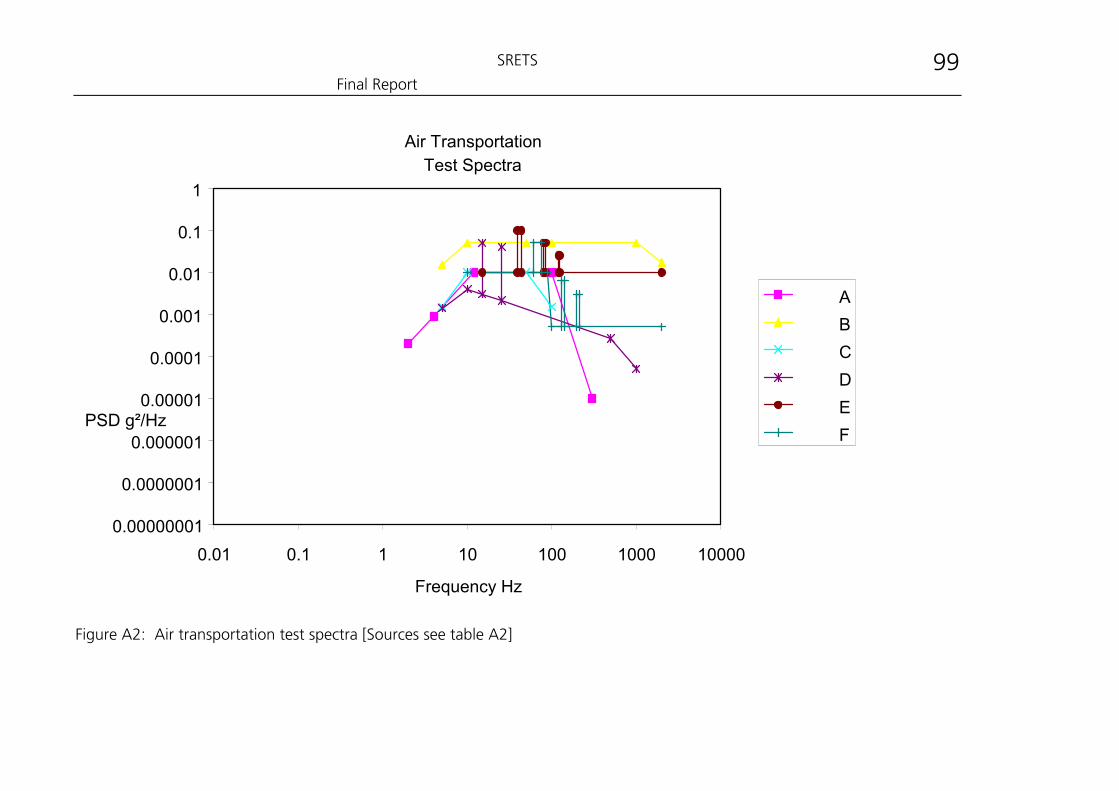
SRETS
Final Report 99
Air TransportationTest Spectra
0.00000001
0.0000001
0.000001
0.00001
0.0001
0.001
0.01
0.1
1
0.01 0.1 1 10 100 1000 10000
Frequency Hz
PSD g²/Hz
A B C D E F
Figure A2: Air transportation test spectra [Sources see table A2]
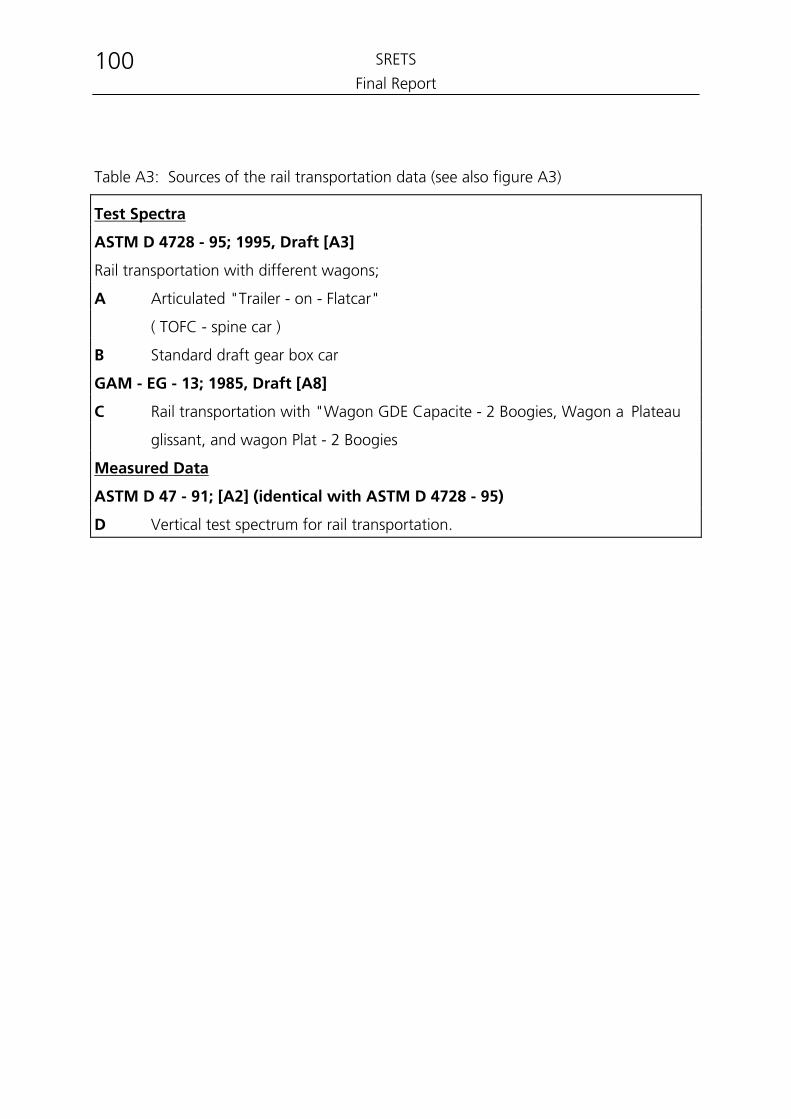
SRETS
Final Report 100
Table A3: Sources of the rail transportation data (see also figure A3)
Test Spectra
ASTM D 4728 - 95; 1995, Draft [A3]
Rail transportation with different wagons;
A Articulated "Trailer - on - Flatcar"
( TOFC - spine car )
B Standard draft gear box car
GAM - EG - 13; 1985, Draft [A8]
C Rail transportation with "Wagon GDE Capacite - 2 Boogies, Wagon a Plateau
glissant, and wagon Plat - 2 Boogies
Measured Data
ASTM D 47 - 91; [A2] (identical with ASTM D 4728 - 95)
D Vertical test spectrum for rail transportation.
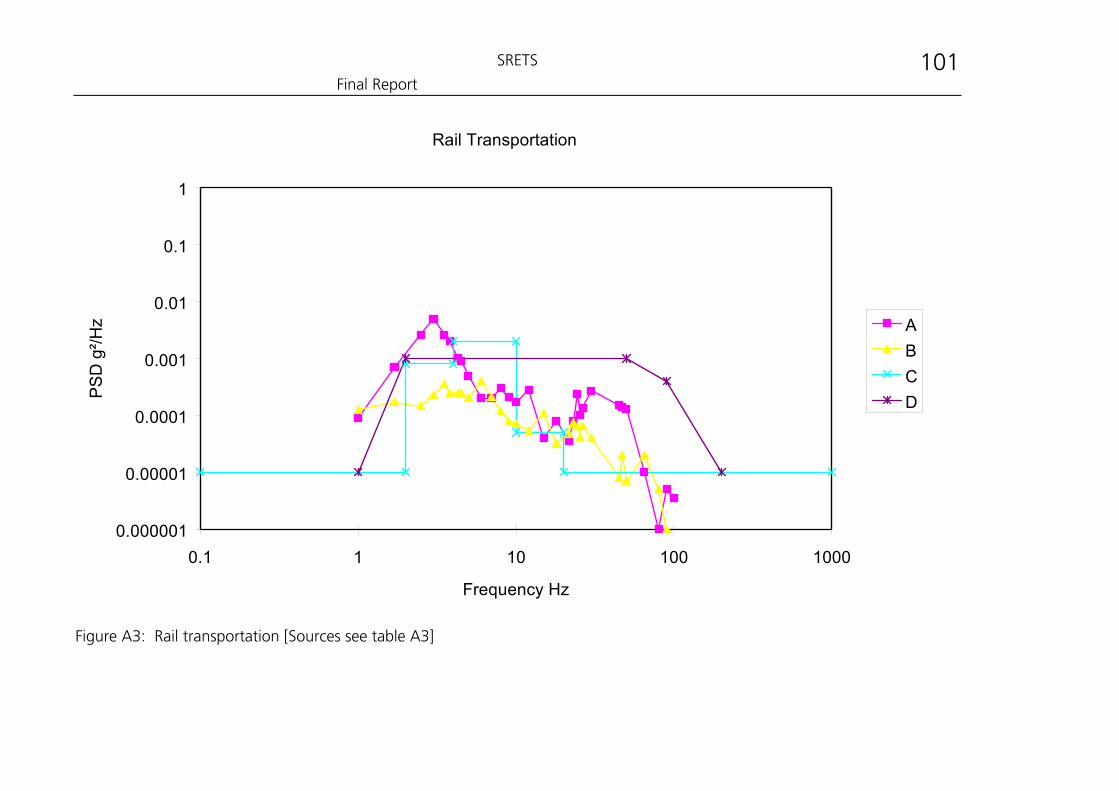
SRETS
Final Report 101
Rail Transportation
0.000001
0.00001
0.0001
0.001
0.01
0.1
1
0.1 1 10 100 1000
Frequency Hz
PSD
g²/H
z ABCD
Figure A3: Rail transportation [Sources see table A3]
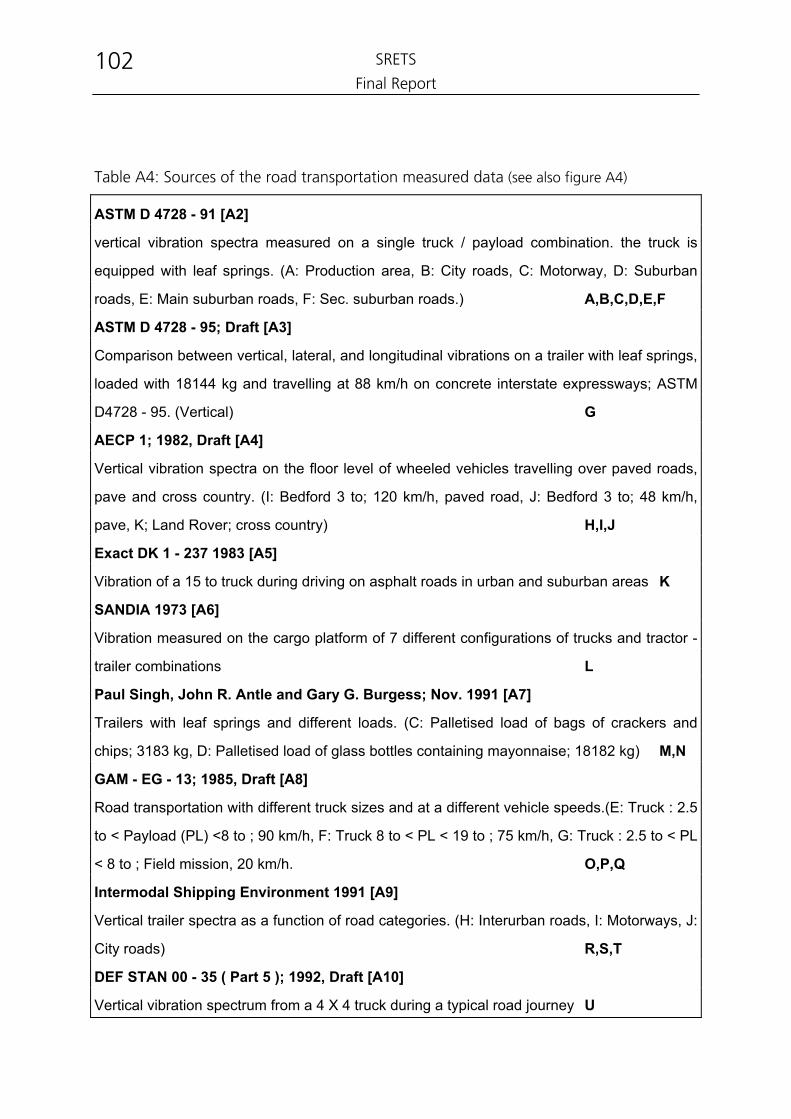
SRETS
Final Report 102
Table A4: Sources of the road transportation measured data (see also figure A4)
ASTM D 4728 - 91 [A2]
vertical vibration spectra measured on a single truck / payload combination. the truck is
equipped with leaf springs. (A: Production area, B: City roads, C: Motorway, D: Suburban
roads, E: Main suburban roads, F: Sec. suburban roads.) A,B,C,D,E,F
ASTM D 4728 - 95; Draft [A3]
Comparison between vertical, lateral, and longitudinal vibrations on a trailer with leaf springs,
loaded with 18144 kg and travelling at 88 km/h on concrete interstate expressways; ASTM
D4728 - 95. (Vertical) G
AECP 1; 1982, Draft [A4]
Vertical vibration spectra on the floor level of wheeled vehicles travelling over paved roads,
pave and cross country. (I: Bedford 3 to; 120 km/h, paved road, J: Bedford 3 to; 48 km/h,
pave, K; Land Rover; cross country) H,I,J
Exact DK 1 - 237 1983 [A5]
Vibration of a 15 to truck during driving on asphalt roads in urban and suburban areas K
SANDIA 1973 [A6]
Vibration measured on the cargo platform of 7 different configurations of trucks and tractor -
trailer combinations L
Paul Singh, John R. Antle and Gary G. Burgess; Nov. 1991 [A7]
Trailers with leaf springs and different loads. (C: Palletised load of bags of crackers and
chips; 3183 kg, D: Palletised load of glass bottles containing mayonnaise; 18182 kg) M,N
GAM - EG - 13; 1985, Draft [A8]
Road transportation with different truck sizes and at a different vehicle speeds.(E: Truck : 2.5
to < Payload (PL) <8 to ; 90 km/h, F: Truck 8 to < PL < 19 to ; 75 km/h, G: Truck : 2.5 to < PL
< 8 to ; Field mission, 20 km/h. O,P,Q
Intermodal Shipping Environment 1991 [A9]
Vertical trailer spectra as a function of road categories. (H: Interurban roads, I: Motorways, J:
City roads) R,S,T
DEF STAN 00 - 35 ( Part 5 ); 1992, Draft [A10]
Vertical vibration spectrum from a 4 X 4 truck during a typical road journey U
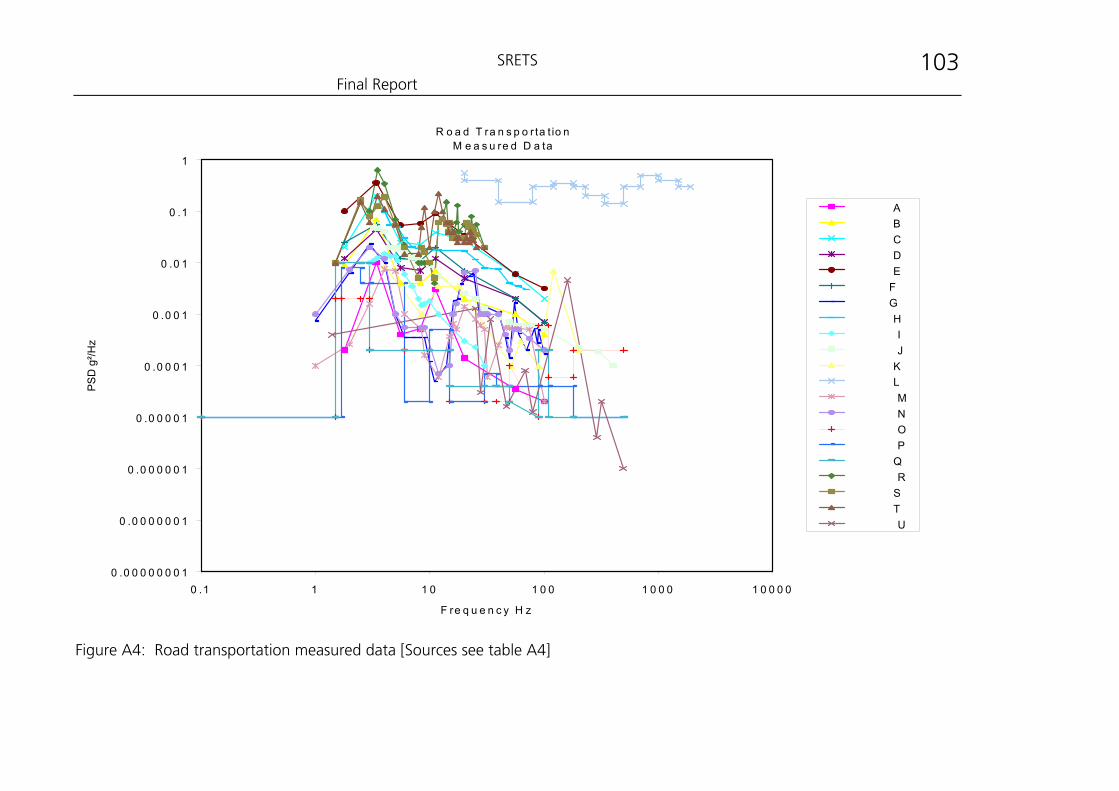
SRETS
Final Report 103
R o a d T ra n s p o r ta t io nM e a s u re d D a ta
0 .0 0 0 0 0 0 0 1
0 .0 0 0 0 0 0 1
0 .0 0 0 0 0 1
0 .0 0 0 0 1
0 .0 0 0 1
0 .0 0 1
0 .0 1
0 .1
1
0 .1 1 1 0 1 0 0 1 0 0 0 1 0 0 0 0
F re q u e n c y H z
PSD
g²/H
z
A B C D E F G H I J K L M N O P Q R S T U
Figure A4: Road transportation measured data [Sources see table A4]
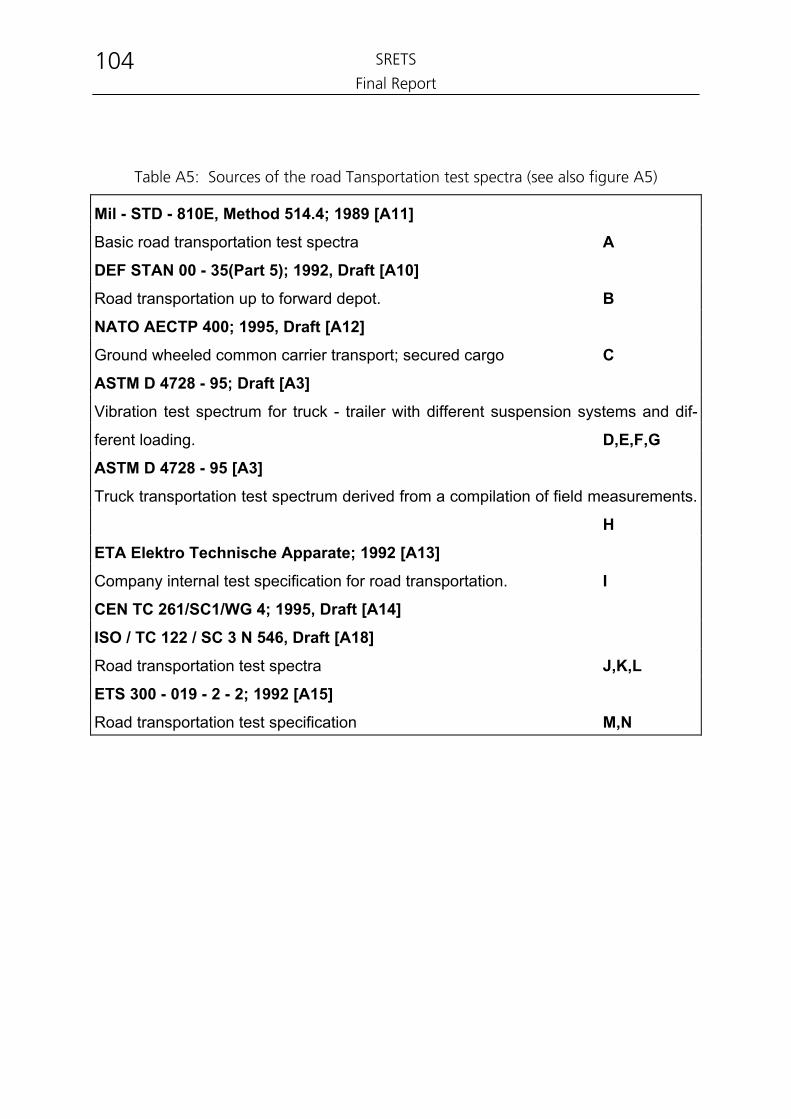
SRETS
Final Report 104
Table A5: Sources of the road Tansportation test spectra (see also figure A5)
Mil - STD - 810E, Method 514.4; 1989 [A11] Basic road transportation test spectra A
DEF STAN 00 - 35(Part 5); 1992, Draft [A10] Road transportation up to forward depot. B NATO AECTP 400; 1995, Draft [A12] Ground wheeled common carrier transport; secured cargo C ASTM D 4728 - 95; Draft [A3] Vibration test spectrum for truck - trailer with different suspension systems and dif-
ferent loading. D,E,F,G ASTM D 4728 - 95 [A3] Truck transportation test spectrum derived from a compilation of field measurements.
H ETA Elektro Technische Apparate; 1992 [A13] Company internal test specification for road transportation. I CEN TC 261/SC1/WG 4; 1995, Draft [A14] ISO / TC 122 / SC 3 N 546, Draft [A18] Road transportation test spectra J,K,L ETS 300 - 019 - 2 - 2; 1992 [A15] Road transportation test specification M,N
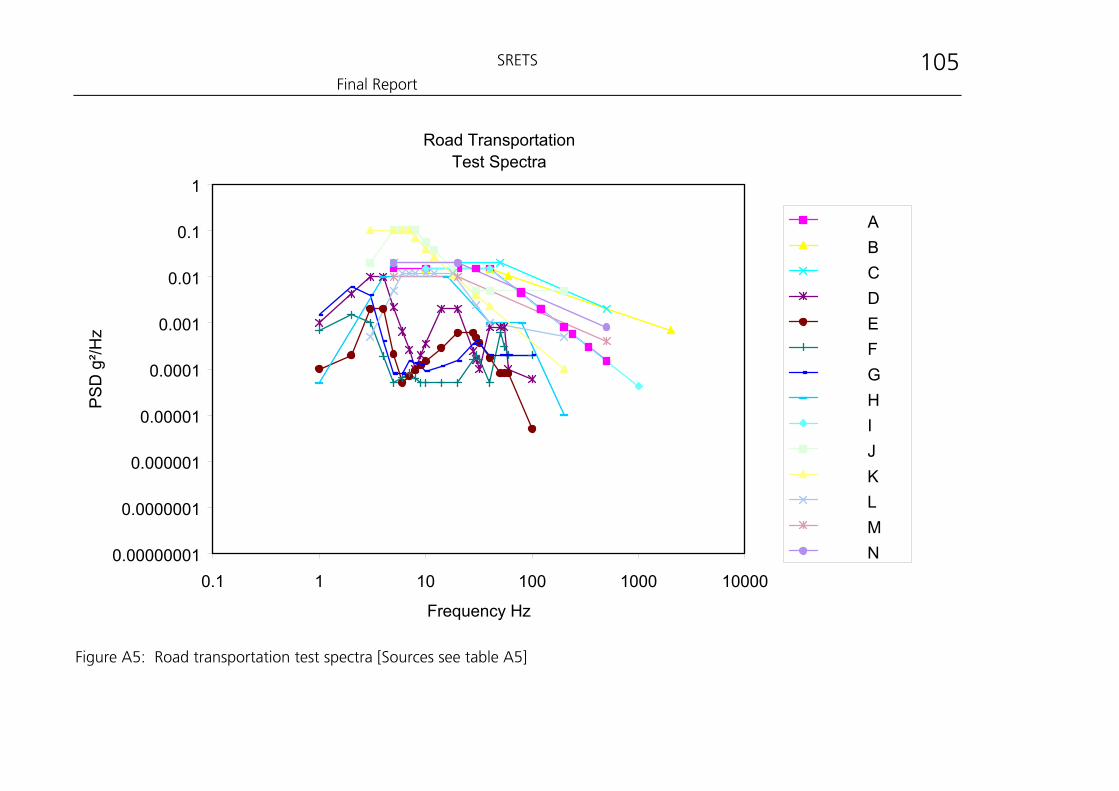
SRETS
Final Report 105
Road Transportation Test Spectra
0.00000001
0.0000001
0.000001
0.00001
0.0001
0.001
0.01
0.1
1
0.1 1 10 100 1000 10000
Frequency Hz
PSD
g²/H
z
A B C D E F G H I J K L M N
Figure A5: Road transportation test spectra [Sources see table A5]
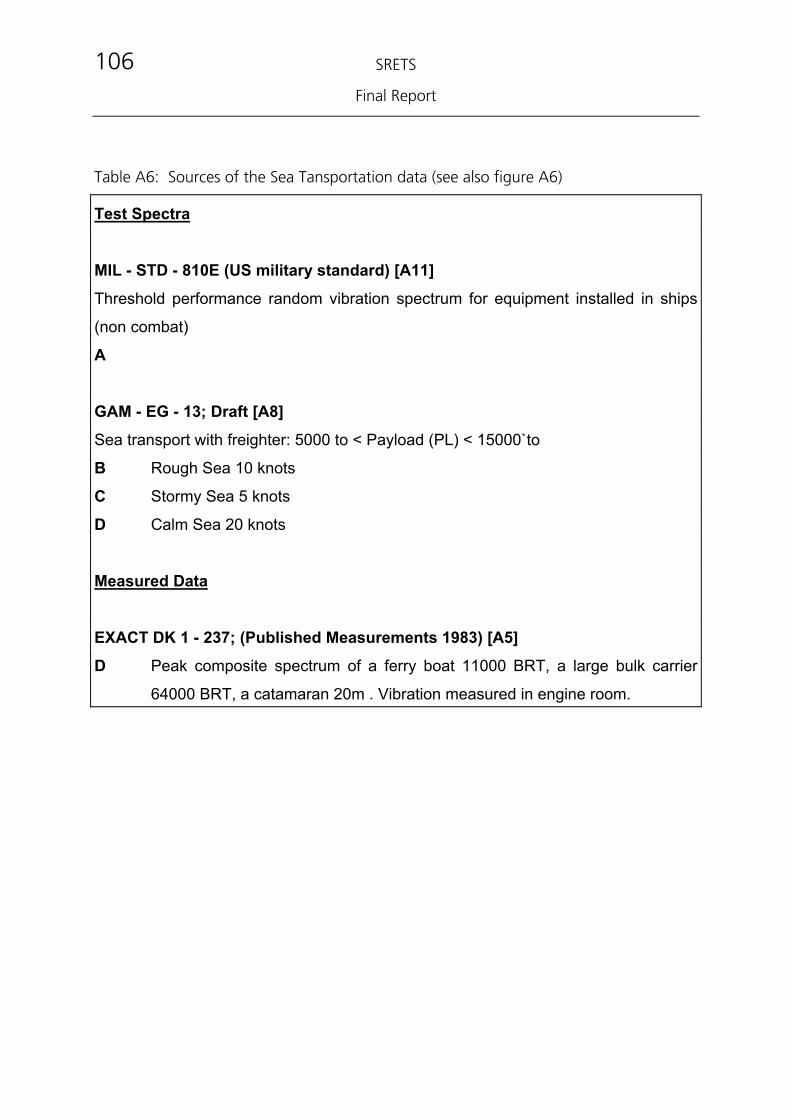
SRETS
Final Report
106
Table A6: Sources of the Sea Tansportation data (see also figure A6)
Test Spectra
MIL - STD - 810E (US military standard) [A11] Threshold performance random vibration spectrum for equipment installed in ships
(non combat)
A GAM - EG - 13; Draft [A8] Sea transport with freighter: 5000 to < Payload (PL) < 15000`to
B Rough Sea 10 knots
C Stormy Sea 5 knots
D Calm Sea 20 knots
Measured Data EXACT DK 1 - 237; (Published Measurements 1983) [A5] D Peak composite spectrum of a ferry boat 11000 BRT, a large bulk carrier
64000 BRT, a catamaran 20m . Vibration measured in engine room.
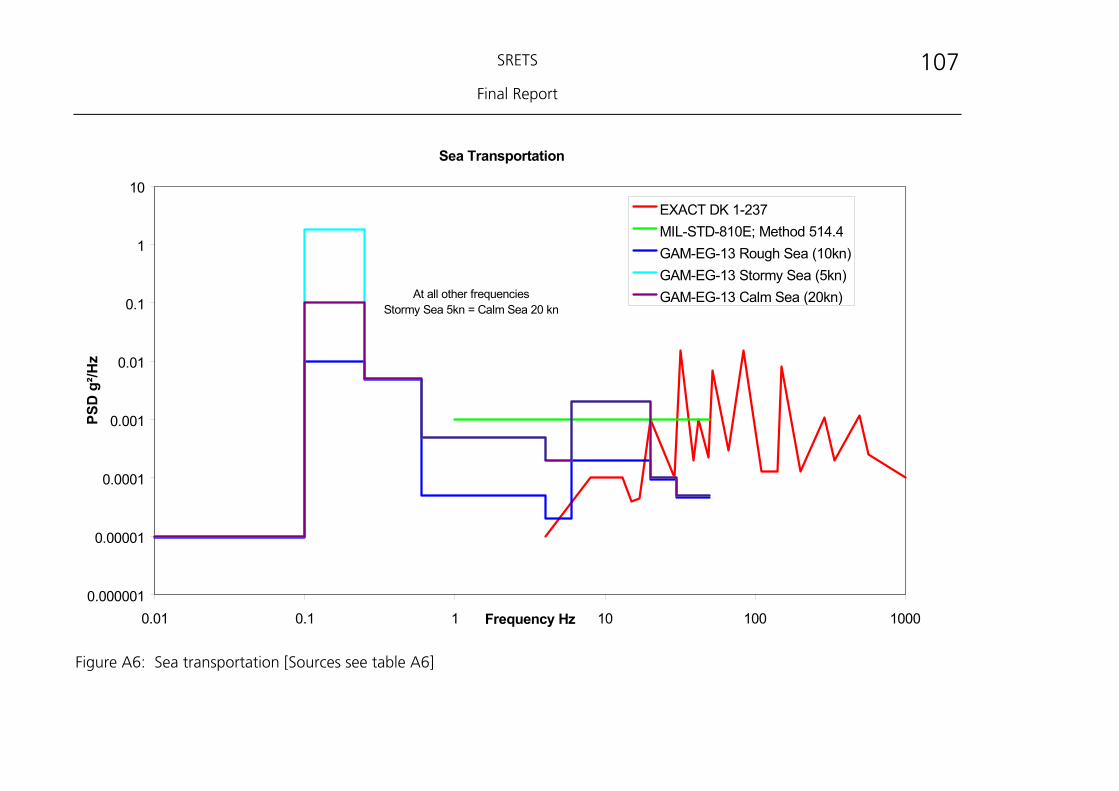
SRETS
Final Report
107
Sea Transportation
0.000001
0.00001
0.0001
0.001
0.01
0.1
1
10
0.01 0.1 1 10 100 1000Frequency Hz
PSD
g²/H
z
EXACT DK 1-237MIL-STD-810E; Method 514.4GAM-EG-13 Rough Sea (10kn)GAM-EG-13 Stormy Sea (5kn)GAM-EG-13 Calm Sea (20kn)At all other frequencies
Stormy Sea 5kn = Calm Sea 20 kn
Figure A6: Sea transportation [Sources see table A6]
SRETS
Final Report
108
References for Annex 1 [A1] IEC 721 - ;Classification of environmental conditions; Classification of groups of
environmental parameters and their severities; Part 3 - 2: Transportation Part 3 - 5: Ground vehicle installations Part 3 - 7: Portable and non - stationary use
[A2] ASTM D 4728 - 91;
Standard test method for random vibration testing of shipping containers. [A3] ASTM D 4728 - 95; Draft;
Standard test method for random vibration testing of shipping containers. [A4] AECP 1; 1982, Draft
Allied Environmental Conditions Publication; Mechanical environmental conditions to which material intended for use by NATO - Forces could be exposed.
[A5] EXACT DK 1 - 237; 1983;
Vibration environments; Background information for the preparation of a general test specification for electronic equipment; Electronic Centralen, Venlighedsvej 4, DK - 2970 Hosholm.
[A6] SANDIA; 1973;
Transportation dynamic environment summary; Sandia National Laboratories, Albuquerque, New Mexico 87185.
[A7] S. Paul Singh, John R. Antle and Gary G. Burgess
Comparison between lateral, longitudinal, and vertical vibration levels in commercial truck shipments. Packaging Technology and Science Vol. 5 71 - 75 (1992).
[A8] GAM - EG - 13; 1985, Draft
Basic environmental test procedures, French Ministry of Defence; [A9] The Intermodal Shipping Environment;
A study performed by the Association of American Railroads; Report No. DP 3 - 92, April 1991.
[A10] DEF STAN 00 - 35 ( Part 5 ); 1992, Draft
Defence standard; Environmental handbook for defence material, British Ministry of Defence.
SRETS
Final Report
109
[A11] MIL - STD - 810 E, Method 514.4; 1989; Military standard; Environmental test methods and engineering guidelines, American Department of Defence.
[A12] NATO AECTP 400; Edition 2 1995, Draft
Allied Environmental Guidelines for Defence Material. [A13] ETA, 1992;
Company internal test specification, P. Merkle; Elektro Technische Apparate GmbH, 8503 Altdorf / Nürnberg.
[A14] CEN TC 261 / SC 1 / WG 4 / N57;
Packaging - Generalities - Test Methods and Test Schedules, European Committee for Standardisation.
[A15] ETS 300 019 - 2 - 2; 1992;
European Telecommunication Standard; Equipment Engineering; ( EE ); Environmental conditions and environmental tests for telecommunication equipment. Part 2 - 2: Specification of environmental tests T 2.1 to T 2.3; Transportation.
[A16] Trost Thomas,
Mechanical Stresses on Products during Air Cargo, Transportation. Packaging Technology and Science Vol. 1, 137 - 155 ( 1988 ).
[A17] Trost Thomas.,
Mechanical Stresses on Cargo during Ground Operations, in Air Transport. Packaging Technology and Science Vol.2, 85 - 108 ( 1988 ).
[A18] ISO / TC 122 / SC 3 N 546
Packaging - Complete filled transport packages and unit loads - Vertical
random vibration test.
SRETS
Final Report
110
7 Annex 2: Test Method on Random Vibration Test
PACKAGING - COMPLETE, FILLED TRANSPORT PACKAGES AND UNIT LOADS VERTICAL RANDOM VIBRATION TESTS 1. Scope and field of application
This European standard specifies a method to carry out a Vertical random vibration test on a complete, filled transport package(s) and unit loads using a random excitation1. This test may be used to assess the performance of a package in terms of its strength or the protection that it offers to its contents when it is subjected to vertical vibration. It may be performed either as a single test to investigate the effects of vertical vibration or as a part of a sequence of tests designed to measure the ability of a test item to withstand a distribution system that includes a vibration hazard. A random vibration test is the most realistic way to reproduce environmental vibration during transportation, for this reason, if suitable laboratory facilities are available, this kind of test should be preferred to any fixed or swept frequency sinusoidal vibration tests similar to EN 22247 and EN 28318. Note: In the following text a Package or unit load is called a test item. 2.0 References
EN 22206 Packaging - Complete, filled transport packages - Identification of parts when testing.
EN 22233 Packaging - Complete, filled transport packages - Condition for testing. EN 22234 Packaging - Complete, filled transport packages - Stacking test using a static
toad, EN 22247 Packaging - Complete, filled transport packages - Vibration tests at fixed low
frequency. EN 28318 Packaging - Complete, filled transport packages - Vibration test using a
sinusoidal excitation with variable frequency. EN 68 - 68-2-64 Part 2: Test methods Test Fh: Vibration, broad-band random (digital
control) and guidance.
1 The treatment of random vibration theory can be found in EN 2-64 standard.
SRETS
Final Report
111
3.0 Principle Placing of the test item on a vibration table and vibrating it using a random excitation with frequency between 3 and 200 Hz. The atmospheric conditions, the duration of the test, the acceleration power spectral density, the attitude of the test item and its method of restraint are predetermined. When required, a load may be superimposed on the test item to simulate conditions at the bottom of a stack. 4.0 Apparatus
4.1 Vibration table must have sufficient size and performance (in terms of power, displacement, frequency range) and must be stiff (its lower resonant frequency must be higher than the higher test frequency); it must remain horizontal during the test, The table may be equipped with: a) low fences to restrict sideways and endways movements during testing; b) high fences or other means of maintaining a superimposed load in position on the test item during testing: c) means to simulate the method of restraining the test item during transit. in addition. the apparatus shall meet the requirements and tolerances of clause 7.
4.2 A vibration measurement, data storage and control System comprising accelerometers, signal conditioners and a computer, able to: a) generate vibration with the required power spectra density b) control the motion of the vibration table by feeding back the Signal from the control accelerometer which monitors the table acceleration. The analysis shall be performed providing at least 120 statistical degrees of freedom. Data acquisition and control channels shall have a response accurate to ±5% over the frequency range specified for the test. 5.0 Test Item preparation
The test item shall normally be filled with its intended contents. However, simulated or substituted contents may be used, provided that the dimensions and physical properties of such contents are as close as possible to those of the intended contents. Ensure that the test item is closed normal, as if ready for distribution. If simulated or substituted contents are used, ensure that the normal method of closure is still employed. 6.0 Conditioning
The test item shall be conditioned in accordance with EN 22233.
SRETS
Final Report
112
7.0 Procedure
The test shall be carried out in the same atmospheric conditions as used for conditioning where this is critical to the performance of the test item. In other circumstances, the test shall be carried out in atmospheric conditions which are as near as practicable to those used for conditioning. Place the test item in the predetermined attitude on the vibration table (see 4.1), with the center of gravity placed as near as practicable to the center of the table, the test item is not secured to the table it may be fenced. lt a superimposed foad is required, the loading procedure shall comply with EN 22234. Imposed acceleration shall be measured by an accelerometer attached to the table as close as possible to the test item, but protected so that it will not be contacted by it. The horizontal components of the acceleration shall not be greater than 20% of the value of the vertical component. Start the test 6 dB below the test level to allow the system to equalise the power spectral density profile, then carefully operate to reach full test level and continue the test for the predetermined duration. The test duration and the power spectral density of the vibration table, in absence of experimental data concerning the effects of transportation to be reproduced, may be chosen in the appendix. The tolerance on root mean square acceleration shall not exceed ±5%, the obtained acceleration power spectral density of the test control signal shall not deviate by more than ±3 dB over the entire test frequency range. Tests may be interrupted at any time to allow visual inspection of the test item, or for any other purpose. 8.0 Test report
The test report shall include the following particulars: a) reference to this European Standard; b) name and address of testing laboratory and name and address of the customer; c) unique identification of report; d) date of receipt of the test items and date(s) of performance of test; e) name, title and signature of persons accepting responsibility for the test report; f) a statement to the effect that the test results relate only to the items tested;
SRETS
Final Report
113
g) a statement that the report shall not be reproduced except in full without the written approval of the testing laboratory;
h) number of replicate test items tested;
i) full description, including dimensions, weight, structural and material specifications of the test item and its fittings, cushioning, blocking, closure or reinforcing arrange-ments, ref. EN 22206;
j) description of contents - if simulated or substituted contents were used, full details shall be given;
k) gross mass of the test item; l) relative humidity, temperature and time of conditioning; temperature and relative
humidity of test area at time of test; whether these values comply with the require-ments of EN 22233;
m) The duration of the test, the frequency range, the applied acceleration power n) spectral density and the obtained root mean square acceleration value; o) whether a superimposed toad was used; if so, the mass, in kilograms, of the superimposed load and the period of time during which the test item was under load; p) the method of restraint, and whether low or high fences were used; q) any deviations from the test method described in this European Standard: r) recorded acceleration power spectra densities, with any observations which may assist
in correct interpretation; s) the attitude(s) in which the package was tested, using the method of identification as
given in EN 22206; t) equipment list and serial numbers.
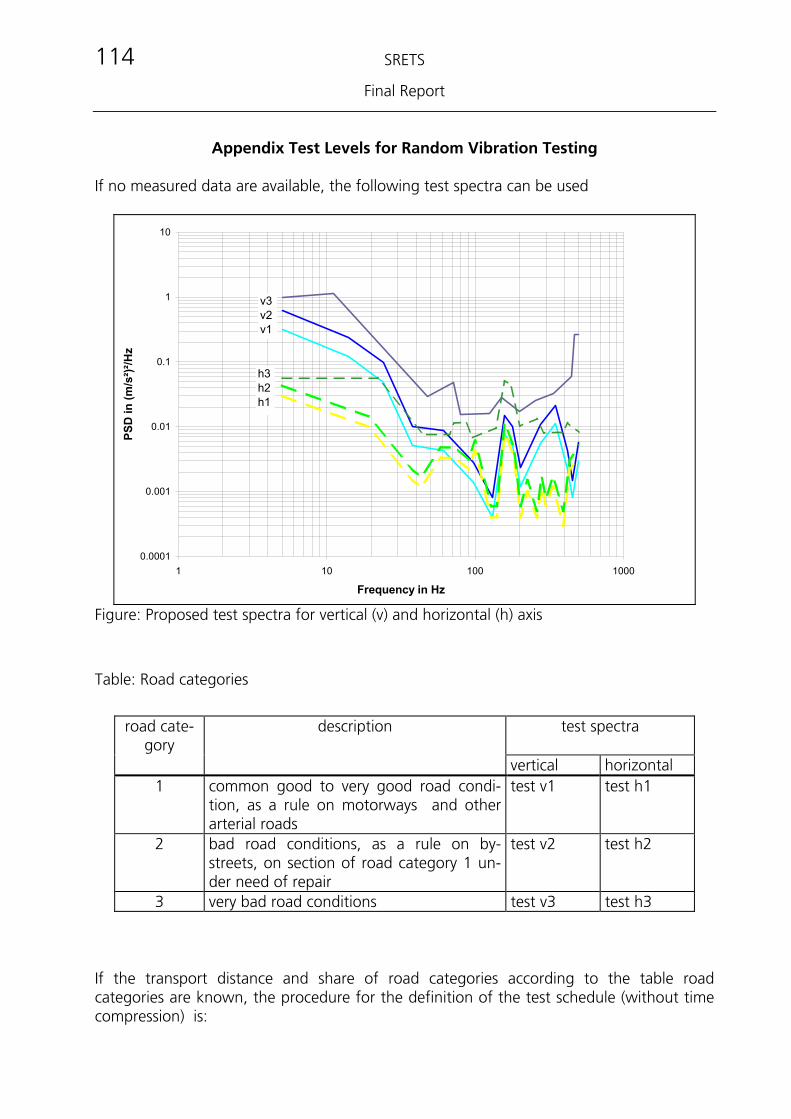
SRETS
Final Report
114
Appendix Test Levels for Random Vibration Testing If no measured data are available, the following test spectra can be used
0.0001
0.001
0.01
0.1
1
10
1 10 100 1000
Frequency in Hz
PSD
in (m
/s²)²
/Hz
v3v2v1
h3h2h1
Figure: Proposed test spectra for vertical (v) and horizontal (h) axis
Table: Road categories
road cate-
gory description test spectra
vertical horizontal 1 common good to very good road condi-
tion, as a rule on motorways and other arterial roads
test v1 test h1
2 bad road conditions, as a rule on by-streets, on section of road category 1 un-der need of repair
test v2 test h2
3 very bad road conditions test v3 test h3 If the transport distance and share of road categories according to the table road categories are known, the procedure for the definition of the test schedule (without time compression) is:
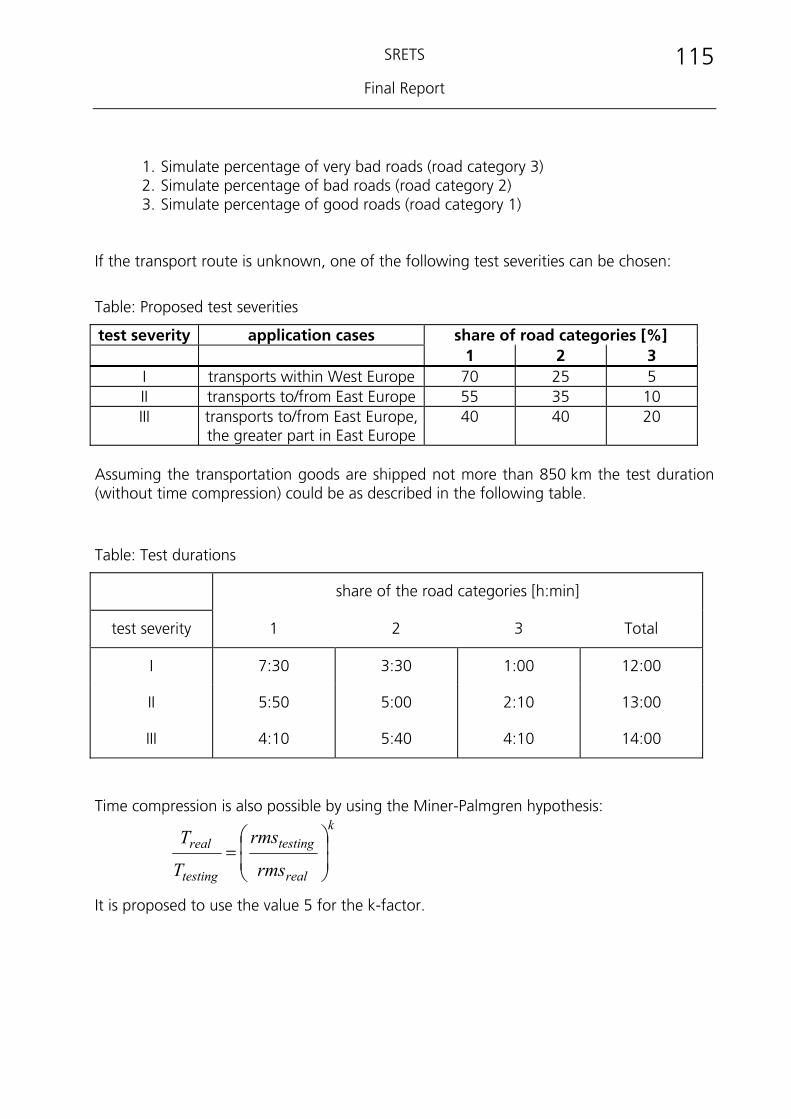
SRETS
Final Report
115
1. Simulate percentage of very bad roads (road category 3) 2. Simulate percentage of bad roads (road category 2) 3. Simulate percentage of good roads (road category 1)
If the transport route is unknown, one of the following test severities can be chosen:
Table: Proposed test severities
test severity application cases share of road categories [%] 1 2 3 I transports within West Europe 70 25 5 II transports to/from East Europe 55 35 10 III transports to/from East Europe,
the greater part in East Europe40 40 20
Assuming the transportation goods are shipped not more than 850 km the test duration (without time compression) could be as described in the following table.
Table: Test durations
share of the road categories [h:min]
test severity 1 2 3 Total
I 7:30 3:30 1:00 12:00
II 5:50 5:00 2:10 13:00
III 4:10 5:40 4:10 14:00
Time compression is also possible by using the Miner-Palmgren hypothesis:
k
real
testing
testing
real
rms
rms
T
T
=
It is proposed to use the value 5 for the k-factor.
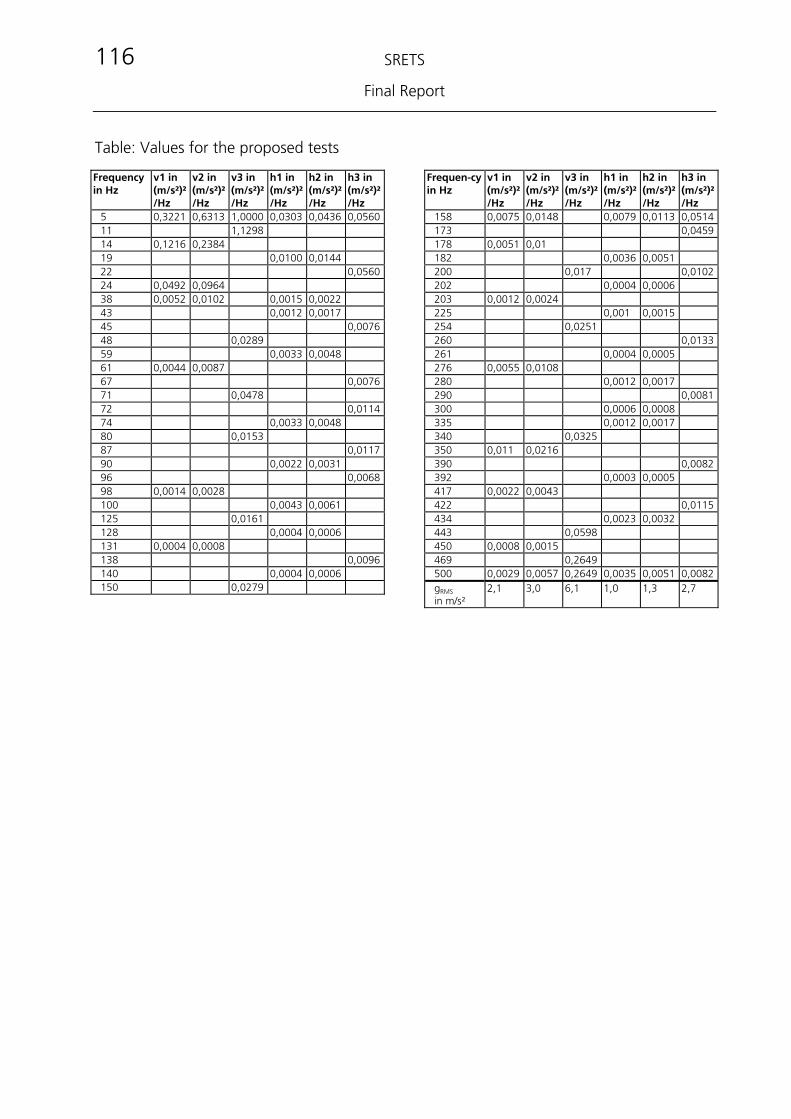
SRETS
Final Report
116
Table: Values for the proposed tests Frequency in Hz
v1 in (m/s²)²/Hz
v2 in (m/s²)²/Hz
v3 in (m/s²)²/Hz
h1 in (m/s²)²/Hz
h2 in (m/s²)²/Hz
h3 in (m/s²)²/Hz
5 0,3221 0,6313 1,0000 0,0303 0,0436 0,056011 1,1298 14 0,1216 0,2384 19 0,0100 0,0144 22 0,056024 0,0492 0,0964 38 0,0052 0,0102 0,0015 0,0022 43 0,0012 0,0017 45 0,007648 0,0289 59 0,0033 0,0048 61 0,0044 0,0087 67 0,007671 0,0478 72 0,011474 0,0033 0,0048 80 0,0153 87 0,011790 0,0022 0,0031 96 0,006898 0,0014 0,0028 100 0,0043 0,0061 125 0,0161 128 0,0004 0,0006 131 0,0004 0,0008 138 0,0096140 0,0004 0,0006 150 0,0279
Frequen-cy in Hz
v1 in (m/s²)²/Hz
v2 in (m/s²)²/Hz
v3 in (m/s²)²/Hz
h1 in (m/s²)²/Hz
h2 in (m/s²)²/Hz
h3 in (m/s²)²/Hz
158 0,0075 0,0148 0,0079 0,0113 0,0514173 0,0459178 0,0051 0,01 182 0,0036 0,0051 200 0,017 0,0102202 0,0004 0,0006 203 0,0012 0,0024 225 0,001 0,0015 254 0,0251 260 0,0133261 0,0004 0,0005 276 0,0055 0,0108 280 0,0012 0,0017 290 0,0081300 0,0006 0,0008 335 0,0012 0,0017 340 0,0325 350 0,011 0,0216 390 0,0082392 0,0003 0,0005 417 0,0022 0,0043 422 0,0115434 0,0023 0,0032 443 0,0598 450 0,0008 0,0015 469 0,2649 500 0,0029 0,0057 0,2649 0,0035 0,0051 0,0082gRMS
in m/s² 2,1 3,0 6,1 1,0 1,3 2,7
SRETS
Final Report
117
8 Annex 3: Test Schedules
Packaging Standard Test Methods for the Simulation of Supply Chain Conditions of Complete, Filled Transport Packages
This document has been issued within project n. SMT4-CT95-2005, denominated SRETS (“Source Reduction for European Testing Schedule”). The content has been approved by all the involved parties:
- FRAUNHOFER - Institut Für Chemische Technologie (ICT) - FRAUNHOFER - Institut Für Materialfluss Und Logistik (IML) - PIRA International - PACKFORSK - LNE – Laboratoire National D’Essais - BFSV – Beratung, Forschung, Systemplanung, Verpackung e.V. - Robert BOSCH GmbH - Tetra Pak Carton Systems AB - J & B Scotland - HUNTING Engineering Ltd.
A procedure aiming to replicate transportation environments will be added as a part of the whole task of the SRETS project. 1. Introduction The distribution of products is a multi step operation. Many different events occur in between the production site and the point of sale, where the goods eventually get ready for purchase by end users. Handling, storage, transportation are some of them and each and any may cause a damage to the goods to be delivered. Function of the packaging is, first of all, to protect the inner content toward all these events, though its role of conveying information and promotion is important as well. No damage of the packaging, as far as the inner good integrity is maintained, is then considered as a booster to improve its design, unless saleability is affected. The design of the packaging will have to be done in respect of different needs, including protection of the product. In order to minimise the quantity of packaging material to be used, a test routine reproducing the events from the producer to the consumers has to be defined and eventually performed in dedicated laboratories. The International Standard Organisation has been issuing a series of test methods that have to be followed when simulating some of the aforesaid events. 2. Scope These test methods establish a template to be followed when simulation of life conditions of goods to be distributed is necessary. The routine is a collection of individual tests, to be performed according to a sequence to be defined by operator (test designer) and orderer (packaging designer). An analysis of the actual supply chain, together with the identification of all the events that will occur will be the basis for this task.
SRETS
Final Report
118
Criteria of acceptance are listed as well, although it will be the parties involved in packaging design and test who may define tailored evaluation procedures. Most of the tests referred to in this routine have already been described within the International Standards Organisation (ISO). A guide on how to handle them is contained in the document. The test simulating the transport conditions of goods is specifically described in a dedicated procedure to be referred to as a recommendation for EC Mechanical Testing Committee. No previous procedure exists. 3. References The following ISO standard procedures are referred to. 2206, Packaging - Complete, filled transport packages - Identification of parts when testing. 2233, Packaging - Complete, filled transport packages - Conditioning for testing 2234, Packaging - Complete, filled transport packages - Stacking tests using static load 2244, Packaging - Complete, filled transport packages - Horizontal impact tests (horizontal or inclined plane test; pendulum test) 2247, Packaging - Complete, filled transport packages – Vibration test at fixed low frequency 2248, Packaging - Complete, filled transport packages - Vertical impact test by dropping 2872, Packaging - Complete, filled transport packages - Compression test 2874, Packaging - Complete, filled transport packages - Stacking tests using compression tester 8768, Packaging - Complete, filled transport packages – Toppling Test 4180/1, Packaging - Complete, filled transport packages - General rules for the compilation of performance test schedule - Part 1: General principles 4180/2, Packaging - Complete, filled transport packages - General rules for the compilation of performance test schedule – Part 2: Quantitative data Other standards are used during the issuing of the document. They are collected in Appendix 1. National standards are listed as well. 4. Terminology General definitions will be found in Test Method ISO 2206. Other specific terms are: Case - box of plastic, cardboard, wood, metal used for protection during delivery. Good – the product item, ready for sale. Operator - the person in charge of designing the routine and performing tests. Orderer - the person asking for the tests to be performed, in order to design the optimised packaging. Supply chain - the whole system to distribute goods from production site to end-users. Transit unit – box of plastic, cardboard, wood, metal used for protection during delivery. 5. Events to be replicated The test routine is to simulate mechanical and climatic conditions of the particular supply chain that the delivered good will experience during its lifetime. This chain has then to be analysed in each and any aspect so that all the different events that can cause damage may be reproduced. To each of the events, a test procedure will be coupled. 5.1. Environment It’s clear that peculiar environmental conditions may affect performance of transit units, then resulting in unacceptable damage of the deliveries. Temperature and Relative Humidity are then two parameters to be checked and taken into account when simulating the supply chain. A tailored ISO procedure is existing.
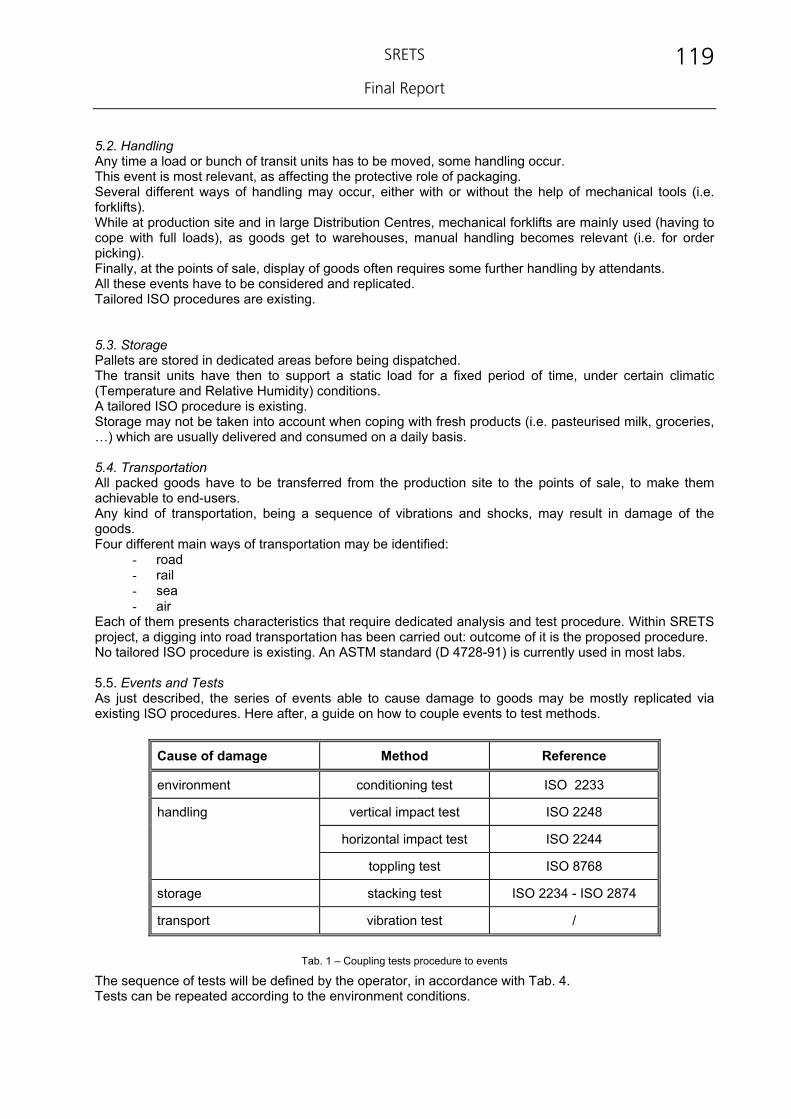
SRETS
Final Report
119
5.2. Handling Any time a load or bunch of transit units has to be moved, some handling occur. This event is most relevant, as affecting the protective role of packaging. Several different ways of handling may occur, either with or without the help of mechanical tools (i.e. forklifts). While at production site and in large Distribution Centres, mechanical forklifts are mainly used (having to cope with full loads), as goods get to warehouses, manual handling becomes relevant (i.e. for order picking). Finally, at the points of sale, display of goods often requires some further handling by attendants. All these events have to be considered and replicated. Tailored ISO procedures are existing. 5.3. Storage Pallets are stored in dedicated areas before being dispatched. The transit units have then to support a static load for a fixed period of time, under certain climatic (Temperature and Relative Humidity) conditions. A tailored ISO procedure is existing. Storage may not be taken into account when coping with fresh products (i.e. pasteurised milk, groceries, …) which are usually delivered and consumed on a daily basis. 5.4. Transportation All packed goods have to be transferred from the production site to the points of sale, to make them achievable to end-users. Any kind of transportation, being a sequence of vibrations and shocks, may result in damage of the goods. Four different main ways of transportation may be identified:
- road - rail - sea - air
Each of them presents characteristics that require dedicated analysis and test procedure. Within SRETS project, a digging into road transportation has been carried out: outcome of it is the proposed procedure. No tailored ISO procedure is existing. An ASTM standard (D 4728-91) is currently used in most labs. 5.5. Events and Tests As just described, the series of events able to cause damage to goods may be mostly replicated via existing ISO procedures. Here after, a guide on how to couple events to test methods.
Cause of damage Method Reference
environment conditioning test ISO 2233
handling vertical impact test ISO 2248
horizontal impact test ISO 2244
toppling test ISO 8768
storage stacking test ISO 2234 - ISO 2874
transport vibration test /
Tab. 1 – Coupling tests procedure to events
The sequence of tests will be defined by the operator, in accordance with Tab. 4. Tests can be repeated according to the environment conditions.
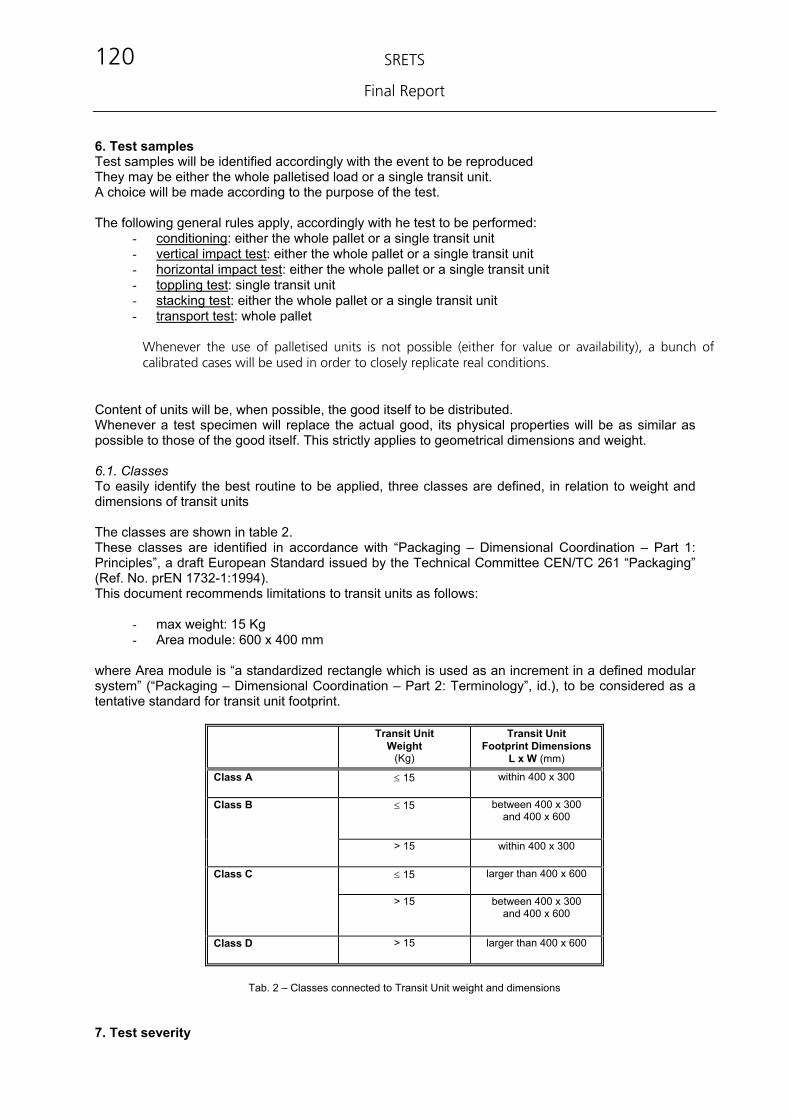
SRETS
Final Report
120
6. Test samples Test samples will be identified accordingly with the event to be reproduced They may be either the whole palletised load or a single transit unit. A choice will be made according to the purpose of the test. The following general rules apply, accordingly with he test to be performed:
- conditioning: either the whole pallet or a single transit unit - vertical impact test: either the whole pallet or a single transit unit - horizontal impact test: either the whole pallet or a single transit unit - toppling test: single transit unit - stacking test: either the whole pallet or a single transit unit - transport test: whole pallet
Whenever the use of palletised units is not possible (either for value or availability), a bunch of calibrated cases will be used in order to closely replicate real conditions.
Content of units will be, when possible, the good itself to be distributed. Whenever a test specimen will replace the actual good, its physical properties will be as similar as possible to those of the good itself. This strictly applies to geometrical dimensions and weight. 6.1. Classes To easily identify the best routine to be applied, three classes are defined, in relation to weight and dimensions of transit units The classes are shown in table 2. These classes are identified in accordance with “Packaging – Dimensional Coordination – Part 1: Principles”, a draft European Standard issued by the Technical Committee CEN/TC 261 “Packaging” (Ref. No. prEN 1732-1:1994). This document recommends limitations to transit units as follows:
- max weight: 15 Kg - Area module: 600 x 400 mm
where Area module is “a standardized rectangle which is used as an increment in a defined modular system” (“Packaging – Dimensional Coordination – Part 2: Terminology”, id.), to be considered as a tentative standard for transit unit footprint.
Transit Unit Weight
(Kg)
Transit Unit Footprint Dimensions
L x W (mm) Class A ≤ 15 within 400 x 300
Class B ≤ 15 between 400 x 300 and 400 x 600
> 15 within 400 x 300
Class C ≤ 15 larger than 400 x 600
> 15 between 400 x 300 and 400 x 600
Class D > 15 larger than 400 x 600
Tab. 2 – Classes connected to Transit Unit weight and dimensions
7. Test severity
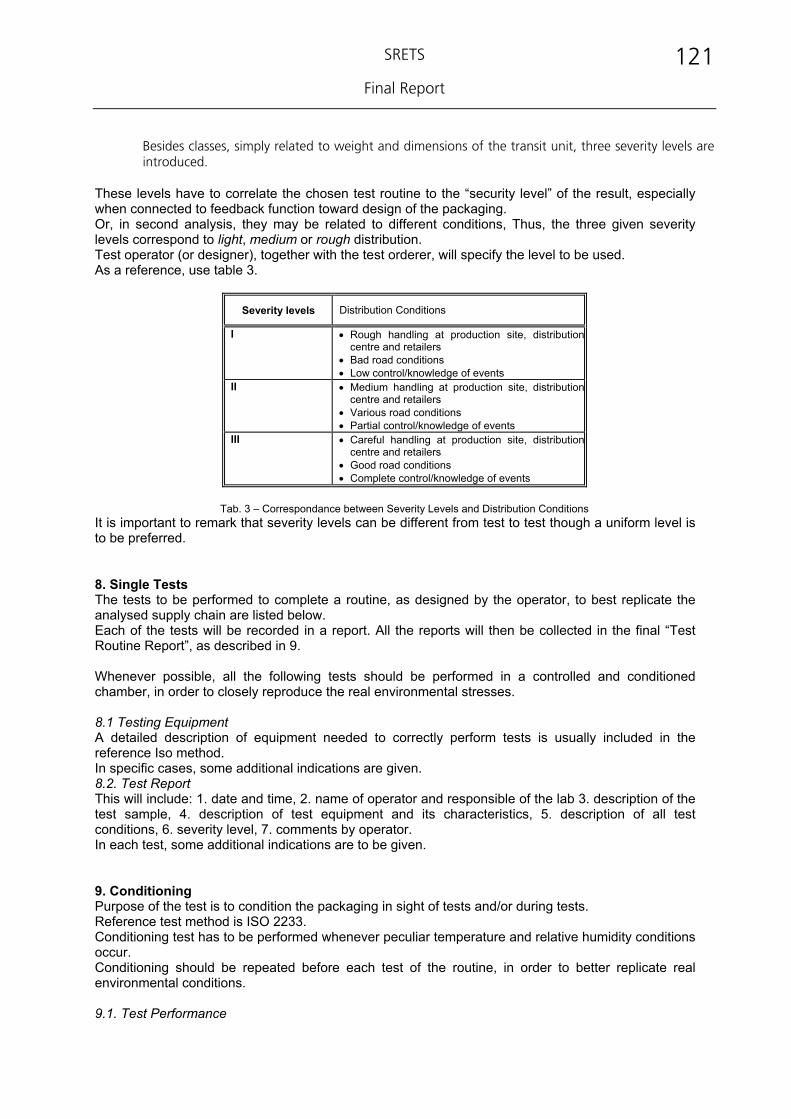
SRETS
Final Report
121
Besides classes, simply related to weight and dimensions of the transit unit, three severity levels are introduced.
These levels have to correlate the chosen test routine to the “security level” of the result, especially when connected to feedback function toward design of the packaging. Or, in second analysis, they may be related to different conditions, Thus, the three given severity levels correspond to light, medium or rough distribution. Test operator (or designer), together with the test orderer, will specify the level to be used. As a reference, use table 3.
Severity levels Distribution Conditions
I • Rough handling at production site, distributioncentre and retailers
• Bad road conditions • Low control/knowledge of events
II • Medium handling at production site, distributioncentre and retailers
• Various road conditions • Partial control/knowledge of events
III • Careful handling at production site, distributioncentre and retailers
• Good road conditions • Complete control/knowledge of events
Tab. 3 – Correspondance between Severity Levels and Distribution Conditions
It is important to remark that severity levels can be different from test to test though a uniform level is to be preferred. 8. Single Tests The tests to be performed to complete a routine, as designed by the operator, to best replicate the analysed supply chain are listed below. Each of the tests will be recorded in a report. All the reports will then be collected in the final “Test Routine Report”, as described in 9. Whenever possible, all the following tests should be performed in a controlled and conditioned chamber, in order to closely reproduce the real environmental stresses. 8.1 Testing Equipment A detailed description of equipment needed to correctly perform tests is usually included in the reference Iso method. In specific cases, some additional indications are given. 8.2. Test Report This will include: 1. date and time, 2. name of operator and responsible of the lab 3. description of the test sample, 4. description of test equipment and its characteristics, 5. description of all test conditions, 6. severity level, 7. comments by operator. In each test, some additional indications are to be given. 9. Conditioning Purpose of the test is to condition the packaging in sight of tests and/or during tests. Reference test method is ISO 2233. Conditioning test has to be performed whenever peculiar temperature and relative humidity conditions occur. Conditioning should be repeated before each test of the routine, in order to better replicate real environmental conditions. 9.1. Test Performance
SRETS
Final Report
122
To define Temperature and Relative Humidity values, refer to conditions in ISO 2233 (to be then mentioned in the final report). In case the same packaging has to be used for different conditions, apply the worst case. 9.2. Test Report This will also include: a. recorded parameters and intervals (T and RH % ranges) b. duration of the test. 10. Vertical Impact test Purpose of the test is to verify the attitude of the designed packaging to withstand vertical free falls, to occur during handling of both the full pallet and the packaging itself. Reference test method is ISO 2248. 10.1. Test Sample Sample of the test is in accordance with the purpose: a. the full load is to be used when simulating rough mechanical handling, both at the production site
and at the distribution centre. b. a single box represents the sample when replicating the handling at distribution centre (orders
picking) and at the retailer’s (point of sale) The equipment is to be suitable to the sample. In case of single transit units, classes will be applied. 10.3. Test Performance The test will be run, when possible, in the same environmental conditions in the particular supply chain. Perform the following steps: a. Lift the sample up to the following starting height (distance between the lowest point of the box and the impact surface). For transit units, follow the table 3 and 4:
Reference Starting Height
h0 (mm) Class A 80
Class B 70
Class C 60
Class D 50
Tab. 4 – Starting height for Shock (Drop) Test
according with transit unit class These values have been defined by analysis of existing shelf limitations currently in use in Europe. b. Let the sample free fall, with a sudden movement of the holding plate, not to let the sample itself twist. c. Check the packaging and content conditions. d. Whenever the content of the packaging is damaged, repeat the test once more after decreasing the falling height by 10%. For this step, use another sample. 9.4. Vertical Impact Test on Inclined Plane Apply the same conditions as above.
SRETS
Final Report
123
The height will be considered between the lowest point of the box and the theoretical impact point of the surface. Perform the test as above. 9.5. Test Report The report will include information on the package (and its Class), position of the impact surface, detected damage on the packaging and steps of the test. 10. Horizontal Impact Test Purpose of the test is to reproduce events that result in high horizontal acceleration (shock) on packaging. Typical events are: rail switching, sudden stops during transportation, mechanical handling (forklifts, etc.) in the warehouse, etc. Reference test method is ISO 2244. 10.1. Test equipment See ISO 2244. 10.2. Test sample The whole palletised load is to be used for the test. 10.3. Test performance The test will be run, when possible, in the same environmental conditions in the particular supply chain. 10.4. Test report The report will include starting height (or distance from shock plate) and speed at impact time. 11. Toppling Test Purpose of the test is to verify attitude of the packaging to withstand falls, due to handling at the end of supply chain. In particular, this procedure is applicable when case height is much larger than maximum base dimension and/or centre of gravity does not corresponds to geometrical centre. Reference test method is ISO 8768. 11.1. Test equipment See ISO 8768. 11.2. Test performance The test will be run, when possible, in the same environmental conditions of the particular supply chain. Get sure that each selected side and face has been the impact surface at least once. 11.3. Test report The report will include the number of falls, impact surface (panel and face) and detected damage. For the lattest, the check is done after each fall. 12. Stacking Test Purpose of the test is to verify attitude of the packaging to withstand static loads connected to storage conditions. Reference test method is ISO 2234 and ISO 2874. 12.1. Test Equipment A machine able to apply a constant load for a specified time will be used. Either load or displacement will have to be monitored via devoted cells. A record of load vs displacement diagram will be necessary.
SRETS
Final Report
124
Dimensions of the compressive plate have to be larger than the largest horizontal dimension of the sample. Both compressive and leaning plates have to be horizontal. Parallelism will be within a 2% tolerance. 12.2. Test sample Whenever a suitable equipment is available, the whole palletised load will represent the sample. In case smaller machines are to be used, a single box (or packaging) will be representative for the test. In the latter case, reference to define loads will be the bottom layer of the palletised unit. 12.3. Test performance The test will be run, when possible, in the same environmental conditions as the actual storage in the particular supply chain. The applied load will be the actual one. In case a single box is used as test sample, the total load of the pallet decreased of the bottom layer weight will be added. Duration of the test will be in accordance with the supply chain to be reproduced. This test will be repeated as many times as the number of storage periods in the products life. In case a conditioning chamber is not available, do perform the test at standard temperature and relative humidity conditions (25° C, 50% RH). 12.4. Test report The report will also include the diagram load vs displacement. 13. Transport simulation - Vibration test Purpose of the test is to verify the attitude of the packaging to withstand transport conditions, in accordance with the analysed supply chain. 13.1. Test Equipment A three-axis vibration table will be used. Whenever a single axis table is available, only the vertical acceleration will be simulated. A less reliable result will then be obtained. Max load of the vibrating table to be at least 1200 kg. Max displacement to be at least +/- 12.5 mm. The table will have frames not to let the load move over it, without decreasing effects of three-axis vibrations. A small gap (not larger than 10 cm) between pallet and frame will be present. 13.2. Test Sample A whole palletised load will represent the test sample. 13.3. Test Performance The load has not to be fixed onto the vibrating table with bolts and nuts: a better replication of the vibrations effect is guaranteed. 13.4. Test Report The chosen spectra will be reported, together with feedback funcion (whenever possible) of the actual spectra on the table. Detected damage will be reported, with exact specification of position of the transit unit onto the pallet, to identify weak points in pallet stacking. 14. Test Routine The aforementioned tests will be combined in a sequence that best replicate the real supply chain. Task of the orderer will be to provide all the information needed to identify events that occur and may result in damage of goods. Task of the operator will be to pick the most suitable tests and arrange them in a way to replicate the particular supply chain. Appendix 2 describes an example.
SRETS
Final Report
125
15. Acceptance Evaluation of tests will be made from a “commercial” viewpoint: “Shall the good be saleable or not ?”. The orderer, according with the expectations from and role of the packaging in the whole system may fix different criteria. 16. Test Report After performing all the tests, a report will be written as an official document. Here under follow the information that is to be included in the report: a. Description of goods b. Description of packaging (design, materials, dimensions, weight, etc.) c. Description of test samples (when different from actual good) and amount of. d. Description of the identified supply chain (by the orderer) e. Description of the choosen test routine (by the operator) f. List of standards used g. All the test reports (one per each test) h. Results of all tests i. Acceptance j. Comments and results
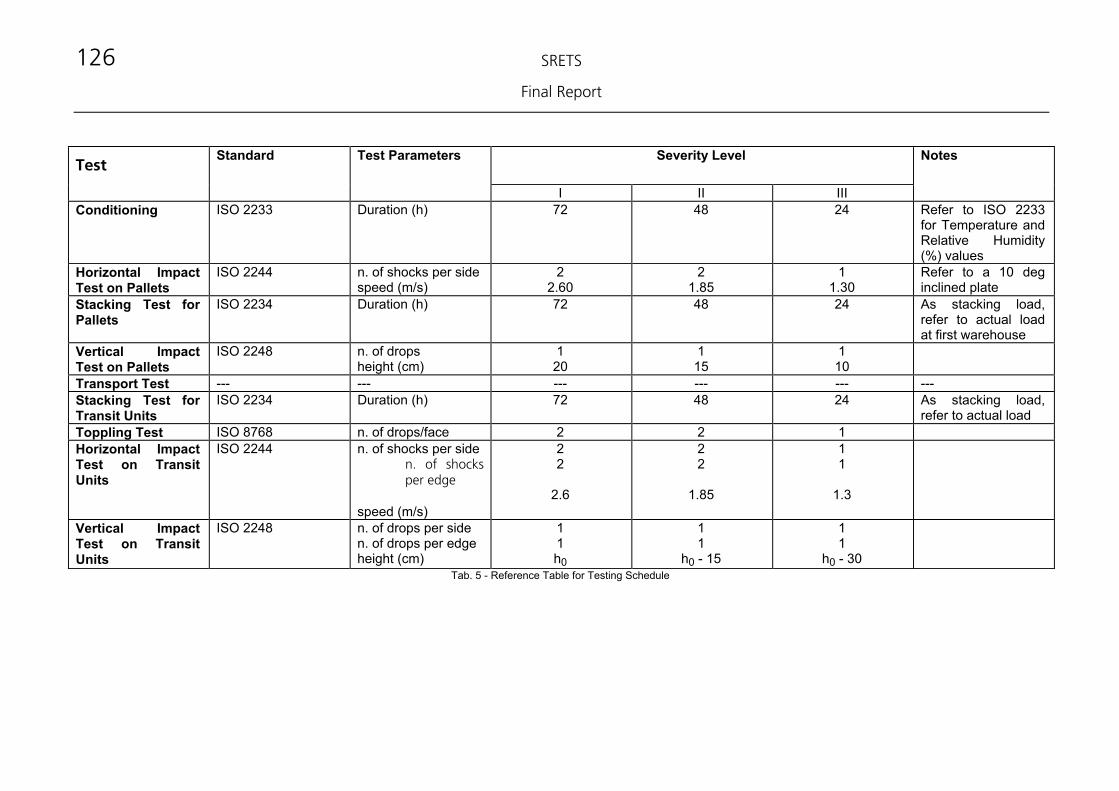
SRETS
Final Report
126
Test Standard Test Parameters Severity Level Notes
I II IIIConditioning ISO 2233 Duration (h) 72 48 24 Refer to ISO 2233
for Temperature and Relative Humidity (%) values
Horizontal Impact Test on Pallets
ISO 2244 n. of shocks per side speed (m/s)
2 2.60
2 1.85
1 1.30
Refer to a 10 deg inclined plate
Stacking Test for Pallets
ISO 2234 Duration (h) 72 48 24 As stacking load, refer to actual load at first warehouse
Vertical ImpactTest on Pallets
ISO 2248 n. of drops height (cm)
1 20
1 15
1 10
Transport Test --- --- --- --- --- ---Stacking Test for Transit Units
ISO 2234 Duration (h) 72 48 24 As stacking load, refer to actual load
Toppling Test ISO 8768 n. of drops/face 2 2 1 Horizontal Impact Test on Transit Units
ISO 2244 n. of shocks per side n. of shocks per edge
speed (m/s)
2 2
2.6
2 2
1.85
1 1
1.3
Vertical ImpactTest on Transit Units
ISO 2248 n. of drops per side n. of drops per edge height (cm)
1
h0
1 1
h0 - 15
1 1
h0 - 30
1
Tab. 5 - Reference Table for Testing Schedule

SRETS
Final Report
127
Appendix 1 – International Standards
Austrian Standards (OENORM) ISO 2206, Verpackung; Versandfertige Packstuecke; Bezeichnung von Flaechen, Kanten und Ecken fuer die Pruefung ISO 2233, Verpackung; Versandfertige Packstuecke; Klimatische Vorbehandlung fuer die Pruefung ISO 2234, Verpackung; Versandfertige Packstuecke; Stapelpruefung unter statischer Last EN 22244, Verpackung; Versandfertige Packstuecke; Horizontale Stosspruefung (waagrechte oder schiefe Ebene – Pendel) EN 22247, Verpackung; Versandfertige Packstuecke; Schwingpruefung mit niedriger Festfrequenz ISO 2248, Verpackung; Versandfertige Packstuecke; Vertikale Stosspruefung (freier Fall) ISO 2874, Verpackung; Versandfertige Packstuecke; Stapelpruefung mit Druckpruefmaschine Belgian Standards H 03-313 R, Emballages - Emballages d’expédition complets et pleins – Identification des Differentes Parties en Vue des Essais H 03-324 R, Verpakkingen – Complete, Gevulde Transpotverpakkingen – Horizontale Stootproeven (Proef op Horizontaal of Hellend Vlak; Aanstootproef) H 03-326 R, Verpakkingen – Complete, Gevulde Transpotverpakkingen – Trilproef met Vastgestelde lage Frequentie H 03-324 R, Verpakkingen – Complete, Gevulde Transpotverpakkingen – Vrije – Valproef H 03-324 R, Verpakkingen – Complete, Gevulde Transpotverpakkingen – algemene Regels voor het Opstellen van Beproevingsprogramma’s voor Gebruiksgeschikteheid – Deel 1: Algemene Principes H 03-324 R, Verpakkingen – Complete, Gevulde Transpotverpakkingen – algemene Regels voor het Opstellen van Beproevingsprogramma’s voor Gebruiksgeschikteheid – Deel 2: Kwantitatieve Gegevens Danish Standards Dutch Standards (NNI) NEN-ISO 2206, Verpakkingen; Complete, gevulde transportverpakkingen; Nummering van vlakken voor de beproeving NEN-ISO 2233, Verpakkingen; Complete, gevulde transportverpakkingen; Conditionering voor de beproeving NEN-ISO 2234, Verpakkingen; Complete, gevulde transportverpakkingen; Stapelproeven met statische belasting NEN-ISO 2244, Verpakkingen; Complete, gevulde transportverpakkingen; Stootproeven (horizontale of hellende stooproef; Slingerproef) NEN-ISO 2247, Verpakkingen; Complete, gevulde transportverpakkingen; Trilproef met een vaste lage frequentie NEN-ISO 2248, Verpakkingen; Complete, gevulde transportverpakkingen; Vrije-valproef NEN-ISO 2274, Verpakkingen; Complete, gevulde transportverpakkingen; Stapelproef met gebruikmaking van een drukbank English Standards Finnish Standards French Standards (Norme française - NF) H 00-042-2, Emballages d’expédition complets et pleins - Essai de choc vertical par chute par basculement H 00-057, Emballages d’expédition complets et pleins - Essai au tambour culbuteur H 00-058, Emballages d’expédition complets et pleins - Essai de compression localisée H 00-059, Emballages d’expédition complets et pleins - Essai d’impact localisée H 00-060, Emballages d’expédition complets et pleins - Programmes d’essais German Standards DIN EN 2 22 06, Verpackung; Versandfertige Packstücke; Bezeichnung von Flächen, Kanten und Ecken für die Prüfung DIN EN 2 22 33, Verpackung; Versandfertige Packstücke; Klimatische Vorbehandlung für die Prüfung DIN EN 2 22 34, Verpackung; Versandfertige Packstücke; Stapelprüfung unter statischer Last DIN EN 2 22 44, Verpackung; Versandfertige Packstücke; Horizontale Stoßprüfung (waagerechte oder schiefe Ebene; Pendel) DIN EN 2 22 47, Verpackung; Versandfertige Packstücke; Schwingprüfung mit niedriger Festfrequenz, DIN EN 2 22 48, Verpackung; Versandfertige Packstücke; Vertikale Stoßprüfung (freier Fall) DIN EN 2 28 72, Verpackung; Versandfertige Packstücke; Stauchprüfung DIN EN 2 28 73, Verpackung; Versandfertige Packstücke; Unterdruckprüfung DIN EN 2 28 74, Verpackung; Versandfertige Packstücke; Stapelprüfung mit Druckprüfmaschine DIN EN 2 28 75, Verpackung; Versandfertige Packstücke; Sprühwasserprüfung DIN EN 2 28 76, Verpackung; Versandfertige Packstücke; Umkipp-Prüfung (sequentiell) DIN EN 2 41 78, Verpackung; Versandfertige Packstücke; Probeversand; Aufzuzeichnende Angaben DIN EN 2 41 80/1, Verpackung; Versandfertige Packstücke; Allgemeine Regeln für die Erstellung von Prüfplänen; Teil 1: Allgemeine Grundsätze DIN EN 2 41 80/2, Verpackung; Versandfertige Packstücke; Allgemeine Regeln für die Erstellung von Prüfplänen; Teil 2: Beanspruchungsparameter DIN EN 2 83 18, Verpackung; Versandfertige Packstücke; Schwingprüfung mit variabler sinusförmiger Frequenz DIN EN 2 84 74, Verpackung; Versandfertige Packstücke; Tauchprüfung DIN EN 2 87 68, Verpackung; Versandfertige Packstücke; Umstürzprüfung
SRETS
Final Report
128
DIN ISO 1 05 31, Verpackung; Versandfertige Packstücke; Festigkeitsprüfung von Ladeeinheiten DIN 30786/1, Mechanisch-dynamische Belastungen; Wertesammlung/Datenbasis, Teil 1, Grundlagen E DIN 30787/2, Mechanisch-dynamische Belastungen; Messen und Auswerten, Teil 2, Datenerfassung und Anforderungen an Meßeinrichtungen, Draft E DIN 30787/3, Mechanisch-dynamische Belastungen; Messen und Auswerten, Teil 3, Datengültigkeitsüberprüfung und Datenaufbereitung zur Auswertung, Draft E DIN 30787/4, Mechanisch-dynamische Belastungen; Messen und Auswerten, Teil 4, Datenauswertung, Draft Greek Standards Irish Standards Italian Standards (Norme UNI) U38.03.012.0 - Imballaggi di trasporto completi e pieni. Prove di vibrazione sinusoidale a frequenza variabile 5607 - Imballaggi di spedizione a base rettangolare. Dimensioni esterne ed interne e modalita’ di sistemazione degli imballaggi sulle palette unificate. 7970/5 - Prove sugli imballaggi di trasporto completi e pieni. Prova d’urto orizzontale mediante piano inclinato o pendolo. 7970/13 - Imballaggi di trasporto completi e pieni - Prove di vibrazioni casuali EN 22206 – Imballaggi. Imballaggi di trasporto completi e pieni. Identificazione delle parti per le prove. EN 22233 – Imballaggi. Imballaggi di trasporto completi e pieni. Condizionamento per l’esecuzione delle prove. EN 22234 – Imballaggi. Imballaggi di trasporto completi e pieni. Prove di accatastamento con carico statico EN 22244 – Imballaggi. Imballaggi di trasporto completi e pieni. Prove d’urto orizzontali (prova su piano orizzontale o inclinato. Prova con pendolo) EN 22247 – Imballaggi. Imballaggi di trasporto completi e pieni. Prova di vibrazione a bassa frequenza prestabilita. EN 22248 –Imballaggi di trasporto completi e pieni. Prova d’impatto verticale media caduta. EN 22872 – Imballaggi. Imballaggi di trasporto completi e pieni. Prova di compressione. EN 22873 – Imballaggi. Imballaggi di trasporto completi e pieni. Prova a bassa pressione. EN 22874 – Imballaggi. Imballaggi di trasporto completi e pieni. Prova di accatastamento mediante macchina di compressione. EN 24178 – Imballaggi di trasporto completi e pieni. Prove relative ai sistemi di distribuzione. Informazioni da registrare. EN 28768 – Imballaggi di trasporto completi e pieni. Prova di ribaltamento. EN 24180/1 – Imballaggi di trasporto completi e pieni. Regole generali per la definizione di programmi di prova per l’attitudine all’uso. Principi generali. EN 24180/2 – Imballaggi di trasporto completi e pieni. Regole generali per la definizione di programmi di prova per l’attitudine all’uso. Dati quantitativi. EN 28318 – Imballaggi. Imballaggi di trasporto completi e pieni. Prove di vibrazione sinusoidale a frequenza variabile. Portoguese Standards Spanish Standards (Asociacion Espanola de Normalizacion y certificacion – AENOR) UNE–EN 22206, Embalajes. Embalajes de expedicion completos y llenos. Identificacion de las diferentes partes para su ensayo UNE–EN 22233, Embalajes. Embalajes de expedicion completos y llenos. Acondicionamento para ensayos UNE–EN 22234, Embalajes. Embalajes de expedicion completos y llenos. Ensayo de apilamiento utilizando una carga estatica UNE–EN 22244, Embalajes. Embalajes de expedicion completos y llenos. Ensayos de choque horizontal (ensayo sobre plano horizontal o inclinado. Ensayo de pendulo) UNE–EN 22247, Embalajes. Embalajes de expedicion completos y llenos. Ensayo de vibracion a baja frecuencia fija UNE–EN 22248, Embalajes. Embalajes de expedicion completos y llenos. Ensayo de choque vertical por caida libre UNE–EN 24180-1, Embalajes de expedicion completos y llenos. Reglas generales para el establecimiento de los programas de ensayo de aptitud al uso. Parte 1: principios generales UNE–EN 24180-2, Embalajes de expedicion completos y llenos. Reglas generales para el establecimiento de los programas de ensayo de aptitud al uso. Parte 2: datos cuantitativos Swedish Standards American Standards (ASTM) D 642, Test Method for Determining Compressive Resistance of Shipping Containers, Components, and Unit Loads D 782; Test Method for Shipping Containers in Revolving Hexagonal Drum D 996, Terminology of Packaging and Distribution Environments D 999, Test Methods for Vibration Testing of Shipping Containers D 1083, Test Methods for Mechanical Handling of Unitized Loads and Large Shipping Cases and Crates D 4003, Methods of Programmable Horizontal Impact Test for Shipping Containers D 4169; Practice for Performance Testing of Shipping Containers and Systems D 4332, Practice for Conditioning Containers, Packages, or packaging Components for Testing D 4728, Test Method for Random Vibration Testing of Shipping Containers D 5276, Test Method for Drop Test of Loaded Containers by Free Fall D 5277, Test Method for Performing Programmed Horizontal Impacts Using an Inclined Tester