source rock evaluation and hydrocarbon potential in the tano basin
TRANSCRIPT
International Journal of Oil, Gas and Coal Engineering 2014; 2(5): 66-77
Published online November 10, 2014 (http://www.sciencepublishinggroup.com/j/ogce)
doi: 10.11648/j.ogce.20140205.11
Source rock evaluation and hydrocarbon potential in the Tano basin, South Western Ghana, West Africa
D. Atta-Peters*, P. Garrey
Department of Earth Science, University of Ghana, P. O. Box LG 58, Legon, Accra, Ghana
Email address: [email protected] (D. Atta-Peters), [email protected] (P. Garrey)
To cite this article: D. Atta-Peters, P. Garrey. Source Rock Evaluation and Hydrocarbon Potential in the Tano Basin, South Western Ghana, West Africa.
International Journal of Oil, Gas and Coal Engineering. Vol. 2, No. 5, 2014, pp. 66-77. doi: 10.11648/j.ogce.20140205.11
Abstract: Three exploratory oil wells (ST-9H, WCTP-2X and WT-1X) from the Tano Basin, south-western Ghana, have
been evaluated for their hydrocarbon generation potential by the use of geochemical analysis (TOC, Rock-Eval pyrolysis). The
analytical results of samples revealed that the wells have fair to good total organic carbon (TOC) contents, suggesting that
there exist conditions in the Basin that favoured organic matter production and preservation. There is a variation in kerogen
types and this may be attributed to the relative stratigraphic positions of the outcrops within the basin. Thermal maturity
indicated that samples from the well WCTP-2X and WT-1X, are immature and that from ST-9H show late immature to mature
stage of the hydrocarbon generation process. Most of the samples from the wells with the exception of two samples from ST-
9H are non-indigenous (migrated). Hydrocarbon generation potential from all three wells particularly ST-9H display sufficient
organic matter contents to produce oil and gas. The hydrocarbon potential is good and capable to make expulsions of oil and
gas from the wells. Kerogen Type IV, III and II are present in well ST-9Hand Types II and III kerogen in wells WCTP-2X and
WT-1X.
Keywords: Total Organic Carbon (TOC), Tano Basin, Vitrinite Reflectance, Hydrocarbon Potential, Genetic Potential,
Kerogen
1. Introduction
The Tano Basin occupies an area of at least 3000 km2, with
the onshore component estimated at about 1165 km2 [1]. The
Tano structure is located approximately 39 km from the
Ghana coast and approximately 24 km east of the Ghana-
Cote d’Ivoire border, with a water depth in the area ranging
from 91 m to 125 m. The Tano Basin began its tectonic-
sedimentary evolution as an extensional rift basin modified
by wrench tectonism. This rifting was initiated by complex
movements due to the separation of the continents of South
America and Africa [2]
The Tano Basin located in southwestern Ghana, has been a
major target for oil and gas exploration since 1896. Since
then the basin has been subjected to serious exploration
activities until 1978 when the first truly deepwater well
(greater than 1000 ft) was drilled some 40 miles offshore.
With further advances in seismic imaging technologies, more
complex and subtle geological features were identified and
mapped. The hydrocarbon potential of the Tano Basin has
since been known based on onshore oil seeps, but the first
major discovery was made in 2007 (Jubilee Field).
This work aims at evaluating the quantity of organic
matter, characterizing the type of kerogen as well as
determining its maturity status in order to deduce the
Hydrocarbon potential of the basin, from organic
geochemical data from wells ST-9H, WCTP-2X and WT-1X.
1.1. Geologic Setting
The Tano-Cape Three Points Basin is a Cretaceous wrench
modified pull-apart basin. It is bounded by the African main
land to the north, Saltpond Basin in the East and the St. Paul
Fracture Zone in the West. The Tano basin resides on a
transform margin, between the Romanche and St Paul
transform faults and is the eastern extension of the Cote
d’Ivoire-Ghana Basin and formed because of trans-tensional
movement during the separation of Africa and South America,
and opening of the Atlantic in the Albian. Active rifting and
subsidence during this period resulted in the formation of a
deep basin [3]. The Tano basin was part of an extensional rift
basin system which received substantial clastic sediment
input from the African continent. In the Upper Cretaceous,
the Tano basin became a depositional focus, and a thick
clastic sequence consisting of fluvial and lacustrine facies
67 D. Atta-Peters and P. Garrey: Source Rock Evaluation and Hydrocarbon Potential in the Tano Basin,
was deposited. This sequence, in addition to the thin Tertiary
section, provided adequate thickness to mature the
Cretaceous source rocks in the central and western region of
the Tano Basin. Rapid drowning of the West African
Transform Margin created ideal conditions for deposition of
thick rich source rock in the Cenomanian. Creation of a deep
basin with significant river systems onshore, led to the
deposition of large turbidite fan/channel complexes (forming
stratigraphic traps for oil) in deep water.
The basin (Cretaceous to Eocene) forms part of the broad
Apollonian Formation occupying the southwest corner of
Ghana and larger portion of southeast Côte d’Ivoire. The
rocks onshore consist of alternating sands, clays and
limestones with gentle dips overlying the Precambrian
metamorphosed Birimian System composed of schist,
phyllite and greywackes. At depth, the sands and clays a
more compact and pass into sandstones and shales.
The basin comprises a thick Upper Cretaceous drift section
which is dominated by basin floor fans, stratigraphic traps
and channel systems. The rift section comprises shallow
marine to continental deposits. The working play type is the
Cretaceous Play, which consists of Cenomanian
and Albian shales as source rocks with Turonian slope fan
turbidite sandstones and Albian sandstones in tilted fault
blocks as reservoirs. Trapping is both stratig
structural [3]. As reservoir rocks are predicted to be in close
proximity to the source rocks, a minimal hydrocarbon
migration pathway is assumed. The prolific Tano Basin is
thus the results of:
� an exceptionally favourable coincidence of
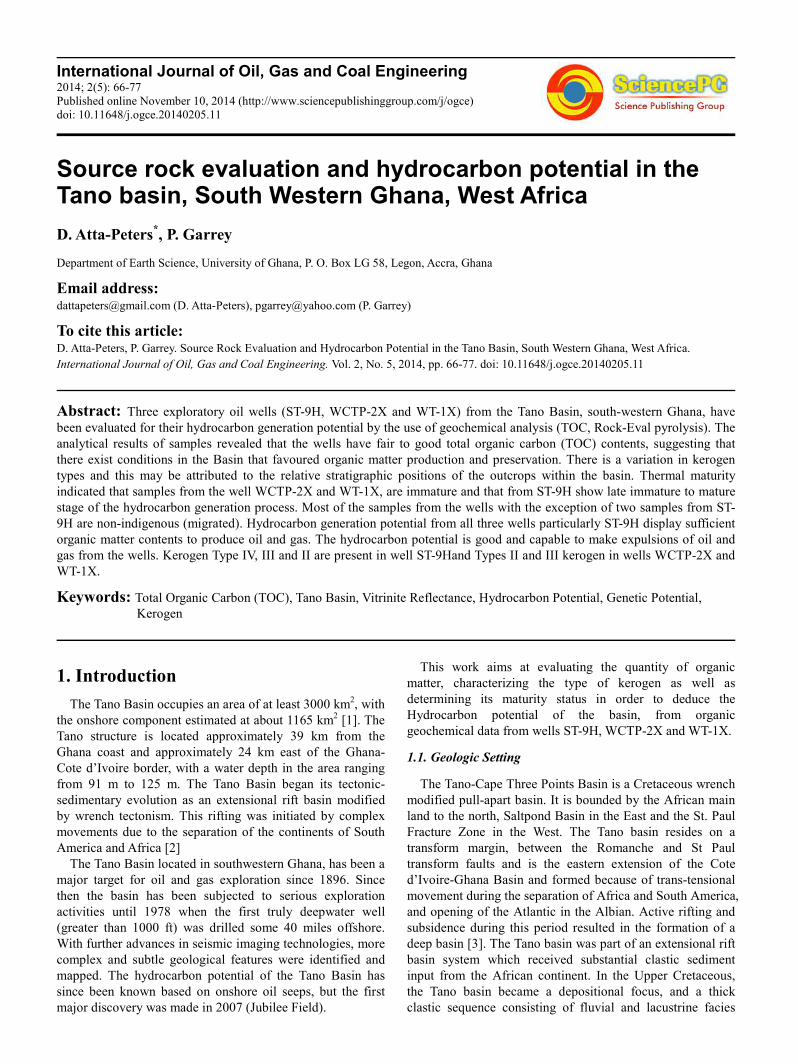
Figure 1. Map of offshore sedimentary basins showing studied well in the Tano basin.
Peters and P. Garrey: Source Rock Evaluation and Hydrocarbon Potential in the Tano Basin,
South Western Ghana, West Africa
was deposited. This sequence, in addition to the thin Tertiary
section, provided adequate thickness to mature the
source rocks in the central and western region of
the Tano Basin. Rapid drowning of the West African
Transform Margin created ideal conditions for deposition of
thick rich source rock in the Cenomanian. Creation of a deep
ems onshore, led to the
deposition of large turbidite fan/channel complexes (forming
part of the broad
the southwest corner of
r portion of southeast Côte d’Ivoire. The
rocks onshore consist of alternating sands, clays and
limestones with gentle dips overlying the Precambrian
metamorphosed Birimian System composed of schist,
phyllite and greywackes. At depth, the sands and clays are
more compact and pass into sandstones and shales. [4].
The basin comprises a thick Upper Cretaceous drift section
which is dominated by basin floor fans, stratigraphic traps
and channel systems. The rift section comprises shallow
eposits. The working play type is the
Cretaceous Play, which consists of Cenomanian-Turonian
and Albian shales as source rocks with Turonian slope fan
turbidite sandstones and Albian sandstones in tilted fault
blocks as reservoirs. Trapping is both stratigraphic and
As reservoir rocks are predicted to be in close
proximity to the source rocks, a minimal hydrocarbon
The prolific Tano Basin is
an exceptionally favourable coincidence of regional
geological factors
� rich source rocks deposited and matured for oil
� tectonics and structural geology establishing
framework for focusing charge
� world class turbidite reservoirs deposited in giant
stratigraphic traps
� highly effective seals preservin
discovery and development
2. Methodology
2.1. Samples
The study was carried out on 54 samples from well South
Tano - 9H (ST-9H) within intervals 1470 ft
samples from well WCTP - 2X within intervals
9440 ft and 33 samples from intervals 5000 ft
well WT – 1X (Figure 1). All three wells are in the Tano
Basin and their geochemical data
Appendix 1(a,b,c) respectively.
The samples were processed in the Organic
Laboratory, Ghana National Petroleum Corporation (GNPC)
where they were oven-dried overnight at 110°C, and
pulverized with the aid of pestle and mortar. The crushed
rock samples were analyzed geochemically by TOC contents,
Rock-Eval pyrolysis techniques.
hydrocarbon generating potential,
geochemically investigated to determine the total organic
content, identify organic matter type,
maturity of organic matter.
Map of offshore sedimentary basins showing studied well in the Tano basin.
Peters and P. Garrey: Source Rock Evaluation and Hydrocarbon Potential in the Tano Basin,
rich source rocks deposited and matured for oil
tectonics and structural geology establishing
framework for focusing charge
world class turbidite reservoirs deposited in giant
highly effective seals preserving oil and gas for
tudy was carried out on 54 samples from well South
within intervals 1470 ft -7260 ft, 55
2X within intervals 3980 ft –
and 33 samples from intervals 5000 ft – 9840 ft of
. All three wells are in the Tano
geochemical data are summarized in
the Organic Geochemistry
Laboratory, Ghana National Petroleum Corporation (GNPC),
dried overnight at 110°C, and
pulverized with the aid of pestle and mortar. The crushed
rock samples were analyzed geochemically by TOC contents,
s techniques. To characterize their
hydrocarbon generating potential, the samples were
determine the total organic
, identify organic matter type, and determine the
International Journal of Oil, Gas and Coal Engineering 2014;
2.2. Total Organic Carbon and Rock Eval Analysis
About 100 mg of each sample was analyzed
Eval II instrument. The output from this sensor provides the
peak data for the S1 and S2 indices. At low temperatures
isothermally at 300 º C for 4 minutes the free hydrocarbons
in the sample were volatilized and S1 measured
Ionization Detector (FID). At increasing temperatures by
programmed pyrolysis in an inert helium atmosphere at 25
ºC/min to 600ºC, hydrocarbons are expelled from the
kerogen itself by cracking. This peak was measured as the S
The temperature at which the maximum generation of
cracked hydrocarbons occurred at S2 peak is termed Tmax
[5]. Tmax is a maturation parameter that is kerogen
dependent. The S3 peak which is a result of CO
from the kerogen cracking and trapped between 300
was detected with a thermal conductivity detector (TCD).
The calibration data for the thermal models includes
vitrinite reflectance and the temperature.
measurement was not done, modelled vitrinite reflectance was
derived from the equation RO % = (0.018* Tmax)
3. Results and Discussion
Table 1. Guidelines for interpreting source rock quantity, quality and
maturation, and commonly used Rock-Eval parameters. SOURCE:
[10], [11], [12], [13]}.
Quantity TOC S1(mg HC/g
rock)
Poor <0.5 <0.5
Fair 0.5-1 0.5-1
Good 1-2 1-2
Very Good 2-4 2-4
Excellent >4 >4
Quality HI (mg HC/g TOC) S2/S3
None <50 <1
Gas 50-200 1-5
Gas and Oil 200-300 5-10
Oil 300-600 10-15
Oil >600 >15
Maturation Ro (%) Tmax (0C)
Immature 0.2-0.6 <435
Early Mature 0.6-0.65 435-445
Peak Mature 0.65-0.9 445-450
Late Mature 0.9-1.35 450-470
Post Mature >1.35 >470
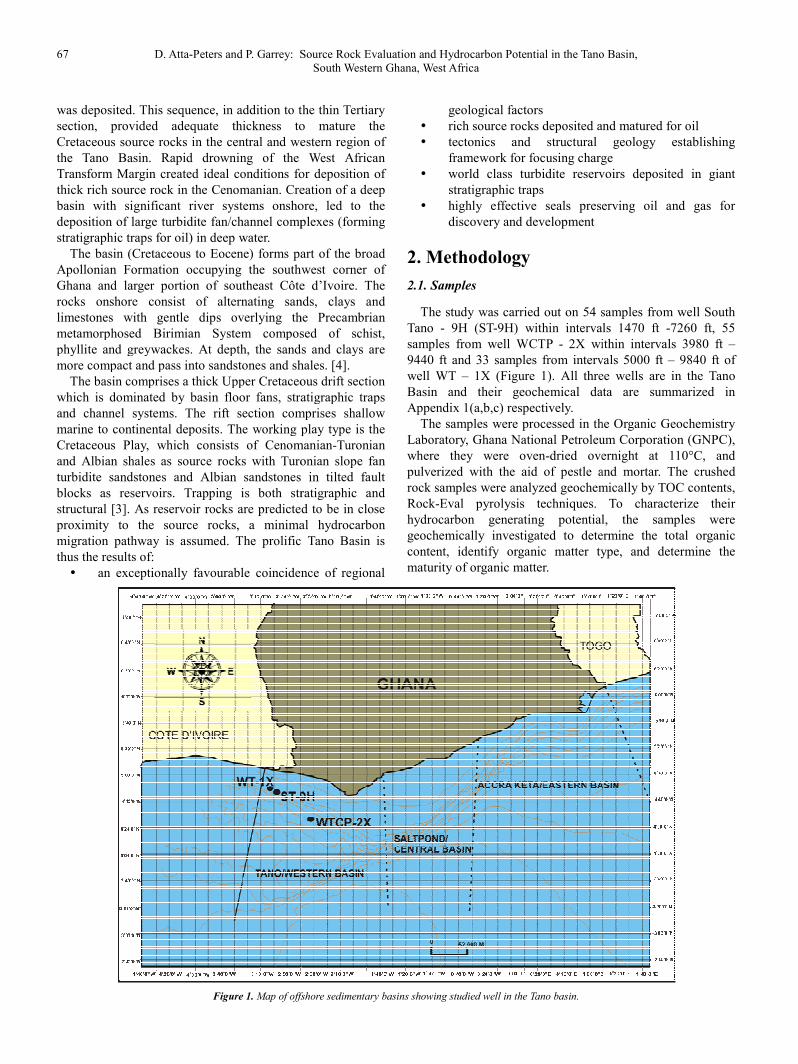
Figure 2. Plot of S2 versus TOC indicating hydrocarbon potentiality and source rock efficiency.
International Journal of Oil, Gas and Coal Engineering 2014; 2(5): 66-77
and Rock Eval Analysis
analyzed by using Rock
output from this sensor provides the
indices. At low temperatures kept
free hydrocarbons
measured with a Flame
. At increasing temperatures by
elium atmosphere at 25
ºC/min to 600ºC, hydrocarbons are expelled from the
kerogen itself by cracking. This peak was measured as the S2.
maximum generation of
peak is termed Tmax
[5]. Tmax is a maturation parameter that is kerogen-
peak which is a result of CO2 produced
from the kerogen cracking and trapped between 300-390 ºC,
ed with a thermal conductivity detector (TCD).
The calibration data for the thermal models includes
vitrinite reflectance and the temperature. Since vitrinite
odelled vitrinite reflectance was
% = (0.018* Tmax) -7.16 [6]
Guidelines for interpreting source rock quantity, quality and
Eval parameters. SOURCE: {[8], [9],
S2(mg HC/g
rock)
<2.5
2.5-5.0
5-10
10-20
>20
Kerogen Type
IV
III
II/III
II
I
TAI
1.5-2.6
2.6-2.6
2.7-2.9
2.9-3.3
>3.3
In Geochemical analysis, the purpose of geochemical
logging and cross plots is to measure the following
parameters relating to source rock evaluation in sedimentary
rocks: quantity of organic matter, quality of the organic
matter and the thermal maturation of the organic
knowledge of these three parameters permits accurate
evaluation of the source rock geochemistry and hydrocarbon
potential in the Tano Basin. Scatter plots are actually cross
plots whereby the parameters obtained from pyrolysis are
plotted against each other and are used in interpreting the
properties and hydrocarbon potential of the study area. Four
parameters S1, free hydrocarbon: S2
resulting from the cracking of kerogen; S
and Tmax, the temperature at which the maximum generation
of the products of pyrolysis occurs were used to calculate the
following:
OI, oxygen index [OI = (S3/TOC) x 100)]
HI, hydrogen index [HI = (S2/TOC) x 100]. Plot of HI
versus OI can be used to deduce the type of organic matte
present in the source rock [7]
PI, production index [PI = S1 / (S1
Hydrogen richness in the kerogen =
Genetic potential of the source rock = S
The TOC contents and Rock-Eval data results for the
studied samples of the 3 exploratory
Well WCTP – 2X and WT – 1X are presented in the
Appendix 1 (a,b,c). Table 1 below serves as a guide for
interpreting source rock quantity, quality and maturation, and
commonly used Rock-Eval parameters.
3.1. Organic Richness and Hydrocarbon Potentiality
The organic richness and potential of a rock sample is
evaluated by measuring the amount of total organic carbon
TOC in the whole rock and pyrolysis derived S
samples [14]. [10] reported that samples which contain TOC
less than 0.5 wt % and S2 less than 2.5 mg/g are considered
poor source rocks. Samples contain from 0.5 to 1.0 wt %
TOC and S2 from 2.5 to 5 mg/g are fair source rocks
those containing TOC from 1-2 wt % and S
are good source rocks and samples that contain more than 2
wt% TOC and S2>10 mg/g are considered very good source
rocks.
versus TOC indicating hydrocarbon potentiality and source rock efficiency.
68
analysis, the purpose of geochemical
logging and cross plots is to measure the following
parameters relating to source rock evaluation in sedimentary
rocks: quantity of organic matter, quality of the organic
matter and the thermal maturation of the organic matter. The
knowledge of these three parameters permits accurate
evaluation of the source rock geochemistry and hydrocarbon
potential in the Tano Basin. Scatter plots are actually cross
plots whereby the parameters obtained from pyrolysis are
nst each other and are used in interpreting the
properties and hydrocarbon potential of the study area. Four
, pyrolyzed hydrocarbon
resulting from the cracking of kerogen; S3, quantity of CO2,
t which the maximum generation
of the products of pyrolysis occurs were used to calculate the
/TOC) x 100)]
/TOC) x 100]. Plot of HI
versus OI can be used to deduce the type of organic matter
+ S2)]
Hydrogen richness in the kerogen = S2/S3
Genetic potential of the source rock = S1 + S2
Eval data results for the
studied samples of the 3 exploratory wells, Well ST – 9H,
1X are presented in the
Table 1 below serves as a guide for
interpreting source rock quantity, quality and maturation, and
Eval parameters.
Hydrocarbon Potentiality
The organic richness and potential of a rock sample is
evaluated by measuring the amount of total organic carbon
TOC in the whole rock and pyrolysis derived S2 of the rock
orted that samples which contain TOC
less than 2.5 mg/g are considered
Samples contain from 0.5 to 1.0 wt %
from 2.5 to 5 mg/g are fair source rocks and
2 wt % and S2 from 5-10 mg/g
amples that contain more than 2
>10 mg/g are considered very good source
69 D. Atta-Peters and P. Garrey: Source Rock Evaluation and Hydrocarbon Potential in the Tano Basin,
Figure 2 shows a hydrocarbon yield of S2 versus TOC cross
plot. Based on the above criterion, rock samples from well ST
9H are good to excellent source rocks and those from wells
WCTP-2X and WT-1X as good to very good source rocks.
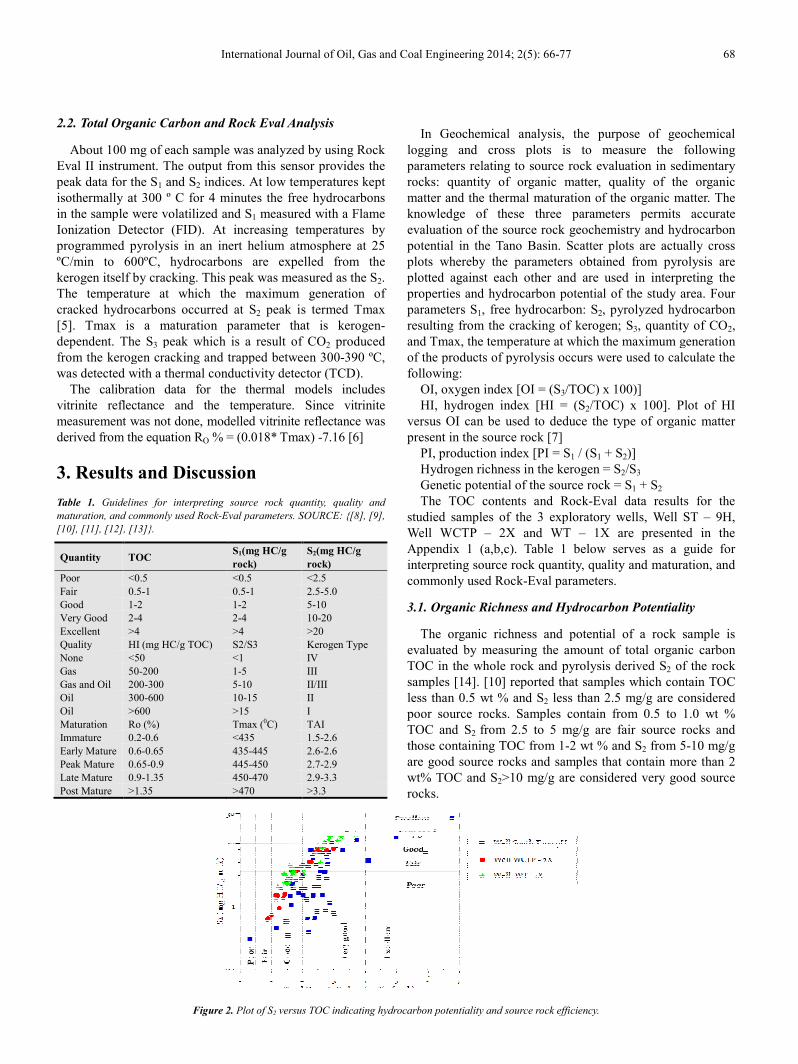
The plot of S2 versus TOC and determining the regression
equation is the best method for analyzing the true average HI
and measuring the adsorption of hydrocarbons by the rock
matrix[15].The analyzed samples from well ST
average HI of 134 mg HC/g TOC, thus falling in the range of
gas prone kerogen. Well WCTP-2X on the other hand gave
Figure 3. Plot of S2
3.2. Type of Organic Matter
Organic matter type is an important factor in evaluating
source rock potential and has important influence on the
nature of the hydrocarbon products. It is very important to
determine the kerogen types due to the variation of the
chemical structure of organic matters and the hydrocarbon
products. According to [12] and [16] there are four types of
kerogen in sedimentary rocks:
� Type-I, composed of oil-prone hydrogen
matter generally in lacustrine and some marine
sediments;
� Type-II, also composed of oil-prone hydrogen
organic matter mainly in marine sediments, Even
though oil is the main product of Type
actually produces more gas than Type-
� Type-III composed of terrestrial organic matter
derived mainly from woody plant material that is low
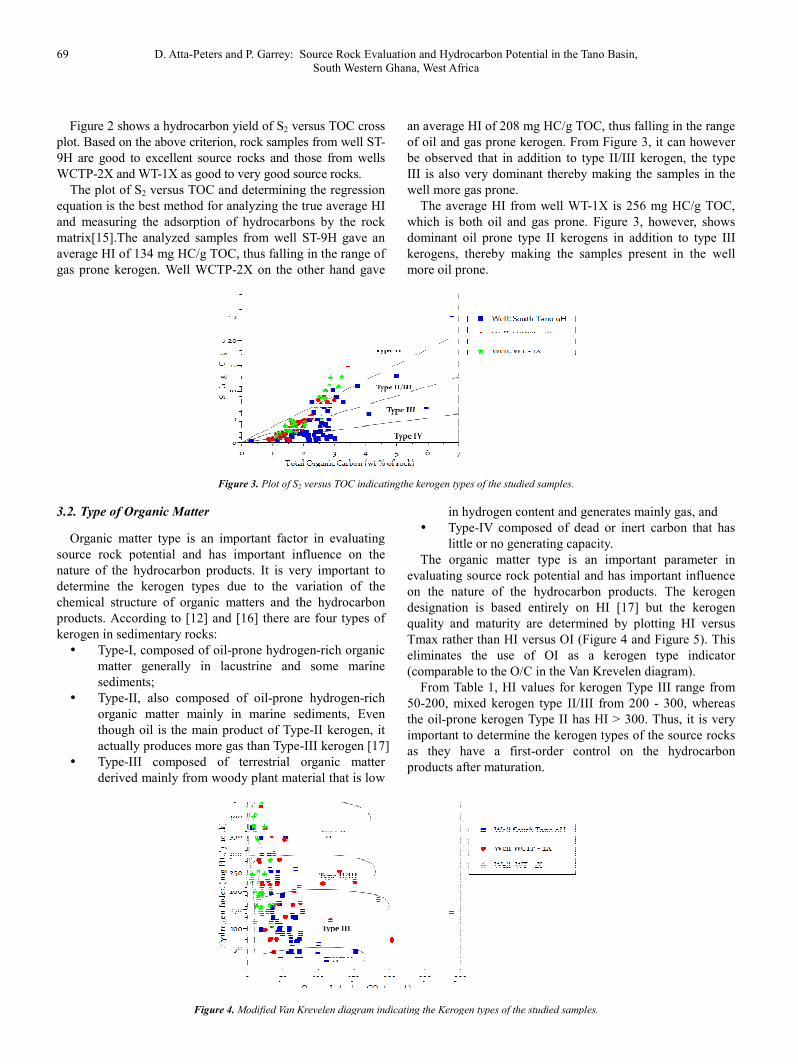
Figure 4. Modified Van Krevelen diagram indicating the Kerogen types of the studied samples.
Peters and P. Garrey: Source Rock Evaluation and Hydrocarbon Potential in the Tano Basin,
South Western Ghana, West Africa
versus TOC cross
plot. Based on the above criterion, rock samples from well ST-
9H are good to excellent source rocks and those from wells
1X as good to very good source rocks.
versus TOC and determining the regression
on is the best method for analyzing the true average HI
and measuring the adsorption of hydrocarbons by the rock
The analyzed samples from well ST-9H gave an
HC/g TOC, thus falling in the range of
2X on the other hand gave
an average HI of 208 mg HC/g TOC, thus falling in the range
of oil and gas prone kerogen. From Figure 3
be observed that in addition to type II/III kerogen, the type
III is also very dominant thereby maki
well more gas prone.
The average HI from well WT-1X is 256 mg
which is both oil and gas prone. Fig
dominant oil prone type II kerogens in addition to type III
kerogens, thereby making the samples present
more oil prone.
2 versus TOC indicatingthe kerogen types of the studied samples.
Organic matter type is an important factor in evaluating
source rock potential and has important influence on the
nature of the hydrocarbon products. It is very important to
determine the kerogen types due to the variation of the
nic matters and the hydrocarbon
there are four types of
prone hydrogen-rich organic
matter generally in lacustrine and some marine
prone hydrogen-rich
organic matter mainly in marine sediments, Even
though oil is the main product of Type-II kerogen, it
-III kerogen [17]
of terrestrial organic matter
y plant material that is low
in hydrogen content and generates mainly gas, and
� Type-IV composed of dead or inert carbon that has
little or no generating capacity.
The organic matter type is an important parameter in
evaluating source rock potential and ha
on the nature of the hydrocarbon products. The kerogen
designation is based entirely on HI
quality and maturity are determined by plotting HI versus
Tmax rather than HI versus OI (Figure 4
eliminates the use of OI as a kerogen type indicator
(comparable to the O/C in the Van Krevelen diagram).
From Table 1, HI values for kerogen
50-200, mixed kerogen type II/III from
the oil-prone kerogen Type II has HI
important to determine the kerogen types of the source rocks
as they have a first-order control on the hydrocarbon
products after maturation.
Modified Van Krevelen diagram indicating the Kerogen types of the studied samples.
Peters and P. Garrey: Source Rock Evaluation and Hydrocarbon Potential in the Tano Basin,
HC/g TOC, thus falling in the range
. From Figure 3, it can however
be observed that in addition to type II/III kerogen, the type
III is also very dominant thereby making the samples in the
1X is 256 mg HC/g TOC,
rone. Figure 3, however, shows
inant oil prone type II kerogens in addition to type III
thereby making the samples present in the well
in hydrogen content and generates mainly gas, and
IV composed of dead or inert carbon that has
little or no generating capacity.
he organic matter type is an important parameter in
evaluating source rock potential and has important influence
on the nature of the hydrocarbon products. The kerogen
designation is based entirely on HI [17] but the kerogen
quality and maturity are determined by plotting HI versus
ure 4 and Figure 5). This
eliminates the use of OI as a kerogen type indicator
(comparable to the O/C in the Van Krevelen diagram).
for kerogen Type III range from
from 200 - 300, whereas
has HI > 300. Thus, it is very
important to determine the kerogen types of the source rocks
order control on the hydrocarbon
International Journal of Oil, Gas and Coal Engineering 2014;
The results from this study showed that for well ST
most samples have HI values between 50 and 200 which
indicate gas-prone organic matter and HI of 200
indicative of mixed kerogen type (Oil and/or Gas). About 5
samples show HI values > 300, which is indicative of very
rich oil source. 10 samples from the well, however, indicate
kerogen Type IV, which yields neither oil nor gas.
For well WCTP-2X, the sample from depth of about 9440
ft showed HI < 50, 15 samples have HI values of 50
which indicate gas-oil prone organic matter, and 15 samples
indicate the mixed kerogen Type II/III which has the
potential to yield oil and/or gas. About 5 samples from the
same well have HI values greater than 300 which indicate
oil-prone Type II kerogen.
Most of the samples from well WT-1X have HI values of
50-200 which indicate gas-prone organic matter. 10 samples
have HI value 200-300, indicating gas-oil prone organic
matter. About 10 samples have HI values > 300, which is
indicative of very rich oil sources.
The modified Van Krevelen diagram (HI versus OI)
(Figure 4) shows that almost all the samples from the 3
exploratory wells consist predominantly of Types II and III
kerogens, which are capable of generating gas
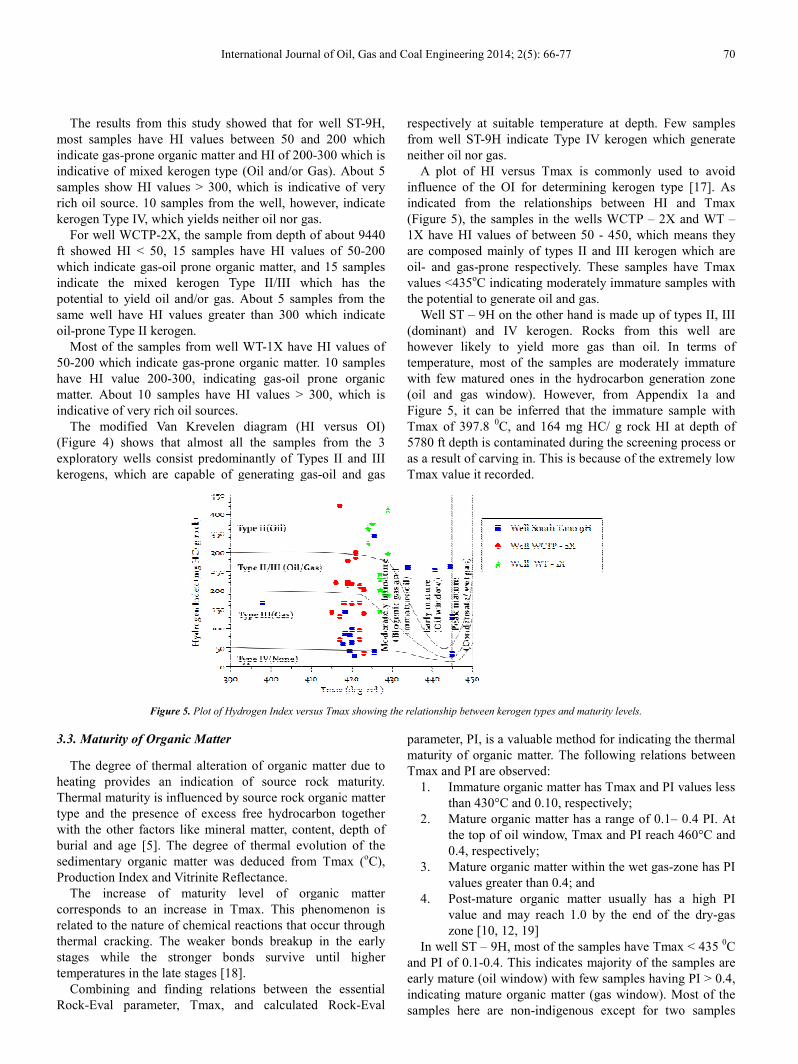
Figure 5. Plot of Hydrogen Index versus Tmax showing the relationship between kerogen types and maturity levels.
3.3. Maturity of Organic Matter
The degree of thermal alteration of organic matter due to
heating provides an indication of source rock maturity.
Thermal maturity is influenced by source rock organic matter
type and the presence of excess free hydrocarbon together
with the other factors like mineral matter, content, depth of
burial and age [5]. The degree of thermal evolution of the
sedimentary organic matter was deduced from Tmax (
Production Index and Vitrinite Reflectance.
The increase of maturity level of organic matter
corresponds to an increase in Tmax. This phenomenon is
related to the nature of chemical reactions that occur through
thermal cracking. The weaker bonds breakup
stages while the stronger bonds survive until higher
temperatures in the late stages [18].
Combining and finding relations between the essential
Rock-Eval parameter, Tmax, and calculated Rock
International Journal of Oil, Gas and Coal Engineering 2014; 2(5): 66-77
The results from this study showed that for well ST-9H,
most samples have HI values between 50 and 200 which
200-300 which is
indicative of mixed kerogen type (Oil and/or Gas). About 5
0, which is indicative of very
rich oil source. 10 samples from the well, however, indicate
kerogen Type IV, which yields neither oil nor gas.
the sample from depth of about 9440
ft showed HI < 50, 15 samples have HI values of 50-200
oil prone organic matter, and 15 samples
indicate the mixed kerogen Type II/III which has the
potential to yield oil and/or gas. About 5 samples from the
same well have HI values greater than 300 which indicate
have HI values of
prone organic matter. 10 samples
oil prone organic
matter. About 10 samples have HI values > 300, which is
The modified Van Krevelen diagram (HI versus OI)
(Figure 4) shows that almost all the samples from the 3
exploratory wells consist predominantly of Types II and III
kerogens, which are capable of generating gas-oil and gas
respectively at suitable temperature
from well ST-9H indicate Type IV kerogen which generate
neither oil nor gas.
A plot of HI versus Tmax is commonly used to avoid
influence of the OI for determining kerogen type
indicated from the relationships between
(Figure 5), the samples in the wells WCTP
1X have HI values of between 50 -
are composed mainly of types II and
oil- and gas-prone respectively. These samples have Tmax
values <435oC indicating moderately immature samples with
the potential to generate oil and gas.
Well ST – 9H on the other hand is made up of types II, III
(dominant) and IV kerogen. Rocks from this well are
however likely to yield more gas than oil. In terms of
temperature, most of the samples are moderately immature
with few matured ones in the hydrocarbon generation zone
(oil and gas window). However, from
Figure 5, it can be inferred that the immature sample with
Tmax of 397.8 0C, and 164 mg HC/ g roc
5780 ft depth is contaminated during the screening process or
as a result of carving in. This is because of the extremely low
Tmax value it recorded.
Plot of Hydrogen Index versus Tmax showing the relationship between kerogen types and maturity levels.
degree of thermal alteration of organic matter due to
heating provides an indication of source rock maturity.
Thermal maturity is influenced by source rock organic matter
type and the presence of excess free hydrocarbon together
mineral matter, content, depth of
The degree of thermal evolution of the
sedimentary organic matter was deduced from Tmax (oC),
he increase of maturity level of organic matter
Tmax. This phenomenon is
related to the nature of chemical reactions that occur through
up in the early
survive until higher
Combining and finding relations between the essential
Tmax, and calculated Rock-Eval
parameter, PI, is a valuable method for indicating the
maturity of organic matter. The following relations between
Tmax and PI are observed:
1. Immature organic matter has Tmax and PI values less
than 430°C and 0.10, respectively;
2. Mature organic matter has a range of 0.1
the top of oil window, Tmax and PI reach 460°C and
0.4, respectively;
3. Mature organic matter within the wet gas
values greater than 0.4; and
4. Post-mature organic matter usually has a high PI
value and may reach 1.0 by the end of the dry
zone [10, 12, 19]
In well ST – 9H, most of the samples have Tmax < 435
and PI of 0.1-0.4. This indicates majority of t
early mature (oil window) with few samples having PI > 0.4,
indicating mature organic matter (gas window). Most of the
samples here are non-indigenous except for two samples
70
erature at depth. Few samples
Type IV kerogen which generate
HI versus Tmax is commonly used to avoid
influence of the OI for determining kerogen type [17]. As
indicated from the relationships between HI and Tmax
, the samples in the wells WCTP – 2X and WT –
- 450, which means they
are composed mainly of types II and III kerogen which are
prone respectively. These samples have Tmax
indicating moderately immature samples with
9H on the other hand is made up of types II, III
(dominant) and IV kerogen. Rocks from this well are
however likely to yield more gas than oil. In terms of
ture, most of the samples are moderately immature
with few matured ones in the hydrocarbon generation zone
and gas window). However, from Appendix 1a and
the immature sample with
164 mg HC/ g rock HI at depth of
5780 ft depth is contaminated during the screening process or
as a result of carving in. This is because of the extremely low
Plot of Hydrogen Index versus Tmax showing the relationship between kerogen types and maturity levels.
parameter, PI, is a valuable method for indicating the thermal
maturity of organic matter. The following relations between
Immature organic matter has Tmax and PI values less
than 430°C and 0.10, respectively;
Mature organic matter has a range of 0.1– 0.4 PI. At
the top of oil window, Tmax and PI reach 460°C and
Mature organic matter within the wet gas-zone has PI
mature organic matter usually has a high PI
value and may reach 1.0 by the end of the dry-gas
9H, most of the samples have Tmax < 435 0C
0.4. This indicates majority of the samples are
early mature (oil window) with few samples having PI > 0.4,
indicating mature organic matter (gas window). Most of the
indigenous except for two samples
71 D. Atta-Peters and P. Garrey: Source Rock Evaluation and Hydrocarbon Potential in the Tano Basin,
which fall within the hydrocarbon generation zone.
Most of the samples in wells WCTP – 2X and WT
have Tmax< 435 0C and PI <0.1 thereby making th
immature and non-indigenous. Samples from the three
exploratory wells ST – 9H, WCTP – 2X, WT
two samples in ST – 9H are non-indigenous (migrated)
hydrocarbons (Figure 6).
The degree of thermal alteration of organic matter due to
heating is called maturity [12]. Organic matter has three
different maturity phases:
1. Immature (<4350C), which has not been obviously
affected by temperature and may be aff
biological diagenesis processes;
2. Mature (435-4500C), which is (or was) within an oil
window and has been converted to petroleum via
thermal processes; and
3. Post-mature (450-4700C), which is in the gas window
because it is hydrogen deficient material due to the
influence of high temperatures [12]
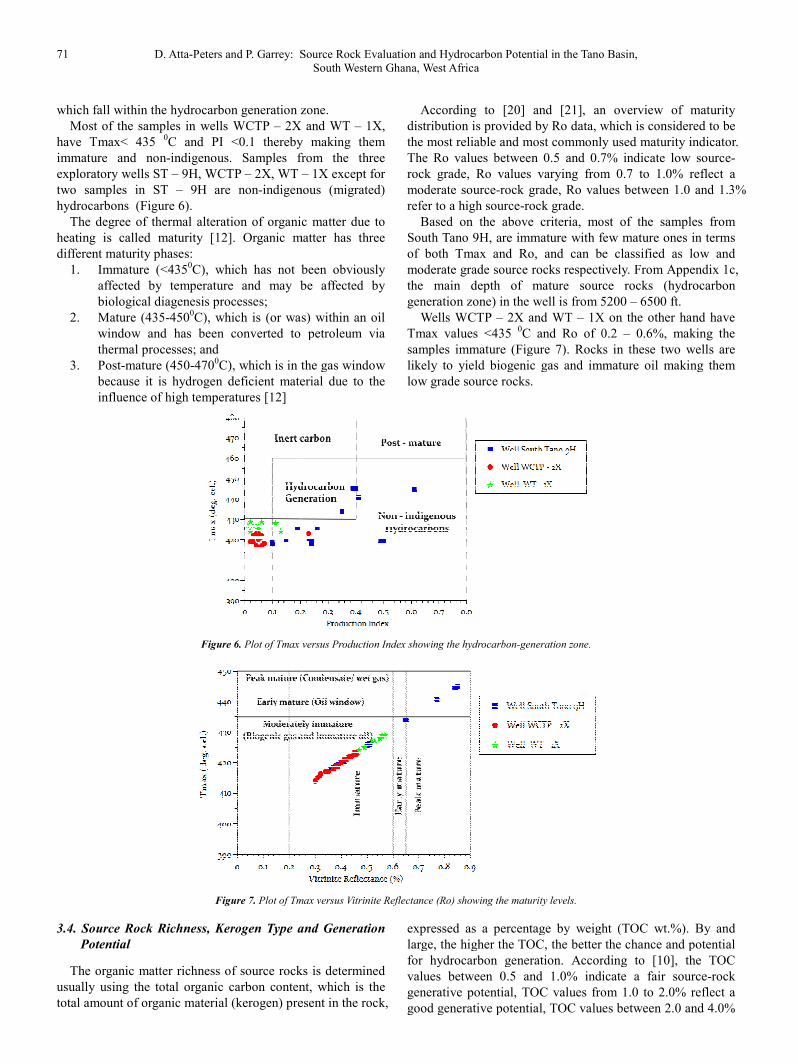
Figure 6. Plot of Tmax versus Production Index showing the hydrocarbon
Figure 7. Plot of Tmax versus Vitrinite Reflectance (Ro) showing the maturity levels.
3.4. Source Rock Richness, Kerogen Type and Generation
Potential
The organic matter richness of source rocks is determined
usually using the total organic carbon content, which is the
total amount of organic material (kerogen) present in the rock,
Peters and P. Garrey: Source Rock Evaluation and Hydrocarbon Potential in the Tano Basin,
South Western Ghana, West Africa
which fall within the hydrocarbon generation zone.
2X and WT – 1X,
0.1 thereby making them
amples from the three
2X, WT – 1X except for
indigenous (migrated)
The degree of thermal alteration of organic matter due to
maturity [12]. Organic matter has three
C), which has not been obviously
affected by temperature and may be affected by
C), which is (or was) within an oil
window and has been converted to petroleum via
C), which is in the gas window
material due to the
According to [20] and [21], an overview of maturity
distribution is provided by Ro data, which is considered to be
the most reliable and most commonly used maturity indicator.
The Ro values between 0.5 and 0.7% indicate low source
rock grade, Ro values varying from 0.7 to 1.0% reflect a
moderate source-rock grade, Ro values between 1.0 and 1.3%
refer to a high source-rock grade.
Based on the above criteria, most of the samples from
South Tano 9H, are immature with few mature ones in terms
of both Tmax and Ro, and can be classified as low and
moderate grade source rocks respectively. From Appendix 1c,
the main depth of mature source rocks (hydrocarbon
generation zone) in the well is from 5200
Wells WCTP – 2X and WT – 1X on the other hand have
Tmax values <435 0C and Ro of 0.2
samples immature (Figure 7). Rocks in these two wells are
likely to yield biogenic gas and immature oil making them
low grade source rocks.
Plot of Tmax versus Production Index showing the hydrocarbon-generation zone.
Plot of Tmax versus Vitrinite Reflectance (Ro) showing the maturity levels.
and Generation
The organic matter richness of source rocks is determined
usually using the total organic carbon content, which is the
total amount of organic material (kerogen) present in the rock,
expressed as a percentage by weight (TOC wt.%). By and
large, the higher the TOC, the better the chance and potential
for hydrocarbon generation. According to
values between 0.5 and 1.0% indicate a fair source
generative potential, TOC values from 1.0 to 2.0% reflect a
good generative potential, TOC values between 2.0 and 4.0%
Peters and P. Garrey: Source Rock Evaluation and Hydrocarbon Potential in the Tano Basin,
According to [20] and [21], an overview of maturity
data, which is considered to be
the most reliable and most commonly used maturity indicator.
5 and 0.7% indicate low source-
rock grade, Ro values varying from 0.7 to 1.0% reflect a
rock grade, Ro values between 1.0 and 1.3%
Based on the above criteria, most of the samples from
immature with few mature ones in terms
of both Tmax and Ro, and can be classified as low and
moderate grade source rocks respectively. From Appendix 1c,
the main depth of mature source rocks (hydrocarbon
5200 – 6500 ft.
1X on the other hand have
C and Ro of 0.2 – 0.6%, making the
samples immature (Figure 7). Rocks in these two wells are
likely to yield biogenic gas and immature oil making them
centage by weight (TOC wt.%). By and
large, the higher the TOC, the better the chance and potential
for hydrocarbon generation. According to [10], the TOC
values between 0.5 and 1.0% indicate a fair source-rock
from 1.0 to 2.0% reflect a
good generative potential, TOC values between 2.0 and 4.0%
International Journal of Oil, Gas and Coal Engineering 2014;
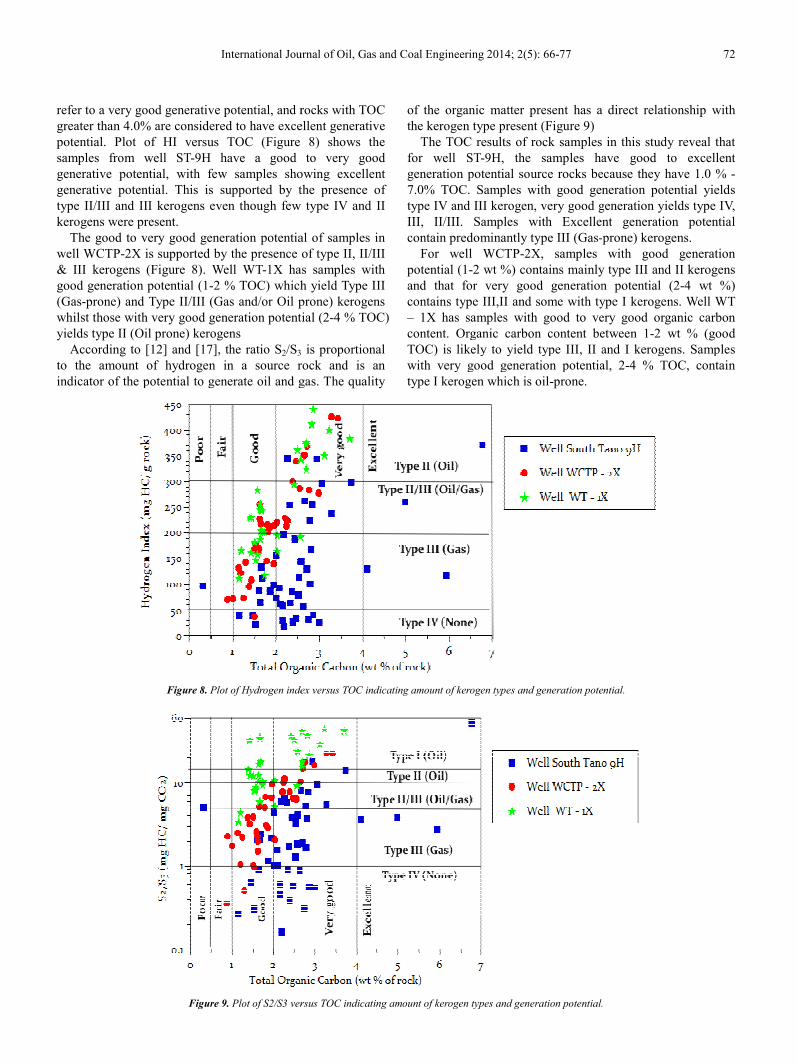
refer to a very good generative potential, and rocks with TOC
greater than 4.0% are considered to have excellent generative
potential. Plot of HI versus TOC (Figure 8
samples from well ST-9H have a good to very good
generative potential, with few samples showing excellent
generative potential. This is supported by the presence of
type II/III and III kerogens even though few type IV and II
kerogens were present.
The good to very good generation potential of samples in
well WCTP-2X is supported by the presence of type II
& III kerogens (Figure 8). Well WT-1X has
good generation potential (1-2 % TOC) which
(Gas-prone) and Type II/III (Gas and/or Oil prone) kerogens
whilst those with very good generation potential (2
yields type II (Oil prone) kerogens
According to [12] and [17], the ratio S2/S3
to the amount of hydrogen in a source rock and is an
indicator of the potential to generate oil and gas.
Figure 8. Plot of Hydrogen index versus TOC indicating
Figure 9. Plot of S2/S3 versus TOC indicating amount of kerogen types and generation potential.
International Journal of Oil, Gas and Coal Engineering 2014; 2(5): 66-77
refer to a very good generative potential, and rocks with TOC
greater than 4.0% are considered to have excellent generative
(Figure 8) shows the
have a good to very good
generative potential, with few samples showing excellent
generative potential. This is supported by the presence of
and III kerogens even though few type IV and II
The good to very good generation potential of samples in
2X is supported by the presence of type II, II/III
1X has samples with
which yield Type III
prone) and Type II/III (Gas and/or Oil prone) kerogens
whilst those with very good generation potential (2-4 % TOC)
3 is proportional
source rock and is an
indicator of the potential to generate oil and gas. The quality
of the organic matter present has a direct relationship with
the kerogen type present (Figure 9)
The TOC results of rock samples
for well ST-9H, the samples have good to excellent
generation potential source rocks because they have 1.0 %
7.0% TOC. Samples with good generation potential yields
type IV and III kerogen, very good generation yields type IV,
III, II/III. Samples with Excellent generat
contain predominantly type III (Gas-
For well WCTP-2X, samples with good generation
potential (1-2 wt %) contains mainly type III and II kerogens
and that for very good generation potential (2
contains type III,II and some with type I kerogens. Well WT
– 1X has samples with good to very good organic carbon
content. Organic carbon content between
TOC) is likely to yield type III, II and I kerogens. Samples
with very good generation potential, 2
type I kerogen which is oil-prone.
Plot of Hydrogen index versus TOC indicating amount of kerogen types and generation potential.
Plot of S2/S3 versus TOC indicating amount of kerogen types and generation potential.
72
of the organic matter present has a direct relationship with
in this study reveal that
the samples have good to excellent
generation potential source rocks because they have 1.0 % -
7.0% TOC. Samples with good generation potential yields
type IV and III kerogen, very good generation yields type IV,
III, II/III. Samples with Excellent generation potential
-prone) kerogens.
2X, samples with good generation
%) contains mainly type III and II kerogens
and that for very good generation potential (2-4 wt %)
contains type III,II and some with type I kerogens. Well WT
1X has samples with good to very good organic carbon
content. Organic carbon content between 1-2 wt % (good
TOC) is likely to yield type III, II and I kerogens. Samples
with very good generation potential, 2-4 % TOC, contain
amount of kerogen types and generation potential.
Plot of S2/S3 versus TOC indicating amount of kerogen types and generation potential.
73 D. Atta-Peters and P. Garrey: Source Rock Evaluation and Hydrocarbon Potential in the Tano Basin,
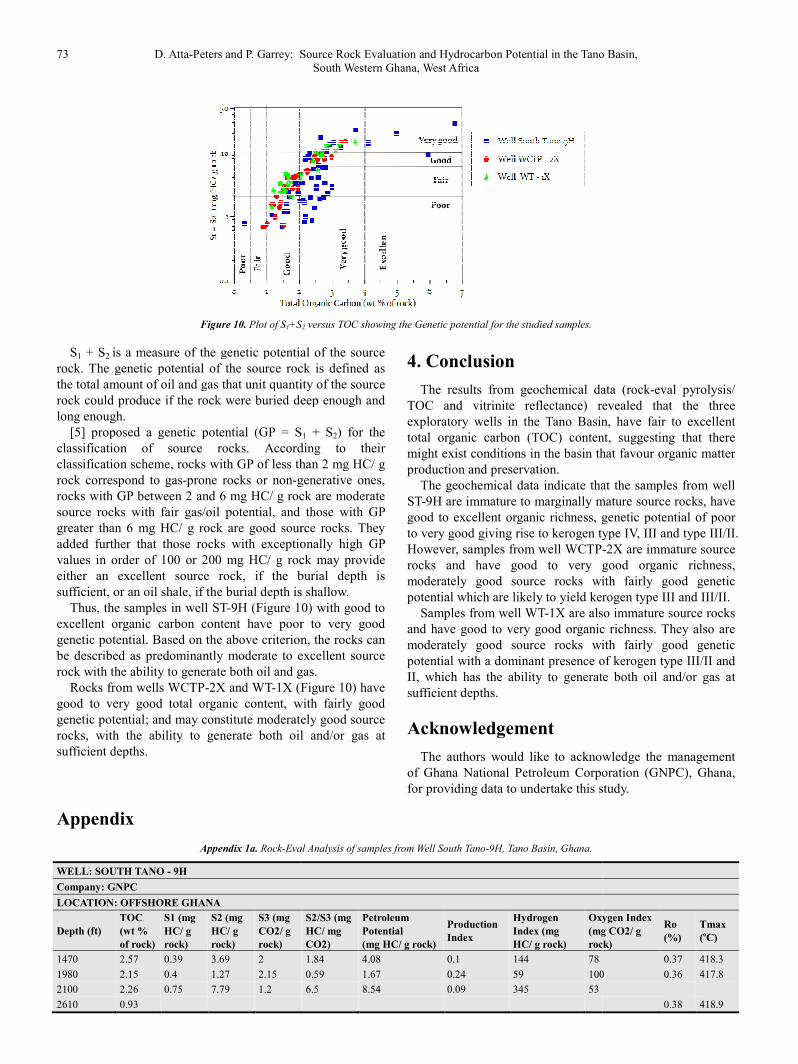
Figure 10. Plot of S1+S
S1 + S2 is a measure of the genetic potential of the source
rock. The genetic potential of the source rock is defined as
the total amount of oil and gas that unit quantity of the source
rock could produce if the rock were buried deep enough and
long enough.
[5] proposed a genetic potential (GP = S
classification of source rocks. According to their
classification scheme, rocks with GP of less than 2 mg HC/ g
rock correspond to gas-prone rocks or non-generative
rocks with GP between 2 and 6 mg HC/ g rock are moderate
source rocks with fair gas/oil potential, and those with GP
greater than 6 mg HC/ g rock are good source rocks. They
added further that those rocks with exceptionally high GP
values in order of 100 or 200 mg HC/ g rock may provide
either an excellent source rock, if the burial depth is
sufficient, or an oil shale, if the burial depth is shallow.
Thus, the samples in well ST-9H (Figure 10) with good to
excellent organic carbon content have poor
genetic potential. Based on the above criterion, the rocks can
be described as predominantly moderate to excellent source
rock with the ability to generate both oil and gas.
Rocks from wells WCTP-2X and WT-1X (Figure 10) have
good to very good total organic content, with fairly good
genetic potential; and may constitute moderately
rocks, with the ability to generate both oil a
sufficient depths.
Appendix
Appendix 1a. Rock-Eval Analysis of samples from Well South Tano
WELL: SOUTH TANO - 9H
Company: GNPC
LOCATION: OFFSHORE GHANA
Depth (ft)
TOC
(wt %
of rock)
S1 (mg
HC/ g
rock)
S2 (mg
HC/ g
rock)
S3 (mg
CO2/ g
rock)
1470 2.57 0.39 3.69 2
1980 2.15 0.4 1.27 2.15
2100 2.26 0.75 7.79 1.2
2610 0.93
Peters and P. Garrey: Source Rock Evaluation and Hydrocarbon Potential in the Tano Basin,
South Western Ghana, West Africa
+S2 versus TOC showing the Genetic potential for the studied samples.
is a measure of the genetic potential of the source
rock. The genetic potential of the source rock is defined as
the total amount of oil and gas that unit quantity of the source
ed deep enough and
[5] proposed a genetic potential (GP = S1 + S2) for the
classification of source rocks. According to their
classification scheme, rocks with GP of less than 2 mg HC/ g
generative ones,
rocks with GP between 2 and 6 mg HC/ g rock are moderate
source rocks with fair gas/oil potential, and those with GP
greater than 6 mg HC/ g rock are good source rocks. They
added further that those rocks with exceptionally high GP
f 100 or 200 mg HC/ g rock may provide
either an excellent source rock, if the burial depth is
sufficient, or an oil shale, if the burial depth is shallow.
9H (Figure 10) with good to
excellent organic carbon content have poor to very good
genetic potential. Based on the above criterion, the rocks can
be described as predominantly moderate to excellent source
rock with the ability to generate both oil and gas.
1X (Figure 10) have
with fairly good
genetic potential; and may constitute moderately good source
rocks, with the ability to generate both oil and/or gas at
4. Conclusion
The results from geochemical data (rock
TOC and vitrinite reflectance) revealed that the three
exploratory wells in the Tano Basin,
total organic carbon (TOC) content, suggesting that there
might exist conditions in the basin th
production and preservation.
The geochemical data indicate that the samples from well
ST-9H are immature to marginally mature source rocks, have
good to excellent organic richness, genetic potential of poor
to very good giving rise to kerogen type IV, III and type III/II.
However, samples from well WCTP-
rocks and have good to very good organic richness,
moderately good source rocks with fairly good genetic
potential which are likely to yield kerogen type III a
Samples from well WT-1X are also immature source rocks
and have good to very good organic richness. They also are
moderately good source rocks with fairly good
potential with a dominant presence of kerogen type III/II and
II, which has the ability to generate both oil and/or gas at
sufficient depths.
Acknowledgement
The authors would like to acknowledge the management
of Ghana National Petroleum Corporation (GNPC), Ghana,
for providing data to undertake this study.
Eval Analysis of samples from Well South Tano-9H, Tano Basin, Ghana.
S2/S3 (mg
HC/ mg
CO2)
Petroleum
Potential
(mg HC/ g rock)
Production
Index
Hydrogen
Index (mg
HC/ g rock)
Oxygen Index
(mg CO2/
rock)
1.84 4.08 0.1 144 78
0.59 1.67 0.24 59 100
6.5 8.54 0.09 345 53
Peters and P. Garrey: Source Rock Evaluation and Hydrocarbon Potential in the Tano Basin,
from geochemical data (rock-eval pyrolysis/
revealed that the three
Basin, have fair to excellent
total organic carbon (TOC) content, suggesting that there
might exist conditions in the basin that favour organic matter
that the samples from well
9H are immature to marginally mature source rocks, have
good to excellent organic richness, genetic potential of poor
to kerogen type IV, III and type III/II.
-2X are immature source
rocks and have good to very good organic richness,
moderately good source rocks with fairly good genetic
potential which are likely to yield kerogen type III and III/II.
are also immature source rocks
and have good to very good organic richness. They also are
good source rocks with fairly good genetic
potential with a dominant presence of kerogen type III/II and
the ability to generate both oil and/or gas at
The authors would like to acknowledge the management
Corporation (GNPC), Ghana,
for providing data to undertake this study.
Oxygen Index
(mg CO2/ g
rock)
Ro
(%)
Tmax
(oC)
0.37 418.3
100 0.36 417.8
0.38 418.9
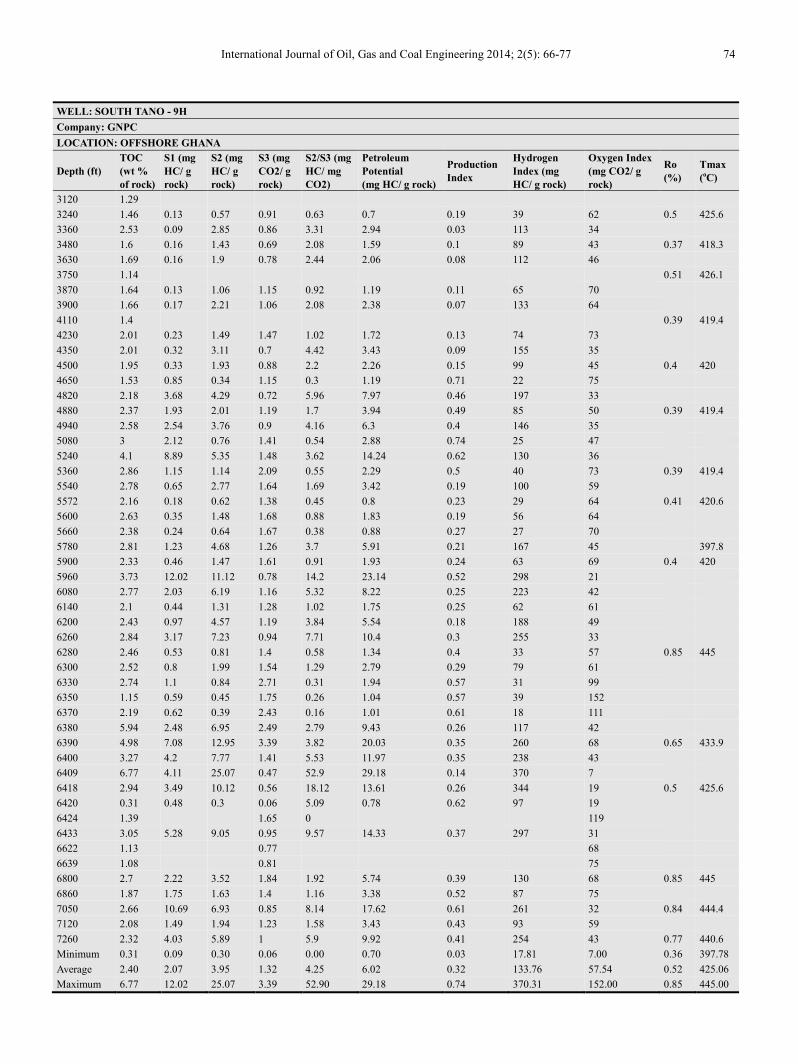
International Journal of Oil, Gas and Coal Engineering 2014; 2(5): 66-77 74
WELL: SOUTH TANO - 9H
Company: GNPC
LOCATION: OFFSHORE GHANA
Depth (ft)
TOC
(wt %
of rock)
S1 (mg
HC/ g
rock)
S2 (mg
HC/ g
rock)
S3 (mg
CO2/ g
rock)
S2/S3 (mg
HC/ mg
CO2)
Petroleum
Potential
(mg HC/ g rock)
Production
Index
Hydrogen
Index (mg
HC/ g rock)
Oxygen Index
(mg CO2/ g
rock)
Ro
(%)
Tmax
(oC)
3120 1.29
3240 1.46 0.13 0.57 0.91 0.63 0.7 0.19 39 62 0.5 425.6
3360 2.53 0.09 2.85 0.86 3.31 2.94 0.03 113 34
3480 1.6 0.16 1.43 0.69 2.08 1.59 0.1 89 43 0.37 418.3
3630 1.69 0.16 1.9 0.78 2.44 2.06 0.08 112 46
3750 1.14
0.51 426.1
3870 1.64 0.13 1.06 1.15 0.92 1.19 0.11 65 70
3900 1.66 0.17 2.21 1.06 2.08 2.38 0.07 133 64
4110 1.4
0.39 419.4
4230 2.01 0.23 1.49 1.47 1.02 1.72 0.13 74 73
4350 2.01 0.32 3.11 0.7 4.42 3.43 0.09 155 35
4500 1.95 0.33 1.93 0.88 2.2 2.26 0.15 99 45 0.4 420
4650 1.53 0.85 0.34 1.15 0.3 1.19 0.71 22 75
4820 2.18 3.68 4.29 0.72 5.96 7.97 0.46 197 33
4880 2.37 1.93 2.01 1.19 1.7 3.94 0.49 85 50 0.39 419.4
4940 2.58 2.54 3.76 0.9 4.16 6.3 0.4 146 35
5080 3 2.12 0.76 1.41 0.54 2.88 0.74 25 47
5240 4.1 8.89 5.35 1.48 3.62 14.24 0.62 130 36
5360 2.86 1.15 1.14 2.09 0.55 2.29 0.5 40 73 0.39 419.4
5540 2.78 0.65 2.77 1.64 1.69 3.42 0.19 100 59
5572 2.16 0.18 0.62 1.38 0.45 0.8 0.23 29 64 0.41 420.6
5600 2.63 0.35 1.48 1.68 0.88 1.83 0.19 56 64
5660 2.38 0.24 0.64 1.67 0.38 0.88 0.27 27 70
5780 2.81 1.23 4.68 1.26 3.7 5.91 0.21 167 45
397.8
5900 2.33 0.46 1.47 1.61 0.91 1.93 0.24 63 69 0.4 420
5960 3.73 12.02 11.12 0.78 14.2 23.14 0.52 298 21
6080 2.77 2.03 6.19 1.16 5.32 8.22 0.25 223 42
6140 2.1 0.44 1.31 1.28 1.02 1.75 0.25 62 61
6200 2.43 0.97 4.57 1.19 3.84 5.54 0.18 188 49
6260 2.84 3.17 7.23 0.94 7.71 10.4 0.3 255 33
6280 2.46 0.53 0.81 1.4 0.58 1.34 0.4 33 57 0.85 445
6300 2.52 0.8 1.99 1.54 1.29 2.79 0.29 79 61
6330 2.74 1.1 0.84 2.71 0.31 1.94 0.57 31 99
6350 1.15 0.59 0.45 1.75 0.26 1.04 0.57 39 152
6370 2.19 0.62 0.39 2.43 0.16 1.01 0.61 18 111
6380 5.94 2.48 6.95 2.49 2.79 9.43 0.26 117 42
6390 4.98 7.08 12.95 3.39 3.82 20.03 0.35 260 68 0.65 433.9
6400 3.27 4.2 7.77 1.41 5.53 11.97 0.35 238 43
6409 6.77 4.11 25.07 0.47 52.9 29.18 0.14 370 7
6418 2.94 3.49 10.12 0.56 18.12 13.61 0.26 344 19 0.5 425.6
6420 0.31 0.48 0.3 0.06 5.09 0.78 0.62 97 19
6424 1.39
1.65 0
119
6433 3.05 5.28 9.05 0.95 9.57 14.33 0.37 297 31
6622 1.13
0.77
68
6639 1.08
0.81
75
6800 2.7 2.22 3.52 1.84 1.92 5.74 0.39 130 68 0.85 445
6860 1.87 1.75 1.63 1.4 1.16 3.38 0.52 87 75
7050 2.66 10.69 6.93 0.85 8.14 17.62 0.61 261 32 0.84 444.4
7120 2.08 1.49 1.94 1.23 1.58 3.43 0.43 93 59
7260 2.32 4.03 5.89 1 5.9 9.92 0.41 254 43 0.77 440.6
Minimum 0.31 0.09 0.30 0.06 0.00 0.70 0.03 17.81 7.00 0.36 397.78
Average 2.40 2.07 3.95 1.32 4.25 6.02 0.32 133.76 57.54 0.52 425.06
Maximum 6.77 12.02 25.07 3.39 52.90 29.18 0.74 370.31 152.00 0.85 445.00
75 D. Atta-Peters and P. Garrey: Source Rock Evaluation and Hydrocarbon Potential in the Tano Basin,
South Western Ghana, West Africa
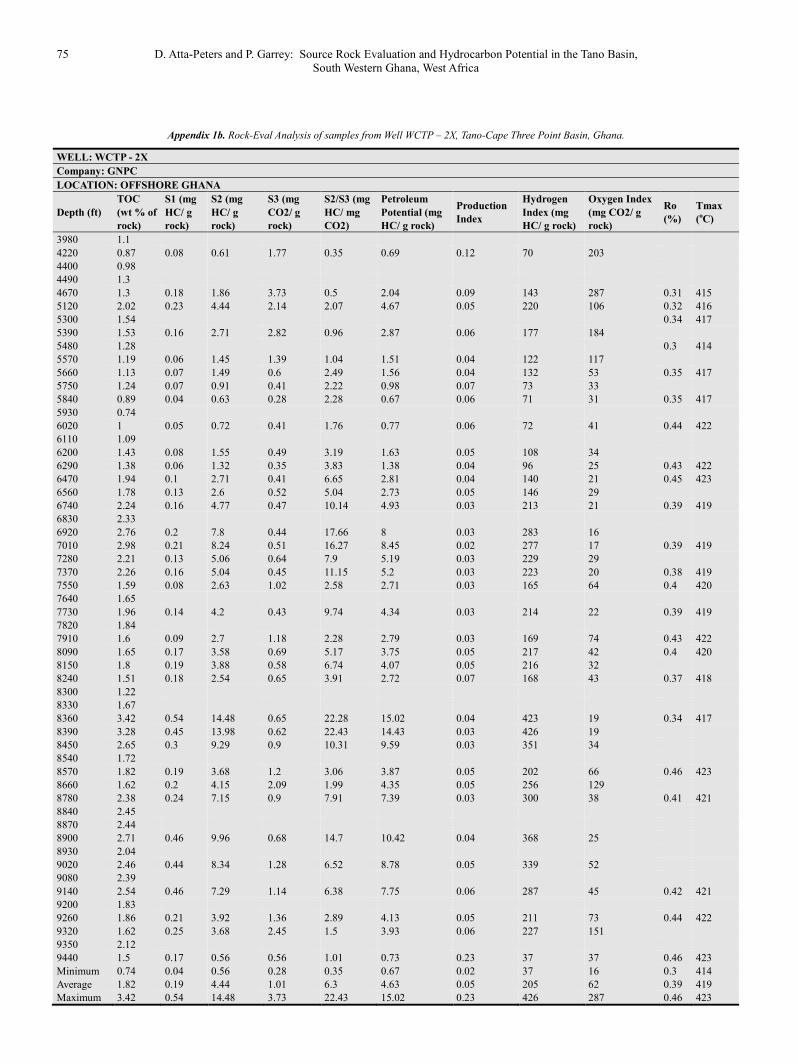
Appendix 1b. Rock-Eval Analysis of samples from Well WCTP – 2X, Tano-Cape Three Point Basin, Ghana.
WELL: WCTP - 2X
Company: GNPC
LOCATION: OFFSHORE GHANA
Depth (ft)
TOC
(wt % of
rock)
S1 (mg
HC/ g
rock)
S2 (mg
HC/ g
rock)
S3 (mg
CO2/ g
rock)
S2/S3 (mg
HC/ mg
CO2)
Petroleum
Potential (mg
HC/ g rock)
Production
Index
Hydrogen
Index (mg
HC/ g rock)
Oxygen Index
(mg CO2/ g
rock)
Ro
(%)
Tmax
(oC)
3980 1.1
4220 0.87 0.08 0.61 1.77 0.35 0.69 0.12 70 203
4400 0.98
4490 1.3
4670 1.3 0.18 1.86 3.73 0.5 2.04 0.09 143 287 0.31 415
5120 2.02 0.23 4.44 2.14 2.07 4.67 0.05 220 106 0.32 416
5300 1.54
0.34 417
5390 1.53 0.16 2.71 2.82 0.96 2.87 0.06 177 184
5480 1.28
0.3 414
5570 1.19 0.06 1.45 1.39 1.04 1.51 0.04 122 117
5660 1.13 0.07 1.49 0.6 2.49 1.56 0.04 132 53 0.35 417
5750 1.24 0.07 0.91 0.41 2.22 0.98 0.07 73 33
5840 0.89 0.04 0.63 0.28 2.28 0.67 0.06 71 31 0.35 417
5930 0.74
6020 1 0.05 0.72 0.41 1.76 0.77 0.06 72 41 0.44 422
6110 1.09
6200 1.43 0.08 1.55 0.49 3.19 1.63 0.05 108 34
6290 1.38 0.06 1.32 0.35 3.83 1.38 0.04 96 25 0.43 422
6470 1.94 0.1 2.71 0.41 6.65 2.81 0.04 140 21 0.45 423
6560 1.78 0.13 2.6 0.52 5.04 2.73 0.05 146 29
6740 2.24 0.16 4.77 0.47 10.14 4.93 0.03 213 21 0.39 419
6830 2.33
6920 2.76 0.2 7.8 0.44 17.66 8 0.03 283 16
7010 2.98 0.21 8.24 0.51 16.27 8.45 0.02 277 17 0.39 419
7280 2.21 0.13 5.06 0.64 7.9 5.19 0.03 229 29
7370 2.26 0.16 5.04 0.45 11.15 5.2 0.03 223 20 0.38 419
7550 1.59 0.08 2.63 1.02 2.58 2.71 0.03 165 64 0.4 420
7640 1.65
7730 1.96 0.14 4.2 0.43 9.74 4.34 0.03 214 22 0.39 419
7820 1.84
7910 1.6 0.09 2.7 1.18 2.28 2.79 0.03 169 74 0.43 422
8090 1.65 0.17 3.58 0.69 5.17 3.75 0.05 217 42 0.4 420
8150 1.8 0.19 3.88 0.58 6.74 4.07 0.05 216 32
8240 1.51 0.18 2.54 0.65 3.91 2.72 0.07 168 43 0.37 418
8300 1.22
8330 1.67
8360 3.42 0.54 14.48 0.65 22.28 15.02 0.04 423 19 0.34 417
8390 3.28 0.45 13.98 0.62 22.43 14.43 0.03 426 19
8450 2.65 0.3 9.29 0.9 10.31 9.59 0.03 351 34
8540 1.72
8570 1.82 0.19 3.68 1.2 3.06 3.87 0.05 202 66 0.46 423
8660 1.62 0.2 4.15 2.09 1.99 4.35 0.05 256 129
8780 2.38 0.24 7.15 0.9 7.91 7.39 0.03 300 38 0.41 421
8840 2.45
8870 2.44
8900 2.71 0.46 9.96 0.68 14.7 10.42 0.04 368 25
8930 2.04
9020 2.46 0.44 8.34 1.28 6.52 8.78 0.05 339 52
9080 2.39
9140 2.54 0.46 7.29 1.14 6.38 7.75 0.06 287 45 0.42 421
9200 1.83
9260 1.86 0.21 3.92 1.36 2.89 4.13 0.05 211 73 0.44 422
9320 1.62 0.25 3.68 2.45 1.5 3.93 0.06 227 151
9350 2.12
9440 1.5 0.17 0.56 0.56 1.01 0.73 0.23 37 37 0.46 423
Minimum 0.74 0.04 0.56 0.28 0.35 0.67 0.02 37 16 0.3 414
Average 1.82 0.19 4.44 1.01 6.3 4.63 0.05 205 62 0.39 419
Maximum 3.42 0.54 14.48 3.73 22.43 15.02 0.23 426 287 0.46 423
International Journal of Oil, Gas and Coal Engineering 2014; 2(5): 66-77 76
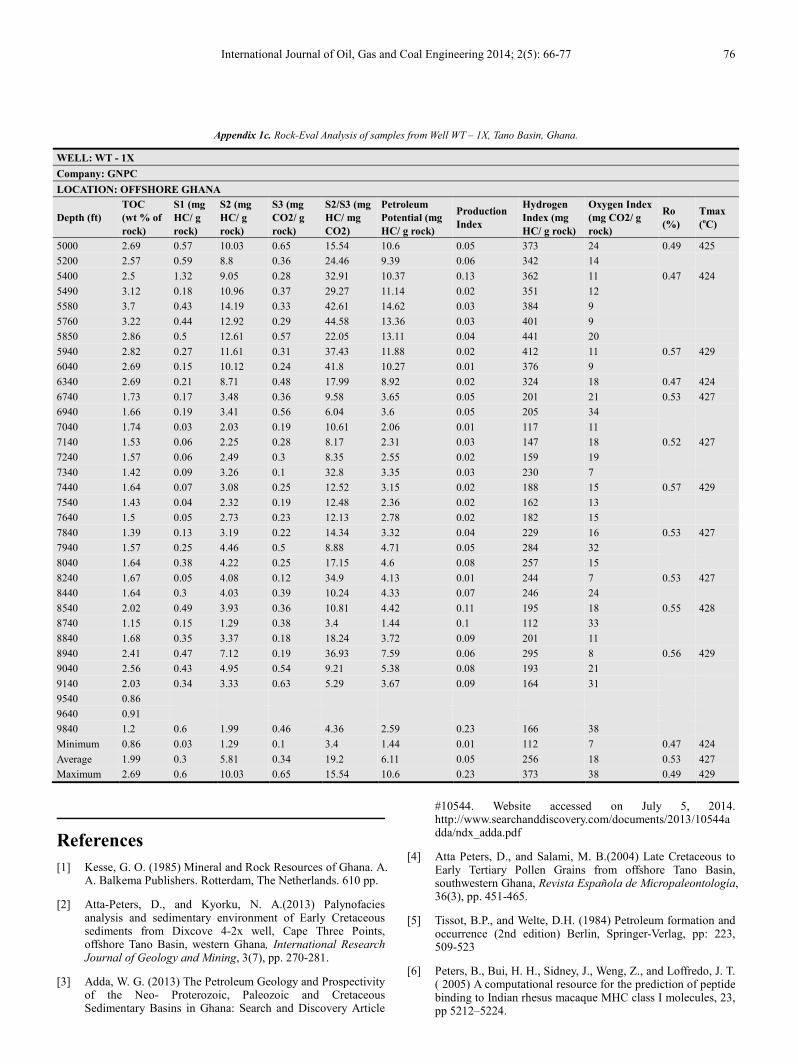
Appendix 1c. Rock-Eval Analysis of samples from Well WT – 1X, Tano Basin, Ghana.
WELL: WT - 1X
Company: GNPC
LOCATION: OFFSHORE GHANA
Depth (ft)
TOC
(wt % of
rock)
S1 (mg
HC/ g
rock)
S2 (mg
HC/ g
rock)
S3 (mg
CO2/ g
rock)
S2/S3 (mg
HC/ mg
CO2)
Petroleum
Potential (mg
HC/ g rock)
Production
Index
Hydrogen
Index (mg
HC/ g rock)
Oxygen Index
(mg CO2/ g
rock)
Ro
(%)
Tmax
(oC)
5000 2.69 0.57 10.03 0.65 15.54 10.6 0.05 373 24 0.49 425
5200 2.57 0.59 8.8 0.36 24.46 9.39 0.06 342 14
5400 2.5 1.32 9.05 0.28 32.91 10.37 0.13 362 11 0.47 424
5490 3.12 0.18 10.96 0.37 29.27 11.14 0.02 351 12
5580 3.7 0.43 14.19 0.33 42.61 14.62 0.03 384 9
5760 3.22 0.44 12.92 0.29 44.58 13.36 0.03 401 9
5850 2.86 0.5 12.61 0.57 22.05 13.11 0.04 441 20
5940 2.82 0.27 11.61 0.31 37.43 11.88 0.02 412 11 0.57 429
6040 2.69 0.15 10.12 0.24 41.8 10.27 0.01 376 9
6340 2.69 0.21 8.71 0.48 17.99 8.92 0.02 324 18 0.47 424
6740 1.73 0.17 3.48 0.36 9.58 3.65 0.05 201 21 0.53 427
6940 1.66 0.19 3.41 0.56 6.04 3.6 0.05 205 34
7040 1.74 0.03 2.03 0.19 10.61 2.06 0.01 117 11
7140 1.53 0.06 2.25 0.28 8.17 2.31 0.03 147 18 0.52 427
7240 1.57 0.06 2.49 0.3 8.35 2.55 0.02 159 19
7340 1.42 0.09 3.26 0.1 32.8 3.35 0.03 230 7
7440 1.64 0.07 3.08 0.25 12.52 3.15 0.02 188 15 0.57 429
7540 1.43 0.04 2.32 0.19 12.48 2.36 0.02 162 13
7640 1.5 0.05 2.73 0.23 12.13 2.78 0.02 182 15
7840 1.39 0.13 3.19 0.22 14.34 3.32 0.04 229 16 0.53 427
7940 1.57 0.25 4.46 0.5 8.88 4.71 0.05 284 32
8040 1.64 0.38 4.22 0.25 17.15 4.6 0.08 257 15
8240 1.67 0.05 4.08 0.12 34.9 4.13 0.01 244 7 0.53 427
8440 1.64 0.3 4.03 0.39 10.24 4.33 0.07 246 24
8540 2.02 0.49 3.93 0.36 10.81 4.42 0.11 195 18 0.55 428
8740 1.15 0.15 1.29 0.38 3.4 1.44 0.1 112 33
8840 1.68 0.35 3.37 0.18 18.24 3.72 0.09 201 11
8940 2.41 0.47 7.12 0.19 36.93 7.59 0.06 295 8 0.56 429
9040 2.56 0.43 4.95 0.54 9.21 5.38 0.08 193 21
9140 2.03 0.34 3.33 0.63 5.29 3.67 0.09 164 31
9540 0.86
9640 0.91
9840 1.2 0.6 1.99 0.46 4.36 2.59 0.23 166 38
Minimum 0.86 0.03 1.29 0.1 3.4 1.44 0.01 112 7 0.47 424
Average 1.99 0.3 5.81 0.34 19.2 6.11 0.05 256 18 0.53 427
Maximum 2.69 0.6 10.03 0.65 15.54 10.6 0.23 373 38 0.49 429
References
[1] Kesse, G. O. (1985) Mineral and Rock Resources of Ghana. A. A. Balkema Publishers. Rotterdam, The Netherlands. 610 pp.
[2] Atta-Peters, D., and Kyorku, N. A.(2013) Palynofacies analysis and sedimentary environment of Early Cretaceous sediments from Dixcove 4-2x well, Cape Three Points, offshore Tano Basin, western Ghana, International Research Journal of Geology and Mining, 3(7), pp. 270-281.
[3] Adda, W. G. (2013) The Petroleum Geology and Prospectivity of the Neo- Proterozoic, Paleozoic and Cretaceous Sedimentary Basins in Ghana: Search and Discovery Article
#10544. Website accessed on July 5, 2014. http://www.searchanddiscovery.com/documents/2013/10544adda/ndx_adda.pdf
[4] Atta Peters, D., and Salami, M. B.(2004) Late Cretaceous to Early Tertiary Pollen Grains from offshore Tano Basin, southwestern Ghana, Revista Española de Micropaleontología, 36(3), pp. 451-465.
[5] Tissot, B.P., and Welte, D.H. (1984) Petroleum formation and occurrence (2nd edition) Berlin, Springer-Verlag, pp: 223, 509-523
[6] Peters, B., Bui, H. H., Sidney, J., Weng, Z., and Loffredo, J. T. ( 2005) A computational resource for the prediction of peptide binding to Indian rhesus macaque MHC class I molecules, 23, pp 5212–5224.
77 D. Atta-Peters and P. Garrey: Source Rock Evaluation and Hydrocarbon Potential in the Tano Basin,
South Western Ghana, West Africa
[7] Peters, K. E. and Moldowan, J. M. (1993) The biomarker guide: Interpreting molecular fossils in petroleum and ancient sediments. Prentice Hall Englewood Cliffs, N. J., 363 pp
[8] Epstein, A.G., Epstein, J.B. and Harris, L. D. (1977) Conodont color alteration—an index to organic metamorphism: U.S. Geological Survey Professional Paper, 995, pp 27.
[9] Espitalié J., Marquis, F., Barsony, I. (1984) Geochemical logging, In: Voorhees KJ (ed) Analytical pyrolysis: techniques and applications. Butterworth, London, pp 276–304
[10] Peters K.E. (1986) Guidelines for evaluating petroleum source rock using programmed pyrolysis: American Association of Petroleum Geologists Bulletin, 70, pp. 318-329.
[11] Traverse, A. (1988) Paleopalynology, Unwin Hyman, Boston, 512 pp
[12] Peters K.E., and Cassa, M.R. (1994) Applied source rock geochemistry.In Magoon, L.B., and Dow, W.G., (eds.), The petroleum system – from source to trap: American Association of Petroleum Geologists, 60, pp. 93-120.
[13] Fowler, M., Snowdon, L. and Stasiuk, V. (2005) Applying petroleum geochemistry to hydrocarbon exploration and exploitation. American Association of Petroleum Geologists Short Course Notes, June 18-19, 2005, Calgary, Alberta, 224 pp.
[14] Waples, D. W., H. Kamata, and M. Suizu. (1992) The art of maturity modeling: Part 1. Finding a satisfactory geological model: American Association of Petroleum Geologists Bulletin, 76, pp 31–46.
[15] Obaje, N.G., Wehner, H., Scheeder, G., Abubakar, M.B., and Jauro, A. (2004) Hydrocarbon prospectively of Nigeria’s inland basins: organic geochemistry and organic petrology, American Association of Petroleum GeologistsBulletin, 88 (3), pp.325-353.
[16] Jacobson, S. R. (1991) Petroleum source rocks and organic facies.In Merrill, R.K., (ed.), Source and migration processes and evaluation techniques: American Association of Petroleum Geologists Handbook of Petroleum Geology, pp. 1–11.
[17] Hunt, J. M. (1996) Petroleum geology and geochemistry, second edition: W.H. Freeman and Company, New York, 743 pp.
[18] Whelan, J. K. and Thompson-Rizer, C. (1993) Chemical methods for assessing kerogen and protokerogen types and maturity: Organic geochemistry principles and applications. In M. H. Engle and S. A. Macko, (eds.), New York Plenum 130, pp 289-353.
[19] Bacon, C. A., Calver, C. R., Boreham, C. J., Leaman, D. E., Morrison, K. C., Revill, A. T. and Volkman, J. K.(2000) The petroleum potential of onshore Tasmania: a review. Mineral Resources Tasmania, Geological Survey Bulletin, pp 71-9.
[20] Dow, W. G. (1977) Kerogen studies and geological interpretations: Journal of Geochemical Exploration, 7, pp 77– 99, doi: 10.1016/0375-6742 (77)90077-2.
[21] Waples, D., (1985) Geochemistry in petroleum exploration. Reidel Publ. Co., Dordrecht and IHRDC, Boston, pp 232