sources and uses of funds for universities, health-related
TRANSCRIPT

Strategic Planning and Funding
Sources and Uses of Funds for General Academic Institutions,
Health-Related Institutions, Lamar State Colleges and
Texas State Technical Colleges for Fiscal Year 2019
June 2020

Texas Higher Education Coordinating Board
Stuart W. Stedman, CHAIR Houston Fred Farias III, OD, VICE CHAIR McAllen S. Javaid AnwarCody C. Campbell
Midland Fort Worth
Ricky A. RavenEmma W. SchwartzR. Sam Torn
Sugarland El Paso Houston
Donna N. Williams Arlington Welcome Wilson Jr. Houston Lauren C. McKenzie, STUDENT REPRESENTATIVE Houston
Harrison Keller, COMMISSIONER OF HIGHER EDUCATION
Agency Mission The mission of the Texas Higher Education Coordinating Board (THECB) is to provide leadership and coordination for the Texas higher education system and to promote access, affordability, quality, success, and cost efficiency through 60x30TX, resulting in a globally competitive workforce that positions Texas as an international leader.
Agency Vision The THECB will be recognized as an international leader in developing and implementing innovative higher education policy to accomplish our mission.
Agency Philosophy The THECB will promote access to and success in quality higher education across the state with the conviction that access and success without quality is mediocrity and that quality without access and success is unacceptable.
The Coordinating Board’s core values are: Accountability: We hold ourselves responsible for our actions and welcome every opportunity to educate stakeholders about our policies, decisions, and aspirations. Efficiency: We accomplish our work using resources in the most effective manner. Collaboration: We develop partnerships that result in student success and a highly qualified, globally competent workforce. Excellence: We strive for excellence in all our endeavors.
The Texas Higher Education Coordinating Board does not discriminate on the basis of race, color, national origin, gender, religion, age or disability in employment or the provision of services.
Please cite this report as follows: Texas Higher Education Coordinating Board. (2019). Sources and Uses of funds general academic institutions, health-related institutions, Lamar State Colleges and Texas State Technical Colleges. Austin, TX.

Statements of Sources and Uses of Funds for General Academic Institutions, Health-Related Institutions,
and Lamar State Colleges and Texas State Technical Colleges FY 2019
Introduction ..................................................................................................................... 1
Background Funding Information for Higher Education ....................................................... 2
Glossary of Terms ............................................................................................................ 7
Section 1 - General Academic Institutions
General Academic Institutions Statewide Summary
The University of Texas System Institutions The University of Texas at Arlington The University of Texas at Austin - Academic + Health Professions (A+H) The University of Texas at Dallas The University of Texas at El Paso
The University of Texas at Rio Grande Valley – Academic + Health Professions (A+H)
The University of Texas of the Permian Basin The University of Texas at San Antonio The University of Texas at Tyler
Texas A&M University System Institutions Texas A&M University Texas A&M University at Galveston Prairie View A&M University Tarleton State University Texas A&M University - Corpus Christi Texas A&M University - Kingsville Texas A&M International University West Texas A&M University Texas A&M University - Commerce Texas A&M University - Texarkana Texas A&M University - Central Texas Texas A&M University - San Antonio
University of Houston System Institutions University of Houston - Academic + Health Professions (A+H) University of Houston - Clear Lake University of Houston - Downtown University of Houston - Victoria

Texas State University System InstitutionsLamar University - Beaumont Sam Houston State University - Academic + Health Professions (A+H) Texas State University Sul Ross State University
Texas Tech University System Texas Tech University Angelo State University
University of North Texas System University of North Texas University of North Texas at Dallas
University Non-System Institutions Midwestern State University Stephen F. Austin State University Texas Southern University Texas Woman's University
Other Financial Information (Not Included in Sector Summaries) The University of Texas at Austin - All Disciplines (A+H+M) The University of Texas at Rio Grande Valley - All Disciplines (A+H+M) University of Houston - All Disciplines (A+H+M) Sam Houston State University- All Disciplines (A+H+Non-Formula Medical
School)
Section 2 - Health-Related Institutions
Health-Related Institutions Statewide Summary
Health-Related Institutions The University of Texas Southwestern Medical Center at Dallas
The University of Texas Medical Branch at Galveston The University of Texas Health Science Center at Houston The University of Texas Health Science Center at San Antonio The University of Texas M.D. Anderson Cancer Center The University of Texas Health Science Center at Tyler Texas A&M University System Health Science Center
University of North Texas Health Science Center at Fort Worth (Public Medical School) Texas Tech University Health Sciences Center
The University of Texas at Austin – Medical School (M) The University of Texas at Rio Grande Valley – Medical School (M)
University of Houston – Medical School (M)
Other Financial Information (Not Included in Sector Summaries) Sam Houston State University – Non-Formula Medical School
Section 3 - Lamar State Colleges & Texas State Technical Colleges
Lamar State Colleges & Texas State Technical Colleges Statewide Summary
Lamar State Colleges & Texas State Technical Colleges Lamar Institute of Technology
Lamar State College - Orange Lamar State College - Port Arthur Texas State Technical College - Harlingen Texas State Technical College - West Texas Texas State Technical College - Marshall Texas State Technical College - Waco Texas State Technical College - North Texas Texas State Technical College - Ft. Bend

Blank Page

Texas Higher Education Coordinating Board 1 June, 2020
Introduction
The Texas Higher Education Coordinating Board (THECB or Coordinating Board) collected information from the Fiscal Year (FY) 2019 annual financial reports of general academic institutions, health-related institutions, Lamar State Colleges, and Texas State Technical Colleges. The data represent an All Funds portrayal, providing all sources and uses of funds available to the individual institutions in FY 2019, but excluding system administrations.
These tables and charts have been prepared annually since they were first developed in 2004 at the request of the Joint Interim Select Committee on Higher Education with FY 2003 financial data. The presentation format was developed with input from legislative staff, institution representatives, and Coordinating Board staff. The pie charts are based on data extracted from the summary tables that immediately follow the charts, which show the net result of all sources and uses of funds. For example, in the summary table, tuition and fees are presented net of scholarships and discounts. To facilitate the comparison between institutions, a state-funded amount per full-time-student equivalent (FTSE) has been provided in the summary table.
The detailed table that follows the summary table provides the calculations for the net amounts captured on the summary table and shows a breakdown by fund group (e.g., Education and General, Designated, Auxiliary, Restricted, etc.). With the requirement from the Coordinating Board to submit information by fund group, the methodology used to record tuition discounts has become a significant issue. While there remains some inconsistency in the way institutions have reported tuition discounts and allowances in the detailed table, the summary table and the charts provide comparable and consistent results, because they show the net amounts.
Detailed footnotes are included on the page following the summary table. The categories of uses shown on the pie charts reflect modified National
Association of College and University Business Officers (NACUBO) functional categories that are defined at the beginning of the report. A glossary of terms follows the definitions of the functional categories.

Texas Higher Education Coordinating Board 2 June, 2020
Background Information for Higher Education
Overview
All public institutions of higher education, except community colleges receive funding for construction and other capital purposes through the Permanent University Fund (PUF) or the Higher Education Fund (HEF).
Institutions in The University of Texas System and the Texas A&M University System benefit from the PUF except for those shown below:
Texas A&M University - Corpus Christi Texas A&M International University Texas A&M University - Kingsville Texas A&M University - Commerce West Texas A&M University Texas A&M University - Texarkana These institutions and all others outside The University of Texas and Texas A&M
Systems receive funding from the HEF. The amount of funds allocated for each PUF institution is determined by the
Boards of Regents of The University of Texas System and the Texas A&M University System each year. The allocation of HEF funds to the other institutions is determined by the Legislature and may be revised every five years.
Three Major Types of Tuition
The three major types of tuition are commonly referred to as “statutory,” “designated,” and “Board Authorized” tuition.
- Statutory Tuition. A tuition charge authorized under Texas Education Code(TEC), Section 54.051, in an amount determined by the Texas Legislature forresident or nonresident students. This includes the charge for state-fundedcontinuing education courses. The current rate for a resident student is $50 persemester credit hour (SCH), unless a different rate is specified by TEC, Section54.051.
- Designated Tuition. A tuition charge authorized under TEC, Section 54.0513,that institutions may impose on any graduate or undergraduate, resident ornonresident student, in an amount that the governing board of the institutionconsiders necessary for the effective operation of the institution. Designatedtuition was “deregulated” by the 78th Legislature. Amounts collected are notapplied toward legislative appropriations, but are retained by the institutions.With tuition deregulation is a requirement that 15 percent of the proceeds fromTexas resident undergraduate rates greater than $46 per Semester Credit Hour(SCH) be set aside for student financial aid programs.
- Board Authorized Tuition. A tuition charge that a general academic teachinginstitution or a medical and dental unit may impose on any graduate resident ornonresident student in an amount as specified in TEC, Section 54.008.

Texas Higher Education Coordinating Board 3 June, 2020
Auxiliary Enterprises Fees
Auxiliary enterprises furnish services to students, faculty, or staff and charge a fee related to, but not necessarily equal to, the cost of the services. The distinguishing characteristic of most auxiliary enterprises is that they are managed as self-supporting activities. Examples include intercollegiate athletics, student health services, food services, student housing, and parking and traffic enforcement. Examples of fees include room and board fees, parking permit fees, and student service fees. No educational and general funds appropriated to institutions in the General Appropriations Act (Act) may be expended on auxiliary enterprises, unless specifically authorized in the Act.
Sources They include all operating funds received of any nature, including Educational
and General (E&G) revenues, as described in what follows. Education & General (E&G) revenues include the following:
- Unrestricted Current (General) Funds are earned by, or appropriated,
or contributed free from any restrictions imposed by donors, payers, or outside agencies as to their use. This group includes, but is not limited to, state appropriations.
- Designated Funds are otherwise unrestricted current funds which are
designated by governing boards for specific institutional purposes. - Restricted Funds may only be expended for specific purposes set by
donors or other outside agencies. These may be used for operating purposes if that is one of the designated specific purposes. Restricted revenues are reported in the year in which they are expended.
- E&G revenues may also include Auxiliary Enterprises revenue.
Uses
This includes all funds of any nature expended, including E&G uses described as follows:
Operating expenses for public annual financial reports include depreciation expense as required by the Governmental Accounting Standards Board (GASB). However, depreciation has been excluded from this analysis. Capital outlay from current funds has been substituted as an operating expense to make this analysis consistent with reports for fiscal years prior to 2002. The operating expenses are presented by NACUBO functional categories.
Operating Expenses (Uses). Expenses paid to acquire goods and services provided in return for operating revenues and to carry out the mission of the institutions are reported in 10 categories.
The following functional category definitions are extracted from the National Association of College and University Business Officers (NACUBO) glossary:
- Instruction. Funds used for all activities that are a part of an institution’s instruction program to include faculty salaries, academic departmental operating expenses, and support staff salaries.

Texas Higher Education Coordinating Board 4 June, 2020
- Research. Funds used for activities specifically organized to produce
research outcomes.
- Public Service. Funds used for activities that are established primarily to provide non-instructional services beneficial to those external to the institution.
- Academic Support. Funds used primarily to support services for an
institution’s primary mission of instruction, research, and public service. This may include technical support, academic administration, and the retention and display of educational materials.
- Student Services. Funds used for activities whose primary purpose is
to contribute to the students’ emotional and physical well-being outside the context of the formal instruction program. Included are funds used for the admissions and registrar offices.
- Institutional Support. Funds used for items such as central executive
level management, fiscal operations, administrative data processing, human resources; and records, logistical activities, and activities concerned with community and alumni relations.
- Operation and Maintenance of Plant. Funds used for the operation
and maintenance of the physical plant, such as custodial services, landscape and ground maintenance, and utilities.
- Scholarships and Fellowships. Funds used for scholarships and
fellowships in the form of grants to students.
- Capital Outlay. Expenditures for the construction or acquisition of capital assets funded from current funding sources.
- Other Expenses. (Material entries are explained in the footnotes)
Non-operating sources and uses of funds are shown separately at the bottom of
the analysis. (For consistency in reporting, bond proceeds received by the four non-system institutions that have not been expended in the current year are excluded from this analysis. These funds are normally held by university system administrations, which are not shown in this report.)
Tuition Revenue Bonds
Tuition Revenue Bonds (TRBs) originated with the Higher Education Facilities Bond Program of 1971. The original legislation, with subsequent amendments, is codified as V.T.C.A., Texas Education Code, Section 55.01-55.25. The program originally authorized the regents of Texas Tech University, The University of Texas at Austin, Texas A&M University, University of Houston and Pan American University (now part of The University of Texas Rio Grande Valley) to issue revenue bonds up to a specified amount (an aggregate of $242.5 million) for construction of new campuses and facilities. The bonds are backed by tuition pledged from the specified institutions. Since then, all general academic institutions, health-related institutions, and state and
Texas Higher Education Coordinating Board 5 June, 2020
technical colleges have been authorized by the Legislature at various times to issue specific amounts of Tuition Revenue Bonds.
The Legislature has historically used General Revenue to reimburse institutions for the debt services related to these bonds. Funding for the FY 2018-19 biennium is $528.7 million.

Texas Higher Education Coordinating Board 6 June, 2020
Glossary of Terms
Definitions for terms used in describing the categories of Operating Sources and Operating Uses are briefly described below:
Operating Sources
State of Texas
- State Appropriations. Appropriations spending authority received from theLegislature for the institution for the current fiscal period.
- State Grants & Contracts. Appropriations for specific grants and contracts.This category includes funding for the following significant research programs:
The Texas Research Incentive Program (TRIP) The Texas Research University Fund (TRUF) The Core Research Support Fund (CRSF) The Texas Comprehensive Research Fund (TCRF) The National Research University Fund (NRUF) Autism Research Program The Cancer Prevention and Research Institute of Texas (CPRIT) The Governor's University Research Initiative (GURI) The Academy of Medicine, Engineering and Science of Texas (TAMEST)
- Higher Education Funds (HEF). Total spending authority for the currentperiod for the constitutional appropriation for acquiring land with or withoutpermanent improvements, constructing and equipping buildings or otherpermanent improvements, major repair or rehabilitation of building or otherpermanent improvements and acquisition of capital equipment, library books,and library materials at eligible institutions and agencies of higher education.
- Available University Fund. Earnings received from investments of the PUF.Earnings are used for three primary purposes. The fund is used to pay interestand principal due on PUF bonds that are issued to provide construction dollars at20 of the institutions of The University of Texas and Texas A&M Systems. Thefund provides support for a wide range of programs intended to developexcellence at The University of Texas at Austin, Texas A&M University at CollegeStation, and Prairie View A&M University. In addition, it provides for theexpenses of the two respective system administrations.
Student & Parent
- Tuition & Fees (Net). Current year totals of student tuition and fees paid bystudents and parents after reduction by waivers, remissions, and exemptions orscholarship discounts and allowances.
Federal Government
- Federal Grants & Contracts. Operating revenue grants and contracts receivedthrough federal legislative acts.

Texas Higher Education Coordinating Board 7 June, 2020
Professional Fees
Revenues for colleges and universities derived from the fees charged by the professional staffs at health institutions as part of the medical practice plans. Examples of such fees could include doctors’ fees for clinic visits, medical and dental procedures, professional opinion and anatomical procedures, such as analysis of specimens after a surgical procedure, etc.
Hospitals and Clinics
Revenue associated with the operations of hospitals and clinic operations.
Institutional Resources
- Endowment & Interest Income. Revenue derived from investments.
- Local Government Grants. Operating revenue grants and contracts receivedfrom local governmental entities.
- Private Gifts & Grants. Operating revenue grants and contracts received fromindividuals, corporations, and nonprofit entities not associated with agovernmental entity.
- Sales & Services. Includes (1) revenues that are related incidentally to theconduct of instruction, research, and public service and (2) revenues fromactivities that exist to provide an instructional and laboratory experience forstudents that incidentally create goods and services that may be sold. ForHealth-Related Institutions, it includes revenues generated from non-professionalfees and miscellaneous income, e.g., reimbursement for long distance charges,collections for photocopy services, lab fees, computer services, rental ofmicroscopes, etc.
- Net Auxiliary Enterprises. Revenues derived directly from the operation ofauxiliary enterprises themselves. Auxiliary enterprises are activities that furnish aservice to students, faculty, or staff and charge a fee that is directly related to,although not necessarily equal to, the cost of the service (e.g., dormitories,dining halls, and bookstores). The activity is managed as essentially self-supporting.
- Other Income. Any operating revenue that does not fall within one of theabove categories should be included here.
Operating Uses
- Instruction. Expenses for all activities that are part of an institution'sinstruction program. Expenses for credit and non-credit courses, for academic,occupational, vocational and technical instruction, for remedial and tutorialinstruction, and for regular, special, and extension sessions should be included.Includes expenditures for departmental research and public service that are notseparately budgeted, and expenditures for departmental chairpersons, in whichinstruction is still an important role.

Texas Higher Education Coordinating Board 8 June, 2020
- Research. All expenses for activities specifically organized to produce researchoutcomes. Expenses include internally and externally sponsored research, butmust be separately budgeted.
- Public Service. Expenses for activities that are established primarily to providenon-instructional services beneficial to individuals and groups external to theinstitution.
- Hospitals and Clinics. Expenses associated with the operations of hospital andclinic operations.
- Academic Support. Expenses primarily to provide support services for theinstitution's primary missions - instruction, research, and public service. Itincludes the following: galleries, academic administration (deans' salaries andoffice expenses), technical support (computer services and audio-visualinformation), separately budgeted support for course and curriculumdevelopment, etc.
- Student Services. Expenses for offices of admissions and registrar and thoseactivities whose primary purpose is to contribute to the students' emotional andphysical well-being and to his/her intellectual, cultural, and social developmentoutside the context of the formal instruction program.
- Institutional Support. Expenses for central executive level management andlong-range planning of the entire institution; fiscal operations; administrativedata processing; space management; employee personnel and records; logisticalactivities that provide procurement, storerooms, safety, security, printing, andtransportation services to the institution; support services for faculty and staffthat do not operate as auxiliary enterprises; and activities concerned withcommunity and alumni relations, including development and fundraising.
- Operations & Maintenance of Plant. Expenses for the operation andmaintenance of physical plant, net of amounts charged to hospitals andindependent operations.
- Scholarships & Fellowships. Expenses for scholarships and fellowships fromrestricted and unrestricted funds in the forms of grants to students fromselection either by the institution or from an entitlement program.
- Auxiliary Enterprises. Expenses of activities that furnish a service to students,faculty, or staff and charge a fee that is directly related to, although notnecessarily equal to, the cost of the service (e.g. dormitories, dining halls, andbookstores).
- Capital Outlay from Current Fund Sources. Expenditures for theconstruction or acquisition of capital assets funded from current funding sources.
- Other Expense. Expenses for activities not directly related to the basic servicesperformed by the institution, which do not fall within one of the abovecategories.

General Academic Institutions
Texas Higher Education Coordinating Board 9 June, 2020

Summary of All General Academic InstitutionsFor the Year Ended August 31, 2019Source: FY 2019 Annual Financial Report
Non-Operating Funds are not included in above charts. See following page (Summary).Charts May Not Add to 100% Due to Rounding
Total Operating Sources $15,826,545,732
Total Operating Sources $15,826,545,732
Total Operating Uses $13,781,714,013
State of Texas$4,480,145,995
28%
Student & Parent$4,808,945,687
30%
Federal Government$2,186,416,505
14%
Institutional Resources$4,351,037,545
28%
Operating Sources by Category
State Appropriations$2,988,685,985
19%
State Grants & Contracts
$578,623,6204%
Higher Education Fund$331,956,525
2%
Available University Fund Excellence
$580,879,8654%
Tuition & Fees$4,808,945,687
30%
Federal Grants & Contracts
$2,186,416,50514%
Endowment & Interest Income
$682,619,4154%
Local Government Grants
$32,538,7680%
Private Gifts & Grants$1,119,782,889
7%
Sales & Services$770,942,280
5%
Net Auxiliary Enterprises
$1,495,643,0599%
Other Income$249,511,134
2%
Operating Sources
Instruction$4,022,858,833
29%
Research$1,662,898,991
12%
Public Service$345,098,525
2%
Academic Support$1,598,588,845
12%
Student Services$814,861,546
6%Institutional Support
$1,035,050,1708%
Operations & Maintenance of Plant
$1,021,309,3077%
Scholarships & Fellowships
$1,056,220,0008%
Auxiliary Enterprises$1,646,446,288
12%Capital Outlay$345,286,836
2%
Other Expenses$233,094,672
2%
Operating Uses
Texas Higher Education Coordinating Board 10 June, 2020

Summary of All General Academic InstitutionsFor the Year Ended August 31, 2019Source: FY 2019 Annual Financial Report
Summary Worksheet FY 2019 Amount Per FTSEInstitution State Funded FTSEs 551,455.60
Operating SourcesState of TexasState Appropriations 2,988,685,985$ 5,420$ State Grants and Contracts - Restricted 578,623,620 1,049 Higher Education Fund 331,956,525 602 Available University Fund Excellence (See FN8) 580,879,865 1,053 Subtotal 4,480,145,995$ 8,124$
Student & ParentTuition - net 3,382,266,305$ 6,133$ Fees - net 1,426,679,382 2,587 Tuition and Fees (net of Scholarship Discounts and Allowances) 4,808,945,687$ 8,720$
Federal GovernmentFederal Grants and Contracts - Restricted 2,186,416,505$ 3,965$
Institutional ResourcesEndowment and Interest Income (See FN2) 682,619,415$ 1,238$ Local Government Grants - Restricted 32,538,768 59 Private Gifts and Grants - Restricted 1,119,782,889 2,031 Sales and Services 770,942,280 1,398 Net Auxiliary Enterprises (See FN9) 1,495,643,059 2,712 Other Income (See FN3) 249,511,134 452 Subtotal 4,351,037,545$ 7,890$ Total Operating Sources 15,826,545,732$ 28,699$
Operating UsesInstruction 4,022,858,833$ 7,295$ Research 1,662,898,991 3,015 Public Service 345,098,525 626 Academic Support 1,598,588,845 2,899 Student Services 814,861,546 1,478 Institutional Support 1,035,050,170 1,877 Operations and Maintenance of Plant 1,021,309,307 1,852 Scholarships and Fellowships 1,056,220,000 1,915 Auxiliary Enterprises (See FN9) 1,646,446,288 2,986 Capital Outlay from Current Fund Sources 345,286,836 626 Other Expenses (See FN3) 233,094,672 423 Total Operating Uses 13,781,714,013$ 24,992$
Other Sources / (Uses) of FundsCapital Outlay from Non-Current Fund Sources (1,417,259,296)$ (2,570)$ Mandatory and Non-mandatory Transfers (See FN10) 304,203,889 552 Bond Proceeds Transfers (See FN4) 452,388,346 820 Debt Service Payments (See FN5) (1,001,861,578) (1,817) Subtotal (1,662,528,639)$ (3,015)$
Other Items Not for Current Operating UseUnrealized Gains / (Losses) (See FN6) 87,251,813$ 158$ Additions to Permanent Endowments (See FN7) 165,578,565 300 Subtotal 252,830,378$ 458$
Total Sources Over / (Under) Uses (See FN11) 635,133,458$ 1,150$
Texas Higher Education Coordinating Board 11 June, 2020

FY 2019
Operating SourcesEducational &
General DesignatedAuxiliary
EnterprisesRestricted
Expendable Loan Funds
Annuity, Life & Endowment and Similar Funds
Unexpended Plant
Retirement of Indebtedness
Investment In Plant
Total Primary University
State of TexasState Appropriations 2,988,685,985 - - - - - - - - 2,988,685,985 State Grants and Contracts - Restricted 281,902,341 49,144,687 - 247,576,592 - - - - - 578,623,620 Higher Education Fund 331,956,525 - - - - - - - - 331,956,525 Available University Fund Excellence (See FN8) 472,247,238 108,632,627 - - - - - - - 580,879,865 Subtotal 4,074,792,089 157,777,314 - 247,576,592 - - - - - 4,480,145,995
Student & ParentTuition Potential 100% 1,567,669,147 3,565,369,851 - - - - - - - 5,133,038,998 Waivers - Statutory (Not Reported in AFR) (360,380,238) (59,402,585) - - - - - - - (419,782,823) Waivers - Institutional (Not Reported in AFR) (2,683,309) (299,477) - - - - - - - (2,982,786) Exemptions - Statutory (Not Reported in AFR) (4,051,552) (16,938,351) - - - - - - - (20,989,903) Exemptions - Institutional (Not Reported in AFR) (2,355,596) (3,809,191) - - - - - - - (6,164,787) Tuition - Gross - AFR Presentation 1,198,198,452 3,484,920,247 - - - - - - - 4,683,118,699 Waivers - Statutory (Reported in AFR) (10,120,910) (98,314) - - - - - - - (10,219,224) Waivers - Institutional (Reported in AFR) (167,635) (18,925) - - - - - - - (186,560) Exemptions - Statutory (Reported in AFR) (56,519,341) (153,098,103) - - - - - - - (209,617,444) Exemptions - Institutional (Reported in AFR) (591,470) (88,042) - - - - - - - (679,512) All Other Scholarship Disc.& Allow. (See FN1) (292,946,655) (787,202,999) - - - - - - - (1,080,149,654) Tuition - net 837,852,441 2,544,413,864 - - - - - - - 3,382,266,305
Fees Potential 100% 15,409,513 1,534,754,002 502,537,359 536,199 - - - - - 2,053,237,073 Waivers - Statutory (Not Reported in AFR) (376) (3,175,277) (3,314,527) - - - - - - (6,490,180) Waivers - Institutional (Not Reported in AFR) (749) (15,010) (7,432) - - - - - - (23,191) Exemptions - Statutory (Not Reported in AFR) - (649,619) (754,004) - - - - - - (1,403,623) Exemptions - Institutional (Not Reported in AFR) - - - - - - - - - - Fees - Gross - AFR Presentation 15,408,388 1,530,914,096 498,461,396 536,199 - - - - - 2,045,320,079 Waivers - Statutory (Reported in AFR) - - - - - - - - - - Waivers - Institutional (Reported in AFR) - (25) - - - - - - - (25) Exemptions - Statutory (Reported in AFR) (1,710,627) (49,310,914) (23,076,756) - - - - - - (74,098,297) Exemptions - Institutional (Reported in AFR) - (671,267) (2,620,667) - - - - - - (3,291,934) All Other Scholarship Disc.& Allow. (See FN1) (13,185,016) (419,731,332) (108,334,093) - - - - - - (541,250,441) Fees - net 512,745 1,061,200,558 364,429,880 536,199 - - - - - 1,426,679,382
Net Tuition and Fees (Funds Collected) 838,365,186 3,605,614,422 364,429,880 536,199 - - - - - 4,808,945,687
Federal GovernmentFederal Grants and Contracts - Restricted 7,249 180,598,797 20,005 2,004,554,184 - - 1,236,270 - - 2,186,416,505
Institutional ResourcesEndowment and Interest Income (See FN2) 26,940,105 290,446,513 29,293,651 292,992,640 2,037,328 20,381,461 17,324,299 3,120,895 82,523 682,619,415 Local Government Grants - Restricted 3,262 9,582,942 - 22,952,564 - - - - - 32,538,768 Private Gifts and Grants - Restricted (630,183) 41,133,137 38,264,665 1,029,943,834 100,642 3,297,272 7,610,509 - 63,013 1,119,782,889 Sales and Services 48,495,107 675,695,297 118,709 46,626,661 2,825 3,681 - - - 770,942,280 Net Auxiliary Enterprises (See FN9) - 2,052,232 1,493,590,827 - - - - - - 1,495,643,059 Other Income (See FN3) 47,572,641 107,828,467 24,009,748 44,320,135 4,455,548 1,253,810 7,522,185 85,214 12,463,386 249,511,134 Subtotal 122,380,932 1,126,738,588 1,585,277,600 1,436,835,834 6,596,343 24,936,224 32,456,993 3,206,109 12,608,922 4,351,037,545 Total Operating Sources 5,035,545,456 5,070,729,121 1,949,727,485 3,689,502,809 6,596,343 24,936,224 33,693,263 3,206,109 12,608,922 15,826,545,732
Operating UsesInstruction 2,774,413,115 1,009,105,172 - 239,340,546 - - - - - 4,022,858,833 Research 302,095,712 328,069,092 - 1,032,647,545 - - 86,642 - - 1,662,898,991 Public Service 43,364,526 142,155,885 19,456 159,558,658 - - - - - 345,098,525 Academic Support 525,965,761 909,728,005 500 162,927,474 (158,995) - 126,100 - - 1,598,588,845 Student Services 158,716,440 577,102,909 32,379,840 39,518,855 6,904,997 - 238,505 - - 814,861,546 Institutional Support 426,588,894 579,034,236 26,892 28,142,449 461,941 602,965 192,793 - - 1,035,050,170 Operations and Maintenance of Plant 273,999,629 589,504,671 1,275,601 4,484,796 - - 146,271,781 1,800 5,771,029 1,021,309,307 Scholarships and Fellowships 127,588,810 320,349,873 7,651,981 600,645,741 (16,405) - - - - 1,056,220,000 Auxiliary Enterprises (See FN9) - 13,737,470 1,580,328,704 52,380,114 - - - - - 1,646,446,288 Capital Outlay from Current Fund Sources* 86,837,785 151,025,806 23,657,795 83,765,450 - - - - - 345,286,836 Other Expenses (See FN3) 4,010,674 16,029,714 4,621,948 324,380 3,486,917 21,149,462 125,177,637 14,029,222 44,264,718 233,094,672 Total Operating Uses 4,723,581,346 4,635,842,833 1,649,962,717 2,403,736,008 10,678,455 21,752,427 272,093,458 14,031,022 50,035,747 13,781,714,013
Other Sources / (Uses) of FundsCapital Outlay from Non-Current Fund Sources** - - - - - - (1,376,985,064) - (40,274,232) (1,417,259,296) Mandatory and Non-mandatory Transfers (See FN10) 21,255,999 (168,760,433) 7,542,505 (898,722,447) 745,052 52,507,780 803,505,421 101,162,824 384,967,188 304,203,889 Bond Proceeds Transfers In (See FN4) - - - - - - 452,388,346 - - 452,388,346 Debt Service Payments (See FN5) (280,085,059) (160,154,622) (306,404,333) (66,820,124) - - (21,139,232) (160,500,712) (6,757,496) (1,001,861,578) Subtotal (258,829,060) (328,915,055) (298,861,828) (965,542,571) 745,052 52,507,780 (142,230,529) (59,337,888) 337,935,460 (1,662,528,639)
Other Items Not for Current Operating UseUnrealized Gains / (Losses) (See FN6) 1,878,684 (6,019,656) 2,671,876 11,511,536 192,650 71,938,979 5,751,263 (508,614) (164,905) 87,251,813 Additions to Permanent Endowments (See FN7) - - - 16,665 - 165,561,900 - - - 165,578,565 Subtotal 1,878,684 (6,019,656) 2,671,876 11,528,201 192,650 237,500,879 5,751,263 (508,614) (164,905) 252,830,378
Total Sources Over / (Under) Uses (See FN 11) 55,013,734 99,951,577 3,574,816 331,752,431 (3,144,410) 293,192,456 (374,879,461) (70,671,415) 300,343,730 635,133,458
Bond Proceeds 7,905,000 1,930,759 3,645,579 - - - (31,314,147) 22,385,994 14,965,715 19,518,900 Depreciation Expense - - - - - - (29,540,563) - (1,357,317,953) (1,386,858,516) Transfer of Capital Asses(s) from System - - - - - - 318 - 872,423,839 872,424,157 Other Post-Employment Benefit (OPEB) Expense - - - - - - - - - - Non-Cash Capital Gifts - 133,300 - 385,981 - - - - 105,190,077 105,709,358 Capital Outlay 42,979,413 73,674,152 17,013,928 38,842,688 - - 759,693,488 - 850,588,099 1,782,791,768 Change in Net Assets (Total Agrees with AFR***) 105,898,147 175,689,788 24,234,323 370,981,100 (3,144,410) 293,192,456 323,959,635 (48,285,421) 786,193,507 2,028,719,125
*Defined as any capital outlay expenses from Educational & General, Designated, Auxiliary, or Restricted Expendable Funds.**Defined as any capital outlay expense from funds other than Educational & General, Designated, Auxiliary, or Restricted Expendable.***As reported for "Changes in Net Position" shown on Schedule of Revenues, Expenses, and Changes in Net Position (SRECNP) in Annual Financial Report.
Summary of All General Academic InstitutionsFor the Year Ended August 31, 2019Source: FY 2019 Annual Financial Report
Detail Worksheet FY 2019
Texas Higher Education Coordinating Board 12 June, 2020

Summary of All General Academic InstitutionsFor the Year Ended August 31, 2019Source: FY 2019 Annual Financial Report
FOOTNOTES:
FN1: Scholarship Discounts and Allowances are scholarships, fellowships, and grants applied to tuition. The discount eliminates tuition revenues that are paid for by University resources which are recorded as revenue elsewhere on the financial statements (i.e. federal and state contracts and grants revenues). In addition, Scholarship Discounts and Allowances eliminate tuition revenue that is exempted from payment due to tuition exemptions approved by the Texas Legislature. Waivers, remissions, and exemptions represent tuition and fee dollars forgone by the university - some are required by statute. See the Integrated Financial Reporting System (IFRS) report submitted to THECB for details on waivers, exemptions, tuition, and fees. Allocation methods to individual funds shown may vary between institutions.
FN2: Endowment and Interest Income includes interest income and endowment payouts.
FN3: Other Income is primarily Other Operating and Other Non-operating Revenues from the AFR. Other Expenses is primarily Other Nonoperating Expenses from the AFR.
FN4: Bond Proceeds are funds received from the sale of bonds and commercial paper used to finance capital projects. This amount includes actual proceeds and accrued or anticipated proceeds to be transferred from System. Independent institutions report only to the extent expended in current year.
FN5: Debt service payments are payments to service and retire debt issued to fund capital projects. System components do this via transfers to System Administrations. Independent institutions use direct payment to appropriate paying agents.
FN6: Unrealized Gains / (Losses) represent the increase in the Fair Market Value of Investments and Endowments. Unrealized Gains / (Losses) are accrued as non-cash transactions. Therefore, funds are not actually received for this revenue stream. Accordingly, this revenue is not cash revenue and cannot be used by the University to fund operations.
FN7: Additions to Permanent Endowments are additions to endowment principal. This revenue is restricted for investment purposes only and cannot be used to fund operations. Only interest income from these endowments, which is reported on the Endowment and Investment Income line of this report, can be used by the University to fund operations.
FN8: Distributions from the Available University Fund appropriated through the Appropriation Bill are first used to pay debt service costs on Permanent University Fund Bonds. Funds remaining are distributed to constitutionally designated institutions to promote academic excellence. Only the Excellence funding is shown at the institution level. The AUF funds used to pay debt service on PUF bonds are reported at the System level.
FN9: Auxiliary Enterprises include athletics, housing and food, student services, and parking and transportation. Auxiliary Enterprises are required to be self-supporting, and therefore must operate on the funds they generate.
FN10: Mandatory and non-mandatory transfers includes transfers between funds, transfers between the University System and institutions and transfers to and from other state agencies. In total, all transfers between funds net to zero with the exception of any amounts transferred between the University System, between other institutions, or to and from another state agency. There are no transfers of education and general funds provided by the State of Texas to restricted or auxiliary fund groups. Transfers between education and general funds and designated funds are related to Texas Public Education Grant as provided by the State of Texas.
FN11: See each individual institution for the revenues received but not yet expended for each institution. This income is fully committed to program expenditures and capital disbursements. The amount of Non-expendable funds for each institution is provided. Non-expendable funds, which include unrealized gains (losses) and additions (reductions) to permanent endowments, are provided for each institution. Unrealized gains (losses) and additions (reductions) to permanent endowments do not contribute to the availability of the institution's operating cash as discussed in FN6 and FN7 above. The total overall increase in Sources Over Uses is provided. If Sources Over Uses is negative, this footnote will be marked N/A.
Texas Higher Education Coordinating Board 13 June, 2020

The University of Texas at ArlingtonFor the Year Ended August 31, 2019Source: FY 2019 Annual Financial Report
Non-Operating Funds are not included in above charts. See following page (Summary).Charts May Not Add to 100% Due to Rounding
Total Operating Sources $744,501,300
Total Operating Sources $744,501,300
Total Operating Uses $632,988,693
State of Texas$154,511,028
21%
Student & Parent$327,476,565
44%
Federal Government$114,055,253
15%
Institutional Resources$148,458,454
20%
Operating Sources by Category
State Appropriations$131,657,726
18%
State Grants & Contracts
$22,853,3023%
Tuition & Fees$327,476,565
44%
Federal Grants & Contracts
$114,055,25315%
Endowment & Interest Income
$26,663,7024%
Local Government Grants
$1,466,4180%
Private Gifts & Grants$22,216,794
3%
Sales & Services$32,882,975
4%
Net Auxiliary Enterprises$50,367,537
7%
Other Income$14,861,028
2%
Operating Sources
Instruction$186,376,760
30%
Research$96,479,806
15%
Public Service$14,459,423
2%
Academic Support$50,643,636
8%Student Services
$93,479,92215%
Institutional Support$51,039,043
8%
Operations & Maintenance of Plant
$36,101,6056%
Scholarships & Fellowships$32,236,353
5%
Auxiliary Enterprises$58,709,592
9%Capital Outlay
$12,856,1912%
Other Expenses$606,362
0%
Operating Uses
Texas Higher Education Coordinating Board 14 June, 2020

The University of Texas at ArlingtonFor the Year Ended August 31, 2019Source: FY 2019 Annual Financial Report
Summary Worksheet FY 2019 Amount Per FTSEInstitution State Funded FTSEs 34,150.28
Operating SourcesState of TexasState Appropriations 131,657,726$ 3,855$ State Grants and Contracts - Restricted 22,853,302 669 Higher Education Fund - - Available University Fund Excellence (See FN8) - - Subtotal 154,511,028$ 4,524$
Student & ParentTuition - net 223,528,983$ 6,545$ Fees - net 103,947,582 3,044 Tuition and Fees (net of Scholarship Discounts and Allowances) 327,476,565$ 9,589$
Federal GovernmentFederal Grants and Contracts - Restricted 114,055,253$ 3,340$
Institutional ResourcesEndowment and Interest Income (See FN2) 26,663,702$ 781$ Local Government Grants - Restricted 1,466,418 43 Private Gifts and Grants - Restricted 22,216,794 651 Sales and Services 32,882,975 963 Net Auxiliary Enterprises (See FN9) 50,367,537 1,475 Other Income (See FN3) 14,861,028 435 Subtotal 148,458,454$ 4,348$ Total Operating Sources 744,501,300$ 21,801$
Operating UsesInstruction 186,376,760$ 5,458$ Research 96,479,806 2,825 Public Service 14,459,423 423 Academic Support 50,643,636 1,483 Student Services 93,479,922 2,737 Institutional Support 51,039,043 1,495 Operations and Maintenance of Plant 36,101,605 1,057 Scholarships and Fellowships 32,236,353 944 Auxiliary Enterprises (See FN9) 58,709,592 1,719 Capital Outlay from Current Fund Sources 12,856,191 376 Other Expenses (See FN3) 606,362 18 Total Operating Uses 632,988,693$ 18,535$
Other Sources / (Uses) of FundsCapital Outlay from Non-Current Fund Sources (17,303,554) (507)$ Mandatory and Non-mandatory Transfers (See FN10) 1,150,265 34 Bond Proceeds Transfers (See FN4) 20,892,905 612 Debt Service Payments (See FN5) (33,833,206) (991) Subtotal (29,093,590)$ (852)$
Other Items Not for Current Operating UseUnrealized Gains / (Losses) (See FN6) 2,727,808 80$ Additions to Permanent Endowments (See FN7) 3,267,366 96 Subtotal 5,995,174$ 176$
Total Sources Over / (Under) Uses (See FN11) 88,414,191$ 2,590$
Texas Higher Education Coordinating Board 15 June, 2020

FY 2019
Operating SourcesEducational &
General DesignatedAuxiliary
EnterprisesRestricted
Expendable Loan Funds
Annuity, Life & Endowment and Similar Funds
Unexpended Plant
Retirement of Indebtedness
Investment In Plant Primary University
State of TexasState Appropriations 131,657,726 - - - - - - - - 131,657,726 State Grants and Contracts - Restricted 18,030,966 1,134,074 - 3,688,262 - - - - - 22,853,302 Higher Education Fund - - - - - - - - - - Available University Fund Excellence (See FN8) - - - - - - - - - - Subtotal 149,688,692 1,134,074 - 3,688,262 - - - - - 154,511,028
Student & ParentTuition Potential 100% 111,338,997 220,142,876 - - - - - - - 331,481,873 Waivers - Statutory (Not Reported in AFR) (20,632,245) (3,725,324) - - - - - - - (24,357,569) Waivers - Institutional (Not Reported in AFR) - - - - - - - - - - Exemptions - Statutory (Not Reported in AFR) - - - - - - - - - - Exemptions - Institutional (Not Reported in AFR) - - - - - - - - - - Tuition - Gross - AFR Presentation 90,706,752 216,417,552 - - - - - - - 307,124,304 Waivers - Statutory (Reported in AFR) - - - - - - - - - - Waivers - Institutional (Reported in AFR) - - - - - - - - - - Exemptions - Statutory (Reported in AFR) (10,153,524) (1,833,275) - - - - - - - (11,986,799) Exemptions - Institutional (Reported in AFR) - - - - - - - - - - All Other Scholarship Disc.& Allow. (See FN1) (14,535,698) (57,072,824) - - - - - - - (71,608,522) Tuition - net 66,017,530 157,511,453 - - - - - - - 223,528,983
Fees Potential 100% 1,722 122,590,917 24,528,007 - - - - - - 147,120,646 Waivers - Statutory (Not Reported in AFR) (319) (1,146,254) (3,152,197) - - - - - - (4,298,770) Waivers - Institutional (Not Reported in AFR) - - - - - - - - - - Exemptions - Statutory (Not Reported in AFR) - - - - - - - - - - Exemptions - Institutional (Not Reported in AFR) - - - - - - - - - - Fees - Gross - AFR Presentation 1,403 121,444,663 21,375,810 - - - - - - 142,821,876 Waivers - Statutory (Reported in AFR) - - - - - - - - - - Waivers - Institutional (Reported in AFR) - - - - - - - - - - Exemptions - Statutory (Reported in AFR) - (564,085) (1,551,233) - - - - - - (2,115,318) Exemptions - Institutional (Reported in AFR) - - - - - - - - - - All Other Scholarship Disc.& Allow. (See FN1) (382) (32,491,604) (4,266,990) - - - - - - (36,758,976) Fees - net 1,021 88,388,974 15,557,587 - - - - - - 103,947,582
Net Tuition and Fees (Funds Collected) 66,018,551 245,900,427 15,557,587 - - - - - - 327,476,565
Federal GovernmentFederal Grants and Contracts - Restricted - 11,332,736 - 102,722,517 - - - - - 114,055,253
Institutional ResourcesEndowment and Interest Income (See FN2) 1,204,605 15,978,898 1,384,164 7,287,144 8,971 13,614 786,306 - - 26,663,702 Local Government Grants - Restricted - 141,334 - 1,325,084 - - - - - 1,466,418 Private Gifts and Grants - Restricted - 948,072 - 17,509,418 - - 3,759,304 - - 22,216,794 Sales and Services 55,426 27,371,785 - 5,455,764 - - - - - 32,882,975 Net Auxiliary Enterprises (See FN9) - - 50,367,537 - - - - - - 50,367,537 Other Income (See FN3) 9,642,183 6,743,855 - (1,147,283) 454,299 - 476,324 - (1,308,350) 14,861,028 Subtotal 10,902,214 51,183,944 51,751,701 30,430,127 463,270 13,614 5,021,934 - (1,308,350) 148,458,454 Total Operating Sources 226,609,457 309,551,181 67,309,288 136,840,906 463,270 13,614 5,021,934 - (1,308,350) 744,501,300
Operating UsesInstruction 126,731,650 54,006,199 - 5,638,911 - - - - - 186,376,760 Research 12,548,869 39,560,366 - 44,370,571 - - - - - 96,479,806 Public Service 259,753 2,169,655 - 12,030,015 - - - - - 14,459,423 Academic Support 16,703,365 33,577,475 - 362,796 - - - - - 50,643,636 Student Services 8,666,335 83,514,100 - 374,532 924,955 - - - - 93,479,922 Institutional Support 18,429,959 32,087,091 - 521,993 - - - - - 51,039,043 Operations and Maintenance of Plant 25,362,334 6,266,116 - - - - 4,473,155 - - 36,101,605 Scholarships and Fellowships 4,377,325 11,236,856 - 16,622,172 - - - - - 32,236,353 Auxiliary Enterprises (See FN9) - 458,148 57,671,173 580,271 - - - - - 58,709,592 Capital Outlay from Current Fund Sources* 40,416 7,658,503 510,515 4,646,757 - - - - - 12,856,191 Other Expenses (See FN3) - 80,805 - - 25,487 - - - 500,070 606,362 Total Operating Uses 213,120,006 270,615,314 58,181,688 85,148,018 950,442 - 4,473,155 - 500,070 632,988,693
Other Sources / (Uses) of FundsCapital Outlay from Non-Current Fund Sources** - - - - - - (17,303,554) - - (17,303,554) Mandatory and Non-mandatory Transfers (See FN10) (661,689) 18,307,958 6,412,093 (49,982,651) - 665,736 26,403,310 - 5,508 1,150,265 Bond Proceeds Transfers In (See FN4) - - - - - - 20,892,905 - - 20,892,905 Debt Service Payments (See FN5) (12,827,762) (3,004,324) (17,413,928) - - - (587,192) - - (33,833,206) Subtotal (13,489,451) 15,303,634 (11,001,835) (49,982,651) - 665,736 29,405,469 - 5,508 (29,093,590)
Other Items Not for Current Operating UseUnrealized Gains / (Losses) (See FN6) - 2,548,724 331,243 502,630 (7,222) (1,093,975) 446,408 - - 2,727,808 Additions to Permanent Endowments (See FN7) - - - - - 3,267,366 - - - 3,267,366 Subtotal - 2,548,724 331,243 502,630 (7,222) 2,173,391 446,408 - - 5,995,174
Total Sources Over / (Under) Uses (See FN 11) - 56,788,225 (1,542,992) 2,212,867 (494,394) 2,852,741 30,400,656 - (1,802,912) 88,414,191
Bond Proceeds - - - - - - - - - - Depreciation Expense - - - - - - - - (55,273,125) (55,273,125) Transfer of Capital Asses(s) from System - - - - - - - - - - Other Post-Employment Benefit (OPEB) Expense - - - - - - - - - - Non-Cash Capital Gifts - - - - - - - - 622,819 622,819 Capital Outlay - - - - - - - - 30,159,746 30,159,746 Change in Net Assets (Total Agrees with AFR***) - 56,788,225 (1,542,992) 2,212,867 (494,394) 2,852,741 30,400,656 - (26,293,472) 63,923,631
*Defined as any capital outlay expenses from Educational & General, Designated, Auxiliary, or Restricted Expendable Funds.**Defined as any capital outlay expense from funds other than Educational & General, Designated, Auxiliary, or Restricted Expendable.***As reported for "Changes in Net Position" shown on Schedule of Revenues, Expenses, and Changes in Net Position (SRECNP) in Annual Financial Report.
The University of Texas at ArlingtonFor the Year Ended August 31, 2019Source: FY 2019 Annual Financial Report
Detail Worksheet FY 2019
Texas Higher Education Coordinating Board 16 June, 2020

The University of Texas at ArlingtonFor the Year Ended August 31, 2019Source: FY 2019 Annual Financial Report
FOOTNOTES:
FN1: Scholarship Discounts and Allowances are scholarships, fellowships, and grants applied to tuition. The discount eliminates tuition revenues that are paid for by University resources which are recorded as revenue elsewhere on the financial statements (i.e. federal and state contracts and grants revenues). In addition, Scholarship Discounts and Allowances eliminate tuition revenue that is exempted from payment due to tuition exemptions approved by the Texas Legislature. Waivers, remissions, and exemptions represent tuition and fee dollars forgone by the university - some are required by statute. See the Integrated Financial Reporting System (IFRS) report submitted to THECB for details on waivers, exemptions, tuition, and fees. Allocation methods to individual funds shown may vary between institutions.
FN2: Endowment and Interest Income includes interest income and endowment payouts.
FN3: Other Income is primarily Other Operating and Other Non-operating Revenues from the AFR. Other Expenses is primarily Other Nonoperating Expenses from the AFR.
FN4: Bond Proceeds are funds received from the sale of bonds and commercial paper used to finance capital projects. This amount includes actual proceeds and accrued or anticipated proceeds to be transferred from System. Independent institutions report only to the extent expended in current year.
FN5: Debt service payments are payments to service and retire debt issued to fund capital projects. System components do this via transfers to System Administrations. Independent institutions use direct payment to appropriate paying agents.
FN6: Unrealized Gains / (Losses) represent the increase in the Fair Market Value of Investments and Endowments. Unrealized Gains / (Losses) are accrued as non-cash transactions. Therefore, funds are not actually received for this revenue stream. Accordingly, this revenue is not cash revenue and cannot be used by the University to fund operations.
FN7: Additions to Permanent Endowments are additions to endowment principal. This revenue is restricted for investment purposes only and cannot be used to fund operations. Only interest income from these endowments, which is reported on the Endowment and Investment Income line of this report, can be used by the University to fund operations.
FN8: Distributions from the Available University Fund appropriated through the Appropriation Bill are first used to pay debt service costs on Permanent University Fund Bonds. Funds remaining are distributed to constitutionally designated institutions to promote academic excellence. Only the Excellence funding is shown at the institution level. The AUF funds used to pay debt service on PUF bonds are reported at the System level.
FN9: Auxiliary Enterprises include athletics, housing and food, student services, and parking and transportation. Auxiliary Enterprises are required to be self-supporting, and therefore must operate on the funds they generate.
FN10: Mandatory and non-mandatory transfers includes transfers between funds, transfers between the University System and institutions and transfers to and from other state agencies. In total, all transfers between funds net to zero with the exception of any amounts transferred between the University System, between other institutions, or to and from another state agency. There are no transfers of education and general funds provided by the State of Texas to restricted or auxiliary fund groups. Transfers between education and general funds and designated funds are related to Texas Public Education Grant as provided by the State of Texas.
FN11: Of the net increase of $88,414,191 approximately $82.4 million represents revenues received but not yet expended. This income is fully committed to program expenditures and capital disbursements. The remaining $6.0 million represents non-expendable funds from unrealized gains and additions to permanent endowments of approximately $2.7 million and $3.3 million respectively. Unrealized gains and additions to permanent endowments do not contribute to the availability of the institution's operating cash as discussed in FN6 and FN7.
Texas Higher Education Coordinating Board 17 June, 2020

The University of Texas at Austin - Academic & Health (A+H)(Excludes Medical School)For the Year Ended August 31, 2019Source: FY 2019 Annual Financial Report
Non-Operating Funds are not included in above charts. See following page (Summary).Charts May Not Add to 100% Due to Rounding
Total Operating Sources $3,113,498,266
Total Operating Sources $3,113,498,266
Total Operating Uses $2,530,745,388
State of Texas$786,909,961
25%
Student & Parent$511,948,039
17%Federal Government
$495,487,91216%
Institutional Resources$1,319,152,354
42%
Operating Sources by Category
State Appropriations$349,785,371
11%
State Grants & Contracts
$58,182,7802%
Available University Fund Excellence
$378,941,81012%
Tuition & Fees$511,948,039
16%
Federal Grants & Contracts
$495,487,91216%
Endowment & Interest Income
$275,497,0389%
Local Government Grants
$4,592,8600%
Private Gifts & Grants$366,016,271
12%
Sales & Services$306,478,073
10%
Net Auxiliary Enterprises
$346,376,00711%
Other Income$20,192,105
1%
Operating Sources
Instruction$670,527,645
27%
Research$483,734,046
19%
Public Service$119,601,155
5%
Academic Support$306,405,907
12%Student Services
$52,333,3072%
Institutional Support$160,869,834
6%
Operations & Maintenance of Plant
$212,233,2488%
Scholarships & Fellowships$120,601,329
5%Auxiliary Enterprises
$321,448,23413%
Capital Outlay$82,274,490
3%
Other Expenses$716,193
0%
Operating Uses
Texas Higher Education Coordinating Board 18 June, 2020

The University of Texas at Austin - Academic & Health (A+H)(Excludes Medical School)For the Year Ended August 31, 2019Source: FY 2019 Annual Financial Report
Summary Worksheet FY 2019 Amount Per FTSEInstitution State Funded FTSEs 47,775.06
Operating SourcesState of TexasState Appropriations 349,785,371$ 7,322$ State Grants and Contracts - Restricted 58,182,780 1,218 Higher Education Fund - - Available University Fund Excellence (See FN8) 378,941,810 7,932 Subtotal 786,909,961$ 16,472$
Student & ParentTuition - net 394,479,359$ 8,257$ Fees - net 117,468,680 2,459 Tuition and Fees (net of Scholarship Discounts and Allowances) 511,948,039$ 10,716$
Federal GovernmentFederal Grants and Contracts - Restricted 495,487,912$ 10,371$
Institutional ResourcesEndowment and Interest Income (See FN2) 275,497,038$ 5,767$ Local Government Grants - Restricted 4,592,860 96 Private Gifts and Grants - Restricted 366,016,271 7,661 Sales and Services 306,478,073 6,415 Net Auxiliary Enterprises (See FN9) 346,376,007 7,250 Other Income (See FN3) 20,192,105 423 Subtotal 1,319,152,354$ 27,612$ Total Operating Sources 3,113,498,266$ 65,171$
Operating UsesInstruction 670,527,645$ 14,035$ Research 483,734,046 10,125 Public Service 119,601,155 2,503 Academic Support 306,405,907 6,414 Student Services 52,333,307 1,095 Institutional Support 160,869,834 3,367 Operations and Maintenance of Plant 212,233,248 4,442 Scholarships and Fellowships 120,601,329 2,524 Auxiliary Enterprises (See FN9) 321,448,234 6,728 Capital Outlay from Current Fund Sources 82,274,490 1,722 Other Expenses (See FN3) 716,193 15 Total Operating Uses 2,530,745,388$ 52,970$
Other Sources / (Uses) of FundsCapital Outlay from Non-Current Fund Sources (293,741,508) (6,148)$ Mandatory and Non-mandatory Transfers (See FN10) 18,541,686 388 Bond Proceeds Transfers (See FN4) 116,738,070 2,443 Debt Service Payments (See FN5) (125,299,099) (2,623) Subtotal (283,760,851)$ (5,940)$
Other Items Not for Current Operating UseUnrealized Gains / (Losses) (See FN6) 122,987,844 2,574$ Additions to Permanent Endowments (See FN7) 117,971,704 2,469 Subtotal 240,959,548$ 5,043$
Total Sources Over / (Under) Uses (See FN11) 539,951,575$ 11,304$
Texas Higher Education Coordinating Board 19 June, 2020

(Excludes Medical School)For the Year Ended August 31, 2019Source: FY 2019 Annual Financial Report
Detail Worksheet FY 2019FY 2019
Operating SourcesEducational &
General DesignatedAuxiliary
EnterprisesRestricted
Expendable Loan Funds
Annuity, Life & Endowment and Similar Funds
Unexpended Plant
Retirement of Indebtedness
Investment In Plant Primary University
State of TexasState Appropriations 349,785,371 - - - - - - - - 349,785,371 State Grants and Contracts - Restricted 32,781,176 15,609,404 - 9,792,200 - - - - - 58,182,780 Higher Education Fund - - - - - - - - - - Available University Fund Excellence (See FN8) 378,941,810 - - - - - - - - 378,941,810 Subtotal 761,508,357 15,609,404 - 9,792,200 - - - - - 786,909,961
Student & ParentTuition Potential 100% 176,868,909 427,347,701 - - - - - - - 604,216,610 Waivers - Statutory (Not Reported in AFR) (50,064,581) (14,169,163) - - - - - - - (64,233,744) Waivers - Institutional (Not Reported in AFR) - - - - - - - - - - Exemptions - Statutory (Not Reported in AFR) - - - - - - - - - - Exemptions - Institutional (Not Reported in AFR) - - - - - - - - - - Tuition - Gross - AFR Presentation 126,804,328 413,178,538 - - - - - - - 539,982,866 Waivers - Statutory (Reported in AFR) - - - - - - - - - - Waivers - Institutional (Reported in AFR) - - - - - - - - - - Exemptions - Statutory (Reported in AFR) (2,388,421) (17,250,709) - - - - - - - (19,639,130) Exemptions - Institutional (Reported in AFR) - - - - - - - - - - All Other Scholarship Disc.& Allow. (See FN1) (29,533,506) (96,330,871) - - - - - - - (125,864,377) Tuition - net 94,882,401 299,596,958 - - - - - - - 394,479,359
Fees Potential 100% 166,490 109,698,972 44,449,257 - - - - - - 154,314,719 Waivers - Statutory (Not Reported in AFR) - - - - - - - - - - Waivers - Institutional (Not Reported in AFR) - - - - - - - - - - Exemptions - Statutory (Not Reported in AFR) - - - - - - - - - - Exemptions - Institutional (Not Reported in AFR) - - - - - - - - - - Fees - Gross - AFR Presentation 166,490 109,698,972 44,449,257 - - - - - - 154,314,719 Waivers - Statutory (Reported in AFR) - - - - - - - - - - Waivers - Institutional (Reported in AFR) - - - - - - - - - - Exemptions - Statutory (Reported in AFR) - (1,248,711) - - - - - - - (1,248,711) Exemptions - Institutional (Reported in AFR) - - - - - - - - - - All Other Scholarship Disc.& Allow. (See FN1) (38,777) (25,456,107) (10,102,444) - - - - - - (35,597,328) Fees - net 127,713 82,994,154 34,346,813 - - - - - - 117,468,680
Net Tuition and Fees (Funds Collected) 95,010,114 382,591,112 34,346,813 - - - - - - 511,948,039
Federal GovernmentFederal Grants and Contracts - Restricted - 101,976,702 - 393,511,210 - - - - - 495,487,912
Institutional ResourcesEndowment and Interest Income (See FN2) 6,843,227 68,413,947 5,327,802 187,632,934 721,328 1,910,111 4,647,689 - - 275,497,038 Local Government Grants - Restricted - 486,922 - 4,105,938 - - - - - 4,592,860 Private Gifts and Grants - Restricted - 12,575,137 - 353,441,134 - - - - - 366,016,271 Sales and Services 91,131 286,748,560 - 19,638,382 - - - - - 306,478,073 Net Auxiliary Enterprises (See FN9) - - 346,376,007 - - - - - - 346,376,007 Other Income (See FN3) 176,849 10,911,231 - 32,099 1,280,467 - - - 7,791,459 20,192,105 Subtotal 7,111,207 379,135,797 351,703,809 564,850,487 2,001,795 1,910,111 4,647,689 - 7,791,459 1,319,152,354 Total Operating Sources 863,629,678 879,313,015 386,050,622 968,153,897 2,001,795 1,910,111 4,647,689 - 7,791,459 3,113,498,266
Operating UsesInstruction 447,527,341 138,482,577 - 84,517,727 - - - - - 670,527,645 Research 43,979,681 41,111,246 - 398,643,119 - - - - - 483,734,046 Public Service 2,554,178 63,372,951 - 53,674,026 - - - - - 119,601,155 Academic Support 87,372,531 163,791,640 - 55,241,736 - - - - - 306,405,907 Student Services 13,301,268 35,046,379 - 2,778,484 1,207,176 - - - - 52,333,307 Institutional Support 73,444,425 78,049,400 - 9,376,009 - - - - - 160,869,834 Operations and Maintenance of Plant 337,565 150,332,066 - 4,206 - - 61,559,411 - - 212,233,248 Scholarships and Fellowships 36,346,247 38,498,231 - 45,756,851 - - - - - 120,601,329 Auxiliary Enterprises (See FN9) - - 275,284,630 46,163,604 - - - - - 321,448,234 Capital Outlay from Current Fund Sources* 13,211,686 35,640,540 1,021,924 32,400,340 - - - - - 82,274,490 Other Expenses (See FN3) - 288,477 5,060 23,161 - - - - 399,495 716,193 Total Operating Uses 718,074,922 744,613,507 276,311,614 728,579,263 1,207,176 - 61,559,411 - 399,495 2,530,745,388
Other Sources / (Uses) of FundsCapital Outlay from Non-Current Fund Sources** - - - - - - (293,741,508) - - (293,741,508) Mandatory and Non-mandatory Transfers (See FN10) (9,562,165) (44,888,681) (62,867,506) (168,121,490) (41,350) 28,976,481 286,650,553 - (11,604,156) 18,541,686 Bond Proceeds Transfers In (See FN4) - - - - - - 116,738,070 - - 116,738,070 Debt Service Payments (See FN5) (20,817,912) (54,248,236) (47,446,430) (1,650,040) - - (1,136,481) - - (125,299,099) Subtotal (30,380,077) (99,136,917) (110,313,936) (169,771,530) (41,350) 28,976,481 108,510,634 - (11,604,156) (283,760,851)
Other Items Not for Current Operating UseUnrealized Gains / (Losses) (See FN6) 1,473,633 12,491,209 3,283,814 9,457,783 478,338 89,976,106 5,826,961 - - 122,987,844 Additions to Permanent Endowments (See FN7) - - - - - 117,971,704 - - - 117,971,704 Subtotal 1,473,633 12,491,209 3,283,814 9,457,783 478,338 207,947,810 5,826,961 - - 240,959,548
Total Sources Over / (Under) Uses (See FN 11) 116,648,312 48,053,800 2,708,886 79,260,887 1,231,607 238,834,402 57,425,873 - (4,212,192) 539,951,575
Bond Proceeds - - - - - - - - - - Depreciation Expense - - - - - - - - (313,996,920) (313,996,920) Transfer of Capital Asses(s) from System - - - - - - - - - - Other Post-Employment Benefit (OPEB) Expense - - - - - - - - - - Non-Cash Capital Gifts - - - - - - - - 37,637,472 37,637,472 Capital Outlay - - - - - - - - 376,015,999 376,015,999 Change in Net Assets (Total Agrees with AFR***) 116,648,312 48,053,800 2,708,886 79,260,887 1,231,607 238,834,402 57,425,873 - 95,444,359 639,608,126
*Defined as any capital outlay expenses from Educational & General, Designated, Auxiliary, or Restricted Expendable Funds.**Defined as any capital outlay expense from funds other than Educational & General, Designated, Auxiliary, or Restricted Expendable.***As reported for "Changes in Net Position" shown on Schedule of Revenues, Expenses, and Changes in Net Position (SRECNP) in Annual Financial Report.
The University of Texas at Austin - Academic & Health (A+H)
Texas Higher Education Coordinating Board 20 June, 2020

The University of Texas at Austin - Academic & Health (A+H)(Excludes Medical School)For the Year Ended August 31, 2019Source: FY 2019 Annual Financial ReportFOOTNOTES:
FN1: Scholarship Discounts and Allowances are scholarships, fellowships, and grants applied to tuition. The discount eliminates tuition revenues that are paid for by University resources which are recorded as revenue elsewhere on the financial statements (i.e. federal and state contracts and grants revenues). In addition, Scholarship Discounts and Allowances eliminate tuition revenue that is exempted from payment due to tuition exemptions approved by the Texas Legislature. Waivers, remissions, and exemptions represent tuition and fee dollars forgone by the university - some are required by statute. See the Integrated Financial Reporting System (IFRS) report submitted to THECB for details on waivers, exemptions, tuition, and fees. Allocation methods to individual funds shown may vary between institutions.
FN2: Endowment and Interest Income includes interest income and endowment payouts.
FN3: Other Income is primarily Other Operating and Other Non-operating Revenues from the AFR. Other Expenses is primarily Other Nonoperating Expenses from the AFR.
FN4: Bond Proceeds are funds received from the sale of bonds and commercial paper used to finance capital projects. This amount includes actual proceeds and accrued or anticipated proceeds to be transferred from System. Independent institutions report only to the extent expended in current year.
FN5: Debt service payments are payments to service and retire debt issued to fund capital projects. System components do this via transfers to System Administrations. Independent institutions use direct payment to appropriate paying agents.
FN6: Unrealized Gains / (Losses) represent the increase in the Fair Market Value of Investments and Endowments. Unrealized Gains / (Losses) are accrued as non-cash transactions. Therefore, funds are not actually received for this revenue stream. Accordingly, this revenue is not cash revenue and cannot be used by the University to fund operations.
FN7: Additions to Permanent Endowments are additions to endowment principal. This revenue is restricted for investment purposes only and cannot be used to fund operations. Only interest income from these endowments, which is reported on the Endowment and Investment Income line of this report, can be used by the University to fund operations.
FN8: Distributions from the Available University Fund appropriated through the Appropriation Bill are first used to pay debt service costs on Permanent University Fund Bonds. Funds remaining are distributed to constitutionally designated institutions to promote academic excellence. Only the Excellence funding is shown at the institution level. The AUF funds used to pay debt service on PUF bonds are reported at the System level.
FN9: Auxiliary Enterprises include athletics, housing and food, student services, and parking and transportation. Auxiliary Enterprises are required to be self-supporting, and therefore must operate on the funds they generate.
FN10: Mandatory and non-mandatory transfers includes transfers between funds, transfers between the University System and institutions and transfers to and from other state agencies. In total, all transfers between funds net to zero with the exception of any amounts transferred between the University System, between other institutions, or to and from another state agency. There are no transfers of education and general funds provided by the State of Texas to restricted or auxiliary fund groups. Transfers between education and general funds and designated funds are related to Texas Public Education Grant as provided by the State of Texas.
FN11: Of the net increase of $539,951,575 approximately $299.0 million represents revenues received but not yet expended. This income is fully committed to program expenditures and capital disbursements. The remaining $241.0 million represents non-expendable funds from unrealized gains and additions to permanent endowments of approximately $123.0 million and $118.0 million respectively. Unrealized gains and additions to permanent endowments do not contribute to the availability of the institution's operating cash as discussed in FN6 and FN7.
Texas Higher Education Coordinating Board 21 June, 2020

The University of Texas at DallasFor the Year Ended August 31, 2019Source: FY 2019 Annual Financial Report
Non-Operating Funds are not included in above charts. See following page (Summary).Charts May Not Add to 100% Due to Rounding
Total Operating Sources $688,226,205
Total Operating Sources $688,226,205
Total Operating Uses $607,017,006
State of Texas$123,795,871
18%
Student & Parent$293,275,806
43%
Federal Government$82,490,262
12%
Institutional Resources$188,664,266
27%
Operating Sources by Category
State Appropriations$108,550,172
16%
State Grants & Contracts
$15,245,6992%
Tuition & Fees$293,275,806
43%
Federal Grants & Contracts
$82,490,26212%
Endowment & Interest Income
$37,192,7615%
Local Government Grants$2,357
0%
Private Gifts & Grants$44,957,744
6%
Sales & Services$38,566,025
6%
Net Auxiliary Enterprises$62,449,553
9%
Other Income$5,495,826
1%
Operating Sources
Instruction$198,889,758
33%
Research$99,779,383
16%
Public Service$13,600,096
2%
Academic Support$63,485,371
11% Student Services$19,146,220
3%
Institutional Support$48,073,538
8%
Operations & Maintenance of Plant
$45,690,1308%
Scholarships & Fellowships$42,531,644
7%Auxiliary Enterprises$60,918,532
10%
Capital Outlay$14,897,335
2%
Operating Uses
Texas Higher Education Coordinating Board 22 June, 2020

The University of Texas at DallasFor the Year Ended August 31, 2019Source: FY 2019 Annual Financial Report
Summary Worksheet FY 2019 Amount Per FTSEInstitution State Funded FTSEs 24,293.71
Operating SourcesState of TexasState Appropriations 108,550,172$ 4,468$ State Grants and Contracts - Restricted 15,245,699 628 Higher Education Fund - - Available University Fund Excellence (See FN8) - - Subtotal 123,795,871$ 5,096$
Student & ParentTuition - net 198,904,738$ 8,187$ Fees - net 94,371,068 3,885 Tuition and Fees (net of Scholarship Discounts and Allowances) 293,275,806$ 12,072$
Federal GovernmentFederal Grants and Contracts - Restricted 82,490,262$ 3,396$
Institutional ResourcesEndowment and Interest Income (See FN2) 37,192,761$ 1,531$ Local Government Grants - Restricted 2,357 - Private Gifts and Grants - Restricted 44,957,744 1,851 Sales and Services 38,566,025 1,587 Net Auxiliary Enterprises (See FN9) 62,449,553 2,571 Other Income (See FN3) 5,495,826 226 Subtotal 188,664,266$ 7,766$ Total Operating Sources 688,226,205$ 28,330$
Operating UsesInstruction 198,889,758$ 8,187$ Research 99,779,383 4,107 Public Service 13,600,096 560 Academic Support 63,485,371 2,613 Student Services 19,146,220 788 Institutional Support 48,073,538 1,979 Operations and Maintenance of Plant 45,690,130 1,881 Scholarships and Fellowships 42,531,644 1,751 Auxiliary Enterprises (See FN9) 60,918,532 2,508 Capital Outlay from Current Fund Sources 14,897,335 613 Other Expenses (See FN3) 4,999 - Total Operating Uses 607,017,006$ 24,987$
Other Sources / (Uses) of FundsCapital Outlay from Non-Current Fund Sources (65,028,169) (2,677)$ Mandatory and Non-mandatory Transfers (See FN10) 14,505,547 597 Bond Proceeds Transfers (See FN4) 58,930,939 2,426 Debt Service Payments (See FN5) (62,557,311) (2,575) Subtotal (54,148,994)$ (2,229)$
Other Items Not for Current Operating UseUnrealized Gains / (Losses) (See FN6) 22,638,312 932$ Additions to Permanent Endowments (See FN7) 6,204,570 255 Subtotal 28,842,882$ 1,187$
Total Sources Over / (Under) Uses (See FN11) 55,903,087$ 2,301$
Texas Higher Education Coordinating Board 23 June, 2020

FY 2019
Operating SourcesEducational &
General DesignatedAuxiliary
EnterprisesRestricted
Expendable Loan Funds
Annuity, Life & Endowment and Similar Funds
Unexpended Plant
Retirement of Indebtedness
Investment In Plant Primary University
State of TexasState Appropriations 108,550,172 - - - - - - - - 108,550,172 State Grants and Contracts - Restricted 12,184,135 - - 3,061,564 - - - - - 15,245,699 Higher Education Fund - - - - - - - - - - Available University Fund Excellence (See FN8) - - - - - - - - - - Subtotal 120,734,307 - - 3,061,564 - - - - - 123,795,871
Student & ParentTuition Potential 100% 97,071,131 258,531,742 - - - - - - - 355,602,873 Waivers - Statutory (Not Reported in AFR) (25,729,194) (17,132,651) - - - - - - - (42,861,845) Waivers - Institutional (Not Reported in AFR) - - - - - - - - - - Exemptions - Statutory (Not Reported in AFR) - - - - - - - - - - Exemptions - Institutional (Not Reported in AFR) - - - - - - - - - - Tuition - Gross - AFR Presentation 71,341,937 241,399,091 - - - - - - - 312,741,028 Waivers - Statutory (Reported in AFR) - - - - - - - - - - Waivers - Institutional (Reported in AFR) - - - - - - - - - - Exemptions - Statutory (Reported in AFR) (814,002) (6,911,917) - - - - - - - (7,725,919) Exemptions - Institutional (Reported in AFR) - - - - - - - - - - All Other Scholarship Disc.& Allow. (See FN1) (20,393,605) (85,716,766) - - - - - - - (106,110,371) Tuition - net 50,134,330 148,770,408 - - - - - - - 198,904,738
Fees Potential 100% 631,092 73,165,699 29,524,862 - - - - - - 103,321,653 Waivers - Statutory (Not Reported in AFR) - (207,446) (61,431) - - - - - - (268,877) Waivers - Institutional (Not Reported in AFR) - - - - - - - - - - Exemptions - Statutory (Not Reported in AFR) - - - - - - - - - - Exemptions - Institutional (Not Reported in AFR) - - - - - - - - - - Fees - Gross - AFR Presentation 631,092 72,958,253 29,463,431 - - - - - - 103,052,776 Waivers - Statutory (Reported in AFR) - - - - - - - - - - Waivers - Institutional (Reported in AFR) - - - - - - - - - - Exemptions - Statutory (Reported in AFR) - - (969,463) - - - - - - (969,463) Exemptions - Institutional (Reported in AFR) - - - - - - - - - - All Other Scholarship Disc.& Allow. (See FN1) - - (7,712,245) - - - - - - (7,712,245) Fees - net 631,092 72,958,253 20,781,723 - - - - - - 94,371,068
Net Tuition and Fees (Funds Collected) 50,765,422 221,728,661 20,781,723 - - - - - - 293,275,806
Federal GovernmentFederal Grants and Contracts - Restricted - 14,493,890 - 67,996,372 - - - - - 82,490,262
Institutional ResourcesEndowment and Interest Income (See FN2) 749,536 15,091,221 - 20,961,549 22,118 368,337 - - - 37,192,761 Local Government Grants - Restricted - - - 2,357 - - - - - 2,357 Private Gifts and Grants - Restricted - 3,113,365 - 41,289,375 - - 555,004 - - 44,957,744 Sales and Services 7,152,171 30,348,285 - 1,065,569 - - - - - 38,566,025 Net Auxiliary Enterprises (See FN9) - - 62,449,553 - - - - - - 62,449,553 Other Income (See FN3) 3,812 5,119,302 - 639,031 1,787 - - - (268,106) 5,495,826 Subtotal 7,905,519 53,672,173 62,449,553 63,957,881 23,905 368,337 555,004 - (268,106) 188,664,266 Total Operating Sources 179,405,248 289,894,724 83,231,276 135,015,817 23,905 368,337 555,004 - (268,106) 688,226,205
Operating UsesInstruction 120,659,452 76,813,064 - 1,417,242 - - - - - 198,889,758 Research 12,790,303 26,136,082 - 60,852,998 - - - - - 99,779,383 Public Service 3,784,739 6,894,679 - 2,920,678 - - - - - 13,600,096 Academic Support 14,736,267 44,804,546 - 3,944,558 - - - - - 63,485,371 Student Services 929,468 16,238,686 - 449,835 1,528,231 - - - - 19,146,220 Institutional Support 8,191,183 37,524,882 - 2,357,473 - - - - - 48,073,538 Operations and Maintenance of Plant 10,582,724 32,970,235 - 363,277 - - 1,773,894 - - 45,690,130 Scholarships and Fellowships 4,680,970 27,528,865 - 10,321,809 - - - - - 42,531,644 Auxiliary Enterprises (See FN9) - - 60,918,532 - - - - - - 60,918,532 Capital Outlay from Current Fund Sources* 65,273 10,257,881 338,329 4,235,852 - - - - - 14,897,335 Other Expenses (See FN3) - 4,999 - - - - - - - 4,999 Total Operating Uses 176,420,379 279,173,919 61,256,861 86,863,722 1,528,231 - 1,773,894 - - 607,017,006
Other Sources / (Uses) of FundsCapital Outlay from Non-Current Fund Sources** - - - - - - (65,028,169) - - (65,028,169) Mandatory and Non-mandatory Transfers (See FN10) 11,743,365 18,793,639 7,867,846 (25,282,679) 505,671 3,101,084 (2,166,932) - (56,447) 14,505,547 Bond Proceeds Transfers In (See FN4) - - - - - - 58,930,939 - - 58,930,939 Debt Service Payments (See FN5) (14,316,235) (21,668,950) (26,489,153) (82,973) - - - - - (62,557,311) Subtotal (2,572,870) (2,875,311) (18,621,307) (25,365,652) 505,671 3,101,084 (8,264,162) - (56,447) (54,148,994)
Other Items Not for Current Operating UseUnrealized Gains / (Losses) (See FN6) - 3,028,563 - 2,186,918 - 17,422,831 - - - 22,638,312 Additions to Permanent Endowments (See FN7) - - - - - 6,204,570 - - - 6,204,570 Subtotal - 3,028,563 - 2,186,918 - 23,627,401 - - - 28,842,882
Total Sources Over / (Under) Uses (See FN 11) 411,999 10,874,057 3,353,108 24,973,361 (998,655) 27,096,822 (9,483,052) - (324,553) 55,903,087
Bond Proceeds - - - - - - - - - - Depreciation Expense - - - - - - - - (82,144,699) (82,144,699) Transfer of Capital Asses(s) from System - - - - - - - - - - Other Post-Employment Benefit (OPEB) Expense - - - - - - - - - - Non-Cash Capital Gifts - - - - - - - - 41,387,556 41,387,556 Capital Outlay - - - - - - - - 79,925,504 79,925,504 Change in Net Assets (Total Agrees with AFR***) 411,999 10,874,057 3,353,108 24,973,361 (998,655) 27,096,822 (9,483,052) - 38,843,808 95,071,448
*Defined as any capital outlay expenses from Educational & General, Designated, Auxiliary, or Restricted Expendable Funds.**Defined as any capital outlay expense from funds other than Educational & General, Designated, Auxiliary, or Restricted Expendable.***As reported for "Changes in Net Position" shown on Schedule of Revenues, Expenses, and Changes in Net Position (SRECNP) in Annual Financial Report.
The University of Texas at DallasFor the Year Ended August 31, 2019Source: FY 2019 Annual Financial Report
Detail Worksheet FY 2019
Texas Higher Education Coordinating Board 24 June, 2020

The University of Texas at DallasFor the Year Ended August 31, 2019Source: FY 2019 Annual Financial Report
FOOTNOTES:
FN1: Scholarship Discounts and Allowances are scholarships, fellowships, and grants applied to tuition. The discount eliminates tuition revenues that are paid for by University resources which are recorded as revenue elsewhere on the financial statements (i.e. federal and state contracts and grants revenues). In addition, Scholarship Discounts and Allowances eliminate tuition revenue that is exempted from payment due to tuition exemptions approved by the Texas Legislature. Waivers, remissions, and exemptions represent tuition and fee dollars forgone by the university - some are required by statute. See the Integrated Financial Reporting System (IFRS) report submitted to THECB for details on waivers, exemptions, tuition, and fees. Allocation methods to individual funds shown may vary between institutions.
FN2: Endowment and Interest Income includes interest income and endowment payouts.
FN3: Other Income is primarily Other Operating and Other Non-operating Revenues from the AFR. Other Expenses is primarily Other Nonoperating Expenses from the AFR.
FN4: Bond Proceeds are funds received from the sale of bonds and commercial paper used to finance capital projects. This amount includes actual proceeds and accrued or anticipated proceeds to be transferred from System. Independent institutions report only to the extent expended in current year.
FN5: Debt service payments are payments to service and retire debt issued to fund capital projects. System components do this via transfers to System Administrations. Independent institutions use direct payment to appropriate paying agents.
FN6: Unrealized Gains / (Losses) represent the increase in the Fair Market Value of Investments and Endowments. Unrealized Gains / (Losses) are accrued as non-cash transactions. Therefore, funds are not actually received for this revenue stream. Accordingly, this revenue is not cash revenue and cannot be used by the University to fund operations.
FN7: Additions to Permanent Endowments are additions to endowment principal. This revenue is restricted for investment purposes only and cannot be used to fund operations. Only interest income from these endowments, which is reported on the Endowment and Investment Income line of this report, can be used by the University to fund operations.
FN8: Distributions from the Available University Fund appropriated through the Appropriation Bill are first used to pay debt service costs on Permanent University Fund Bonds. Funds remaining are distributed to constitutionally designated institutions to promote academic excellence. Only the Excellence funding is shown at the institution level. The AUF funds used to pay debt service on PUF bonds are reported at the System level.
FN9: Auxiliary Enterprises include athletics, housing and food, student services, and parking and transportation. Auxiliary Enterprises are required to be self-supporting, and therefore must operate on the funds they generate.
FN10: Mandatory and non-mandatory transfers includes transfers between funds, transfers between the University System and institutions and transfers to and from other state agencies. In total, all transfers between funds net to zero with the exception of any amounts transferred between the University System, between other institutions, or to and from another state agency. There are no transfers of education and general funds provided by the State of Texas to restricted or auxiliary fund groups. Transfers between education and general funds and designated funds are related to Texas Public Education Grant as provided by the State of Texas.
FN11: Of the net increase of $55,903,087 approximately $27.1 million represents revenues received but not yet expended. This income is fully committed to program expenditures and capital disbursements. The remaining $28.8 million represents non-expendable funds from unrealized gains and additions to permanent endowments of approximately $22.6 million and $6.2 million respectively. Unrealized gains and additions to permanent endowments do not contribute to the availability of the institution's operating cash as discussed in FN6 and FN7.
Texas Higher Education Coordinating Board 25 June, 2020

The University of Texas at El PasoFor the Year Ended August 31, 2019Source: FY 2019 Annual Financial Report
Non-Operating Funds are not included in above charts. See following page (Summary).Charts May Not Add to 100% Due to Rounding
Total Operating Sources $466,937,877
Total Operating Sources $466,937,877
Total Operating Uses $429,446,046
State of Texas$132,217,337
28%
Student & Parent$137,681,016
29%
Federal Government$115,013,451
25%
Institutional Resources$82,026,073
18%
Operating Sources by Category
State Appropriations$107,836,565
23%
State Grants & Contracts
$24,380,7725%
Tuition & Fees$137,681,016
29%
Federal Grants & Contracts
$115,013,45125%
Endowment & Interest Income
$16,700,5454%
Local Government Grants
$1,493,9780%
Private Gifts & Grants$18,076,294
4%
Sales & Services$7,099,176
2%
Net Auxiliary Enterprises$38,482,113
8%
Other Income$173,967
0%
Operating Sources
Instruction$112,587,434
26%
Research$86,244,326
20%
Public Service$5,488,289
1%
Academic Support$24,428,091
6%
Student Services$18,248,295
4%Institutional Support
$31,549,8727%
Operations & Maintenance of Plant
$28,669,6367%
Scholarships & Fellowships$59,025,926
14%
Auxiliary Enterprises$53,037,496
12%Capital Outlay$8,658,827
2%
Other Expenses$1,507,854
1%
Operating Uses
Texas Higher Education Coordinating Board 26 June, 2020

The University of Texas at El PasoFor the Year Ended August 31, 2019Source: FY 2019 Annual Financial Report
Summary Worksheet FY 2019 Amount Per FTSEInstitution State Funded FTSEs 19,874.07
Operating SourcesState of TexasState Appropriations 107,836,565$ 5,426$ State Grants and Contracts - Restricted 24,380,772 1,227 Higher Education Fund - - Available University Fund Excellence (See FN8) - - Subtotal 132,217,337$ 6,653$
Student & ParentTuition - net 98,299,600$ 4,946$ Fees - net 39,381,416 1,982 Tuition and Fees (net of Scholarship Discounts and Allowances) 137,681,016$ 6,928$
Federal GovernmentFederal Grants and Contracts - Restricted 115,013,451$ 5,787$
Institutional ResourcesEndowment and Interest Income (See FN2) 16,700,545$ 840$ Local Government Grants - Restricted 1,493,978 75 Private Gifts and Grants - Restricted 18,076,294 910 Sales and Services 7,099,176 357 Net Auxiliary Enterprises (See FN9) 38,482,113 1,936 Other Income (See FN3) 173,967 9 Subtotal 82,026,073$ 4,127$ Total Operating Sources 466,937,877$ 23,495$
Operating UsesInstruction 112,587,434$ 5,665$ Research 86,244,326 4,340 Public Service 5,488,289 276 Academic Support 24,428,091 1,229 Student Services 18,248,295 918 Institutional Support 31,549,872 1,587 Operations and Maintenance of Plant 28,669,636 1,443 Scholarships and Fellowships 59,025,926 2,970 Auxiliary Enterprises (See FN9) 53,037,496 2,669 Capital Outlay from Current Fund Sources 8,658,827 436 Other Expenses (See FN3) 1,507,854 76 Total Operating Uses 429,446,046$ 21,609$
Other Sources / (Uses) of FundsCapital Outlay from Non-Current Fund Sources (52,162,614) (2,625)$ Mandatory and Non-mandatory Transfers (See FN10) 406,096 20 Bond Proceeds Transfers (See FN4) 45,558,323 2,292 Debt Service Payments (See FN5) (28,126,500) (1,415) Subtotal (34,324,695)$ (1,728)$
Other Items Not for Current Operating UseUnrealized Gains / (Losses) (See FN6) 2,378,924 120$ Additions to Permanent Endowments (See FN7) 3,873,211 195 Subtotal 6,252,135$ 315$
Total Sources Over / (Under) Uses (See FN11) 9,419,271$ 473$
Texas Higher Education Coordinating Board 27 June, 2020

FY 2019
Operating SourcesEducational &
General DesignatedAuxiliary
EnterprisesRestricted
Expendable Loan Funds
Annuity, Life & Endowment and Similar Funds
Unexpended Plant
Retirement of Indebtedness
Investment In Plant Primary University
State of TexasState Appropriations 107,836,565 - - - - - - - - 107,836,565 State Grants and Contracts - Restricted 24,066,299 - - 314,473 - - - - - 24,380,772 Higher Education Fund - - - - - - - - - - Available University Fund Excellence (See FN8) - - - - - - - - - - Subtotal 131,902,864 - - 314,473 - - - - - 132,217,337
Student & ParentTuition Potential 100% 61,795,854 99,108,667 - - - - - - - 160,904,521 Waivers - Statutory (Not Reported in AFR) (23,009,288) (11,649) - - - - - - - (23,020,937) Waivers - Institutional (Not Reported in AFR) - - - - - - - - - - Exemptions - Statutory (Not Reported in AFR) - - - - - - - - - - Exemptions - Institutional (Not Reported in AFR) - - - - - - - - - - Tuition - Gross - AFR Presentation 38,786,566 99,097,018 - - - - - - - 137,883,584 Waivers - Statutory (Reported in AFR) - - - - - - - - - - Waivers - Institutional (Reported in AFR) - - - - - - - - - - Exemptions - Statutory (Reported in AFR) (1,290,114) (4,300,086) - - - - - - - (5,590,200) Exemptions - Institutional (Reported in AFR) - - - - - - - - - - All Other Scholarship Disc.& Allow. (See FN1) (10,107,399) (23,886,385) - - - - - - - (33,993,784) Tuition - net 27,389,053 70,910,547 - - - - - - - 98,299,600
Fees Potential 100% - 44,480,100 10,594,653 - - - - - - 55,074,753 Waivers - Statutory (Not Reported in AFR) - (5,229) (387) - - - - - - (5,616) Waivers - Institutional (Not Reported in AFR) - - - - - - - - - - Exemptions - Statutory (Not Reported in AFR) - - - - - - - - - - Exemptions - Institutional (Not Reported in AFR) - - - - - - - - - - Fees - Gross - AFR Presentation - 44,474,871 10,594,266 - - - - - - 55,069,137 Waivers - Statutory (Reported in AFR) - - - - - - - - - - Waivers - Institutional (Reported in AFR) - - - - - - - - - - Exemptions - Statutory (Reported in AFR) - (1,018,556) (122,000) - - - - - - (1,140,556) Exemptions - Institutional (Reported in AFR) - - - - - - - - - - All Other Scholarship Disc.& Allow. (See FN1) - (11,631,555) (2,915,610) - - - - - - (14,547,165) Fees - net - 31,824,760 7,556,656 - - - - - - 39,381,416
Net Tuition and Fees (Funds Collected) 27,389,053 102,735,307 7,556,656 - - - - - - 137,681,016
Federal GovernmentFederal Grants and Contracts - Restricted - 8,724,625 - 106,288,826 - - - - - 115,013,451
Institutional ResourcesEndowment and Interest Income (See FN2) 121,787 6,080,108 223,819 9,849,137 52,504 362,427 10,763 - - 16,700,545 Local Government Grants - Restricted - 177,266 - 1,316,712 - - - - - 1,493,978 Private Gifts and Grants - Restricted - 478,567 - 16,854,954 - - 742,773 - - 18,076,294 Sales and Services - 6,023,212 - 1,075,964 - - - - - 7,099,176 Net Auxiliary Enterprises (See FN9) - - 38,482,113 - - - - - - 38,482,113 Other Income (See FN3) 67,384 40,844 - 109,196 71,242 - - - (114,699) 173,967 Subtotal 189,171 12,799,997 38,705,932 29,205,963 123,746 362,427 753,536 - (114,699) 82,026,073 Total Operating Sources 159,481,088 124,259,929 46,262,588 135,809,262 123,746 362,427 753,536 - (114,699) 466,937,877
Operating UsesInstruction 94,659,418 16,590,094 - 1,337,922 - - - - - 112,587,434 Research 27,432,015 8,571,539 - 50,240,772 - - - - - 86,244,326 Public Service 725,166 464,418 - 4,298,705 - - - - - 5,488,289 Academic Support 11,132,300 11,335,074 - 1,960,717 - - - - - 24,428,091 Student Services 6,345,958 12,016,416 - 172,804 (286,883) - - - - 18,248,295 Institutional Support 19,061,458 9,704,122 - 2,784,292 - - - - - 31,549,872 Operations and Maintenance of Plant 15,969,761 11,716,185 - 16,617 - - 967,073 - - 28,669,636 Scholarships and Fellowships 12,618,329 18,069,661 - 28,337,936 - - - - - 59,025,926 Auxiliary Enterprises (See FN9) - - 52,613,450 424,046 - - - - - 53,037,496 Capital Outlay from Current Fund Sources* 483,252 5,983,788 61,650 2,130,137 - - - - - 8,658,827 Other Expenses (See FN3) - - - - 1,507,854 - - - - 1,507,854 Total Operating Uses 188,427,657 94,451,297 52,675,100 91,703,948 1,220,971 - 967,073 - - 429,446,046
Other Sources / (Uses) of FundsCapital Outlay from Non-Current Fund Sources** - - - - - - (52,162,614) - - (52,162,614) Mandatory and Non-mandatory Transfers (See FN10) 41,653,631 (16,188,402) 13,646,867 (43,500,065) 381,974 731,030 3,681,061 - - 406,096 Bond Proceeds Transfers In (See FN4) - - - - - - 45,558,323 - - 45,558,323 Debt Service Payments (See FN5) (12,707,062) (7,975,101) (6,597,403) (846,934) - - - - - (28,126,500) Subtotal 28,946,569 (24,163,503) 7,049,464 (44,346,999) 381,974 731,030 (2,923,230) - - (34,324,695)
Other Items Not for Current Operating UseUnrealized Gains / (Losses) (See FN6) - 1,847,592 - - - 531,332 - - - 2,378,924 Additions to Permanent Endowments (See FN7) - - - - - 3,873,211 - - - 3,873,211 Subtotal - 1,847,592 - - - 4,404,543 - - - 6,252,135
Total Sources Over / (Under) Uses (See FN 11) - 7,492,721 636,952 (241,685) (715,251) 5,498,000 (3,136,767) - (114,699) 9,419,271
Bond Proceeds - - - - - - - - - - Depreciation Expense - - - - - - - - (30,772,804) (30,772,804) Transfer of Capital Asses(s) from System - - - - - - - - - - Other Post-Employment Benefit (OPEB) Expense - - - - - - - - - - Non-Cash Capital Gifts - - - - - - - - 39,203 39,203 Capital Outlay - - - - - - - - 60,821,441 60,821,441 Change in Net Assets (Total Agrees with AFR***) - 7,492,721 636,952 (241,685) (715,251) 5,498,000 (3,136,767) - 29,973,141 39,507,111
*Defined as any capital outlay expenses from Educational & General, Designated, Auxiliary, or Restricted Expendable Funds.**Defined as any capital outlay expense from funds other than Educational & General, Designated, Auxiliary, or Restricted Expendable.***As reported for "Changes in Net Position" shown on Schedule of Revenues, Expenses, and Changes in Net Position (SRECNP) in Annual Financial Report.
The University of Texas at El PasoFor the Year Ended August 31, 2019Source: FY 2019 Annual Financial Report
Detail Worksheet FY 2019
Texas Higher Education Coordinating Board 28 June, 2020

The University of Texas at El PasoFor the Year Ended August 31, 2019Source: FY 2019 Annual Financial Report
FOOTNOTES:
FN1: Scholarship Discounts and Allowances are scholarships, fellowships, and grants applied to tuition. The discount eliminates tuition revenues that are paid for by University resources which are recorded as revenue elsewhere on the financial statements (i.e. federal and state contracts and grants revenues). In addition, Scholarship Discounts and Allowances eliminate tuition revenue that is exempted from payment due to tuition exemptions approved by the Texas Legislature. Waivers, remissions, and exemptions represent tuition and fee dollars forgone by the university - some are required by statute. See the Integrated Financial Reporting System (IFRS) report submitted to THECB for details on waivers, exemptions, tuition, and fees. Allocation methods to individual funds shown may vary between institutions.
FN2: Endowment and Interest Income includes interest income and endowment payouts.
FN3: Other Income is primarily Other Operating and Other Non-operating Revenues from the AFR. Other Expenses is primarily Other Nonoperating Expenses from the AFR.
FN4: Bond Proceeds are funds received from the sale of bonds and commercial paper used to finance capital projects. This amount includes actual proceeds and accrued or anticipated proceeds to be transferred from System. Independent institutions report only to the extent expended in current year.
FN5: Debt service payments are payments to service and retire debt issued to fund capital projects. System components do this via transfers to System Administrations. Independent institutions use direct payment to appropriate paying agents.
FN6: Unrealized Gains / (Losses) represent the increase in the Fair Market Value of Investments and Endowments. Unrealized Gains / (Losses) are accrued as non-cash transactions. Therefore, funds are not actually received for this revenue stream. Accordingly, this revenue is not cash revenue and cannot be used by the University to fund operations.
FN7: Additions to Permanent Endowments are additions to endowment principal. This revenue is restricted for investment purposes only and cannot be used to fund operations. Only interest income from these endowments, which is reported on the Endowment and Investment Income line of this report, can be used by the University to fund operations.
FN8: Distributions from the Available University Fund appropriated through the Appropriation Bill are first used to pay debt service costs on Permanent University Fund Bonds. Funds remaining are distributed to constitutionally designated institutions to promote academic excellence. Only the Excellence funding is shown at the institution level. The AUF funds used to pay debt service on PUF bonds are reported at the System level.
FN9: Auxiliary Enterprises include athletics, housing and food, student services, and parking and transportation. Auxiliary Enterprises are required to be self-supporting, and therefore must operate on the funds they generate.
FN10: Mandatory and non-mandatory transfers includes transfers between funds, transfers between the University System and institutions and transfers to and from other state agencies. In total, all transfers between funds net to zero with the exception of any amounts transferred between the University System, between other institutions, or to and from another state agency. There are no transfers of education and general funds provided by the State of Texas to restricted or auxiliary fund groups. Transfers between education and general funds and designated funds are related to Texas Public Education Grant as provided by the State of Texas.
FN11: Of the net increase of $9,419,271 approximately $3.2 million represents revenues received but not yet expended. This income is fully committed to program expenditures and capital disbursements. The remaining $6.3 million represents non-expendable funds from unrealized gains and additions to permanent endowments of approximately $2.4 million and $3.9 million respectively. Unrealized gains and additions to permanent endowments do not contribute to the availability of the institution's operating cash as discussed in FN6 and FN7.
Texas Higher Education Coordinating Board 29 June, 2020

The University of Texas RGV - Academic & Health (A+H)(Excludes Medical School)For the Year Ended August 31, 2019Source: FY 2019 Annual Financial Report
Non-Operating Funds are not included in above charts. See following page (Summary).Charts May Not Add to 100% Due to Rounding
Total Operating Sources $413,147,177
Total Operating Sources $413,147,177
Total Operating Uses $398,268,426
State of Texas$149,918,157
36%
Student & Parent$101,833,862
25%
Federal Government$126,932,586
31%
Institutional Resources$34,462,572
8%
Operating Sources by Category
State Appropriations$111,514,096
27%
State Grants & Contracts
$38,404,0619%
Higher Education Fund$00%Tuition & Fees
$101,833,86225%
Federal Grants & Contracts
$126,932,58631%
Endowment & Interest Income
$8,233,4372%
Local Government Grants
$256,4060%
Private Gifts & Grants$6,993,801
2%
Sales & Services$7,249,908
2%
Net Auxiliary Enterprises$9,425,690
2% Other Income$2,303,330
0%
Operating Sources
Instruction$128,758,678
32%
Research$27,975,914
7%
Public Service$16,484,180
4%
Academic Support$41,090,170
10%
Student Services$28,218,053
7% Institutional Support$35,279,684
9%
Operations & Maintenance of Plant
$34,274,3979%
Scholarships & Fellowships$52,010,033
13%
Auxiliary Enterprises$28,213,760
7%Capital Outlay$5,883,557
2%
Operating Uses
Texas Higher Education Coordinating Board 30 June, 2020

The University of Texas RGV - Academic & Health (A+H)(Excludes Medical School)For the Year Ended August 31, 2019Source: FY 2019 Annual Financial Report
Summary Worksheet FY 2019 Amount Per FTSEInstitution State Funded FTSEs 24,918.01
Operating SourcesState of TexasState Appropriations 111,514,096$ 4,475$ State Grants and Contracts - Restricted 38,404,061 1,541 Higher Education Fund - - Available University Fund Excellence (See FN8) - - Subtotal 149,918,157$ 6,016$
Student & ParentTuition - net 67,909,983$ 2,725$ Fees - net 33,923,879 1,361 Tuition and Fees (net of Scholarship Discounts and Allowances) 101,833,862$ 4,086$
Federal GovernmentFederal Grants and Contracts - Restricted 126,932,586$ 5,094$
Institutional ResourcesEndowment and Interest Income (See FN2) 8,233,437$ 330$ Local Government Grants - Restricted 256,406 10 Private Gifts and Grants - Restricted 6,993,801 281 Sales and Services 7,249,908 291 Net Auxiliary Enterprises (See FN9) 9,425,690 378 Other Income (See FN3) 2,303,330 92 Subtotal 34,462,572$ 1,382$ Total Operating Sources 413,147,177$ 16,578$
Operating UsesInstruction 128,758,678$ 5,167$ Research 27,975,914 1,123 Public Service 16,484,180 662 Academic Support 41,090,170 1,649 Student Services 28,218,053 1,132 Institutional Support 35,279,684 1,416 Operations and Maintenance of Plant 34,274,397 1,375 Scholarships and Fellowships 52,010,033 2,087 Auxiliary Enterprises (See FN9) 28,213,760 1,132 Capital Outlay from Current Fund Sources 5,883,557 236 Other Expenses (See FN3) 80,000 3 Total Operating Uses 398,268,426$ 15,982$
Other Sources / (Uses) of FundsCapital Outlay from Non-Current Fund Sources (32,403,297) (1,300)$ Mandatory and Non-mandatory Transfers (See FN10) (376,318) (15) Bond Proceeds Transfers (See FN4) 41,604,764 1,670 Debt Service Payments (See FN5) (25,529,026) (1,025) Subtotal (16,703,877)$ (670)$
Other Items Not for Current Operating UseUnrealized Gains / (Losses) (See FN6) 2,076,315 83$ Additions to Permanent Endowments (See FN7) 2,375,149 95 Subtotal 4,451,464$ 178$
Total Sources Over / (Under) Uses (See FN11) 2,626,338$ 104$
Texas Higher Education Coordinating Board 31 June, 2020

(Excludes Medical School)
Detail Worksheet FY 2019FY 2019
Operating SourcesEducational &
General DesignatedAuxiliary
EnterprisesRestricted
Expendable Loan Funds
Annuity, Life & Endowment and Similar Funds
Unexpended Plant
Retirement of Indebtedness
Investment In Plant Primary University
State of TexasState Appropriations 111,514,096 - - - - - - - - 111,514,096 State Grants and Contracts - Restricted 37,043,060 1,352,274 - 8,727 - - - - - 38,404,061 Higher Education Fund - - - - - - - - - - Available University Fund Excellence (See FN8) - - - - - - - - - - Subtotal 148,557,156 1,352,274 - 8,727 - - - - - 149,918,157
Student & ParentTuition Potential 100% 49,354,820 130,638,554 - - - - - - - 179,993,374 Waivers - Statutory (Not Reported in AFR) (8,706,169) - - - - - - - - (8,706,169) Waivers - Institutional (Not Reported in AFR) - (7,116) - - - - - - - (7,116) Exemptions - Statutory (Not Reported in AFR) - - - - - - - - - - Exemptions - Institutional (Not Reported in AFR) - - - - - - - - - - Tuition - Gross - AFR Presentation 40,648,651 130,631,438 - - - - - - - 171,280,089 Waivers - Statutory (Reported in AFR) - - - - - - - - - - Waivers - Institutional (Reported in AFR) - - - - - - - - - - Exemptions - Statutory (Reported in AFR) (2,440,222) (4,604,452) - - - - - - - (7,044,674) Exemptions - Institutional (Reported in AFR) - - - - - - - - - - All Other Scholarship Disc.& Allow. (See FN1) (20,972,939) (75,352,493) - - - - - - - (96,325,432) Tuition - net 17,235,490 50,674,493 - - - - - - - 67,909,983
Fees Potential 100% 1,551,268 21,487,752 22,788,504 - - - - - - 45,827,524 Waivers - Statutory (Not Reported in AFR) - - - - - - - - - - Waivers - Institutional (Not Reported in AFR) - - - - - - - - - - Exemptions - Statutory (Not Reported in AFR) - - - - - - - - - - Exemptions - Institutional (Not Reported in AFR) - - - - - - - - - - Fees - Gross - AFR Presentation 1,551,268 21,487,752 22,788,504 - - - - - - 45,827,524 Waivers - Statutory (Reported in AFR) - - - - - - - - - - Waivers - Institutional (Reported in AFR) - - - - - - - - - - Exemptions - Statutory (Reported in AFR) - - (618,088) - - - - - - (618,088) Exemptions - Institutional (Reported in AFR) - - - - - - - - - - All Other Scholarship Disc.& Allow. (See FN1) - - (11,285,557) - - - - - - (11,285,557) Fees - net 1,551,268 21,487,752 10,884,859 - - - - - - 33,923,879
Net Tuition and Fees (Funds Collected) 18,786,758 72,162,245 10,884,859 - - - - - - 101,833,862
Federal GovernmentFederal Grants and Contracts - Restricted - 5,014,973 - 121,917,613 - - - - - 126,932,586
Institutional ResourcesEndowment and Interest Income (See FN2) 1,734,357 3,936,974 455,563 1,883,843 23,513 24,414 174,773 - - 8,233,437 Local Government Grants - Restricted - 28,890 - 227,516 - - - - - 256,406 Private Gifts and Grants - Restricted - 2,087,859 - 4,905,942 - - - - - 6,993,801 Sales and Services - 5,695,410 - 1,554,498 - - - - - 7,249,908 Net Auxiliary Enterprises (See FN9) - - 9,425,690 - - - - - - 9,425,690 Other Income (See FN3) 311,328 1,043,306 - 355,973 610,173 - - - (17,450) 2,303,330 Subtotal 2,045,685 12,792,439 9,881,253 8,927,772 633,686 24,414 174,773 - (17,450) 34,462,572 Total Operating Sources 169,389,599 91,321,931 20,766,112 130,854,112 633,686 24,414 174,773 - (17,450) 413,147,177
Operating UsesInstruction 113,687,881 9,661,934 - 5,408,863 - - - - - 128,758,678 Research 1,602,935 18,599,154 - 7,773,825 - - - - - 27,975,914 Public Service 3,099,942 1,212,075 - 12,172,163 - - - - - 16,484,180 Academic Support 19,800,230 18,283,917 - 3,006,023 - - - - - 41,090,170 Student Services 12,187,819 9,429,770 - 6,256,634 343,830 - - - - 28,218,053 Institutional Support 19,573,302 14,989,498 - 716,884 - - - - - 35,279,684 Operations and Maintenance of Plant 19,551,237 9,397,526 - 140,542 - - 5,185,092 - - 34,274,397 Scholarships and Fellowships 8,737,800 11,585,922 - 31,686,311 - - - - - 52,010,033 Auxiliary Enterprises (See FN9) - 1,799,118 26,144,732 269,910 - - - - - 28,213,760 Capital Outlay from Current Fund Sources* 787,629 4,398,996 131,276 565,656 - - - - - 5,883,557 Other Expenses (See FN3) - 80,000 - - - - - - - 80,000 Total Operating Uses 199,028,775 99,437,910 26,276,008 67,996,811 343,830 - 5,185,092 - - 398,268,426
Other Sources / (Uses) of FundsCapital Outlay from Non-Current Fund Sources** - - - - - - (32,403,297) - - (32,403,297) Mandatory and Non-mandatory Transfers (See FN10) 49,980,691 (2,326,963) 11,332,913 (66,074,738) (2,175,361) 82,613 8,804,527 - - (376,318) Bond Proceeds Transfers In (See FN4) - - - - - - 41,604,764 - - 41,604,764 Debt Service Payments (See FN5) (18,020,250) (3,378,060) (4,130,716) - - - - - - (25,529,026) Subtotal 31,960,441 (5,705,023) 7,202,197 (66,074,738) (2,175,361) 82,613 18,005,994 - - (16,703,877)
Other Items Not for Current Operating UseUnrealized Gains / (Losses) (See FN6) - 2,017,364 338,060 49,236 17,448 (475,487) 129,694 - - 2,076,315 Additions to Permanent Endowments (See FN7) - - - - - 2,375,149 - - - 2,375,149 Subtotal - 2,017,364 338,060 49,236 17,448 1,899,662 129,694 - - 4,451,464
Total Sources Over / (Under) Uses (See FN 11) 2,321,265 (11,803,638) 2,030,361 (3,168,201) (1,868,057) 2,006,689 13,125,369 - (17,450) 2,626,338
Bond Proceeds - - - - - - - - - - Depreciation Expense - - - - - - - - (40,145,465) (40,145,465) Transfer of Capital Asses(s) from System - - - - - - - - - - Other Post-Employment Benefit (OPEB) Expense - - - - - - - - - - Non-Cash Capital Gifts - - - - - - - - 1,263,922 1,263,922 Capital Outlay - - - - - - - - 56,541,857 56,541,857 Change in Net Assets (Total Agrees with AFR***) 2,321,265 (11,803,638) 2,030,361 (3,168,201) (1,868,057) 2,006,689 13,125,369 - 17,642,864 20,286,652
*Defined as any capital outlay expenses from Educational & General, Designated, Auxiliary, or Restricted Expendable Funds.**Defined as any capital outlay expense from funds other than Educational & General, Designated, Auxiliary, or Restricted Expendable.***As reported for "Changes in Net Position" shown on Schedule of Revenues, Expenses, and Changes in Net Position (SRECNP) in Annual Financial Report.
The University of Texas RGV - Academic & Health (A+H)
For the Year Ended August 31, 2019Source: FY 2019 Annual Financial Report
Texas Higher Education Coordinating Board 32 June, 2020

The University of Texas RGV - Academic & Health (A+H)(Excludes Medical School)For the Year Ended August 31, 2019Source: FY 2019 Annual Financial ReportFOOTNOTES:
FN1: Scholarship Discounts and Allowances are scholarships, fellowships, and grants applied to tuition. The discount eliminates tuition revenues that are paid for by University resources which are recorded as revenue elsewhere on the financial statements (i.e. federal and state contracts and grants revenues). In addition, Scholarship Discounts and Allowances eliminate tuition revenue that is exempted from payment due to tuition exemptions approved by the Texas Legislature. Waivers, remissions, and exemptions represent tuition and fee dollars forgone by the university - some are required by statute. See the Integrated Financial Reporting System (IFRS) report submitted to THECB for details on waivers, exemptions, tuition, and fees. Allocation methods to individual funds shown may vary between institutions.
FN2: Endowment and Interest Income includes interest income and endowment payouts.
FN3: Other Income is primarily Other Operating and Other Non-operating Revenues from the AFR. Other Expenses is primarily Other Nonoperating Expenses from the AFR.
FN4: Bond Proceeds are funds received from the sale of bonds and commercial paper used to finance capital projects. This amount includes actual proceeds and accrued or anticipated proceeds to be transferred from System. Independent institutions report only to the extent expended in current year.
FN5: Debt service payments are payments to service and retire debt issued to fund capital projects. System components do this via transfers to System Administrations. Independent institutions use direct payment to appropriate paying agents.
FN6: Unrealized Gains / (Losses) represent the increase in the Fair Market Value of Investments and Endowments. Unrealized Gains / (Losses) are accrued as non-cash transactions. Therefore, funds are not actually received for this revenue stream. Accordingly, this revenue is not cash revenue and cannot be used by the University to fund operations.
FN7: Additions to Permanent Endowments are additions to endowment principal. This revenue is restricted for investment purposes only and cannot be used to fund operations. Only interest income from these endowments, which is reported on the Endowment and Investment Income line of this report, can be used by the University to fund operations.
FN8: Distributions from the Available University Fund appropriated through the Appropriation Bill are first used to pay debt service costs on Permanent University Fund Bonds. Funds remaining are distributed to constitutionally designated institutions to promote academic excellence. Only the Excellence funding is shown at the institution level. The AUF funds used to pay debt service on PUF bonds are reported at the System level.
FN9: Auxiliary Enterprises include athletics, housing and food, student services, and parking and transportation. Auxiliary Enterprises are required to be self-supporting, and therefore must operate on the funds they generate.
FN10: Mandatory and non-mandatory transfers includes transfers between funds, transfers between the University System and institutions and transfers to and from other state agencies. In total, all transfers between funds net to zero with the exception of any amounts transferred between the University System, between other institutions, or to and from another state agency. There are no transfers of education and general funds provided by the State of Texas to restricted or auxiliary fund groups. Transfers between education and general funds and designated funds are related to Texas Public Education Grant as provided by the State of Texas.
FN11: Of the net increase of $2,626,338 approximately $(1.8) million represents revenues received but not yet expended. This income is fully committed to program expenditures and capital disbursements. The remaining $4.5 million represents non-expendable funds from unrealized gains and additions to permanent endowments of approximately $2.1 million All Other Scholarship Disc.& Allow. (See FN1)$2.4 million respectively. Unrealized gains and additions to permanent endowments do not contribute to the availability of the institution's operating cash as discussed in FN6 and FN7.
Texas Higher Education Coordinating Board 33 June, 2020

The University of Texas of the Permian BasinFor the Year Ended August 31, 2019Source: FY 2019 Annual Financial Report
Non-Operating Funds are not included in above charts. See following page (Summary).Charts May Not Add to 100% Due to Rounding
Total Operating Sources $63,984,630
Total Operating Sources $63,984,630
Total Operating Uses $83,406,822
State of Texas$43,849,858
54%
Student & Parent-$8,430,055
-10%
Federal Government$10,212,760
13%
Institutional Resources$18,352,067
23%
Operating Sources by Category
State Appropriations$35,719,307
44%
State Grants & Contracts$8,130,551
10%
Tuition & Fees-$8,430,055
-10%
Federal Grants & Contracts
$10,212,76013%
Endowment & Interest Income
$3,090,0694%
Local Government Grants
$4,535,9646%
Private Gifts & Grants$2,968,465
4%
Sales & Services$1,842,130
2%
Net Auxiliary Enterprises$4,397,452
5%
Other Income$1,517,987
2%
Operating Sources
Instruction$25,924,706
31%
Research$1,508,786
2%
Public Service$4,423,171
5%
Academic Support$9,530,294
11%
Student Services$4,187,997
5%Institutional Support
$9,755,07312%
Operations & Maintenance of Plant
$12,082,26515%
Scholarships & Fellowships$4,537,231
5%
Auxiliary Enterprises$10,436,407
13%Capital Outlay
$875,6321%
Other Expenses$145,260
0%
Operating Uses
Texas Higher Education Coordinating Board 34 June, 2020

The University of Texas of the Permian BasinFor the Year Ended August 31, 2019Source: FY 2019 Annual Financial Report
Summary Worksheet FY 2019 Amount Per FTSEInstitution State Funded FTSEs 4,271.78
Operating SourcesState of TexasState Appropriations 35,719,307$ 8,362$ State Grants and Contracts - Restricted 8,130,551 1,903 Higher Education Fund - - Available University Fund Excellence (See FN8) - - Subtotal 43,849,858$ 10,265$
Student & ParentTuition - net (14,032,112)$ (3,285)$ Fees - net 5,602,057 1,311 Tuition and Fees (net of Scholarship Discounts and Allowances) (8,430,055)$ (1,974)$
Federal GovernmentFederal Grants and Contracts - Restricted 10,212,760$ 2,391$
Institutional ResourcesEndowment and Interest Income (See FN2) 3,090,069$ 723$ Local Government Grants - Restricted 4,535,964 1,062 Private Gifts and Grants - Restricted 2,968,465 695 Sales and Services 1,842,130 431 Net Auxiliary Enterprises (See FN9) 4,397,452 1,029 Other Income (See FN3) 1,517,987 355 Subtotal 18,352,067$ 4,295$ Total Operating Sources 63,984,630$ 14,977$
Operating UsesInstruction 25,924,706$ 6,069$ Research 1,508,786 353 Public Service 4,423,171 1,035 Academic Support 9,530,294 2,231 Student Services 4,187,997 980 Institutional Support 9,755,073 2,284 Operations and Maintenance of Plant 12,082,265 2,828 Scholarships and Fellowships 4,537,231 1,062 Auxiliary Enterprises (See FN9) 10,436,407 2,443 Capital Outlay from Current Fund Sources 875,632 205 Other Expenses (See FN3) 145,260 34 Total Operating Uses 83,406,822$ 19,524$
Other Sources / (Uses) of FundsCapital Outlay from Non-Current Fund Sources (42,745,344) (10,006)$ Mandatory and Non-mandatory Transfers (See FN10) 3,197,498 749 Bond Proceeds Transfers (See FN4) 32,608,427 7,633 Debt Service Payments (See FN5) (18,730,583) (4,385) Subtotal (25,670,002)$ (6,009)$
Other Items Not for Current Operating UseUnrealized Gains / (Losses) (See FN6) (242,544) (57)$ Additions to Permanent Endowments (See FN7) 956,500 224 Subtotal 713,956$ 167$
Total Sources Over / (Under) Uses (See FN11) (44,378,238)$ (10,389)$
Texas Higher Education Coordinating Board 35 June, 2020

FY 2019
Operating SourcesEducational &
General DesignatedAuxiliary
EnterprisesRestricted
Expendable Loan Funds
Annuity, Life & Endowment and Similar Funds
Unexpended Plant
Retirement of Indebtedness
Investment In Plant Primary University
State of TexasState Appropriations 35,719,307 - - - - - - - - 35,719,307 State Grants and Contracts - Restricted 2,088,448 5,720,543 - 321,560 - - - - - 8,130,551 Higher Education Fund - - - - - - - - - - Available University Fund Excellence (See FN8) - - - - - - - - - - Subtotal 37,807,755 5,720,543 - 321,560 - - - - - 43,849,858
Student & ParentTuition Potential 100% 3,957,628 9,747,052 - - - - - - - 13,704,680 Waivers - Statutory (Not Reported in AFR) (808,839) - - - - - - - - (808,839) Waivers - Institutional (Not Reported in AFR) - - - - - - - - - - Exemptions - Statutory (Not Reported in AFR) - - - - - - - - - - Exemptions - Institutional (Not Reported in AFR) - - - - - - - - - - Tuition - Gross - AFR Presentation 3,148,789 9,747,052 - - - - - - - 12,895,841 Waivers - Statutory (Reported in AFR) - - - - - - - - - - Waivers - Institutional (Reported in AFR) - - - - - - - - - - Exemptions - Statutory (Reported in AFR) (179,974) (780,490) - - - - - - - (960,464) Exemptions - Institutional (Reported in AFR) - - - - - - - - - - All Other Scholarship Disc.& Allow. (See FN1) (19,681,259) (6,286,230) - - - - - - - (25,967,489) Tuition - net (16,712,444) 2,680,332 - - - - - - - (14,032,112)
Fees Potential 100% 12,418 4,918,132 1,296,025 - - - - - - 6,226,575 Waivers - Statutory (Not Reported in AFR) - - - - - - - - - - Waivers - Institutional (Not Reported in AFR) - - - - - - - - - - Exemptions - Statutory (Not Reported in AFR) - - - - - - - - - - Exemptions - Institutional (Not Reported in AFR) - - - - - - - - - - Fees - Gross - AFR Presentation 12,418 4,918,132 1,296,025 - - - - - - 6,226,575 Waivers - Statutory (Reported in AFR) - - - - - - - - - - Waivers - Institutional (Reported in AFR) - - - - - - - - - - Exemptions - Statutory (Reported in AFR) - - (85,480) - - - - - - (85,480) Exemptions - Institutional (Reported in AFR) - - - - - - - - - - All Other Scholarship Disc.& Allow. (See FN1) - - (539,038) - - - - - - (539,038) Fees - net 12,418 4,918,132 671,507 - - - - - - 5,602,057
Net Tuition and Fees (Funds Collected) (16,700,026) 7,598,464 671,507 - - - - - - (8,430,055)
Federal GovernmentFederal Grants and Contracts - Restricted - 333,414 - 9,879,346 - - - - - 10,212,760
Institutional ResourcesEndowment and Interest Income (See FN2) 251,180 (11) - 2,691,628 - 147,272 - - - 3,090,069 Local Government Grants - Restricted - - - 4,535,964 - - - - - 4,535,964 Private Gifts and Grants - Restricted - 30,361 - 2,938,104 - - - - - 2,968,465 Sales and Services - 1,129,059 - 713,071 - - - - - 1,842,130 Net Auxiliary Enterprises (See FN9) - - 4,397,452 - - - - - - 4,397,452 Other Income (See FN3) 1,186 1,181,347 - 292,516 - - - - 42,938 1,517,987 Subtotal 252,366 2,340,756 4,397,452 11,171,283 - 147,272 - - 42,938 18,352,067 Total Operating Sources 21,360,095 15,993,177 5,068,959 21,372,189 - 147,272 - - 42,938 63,984,630
Operating UsesInstruction 13,639,411 9,906,040 - 2,379,255 - - - - - 25,924,706 Research 240,821 388,992 - 878,973 - - - - - 1,508,786 Public Service 466,503 613,466 - 3,343,202 - - - - - 4,423,171 Academic Support 7,118,157 2,275,928 - 136,209 - - - - - 9,530,294 Student Services 2,569,097 1,413,879 - 205,021 - - - - - 4,187,997 Institutional Support 5,123,156 4,471,988 - 159,929 - - - - - 9,755,073 Operations and Maintenance of Plant 5,939,209 3,073,955 - 430,079 - - 2,639,022 - - 12,082,265 Scholarships and Fellowships 821,765 1,512,785 - 2,202,681 - - - - - 4,537,231 Auxiliary Enterprises (See FN9) - 9,245 9,045,411 1,381,751 - - - - - 10,436,407 Capital Outlay from Current Fund Sources* - 409,665 281,770 184,197 - - - - - 875,632 Other Expenses (See FN3) - - - 145,260 - - - - - 145,260 Total Operating Uses 35,918,119 24,075,943 9,327,181 11,446,557 - - 2,639,022 - - 83,406,822
Other Sources / (Uses) of FundsCapital Outlay from Non-Current Fund Sources** - - - - - - (42,745,344) - - (42,745,344) Mandatory and Non-mandatory Transfers (See FN10) (651,919) 4,600,681 1,366,122 (6,409,685) 113,071 5,791 4,173,437 - - 3,197,498 Bond Proceeds Transfers In (See FN4) - - - - - - 32,608,427 - - 32,608,427 Debt Service Payments (See FN5) (12,185,800) - (6,294,322) - - - (250,461) - - (18,730,583) Subtotal (12,837,719) 4,600,681 (4,928,200) (6,409,685) 113,071 5,791 (6,213,941) - - (25,670,002)
Other Items Not for Current Operating UseUnrealized Gains / (Losses) (See FN6) - - - 267,756 - (510,300) - - - (242,544) Additions to Permanent Endowments (See FN7) - - - - - 956,500 - - - 956,500 Subtotal - - - 267,756 - 446,200 - - - 713,956
Total Sources Over / (Under) Uses (See FN 11) (27,395,743) (3,482,085) (9,186,422) 3,783,703 113,071 599,263 (8,852,963) - 42,938 (44,378,238)
Bond Proceeds - - - - - - - - - - Depreciation Expense - - - - - - - - (16,161,864) (16,161,864) Transfer of Capital Asses(s) from System - - - - - - - - - - Other Post-Employment Benefit (OPEB) Expense - - - - - - - - - - Non-Cash Capital Gifts - - - - - - - - 2,310,004 2,310,004 Capital Outlay - - - - - - - - 43,620,975 43,620,975 Change in Net Assets (Total Agrees with AFR***) (27,395,743) (3,482,085) (9,186,422) 3,783,703 113,071 599,263 (8,852,963) - 29,812,053 (14,609,123)
**Defined as any capital outlay expense from funds other than Educational & General, Designated, Auxiliary, or Restricted Expendable.***As reported for "Changes in Net Position" shown on Schedule of Revenues, Expenses, and Changes in Net Position (SRECNP) in Annual Financial Report.
The University of Texas of the Permian BasinFor the Year Ended August 31, 2019Source: FY 2019 Annual Financial Report
Detail Worksheet FY 2019
Texas Higher Education Coordinating Board 36 June, 2020

The University of Texas of the Permian BasinFor the Year Ended August 31, 2019Source: FY 2019 Annual Financial Report
FOOTNOTES:
FN1: Scholarship Discounts and Allowances are scholarships, fellowships, and grants applied to tuition. The discount eliminates tuition revenues that are paid for by University resources which are recorded as revenue elsewhere on the financial statements (i.e. federal and state contracts and grants revenues). In addition, Scholarship Discounts and Allowances eliminate tuition revenue that is exempted from payment due to tuition exemptions approved by the Texas Legislature. Waivers, remissions, and exemptions represent tuition and fee dollars forgone by the university - some are required by statute. See the Integrated Financial Reporting System (IFRS) report submitted to THECB for details on waivers, exemptions, tuition, and fees. Allocation methods to individual funds shown may vary between institutions.
FN2: Endowment and Interest Income includes interest income and endowment payouts.
FN3: Other Income is primarily Other Operating and Other Non-operating Revenues from the AFR. Other Expenses is primarily Other Nonoperating Expenses from the AFR.
FN4: Bond Proceeds are funds received from the sale of bonds and commercial paper used to finance capital projects. This amount includes actual proceeds and accrued or anticipated proceeds to be transferred from System. Independent institutions report only to the extent expended in current year.
FN5: Debt service payments are payments to service and retire debt issued to fund capital projects. System components do this via transfers to System Administrations. Independent institutions use direct payment to appropriate paying agents.
FN6: Unrealized Gains / (Losses) represent the increase in the Fair Market Value of Investments and Endowments. Unrealized Gains / (Losses) are accrued as non-cash transactions. Therefore, funds are not actually received for this revenue stream. Accordingly, this revenue is not cash revenue and cannot be used by the University to fund operations.
FN7: Additions to Permanent Endowments are additions to endowment principal. This revenue is restricted for investment purposes only and cannot be used to fund operations. Only interest income from these endowments, which is reported on the Endowment and Investment Income line of this report, can be used by the University to fund operations.
FN8: Distributions from the Available University Fund appropriated through the Appropriation Bill are first used to pay debt service costs on Permanent University Fund Bonds. Funds remaining are distributed to constitutionally designated institutions to promote academic excellence. Only the Excellence funding is shown at the institution level. The AUF funds used to pay debt service on PUF bonds are reported at the System level.
FN9: Auxiliary Enterprises include athletics, housing and food, student services, and parking and transportation. Auxiliary Enterprises are required to be self-supporting, and therefore must operate on the funds they generate.
FN10: Mandatory and non-mandatory transfers includes transfers between funds, transfers between the University System and institutions and transfers to and from other state agencies. In total, all transfers between funds net to zero with the exception of any amounts transferred between the University System, between other institutions, or to and from another state agency. There are no transfers of education and general funds provided by the State of Texas to restricted or auxiliary fund groups. Transfers between education and general funds and designated funds are related to Texas Public Education Grant as provided by the State of Texas.
FN11. N/A
Texas Higher Education Coordinating Board 37 June, 2020

The University of Texas at San AntonioFor the Year Ended August 31, 2019Source: FY 2019 Annual Financial Report
Non-Operating Funds are not included in above charts. See following page (Summary).Charts May Not Add to 100% Due to Rounding
Total Operating Sources $586,421,450
Total Operating Sources $586,421,450
Total Operating Uses $527,518,923
State of Texas$158,607,508
27%
Student & Parent$207,741,867
35%
Federal Government$109,935,970
19%
Institutional Resources$110,136,105
19%
Operating Sources by Category
State Appropriations$130,953,607
22%
State Grants & Contracts
$27,653,9015%
Tuition & Fees$207,741,867
35%
Federal Grants & Contracts
$109,935,97019%
Endowment & Interest Income
$20,916,8204%
Local Government Grants
$811,1110%
Private Gifts & Grants$23,164,116
4%
Sales & Services$12,145,563
2%
Net Auxiliary Enterprises$46,993,268
8%
Other Income$6,105,227
1%
Operating Sources
Instruction$139,892,414
26%
Research$67,458,953
13%
Public Service$16,091,029
3%
Academic Support$64,572,708
12%
Student Services$30,906,138
6%Institutional Support
$44,412,6658%
Operations & Maintenance of Plant
$45,381,3039%
Scholarships & Fellowships$51,062,581
10%
Auxiliary Enterprises$58,147,884
11%Capital Outlay$9,509,363
2%
Other Expenses$83,885
0%
Operating Uses
Texas Higher Education Coordinating Board 38 June, 2020

The University of Texas at San AntonioFor the Year Ended August 31, 2019Source: FY 2019 Annual Financial Report
Summary Worksheet FY 2019 Amount Per FTSEInstitution State Funded FTSEs 26,613.23
Operating SourcesState of TexasState Appropriations 130,953,607$ 4,921$ State Grants and Contracts - Restricted 27,653,901 1,039 Higher Education Fund - - Available University Fund Excellence (See FN8) - - Subtotal 158,607,508$ 5,960$
Student & ParentTuition - net 132,346,380$ 4,973$ Fees - net 75,395,487 2,833 Tuition and Fees (net of Scholarship Discounts and Allowances) 207,741,867$ 7,806$
Federal GovernmentFederal Grants and Contracts - Restricted 109,935,970$ 4,131$
Institutional ResourcesEndowment and Interest Income (See FN2) 20,916,820$ 786$ Local Government Grants - Restricted 811,111 30 Private Gifts and Grants - Restricted 23,164,116 870 Sales and Services 12,145,563 456 Net Auxiliary Enterprises (See FN9) 46,993,268 1,766 Other Income (See FN3) 6,105,227 229 Subtotal 110,136,105$ 4,137$ Total Operating Sources 586,421,450$ 22,034$
Operating UsesInstruction 139,892,414$ 5,256$ Research 67,458,953 2,535 Public Service 16,091,029 605 Academic Support 64,572,708 2,426 Student Services 30,906,138 1,161 Institutional Support 44,412,665 1,669 Operations and Maintenance of Plant 45,381,303 1,705 Scholarships and Fellowships 51,062,581 1,919 Auxiliary Enterprises (See FN9) 58,147,884 2,185 Capital Outlay from Current Fund Sources 9,509,363 357 Other Expenses (See FN3) 83,885 3 Total Operating Uses 527,518,923$ 19,821$
Other Sources / (Uses) of FundsCapital Outlay from Non-Current Fund Sources (55,452,033) (2,084)$ Mandatory and Non-mandatory Transfers (See FN10) 3,454,381 130 Bond Proceeds Transfers (See FN4) 47,173,188 1,773 Debt Service Payments (See FN5) (37,657,017) (1,415) Subtotal (42,481,481)$ (1,596)$
Other Items Not for Current Operating UseUnrealized Gains / (Losses) (See FN6) 6,603,085 248$ Additions to Permanent Endowments (See FN7) 3,713,115 140 Subtotal 10,316,200$ 388$
Total Sources Over / (Under) Uses (See FN11) 26,737,246$ 1,005$
Texas Higher Education Coordinating Board 39 June, 2020

FY 2019
Operating SourcesEducational &
General DesignatedAuxiliary
EnterprisesRestricted
Expendable Loan Funds
Annuity, Life & Endowment and Similar Funds
Unexpended Plant
Retirement of Indebtedness
Investment In Plant Primary University
State of TexasState Appropriations 130,953,607 - - - - - - - - 130,953,607 State Grants and Contracts - Restricted 25,136,229 1,116,623 - 1,401,049 - - - - - 27,653,901 Higher Education Fund - - - - - - - - - - Available University Fund Excellence (See FN8) - - - - - - - - - - Subtotal 156,089,836 1,116,623 - 1,401,049 - - - - - 158,607,508
Student & ParentTuition Potential 100% 59,325,474 146,216,018 - - - - - - - 205,541,492 Waivers - Statutory (Not Reported in AFR) (10,996,630) - - - - - - - - (10,996,630) Waivers - Institutional (Not Reported in AFR) - - - - - - - - - - Exemptions - Statutory (Not Reported in AFR) - - - - - - - - - - Exemptions - Institutional (Not Reported in AFR) - - - - - - - - - - Tuition - Gross - AFR Presentation 48,328,844 146,216,018 - - - - - - - 194,544,862 Waivers - Statutory (Reported in AFR) - - - - - - - - - - Waivers - Institutional (Reported in AFR) - - - - - - - - - - Exemptions - Statutory (Reported in AFR) (3,288,202) (14,687,271) - - - - - - - (17,975,473) Exemptions - Institutional (Reported in AFR) - - - - - - - - - - All Other Scholarship Disc.& Allow. (See FN1) (12,289,222) (31,933,787) - - - - - - - (44,223,009) Tuition - net 32,751,420 99,594,960 - - - - - - - 132,346,380
Fees Potential 100% 4,328,193 70,673,591 35,802,338 - - - - - - 110,804,122 Waivers - Statutory (Not Reported in AFR) - - - - - - - - - - Waivers - Institutional (Not Reported in AFR) - - - - - - - - - - Exemptions - Statutory (Not Reported in AFR) - - - - - - - - - - Exemptions - Institutional (Not Reported in AFR) - - - - - - - - - - Fees - Gross - AFR Presentation 4,328,193 70,673,591 35,802,338 - - - - - - 110,804,122 Waivers - Statutory (Reported in AFR) - - - - - - - - - - Waivers - Institutional (Reported in AFR) - - - - - - - - - - Exemptions - Statutory (Reported in AFR) - - (2,427,514) - - - - - - (2,427,514) Exemptions - Institutional (Reported in AFR) - - - - - - - - - - All Other Scholarship Disc.& Allow. (See FN1) (1,395,069) (22,534,314) (9,051,738) - - - - - - (32,981,121) Fees - net 2,933,124 48,139,277 24,323,086 - - - - - - 75,395,487
Net Tuition and Fees (Funds Collected) 35,684,544 147,734,237 24,323,086 - - - - - - 207,741,867
Federal GovernmentFederal Grants and Contracts - Restricted - 7,274,375 - 102,661,595 - - - - - 109,935,970
Institutional ResourcesEndowment and Interest Income (See FN2) 2,506,947 5,151,654 2,542,601 9,508,344 204,185 90,206 912,883 - - 20,916,820 Local Government Grants - Restricted - 250,178 - 560,933 - - - - - 811,111 Private Gifts and Grants - Restricted - 329,803 - 22,834,313 - - - - - 23,164,116 Sales and Services - 9,600,573 - 2,544,990 - - - - - 12,145,563 Net Auxiliary Enterprises (See FN9) - - 46,993,268 - - - - - - 46,993,268 Other Income (See FN3) 2,107,465 2,519,176 14,941 1,280,079 366,935 - - - (183,369) 6,105,227 Subtotal 4,614,412 17,851,384 49,550,810 36,728,659 571,120 90,206 912,883 - (183,369) 110,136,105 Total Operating Sources 196,388,792 173,976,619 73,873,896 140,791,303 571,120 90,206 912,883 - (183,369) 586,421,450
Operating UsesInstruction 119,970,219 16,220,684 - 3,701,511 - - - - - 139,892,414 Research 16,665,931 10,197,250 - 40,595,772 - - - - - 67,458,953 Public Service 6,732,743 1,858,828 - 7,499,458 - - - - - 16,091,029 Academic Support 23,780,376 38,340,310 - 2,452,022 - - - - - 64,572,708 Student Services 5,755,486 23,849,957 - 648,353 652,342 - - - - 30,906,138 Institutional Support 31,966,029 11,491,304 - 955,332 - - - - - 44,412,665 Operations and Maintenance of Plant 19,725,903 20,115,142 - 445,626 - - 5,094,632 - - 45,381,303 Scholarships and Fellowships 10,700,599 18,522,656 - 21,839,326 - - - - - 51,062,581 Auxiliary Enterprises (See FN9) - 4,628,388 51,864,518 1,654,978 - - - - - 58,147,884 Capital Outlay from Current Fund Sources* 400,738 4,803,842 1,192,090 3,112,693 - - - - - 9,509,363 Other Expenses (See FN3) - 37,000 - - 46,885 - - - - 83,885 Total Operating Uses 235,698,024 150,065,361 53,056,608 82,905,071 699,227 - 5,094,632 - - 527,518,923
Other Sources / (Uses) of FundsCapital Outlay from Non-Current Fund Sources** - - - - - - (55,452,033) - - (55,452,033) Mandatory and Non-mandatory Transfers (See FN10) 53,454,333 (16,640,948) (3,631,175) (45,692,391) 300,000 2,676,127 12,988,435 - - 3,454,381 Bond Proceeds Transfers In (See FN4) - - - - - - 47,173,188 - - 47,173,188 Debt Service Payments (See FN5) (16,640,288) (4,636,777) (16,379,952) - - - - - - (37,657,017) Subtotal 36,814,045 (21,277,725) (20,011,127) (45,692,391) 300,000 2,676,127 4,709,590 - - (42,481,481)
Other Items Not for Current Operating UseUnrealized Gains / (Losses) (See FN6) 1,963,114 856,304 1,587,970 905,447 - 1,290,250 - - - 6,603,085 Additions to Permanent Endowments (See FN7) - - - - - 3,713,115 - - - 3,713,115 Subtotal 1,963,114 856,304 1,587,970 905,447 - 5,003,365 - - - 10,316,200
Total Sources Over / (Under) Uses (See FN 11) (532,073) 3,489,837 2,394,131 13,099,288 171,893 7,769,698 527,841 - (183,369) 26,737,246
Bond Proceeds - - - - - - - - - - Depreciation Expense - - - - - - - - (49,952,040) (49,952,040) Transfer of Capital Asses(s) from System - - - - - - - - - - Other Post-Employment Benefit (OPEB) Expense - - - - - - - - - - Non-Cash Capital Gifts - - - - - - - - 554,772 554,772 Capital Outlay - - - - - - - - 64,961,396 64,961,396 Change in Net Assets (Total Agrees with AFR***) (532,073) 3,489,837 2,394,131 13,099,288 171,893 7,769,698 527,841 - 15,380,759 42,301,374
*Defined as any capital outlay expenses from Educational & General, Designated, Auxiliary, or Restricted Expendable Funds.**Defined as any capital outlay expense from funds other than Educational & General, Designated, Auxiliary, or Restricted Expendable.***As reported for "Changes in Net Position" shown on Schedule of Revenues, Expenses, and Changes in Net Position (SRECNP) in Annual Financial Report.
The University of Texas at San AntonioFor the Year Ended August 31, 2019Source: FY 2019 Annual Financial Report
Detail Worksheet FY 2019
Texas Higher Education Coordinating Board 40 June, 2020

The University of Texas at San AntonioFor the Year Ended August 31, 2019Source: FY 2019 Annual Financial Report
FOOTNOTES:
FN1: Scholarship Discounts and Allowances are scholarships, fellowships, and grants applied to tuition. The discount eliminates tuition revenues that are paid for by University resources which are recorded as revenue elsewhere on the financial statements (i.e. federal and state contracts and grants revenues). In addition, Scholarship Discounts and Allowances eliminate tuition revenue that is exempted from payment due to tuition exemptions approved by the Texas Legislature. Waivers, remissions, and exemptions represent tuition and fee dollars forgone by the university - some are required by statute. See the Integrated Financial Reporting System (IFRS) report submitted to THECB for details on waivers, exemptions, tuition, and fees. Allocation methods to individual funds shown may vary between institutions.
FN2: Endowment and Interest Income includes interest income and endowment payouts.
FN3: Other Income is primarily Other Operating and Other Non-operating Revenues from the AFR. Other Expenses is primarily Other Nonoperating Expenses from the AFR.
FN4: Bond Proceeds are funds received from the sale of bonds and commercial paper used to finance capital projects. This amount includes actual proceeds and accrued or anticipated proceeds to be transferred from System. Independent institutions report only to the extent expended in current year.
FN5: Debt service payments are payments to service and retire debt issued to fund capital projects. System components do this via transfers to System Administrations. Independent institutions use direct payment to appropriate paying agents.
FN6: Unrealized Gains / (Losses) represent the increase in the Fair Market Value of Investments and Endowments. Unrealized Gains / (Losses) are accrued as non-cash transactions. Therefore, funds are not actually received for this revenue stream. Accordingly, this revenue is not cash revenue and cannot be used by the University to fund operations.
FN7: Additions to Permanent Endowments are additions to endowment principal. This revenue is restricted for investment purposes only and cannot be used to fund operations. Only interest income from these endowments, which is reported on the Endowment and Investment Income line of this report, can be used by the University to fund operations.
FN8: Distributions from the Available University Fund appropriated through the Appropriation Bill are first used to pay debt service costs on Permanent University Fund Bonds. Funds remaining are distributed to constitutionally designated institutions to promote academic excellence. Only the Excellence funding is shown at the institution level. The AUF funds used to pay debt service on PUF bonds are reported at the System level.
FN9: Auxiliary Enterprises include athletics, housing and food, student services, and parking and transportation. Auxiliary Enterprises are required to be self-supporting, and therefore must operate on the funds they generate.
FN10: Mandatory and non-mandatory transfers includes transfers between funds, transfers between the University System and institutions and transfers to and from other state agencies. In total, all transfers between funds net to zero with the exception of any amounts transferred between the University System, between other institutions, or to and from another state agency. There are no transfers of education and general funds provided by the State of Texas to restricted or auxiliary fund groups. Transfers between education and general funds and designated funds are related to Texas Public Education Grant as provided by the State of Texas.
FN11: Of the net increase of $26,737,246 approximately $16.4 million represents revenues received but not yet expended. This income is fully committed to program expenditures and capital disbursements. The remaining $10.3 million represents non-expendable funds from unrealized gains and additions to permanent endowments of approximately $6.6 million and $3.7 million respectively. Unrealized gains and additions to permanent endowments do not contribute to the availability of the institution's operating cash as discussed in FN6 and FN7.
Texas Higher Education Coordinating Board 41 June, 2020

The University of Texas at TylerFor the Year Ended August 31, 2019Source: FY 2019 Annual Financial Report
Non-Operating Funds are not included in above charts. See following page (Summary).Charts May Not Add to 100% Due to Rounding
Total Operating Sources $154,289,365
Total Operating Sources $154,289,365
Total Operating Uses $137,313,133
State of Texas$53,872,752
35%
Student & Parent$51,919,549
34%
Federal Government$15,959,183
10%
Institutional Resources$32,537,881
21%
Operating Sources by Category
State Appropriations$43,955,067
29%
State Grants & Contracts$9,917,685
6%
Tuition & Fees$51,919,549
34%
Federal Grants & Contracts
$15,959,18310%
Endowment & Interest Income
$6,509,5914%
Local Government Grants
$00%
Private Gifts & Grants$3,962,218
3%
Sales & Services$11,225,447
7%
Net Auxiliary Enterprises$10,553,752
7%
Operating Sources
Instruction$56,531,784
41%
Research$2,071,916
2%
Public Service$596,655
0%
Academic Support$17,154,653
12%
Student Services$11,944,337
9%
Institutional Support$13,679,288
10%
Operations & Maintenance of Plant
$12,224,0919%
Scholarships & Fellowships$9,152,273
7%
Auxiliary Enterprises$13,307,991
10%
Capital Outlay$646,540
0%
Other Expenses$3,605
0%
Operating Uses
Texas Higher Education Coordinating Board 42 June, 2020

The University of Texas at TylerFor the Year Ended August 31, 2019Source: FY 2019 Annual Financial Report
Summary Worksheet FY 2019 Amount Per FTSEInstitution State Funded FTSEs 7,343.30
Operating SourcesState of TexasState Appropriations 43,955,067$ 5,986$ State Grants and Contracts - Restricted 9,917,685 1,351 Higher Education Fund - - Available University Fund Excellence (See FN8) - - Subtotal 53,872,752$ 7,337$
Student & ParentTuition - net 31,969,720$ 4,354$ Fees - net 19,949,829 2,717 Tuition and Fees (net of Scholarship Discounts and Allowances) 51,919,549$ 7,071$
Federal GovernmentFederal Grants and Contracts - Restricted 15,959,183$ 2,173$
Institutional ResourcesEndowment and Interest Income (See FN2) 6,509,591$ 886$ Local Government Grants - Restricted - - Private Gifts and Grants - Restricted 3,962,218 540 Sales and Services 11,225,447 1,529 Net Auxiliary Enterprises (See FN9) 10,553,752 1,437 Other Income (See FN3) 286,873 39 Subtotal 32,537,881$ 4,431$ Total Operating Sources 154,289,365$ 21,012$
Operating UsesInstruction 56,531,784$ 7,698$ Research 2,071,916 282 Public Service 596,655 81 Academic Support 17,154,653 2,336 Student Services 11,944,337 1,627 Institutional Support 13,679,288 1,863 Operations and Maintenance of Plant 12,224,091 1,665 Scholarships and Fellowships 9,152,273 1,246 Auxiliary Enterprises (See FN9) 13,307,991 1,812 Capital Outlay from Current Fund Sources 646,540 88 Other Expenses (See FN3) 3,605 - Total Operating Uses 137,313,133$ 18,698$
Other Sources / (Uses) of FundsCapital Outlay from Non-Current Fund Sources (14,983,471) (2,040)$ Mandatory and Non-mandatory Transfers (See FN10) 589,575 80 Bond Proceeds Transfers (See FN4) 10,515,699 1,432 Debt Service Payments (See FN5) (15,924,268) (2,169) Subtotal (19,802,465)$ (2,697)$
Other Items Not for Current Operating UseUnrealized Gains / (Losses) (See FN6) 539,362 73$ Additions to Permanent Endowments (See FN7) 923,106 126 Subtotal 1,462,468$ 199$
Total Sources Over / (Under) Uses (See FN11) (1,363,765)$ (184)$
Texas Higher Education Coordinating Board 43 June, 2020

FY 2019
Operating SourcesEducational &
General DesignatedAuxiliary
EnterprisesRestricted
Expendable Loan Funds
Annuity, Life & Endowment and Similar Funds
Unexpended Plant
Retirement of Indebtedness
Investment In Plant Primary University
State of TexasState Appropriations 43,955,067 - - - - - - - - 43,955,067 State Grants and Contracts - Restricted 3,374,609 6,468,431 - 74,645 - - - - - 9,917,685 Higher Education Fund - - - - - - - - - - Available University Fund Excellence (See FN8) - - - - - - - - - - Subtotal 47,329,676 6,468,431 - 74,645 - - - - - 53,872,752
Student & ParentTuition Potential 100% 16,121,932 44,590,195 - - - - - - - 60,712,127 Waivers - Statutory (Not Reported in AFR) (3,054,590) - - - - - - - - (3,054,590) Waivers - Institutional (Not Reported in AFR) - - - - - - - - - - Exemptions - Statutory (Not Reported in AFR) - - - - - - - - - - Exemptions - Institutional (Not Reported in AFR) - - - - - - - - - - Tuition - Gross - AFR Presentation 13,067,342 44,590,195 - - - - - - - 57,657,537 Waivers - Statutory (Reported in AFR) - - - - - - - - - - Waivers - Institutional (Reported in AFR) - - - - - - - - - - Exemptions - Statutory (Reported in AFR) (483,833) (3,670,622) - - - - - - - (4,154,455) Exemptions - Institutional (Reported in AFR) - - - - - - - - - - All Other Scholarship Disc.& Allow. (See FN1) (4,015,022) (17,518,340) - - - - - - - (21,533,362) Tuition - net 8,568,487 23,401,233 - - - - - - - 31,969,720
Fees Potential 100% - 15,240,104 7,258,167 - - - - - - 22,498,271 Waivers - Statutory (Not Reported in AFR) - - - - - - - - - - Waivers - Institutional (Not Reported in AFR) - - - - - - - - - - Exemptions - Statutory (Not Reported in AFR) - - - - - - - - - - Exemptions - Institutional (Not Reported in AFR) - - - - - - - - - - Fees - Gross - AFR Presentation - 15,240,104 7,258,167 - - - - - - 22,498,271 Waivers - Statutory (Reported in AFR) - - - - - - - - - - Waivers - Institutional (Reported in AFR) - - - - - - - - - - Exemptions - Statutory (Reported in AFR) - - (589,635) - - - - - - (589,635) Exemptions - Institutional (Reported in AFR) - - (1,958,807) - - - - - - (1,958,807) All Other Scholarship Disc.& Allow. (See FN1) - - - - - - - - - - Fees - net - 15,240,104 4,709,725 - - - - - - 19,949,829
Net Tuition and Fees (Funds Collected) 8,568,487 38,641,337 4,709,725 - - - - - - 51,919,549
Federal GovernmentFederal Grants and Contracts - Restricted - 1,074,817 - 14,884,366 - - - - - 15,959,183
Institutional ResourcesEndowment and Interest Income (See FN2) 243,510 2,253,778 - 3,996,116 - 16,187 - - - 6,509,591 Local Government Grants - Restricted - - - - - - - - - - Private Gifts and Grants - Restricted - 790,842 340,046 2,726,069 - - 105,261 - - 3,962,218 Sales and Services 143 10,484,147 - 741,157 - - - - - 11,225,447 Net Auxiliary Enterprises (See FN9) - - 10,553,752 - - - - - - 10,553,752 Other Income (See FN3) - 259,452 3,950 23,471 - - - - - 286,873 Subtotal 243,653 13,788,219 10,897,748 7,486,813 - 16,187 105,261 - - 32,537,881 Total Operating Sources 56,141,816 59,972,804 15,607,473 22,445,824 - 16,187 105,261 - - 154,289,365
Operating UsesInstruction 31,014,320 23,114,773 - 2,402,691 - - - - - 56,531,784 Research 61,449 672,898 - 1,337,569 - - - - - 2,071,916 Public Service - 417,531 - 179,124 - - - - - 596,655 Academic Support 4,205,806 12,511,317 - 437,530 - - - - - 17,154,653 Student Services 2,205,446 9,920,730 - 100,088 (281,927) - - - - 11,944,337 Institutional Support 3,428,522 9,748,985 - 501,781 - - - - - 13,679,288 Operations and Maintenance of Plant 3,215,918 6,295,932 - 48 - - 2,712,193 - - 12,224,091 Scholarships and Fellowships 920,699 4,100,322 - 4,131,252 - - - - - 9,152,273 Auxiliary Enterprises (See FN9) - 480,298 12,732,811 94,882 - - - - - 13,307,991 Capital Outlay from Current Fund Sources* 88,895 472,603 63,982 21,060 - - - - - 646,540 Other Expenses (See FN3) - 3,605 - - - - - - - 3,605 Total Operating Uses 45,141,055 67,738,994 12,796,793 9,206,025 (281,927) - 2,712,193 - - 137,313,133
Other Sources / (Uses) of FundsCapital Outlay from Non-Current Fund Sources** - - - - - - (14,983,471) - - (14,983,471) Mandatory and Non-mandatory Transfers (See FN10) 577,982 8,306,121 1,615,266 (11,174,430) 155,743 19,984 1,088,909 - - 589,575 Bond Proceeds Transfers In (See FN4) - - - - - - 10,515,699 - - 10,515,699 Debt Service Payments (See FN5) (9,869,625) (1,678,918) (4,375,725) - - - - - - (15,924,268) Subtotal (9,291,643) 6,627,203 (2,760,459) (11,174,430) 155,743 19,984 (3,378,863) - - (19,802,465)
Other Items Not for Current Operating UseUnrealized Gains / (Losses) (See FN6) - 1,204,026 - - - (660,463) - - (4,201) 539,362 Additions to Permanent Endowments (See FN7) - - - 16,665 - 906,441 - - - 923,106 Subtotal - 1,204,026 - 16,665 - 245,978 - - (4,201) 1,462,468
Total Sources Over / (Under) Uses (See FN 11) 1,709,118 65,039 50,221 2,082,034 437,670 282,149 (5,985,795) - (4,201) (1,363,765)
Bond Proceeds - - - - - - - - - - Depreciation Expense - - - - - - - - (17,202,654) (17,202,654) Transfer of Capital Asses(s) from System - - - - - - - - - - Other Post-Employment Benefit (OPEB) Expense - - - - - - - - - - Non-Cash Capital Gifts - - - - - - - - - - Capital Outlay - - - - - - - - 15,630,012 15,630,012 Change in Net Assets (Total Agrees with AFR***) 1,709,118 65,039 50,221 2,082,034 437,670 282,149 (5,985,795) - (1,576,843) (2,936,407)
*Defined as any capital outlay expenses from Educational & General, Designated, Auxiliary, or Restricted Expendable Funds.**Defined as any capital outlay expense from funds other than Educational & General, Designated, Auxiliary, or Restricted Expendable.***As reported for "Changes in Net Position" shown on Schedule of Revenues, Expenses, and Changes in Net Position (SRECNP) in Annual Financial Report.
The University of Texas at TylerFor the Year Ended August 31, 2019Source: FY 2019 Annual Financial Report
Detail Worksheet FY 2019
Texas Higher Education Coordinating Board 44 June, 2020

The University of Texas at TylerFor the Year Ended August 31, 2019Source: FY 2019 Annual Financial Report
FOOTNOTES:
FN1: Scholarship Discounts and Allowances are scholarships, fellowships, and grants applied to tuition. The discount eliminates tuition revenues that are paid for by University resources which are recorded as revenue elsewhere on the financial statements (i.e. federal and state contracts and grants revenues). In addition, Scholarship Discounts and Allowances eliminate tuition revenue that is exempted from payment due to tuition exemptions approved by the Texas Legislature. Waivers, remissions, and exemptions represent tuition and fee dollars forgone by the university - some are required by statute. See the Integrated Financial Reporting System (IFRS) report submitted to THECB for details on waivers, exemptions, tuition, and fees. Allocation methods to individual funds shown may vary between institutions.
FN2: Endowment and Interest Income includes interest income and endowment payouts.
FN3: Other Income is primarily Other Operating and Other Non-operating Revenues from the AFR. Other Expenses is primarily Other Nonoperating Expenses from the AFR.
FN4: Bond Proceeds are funds received from the sale of bonds and commercial paper used to finance capital projects. This amount includes actual proceeds and accrued or anticipated proceeds to be transferred from System. Independent institutions report only to the extent expended in current year.
FN5: Debt service payments are payments to service and retire debt issued to fund capital projects. System components do this via transfers to System Administrations. Independent institutions use direct payment to appropriate paying agents.
FN6: Unrealized Gains / (Losses) represent the increase in the Fair Market Value of Investments and Endowments. Unrealized Gains / (Losses) are accrued as non-cash transactions. Therefore, funds are not actually received for this revenue stream. Accordingly, this revenue is not cash revenue and cannot be used by the University to fund operations.
FN7: Additions to Permanent Endowments are additions to endowment principal. This revenue is restricted for investment purposes only and cannot be used to fund operations. Only interest income from these endowments, which is reported on the Endowment and Investment Income line of this report, can be used by the University to fund operations.
FN8: Distributions from the Available University Fund appropriated through the Appropriation Bill are first used to pay debt service costs on Permanent University Fund Bonds. Funds remaining are distributed to constitutionally designated institutions to promote academic excellence. Only the Excellence funding is shown at the institution level. The AUF funds used to pay debt service on PUF bonds are reported at the System level.
FN9: Auxiliary Enterprises include athletics, housing and food, student services, and parking and transportation. Auxiliary Enterprises are required to be self-supporting, and therefore must operate on the funds they generate.
FN10: Mandatory and non-mandatory transfers includes transfers between funds, transfers between the University System and institutions and transfers to and from other state agencies. In total, all transfers between funds net to zero with the exception of any amounts transferred between the University System, between other institutions, or to and from another state agency. There are no transfers of education and general funds provided by the State of Texas to restricted or auxiliary fund groups. Transfers between education and general funds and designated funds are related to Texas Public Education Grant as provided by the State of Texas.
FN11. N/A
Texas Higher Education Coordinating Board 45 June, 2020

Texas A&M UniversityFor the Year Ended August 31, 2019Source: FY 2019 Annual Financial Report
Non-Operating Funds are not included in above charts. See following page (Summary).Charts May Not Add to 100% Due to Rounding
Total Operating Sources $2,165,828,551
Total Operating Sources $2,165,828,551
Total Operating Uses $1,826,954,385
State of Texas$589,652,293
27%
Student & Parent$620,458,600
29%Federal Government
$165,765,9918%
Institutional Resources$789,951,667
36%
Operating Sources by Category
State Appropriations$338,603,853
16%
State Grants & Contracts
$77,720,3253%
Available University Fund Excellence
$173,328,1158%
Tuition & Fees$620,458,600
29%
Federal Grants & Contracts
$165,765,9918%
Endowment & Interest Income
$80,790,3904%
Private Gifts & Grants$280,603,052
13%
Sales & Services$154,994,950
7%
Net Auxiliary Enterprises
$218,164,62310%
Other Income$55,398,652
2%
Operating Sources
Instruction$593,184,139
32%
Research$219,196,793
12%
Public Service$26,906,578
2%
Academic Support$251,839,140
14% Student Services$79,384,184
4%
Institutional Support$81,338,032
4%
Operations & Maintenance of Plant
$139,346,5668%
Scholarships & Fellowships$110,865,899
6%
Auxiliary Enterprises$229,597,214
13%Capital Outlay
$59,954,0733%
Other Expenses$35,341,767
2%
Operating Uses
Texas Higher Education Coordinating Board 46 June, 2020

Texas A&M UniversityFor the Year Ended August 31, 2019Source: FY 2019 Annual Financial Report
Summary Worksheet FY 2019 Amount Per FTSEInstitution State Funded FTSEs 55,669.85
Operating SourcesState of TexasState Appropriations 338,603,853$ 6,082$ State Grants and Contracts - Restricted 77,720,325 1,396 Higher Education Fund - - Available University Fund Excellence (See FN8) 173,328,115 3,114 Subtotal 589,652,293$ 10,592$
Student & ParentTuition - net 414,530,185$ 7,446$ Fees - net 205,928,415 3,699 Tuition and Fees (net of Scholarship Discounts and Allowances) 620,458,600$ 11,145$
Federal GovernmentFederal Grants and Contracts - Restricted 165,765,991$ 2,978$
Institutional ResourcesEndowment and Interest Income (See FN2) 80,790,390$ 1,451$ Local Government Grants - Restricted - - Private Gifts and Grants - Restricted 280,603,052 5,040 Sales and Services 154,994,950 2,784 Net Auxiliary Enterprises (See FN9) 218,164,623 3,919 Other Income (See FN3) 55,398,652 995 Subtotal 789,951,667$ 14,189$ Total Operating Sources 2,165,828,551$ 38,904$
Operating UsesInstruction 593,184,139$ 10,655$ Research 219,196,793 3,937 Public Service 26,906,578 483 Academic Support 251,839,140 4,524 Student Services 79,384,184 1,426 Institutional Support 81,338,032 1,461 Operations and Maintenance of Plant 139,346,566 2,503 Scholarships and Fellowships 110,865,899 1,991 Auxiliary Enterprises (See FN9) 229,597,214 4,124 Capital Outlay from Current Fund Sources 59,954,073 1,077 Other Expenses (See FN3) 35,341,767 635 Total Operating Uses 1,826,954,385$ 32,816$
Other Sources / (Uses) of FundsCapital Outlay from Non-Current Fund Sources 59,677,719 1,072$ Mandatory and Non-mandatory Transfers (See FN10) 13,937,779 250 Bond Proceeds Transfers (See FN4) - - Debt Service Payments (See FN5) (170,232,939) (3,058) Subtotal (96,617,441)$ (1,736)$
Other Items Not for Current Operating UseUnrealized Gains / (Losses) (See FN6) (29,786,909) (535)$ Additions to Permanent Endowments (See FN7) 2,238,660 40 Subtotal (27,548,249)$ (495)$
Total Sources Over / (Under) Uses (See FN11) 214,708,476$ 3,857$
Texas Higher Education Coordinating Board 47 June, 2020

FY 2019
Operating SourcesEducational &
General DesignatedAuxiliary
EnterprisesRestricted Expendable Loan Funds
Annuity, Life & Endowment and
Similar FundsUnexpended
PlantRetirement of Indebtedness
Investment In Plant Primary University
State of TexasState Appropriations 338,603,853 - - - - - - - - 338,603,853 State Grants and Contracts - Restricted 67,816,220 471,735 - 9,432,370 - - - - - 77,720,325 Higher Education Fund - - - - - - - - - - Available University Fund Excellence (See FN8) 64,695,488 108,632,627 - - - - - - - 173,328,115 Subtotal 471,115,561 109,104,362 - 9,432,370 - - - - - 589,652,293
Student & ParentTuition Potential 100% 180,744,021 416,443,591 - - - - - - - 597,187,612 Waivers - Statutory (Not Reported in AFR) (53,123,307) (16,905,917) - - - - - - - (70,029,224) Waivers - Institutional (Not Reported in AFR) (9,960) (10,992) - - - - - - - (20,952) Exemptions - Statutory (Not Reported in AFR) - - - - - - - - - - Exemptions - Institutional (Not Reported in AFR) - - - - - - - - - - Tuition - Gross - AFR Presentation 127,610,754 399,526,682 - - - - - - - 527,137,436 Waivers - Statutory (Reported in AFR) - - - - - - - - - - Waivers - Institutional (Reported in AFR) - - - - - - - - - - Exemptions - Statutory (Reported in AFR) (3,878,475) (21,400,558) - - - - - - - (25,279,033) Exemptions - Institutional (Reported in AFR) - - - - - - - - - - All Other Scholarship Disc.& Allow. (See FN1) (23,381,771) (63,946,447) - - - - - - - (87,328,218) Tuition - net 100,350,508 314,179,677 - - - - - - - 414,530,185
Fees Potential 100% 714,093 225,935,512 35,283,619 - - - - - - 261,933,224 Waivers - Statutory (Not Reported in AFR) (19) (45,430) (18,844) - - - - - - (64,293) Waivers - Institutional (Not Reported in AFR) - - - - - - - - - - Exemptions - Statutory (Not Reported in AFR) - - - - - - - - - - Exemptions - Institutional (Not Reported in AFR) - - - - - - - - - - Fees - Gross - AFR Presentation 714,074 225,890,082 35,264,775 - - - - - - 261,868,931 Waivers - Statutory (Reported in AFR) - - - - - - - - - - Waivers - Institutional (Reported in AFR) - - - - - - - - - - Exemptions - Statutory (Reported in AFR) (3,072) (8,316,298) (1,343,627) - - - - - - (9,662,997) Exemptions - Institutional (Reported in AFR) - - - - - - - - - - All Other Scholarship Disc.& Allow. (See FN1) (149,469) (39,938,406) (6,189,644) - - - - - - (46,277,519) Fees - net 561,533 177,635,378 27,731,504 - - - - - - 205,928,415
Net Tuition and Fees (Funds Collected) 100,912,041 491,815,055 27,731,504 - - - - - - 620,458,600
Federal GovernmentFederal Grants and Contracts - Restricted 7,249 21,997,554 20,005 143,741,183 - - - - - 165,765,991
Institutional ResourcesEndowment and Interest Income (See FN2) 3,680,618 61,710,063 9,041,887 5,174,255 129,079 70,015 984,473 - - 80,790,390 Local Government Grants - Restricted - - - - - - - - - - Private Gifts and Grants - Restricted - 10,759,849 34,947,625 234,794,936 100,642 - - - - 280,603,052 Sales and Services 36,281,820 116,745,151 - 1,967,979 - - - - - 154,994,950 Net Auxiliary Enterprises (See FN9) - - 218,164,623 - - - - - - 218,164,623 Other Income (See FN3) 459,631 50,921,312 6,476,440 813,415 973,493 - - - (4,245,639) 55,398,652 Subtotal 40,422,069 240,136,375 268,630,575 242,750,585 1,203,214 70,015 984,473 - (4,245,639) 789,951,667 Total Operating Sources 612,456,920 863,053,346 296,382,084 395,924,138 1,203,214 70,015 984,473 - (4,245,639) 2,165,828,551
Operating UsesInstruction 389,512,944 126,710,295 - 76,960,900 - - - - - 593,184,139 Research 16,792,186 61,293,511 - 141,035,552 - - 75,544 - - 219,196,793 Public Service 2,996,023 19,863,094 - 4,047,461 - - - - - 26,906,578 Academic Support 106,277,150 115,751,080 - 29,810,910 - - - - - 251,839,140 Student Services 16,321,653 57,497,925 - 4,977,991 586,615 - - - - 79,384,184 Institutional Support 48,311,992 32,263,460 - 762,580 - - - - - 81,338,032 Operations and Maintenance of Plant 12,693,026 105,351,653 - 2,141,633 - - 19,160,254 - - 139,346,566 Scholarships and Fellowships 14,085,751 59,442,776 - 37,337,372 - - - - - 110,865,899 Auxiliary Enterprises (See FN9) - - 229,597,214 - - - - - - 229,597,214 Capital Outlay from Current Fund Sources* 450,803 40,730,674 12,419,543 6,353,053 - - - - - 59,954,073 Other Expenses (See FN3) 1,029,235 8,889,388 2,506,957 30,000 9,851 - 44,871 - 22,831,465 35,341,767 Total Operating Uses 608,470,763 627,793,856 244,523,714 303,457,452 596,466 - 19,280,669 - 22,831,465 1,826,954,385
Other Sources / (Uses) of FundsCapital Outlay from Non-Current Fund Sources** - - - - - - (74,799,888) - 134,477,607 59,677,719 Mandatory and Non-mandatory Transfers (See FN10) (3,722,174) (104,256,839) (88,393) (51,981,919) (108,979) 16,110,131 136,931,420 - 21,054,532 13,937,779 Bond Proceeds Transfers In (See FN4) - - - - - - - - - - Debt Service Payments (See FN5) (8,379,353) (24,774,174) (64,513,142) (57,413,160) - - (15,153,110) - - (170,232,939) Subtotal (12,101,527) (129,031,013) (64,601,535) (109,395,079) (108,979) 16,110,131 46,978,422 - 155,532,139 (96,617,441)
Other Items Not for Current Operating UseUnrealized Gains / (Losses) (See FN6) - (16,004,740) - - - (13,782,169) - - - (29,786,909) Additions to Permanent Endowments (See FN7) - - - - - 2,238,660 - - - 2,238,660 Subtotal - (16,004,740) - - - (11,543,509) - - - (27,548,249)
Total Sources Over / (Under) Uses (See FN 11) (8,115,370) 90,223,737 (12,743,165) (16,928,393) 497,769 4,636,637 28,682,226 - 128,455,035 214,708,476
Bond Proceeds - - - - - - - - - - Depreciation Expense - - - - - - - - (197,382,369) (197,382,369) Transfer of Capital Asses(s) from System - - - - - - - - 417,225,411 417,225,411 Other Post-Employment Benefit (OPEB) Expense - - - - - - - - - - Non-Cash Capital Gifts - - - - - - - - 3,256,610 3,256,610 Capital Outlay 450,803 40,730,674 12,419,543 10,902,699 - - 69,973,888 - (134,477,607) - Change in Net Assets (Total Agrees with AFR***) (7,664,567) 130,954,411 (323,622) (6,025,694) 497,769 4,636,637 98,656,114 - 217,077,080 437,808,128
*Defined as any capital outlay expenses from Educational & General, Designated, Auxiliary, or Restricted Expendable Funds.**Defined as any capital outlay expense from funds other than Educational & General, Designated, Auxiliary, or Restricted Expendable.***As reported for "Changes in Net Position" shown on Schedule of Revenues, Expenses, and Changes in Net Position (SRECNP) in Annual Financial Report.
Texas A&M UniversityFor the Year Ended August 31, 2019Source: FY 2019 Annual Financial Report
Detail Worksheet FY 2019
Texas Higher Education Coordinating Board 48 June, 2020

Texas A&M UniversityFor the Year Ended August 31, 2019Source: FY 2019 Annual Financial Report
FOOTNOTES:
FN1: Scholarship Discounts and Allowances are scholarships, fellowships, and grants applied to tuition. The discount eliminates tuition revenues that are paid for by University resources which are recorded as revenue elsewhere on the financial statements (i.e. federal and state contracts and grants revenues). In addition, Scholarship Discounts and Allowances eliminate tuition revenue that is exempted from payment due to tuition exemptions approved by the Texas Legislature. Waivers, remissions, and exemptions represent tuition and fee dollars forgone by the university - some are required by statute. See the Integrated Financial Reporting System (IFRS) report submitted to THECB for details on waivers, exemptions, tuition, and fees. Allocation methods to individual funds shown may vary between institutions.
FN2: Endowment and Interest Income includes interest income and endowment payouts.
FN3: Other Income is primarily Other Operating and Other Non-operating Revenues from the AFR. Other Expenses is primarily Other Nonoperating Expenses from the AFR.
FN4: Bond Proceeds are funds received from the sale of bonds and commercial paper used to finance capital projects. This amount includes actual proceeds and accrued or anticipated proceeds to be transferred from System. Independent institutions report only to the extent expended in current year.
FN5: Debt service payments are payments to service and retire debt issued to fund capital projects. System components do this via transfers to System Administrations. Independent institutions use direct payment to appropriate paying agents.
FN6: Unrealized Gains / (Losses) represent the increase in the Fair Market Value of Investments and Endowments. Unrealized Gains / (Losses) are accrued as non-cash transactions. Therefore, funds are not actually received for this revenue stream. Accordingly, this revenue is not cash revenue and cannot be used by the University to fund operations.
FN7: Additions to Permanent Endowments are additions to endowment principal. This revenue is restricted for investment purposes only and cannot be used to fund operations. Only interest income from these endowments, which is reported on the Endowment and Investment Income line of this report, can be used by the University to fund operations.
FN8: Distributions from the Available University Fund appropriated through the Appropriation Bill are first used to pay debt service costs on Permanent University Fund Bonds. Funds remaining are distributed to constitutionally designated institutions to promote academic excellence. Only the Excellence funding is shown at the institution level. The AUF funds used to pay debt service on PUF bonds are reported at the System level.
FN9: Auxiliary Enterprises include athletics, housing and food, student services, and parking and transportation. Auxiliary Enterprises are required to be self-supporting, and therefore must operate on the funds they generate.
FN10: Mandatory and non-mandatory transfers includes transfers between funds, transfers between the University System and institutions and transfers to and from other state agencies. In total, all transfers between funds net to zero with the exception of any amounts transferred between the University System, between other institutions, or to and from another state agency. There are no transfers of education and general funds provided by the State of Texas to restricted or auxiliary fund groups. Transfers between education and general funds and designated funds are related to Texas Public Education Grant as provided by the State of Texas.
FN11: Of the net increase of $214,708,476 approximately $242.3 million represents revenues received but not yet expended. This income is fully committed to program expenditures and capital disbursements. The remaining $(27.5) million represents non-expendable funds from unrealized gains and additions to permanent endowments of approximately $(29.8) million and $2.2 million respectively. Unrealized gains and additions to permanent endowments do not contribute to the availability of the institution's operating cash as discussed in FN6 and FN7.
Texas Higher Education Coordinating Board 49 June, 2020

Texas A&M University at GalvestonFor the Year Ended August 31, 2019Source: FY 2019 Annual Financial Report
Non-Operating Funds are not included in above charts. See following page (Summary).Charts May Not Add to 100% Due to Rounding
Total Operating Sources $72,698,432
Total Operating Sources $72,698,432
Total Operating Uses $63,408,323
State of Texas$26,201,344
36%
Student & Parent$21,245,226
29%
Federal Government$7,529,582
10%
Institutional Resources$17,722,280
25%
Operating Sources by Category
State Appropriations$25,097,386
33%
State Grants & Contracts$1,103,958
2%
Tuition & Fees$21,245,226
28%
Federal Grants & Contracts$7,529,582
10%
Endowment & Interest Income
$3,724,8465%
Private Gifts & Grants$5,184,420
7%
Sales & Services$3,336,062
4%
Net Auxiliary Enterprises$6,618,591
9% Other Income-$1,141,639
-2%
Operating Sources
Instruction$20,469,793
32%
Research$7,939,067
13%
Public Service$1,491,735
2%
Academic Support$6,574,412
10%
Student Services$3,726,840
6%
Institutional Support$7,202,046
11%
Operations & Maintenance of Plant
$5,478,6249%
Scholarships & Fellowships$3,112,733
5%Auxiliary Enterprises
$5,058,9278%Capital Outlay
$202,2770%
Other Expenses$2,151,869
4%
Operating Uses
Texas Higher Education Coordinating Board 50 June, 2020

Texas A&M University at GalvestonFor the Year Ended August 31, 2019Source: FY 2019 Annual Financial Report
Summary Worksheet FY 2019 Amount Per FTSEInstitution State Funded FTSEs 2,004.79
Operating SourcesState of TexasState Appropriations 25,097,386$ 12,519$ State Grants and Contracts - Restricted 1,103,958 551 Higher Education Fund - - Available University Fund Excellence (See FN8) - - Subtotal 26,201,344$ 13,070$
Student & ParentTuition - net 12,749,784$ 6,360$ Fees - net 8,495,442 4,238 Tuition and Fees (net of Scholarship Discounts and Allowances) 21,245,226$ 10,598$
Federal GovernmentFederal Grants and Contracts - Restricted 7,529,582$ 3,756$
Institutional ResourcesEndowment and Interest Income (See FN2) 3,724,846$ 1,858$ Local Government Grants - Restricted - - Private Gifts and Grants - Restricted 5,184,420 2,586 Sales and Services 3,336,062 1,664 Net Auxiliary Enterprises (See FN9) 6,618,591 3,301 Other Income (See FN3) (1,141,639) (569) Subtotal 17,722,280$ 8,840$ Total Operating Sources 72,698,432$ 36,264$
Operating UsesInstruction 20,469,793$ 10,210$ Research 7,939,067 3,960 Public Service 1,491,735 744 Academic Support 6,574,412 3,279 Student Services 3,726,840 1,859 Institutional Support 7,202,046 3,592 Operations and Maintenance of Plant 5,478,624 2,733 Scholarships and Fellowships 3,112,733 1,553 Auxiliary Enterprises (See FN9) 5,058,927 2,523 Capital Outlay from Current Fund Sources 202,277 101 Other Expenses (See FN3) 2,151,869 1,073 Total Operating Uses 63,408,323$ 31,627$
Other Sources / (Uses) of FundsCapital Outlay from Non-Current Fund Sources 202,276 101$ Mandatory and Non-mandatory Transfers (See FN10) 2,052,804 1,024 Bond Proceeds Transfers (See FN4) - - Debt Service Payments (See FN5) (10,919,551) (5,447) Subtotal (8,664,471)$ (4,322)$
Other Items Not for Current Operating UseUnrealized Gains / (Losses) (See FN6) (890,688) (444)$ Additions to Permanent Endowments (See FN7) 3,900 2 Subtotal (886,788)$ (442)$
Total Sources Over / (Under) Uses (See FN11) (261,150)$ (127)$
Texas Higher Education Coordinating Board 51 June, 2020

FY 2019
Operating SourcesEducational &
General DesignatedAuxiliary
EnterprisesRestricted Expendable Loan Funds
Annuity, Life & Endowment and
Similar FundsUnexpended
PlantRetirement of Indebtedness
Investment In Plant Primary University
State of TexasState Appropriations 25,097,386 - - - - - - - - 25,097,386 State Grants and Contracts - Restricted 1,085,592 8,045 - 10,321 - - - - - 1,103,958 Higher Education Fund - - - - - - - - - - Available University Fund Excellence (See FN8) - - - - - - - - - - Subtotal 26,182,978 8,045 - 10,321 - - - - - 26,201,344
Student & ParentTuition Potential 100% 4,125,148 12,011,296 - - - - - - - 16,136,444 Waivers - Statutory (Not Reported in AFR) (591,321) (156,747) - - - - - - - (748,068) Waivers - Institutional (Not Reported in AFR) - - - - - - - - - - Exemptions - Statutory (Not Reported in AFR) - - - - - - - - - - Exemptions - Institutional (Not Reported in AFR) - - - - - - - - - - Tuition - Gross - AFR Presentation 3,533,827 11,854,549 - - - - - - - 15,388,376 Waivers - Statutory (Reported in AFR) - - - - - - - - - - Waivers - Institutional (Reported in AFR) - - - - - - - - - - Exemptions - Statutory (Reported in AFR) (172,326) (918,061) - - - - - - - (1,090,387) Exemptions - Institutional (Reported in AFR) - - - - - - - - - - All Other Scholarship Disc.& Allow. (See FN1) (433,607) (1,114,598) - - - - - - - (1,548,205) Tuition - net 2,927,894 9,821,890 - - - - - - - 12,749,784
Fees Potential 100% 110,626 10,073,682 75,975 - - - - - - 10,260,283 Waivers - Statutory (Not Reported in AFR) - (6,750) - - - - - - - (6,750) Waivers - Institutional (Not Reported in AFR) - - - - - - - - - - Exemptions - Statutory (Not Reported in AFR) - - - - - - - - - - Exemptions - Institutional (Not Reported in AFR) - - - - - - - - - - Fees - Gross - AFR Presentation 110,626 10,066,932 75,975 - - - - - - 10,253,533 Waivers - Statutory (Reported in AFR) - - - - - - - - - - Waivers - Institutional (Reported in AFR) - - - - - - - - - - Exemptions - Statutory (Reported in AFR) (4,682) (486,748) - - - - - - - (491,430) Exemptions - Institutional (Reported in AFR) - - - - - - - - - - All Other Scholarship Disc.& Allow. (See FN1) (14,238) (1,239,396) (13,027) - - - - - - (1,266,661) Fees - net 91,706 8,340,788 62,948 - - - - - - 8,495,442
Net Tuition and Fees (Funds Collected) 3,019,600 18,162,678 62,948 - - - - - - 21,245,226
Federal GovernmentFederal Grants and Contracts - Restricted - 1,140,392 - 6,389,190 - - - - - 7,529,582
Institutional ResourcesEndowment and Interest Income (See FN2) 173,028 3,304,584 - 243,421 1,449 2,364 - - - 3,724,846 Local Government Grants - Restricted - - - - - - - - - - Private Gifts and Grants - Restricted - 1,261,879 - 3,922,541 - - - - - 5,184,420 Sales and Services - 3,334,332 - 1,730 - - - - - 3,336,062 Net Auxiliary Enterprises (See FN9) - - 6,618,591 - - - - - - 6,618,591 Other Income (See FN3) 5,657 (130,456) 58,114 21,824 10,168 - - - (1,106,946) (1,141,639) Subtotal 178,685 7,770,339 6,676,705 4,189,516 11,617 2,364 - - (1,106,946) 17,722,280 Total Operating Sources 29,381,263 27,081,454 6,739,653 10,589,027 11,617 2,364 - - (1,106,946) 72,698,432
Operating UsesInstruction 12,959,166 5,587,630 - 1,922,997 - - - - - 20,469,793 Research 967,800 1,782,208 - 5,189,059 - - - - - 7,939,067 Public Service - 1,491,735 - - - - - - - 1,491,735 Academic Support 2,794,943 3,728,339 - 51,130 - - - - - 6,574,412 Student Services 1,585,437 2,077,154 - 49,630 14,619 - - - - 3,726,840 Institutional Support 2,814,691 3,989,716 - 397,639 - - - - - 7,202,046 Operations and Maintenance of Plant (50,723) 5,447,919 - 822 - - 80,606 - - 5,478,624 Scholarships and Fellowships 281,140 2,042,193 - 789,400 - - - - - 3,112,733 Auxiliary Enterprises (See FN9) - - 5,058,927 - - - - - - 5,058,927 Capital Outlay from Current Fund Sources* 171,113 282,202 (284,038) 33,000 - - - - - 202,277 Other Expenses (See FN3) 38,862 190,840 - - - - - - 1,922,167 2,151,869 Total Operating Uses 21,562,429 26,619,936 4,774,889 8,433,677 14,619 - 80,606 - 1,922,167 63,408,323
Other Sources / (Uses) of FundsCapital Outlay from Non-Current Fund Sources** - - - - - - (311,243) - 513,519 202,276 Mandatory and Non-mandatory Transfers (See FN10) (161,829) 2,605,013 1,047,794 (1,513,518) - 77,903 - - (2,559) 2,052,804 Bond Proceeds Transfers In (See FN4) - - - - - - - - - - Debt Service Payments (See FN5) (8,424,207) (735,299) (1,760,045) - - - - - - (10,919,551) Subtotal (8,586,036) 1,869,714 (712,251) (1,513,518) - 77,903 (311,243) - 510,960 (8,664,471)
Other Items Not for Current Operating UseUnrealized Gains / (Losses) (See FN6) - (788,882) - - - (101,806) - - - (890,688) Additions to Permanent Endowments (See FN7) - - - - - 3,900 - - - 3,900 Subtotal - (788,882) - - - (97,906) - - - (886,788)
Total Sources Over / (Under) Uses (See FN 11) (767,202) 1,542,350 1,252,513 641,832 (3,002) (17,639) (391,849) - (2,518,153) (261,150)
Bond Proceeds - - - - - - - - - - Depreciation Expense - - - - - - - - (12,167,616) (12,167,616) Transfer of Capital Asses(s) from System - - - - - - - - 53,598,408 53,598,408 Other Post-Employment Benefit (OPEB) Expense - - - - - - - - - - Non-Cash Capital Gifts - - - - - - - - - - Capital Outlay 171,113 282,202 (284,038) 33,000 - - 311,243 - (513,520) - Change in Net Assets (Total Agrees with AFR***) (596,089) 1,824,552 968,475 674,832 (3,002) (17,639) (80,606) - 38,399,119 41,169,642
*Defined as any capital outlay expenses from Educational & General, Designated, Auxiliary, or Restricted Expendable Funds.**Defined as any capital outlay expense from funds other than Educational & General, Designated, Auxiliary, or Restricted Expendable.***As reported for "Changes in Net Position" shown on Schedule of Revenues, Expenses, and Changes in Net Position (SRECNP) in Annual Financial Report.
Texas A&M University at GalvestonFor the Year Ended August 31, 2019Source: FY 2019 Annual Financial Report
Detail Worksheet FY 2019
Texas Higher Education Coordinating Board 52 June, 2020

Texas A&M University at GalvestonFor the Year Ended August 31, 2019Source: FY 2019 Annual Financial Report
FOOTNOTES:
FN1: Scholarship Discounts and Allowances are scholarships, fellowships, and grants applied to tuition. The discount eliminates tuition revenues that are paid for by University resources which are recorded as revenue elsewhere on the financial statements (i.e. federal and state contracts and grants revenues). In addition, Scholarship Discounts and Allowances eliminate tuition revenue that is exempted from payment due to tuition exemptions approved by the Texas Legislature. Waivers, remissions, and exemptions represent tuition and fee dollars forgone by the university - some are required by statute. See the Integrated Financial Reporting System (IFRS) report submitted to THECB for details on waivers, exemptions, tuition, and fees. Allocation methods to individual funds shown may vary between institutions.
FN2: Endowment and Interest Income includes interest income and endowment payouts.
FN3: Other Income is primarily Other Operating and Other Non-operating Revenues from the AFR. Other Expenses is primarily Other Nonoperating Expenses from the AFR.
FN4: Bond Proceeds are funds received from the sale of bonds and commercial paper used to finance capital projects. This amount includes actual proceeds and accrued or anticipated proceeds to be transferred from System. Independent institutions report only to the extent expended in current year.
FN5: Debt service payments are payments to service and retire debt issued to fund capital projects. System components do this via transfers to System Administrations. Independent institutions use direct payment to appropriate paying agents.
FN6: Unrealized Gains / (Losses) represent the increase in the Fair Market Value of Investments and Endowments. Unrealized Gains / (Losses) are accrued as non-cash transactions. Therefore, funds are not actually received for this revenue stream. Accordingly, this revenue is not cash revenue and cannot be used by the University to fund operations.
FN7: Additions to Permanent Endowments are additions to endowment principal. This revenue is restricted for investment purposes only and cannot be used to fund operations. Only interest income from these endowments, which is reported on the Endowment and Investment Income line of this report, can be used by the University to fund operations.
FN8: Distributions from the Available University Fund appropriated through the Appropriation Bill are first used to pay debt service costs on Permanent University Fund Bonds. Funds remaining are distributed to constitutionally designated institutions to promote academic excellence. Only the Excellence funding is shown at the institution level. The AUF funds used to pay debt service on PUF bonds are reported at the System level.
FN9: Auxiliary Enterprises include athletics, housing and food, student services, and parking and transportation. Auxiliary Enterprises are required to be self-supporting, and therefore must operate on the funds they generate.
FN10: Mandatory and non-mandatory transfers includes transfers between funds, transfers between the University System and institutions and transfers to and from other state agencies. In total, all transfers between funds net to zero with the exception of any amounts transferred between the University System, between other institutions, or to and from another state agency. There are no transfers of education and general funds provided by the State of Texas to restricted or auxiliary fund groups. Transfers between education and general funds and designated funds are related to Texas Public Education Grant as provided by the State of Texas.
FN11. N/A
Texas Higher Education Coordinating Board 53 June, 2020

Prairie View A&M UniversityFor the Year Ended August 31, 2019Source: FY 2019 Annual Financial Report
Non-Operating Funds are not included in above charts. See following page (Summary).Charts May Not Add to 100% Due to Rounding
Total Operating Sources $251,769,151
Total Operating Sources $251,769,151
Total Operating Uses $244,288,019
State of Texas$98,215,450
39%
Student & Parent$45,114,147
18%
Federal Government$59,879,009
24%
Institutional Resources$48,560,545
19%
Operating Sources by Category
State Appropriations$57,464,400
23%
State Grants & Contracts
$5,332,972, 3%
Available University Fund Excellence
$28,609,94011%Tuition & Fees
$45,114,14718%
Federal Grants & Contracts
$59,879,00924%
Endowment & Interest Income
$10,635,7694%
Private Gifts & Grants$3,579,773
1%
Sales & Services$1,399,700
1%
Net Auxiliary Enterprises$18,444,739
7%
Other Income$14,500,564
6%
Operating Sources
Instruction$49,705,424
20%
Research$18,365,821
7%
Public Service$8,738,807
4%
Academic Support$26,148,766
11%
Student Services$19,452,280
8%
Institutional Support$20,324,698
8%Operations &
Maintenance of Plant$27,468,787
11%
Scholarships & Fellowships$20,812,930
9%
Auxiliary Enterprises$35,005,394
14%
Capital Outlay$7,096,317
3%
Other Expenses$11,168,795
5%
Operating Uses
Texas Higher Education Coordinating Board 54 June, 2020

Prairie View A&M UniversityFor the Year Ended August 31, 2019Source: FY 2019 Annual Financial Report
Summary Worksheet FY 2019 Amount Per FTSEInstitution State Funded FTSEs 8,504.38
Operating SourcesState of TexasState Appropriations 57,464,400$ 6,757$ State Grants and Contracts - Restricted 12,141,110 1,428 Higher Education Fund - - Available University Fund Excellence (See FN8) 28,609,940 3,364 Subtotal 98,215,450$ 11,549$
Student & ParentTuition - net 28,607,080$ 3,364$ Fees - net 16,507,067 1,941 Tuition and Fees (net of Scholarship Discounts and Allowances) 45,114,147$ 5,305$
Federal GovernmentFederal Grants and Contracts - Restricted 59,879,009$ 7,041$
Institutional ResourcesEndowment and Interest Income (See FN2) 10,635,769$ 1,251$ Local Government Grants - Restricted - - Private Gifts and Grants - Restricted 3,579,773 421 Sales and Services 1,399,700 165 Net Auxiliary Enterprises (See FN9) 18,444,739 2,169 Other Income (See FN3) 14,500,564 1,705 Subtotal 48,560,545$ 5,711$ Total Operating Sources 251,769,151$ 29,606$
Operating UsesInstruction 49,705,424$ 5,845$ Research 18,365,821 2,160 Public Service 8,738,807 1,028 Academic Support 26,148,766 3,075 Student Services 19,452,280 2,287 Institutional Support 20,324,698 2,390 Operations and Maintenance of Plant 27,468,787 3,230 Scholarships and Fellowships 20,812,930 2,447 Auxiliary Enterprises (See FN9) 35,005,394 4,116 Capital Outlay from Current Fund Sources 7,096,317 834 Other Expenses (See FN3) 11,168,795 1,313 Total Operating Uses 244,288,019$ 28,725$
Other Sources / (Uses) of FundsCapital Outlay from Non-Current Fund Sources 7,096,317 834$ Mandatory and Non-mandatory Transfers (See FN10) 1,743,241 205 Bond Proceeds Transfers (See FN4) - - Debt Service Payments (See FN5) (14,006,421) (1,647) Subtotal (5,166,863)$ (608)$
Other Items Not for Current Operating UseUnrealized Gains / (Losses) (See FN6) (6,139,420) (722)$ Additions to Permanent Endowments (See FN7) 854,235 100 Subtotal (5,285,185)$ (622)$
Total Sources Over / (Under) Uses (See FN11) (2,970,916)$ (349)$
Texas Higher Education Coordinating Board 55 June, 2020

FY 2019
Operating SourcesEducational &
General DesignatedAuxiliary
EnterprisesRestricted Expendable Loan Funds
Annuity, Life & Endowment and
Similar FundsUnexpended
PlantRetirement of Indebtedness
Investment In Plant Primary University
State of TexasState Appropriations 57,464,400 - - - - - - - - 57,464,400 State Grants and Contracts - Restricted 78,653 91,182 - 11,971,275 - - - - - 12,141,110 Higher Education Fund - - - - - - - - - - Available University Fund Excellence (See FN8) 28,609,940 - - - - - - - - 28,609,940 Subtotal 86,152,993 91,182 - 11,971,275 - - - - - 98,215,450
Student & ParentTuition Potential 100% 23,978,058 43,438,921 - - - - - - - 67,416,979 Waivers - Statutory (Not Reported in AFR) (6,314,508) - - - - - - - - (6,314,508) Waivers - Institutional (Not Reported in AFR) - - - - - - - - - - Exemptions - Statutory (Not Reported in AFR) - - - - - - - - - - Exemptions - Institutional (Not Reported in AFR) - - - - - - - - - - Tuition - Gross - AFR Presentation 17,663,550 43,438,921 - - - - - - - 61,102,471 Waivers - Statutory (Reported in AFR) - - - - - - - - - - Waivers - Institutional (Reported in AFR) - - - - - - - - - - Exemptions - Statutory (Reported in AFR) (736,652) (2,222,178) - - - - - - - (2,958,830) Exemptions - Institutional (Reported in AFR) - - - - - - - - - - All Other Scholarship Disc.& Allow. (See FN1) (8,657,141) (20,879,420) - - - - - - - (29,536,561) Tuition - net 8,269,757 20,337,323 - - - - - - - 28,607,080
Fees Potential 100% 153,227 26,056,505 9,048,063 - - - - - - 35,257,795 Waivers - Statutory (Not Reported in AFR) - - - - - - - - - - Waivers - Institutional (Not Reported in AFR) - - - - - - - - - - Exemptions - Statutory (Not Reported in AFR) - - - - - - - - - - Exemptions - Institutional (Not Reported in AFR) - - - - - - - - - - Fees - Gross - AFR Presentation 153,227 26,056,505 9,048,063 - - - - - - 35,257,795 Waivers - Statutory (Reported in AFR) - - - - - - - - - - Waivers - Institutional (Reported in AFR) - - - - - - - - - - Exemptions - Statutory (Reported in AFR) - (1,395,963) (545,519) - - - - - - (1,941,482) Exemptions - Institutional (Reported in AFR) - - - - - - - - - - All Other Scholarship Disc.& Allow. (See FN1) (81,489) (12,461,354) (4,266,403) - - - - - - (16,809,246) Fees - net 71,738 12,199,188 4,236,141 - - - - - - 16,507,067
Net Tuition and Fees (Funds Collected) 8,341,495 32,536,511 4,236,141 - - - - - - 45,114,147
Federal GovernmentFederal Grants and Contracts - Restricted - 1,922,294 - 56,951,004 - - 1,005,711 - - 59,879,009
Institutional ResourcesEndowment and Interest Income (See FN2) 653,905 9,234,217 - 590,172 - 109,583 47,892 - - 10,635,769 Local Government Grants - Restricted - - - - - - - - - - Private Gifts and Grants - Restricted - 147,722 4,373 3,427,678 - - - - - 3,579,773 Sales and Services - 627,240 8,062 764,398 - - - - - 1,399,700 Net Auxiliary Enterprises (See FN9) - - 18,444,739 - - - - - - 18,444,739 Other Income (See FN3) 1,863,218 700,613 1,803,543 335,890 - - - - 9,797,300 14,500,564 Subtotal 2,517,123 10,709,792 20,260,717 5,118,138 - 109,583 47,892 - 9,797,300 48,560,545 Total Operating Sources 97,011,611 45,259,779 24,496,858 74,040,417 - 109,583 1,053,603 - 9,797,300 251,769,151
Operating UsesInstruction 41,672,464 7,112,085 - 920,875 - - - - - 49,705,424 Research 10,095,572 258,690 - 8,011,559 - - - - - 18,365,821 Public Service 2,364,467 232,003 - 6,142,337 - - - - - 8,738,807 Academic Support 9,681,597 8,543,800 - 7,923,369 - - - - - 26,148,766 Student Services 5,771,668 12,334,243 - 1,376,547 (30,178) - - - - 19,452,280 Institutional Support 11,161,231 8,871,070 - 292,397 - - - - - 20,324,698 Operations and Maintenance of Plant 2,942,415 19,251,030 - 379 - - 5,274,963 - - 27,468,787 Scholarships and Fellowships 1,931,349 9,797,946 - 9,083,635 - - - - - 20,812,930 Auxiliary Enterprises (See FN9) - - 35,005,394 - - - - - - 35,005,394 Capital Outlay from Current Fund Sources* 720,517 1,377,638 438,996 4,559,166 - - - - - 7,096,317 Other Expenses (See FN3) 247,529 745,432 883 - - - 300,790 - 9,874,161 11,168,795 Total Operating Uses 86,588,809 68,523,937 35,445,273 38,310,264 (30,178) - 5,575,753 - 9,874,161 244,288,019
Other Sources / (Uses) of FundsCapital Outlay from Non-Current Fund Sources** - - - - - - (10,764,072) - 17,860,389 7,096,317 Mandatory and Non-mandatory Transfers (See FN10) (4,156,461) 16,708,605 18,542,803 (35,465,477) 281 2,362,659 3,746,433 - 4,398 1,743,241 Bond Proceeds Transfers In (See FN4) - - - - - - - - - - Debt Service Payments (See FN5) (6,668,116) (1,899,172) (5,439,133) - - - - - - (14,006,421) Subtotal (10,824,577) 14,809,433 13,103,670 (35,465,477) 281 2,362,659 (7,017,639) - 17,864,787 (5,166,863)
Other Items Not for Current Operating UseUnrealized Gains / (Losses) (See FN6) - (4,330,593) - - - (1,808,827) - - - (6,139,420) Additions to Permanent Endowments (See FN7) - - - - - 854,235 - - - 854,235 Subtotal - (4,330,593) - - - (954,592) - - - (5,285,185)
Total Sources Over / (Under) Uses (See FN 11) (401,775) (12,785,318) 2,155,255 264,676 30,459 1,517,650 (11,539,789) - 17,787,926 (2,970,916)
Bond Proceeds - - - - - - - - - - Depreciation Expense - - - - - - - - (21,746,812) (21,746,812) Transfer of Capital Asses(s) from System - - - - - - - - 3,758,909 3,758,909 Other Post-Employment Benefit (OPEB) Expense - - - - - - - - - - Non-Cash Capital Gifts - - - - - - - - - - Capital Outlay 720,517 1,377,638 438,996 4,559,166 - - 10,764,072 - (17,860,389) - Change in Net Assets (Total Agrees with AFR***) 318,742 (11,407,680) 2,594,251 4,823,842 30,459 1,517,650 (775,717) - (18,060,366) (20,958,819)
*Defined as any capital outlay expenses from Educational & General, Designated, Auxiliary, or Restricted Expendable Funds.**Defined as any capital outlay expense from funds other than Educational & General, Designated, Auxiliary, or Restricted Expendable.***As reported for "Changes in Net Position" shown on Schedule of Revenues, Expenses, and Changes in Net Position (SRECNP) in Annual Financial Report.
Prairie View A&M UniversityFor the Year Ended August 31, 2019Source: FY 2019 Annual Financial Report
Detail Worksheet FY 2019
Texas Higher Education Coordinating Board 56 June, 2020

Prairie View A&M UniversityFor the Year Ended August 31, 2019Source: FY 2019 Annual Financial Report
FOOTNOTES:
FN1: Scholarship Discounts and Allowances are scholarships, fellowships, and grants applied to tuition. The discount eliminates tuition revenues that are paid for by University resources which are recorded as revenue elsewhere on the financial statements (i.e. federal and state contracts and grants revenues). In addition, Scholarship Discounts and Allowances eliminate tuition revenue that is exempted from payment due to tuition exemptions approved by the Texas Legislature. Waivers, remissions, and exemptions represent tuition and fee dollars forgone by the university - some are required by statute. See the Integrated Financial Reporting System (IFRS) report submitted to THECB for details on waivers, exemptions, tuition, and fees. Allocation methods to individual funds shown may vary between institutions.
FN2: Endowment and Interest Income includes interest income and endowment payouts.
FN3: Other Income is primarily Other Operating and Other Non-operating Revenues from the AFR. Other Expenses is primarily Other Nonoperating Expenses from the AFR.
FN4: Bond Proceeds are funds received from the sale of bonds and commercial paper used to finance capital projects. This amount includes actual proceeds and accrued or anticipated proceeds to be transferred from System. Independent institutions report only to the extent expended in current year.
FN5: Debt service payments are payments to service and retire debt issued to fund capital projects. System components do this via transfers to System Administrations. Independent institutions use direct payment to appropriate paying agents.
FN6: Unrealized Gains / (Losses) represent the increase in the Fair Market Value of Investments and Endowments. Unrealized Gains / (Losses) are accrued as non-cash transactions. Therefore, funds are not actually received for this revenue stream. Accordingly, this revenue is not cash revenue and cannot be used by the University to fund operations.
FN7: Additions to Permanent Endowments are additions to endowment principal. This revenue is restricted for investment purposes only and cannot be used to fund operations. Only interest income from these endowments, which is reported on the Endowment and Investment Income line of this report, can be used by the University to fund operations.
FN8: Distributions from the Available University Fund appropriated through the Appropriation Bill are first used to pay debt service costs on Permanent University Fund Bonds. Funds remaining are distributed to constitutionally designated institutions to promote academic excellence. Only the Excellence funding is shown at the institution level. The AUF funds used to pay debt service on PUF bonds are reported at the System level.
FN9: Auxiliary Enterprises include athletics, housing and food, student services, and parking and transportation. Auxiliary Enterprises are required to be self-supporting, and therefore must operate on the funds they generate.
FN10: Mandatory and non-mandatory transfers includes transfers between funds, transfers between the University System and institutions and transfers to and from other state agencies. In total, all transfers between funds net to zero with the exception of any amounts transferred between the University System, between other institutions, or to and from another state agency. There are no transfers of education and general funds provided by the State of Texas to restricted or auxiliary fund groups. Transfers between education and general funds and designated funds are related to Texas Public Education Grant as provided by the State of Texas.
FN11. N/A
Texas Higher Education Coordinating Board 57 June, 2020

Tarleton State UniversityFor the Year Ended August 31, 2019Source: FY 2019 Annual Financial Report
Non-Operating Funds are not included in above charts. See following page (Summary).Charts May Not Add to 100% Due to Rounding
Total Operating Sources $210,395,308
Total Operating Sources $210,395,308
Total Operating Uses $182,643,413
State of Texas$65,780,888
31%
Student & Parent$77,781,713
37%
Federal Government$29,038,131
14%
Institutional Resources$37,794,576
18%
Operating Sources by Category
State Appropriations$56,429,880
27%
State Grants & Contracts$9,351,008
4%
Tuition & Fees$77,781,713
37%
Federal Grants & Contracts
$29,038,13114%
Endowment & Interest Income
$7,322,9834%
Private Gifts & Grants$6,395,339
3%
Sales & Services$2,599,879
1%
Net Auxiliary Enterprises$20,726,631
10% Other Income$749,744
0%
Operating Sources
Instruction$62,019,185
34%
Research$11,197,818
6%
Public Service$2,738,731
1%
Academic Support$17,427,584
10%
Student Services$12,508,523
7%Institutional Support
$15,199,4638%
Operations & Maintenance of Plant
$13,016,3977%
Scholarships & Fellowships$16,432,200
9%
Auxiliary Enterprises$28,683,417
16%Capital Outlay
$1,620,5081%
Other Expenses$1,799,587
1%
Operating Uses
Texas Higher Education Coordinating Board 58 June, 2020
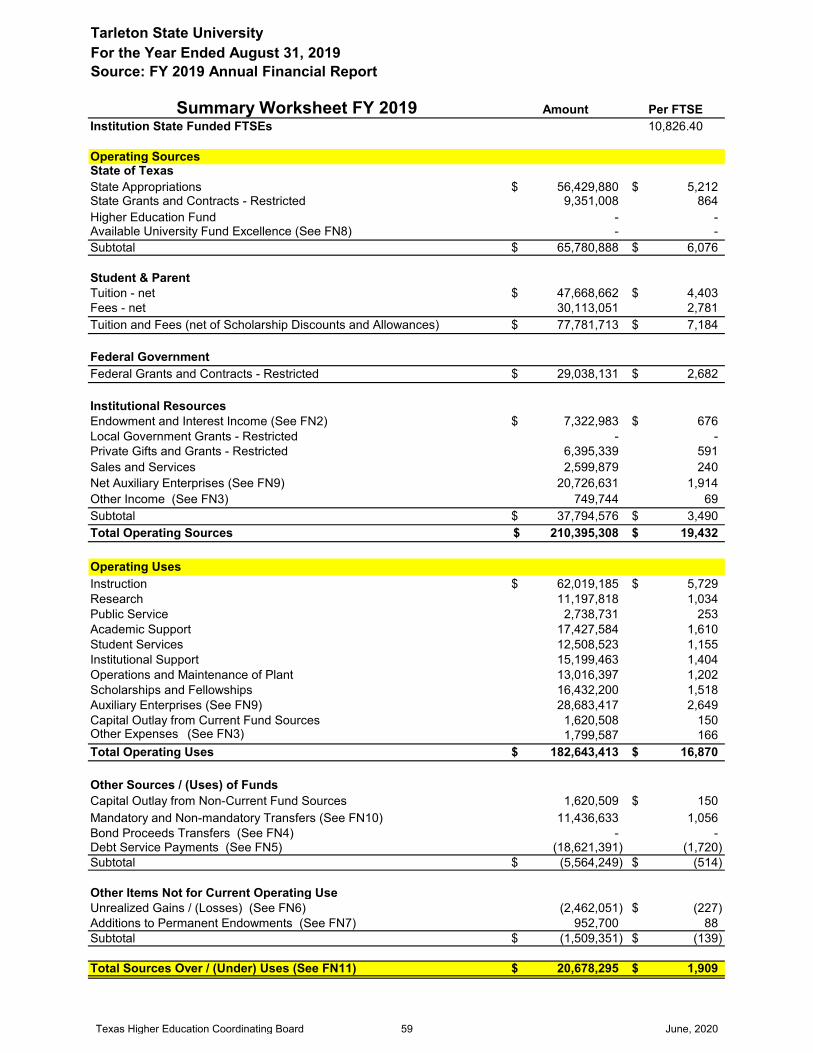
Tarleton State UniversityFor the Year Ended August 31, 2019Source: FY 2019 Annual Financial Report
Summary Worksheet FY 2019 Amount Per FTSEInstitution State Funded FTSEs 10,826.40
Operating SourcesState of TexasState Appropriations 56,429,880$ 5,212$ State Grants and Contracts - Restricted 9,351,008 864 Higher Education Fund - - Available University Fund Excellence (See FN8) - - Subtotal 65,780,888$ 6,076$
Student & ParentTuition - net 47,668,662$ 4,403$ Fees - net 30,113,051 2,781 Tuition and Fees (net of Scholarship Discounts and Allowances) 77,781,713$ 7,184$
Federal GovernmentFederal Grants and Contracts - Restricted 29,038,131$ 2,682$
Institutional ResourcesEndowment and Interest Income (See FN2) 7,322,983$ 676$ Local Government Grants - Restricted - - Private Gifts and Grants - Restricted 6,395,339 591 Sales and Services 2,599,879 240 Net Auxiliary Enterprises (See FN9) 20,726,631 1,914 Other Income (See FN3) 749,744 69 Subtotal 37,794,576$ 3,490$ Total Operating Sources 210,395,308$ 19,432$
Operating UsesInstruction 62,019,185$ 5,729$ Research 11,197,818 1,034 Public Service 2,738,731 253 Academic Support 17,427,584 1,610 Student Services 12,508,523 1,155 Institutional Support 15,199,463 1,404 Operations and Maintenance of Plant 13,016,397 1,202 Scholarships and Fellowships 16,432,200 1,518 Auxiliary Enterprises (See FN9) 28,683,417 2,649 Capital Outlay from Current Fund Sources 1,620,508 150 Other Expenses (See FN3) 1,799,587 166 Total Operating Uses 182,643,413$ 16,870$
Other Sources / (Uses) of FundsCapital Outlay from Non-Current Fund Sources 1,620,509 150$ Mandatory and Non-mandatory Transfers (See FN10) 11,436,633 1,056 Bond Proceeds Transfers (See FN4) - - Debt Service Payments (See FN5) (18,621,391) (1,720) Subtotal (5,564,249)$ (514)$
Other Items Not for Current Operating UseUnrealized Gains / (Losses) (See FN6) (2,462,051) (227)$ Additions to Permanent Endowments (See FN7) 952,700 88 Subtotal (1,509,351)$ (139)$
Total Sources Over / (Under) Uses (See FN11) 20,678,295$ 1,909$
Texas Higher Education Coordinating Board 59 June, 2020

FY 2019
Operating SourcesEducational &
General DesignatedAuxiliary
EnterprisesRestricted Expendable Loan Funds
Annuity, Life & Endowment and
Similar FundsUnexpended
PlantRetirement of Indebtedness
Investment In Plant Primary University
State of TexasState Appropriations 56,429,880 - - - - - - - - 56,429,880 State Grants and Contracts - Restricted 239,615 148,649 - 8,962,744 - - - - - 9,351,008 Higher Education Fund - - - - - - - - - - Available University Fund Excellence (See FN8) - - - - - - - - - - Subtotal 56,669,495 148,649 - 8,962,744 - - - - - 65,780,888
Student & ParentTuition Potential 100% 22,797,527 44,284,062 - - - - - - - 67,081,589 Waivers - Statutory (Not Reported in AFR) (2,800,730) - - - - - - - - (2,800,730) Waivers - Institutional (Not Reported in AFR) - - - - - - - - - - Exemptions - Statutory (Not Reported in AFR) - - - - - - - - - - Exemptions - Institutional (Not Reported in AFR) - - - - - - - - - - Tuition - Gross - AFR Presentation 19,996,797 44,284,062 - - - - - - - 64,280,859 Waivers - Statutory (Reported in AFR) - - - - - - - - - - Waivers - Institutional (Reported in AFR) - - - - - - - - - - Exemptions - Statutory (Reported in AFR) (1,301,970) (3,014,891) - - - - - - - (4,316,861) Exemptions - Institutional (Reported in AFR) (285,035) - - - - - - - - (285,035) All Other Scholarship Disc.& Allow. (See FN1) (3,580,797) (8,429,504) - - - - - - - (12,010,301) Tuition - net 14,828,995 32,839,667 - - - - - - - 47,668,662
Fees Potential 100% 220,441 31,477,526 8,909,272 - - - - - - 40,607,239 Waivers - Statutory (Not Reported in AFR) - - - - - - - - - - Waivers - Institutional (Not Reported in AFR) - - - - - - - - - - Exemptions - Statutory (Not Reported in AFR) - - - - - - - - - - Exemptions - Institutional (Not Reported in AFR) - - - - - - - - - - Fees - Gross - AFR Presentation 220,441 31,477,526 8,909,272 - - - - - - 40,607,239 Waivers - Statutory (Reported in AFR) - - - - - - - - - - Waivers - Institutional (Reported in AFR) - - - - - - - - - - Exemptions - Statutory (Reported in AFR) (13,234) (1,947,140) (660,344) - - - - - - (2,620,718) Exemptions - Institutional (Reported in AFR) - - - - - - - - - - All Other Scholarship Disc.& Allow. (See FN1) (43,735) (6,187,643) (1,642,092) - - - - - - (7,873,470) Fees - net 163,472 23,342,743 6,606,836 - - - - - - 30,113,051
Net Tuition and Fees (Funds Collected) 14,992,467 56,182,410 6,606,836 - - - - - - 77,781,713
Federal GovernmentFederal Grants and Contracts - Restricted - 601,931 - 28,205,641 - - 230,559 - - 29,038,131
Institutional ResourcesEndowment and Interest Income (See FN2) 237,670 4,581,244 1,330,030 857,941 93,744 450 221,904 - - 7,322,983 Local Government Grants - Restricted - - - - - - - - - - Private Gifts and Grants - Restricted - 314,328 11,000 6,070,011 - - - - - 6,395,339 Sales and Services 255,262 2,124,276 - 220,341 - - - - - 2,599,879 Net Auxiliary Enterprises (See FN9) - - 20,726,631 - - - - - - 20,726,631 Other Income (See FN3) 8,923 174,565 508,545 36,775 36,235 - 11,286 - (26,585) 749,744 Subtotal 501,855 7,194,413 22,576,206 7,185,068 129,979 450 233,190 - (26,585) 37,794,576 Total Operating Sources 72,163,817 64,127,403 29,183,042 44,353,453 129,979 450 463,749 - (26,585) 210,395,308
Operating UsesInstruction 39,425,590 21,698,449 - 895,146 - - - - - 62,019,185 Research 3,437,337 2,240,382 - 5,520,099 - - - - - 11,197,818 Public Service 438,718 1,629,343 - 670,670 - - - - - 2,738,731 Academic Support 7,590,532 6,202,209 - 3,634,843 - - - - - 17,427,584 Student Services 3,369,336 7,886,116 - 1,177,224 75,847 - - - - 12,508,523 Institutional Support 7,047,408 8,150,352 - 1,703 - - - - - 15,199,463 Operations and Maintenance of Plant 2,513,467 9,185,549 - 62 - - 1,317,319 - - 13,016,397 Scholarships and Fellowships 623,971 4,395,601 - 11,412,628 - - - - - 16,432,200 Auxiliary Enterprises (See FN9) - - 28,683,417 - - - - - - 28,683,417 Capital Outlay from Current Fund Sources* 15,785 1,244,544 197,262 162,917 - - - - - 1,620,508 Other Expenses (See FN3) - 353,840 - - - - - - 1,445,747 1,799,587 Total Operating Uses 64,462,144 62,986,385 28,880,679 23,475,292 75,847 - 1,317,319 - 1,445,747 182,643,413
Other Sources / (Uses) of FundsCapital Outlay from Non-Current Fund Sources** - - - - - - (10,223,663) - 11,844,172 1,620,509 Mandatory and Non-mandatory Transfers (See FN10) 1,965,199 9,210,788 3,935,942 (19,983,877) 16,339 911,557 15,380,685 - - 11,436,633 Bond Proceeds Transfers In (See FN4) - - - - - - - - - - Debt Service Payments (See FN5) (10,792,003) (1,467,905) (5,014,833) (672,000) - - (674,650) - - (18,621,391) Subtotal (8,826,804) 7,742,883 (1,078,891) (20,655,877) 16,339 911,557 4,482,372 - 11,844,172 (5,564,249)
Other Items Not for Current Operating UseUnrealized Gains / (Losses) (See FN6) (233,083) (777,086) (505,470) (808) (77,428) (931,976) 63,800 - - (2,462,051) Additions to Permanent Endowments (See FN7) - - - - - 952,700 - - - 952,700 Subtotal (233,083) (777,086) (505,470) (808) (77,428) 20,724 63,800 - - (1,509,351)
Total Sources Over / (Under) Uses (See FN 11) (1,358,214) 8,106,815 (1,281,998) 221,476 (6,957) 932,731 3,692,602 - 10,371,840 20,678,295
Bond Proceeds - - - - - - - - - - Depreciation Expense - - - - - - - - (15,092,252) (15,092,252) Transfer of Capital Asses(s) from System - - - - - - - - 54,130,300 54,130,300 Other Post-Employment Benefit (OPEB) Expense - - - - - - - - - - Non-Cash Capital Gifts - - - - - - - - 9,170,670 9,170,670 Capital Outlay 15,785 1,244,544 197,263 162,917 - - 10,223,663 - (11,844,172) - Change in Net Assets (Total Agrees with AFR***) (1,342,429) 9,351,359 (1,084,735) 384,393 (6,957) 932,731 13,916,265 - 46,736,386 68,887,013
*Defined as any capital outlay expenses from Educational & General, Designated, Auxiliary, or Restricted Expendable Funds.**Defined as any capital outlay expense from funds other than Educational & General, Designated, Auxiliary, or Restricted Expendable.***As reported for "Changes in Net Position" shown on Schedule of Revenues, Expenses, and Changes in Net Position (SRECNP) in Annual Financial Report.
Tarleton State UniversityFor the Year Ended August 31, 2019Source: FY 2019 Annual Financial Report
Detail Worksheet FY 2019
Texas Higher Education Coordinating Board 60 June, 2020

Tarleton State UniversityFor the Year Ended August 31, 2019Source: FY 2019 Annual Financial Report
FOOTNOTES:
FN1: Scholarship Discounts and Allowances are scholarships, fellowships, and grants applied to tuition. The discount eliminates tuition revenues that are paid for by University resources which are recorded as revenue elsewhere on the financial statements (i.e. federal and state contracts and grants revenues). In addition, Scholarship Discounts and Allowances eliminate tuition revenue that is exempted from payment due to tuition exemptions approved by the Texas Legislature. Waivers, remissions, and exemptions represent tuition and fee dollars forgone by the university - some are required by statute. See the Integrated Financial Reporting System (IFRS) report submitted to THECB for details on waivers, exemptions, tuition, and fees. Allocation methods to individual funds shown may vary between institutions.
FN2: Endowment and Interest Income includes interest income and endowment payouts.
FN3: Other Income is primarily Other Operating and Other Non-operating Revenues from the AFR. Other Expenses is primarily Other Nonoperating Expenses from the AFR.
FN4: Bond Proceeds are funds received from the sale of bonds and commercial paper used to finance capital projects. This amount includes actual proceeds and accrued or anticipated proceeds to be transferred from System. Independent institutions report only to the extent expended in current year.
FN5: Debt service payments are payments to service and retire debt issued to fund capital projects. System components do this via transfers to System Administrations. Independent institutions use direct payment to appropriate paying agents.
FN6: Unrealized Gains / (Losses) represent the increase in the Fair Market Value of Investments and Endowments. Unrealized Gains / (Losses) are accrued as non-cash transactions. Therefore, funds are not actually received for this revenue stream. Accordingly, this revenue is not cash revenue and cannot be used by the University to fund operations.
FN7: Additions to Permanent Endowments are additions to endowment principal. This revenue is restricted for investment purposes only and cannot be used to fund operations. Only interest income from these endowments, which is reported on the Endowment and Investment Income line of this report, can be used by the University to fund operations.
FN8: Distributions from the Available University Fund appropriated through the Appropriation Bill are first used to pay debt service costs on Permanent University Fund Bonds. Funds remaining are distributed to constitutionally designated institutions to promote academic excellence. Only the Excellence funding is shown at the institution level. The AUF funds used to pay debt service on PUF bonds are reported at the System level.
FN9: Auxiliary Enterprises include athletics, housing and food, student services, and parking and transportation. Auxiliary Enterprises are required to be self-supporting, and therefore must operate on the funds they generate.
FN10: Mandatory and non-mandatory transfers includes transfers between funds, transfers between the University System and institutions and transfers to and from other state agencies. In total, all transfers between funds net to zero with the exception of any amounts transferred between the University System, between other institutions, or to and from another state agency. There are no transfers of education and general funds provided by the State of Texas to restricted or auxiliary fund groups. Transfers between education and general funds and designated funds are related to Texas Public Education Grant as provided by the State of Texas.
FN11: Of the net increase of $20,678,295 approximately $23.1 million represents revenues received but not yet expended. This income is fully committed to program expenditures and capital disbursements. The remaining $(2.5) million represents non-expendable funds from unrealized gains and additions to permanent endowments of approximately $(2.5) million and $0 respectively. Unrealized gains and additions to permanent endowments do not contribute to the availability of the institution's operating cash as discussed in FN6 and FN7.
Texas Higher Education Coordinating Board 61 June, 2020

Texas A&M University - Corpus ChristiFor the Year Ended August 31, 2019Source: FY 2019 Annual Financial Report
Non-Operating Funds are not included in above charts. See following page (Summary).Charts May Not Add to 100% Due to Rounding
Total Operating Sources $233,748,105
Total Operating Sources $233,748,105
Total Operating Uses $211,543,178
State of Texas$80,486,148
35%
Student & Parent$79,163,944
34%
Federal Government$40,653,281
17%
Institutional Resources$33,444,732
14%
Operating Sources by Category
State Appropriations$57,973,766
25%
State Grants & Contracts
$11,376,0385%
Higher Education Fund$11,136,344
5%Tuition & Fees$79,163,944
34%
Federal Grants & Contracts
$40,653,28117%
Endowment & Interest Income
$9,206,3184%
Private Gifts & Grants$12,967,425
6%
Sales & Services$3,350,255
1%
Net Auxiliary Enterprises$6,705,561
3%Other Income
$1,215,1730%
Operating Sources
Instruction$62,022,217
29%
Research$25,227,434
12%
Public Service$3,256,278
2%
Academic Support$28,543,985
13%Student Services
$13,061,7746%
Institutional Support$15,042,172
7%
Operations & Maintenance of Plant
$12,606,3996%
Scholarships & Fellowships$18,113,097
9%
Auxiliary Enterprises$23,587,653
11%Capital Outlay$5,299,230
3%
Other Expenses$4,782,939
2%
Operating Uses
Texas Higher Education Coordinating Board 62 June, 2020

Texas A&M University - Corpus ChristiFor the Year Ended August 31, 2019Source: FY 2019 Annual Financial Report
Summary Worksheet FY 2019 Amount Per FTSEInstitution State Funded FTSEs 9,878.48
Operating SourcesState of TexasState Appropriations 57,973,766$ 5,869$ State Grants and Contracts - Restricted 11,376,038 1,152 Higher Education Fund 11,136,344 1,127 Available University Fund Excellence (See FN8) - - Subtotal 80,486,148$ 8,148$
Student & ParentTuition - net 41,641,129$ 4,215$ Fees - net 37,522,815 3,798 Tuition and Fees (net of Scholarship Discounts and Allowances) 79,163,944$ 8,013$
Federal GovernmentFederal Grants and Contracts - Restricted 40,653,281$ 4,115$
Institutional ResourcesEndowment and Interest Income (See FN2) 9,206,318$ 932$ Local Government Grants - Restricted - - Private Gifts and Grants - Restricted 12,967,425 1,313 Sales and Services 3,350,255 339 Net Auxiliary Enterprises (See FN9) 6,705,561 679 Other Income (See FN3) 1,215,173 123 Subtotal 33,444,732$ 3,386$ Total Operating Sources 233,748,105$ 23,662$
Operating UsesInstruction 62,022,217$ 6,279$ Research 25,227,434 2,554 Public Service 3,256,278 330 Academic Support 28,543,985 2,890 Student Services 13,061,774 1,322 Institutional Support 15,042,172 1,523 Operations and Maintenance of Plant 12,606,399 1,276 Scholarships and Fellowships 18,113,097 1,834 Auxiliary Enterprises (See FN9) 23,587,653 2,388 Capital Outlay from Current Fund Sources 5,299,230 536 Other Expenses (See FN3) 4,782,939 484 Total Operating Uses 211,543,178$ 21,416$
Other Sources / (Uses) of FundsCapital Outlay from Non-Current Fund Sources 5,299,230 536$ Mandatory and Non-mandatory Transfers (See FN10) 1,567,831 159 Bond Proceeds Transfers (See FN4) - - Debt Service Payments (See FN5) (17,394,545) (1,761) Subtotal (10,527,484)$ (1,066)$
Other Items Not for Current Operating UseUnrealized Gains / (Losses) (See FN6) (3,402,641) (344)$ Additions to Permanent Endowments (See FN7) 316,558 32 Subtotal (3,086,083)$ (312)$
Total Sources Over / (Under) Uses (See FN11) 8,591,360$ 868$
Texas Higher Education Coordinating Board 63 June, 2020

FY 2019
Operating SourcesEducational &
General DesignatedAuxiliary
EnterprisesRestricted Expendable Loan Funds
Annuity, Life & Endowment and
Similar FundsUnexpended
PlantRetirement of Indebtedness
Investment In Plant Primary University
State of TexasState Appropriations 57,973,766 - - - - - - - - 57,973,766 State Grants and Contracts - Restricted 446,354 107,729 - 10,821,955 - - - - - 11,376,038 Higher Education Fund 11,136,344 - - - - - - - - 11,136,344 Available University Fund Excellence (See FN8) - - - - - - - - - - Subtotal 69,556,464 107,729 - 10,821,955 - - - - - 80,486,148
Student & ParentTuition Potential 100% 24,364,019 39,356,071 - - - - - - - 63,720,090 Waivers - Statutory (Not Reported in AFR) (3,938,443) - - - - - - - - (3,938,443) Waivers - Institutional (Not Reported in AFR) - - - - - - - - - - Exemptions - Statutory (Not Reported in AFR) - - - - - - - - - - Exemptions - Institutional (Not Reported in AFR) - - - - - - - - - - Tuition - Gross - AFR Presentation 20,425,576 39,356,071 - - - - - - - 59,781,647 Waivers - Statutory (Reported in AFR) (135,964) (35,564) - - - - - - - (171,528) Waivers - Institutional (Reported in AFR) - - - - - - - - - - Exemptions - Statutory (Reported in AFR) (1,296,704) (3,595,686) - - - - - - - (4,892,390) Exemptions - Institutional (Reported in AFR) - - - - - - - - - - All Other Scholarship Disc.& Allow. (See FN1) (4,765,397) (8,311,203) - - - - - - - (13,076,600) Tuition - net 14,227,511 27,413,618 - - - - - - - 41,641,129
Fees Potential 100% 297,950 32,304,668 21,266,615 - - - - - - 53,869,233 Waivers - Statutory (Not Reported in AFR) - - - - - - - - - - Waivers - Institutional (Not Reported in AFR) - - - - - - - - - - Exemptions - Statutory (Not Reported in AFR) - - - - - - - - - - Exemptions - Institutional (Not Reported in AFR) - - - - - - - - - - Fees - Gross - AFR Presentation 297,950 32,304,668 21,266,615 - - - - - - 53,869,233 Waivers - Statutory (Reported in AFR) - - - - - - - - - - Waivers - Institutional (Reported in AFR) - - - - - - - - - - Exemptions - Statutory (Reported in AFR) (399,940) (2,528,190) (1,984,557) - - - - - - (4,912,687) Exemptions - Institutional (Reported in AFR) - - - - - - - - - - All Other Scholarship Disc.& Allow. (See FN1) 309,528 (7,274,541) (4,468,718) - - - - - - (11,433,731) Fees - net 207,538 22,501,937 14,813,340 - - - - - - 37,522,815
Net Tuition and Fees (Funds Collected) 14,435,049 49,915,555 14,813,340 - - - - - - 79,163,944
Federal GovernmentFederal Grants and Contracts - Restricted - 2,090,163 - 38,563,118 - - - - - 40,653,281
Institutional ResourcesEndowment and Interest Income (See FN2) 250,385 6,466,159 1,886,596 509,689 62,168 9,676 21,645 - - 9,206,318 Local Government Grants - Restricted - - - - - - - - - - Private Gifts and Grants - Restricted - 2,173,824 584,245 10,202,382 - - 6,974 - - 12,967,425 Sales and Services - 3,029,910 - 320,345 - - - - - 3,350,255 Net Auxiliary Enterprises (See FN9) - - 6,705,561 - - - - - - 6,705,561 Other Income (See FN3) 8,211 421,674 1,124,363 99,502 - 7,113 185,626 - (631,316) 1,215,173 Subtotal 258,596 12,091,567 10,300,765 11,131,918 62,168 16,789 214,245 - (631,316) 33,444,732 Total Operating Sources 84,250,109 64,205,014 25,114,105 60,516,991 62,168 16,789 214,245 - (631,316) 233,748,105
Operating UsesInstruction 31,542,659 26,231,765 - 4,247,793 - - - - - 62,022,217 Research 5,249,482 2,367,374 - 17,609,266 - - 1,312 - - 25,227,434 Public Service 855,033 1,581,569 - 819,676 - - - - - 3,256,278 Academic Support 14,420,384 12,573,518 - 1,550,083 - - - - - 28,543,985 Student Services 3,477,099 9,023,708 - 232,050 328,917 - - - - 13,061,774 Institutional Support 6,470,438 8,146,670 - 424,449 - - 615 - - 15,042,172 Operations and Maintenance of Plant 4,071,722 8,359,539 - 175,138 - - - - - 12,606,399 Scholarships and Fellowships 2,098,928 7,776,185 - 8,237,984 - - - - - 18,113,097 Auxiliary Enterprises (See FN9) - - 23,587,653 - - - - - - 23,587,653 Capital Outlay from Current Fund Sources* 3,432,095 648,695 189,232 1,029,208 - - - - - 5,299,230 Other Expenses (See FN3) 18,308 331,117 240,502 77,009 - 1,078 - - 4,114,925 4,782,939 Total Operating Uses 71,636,148 77,040,140 24,017,387 34,402,656 328,917 1,078 1,927 - 4,114,925 211,543,178
Other Sources / (Uses) of FundsCapital Outlay from Non-Current Fund Sources** - - - - - - (8,873,711) - 14,172,941 5,299,230 Mandatory and Non-mandatory Transfers (See FN10) (1,324,332) 15,068,660 4,210,225 (25,302,174) 183,730 465,654 8,266,068 - - 1,567,831 Bond Proceeds Transfers In (See FN4) - - - - - - - - - - Debt Service Payments (See FN5) (12,077,097) (533,240) (4,784,208) - - - - - - (17,394,545) Subtotal (13,401,429) 14,535,420 (573,983) (25,302,174) 183,730 465,654 (607,643) - 14,172,941 (10,527,484)
Other Items Not for Current Operating UseUnrealized Gains / (Losses) (See FN6) - (1,802,876) (564,537) (671,934) (44,570) (318,724) - - - (3,402,641) Additions to Permanent Endowments (See FN7) - - - - - 316,558 - - - 316,558 Subtotal - (1,802,876) (564,537) (671,934) (44,570) (2,166) - - - (3,086,083)
Total Sources Over / (Under) Uses (See FN 11) (787,468) (102,582) (41,802) 140,227 (127,589) 479,199 (395,325) - 9,426,700 8,591,360
Bond Proceeds - - - - - - - - - - Depreciation Expense - - - - - - - - (20,186,951) (20,186,951) Transfer of Capital Asses(s) from System - - - - - - - - 57,227,767 57,227,767 Other Post-Employment Benefit (OPEB) Expense - - - - - - - - - - Non-Cash Capital Gifts - - - - - - - - 28,950 28,950 Capital Outlay 3,432,095 648,695 189,232 1,029,208 - - 8,873,711 - (14,172,941) - Change in Net Assets (Total Agrees with AFR***) 2,644,627 546,113 147,430 1,169,435 (127,589) 479,199 8,478,386 - 32,323,525 45,661,126
*Defined as any capital outlay expenses from Educational & General, Designated, Auxiliary, or Restricted Expendable Funds.**Defined as any capital outlay expense from funds other than Educational & General, Designated, Auxiliary, or Restricted Expendable.***As reported for "Changes in Net Position" shown on Schedule of Revenues, Expenses, and Changes in Net Position (SRECNP) in Annual Financial Report.
Texas A&M University - Corpus ChristiFor the Year Ended August 31, 2019Source: FY 2019 Annual Financial Report
Detail Worksheet FY 2019
Texas Higher Education Coordinating Board 64 June, 2020

Texas A&M University - Corpus ChristiFor the Year Ended August 31, 2019Source: FY 2019 Annual Financial Report
FOOTNOTES:
FN1: Scholarship Discounts and Allowances are scholarships, fellowships, and grants applied to tuition. The discount eliminates tuition revenues that are paid for by University resources which are recorded as revenue elsewhere on the financial statements (i.e. federal and state contracts and grants revenues). In addition, Scholarship Discounts and Allowances eliminate tuition revenue that is exempted from payment due to tuition exemptions approved by the Texas Legislature. Waivers, remissions, and exemptions represent tuition and fee dollars forgone by the university - some are required by statute. See the Integrated Financial Reporting System (IFRS) report submitted to THECB for details on waivers, exemptions, tuition, and fees. Allocation methods to individual funds shown may vary between institutions.
FN2: Endowment and Interest Income includes interest income and endowment payouts.
FN3: Other Income is primarily Other Operating and Other Non-operating Revenues from the AFR. Other Expenses is primarily Other Nonoperating Expenses from the AFR.
FN4: Bond Proceeds are funds received from the sale of bonds and commercial paper used to finance capital projects. This amount includes actual proceeds and accrued or anticipated proceeds to be transferred from System. Independent institutions report only to the extent expended in current year.
FN5: Debt service payments are payments to service and retire debt issued to fund capital projects. System components do this via transfers to System Administrations. Independent institutions use direct payment to appropriate paying agents.
FN6: Unrealized Gains / (Losses) represent the increase in the Fair Market Value of Investments and Endowments. Unrealized Gains / (Losses) are accrued as non-cash transactions. Therefore, funds are not actually received for this revenue stream. Accordingly, this revenue is not cash revenue and cannot be used by the University to fund operations.
FN7: Additions to Permanent Endowments are additions to endowment principal. This revenue is restricted for investment purposes only and cannot be used to fund operations. Only interest income from these endowments, which is reported on the Endowment and Investment Income line of this report, can be used by the University to fund operations.
FN8: Distributions from the Available University Fund appropriated through the Appropriation Bill are first used to pay debt service costs on Permanent University Fund Bonds. Funds remaining are distributed to constitutionally designated institutions to promote academic excellence. Only the Excellence funding is shown at the institution level. The AUF funds used to pay debt service on PUF bonds are reported at the System level.
FN9: Auxiliary Enterprises include athletics, housing and food, student services, and parking and transportation. Auxiliary Enterprises are required to be self-supporting, and therefore must operate on the funds they generate.
FN10: Mandatory and non-mandatory transfers includes transfers between funds, transfers between the University System and institutions and transfers to and from other state agencies. In total, all transfers between funds net to zero with the exception of any amounts transferred between the University System, between other institutions, or to and from another state agency. There are no transfers of education and general funds provided by the State of Texas to restricted or auxiliary fund groups. Transfers between education and general funds and designated funds are related to Texas Public Education Grant as provided by the State of Texas.
FN11: Of the net increase of $8,591,360 approximately $12.0 million represents revenues received but not yet expended. This income is fully committed to program expenditures and capital disbursements. The remaining $(3.4) million represents non-expendable funds from unrealized gains and additions to permanent endowments of approximately $(3.4) million and $0 respectively. Unrealized gains and additions to permanent endowments do not contribute to the availability of the institution's operating cash as discussed in FN6 and FN7.
Texas Higher Education Coordinating Board 65 June, 2020
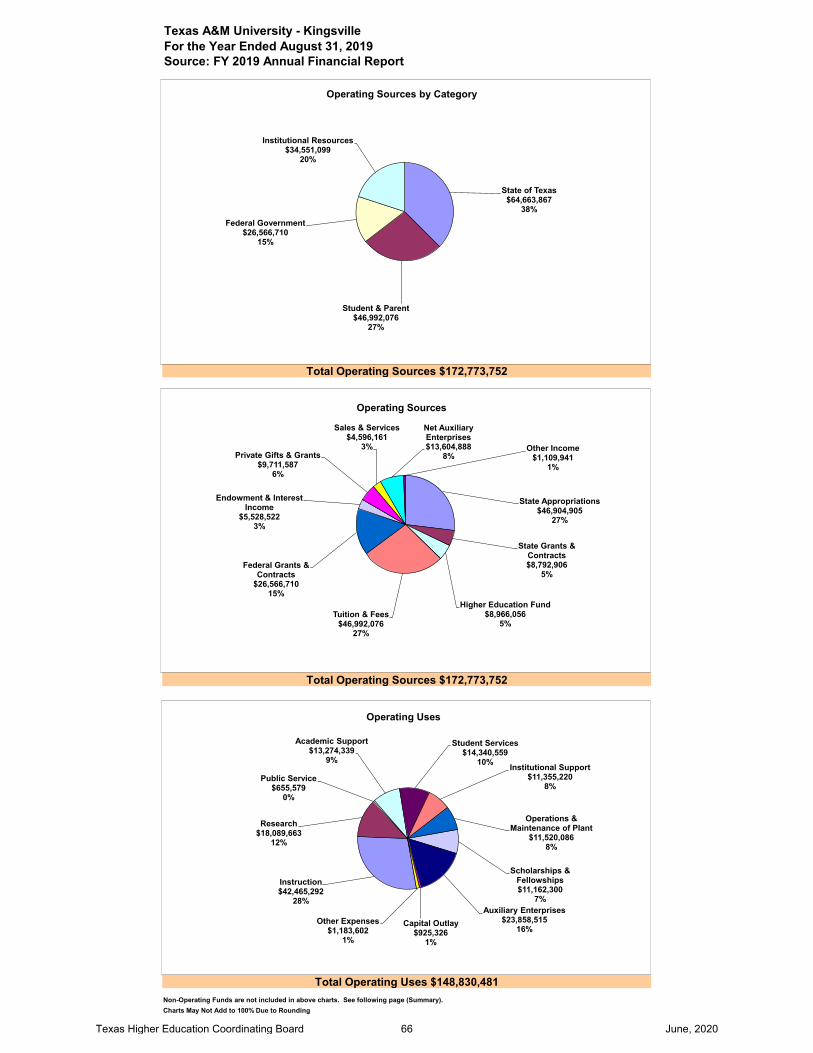
Texas A&M University - KingsvilleFor the Year Ended August 31, 2019Source: FY 2019 Annual Financial Report
Non-Operating Funds are not included in above charts. See following page (Summary).Charts May Not Add to 100% Due to Rounding
Total Operating Sources $172,773,752
Total Operating Sources $172,773,752
Total Operating Uses $148,830,481
State of Texas$64,663,867
38%
Student & Parent$46,992,076
27%
Federal Government$26,566,710
15%
Institutional Resources$34,551,099
20%
Operating Sources by Category
State Appropriations$46,904,905
27%
State Grants & Contracts$8,792,906
5%
Higher Education Fund$8,966,056
5%Tuition & Fees
$46,992,07627%
Federal Grants & Contracts
$26,566,71015%
Endowment & Interest Income
$5,528,5223%
Private Gifts & Grants$9,711,587
6%
Sales & Services$4,596,161
3%
Net Auxiliary Enterprises$13,604,888
8%Other Income
$1,109,9411%
Operating Sources
Instruction$42,465,292
28%
Research$18,089,663
12%
Public Service$655,579
0%
Academic Support$13,274,339
9%
Student Services$14,340,559
10% Institutional Support$11,355,220
8%
Operations & Maintenance of Plant
$11,520,0868%
Scholarships & Fellowships$11,162,300
7%Auxiliary Enterprises
$23,858,51516%
Capital Outlay$925,326
1%
Other Expenses$1,183,602
1%
Operating Uses
Texas Higher Education Coordinating Board 66 June, 2020

Texas A&M University - KingsvilleFor the Year Ended August 31, 2019Source: FY 2019 Annual Financial Report
Summary Worksheet FY 2019 Amount Per FTSEInstitution State Funded FTSEs 6,704.04
Operating SourcesState of TexasState Appropriations 46,904,905$ 6,997$ State Grants and Contracts - Restricted 8,792,906 1,312 Higher Education Fund 8,966,056 1,337 Available University Fund Excellence (See FN8) - - Subtotal 64,663,867$ 9,646$
Student & ParentTuition - net 27,033,113$ 4,032$ Fees - net 19,958,963 2,977 Tuition and Fees (net of Scholarship Discounts and Allowances) 46,992,076$ 7,009$
Federal GovernmentFederal Grants and Contracts - Restricted 26,566,710$ 3,963$
Institutional ResourcesEndowment and Interest Income (See FN2) 5,528,522$ 825$ Local Government Grants - Restricted - - Private Gifts and Grants - Restricted 9,711,587 1,449 Sales and Services 4,596,161 686 Net Auxiliary Enterprises (See FN9) 13,604,888 2,029 Other Income (See FN3) 1,109,941 166 Subtotal 34,551,099$ 5,155$ Total Operating Sources 172,773,752$ 25,773$
Operating UsesInstruction 42,465,292$ 6,334$ Research 18,089,663 2,698 Public Service 655,579 98 Academic Support 13,274,339 1,980 Student Services 14,340,559 2,139 Institutional Support 11,355,220 1,694 Operations and Maintenance of Plant 11,520,086 1,718 Scholarships and Fellowships 11,162,300 1,665 Auxiliary Enterprises (See FN9) 23,858,515 3,559 Capital Outlay from Current Fund Sources 925,326 138 Other Expenses (See FN3) 1,183,602 177 Total Operating Uses 148,830,481$ 22,200$
Other Sources / (Uses) of FundsCapital Outlay from Non-Current Fund Sources (3,677,238) (549)$ Mandatory and Non-mandatory Transfers (See FN10) 1,355,396 202 Bond Proceeds Transfers (See FN4) - - Debt Service Payments (See FN5) (14,060,275) (2,097) Subtotal (16,382,117)$ (2,444)$
Other Items Not for Current Operating UseUnrealized Gains / (Losses) (See FN6) (1,644,392) (245)$ Additions to Permanent Endowments (See FN7) 275,190 41 Subtotal (1,369,202)$ (204)$
Total Sources Over / (Under) Uses (See FN11) 6,191,952$ 925$
Texas Higher Education Coordinating Board 67 June, 2020

FY 2019
Operating SourcesEducational &
General DesignatedAuxiliary
EnterprisesRestricted Expendable Loan Funds
Annuity, Life & Endowment and
Similar FundsUnexpended
PlantRetirement of Indebtedness
Investment In Plant Primary University
State of TexasState Appropriations 46,904,905 - - - - - - - - 46,904,905 State Grants and Contracts - Restricted 1,224,122 59,909 - 7,508,875 - - - - - 8,792,906 Higher Education Fund 8,966,056 - - - - - - - - 8,966,056 Available University Fund Excellence (See FN8) - - - - - - - - - - Subtotal 57,095,083 59,909 - 7,508,875 - - - - - 64,663,867
Student & ParentTuition Potential 100% 19,881,040 20,260,507 - - - - - - - 40,141,547 Waivers - Statutory (Not Reported in AFR) (2,561,629) - - - - - - - - (2,561,629) Waivers - Institutional (Not Reported in AFR) - - - - - - - - - - Exemptions - Statutory (Not Reported in AFR) - - - - - - - - - - Exemptions - Institutional (Not Reported in AFR) - - - - - - - - - - Tuition - Gross - AFR Presentation 17,319,411 20,260,507 - - - - - - - 37,579,918 Waivers - Statutory (Reported in AFR) (48,019) (23,011) - - - - - - - (71,030) Waivers - Institutional (Reported in AFR) - - - - - - - - - - Exemptions - Statutory (Reported in AFR) (903,169) (1,315,284) - - - - - - - (2,218,453) Exemptions - Institutional (Reported in AFR) - - - - - - - - - - All Other Scholarship Disc.& Allow. (See FN1) (3,909,505) (4,347,817) - - - - - - - (8,257,322) Tuition - net 12,458,718 14,574,395 - - - - - - - 27,033,113
Fees Potential 100% 342,655 18,291,592 9,111,584 - - - - - - 27,745,831 Waivers - Statutory (Not Reported in AFR) - - - - - - - - - - Waivers - Institutional (Not Reported in AFR) - - - - - - - - - - Exemptions - Statutory (Not Reported in AFR) - - - - - - - - - - Exemptions - Institutional (Not Reported in AFR) - - - - - - - - - - Fees - Gross - AFR Presentation 342,655 18,291,592 9,111,584 - - - - - - 27,745,831 Waivers - Statutory (Reported in AFR) - - - - - - - - - - Waivers - Institutional (Reported in AFR) - - - - - - - - - - Exemptions - Statutory (Reported in AFR) - (1,217,396) (489,900) - - - - - - (1,707,296) Exemptions - Institutional (Reported in AFR) - - - - - - - - - - All Other Scholarship Disc.& Allow. (See FN1) (96,166) (3,916,140) (2,067,266) - - - - - - (6,079,572) Fees - net 246,489 13,158,056 6,554,418 - - - - - - 19,958,963
Net Tuition and Fees (Funds Collected) 12,705,207 27,732,451 6,554,418 - - - - - - 46,992,076
Federal GovernmentFederal Grants and Contracts - Restricted - 1,205,656 - 25,361,054 - - - - - 26,566,710
Institutional ResourcesEndowment and Interest Income (See FN2) 306,175 3,294,279 42 1,847,801 80,186 39 - - - 5,528,522 Local Government Grants - Restricted - - - - - - - - - - Private Gifts and Grants - Restricted - 434,766 122,536 9,154,285 - - - - - 9,711,587 Sales and Services 194,049 3,536,705 - 865,407 - - - - - 4,596,161 Net Auxiliary Enterprises (See FN9) - - 13,604,888 - - - - - - 13,604,888 Other Income (See FN3) 2,108 403,867 645,348 52,409 9,161 - - - (2,952) 1,109,941 Subtotal 502,332 7,669,617 14,372,814 11,919,902 89,347 39 - - (2,952) 34,551,099 Total Operating Sources 70,302,622 36,667,633 20,927,232 44,789,831 89,347 39 - - (2,952) 172,773,752
Operating UsesInstruction 35,591,075 5,242,838 - 1,631,379 - - - - - 42,465,292 Research 2,803,998 1,408,875 - 13,876,790 - - - - - 18,089,663 Public Service 112,038 425,783 - 117,758 - - - - - 655,579 Academic Support 8,377,403 4,133,536 - 763,400 - - - - - 13,274,339 Student Services 4,127,704 8,399,548 - 1,509,912 303,395 - - - - 14,340,559 Institutional Support 6,189,373 5,065,620 - 100,227 - - - - - 11,355,220 Operations and Maintenance of Plant 2,379,984 7,256,635 - - - - 1,883,467 - - 11,520,086 Scholarships and Fellowships 1,176,667 3,533,382 - 6,452,251 - - - - - 11,162,300 Auxiliary Enterprises (See FN9) - - 23,858,515 - - - - - - 23,858,515 Capital Outlay from Current Fund Sources* 502,248 102,711 41,292 279,075 - - - - - 925,326 Other Expenses (See FN3) - 276,028 359 - - - - - 907,215 1,183,602 Total Operating Uses 61,260,490 35,844,956 23,900,166 24,730,792 303,395 - 1,883,467 - 907,215 148,830,481
Other Sources / (Uses) of FundsCapital Outlay from Non-Current Fund Sources** - - - - - - (3,677,238) - - (3,677,238) Mandatory and Non-mandatory Transfers (See FN10) 2,856,677 22,059 9,002,193 (17,859,503) 4,977 984,217 6,344,776 - - 1,355,396 Bond Proceeds Transfers In (See FN4) - - - - - - - - - - Debt Service Payments (See FN5) (8,307,449) (326,250) (5,426,576) - - - - - - (14,060,275) Subtotal (5,450,772) (304,191) 3,575,617 (17,859,503) 4,977 984,217 2,667,538 - - (16,382,117)
Other Items Not for Current Operating UseUnrealized Gains / (Losses) (See FN6) - (387,240) - (721,150) (2,992) (533,010) - - - (1,644,392) Additions to Permanent Endowments (See FN7) - - - - - 275,190 - - - 275,190 Subtotal - (387,240) - (721,150) (2,992) (257,820) - - - (1,369,202)
Total Sources Over / (Under) Uses (See FN 11) 3,591,360 131,246 602,683 1,478,386 (212,063) 726,436 784,071 - (910,167) 6,191,952
Bond Proceeds - - - - - - - - - - Depreciation Expense - - - - - - - - (9,548,343) (9,548,343) Transfer of Capital Asses(s) from System - - - - - - - - - - Other Post-Employment Benefit (OPEB) Expense - - - - - - - - - - Non-Cash Capital Gifts - - - - - - - - 111,951 111,951 Capital Outlay 502,248 102,711 41,292 574,600 - - 3,677,238 - - 4,898,089 Change in Net Assets (Total Agrees with AFR***) 4,093,608 233,957 643,975 2,052,986 (212,063) 726,436 4,461,309 - (10,346,559) 1,653,649
*Defined as any capital outlay expenses from Educational & General, Designated, Auxiliary, or Restricted Expendable Funds.**Defined as any capital outlay expense from funds other than Educational & General, Designated, Auxiliary, or Restricted Expendable.***As reported for "Changes in Net Position" shown on Schedule of Revenues, Expenses, and Changes in Net Position (SRECNP) in Annual Financial Report.
Texas A&M University - KingsvilleFor the Year Ended August 31, 2019Source: FY 2019 Annual Financial Report
Detail Worksheet FY 2019
Texas Higher Education Coordinating Board 68 June, 2020

Texas A&M University - KingsvilleFor the Year Ended August 31, 2019Source: FY 2019 Annual Financial Report
FOOTNOTES:
FN1: Scholarship Discounts and Allowances are scholarships, fellowships, and grants applied to tuition. The discount eliminates tuition revenues that are paid for by University resources which are recorded as revenue elsewhere on the financial statements (i.e. federal and state contracts and grants revenues). In addition, Scholarship Discounts and Allowances eliminate tuition revenue that is exempted from payment due to tuition exemptions approved by the Texas Legislature. Waivers, remissions, and exemptions represent tuition and fee dollars forgone by the university - some are required by statute. See the Integrated Financial Reporting System (IFRS) report submitted to THECB for details on waivers, exemptions, tuition, and fees. Allocation methods to individual funds shown may vary between institutions.
FN2: Endowment and Interest Income includes interest income and endowment payouts.
FN3: Other Income is primarily Other Operating and Other Non-operating Revenues from the AFR. Other Expenses is primarily Other Nonoperating Expenses from the AFR.
FN4: Bond Proceeds are funds received from the sale of bonds and commercial paper used to finance capital projects. This amount includes actual proceeds and accrued or anticipated proceeds to be transferred from System. Independent institutions report only to the extent expended in current year.
FN5: Debt service payments are payments to service and retire debt issued to fund capital projects. System components do this via transfers to System Administrations. Independent institutions use direct payment to appropriate paying agents.
FN6: Unrealized Gains / (Losses) represent the increase in the Fair Market Value of Investments and Endowments. Unrealized Gains / (Losses) are accrued as non-cash transactions. Therefore, funds are not actually received for this revenue stream. Accordingly, this revenue is not cash revenue and cannot be used by the University to fund operations.
FN7: Additions to Permanent Endowments are additions to endowment principal. This revenue is restricted for investment purposes only and cannot be used to fund operations. Only interest income from these endowments, which is reported on the Endowment and Investment Income line of this report, can be used by the University to fund operations.
FN8: Distributions from the Available University Fund appropriated through the Appropriation Bill are first used to pay debt service costs on Permanent University Fund Bonds. Funds remaining are distributed to constitutionally designated institutions to promote academic excellence. Only the Excellence funding is shown at the institution level. The AUF funds used to pay debt service on PUF bonds are reported at the System level.
FN9: Auxiliary Enterprises include athletics, housing and food, student services, and parking and transportation. Auxiliary Enterprises are required to be self-supporting, and therefore must operate on the funds they generate.
FN10: Mandatory and non-mandatory transfers includes transfers between funds, transfers between the University System and institutions and transfers to and from other state agencies. In total, all transfers between funds net to zero with the exception of any amounts transferred between the University System, between other institutions, or to and from another state agency. There are no transfers of education and general funds provided by the State of Texas to restricted or auxiliary fund groups. Transfers between education and general funds and designated funds are related to Texas Public Education Grant as provided by the State of Texas.
FN11: Of the net increase of $6,191,952 approximately $7.6 million represents revenues received but not yet expended. This income is fully committed to program expenditures and capital disbursements. The remaining $(1.4) million represents non-expendable funds from unrealized gains and additions to permanent endowments of approximately $(1.6) million and $275 thousand respectively. Unrealized gains and additions to permanent endowments do not contribute to the availability of the institution's operating cash as discussed in FN6 and FN7.
Texas Higher Education Coordinating Board 69 June, 2020

Texas A&M International UniversityFor the Year Ended August 31, 2019Source: FY 2019 Annual Financial Report
Non-Operating Funds are not included in above charts. See following page (Summary).Charts May Not Add to 100% Due to Rounding
Total Operating Sources $128,086,919
Total Operating Sources $128,086,919
Total Operating Uses $110,921,465
State of Texas$55,597,444
43%
Student & Parent$27,946,770
22%
Federal Government$29,413,046
23%
Institutional Resources$15,129,659
12%
Operating Sources by Category
State Appropriations$37,335,149
29%
State Grants & Contracts
$11,552,3859%
Higher Education Fund$6,709,910
5%
Tuition & Fees$27,946,770
22%
Federal Grants & Contracts
$29,413,04623%
Endowment & Interest Income
$5,523,7504%
Private Gifts & Grants$4,439,134
4%
Sales & Services$1,041,977
1%
Net Auxiliary Enterprises$2,549,602
2%Other Income
$1,575,1961%
Operating Sources
Instruction$31,649,704
28%
Research$4,777,727
4%
Public Service$3,032,382
3%
Academic Support$16,896,768
15%
Student Services$6,857,675
6% Institutional Support$8,401,581
8%
Operations & Maintenance of Plant
$11,782,64111%
Scholarships & Fellowships$14,843,986
13%
Auxiliary Enterprises$9,551,970
9%Capital Outlay
$1,172,6641%
Other Expenses$1,954,367
2%
Operating Uses
Texas Higher Education Coordinating Board 70 June, 2020

Texas A&M International UniversityFor the Year Ended August 31, 2019Source: FY 2019 Annual Financial Report
Summary Worksheet FY 2019 Amount Per FTSEInstitution State Funded FTSEs 6,712.11
Operating SourcesState of TexasState Appropriations 37,335,149$ 5,562$ State Grants and Contracts - Restricted 11,552,385 1,721 Higher Education Fund 6,709,910 1,000 Available University Fund Excellence (See FN8) - - Subtotal 55,597,444$ 8,283$
Student & ParentTuition - net 14,827,692$ 2,209$ Fees - net 13,119,078 1,955 Tuition and Fees (net of Scholarship Discounts and Allowances) 27,946,770$ 4,164$
Federal GovernmentFederal Grants and Contracts - Restricted 29,413,046$ 4,382$
Institutional ResourcesEndowment and Interest Income (See FN2) 5,523,750$ 823$ Local Government Grants - Restricted - - Private Gifts and Grants - Restricted 4,439,134 661 Sales and Services 1,041,977 155 Net Auxiliary Enterprises (See FN9) 2,549,602 380 Other Income (See FN3) 1,575,196 235 Subtotal 15,129,659$ 2,254$ Total Operating Sources 128,086,919$ 19,083$
Operating UsesInstruction 31,649,704$ 4,715$ Research 4,777,727 712 Public Service 3,032,382 452 Academic Support 16,896,768 2,517 Student Services 6,857,675 1,022 Institutional Support 8,401,581 1,252 Operations and Maintenance of Plant 11,782,641 1,755 Scholarships and Fellowships 14,843,986 2,212 Auxiliary Enterprises (See FN9) 9,551,970 1,423 Capital Outlay from Current Fund Sources 1,172,664 175 Other Expenses (See FN3) 1,954,367 291 Total Operating Uses 110,921,465$ 16,526$
Other Sources / (Uses) of FundsCapital Outlay from Non-Current Fund Sources 1,172,664 175$ Mandatory and Non-mandatory Transfers (See FN10) 2,749,086 410 Bond Proceeds Transfers (See FN4) - - Debt Service Payments (See FN5) (10,608,716) (1,581) Subtotal (6,686,966)$ (996)$
Other Items Not for Current Operating UseUnrealized Gains / (Losses) (See FN6) (2,262,471) (337)$ Additions to Permanent Endowments (See FN7) 136,305 20 Subtotal (2,126,166)$ (317)$
Total Sources Over / (Under) Uses (See FN11) 8,352,322$ 1,244$
Texas Higher Education Coordinating Board 71 June, 2020

FY 2019
Operating SourcesEducational &
General DesignatedAuxiliary
EnterprisesRestricted Expendable Loan Funds
Annuity, Life & Endowment and
Similar FundsUnexpended
PlantRetirement of Indebtedness
Investment In Plant Primary University
State of TexasState Appropriations 37,335,149 - - - - - - - - 37,335,149 State Grants and Contracts - Restricted 70,817 72,857 - 11,408,711 - - - - - 11,552,385 Higher Education Fund 6,709,910 - - - - - - - - 6,709,910 Available University Fund Excellence (See FN8) - - - - - - - - - - Subtotal 44,115,876 72,857 - 11,408,711 - - - - - 55,597,444
Student & ParentTuition Potential 100% 13,991,067 21,884,648 - - - - - - - 35,875,715 Waivers - Statutory (Not Reported in AFR) (2,698,269) (45,047) - - - - - - - (2,743,316) Waivers - Institutional (Not Reported in AFR) - - - - - - - - - - Exemptions - Statutory (Not Reported in AFR) (600,920) (449,940) - - - - - - - (1,050,860) Exemptions - Institutional (Not Reported in AFR) - - - - - - - - - - Tuition - Gross - AFR Presentation 10,691,878 21,389,661 - - - - - - - 32,081,539 Waivers - Statutory (Reported in AFR) - - - - - - - - - - Waivers - Institutional (Reported in AFR) - - - - - - - - - - Exemptions - Statutory (Reported in AFR) (326,043) (692,007) - - - - - - - (1,018,050) Exemptions - Institutional (Reported in AFR) - - - - - - - - - - All Other Scholarship Disc.& Allow. (See FN1) (5,424,181) (10,811,616) - - - - - - - (16,235,797) Tuition - net 4,941,654 9,886,038 - - - - - - - 14,827,692
Fees Potential 100% 540,973 19,789,090 8,629,728 534,289 - - - - - 29,494,080 Waivers - Statutory (Not Reported in AFR) - (290,368) (37,060) - - - - - - (327,428) Waivers - Institutional (Not Reported in AFR) - - - - - - - - - - Exemptions - Statutory (Not Reported in AFR) - (649,619) (754,004) - - - - - - (1,403,623) Exemptions - Institutional (Not Reported in AFR) - - - - - - - - - - Fees - Gross - AFR Presentation 540,973 18,849,103 7,838,664 534,289 - - - - - 27,763,029 Waivers - Statutory (Reported in AFR) - - - - - - - - - - Waivers - Institutional (Reported in AFR) - - - - - - - - - - Exemptions - Statutory (Reported in AFR) (2,640) (428,726) (231,914) - - - - - - (663,280) Exemptions - Institutional (Reported in AFR) - - - - - - - - - - All Other Scholarship Disc.& Allow. (See FN1) (288,302) (9,708,553) (3,983,816) - - - - - - (13,980,671) Fees - net 250,031 8,711,824 3,622,934 534,289 - - - - - 13,119,078
Net Tuition and Fees (Funds Collected) 5,191,685 18,597,862 3,622,934 534,289 - - - - - 27,946,770
Federal GovernmentFederal Grants and Contracts - Restricted - 331,522 - 29,081,524 - - - - - 29,413,046
Institutional ResourcesEndowment and Interest Income (See FN2) 365,359 3,787,580 800,319 458,950 78,361 1,321 31,860 - - 5,523,750 Local Government Grants - Restricted - - - - - - - - - - Private Gifts and Grants - Restricted - 272,144 12,500 4,154,490 - - - - - 4,439,134 Sales and Services 31,660 551,500 - 458,817 - - - - - 1,041,977 Net Auxiliary Enterprises (See FN9) - - 2,549,602 - - - - - - 2,549,602 Other Income (See FN3) 4,422 586,336 25,525 959,757 - - - - (844) 1,575,196 Subtotal 401,441 5,197,560 3,387,946 6,032,014 78,361 1,321 31,860 - (844) 15,129,659 Total Operating Sources 49,709,002 24,199,801 7,010,880 47,056,538 78,361 1,321 31,860 - (844) 128,086,919
Operating UsesInstruction 26,380,486 3,837,513 - 1,431,705 - - - - - 31,649,704 Research 1,005,361 528,320 - 3,244,046 - - - - - 4,777,727 Public Service 845,370 1,038,577 - 1,148,435 - - - - - 3,032,382 Academic Support 6,846,436 6,683,581 - 3,366,751 - - - - - 16,896,768 Student Services 919,628 5,193,154 - 533,686 211,207 - - - - 6,857,675 Institutional Support 1,606,726 6,775,028 - 19,827 - - - - - 8,401,581 Operations and Maintenance of Plant 2,852,821 8,927,205 - 2,550 - - 65 - - 11,782,641 Scholarships and Fellowships 331,759 3,021,661 - 11,490,566 - - - - - 14,843,986 Auxiliary Enterprises (See FN9) - - 9,551,970 - - - - - - 9,551,970 Capital Outlay from Current Fund Sources* 336,753 343,418 451,134 41,359 - - - - - 1,172,664 Other Expenses (See FN3) - 185,635 40,277 999 3,840 - 1,581 - 1,722,035 1,954,367 Total Operating Uses 41,125,340 36,534,092 10,043,381 21,279,924 215,047 - 1,646 - 1,722,035 110,921,465
Other Sources / (Uses) of FundsCapital Outlay from Non-Current Fund Sources** - - - - - - (11,994,755) - 13,167,419 1,172,664 Mandatory and Non-mandatory Transfers (See FN10) 4,729,865 16,267,752 6,568,278 (25,765,547) 143,099 805,639 - - - 2,749,086 Bond Proceeds Transfers In (See FN4) - - - - - - - - - - Debt Service Payments (See FN5) (8,655,682) (18,716) (1,934,318) - - - - - - (10,608,716) Subtotal (3,925,817) 16,249,036 4,633,960 (25,765,547) 143,099 805,639 (11,994,755) - 13,167,419 (6,686,966)
Other Items Not for Current Operating UseUnrealized Gains / (Losses) (See FN6) (806,171) (335,962) (70,460) (132,857) - (917,021) - - - (2,262,471) Additions to Permanent Endowments (See FN7) - - - - - 136,305 - - - 136,305 Subtotal (806,171) (335,962) (70,460) (132,857) - (780,716) - - - (2,126,166)
Total Sources Over / (Under) Uses (See FN 11) 3,851,674 3,578,783 1,530,999 (121,790) 6,413 26,244 (11,964,541) - 11,444,540 8,352,322
Bond Proceeds - - - - - - - - - - Depreciation Expense - - - - - - - - (9,149,863) (9,149,863) Transfer of Capital Asses(s) from System - - - - - - - - 55,712,061 55,712,061 Other Post-Employment Benefit (OPEB) Expense - - - - - - - - - - Non-Cash Capital Gifts - - - - - - - - - - Capital Outlay 336,753 343,418 451,134 41,359 - - 11,994,755 - (13,167,419) - Change in Net Assets (Total Agrees with AFR***) 4,188,427 3,922,201 1,982,133 (80,431) 6,413 26,244 30,214 - 44,839,319 54,914,520
*Defined as any capital outlay expenses from Educational & General, Designated, Auxiliary, or Restricted Expendable Funds.**Defined as any capital outlay expense from funds other than Educational & General, Designated, Auxiliary, or Restricted Expendable.***As reported for "Changes in Net Position" shown on Schedule of Revenues, Expenses, and Changes in Net Position (SRECNP) in Annual Financial Report.
Texas A&M International UniversityFor the Year Ended August 31, 2019Source: FY 2019 Annual Financial Report
Detail Worksheet FY 2019
Texas Higher Education Coordinating Board 72 June, 2020

Texas A&M International UniversityFor the Year Ended August 31, 2019Source: FY 2019 Annual Financial Report
FOOTNOTES:
FN1: Scholarship Discounts and Allowances are scholarships, fellowships, and grants applied to tuition. The discount eliminates tuition revenues that are paid for by University resources which are recorded as revenue elsewhere on the financial statements (i.e. federal and state contracts and grants revenues). In addition, Scholarship Discounts and Allowances eliminate tuition revenue that is exempted from payment due to tuition exemptions approved by the Texas Legislature. Waivers, remissions, and exemptions represent tuition and fee dollars forgone by the university - some are required by statute. See the Integrated Financial Reporting System (IFRS) report submitted to THECB for details on waivers, exemptions, tuition, and fees. Allocation methods to individual funds shown may vary between institutions.
FN2: Endowment and Interest Income includes interest income and endowment payouts.
FN3: Other Income is primarily Other Operating and Other Non-operating Revenues from the AFR. Other Expenses is primarily Other Nonoperating Expenses from the AFR.
FN4: Bond Proceeds are funds received from the sale of bonds and commercial paper used to finance capital projects. This amount includes actual proceeds and accrued or anticipated proceeds to be transferred from System. Independent institutions report only to the extent expended in current year.
FN5: Debt service payments are payments to service and retire debt issued to fund capital projects. System components do this via transfers to System Administrations. Independent institutions use direct payment to appropriate paying agents.
FN6: Unrealized Gains / (Losses) represent the increase in the Fair Market Value of Investments and Endowments. Unrealized Gains / (Losses) are accrued as non-cash transactions. Therefore, funds are not actually received for this revenue stream. Accordingly, this revenue is not cash revenue and cannot be used by the University to fund operations.
FN7: Additions to Permanent Endowments are additions to endowment principal. This revenue is restricted for investment purposes only and cannot be used to fund operations. Only interest income from these endowments, which is reported on the Endowment and Investment Income line of this report, can be used by the University to fund operations.
FN8: Distributions from the Available University Fund appropriated through the Appropriation Bill are first used to pay debt service costs on Permanent University Fund Bonds. Funds remaining are distributed to constitutionally designated institutions to promote academic excellence. Only the Excellence funding is shown at the institution level. The AUF funds used to pay debt service on PUF bonds are reported at the System level.
FN9: Auxiliary Enterprises include athletics, housing and food, student services, and parking and transportation. Auxiliary Enterprises are required to be self-supporting, and therefore must operate on the funds they generate.
FN10: Mandatory and non-mandatory transfers includes transfers between funds, transfers between the University System and institutions and transfers to and from other state agencies. In total, all transfers between funds net to zero with the exception of any amounts transferred between the University System, between other institutions, or to and from another state agency. There are no transfers of education and general funds provided by the State of Texas to restricted or auxiliary fund groups. Transfers between education and general funds and designated funds are related to Texas Public Education Grant as provided by the State of Texas.
FN11: Of the net increase of $8,352,322 approximately $10.5 million represents revenues received but not yet expended. This income is fully committed to program expenditures and capital disbursements. The remaining $(2.1) million represents non-expendable funds from unrealized gains and additions to permanent endowments of approximately $(2.3) million and $136 thousand respectively. Unrealized gains and additions to permanent endowments do not contribute to the availability of the institution's operating cash as discussed in FN6 and FN7.
Texas Higher Education Coordinating Board 73 June, 2020

West Texas A&M UniversityFor the Year Ended August 31, 2019Source: FY 2019 Annual Financial Report
Non-Operating Funds are not included in above charts. See following page (Summary).Charts May Not Add to 100% Due to Rounding
Total Operating Sources $180,211,180
Total Operating Sources $180,211,180
Total Operating Uses $150,514,513
State of Texas$55,030,546
31%
Student & Parent$59,428,333
33%
Federal Government$18,352,319
10%
Institutional Resources$47,399,982
26%
Operating Sources by Category
State Appropriations$41,881,595
23%
State Grants & Contracts$5,984,543
3%
Higher Education Fund$7,164,408
4%Tuition & Fees$59,428,333
33%
Federal Grants & Contracts
$18,352,31910%
Endowment & Interest Income
$6,495,9524%
Private Gifts & Grants$7,342,799
4%
Sales & Services$10,265,074
6%
Net Auxiliary Enterprises$15,168,882
8%
Other Income$8,127,275
5%
Operating Sources
Instruction$42,224,641
28%
Research$4,464,816
3%
Public Service$4,122,397
3%
Academic Support$14,716,504
10%
Student Services$13,694,779
9%Institutional Support
$12,630,5598%
Operations & Maintenance of Plant
$20,959,88814%
Scholarships & Fellowships$12,725,280
9%Auxiliary Enterprises
$19,650,96913%Capital Outlay
$1,779,1221%
Other Expenses$3,545,558
2%
Operating Uses
Texas Higher Education Coordinating Board 74 June, 2020

West Texas A&M UniversityFor the Year Ended August 31, 2019Source: FY 2019 Annual Financial Report
Summary Worksheet FY 2019 Amount Per FTSEInstitution State Funded FTSEs 7,897.10
Operating SourcesState of TexasState Appropriations 41,881,595$ 5,303$ State Grants and Contracts - Restricted 5,984,543 758 Higher Education Fund 7,164,408 907 Available University Fund Excellence (See FN8) - - Subtotal 55,030,546$ 6,968$
Student & ParentTuition - net 40,363,917$ 5,111$ Fees - net 19,064,416 2,414 Tuition and Fees (net of Scholarship Discounts and Allowances) 59,428,333$ 7,525$
Federal GovernmentFederal Grants and Contracts - Restricted 18,352,319$ 2,324$
Institutional ResourcesEndowment and Interest Income (See FN2) 6,495,952$ 823$ Local Government Grants - Restricted - - Private Gifts and Grants - Restricted 7,342,799 930 Sales and Services 10,265,074 1,300 Net Auxiliary Enterprises (See FN9) 15,168,882 1,921 Other Income (See FN3) 8,127,275 1,029 Subtotal 47,399,982$ 6,003$ Total Operating Sources 180,211,180$ 22,820$
Operating UsesInstruction 42,224,641$ 5,347$ Research 4,464,816 565 Public Service 4,122,397 522 Academic Support 14,716,504 1,864 Student Services 13,694,779 1,734 Institutional Support 12,630,559 1,599 Operations and Maintenance of Plant 20,959,888 2,654 Scholarships and Fellowships 12,725,280 1,611 Auxiliary Enterprises (See FN9) 19,650,969 2,488 Capital Outlay from Current Fund Sources 1,779,122 225 Other Expenses (See FN3) 3,545,558 449 Total Operating Uses 150,514,513$ 19,058$
Other Sources / (Uses) of FundsCapital Outlay from Non-Current Fund Sources 1,779,123 225$ Mandatory and Non-mandatory Transfers (See FN10) 2,403,612 304 Bond Proceeds Transfers (See FN4) - - Debt Service Payments (See FN5) (23,138,031) (2,930) Subtotal (18,955,296)$ (2,401)$
Other Items Not for Current Operating UseUnrealized Gains / (Losses) (See FN6) (3,234,230) (410)$ Additions to Permanent Endowments (See FN7) 24,717 3 Subtotal (3,209,513)$ (407)$
Total Sources Over / (Under) Uses (See FN11) 7,531,858$ 954$
Texas Higher Education Coordinating Board 75 June, 2020

FY 2019
Operating SourcesEducational &
General DesignatedAuxiliary
EnterprisesRestricted Expendable Loan Funds
Annuity, Life & Endowment and
Similar FundsUnexpended
PlantRetirement of Indebtedness
Investment In Plant Primary University
State of TexasState Appropriations 41,881,595 - - - - - - - - 41,881,595 State Grants and Contracts - Restricted 25,393 44,352 - 5,914,798 - - - - - 5,984,543 Higher Education Fund 7,164,408 - - - - - - - - 7,164,408 Available University Fund Excellence (See FN8) - - - - - - - - - - Subtotal 49,071,396 44,352 - 5,914,798 - - - - - 55,030,546
Student & ParentTuition Potential 100% 31,073,106 37,662,257 - - - - - - - 68,735,363 Waivers - Statutory (Not Reported in AFR) (15,887,187) - - - - - - - - (15,887,187) Waivers - Institutional (Not Reported in AFR) - (65,599) - - - - - - - (65,599) Exemptions - Statutory (Not Reported in AFR) - - - - - - - - - - Exemptions - Institutional (Not Reported in AFR) - - - - - - - - - - Tuition - Gross - AFR Presentation 15,185,919 37,596,658 - - - - - - - 52,782,577 Waivers - Statutory (Reported in AFR) - - - - - - - - - - Waivers - Institutional (Reported in AFR) - - - - - - - - - - Exemptions - Statutory (Reported in AFR) (640,656) (2,324,952) - - - - - - - (2,965,608) Exemptions - Institutional (Reported in AFR) - - - - - - - - - - All Other Scholarship Disc.& Allow. (See FN1) (2,932,280) (6,520,772) - - - - - - - (9,453,052) Tuition - net 11,612,983 28,750,934 - - - - - - - 40,363,917
Fees Potential 100% 15,101 11,847,649 13,067,164 - - - - - - 24,929,914 Waivers - Statutory (Not Reported in AFR) - - - - - - - - - - Waivers - Institutional (Not Reported in AFR) - - - - - - - - - - Exemptions - Statutory (Not Reported in AFR) - - - - - - - - - - Exemptions - Institutional (Not Reported in AFR) - - - - - - - - - - Fees - Gross - AFR Presentation 15,101 11,847,649 13,067,164 - - - - - - 24,929,914 Waivers - Statutory (Reported in AFR) - - - - - - - - - - Waivers - Institutional (Reported in AFR) - - - - - - - - - - Exemptions - Statutory (Reported in AFR) - - (566,441) - - - - - - (566,441) Exemptions - Institutional (Reported in AFR) - - (469,082) - - - - - - (469,082) All Other Scholarship Disc.& Allow. (See FN1) (3,553) (2,787,509) (2,038,913) - - - - - - (4,829,975) Fees - net 11,548 9,060,140 9,992,728 - - - - - - 19,064,416
Net Tuition and Fees (Funds Collected) 11,624,531 37,811,074 9,992,728 - - - - - - 59,428,333
Federal GovernmentFederal Grants and Contracts - Restricted - 383,290 - 17,969,029 - - - - - 18,352,319
Institutional ResourcesEndowment and Interest Income (See FN2) 172,523 4,002,672 - 1,542,633 162,103 3,217 612,804 - - 6,495,952 Local Government Grants - Restricted - - - - - - - - - - Private Gifts and Grants - Restricted - 664,073 827,740 5,850,986 - - - - - 7,342,799 Sales and Services 51,409 8,916,924 - 1,296,741 - - - - - 10,265,074 Net Auxiliary Enterprises (See FN9) - - 15,168,882 - - - - - - 15,168,882 Other Income (See FN3) 48,765 1,981,440 1,028,948 1,115 56,956 32,430 2,512,629 - 2,464,992 8,127,275 Subtotal 272,697 15,565,109 17,025,570 8,691,475 219,059 35,647 3,125,433 - 2,464,992 47,399,982 Total Operating Sources 60,968,624 53,803,825 27,018,298 32,575,302 219,059 35,647 3,125,433 - 2,464,992 180,211,180
Operating UsesInstruction 30,982,826 10,778,084 - 463,731 - - - - - 42,224,641 Research 1,499,661 880,859 - 2,084,296 - - - - - 4,464,816 Public Service 1,155,878 1,159,772 - 1,806,747 - - - - - 4,122,397 Academic Support 5,237,784 5,810,337 - 3,668,383 - - - - - 14,716,504 Student Services 3,485,203 9,068,707 - 1,130,020 10,849 - - - - 13,694,779 Institutional Support 4,933,141 7,671,761 - 25,657 - - - - - 12,630,559 Operations and Maintenance of Plant 3,074,078 12,355,941 - 57,158 - - 5,472,711 - - 20,959,888 Scholarships and Fellowships 1,009,190 4,491,659 - 7,224,431 - - - - - 12,725,280 Auxiliary Enterprises (See FN9) - - 19,650,969 - - - - - - 19,650,969 Capital Outlay from Current Fund Sources* 1,333,412 106,676 90,780 248,254 - - - - - 1,779,122 Other Expenses (See FN3) - 326,767 - - - - - - 3,218,791 3,545,558 Total Operating Uses 52,711,173 52,650,563 19,741,749 16,708,677 10,849 - 5,472,711 - 3,218,791 150,514,513
Other Sources / (Uses) of FundsCapital Outlay from Non-Current Fund Sources** - - - - - - (2,280,428) - 4,059,551 1,779,123 Mandatory and Non-mandatory Transfers (See FN10) 2,046,906 8,184,429 1,241,815 (15,870,783) 117,136 725,372 5,958,737 - - 2,403,612 Bond Proceeds Transfers In (See FN4) - - - - - - - - - - Debt Service Payments (See FN5) (8,685,682) (7,838,891) (6,613,458) - - - - - - (23,138,031) Subtotal (6,638,776) 345,538 (5,371,643) (15,870,783) 117,136 725,372 3,678,309 - 4,059,551 (18,955,296)
Other Items Not for Current Operating UseUnrealized Gains / (Losses) (See FN6) (55,769) (2,518,386) 191,487 36,783 - (823,232) (65,113) - - (3,234,230) Additions to Permanent Endowments (See FN7) - - - - - 24,717 - - - 24,717 Subtotal (55,769) (2,518,386) 191,487 36,783 - (798,515) (65,113) - - (3,209,513)
Total Sources Over / (Under) Uses (See FN 11) 1,562,906 (1,019,586) 2,096,393 32,625 325,346 (37,496) 1,265,918 - 3,305,752 7,531,858
Bond Proceeds - - - - - - - - - - Depreciation Expense - - - - - - - - (19,381,377) (19,381,377) Transfer of Capital Asses(s) from System - - - - - - - - 64,185,063 64,185,063 Other Post-Employment Benefit (OPEB) Expense - - - - - - - - - - Non-Cash Capital Gifts - - - - - - - - 74,513 74,513 Capital Outlay 1,333,412 106,676 90,780 248,254 - - 2,280,429 - (4,059,551) - Change in Net Assets (Total Agrees with AFR***) 2,896,318 (912,910) 2,187,173 280,879 325,346 (37,496) 3,546,347 - 44,124,400 52,410,057
*Defined as any capital outlay expenses from Educational & General, Designated, Auxiliary, or Restricted Expendable Funds.**Defined as any capital outlay expense from funds other than Educational & General, Designated, Auxiliary, or Restricted Expendable.***As reported for "Changes in Net Position" shown on Schedule of Revenues, Expenses, and Changes in Net Position (SRECNP) in Annual Financial Report.
West Texas A&M UniversityFor the Year Ended August 31, 2019Source: FY 2019 Annual Financial Report
Detail Worksheet FY 2019
Texas Higher Education Coordinating Board 76 June, 2020

West Texas A&M UniversityFor the Year Ended August 31, 2019Source: FY 2019 Annual Financial Report
FOOTNOTES:
FN1: Scholarship Discounts and Allowances are scholarships, fellowships, and grants applied to tuition. The discount eliminates tuition revenues that are paid for by University resources which are recorded as revenue elsewhere on the financial statements (i.e. federal and state contracts and grants revenues). In addition, Scholarship Discounts and Allowances eliminate tuition revenue that is exempted from payment due to tuition exemptions approved by the Texas Legislature. Waivers, remissions, and exemptions represent tuition and fee dollars forgone by the university - some are required by statute. See the Integrated Financial Reporting System (IFRS) report submitted to THECB for details on waivers, exemptions, tuition, and fees. Allocation methods to individual funds shown may vary between institutions.
FN2: Endowment and Interest Income includes interest income and endowment payouts.
FN3: Other Income is primarily Other Operating and Other Non-operating Revenues from the AFR. Other Expenses is primarily Other Nonoperating Expenses from the AFR.
FN4: Bond Proceeds are funds received from the sale of bonds and commercial paper used to finance capital projects. This amount includes actual proceeds and accrued or anticipated proceeds to be transferred from System. Independent institutions report only to the extent expended in current year.
FN5: Debt service payments are payments to service and retire debt issued to fund capital projects. System components do this via transfers to System Administrations. Independent institutions use direct payment to appropriate paying agents.
FN6: Unrealized Gains / (Losses) represent the increase in the Fair Market Value of Investments and Endowments. Unrealized Gains / (Losses) are accrued as non-cash transactions. Therefore, funds are not actually received for this revenue stream. Accordingly, this revenue is not cash revenue and cannot be used by the University to fund operations.
FN7: Additions to Permanent Endowments are additions to endowment principal. This revenue is restricted for investment purposes only and cannot be used to fund operations. Only interest income from these endowments, which is reported on the Endowment and Investment Income line of this report, can be used by the University to fund operations.
FN8: Distributions from the Available University Fund appropriated through the Appropriation Bill are first used to pay debt service costs on Permanent University Fund Bonds. Funds remaining are distributed to constitutionally designated institutions to promote academic excellence. Only the Excellence funding is shown at the institution level. The AUF funds used to pay debt service on PUF bonds are reported at the System level.
FN9: Auxiliary Enterprises include athletics, housing and food, student services, and parking and transportation. Auxiliary Enterprises are required to be self-supporting, and therefore must operate on the funds they generate.
FN10: Mandatory and non-mandatory transfers includes transfers between funds, transfers between the University System and institutions and transfers to and from other state agencies. In total, all transfers between funds net to zero with the exception of any amounts transferred between the University System, between other institutions, or to and from another state agency. There are no transfers of education and general funds provided by the State of Texas to restricted or auxiliary fund groups. Transfers between education and general funds and designated funds are related to Texas Public Education Grant as provided by the State of Texas.
FN11: Of the net increase of $7,531,858 approximately $10.7 million represents revenues received but not yet expended. This income is fully committed to program expenditures and capital disbursements. The remaining $(3.2) million represents non-expendable funds from unrealized gains and additions to permanent endowments of approximately $(3.2) million and $25 thousand respectively. Unrealized gains and additions to permanent endowments do not contribute to the availability of the institution's operating cash as discussed in FN6 and FN7.
Texas Higher Education Coordinating Board 77 June, 2020
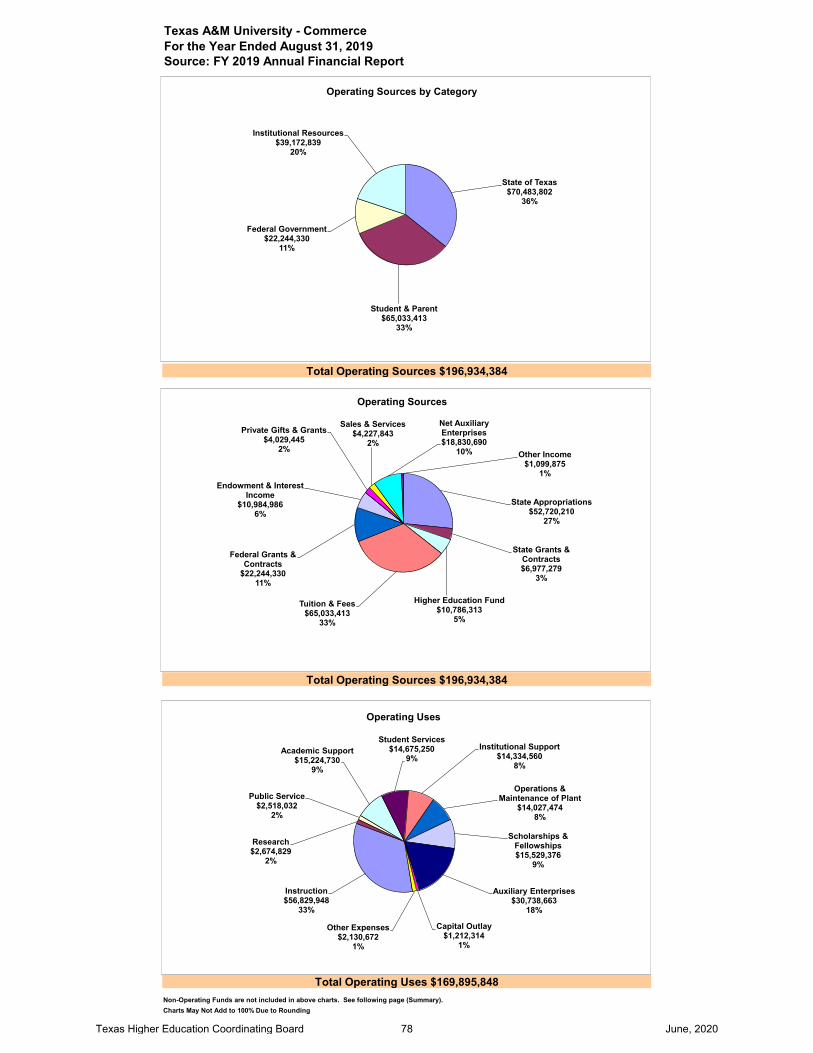
Texas A&M University - CommerceFor the Year Ended August 31, 2019Source: FY 2019 Annual Financial Report
Non-Operating Funds are not included in above charts. See following page (Summary).Charts May Not Add to 100% Due to Rounding
Total Operating Sources $196,934,384
Total Operating Sources $196,934,384
Total Operating Uses $169,895,848
State of Texas$70,483,802
36%
Student & Parent$65,033,413
33%
Federal Government$22,244,330
11%
Institutional Resources$39,172,839
20%
Operating Sources by Category
State Appropriations$52,720,210
27%
State Grants & Contracts$6,977,279
3%
Higher Education Fund$10,786,313
5%
Tuition & Fees$65,033,413
33%
Federal Grants & Contracts
$22,244,33011%
Endowment & Interest Income
$10,984,9866%
Private Gifts & Grants$4,029,445
2%
Sales & Services$4,227,843
2%
Net Auxiliary Enterprises$18,830,690
10% Other Income$1,099,875
1%
Operating Sources
Instruction$56,829,948
33%
Research$2,674,829
2%
Public Service$2,518,032
2%
Academic Support$15,224,730
9%
Student Services$14,675,250
9%Institutional Support
$14,334,5608%
Operations & Maintenance of Plant
$14,027,4748%
Scholarships & Fellowships$15,529,376
9%
Auxiliary Enterprises$30,738,663
18%
Capital Outlay$1,212,314
1%
Other Expenses$2,130,672
1%
Operating Uses
Texas Higher Education Coordinating Board 78 June, 2020

Texas A&M University - CommerceFor the Year Ended August 31, 2019Source: FY 2019 Annual Financial Report
Summary Worksheet FY 2019 Amount Per FTSEInstitution State Funded FTSEs 8,954.15
Operating SourcesState of TexasState Appropriations 52,720,210$ 5,888$ State Grants and Contracts - Restricted 6,977,279 779 Higher Education Fund 10,786,313 1,205 Available University Fund Excellence (See FN8) - - Subtotal 70,483,802$ 7,872$
Student & ParentTuition - net 33,100,490$ 3,697$ Fees - net 31,932,923 3,566 Tuition and Fees (net of Scholarship Discounts and Allowances) 65,033,413$ 7,263$
Federal GovernmentFederal Grants and Contracts - Restricted 22,244,330$ 2,484$
Institutional ResourcesEndowment and Interest Income (See FN2) 10,984,986$ 1,227$ Local Government Grants - Restricted - - Private Gifts and Grants - Restricted 4,029,445 450 Sales and Services 4,227,843 472 Net Auxiliary Enterprises (See FN9) 18,830,690 2,103 Other Income (See FN3) 1,099,875 123 Subtotal 39,172,839$ 4,375$ Total Operating Sources 196,934,384$ 21,994$
Operating UsesInstruction 56,829,948$ 6,347$ Research 2,674,829 299 Public Service 2,518,032 281 Academic Support 15,224,730 1,700 Student Services 14,675,250 1,639 Institutional Support 14,334,560 1,601 Operations and Maintenance of Plant 14,027,474 1,567 Scholarships and Fellowships 15,529,376 1,734 Auxiliary Enterprises (See FN9) 30,738,663 3,433 Capital Outlay from Current Fund Sources 1,212,314 135 Other Expenses (See FN3) 2,130,672 238 Total Operating Uses 169,895,848$ 18,974$
Other Sources / (Uses) of FundsCapital Outlay from Non-Current Fund Sources 1,212,314 135$ Mandatory and Non-mandatory Transfers (See FN10) 501,283 56 Bond Proceeds Transfers (See FN4) - - Debt Service Payments (See FN5) (13,064,500) (1,459) Subtotal (11,350,903)$ (1,268)$
Other Items Not for Current Operating UseUnrealized Gains / (Losses) (See FN6) (4,266,087) (476)$ Additions to Permanent Endowments (See FN7) - - Subtotal (4,266,087)$ (476)$
Total Sources Over / (Under) Uses (See FN11) 11,421,546$ 1,276$
Texas Higher Education Coordinating Board 79 June, 2020

FY 2019
Operating SourcesEducational &
General DesignatedAuxiliary
EnterprisesRestricted Expendable Loan Funds
Annuity, Life & Endowment and
Similar FundsUnexpended
PlantRetirement of Indebtedness
Investment In Plant Primary University
State of TexasState Appropriations 52,720,210 - - - - - - - - 52,720,210 State Grants and Contracts - Restricted 285,746 75,623 - 6,615,910 - - - - - 6,977,279 Higher Education Fund 10,786,313 - - - - - - - - 10,786,313 Available University Fund Excellence (See FN8) - - - - - - - - - - Subtotal 63,792,269 75,623 - 6,615,910 - - - - - 70,483,802
Student & ParentTuition Potential 100% 19,507,092 27,140,305 - - - - - - - 46,647,397 Waivers - Statutory (Not Reported in AFR) (2,025,046) - - - - - - - - (2,025,046) Waivers - Institutional (Not Reported in AFR) - - - - - - - - - - Exemptions - Statutory (Not Reported in AFR) - - - - - - - - - - Exemptions - Institutional (Not Reported in AFR) - - - - - - - - - - Tuition - Gross - AFR Presentation 17,482,046 27,140,305 - - - - - - - 44,622,351 Waivers - Statutory (Reported in AFR) - - - - - - - - - - Waivers - Institutional (Reported in AFR) - - - - - - - - - - Exemptions - Statutory (Reported in AFR) (850,646) (2,635,899) - - - - - - - (3,486,545) Exemptions - Institutional (Reported in AFR) - - - - - - - - - - All Other Scholarship Disc.& Allow. (See FN1) (3,663,363) (4,371,953) - - - - - - - (8,035,316) Tuition - net 12,968,037 20,132,453 - - - - - - - 33,100,490
Fees Potential 100% 342,829 27,325,930 16,702,887 - - - - - - 44,371,646 Waivers - Statutory (Not Reported in AFR) - (1,323,278) - - - - - - - (1,323,278) Waivers - Institutional (Not Reported in AFR) - - - - - - - - - - Exemptions - Statutory (Not Reported in AFR) - - - - - - - - - - Exemptions - Institutional (Not Reported in AFR) - - - - - - - - - - Fees - Gross - AFR Presentation 342,829 26,002,652 16,702,887 - - - - - - 43,048,368 Waivers - Statutory (Reported in AFR) - - - - - - - - - - Waivers - Institutional (Reported in AFR) - - - - - - - - - - Exemptions - Statutory (Reported in AFR) - - (642,217) - - - - - - (642,217) Exemptions - Institutional (Reported in AFR) - - - - - - - - - - All Other Scholarship Disc.& Allow. (See FN1) (88,521) (6,714,100) (3,670,607) - - - - - - (10,473,228) Fees - net 254,308 19,288,552 12,390,063 - - - - - - 31,932,923
Net Tuition and Fees (Funds Collected) 13,222,345 39,421,005 12,390,063 - - - - - - 65,033,413
Federal GovernmentFederal Grants and Contracts - Restricted - 345,220 - 21,899,110 - - - - - 22,244,330
Institutional ResourcesEndowment and Interest Income (See FN2) 93,719 10,159,337 671,033 35,446 23,858 - 1,593 - - 10,984,986 Local Government Grants - Restricted - - - - - - - - - - Private Gifts and Grants - Restricted - 421,662 - 3,567,060 - - 40,723 - - 4,029,445 Sales and Services 150,460 4,058,065 - 19,318 - - - - - 4,227,843 Net Auxiliary Enterprises (See FN9) - - 18,830,690 - - - - - - 18,830,690 Other Income (See FN3) 143,190 1,323,220 256,345 53,747 22,948 - - - (699,575) 1,099,875 Subtotal 387,369 15,962,284 19,758,068 3,675,571 46,806 - 42,316 - (699,575) 39,172,839 Total Operating Sources 77,401,983 55,804,132 32,148,131 32,190,591 46,806 - 42,316 - (699,575) 196,934,384
Operating UsesInstruction 49,026,254 7,471,516 - 332,178 - - - - - 56,829,948 Research 929,972 642,097 - 1,092,974 - - 9,786 - - 2,674,829 Public Service 970,098 1,051,662 - 496,272 - - - - - 2,518,032 Academic Support 6,679,612 8,291,066 - 254,052 - - - - - 15,224,730 Student Services 3,534,787 9,233,807 - 1,820,689 85,967 - - - - 14,675,250 Institutional Support 5,543,654 8,594,688 - 196,218 - - - - - 14,334,560 Operations and Maintenance of Plant 3,067,116 9,235,074 - 2,781 - - 1,722,503 - - 14,027,474 Scholarships and Fellowships 1,135,471 5,330,738 - 9,063,167 - - - - - 15,529,376 Auxiliary Enterprises (See FN9) - - 30,738,663 - - - - - - 30,738,663 Capital Outlay from Current Fund Sources* 948,618 52,142 96,957 114,597 - - - - - 1,212,314 Other Expenses (See FN3) - 1,663,024 - - 16,935 - - - 450,713 2,130,672 Total Operating Uses 71,835,582 51,565,814 30,835,620 13,372,928 102,902 - 1,732,289 - 450,713 169,895,848
Other Sources / (Uses) of FundsCapital Outlay from Non-Current Fund Sources** - - - - - - (9,522,398) - 10,734,712 1,212,314 Mandatory and Non-mandatory Transfers (See FN10) 200,032 55,627 7,860,252 (19,454,461) 187,509 30,041 11,622,283 - - 501,283 Bond Proceeds Transfers In (See FN4) - - - - - - - - - - Debt Service Payments (See FN5) (5,894,507) (710,759) (6,459,234) - - - - - - (13,064,500) Subtotal (5,694,475) (655,132) 1,401,018 (19,454,461) 187,509 30,041 2,099,885 - 10,734,712 (11,350,903)
Other Items Not for Current Operating UseUnrealized Gains / (Losses) (See FN6) (468,135) (2,134,611) (1,062,960) (1,254) (42,505) (42,592) (514,030) - - (4,266,087) Additions to Permanent Endowments (See FN7) - - - - - - - - - - Subtotal (468,135) (2,134,611) (1,062,960) (1,254) (42,505) (42,592) (514,030) - - (4,266,087)
Total Sources Over / (Under) Uses (See FN 11) (596,209) 1,448,575 1,650,569 (638,052) 88,908 (12,551) (104,118) - 9,584,424 11,421,546
Bond Proceeds - - - - - - - - - - Depreciation Expense - - - - - - - - (9,383,641) (9,383,641) Transfer of Capital Asses(s) from System - - - - - - - - - - Other Post-Employment Benefit (OPEB) Expense - - - - - - - - - - Non-Cash Capital Gifts - - - - - - - - 100,000 100,000 Capital Outlay 948,618 52,142 96,957 114,597 - - 9,522,398 - (10,734,712) - Change in Net Assets (Total Agrees with AFR***) 352,409 1,500,717 1,747,526 (523,455) 88,908 (12,551) 9,418,280 - (10,433,929) 2,137,905
*Defined as any capital outlay expenses from Educational & General, Designated, Auxiliary, or Restricted Expendable Funds.**Defined as any capital outlay expense from funds other than Educational & General, Designated, Auxiliary, or Restricted Expendable.***As reported for "Changes in Net Position" shown on Schedule of Revenues, Expenses, and Changes in Net Position (SRECNP) in Annual Financial Report.
Texas A&M University - CommerceFor the Year Ended August 31, 2019Source: FY 2019 Annual Financial Report
Detail Worksheet FY 2019
Texas Higher Education Coordinating Board 80 June, 2020

Texas A&M University - CommerceFor the Year Ended August 31, 2019Source: FY 2019 Annual Financial Report
FOOTNOTES:
FN1: Scholarship Discounts and Allowances are scholarships, fellowships, and grants applied to tuition. The discount eliminates tuition revenues that are paid for by University resources which are recorded as revenue elsewhere on the financial statements (i.e. federal and state contracts and grants revenues). In addition, Scholarship Discounts and Allowances eliminate tuition revenue that is exempted from payment due to tuition exemptions approved by the Texas Legislature. Waivers, remissions, and exemptions represent tuition and fee dollars forgone by the university - some are required by statute. See the Integrated Financial Reporting System (IFRS) report submitted to THECB for details on waivers, exemptions, tuition, and fees. Allocation methods to individual funds shown may vary between institutions.
FN2: Endowment and Interest Income includes interest income and endowment payouts.
FN3: Other Income is primarily Other Operating and Other Non-operating Revenues from the AFR. Other Expenses is primarily Other Nonoperating Expenses from the AFR.
FN4: Bond Proceeds are funds received from the sale of bonds and commercial paper used to finance capital projects. This amount includes actual proceeds and accrued or anticipated proceeds to be transferred from System. Independent institutions report only to the extent expended in current year.
FN5: Debt service payments are payments to service and retire debt issued to fund capital projects. System components do this via transfers to System Administrations. Independent institutions use direct payment to appropriate paying agents.
FN6: Unrealized Gains / (Losses) represent the increase in the Fair Market Value of Investments and Endowments. Unrealized Gains / (Losses) are accrued as non-cash transactions. Therefore, funds are not actually received for this revenue stream. Accordingly, this revenue is not cash revenue and cannot be used by the University to fund operations.
FN7: Additions to Permanent Endowments are additions to endowment principal. This revenue is restricted for investment purposes only and cannot be used to fund operations. Only interest income from these endowments, which is reported on the Endowment and Investment Income line of this report, can be used by the University to fund operations.
FN8: Distributions from the Available University Fund appropriated through the Appropriation Bill are first used to pay debt service costs on Permanent University Fund Bonds. Funds remaining are distributed to constitutionally designated institutions to promote academic excellence. Only the Excellence funding is shown at the institution level. The AUF funds used to pay debt service on PUF bonds are reported at the System level.
FN9: Auxiliary Enterprises include athletics, housing and food, student services, and parking and transportation. Auxiliary Enterprises are required to be self-supporting, and therefore must operate on the funds they generate.
FN10: Mandatory and non-mandatory transfers includes transfers between funds, transfers between the University System and institutions and transfers to and from other state agencies. In total, all transfers between funds net to zero with the exception of any amounts transferred between the University System, between other institutions, or to and from another state agency. There are no transfers of education and general funds provided by the State of Texas to restricted or auxiliary fund groups. Transfers between education and general funds and designated funds are related to Texas Public Education Grant as provided by the State of Texas.
FN11: Of the net increase of $11,421,546 approximately $15.7 million represents revenues received but not yet expended. This income is fully committed to program expenditures and capital disbursements. The remaining $(4.3) million represents non-expendable funds from unrealized gains and additions to permanent endowments of approximately $(4.3) million and $0 respectively. Unrealized gains and additions to permanent endowments do not contribute to the availability of the institution's operating cash as discussed in FN6 and FN7.
Texas Higher Education Coordinating Board 81 June, 2020

Texas A&M University - TexarkanaFor the Year Ended August 31, 2019Source: FY 2019 Annual Financial Report
Non-Operating Funds are not included in above charts. See following page (Summary).Charts May Not Add to 100% Due to Rounding
Total Operating Sources $46,583,144
Total Operating Sources $46,583,144
Total Operating Uses $39,422,037
State of Texas$26,324,601
56%
Student & Parent$10,958,889
24%
Federal Government$5,288,765
11%
Institutional Resources$4,010,889
9%
Operating Sources by Category
State Appropriations$23,397,390
50%
State Grants & Contracts$1,103,328
2%
Higher Education Fund$1,823,883
4%
Tuition & Fees$10,958,889
24%
Federal Grants & Contracts$5,288,765
11%
Endowment & Interest Income
$1,509,2493%
Private Gifts & Grants$333,238
1%
Sales & Services$544,090
1%
Net Auxiliary Enterprises$1,253,726
3% Other Income$370,586
1%
Operating Sources
Instruction$13,708,393
35%
Research$5,749
0%
Public Service$16,528
0%
Academic Support$4,765,440
12%
Student Services$4,190,683
11% Institutional Support$5,058,106
13%
Operations & Maintenance of Plant
$2,192,9435%
Scholarships & Fellowships$3,494,155…
Auxiliary Enterprises$2,292,624
6%Capital Outlay$1,393,842
3%
Other Expenses$2,303,574
6%
Operating Uses
Texas Higher Education Coordinating Board 82 June, 2020

Texas A&M University - TexarkanaFor the Year Ended August 31, 2019Source: FY 2019 Annual Financial Report
Summary Worksheet FY 2019 Amount Per FTSEInstitution State Funded FTSEs 1,615.38
Operating SourcesState of TexasState Appropriations 23,397,390$ 14,484$ State Grants and Contracts - Restricted 1,103,328 683 Higher Education Fund 1,823,883 1,129 Available University Fund Excellence (See FN8) - - Subtotal 26,324,601$ 16,296$
Student & ParentTuition - net 7,500,027$ 4,643$ Fees - net 3,458,862 2,141 Tuition and Fees (net of Scholarship Discounts and Allowances) 10,958,889$ 6,784$
Federal GovernmentFederal Grants and Contracts - Restricted 5,288,765$ 3,274$
Institutional ResourcesEndowment and Interest Income (See FN2) 1,509,249$ 934$ Local Government Grants - Restricted - - Private Gifts and Grants - Restricted 333,238 206 Sales and Services 544,090 337 Net Auxiliary Enterprises (See FN9) 1,253,726 776 Other Income (See FN3) 370,586 229 Subtotal 4,010,889$ 2,482$ Total Operating Sources 46,583,144$ 28,836$
Operating UsesInstruction 13,708,393$ 8,486$ Research 5,749 4 Public Service 16,528 10 Academic Support 4,765,440 2,950 Student Services 4,190,683 2,594 Institutional Support 5,058,106 3,131 Operations and Maintenance of Plant 2,192,943 1,358 Scholarships and Fellowships 3,494,155 2,163 Auxiliary Enterprises (See FN9) 2,292,624 1,419 Capital Outlay from Current Fund Sources 1,393,842 863 Other Expenses (See FN3) 2,303,574 1,426 Total Operating Uses 39,422,037$ 24,404$
Other Sources / (Uses) of FundsCapital Outlay from Non-Current Fund Sources 1,393,842 863$ Mandatory and Non-mandatory Transfers (See FN10) 553,801 343 Bond Proceeds Transfers (See FN4) - - Debt Service Payments (See FN5) (8,807,901) (5,453) Subtotal (6,860,258)$ (4,247)$
Other Items Not for Current Operating UseUnrealized Gains / (Losses) (See FN6) (569,201) (352)$ Additions to Permanent Endowments (See FN7) 281,399 174 Subtotal (287,802)$ (178)$
Total Sources Over / (Under) Uses (See FN11) 13,047$ 7$
Texas Higher Education Coordinating Board 83 June, 2020

FY 2019
Operating SourcesEducational &
General DesignatedAuxiliary
EnterprisesRestricted Expendable Loan Funds
Annuity, Life & Endowment and
Similar FundsUnexpended
PlantRetirement of Indebtedness
Investment In Plant Primary University
State of TexasState Appropriations 23,397,390 - - - - - - - - 23,397,390 State Grants and Contracts - Restricted 1,080,373 14,331 - 8,624 - - - - - 1,103,328 Higher Education Fund 1,823,883 - - - - - - - - 1,823,883 Available University Fund Excellence (See FN8) - - - - - - - - - - Subtotal 26,301,646 14,331 - 8,624 - - - - - 26,324,601
Student & ParentTuition Potential 100% 6,824,445 7,647,409 - - - - - - - 14,471,854 Waivers - Statutory (Not Reported in AFR) (4,312,330) - - - - - - - - (4,312,330) Waivers - Institutional (Not Reported in AFR) - - - - - - - - - - Exemptions - Statutory (Not Reported in AFR) - - - - - - - - - - Exemptions - Institutional (Not Reported in AFR) - - - - - - - - - - Tuition - Gross - AFR Presentation 2,512,115 7,647,409 - - - - - - - 10,159,524 Waivers - Statutory (Reported in AFR) - - - - - - - - - - Waivers - Institutional (Reported in AFR) - - - - - - - - - - Exemptions - Statutory (Reported in AFR) (119,419) (359,860) - - - - - - - (479,279) Exemptions - Institutional (Reported in AFR) - - - - - - - - - - All Other Scholarship Disc.& Allow. (See FN1) (538,187) (1,642,031) - - - - - - - (2,180,218) Tuition - net 1,854,509 5,645,518 - - - - - - - 7,500,027
Fees Potential 100% 62 3,822,896 862,410 - - - - - - 4,685,368 Waivers - Statutory (Not Reported in AFR) - - - - - - - - - - Waivers - Institutional (Not Reported in AFR) - - - - - - - - - - Exemptions - Statutory (Not Reported in AFR) - - - - - - - - - - Exemptions - Institutional (Not Reported in AFR) - - - - - - - - - - Fees - Gross - AFR Presentation 62 3,822,896 862,410 - - - - - - 4,685,368 Waivers - Statutory (Reported in AFR) - - - - - - - - - - Waivers - Institutional (Reported in AFR) - - - - - - - - - - Exemptions - Statutory (Reported in AFR) - (181,039) (42,148) - - - - - - (223,187) Exemptions - Institutional (Reported in AFR) - - - - - - - - - - All Other Scholarship Disc.& Allow. (See FN1) (16) (819,695) (183,608) - - - - - - (1,003,319) Fees - net 46 2,822,162 636,654 - - - - - - 3,458,862
Net Tuition and Fees (Funds Collected) 1,854,555 8,467,680 636,654 - - - - - - 10,958,889
Federal GovernmentFederal Grants and Contracts - Restricted - 16,731 - 5,272,034 - - - - - 5,288,765
Institutional ResourcesEndowment and Interest Income (See FN2) 87,562 1,131,675 55,622 232,289 - 2,101 - - - 1,509,249 Local Government Grants - Restricted - - - - - - - - - - Private Gifts and Grants - Restricted - 11,500 2,013 319,725 - - - - - 333,238 Sales and Services - 409,937 - 134,153 - - - - - 544,090 Net Auxiliary Enterprises (See FN9) - - 1,253,726 - - - - - - 1,253,726 Other Income (See FN3) - 60,520 15,779 638 1,800 291,849 - - - 370,586 Subtotal 87,562 1,613,632 1,327,140 686,805 1,800 293,950 - - - 4,010,889 Total Operating Sources 28,243,763 10,112,374 1,963,794 5,967,463 1,800 293,950 - - - 46,583,144
Operating UsesInstruction 9,713,122 3,896,485 - 98,786 - - - - - 13,708,393 Research 1,132 4,617 - - - - - - - 5,749 Public Service - - - 16,528 - - - - - 16,528 Academic Support 3,358,214 1,003,975 - 403,251 - - - - - 4,765,440 Student Services 2,141,732 1,656,420 - 486,007 (93,476) - - - - 4,190,683 Institutional Support 2,922,445 2,121,986 - 13,675 - - - - - 5,058,106 Operations and Maintenance of Plant 476,396 1,716,547 - - - - - - - 2,192,943 Scholarships and Fellowships 647,742 784,569 - 2,061,844 - - - - - 3,494,155 Auxiliary Enterprises (See FN9) - - 2,292,624 - - - - - - 2,292,624 Capital Outlay from Current Fund Sources* 2,327,125 (1,865,979) 27,597 905,099 - - - - - 1,393,842 Other Expenses (See FN3) - 65,240 - 405,873 - - - - 1,832,461 2,303,574 Total Operating Uses 21,587,908 9,383,860 2,320,221 4,391,063 (93,476) - - - 1,832,461 39,422,037
Other Sources / (Uses) of FundsCapital Outlay from Non-Current Fund Sources** - - - - - - (57) - 1,393,899 1,393,842 Mandatory and Non-mandatory Transfers (See FN10) (504,896) 2,099,913 1,331,337 (2,529,964) 31,220 159,752 (33,561) - - 553,801 Bond Proceeds Transfers In (See FN4) - - - - - - - - - - Debt Service Payments (See FN5) (7,908,401) - (899,500) - - - - - - (8,807,901) Subtotal (8,413,297) 2,099,913 431,837 (2,529,964) 31,220 159,752 (33,618) - 1,393,899 (6,860,258)
Other Items Not for Current Operating UseUnrealized Gains / (Losses) (See FN6) - (277,865) (68,195) (112,594) - (110,547) - - - (569,201) Additions to Permanent Endowments (See FN7) - - - - - 281,399 - - - 281,399 Subtotal - (277,865) (68,195) (112,594) - 170,852 - - - (287,802)
Total Sources Over / (Under) Uses (See FN 11) (1,757,442) 2,550,562 7,215 (1,066,158) 126,496 624,554 (33,618) - (438,562) 13,047
Bond Proceeds - - - - - - - - - - Depreciation Expense - - - - - - - - (8,031,048) (8,031,048) Transfer of Capital Asses(s) from System - - - - - - - - 28,192,220 28,192,220 Other Post-Employment Benefit (OPEB) Expense - - - - - - - - - - Non-Cash Capital Gifts - - - - - - - - - - Capital Outlay 2,327,125 (1,865,979) 27,597 905,099 - - 57 - (1,393,899) - Change in Net Assets (Total Agrees with AFR***) 569,683 684,583 34,812 (161,059) 126,496 624,554 (33,561) - 18,328,711 20,174,219
*Defined as any capital outlay expenses from Educational & General, Designated, Auxiliary, or Restricted Expendable Funds.**Defined as any capital outlay expense from funds other than Educational & General, Designated, Auxiliary, or Restricted Expendable.***As reported for "Changes in Net Position" shown on Schedule of Revenues, Expenses, and Changes in Net Position (SRECNP) in Annual Financial Report.
Texas A&M University - TexarkanaFor the Year Ended August 31, 2019Source: FY 2019 Annual Financial Report
Detail Worksheet FY 2019
Texas Higher Education Coordinating Board 84 June, 2020

Texas A&M University - TexarkanaFor the Year Ended August 31, 2019Source: FY 2019 Annual Financial Report
FOOTNOTES:
FN1: Scholarship Discounts and Allowances are scholarships, fellowships, and grants applied to tuition. The discount eliminates tuition revenues that are paid for by University resources which are recorded as revenue elsewhere on the financial statements (i.e. federal and state contracts and grants revenues). In addition, Scholarship Discounts and Allowances eliminate tuition revenue that is exempted from payment due to tuition exemptions approved by the Texas Legislature. Waivers, remissions, and exemptions represent tuition and fee dollars forgone by the university - some are required by statute. See the Integrated Financial Reporting System (IFRS) report submitted to THECB for details on waivers, exemptions, tuition, and fees. Allocation methods to individual funds shown may vary between institutions.
FN2: Endowment and Interest Income includes interest income and endowment payouts.
FN3: Other Income is primarily Other Operating and Other Non-operating Revenues from the AFR. Other Expenses is primarily Other Nonoperating Expenses from the AFR.
FN4: Bond Proceeds are funds received from the sale of bonds and commercial paper used to finance capital projects. This amount includes actual proceeds and accrued or anticipated proceeds to be transferred from System. Independent institutions report only to the extent expended in current year.
FN5: Debt service payments are payments to service and retire debt issued to fund capital projects. System components do this via transfers to System Administrations. Independent institutions use direct payment to appropriate paying agents.
FN6: Unrealized Gains / (Losses) represent the increase in the Fair Market Value of Investments and Endowments. Unrealized Gains / (Losses) are accrued as non-cash transactions. Therefore, funds are not actually received for this revenue stream. Accordingly, this revenue is not cash revenue and cannot be used by the University to fund operations.
FN7: Additions to Permanent Endowments are additions to endowment principal. This revenue is restricted for investment purposes only and cannot be used to fund operations. Only interest income from these endowments, which is reported on the Endowment and Investment Income line of this report, can be used by the University to fund operations.
FN8: Distributions from the Available University Fund appropriated through the Appropriation Bill are first used to pay debt service costs on Permanent University Fund Bonds. Funds remaining are distributed to constitutionally designated institutions to promote academic excellence. Only the Excellence funding is shown at the institution level. The AUF funds used to pay debt service on PUF bonds are reported at the System level.
FN9: Auxiliary Enterprises include athletics, housing and food, student services, and parking and transportation. Auxiliary Enterprises are required to be self-supporting, and therefore must operate on the funds they generate.
FN10: Mandatory and non-mandatory transfers includes transfers between funds, transfers between the University System and institutions and transfers to and from other state agencies. In total, all transfers between funds net to zero with the exception of any amounts transferred between the University System, between other institutions, or to and from another state agency. There are no transfers of education and general funds provided by the State of Texas to restricted or auxiliary fund groups. Transfers between education and general funds and designated funds are related to Texas Public Education Grant as provided by the State of Texas.
FN11: Of the net increase of $13,047 approximately $301 thousand represents revenues received but not yet expended. This income is fully committed to program expenditures and capital disbursements. The remaining $(288) thousand represents non-expendable funds from unrealized gains and additions to permanent endowments of approximately $(569) thousand and $281 thousand respectively. Unrealized gains and additions to permanent endowments do not contribute to the availability of the institution's operating cash as discussed in FN6 and FN7.
Texas Higher Education Coordinating Board 85 June, 2020

Texas A&M University - Central TexasFor the Year Ended August 31, 2019Source: FY 2019 Annual Financial Report
Non-Operating Funds are not included in above charts. See following page (Summary).Charts May Not Add to 100% Due to Rounding
Total Operating Uses $32,630,372
Total Operating Sources $38,532,389
Total Operating Sources $38,532,389
State of Texas$19,054,453
49%
Student & Parent$11,985,917
31%
Federal Government$5,209,129
14%
Institutional Resources$2,282,890
6%
Operating Sources by Category
State Appropriations$18,594,542
48%
State Grants & Contracts$459,911
1%
Tuition & Fees$11,985,917
31%
Federal Grants & Contracts$5,209,129
14%
Endowment & Interest Income
$899,7073%
Private Gifts & Grants$806,328
2%
Sales & Services$350,815
1%
Net Auxiliary Enterprises
$115,7340%
Other Income$110,306
0%
Operating Sources
Instruction$10,372,204
31%
Research$791,977
2%
Public Service$22,140
0%
Academic Support$6,185,420
18%Student Services
$5,153,49115%
Institutional Support$3,753,934
11%
Operations & Maintenance of Plant
$2,127,0706%
Scholarships & Fellowships$4,339,610
13%
Auxiliary Enterprises$169,045
1%Capital Outlay
$234,2571%
Other Expenses-$518,776
-2%
Operating Uses
Texas Higher Education Coordinating Board 86 June, 2020

Texas A&M University - Central TexasFor the Year Ended August 31, 2019Source: FY 2019 Annual Financial Report
Summary Worksheet FY 2019 Amount Per FTSEInstitution State Funded FTSEs 1,663.82
Operating SourcesState of TexasState Appropriations 18,594,542$ 11,176$ State Grants and Contracts - Restricted 459,911 276 Higher Education Fund - - Available University Fund Excellence (See FN8) - - Subtotal 19,054,453$ 11,452$
Student & ParentTuition - net 7,143,803$ 4,294$ Fees - net 4,842,114 2,910 Tuition and Fees (net of Scholarship Discounts and Allowances) 11,985,917$ 7,204$
Federal GovernmentFederal Grants and Contracts - Restricted 5,209,129$ 3,131$
Institutional ResourcesEndowment and Interest Income (See FN2) 899,707$ 541$ Local Government Grants - Restricted - - Private Gifts and Grants - Restricted 806,328 485 Sales and Services 350,815 211 Net Auxiliary Enterprises (See FN9) 115,734 70 Other Income (See FN3) 110,306 66 Subtotal 2,282,890$ 1,373$ Total Operating Sources 38,532,389$ 23,160$
Operating UsesInstruction 10,372,204$ 6,234$ Research 791,977 476 Public Service 22,140 13 Academic Support 6,185,420 3,718 Student Services 5,153,491 3,097 Institutional Support 3,753,934 2,256 Operations and Maintenance of Plant 2,127,070 1,278 Scholarships and Fellowships 4,339,610 2,608 Auxiliary Enterprises (See FN9) 169,045 102 Capital Outlay from Current Fund Sources 234,257 141 Other Expenses (See FN3) (518,776) (312) Total Operating Uses 32,630,372$ 19,611$
Other Sources / (Uses) of FundsCapital Outlay from Non-Current Fund Sources 234,257 141$ Mandatory and Non-mandatory Transfers (See FN10) 2,102,406 1,264 Bond Proceeds Transfers (See FN4) - - Debt Service Payments (See FN5) (4,534,730) (2,725) Subtotal (2,198,067)$ (1,320)$
Other Items Not for Current Operating UseUnrealized Gains / (Losses) (See FN6) (182,160) (109)$ Additions to Permanent Endowments (See FN7) - - Subtotal (182,160)$ (109)$
Total Sources Over / (Under) Uses (See FN11) 3,521,790$ 2,120$
Texas Higher Education Coordinating Board 87 June, 2020

FY 2019
Operating SourcesEducational &
General DesignatedAuxiliary
EnterprisesRestricted Expendable Loan Funds
Annuity, Life & Endowment and
Similar FundsUnexpended
PlantRetirement of Indebtedness
Investment In Plant Primary University
State of TexasState Appropriations 18,594,542 - - - - - - - - 18,594,542 State Grants and Contracts - Restricted 441,447 18,464 - - - - - - - 459,911 Higher Education Fund - - - - - - - - - - Available University Fund Excellence (See FN8) - - - - - - - - - - Subtotal 19,035,989 18,464 - - - - - - - 19,054,453
Student & ParentTuition Potential 100% 4,080,742 6,672,781 - - - - - - - 10,753,523 Waivers - Statutory (Not Reported in AFR) (1,239,823) - - - - - - - - (1,239,823) Waivers - Institutional (Not Reported in AFR) - - - - - - - - - - Exemptions - Statutory (Not Reported in AFR) - - - - - - - - - - Exemptions - Institutional (Not Reported in AFR) - - - - - - - - - - Tuition - Gross - AFR Presentation 2,840,919 6,672,781 - - - - - - - 9,513,700 Waivers - Statutory (Reported in AFR) - - - - - - - - - - Waivers - Institutional (Reported in AFR) - - - - - - - - - - Exemptions - Statutory (Reported in AFR) (246,016) (618,136) - - - - - - - (864,152) Exemptions - Institutional (Reported in AFR) - - - - - - - - - - All Other Scholarship Disc.& Allow. (See FN1) (461,667) (1,044,078) - - - - - - - (1,505,745) Tuition - net 2,133,236 5,010,567 - - - - - - - 7,143,803
Fees Potential 100% 39,863 6,406,038 - 1,910 - - - - - 6,447,811 Waivers - Statutory (Not Reported in AFR) - - - - - - - - - - Waivers - Institutional (Not Reported in AFR) - - - - - - - - - - Exemptions - Statutory (Not Reported in AFR) - - - - - - - - - - Exemptions - Institutional (Not Reported in AFR) - - - - - - - - - - Fees - Gross - AFR Presentation 39,863 6,406,038 - 1,910 - - - - - 6,447,811 Waivers - Statutory (Reported in AFR) - - - - - - - - - - Waivers - Institutional (Reported in AFR) - - - - - - - - - - Exemptions - Statutory (Reported in AFR) (1,055) (532,318) (9,660) - - - - - - (543,033) Exemptions - Institutional (Reported in AFR) - - - - - - - - - - All Other Scholarship Disc.& Allow. (See FN1) (8,875) (1,053,789) - - - - - - - (1,062,664) Fees - net 29,933 4,819,931 (9,660) 1,910 - - - - - 4,842,114
Net Tuition and Fees (Funds Collected) 2,163,169 9,830,498 (9,660) 1,910 - - - - - 11,985,917
Federal GovernmentFederal Grants and Contracts - Restricted - 6,360 - 5,202,769 - - - - - 5,209,129
Institutional ResourcesEndowment and Interest Income (See FN2) 64,865 826,089 - 8,753 - - - - - 899,707 Local Government Grants - Restricted - - - - - - - - - - Private Gifts and Grants - Restricted - 693,525 - 112,803 - - - - - 806,328 Sales and Services - 200,712 - 150,103 - - - - - 350,815 Net Auxiliary Enterprises (See FN9) - - 115,734 - - - - - - 115,734 Other Income (See FN3) - 82,949 4,640 17,895 4,822 - - - - 110,306 Subtotal 64,865 1,803,275 120,374 289,554 4,822 - - - - 2,282,890 Total Operating Sources 21,264,023 11,658,597 110,714 5,494,233 4,822 - - - - 38,532,389
Operating UsesInstruction 7,348,636 3,023,568 - - - - - - - 10,372,204 Research 294,909 208,343 - 288,725 - - - - - 791,977 Public Service - 22,140 - - - - - - - 22,140 Academic Support 2,683,046 3,498,848 - 3,526 - - - - - 6,185,420 Student Services 1,835,181 3,183,304 - 131,950 3,056 - - - - 5,153,491 Institutional Support 2,200,552 1,510,019 - 43,363 - - - - - 3,753,934 Operations and Maintenance of Plant 1,789,517 337,553 - - - - - - - 2,127,070 Scholarships and Fellowships 505,064 1,671,463 - 2,163,083 - - - - - 4,339,610 Auxiliary Enterprises (See FN9) - - 169,045 - - - - - - 169,045 Capital Outlay from Current Fund Sources* 138,145 73,305 - 22,807 - - - - - 234,257 Other Expenses (See FN3) - (1,515,673) - - - - - - 996,897 (518,776) Total Operating Uses 16,795,050 12,012,870 169,045 2,653,454 3,056 - - - 996,897 32,630,372
Other Sources / (Uses) of FundsCapital Outlay from Non-Current Fund Sources** - - - - - - - - 234,257 234,257 Mandatory and Non-mandatory Transfers (See FN10) 103,929 4,964,617 - (3,008,780) 34,514 8,126 - - - 2,102,406 Bond Proceeds Transfers In (See FN4) - - - - - - - - - - Debt Service Payments (See FN5) (4,534,730) - - - - - - - - (4,534,730) Subtotal (4,430,801) 4,964,617 - (3,008,780) 34,514 8,126 - - 234,257 (2,198,067)
Other Items Not for Current Operating UseUnrealized Gains / (Losses) (See FN6) 5,095 (170,908) - - - (16,347) - - - (182,160) Additions to Permanent Endowments (See FN7) - - - - - - - - - - Subtotal 5,095 (170,908) - - - (16,347) - - - (182,160)
Total Sources Over / (Under) Uses (See FN 11) 43,267 4,439,436 (58,331) (168,001) 36,280 (8,221) - - (762,640) 3,521,790
Bond Proceeds - - - - - - - - - - Depreciation Expense - - - - - - - - (5,579,041) (5,579,041) Transfer of Capital Asses(s) from System - - - - - - - - 33,337,316 33,337,316 Other Post-Employment Benefit (OPEB) Expense - - - - - - - - - - Non-Cash Capital Gifts - - - - - - - - 5,837 5,837 Capital Outlay 138,145 73,305 - 22,807 - - - - (234,257) - Change in Net Assets (Total Agrees with AFR***) 181,412 4,512,741 (58,331) (145,194) 36,280 (8,221) - - 26,767,215 31,285,902
*Defined as any capital outlay expenses from Educational & General, Designated, Auxiliary, or Restricted Expendable Funds.**Defined as any capital outlay expense from funds other than Educational & General, Designated, Auxiliary, or Restricted Expendable.***As reported for "Changes in Net Position" shown on Schedule of Revenues, Expenses, and Changes in Net Position (SRECNP) in Annual Financial Report.
Detail Worksheet FY 2019
Texas A&M University - Central TexasFor the Year Ended August 31, 2019Source: FY 2019 Annual Financial Report
Texas Higher Education Coordinating Board 88 June, 2020

Texas A&M University - Central TexasFor the Year Ended August 31, 2019Source: FY 2019 Annual Financial Report
FOOTNOTES:
FN1: Scholarship Discounts and Allowances are scholarships, fellowships, and grants applied to tuition. The discount eliminates tuition revenues that are paid for by University resources which are recorded as revenue elsewhere on the financial statements (i.e. federal and state contracts and grants revenues). In addition, Scholarship Discounts and Allowances eliminate tuition revenue that is exempted from payment due to tuition exemptions approved by the Texas Legislature. Waivers, remissions, and exemptions represent tuition and fee dollars forgone by the university - some are required by statute. See the Integrated Financial Reporting System (IFRS) report submitted to THECB for details on waivers, exemptions, tuition, and fees. Allocation methods to individual funds shown may vary between institutions.
FN2: Endowment and Interest Income includes interest income and endowment payouts.
FN3: Other Income is primarily Other Operating and Other Non-operating Revenues from the AFR. Other Expenses is primarily Other Nonoperating Expenses from the AFR.
FN4: Bond Proceeds are funds received from the sale of bonds and commercial paper used to finance capital projects. This amount includes actual proceeds and accrued or anticipated proceeds to be transferred from System. Independent institutions report only to the extent expended in current year.
FN5: Debt service payments are payments to service and retire debt issued to fund capital projects. System components do this via transfers to System Administrations. Independent institutions use direct payment to appropriate paying agents.
FN6: Unrealized Gains / (Losses) represent the increase in the Fair Market Value of Investments and Endowments. Unrealized Gains / (Losses) are accrued as non-cash transactions. Therefore, funds are not actually received for this revenue stream. Accordingly, this revenue is not cash revenue and cannot be used by the University to fund operations.
FN7: Additions to Permanent Endowments are additions to endowment principal. This revenue is restricted for investment purposes only and cannot be used to fund operations. Only interest income from these endowments, which is reported on the Endowment and Investment Income line of this report, can be used by the University to fund operations.
FN8: Distributions from the Available University Fund appropriated through the Appropriation Bill are first used to pay debt service costs on Permanent University Fund Bonds. Funds remaining are distributed to constitutionally designated institutions to promote academic excellence. Only the Excellence funding is shown at the institution level. The AUF funds used to pay debt service on PUF bonds are reported at the System level.
FN9: Auxiliary Enterprises include athletics, housing and food, student services, and parking and transportation. Auxiliary Enterprises are required to be self-supporting, and therefore must operate on the funds they generate.
FN10: Mandatory and non-mandatory transfers includes transfers between funds, transfers between the University System and institutions and transfers to and from other state agencies. In total, all transfers between funds net to zero with the exception of any amounts transferred between the University System, between other institutions, or to and from another state agency. There are no transfers of education and general funds provided by the State of Texas to restricted or auxiliary fund groups. Transfers between education and general funds and designated funds are related to Texas Public Education Grant as provided by the State of Texas.
FN11: Of the net increase of $3,521,790 approximately $3.7 million represents revenues received but not yet expended. This income is fully committed to program expenditures and capital disbursements. The remaining $(182) thousand represents non-expendable funds from unrealized gains and additions to permanent endowments of approximately $(182) thousand and $0 respectively. Unrealized gains and additions to permanent endowments do not contribute to the availability of the institution's operating cash as discussed in FN6 and FN7.
Texas Higher Education Coordinating Board 89 June, 2020

Texas A&M University - San AntonioFor the Year Ended August 31, 2019Source: FY 2019 Annual Financial Report
Non-Operating Funds are not included in above charts. See following page (Summary).Charts May Not Add to 100% Due to Rounding
Total Operating Uses $85,340,799
Total Operating Sources $86,606,172
Total Operating Sources $86,606,172
State of Texas$34,873,664
40%
Student & Parent$30,299,366
35%
Federal Government$15,039,450
17%
Institutional Resources$6,393,692
8%
Operating Sources by Category
State Appropriations$32,602,129
38%
State Grants & Contracts$2,271,535
3%
Tuition & Fees$30,299,366
35%
Federal Grants & Contracts
$15,039,45017%
Endowment & Interest Income
$2,509,8553%
Private Gifts & Grants$2,577,698
3%
Sales & Services$540,196
1%
Net Auxiliary Enterprises
$530,5120%
Other Income$235,431
0%
Operating Sources
Instruction$25,643,512
30%
Research$305,450
0%
Public Service$344,442
0%
Academic Support$8,102,961
10%
Student Services$15,735,569
18%Institutional Support
$9,492,08011%
Operations & Maintenance of Plant
$8,744,13810%
Scholarships & Fellowships$10,966,796
13%
Auxiliary Enterprises$388,563
1%Capital Outlay
$1,542,8432%
Other Expenses$4,074,445
5%
Operating Uses
Texas Higher Education Coordinating Board 90 June, 2020

Texas A&M University - San AntonioFor the Year Ended August 31, 2019Source: FY 2019 Annual Financial Report
Summary Worksheet FY 2019 Amount Per FTSEInstitution State Funded FTSEs 4,836.09
Operating SourcesState of TexasState Appropriations 32,602,129$ 6,741$ State Grants and Contracts - Restricted 2,271,535 470 Higher Education Fund - - Available University Fund Excellence (See FN8) - - Subtotal 34,873,664$ 7,211$
Student & ParentTuition - net 14,892,323$ 3,079$ Fees - net 15,407,043 3,186 Tuition and Fees (net of Scholarship Discounts and Allowances) 30,299,366$ 6,265$
Federal GovernmentFederal Grants and Contracts - Restricted 15,039,450$ 3,110$
Institutional ResourcesEndowment and Interest Income (See FN2) 2,509,855$ 519$ Local Government Grants - Restricted - - Private Gifts and Grants - Restricted 2,577,698 533 Sales and Services 540,196 112 Net Auxiliary Enterprises (See FN9) 530,512 110 Other Income (See FN3) 235,431 49 Subtotal 6,393,692$ 1,323$ Total Operating Sources 86,606,172$ 17,909$
Operating UsesInstruction 25,643,512$ 5,303$ Research 305,450 63 Public Service 344,442 71 Academic Support 8,102,961 1,676 Student Services 15,735,569 3,254 Institutional Support 9,492,080 1,963 Operations and Maintenance of Plant 8,744,138 1,808 Scholarships and Fellowships 10,966,796 2,268 Auxiliary Enterprises (See FN9) 388,563 80 Capital Outlay from Current Fund Sources 1,542,843 319 Other Expenses (See FN3) 4,074,445 843 Total Operating Uses 85,340,799$ 17,648$
Other Sources / (Uses) of FundsCapital Outlay from Non-Current Fund Sources 1,542,843 319$ Mandatory and Non-mandatory Transfers (See FN10) 2,597,348 537 Bond Proceeds Transfers (See FN4) - - Debt Service Payments (See FN5) (7,950,236) (1,644) Subtotal (3,810,045)$ (788)$
Other Items Not for Current Operating UseUnrealized Gains / (Losses) (See FN6) (428,399) (89)$ Additions to Permanent Endowments (See FN7) - - Subtotal (428,399)$ (89)$
Total Sources Over / (Under) Uses (See FN11) (2,973,071)$ (616)$
Texas Higher Education Coordinating Board 91 June, 2020

FY 2019
Operating SourcesEducational &
General DesignatedAuxiliary
EnterprisesRestricted Expendable Loan Funds
Annuity, Life & Endowment and
Similar FundsUnexpended
PlantRetirement of Indebtedness
Investment In Plant Primary University
State of TexasState Appropriations 32,602,129 - - - - - - - - 32,602,129 State Grants and Contracts - Restricted 41,758 32,783 - 2,196,994 - - - - - 2,271,535 Higher Education Fund - - - - - - - - - - Available University Fund Excellence (See FN8) - - - - - - - - - - Subtotal 32,643,887 32,783 - 2,196,994 - - - - - 34,873,664
Student & ParentTuition Potential 100% 8,263,259 13,491,768 - - - - - - - 21,755,027 Waivers - Statutory (Not Reported in AFR) - - - - - - - - - - Waivers - Institutional (Not Reported in AFR) - - - - - - - - - - Exemptions - Statutory (Not Reported in AFR) - - - - - - - - - - Exemptions - Institutional (Not Reported in AFR) - - - - - - - - - - Tuition - Gross - AFR Presentation 8,263,259 13,491,768 - - - - - - - 21,755,027 Waivers - Statutory (Reported in AFR) (184,675) - - - - - - - - (184,675) Waivers - Institutional (Reported in AFR) - - - - - - - - - - Exemptions - Statutory (Reported in AFR) (727,143) (1,314,919) - - - - - - - (2,042,062) Exemptions - Institutional (Reported in AFR) - - - - - - - - - - All Other Scholarship Disc.& Allow. (See FN1) (1,694,858) (2,941,109) - - - - - - - (4,635,967) Tuition - net 5,656,583 9,235,740 - - - - - - - 14,892,323
Fees Potential 100% 97,416 22,408,835 689 - - - - - - 22,506,940 Waivers - Statutory (Not Reported in AFR) - - - - - - - - - - Waivers - Institutional (Not Reported in AFR) - - - - - - - - - - Exemptions - Statutory (Not Reported in AFR) - - - - - - - - - - Exemptions - Institutional (Not Reported in AFR) - - - - - - - - - - Fees - Gross - AFR Presentation 97,416 22,408,835 689 - - - - - - 22,506,940 Waivers - Statutory (Reported in AFR) - - - - - - - - - - Waivers - Institutional (Reported in AFR) - - - - - - - - - - Exemptions - Statutory (Reported in AFR) - (1,905,258) - - - - - - - (1,905,258) Exemptions - Institutional (Reported in AFR) - - - - - - - - - - All Other Scholarship Disc.& Allow. (See FN1) (30,730) (5,163,692) (217) - - - - - - (5,194,639) Fees - net 66,686 15,339,885 472 - - - - - - 15,407,043
Net Tuition and Fees (Funds Collected) 5,723,269 24,575,625 472 - - - - - - 30,299,366
Federal GovernmentFederal Grants and Contracts - Restricted - 44,052 - 14,995,398 - - - - - 15,039,450
Institutional ResourcesEndowment and Interest Income (See FN2) 353,572 2,153,543 - 2,740 - - - - - 2,509,855 Local Government Grants - Restricted - - - - - - - - - - Private Gifts and Grants - Restricted - 182,587 - 2,395,111 - - - - - 2,577,698 Sales and Services - 539,946 - 250 - - - - - 540,196 Net Auxiliary Enterprises (See FN9) - - 530,512 - - - - - - 530,512 Other Income (See FN3) - 92,210 142,139 - (23) - - - 1,105 235,431 Subtotal 353,572 2,968,286 672,651 2,398,101 (23) - - - 1,105 6,393,692 Total Operating Sources 38,720,728 27,620,746 673,123 19,590,493 (23) - - - 1,105 86,606,172
Operating UsesInstruction 21,824,107 3,813,326 - 6,079 - - - - - 25,643,512 Research 12,317 193,634 - 99,499 - - - - - 305,450 Public Service - 257,219 - 87,223 - - - - - 344,442 Academic Support 3,551,680 4,009,998 - 541,283 - - - - - 8,102,961 Student Services 2,776,130 12,675,671 - 73,388 210,380 - - - - 15,735,569 Institutional Support 4,186,800 5,294,657 - 10,623 - - - - - 9,492,080 Operations and Maintenance of Plant 168,255 7,099,579 - - - - 1,476,304 - - 8,744,138 Scholarships and Fellowships 727,143 4,085,140 - 6,154,513 - - - - - 10,966,796 Auxiliary Enterprises (See FN9) - - 388,563 - - - - - - 388,563 Capital Outlay from Current Fund Sources* - 1,542,843 - - - - - - - 1,542,843 Other Expenses (See FN3) - 115,255 - - - - - - 3,959,190 4,074,445 Total Operating Uses 33,246,432 39,087,322 388,563 6,972,608 210,380 - 1,476,304 - 3,959,190 85,340,799
Other Sources / (Uses) of FundsCapital Outlay from Non-Current Fund Sources** - - - - - - (802,400) - 2,345,243 1,542,843 Mandatory and Non-mandatory Transfers (See FN10) 1,807,764 10,350,380 217 (12,071,027) 99,154 340 2,410,520 - - 2,597,348 Bond Proceeds Transfers In (See FN4) - - - - - - - - - - Debt Service Payments (See FN5) (7,686,507) (14,574) (249,155) - - - - - - (7,950,236) Subtotal (5,878,743) 10,335,806 (248,938) (12,071,027) 99,154 340 1,608,120 - 2,345,243 (3,810,045)
Other Items Not for Current Operating UseUnrealized Gains / (Losses) (See FN6) - (392,048) (413) 10,543 (38,015) (2,903) (5,563) - - (428,399) Additions to Permanent Endowments (See FN7) - - - - - - - - - - Subtotal - (392,048) (413) 10,543 (38,015) (2,903) (5,563) - - (428,399)
Total Sources Over / (Under) Uses (See FN 11) (404,447) (1,522,818) 35,209 557,401 (149,264) (2,563) 126,253 - (1,612,842) (2,973,071)
Bond Proceeds - - - - - - - - - - Depreciation Expense - - - - - - - - (8,443,683) (8,443,683) Transfer of Capital Asses(s) from System - - - - - - - - 61,119,085 61,119,085 Other Post-Employment Benefit (OPEB) Expense - - - - - - - - - - Non-Cash Capital Gifts - - - - - - - - 398,311 398,311 Capital Outlay - 1,542,843 - - - - 802,400 - (2,345,243) - Change in Net Assets (Total Agrees with AFR***) (404,447) 20,025 35,209 557,401 (149,264) (2,563) 928,653 - 49,115,628 50,100,642
*Defined as any capital outlay expenses from Educational & General, Designated, Auxiliary, or Restricted Expendable Funds.**Defined as any capital outlay expense from funds other than Educational & General, Designated, Auxiliary, or Restricted Expendable.***As reported for "Changes in Net Position" shown on Schedule of Revenues, Expenses, and Changes in Net Position (SRECNP) in Annual Financial Report.
Detail Worksheet FY 2019
Texas A&M University - San AntonioFor the Year Ended August 31, 2019Source: FY 2019 Annual Financial Report
Texas Higher Education Coordinating Board 92 June, 2020
Texas A&M University - San AntonioFor the Year Ended August 31, 2019Source: FY 2019 Annual Financial Report
FOOTNOTES:
FN1: Scholarship Discounts and Allowances are scholarships, fellowships, and grants applied to tuition. The discount eliminates tuition revenues that are paid for by University resources which are recorded as revenue elsewhere on the financial statements (i.e. federal and state contracts and grants revenues). In addition, Scholarship Discounts and Allowances eliminate tuition revenue that is exempted from payment due to tuition exemptions approved by the Texas Legislature. Waivers, remissions, and exemptions represent tuition and fee dollars forgone by the university - some are required by statute. See the Integrated Financial Reporting System (IFRS) report submitted to THECB for details on waivers, exemptions, tuition, and fees. Allocation methods to individual funds shown may vary between institutions.
FN2: Endowment and Interest Income includes interest income and endowment payouts.
FN3: Other Income is primarily Other Operating and Other Non-operating Revenues from the AFR. Other Expenses is primarily Other Nonoperating Expenses from the AFR.
FN4: Bond Proceeds are funds received from the sale of bonds and commercial paper used to finance capital projects. This amount includes actual proceeds and accrued or anticipated proceeds to be transferred from System. Independent institutions report only to the extent expended in current year.
FN5: Debt service payments are payments to service and retire debt issued to fund capital projects. System components do this via transfers to System Administrations. Independent institutions use direct payment to appropriate paying agents.
FN6: Unrealized Gains / (Losses) represent the increase in the Fair Market Value of Investments and Endowments. Unrealized Gains / (Losses) are accrued as non-cash transactions. Therefore, funds are not actually received for this revenue stream. Accordingly, this revenue is not cash revenue and cannot be used by the University to fund operations.
FN7: Additions to Permanent Endowments are additions to endowment principal. This revenue is restricted for investment purposes only and cannot be used to fund operations. Only interest income from these endowments, which is reported on the Endowment and Investment Income line of this report, can be used by the University to fund operations.
FN8: Distributions from the Available University Fund appropriated through the Appropriation Bill are first used to pay debt service costs on Permanent University Fund Bonds. Funds remaining are distributed to constitutionally designated institutions to promote academic excellence. Only the Excellence funding is shown at the institution level. The AUF funds used to pay debt service on PUF bonds are reported at the System level.
FN9: Auxiliary Enterprises include athletics, housing and food, student services, and parking and transportation. Auxiliary Enterprises are required to be self-supporting, and therefore must operate on the funds they generate.
FN10: Mandatory and non-mandatory transfers includes transfers between funds, transfers between the University System and institutions and transfers to and from other state agencies. In total, all transfers between funds net to zero with the exception of any amounts transferred between the University System, between other institutions, or to and from another state agency. There are no transfers of education and general funds provided by the State of Texas to restricted or auxiliary fund groups. Transfers between education and general funds and designated funds are related to Texas Public Education Grant as provided by the State of Texas.
FN11. N/A
Texas Higher Education Coordinating Board 93 June, 2020

University of Houston - Academic & Health (A+H)(Excludes Medical School)For the Year Ended August 31, 2019Source: FY 2019 Annual Financial Report
Non-Operating Funds are not included in above charts. See following page (Summary).Charts May Not Add to 100% Due to Rounding
Total Operating Sources $1,289,976,612
Total Operating Sources $1,289,976,612
Total Operating Uses $1,139,992,046
State of Texas$303,832,633
24%
Student & Parent$397,368,725
31%
Federal Government$146,321,086
11%
Institutional Resources$442,454,168
34%
Operating Sources by Category
State Appropriations$204,320,720
16%
State Grants & Contracts
$46,741,8594%
Higher Education Fund$52,770,054
4%
Tuition & Fees$397,368,725
31%
Federal Grants & Contracts
$146,321,08611%
Endowment & Interest Income
$30,858,7382%
Local Government Grants
$9,112,4281%
Private Gifts & Grants$143,797,201
11%
Sales & Services$91,724,777
7%
Net Auxiliary Enterprises$96,860,055
8%
Other Income$70,100,969
5%
Operating Sources
Instruction$253,955,243
22%
Research$168,242,327
15%
Public Service$41,959,600
4%
Academic Support$176,604,721
15%
Student Services$32,815,821
3%Institutional Support
$76,739,5917%
Operations & Maintenance of Plant
$48,771,2514%
Scholarships & Fellowships$64,495,750
6%Auxiliary Enterprises
$125,142,92511%
Capital Outlay$22,271,899
2%Other Expenses$128,992,918
11%
Operating Uses
Texas Higher Education Coordinating Board 94 June, 2020

University of Houston - Academic & Health (A+H)(Excludes Medical School)For the Year Ended August 31, 2019Source: FY 2019 Annual Financial Report
Summary Worksheet FY 2019 Amount Per FTSEInstitution State Funded FTSEs 39,553.88
Operating SourcesState of TexasState Appropriations 204,320,720$ 5,166$ State Grants and Contracts - Restricted 46,741,859 1,182 Higher Education Fund 52,770,054 1,334 Available University Fund Excellence (See FN8) - - Subtotal 303,832,633$ 7,682$
Student & ParentTuition - net 279,079,570$ 7,056$ Fees - net 118,289,155 2,991 Tuition and Fees (net of Scholarship Discounts and Allowances) 397,368,725$ 10,047$
Federal GovernmentFederal Grants and Contracts - Restricted 146,321,086$ 3,699$
Institutional ResourcesEndowment and Interest Income (See FN2) 30,858,738$ 780$ Local Government Grants - Restricted 9,112,428 230 Private Gifts and Grants - Restricted 143,797,201 3,635 Sales and Services 91,724,777 2,319 Net Auxiliary Enterprises (See FN9) 96,860,055 2,449 Other Income (See FN3) 70,100,969 1,772 Subtotal 442,454,168$ 11,185$ Total Operating Sources 1,289,976,612$ 32,613$
Operating UsesInstruction 253,955,243$ 6,420$ Research 168,242,327 4,253 Public Service 41,959,600 1,061 Academic Support 176,604,721 4,465 Student Services 32,815,821 830 Institutional Support 76,739,591 1,940 Operations and Maintenance of Plant 48,771,251 1,233 Scholarships and Fellowships 64,495,750 1,631 Auxiliary Enterprises (See FN9) 125,142,925 3,164 Capital Outlay from Current Fund Sources 22,271,899 563 Other Expenses (See FN3) 128,992,918 3,261 Total Operating Uses 1,139,992,046$ 28,821$
Other Sources / (Uses) of FundsCapital Outlay from Non-Current Fund Sources (174,128,357) (4,402)$ Mandatory and Non-mandatory Transfers (See FN10) 142,941,812 3,614 Bond Proceeds Transfers (See FN4) - - Debt Service Payments (See FN5) (86,294,491) (2,182) Subtotal (117,481,036)$ (2,970)$
Other Items Not for Current Operating UseUnrealized Gains / (Losses) (See FN6) 4,307,372 109$ Additions to Permanent Endowments (See FN7) 9,920,474 251 Subtotal 14,227,846$ 360$
Total Sources Over / (Under) Uses (See FN11) 46,731,376$ 1,182$
Texas Higher Education Coordinating Board 95 June, 2020

(Excludes Medical School)
FY 2019
Operating SourcesEducational &
General DesignatedAuxiliary
EnterprisesRestricted Expendable Loan Funds
Annuity, Life & Endowment and
Similar FundsUnexpended
PlantRetirement of Indebtedness
Investment In Plant Primary University
State of TexasState Appropriations 204,320,720 - - - - - - - - 204,320,720 State Grants and Contracts - Restricted 265,522 - - 46,476,337 - - - - - 46,741,859 Higher Education Fund 52,770,054 - - - - - - - - 52,770,054 Available University Fund Excellence (See FN8) - - - - - - - - - - Subtotal 257,356,296 - - 46,476,337 - - - - - 303,832,633
Student & ParentTuition Potential 100% 113,507,045 289,732,530 - - - - - - - 403,239,575 Waivers - Statutory (Not Reported in AFR) (26,900,379) (6,517,232) - - - - - - - (33,417,611) Waivers - Institutional (Not Reported in AFR) - - - - - - - - - - Exemptions - Statutory (Not Reported in AFR) - - - - - - - - - - Exemptions - Institutional (Not Reported in AFR) - - - - - - - - - - Tuition - Gross - AFR Presentation 86,606,666 283,215,298 - - - - - - - 369,821,964 Waivers - Statutory (Reported in AFR) - - - - - - - - - - Waivers - Institutional (Reported in AFR) - - - - - - - - - - Exemptions - Statutory (Reported in AFR) (2,549,967) (7,529,596) - - - - - - - (10,079,563) Exemptions - Institutional (Reported in AFR) - - - - - - - - - - All Other Scholarship Disc.& Allow. (See FN1) (18,683,229) (61,979,602) - - - - - - - (80,662,831) Tuition - net 65,373,470 213,706,100 - - - - - - - 279,079,570
Fees Potential 100% 470,554 107,436,449 48,644,546 - - - - - - 156,551,549 Waivers - Statutory (Not Reported in AFR) (4) (19,314) (10,030) - - - - - - (29,348) Waivers - Institutional (Not Reported in AFR) - - - - - - - - - - Exemptions - Statutory (Not Reported in AFR) - - - - - - - - - - Exemptions - Institutional (Not Reported in AFR) - - - - - - - - - - Fees - Gross - AFR Presentation 470,550 107,417,135 48,634,516 - - - - - - 156,522,201 Waivers - Statutory (Reported in AFR) - - - - - - - - - - Waivers - Institutional (Reported in AFR) - - - - - - - - - - Exemptions - Statutory (Reported in AFR) (2,779) (2,704,277) (711,477) - - - - - - (3,418,533) Exemptions - Institutional (Reported in AFR) - - - - - - - - - - All Other Scholarship Disc.& Allow. (See FN1) (101,436) (23,507,146) (11,205,931) - - - - - - (34,814,513) Fees - net 366,335 81,205,712 36,717,108 - - - - - - 118,289,155
Net Tuition and Fees (Funds Collected) 65,739,805 294,911,812 36,717,108 - - - - - - 397,368,725
Federal GovernmentFederal Grants and Contracts - Restricted - 21,480 - 146,299,606 - - - - - 146,321,086
Institutional ResourcesEndowment and Interest Income (See FN2) 2,803,929 7,580,621 - 198,871 77,207 20,006,701 56,108 135,301 - 30,858,738 Local Government Grants - Restricted - 8,256,328 - 856,100 - - - - - 9,112,428 Private Gifts and Grants - Restricted - 722,496 358,086 142,605,981 - 110,638 - - - 143,797,201 Sales and Services 12,814 91,537,244 - 174,719 - - - - - 91,724,777 Net Auxiliary Enterprises (See FN9) - - 96,860,055 - - - - - - 96,860,055 Other Income (See FN3) 26,900,089 1,262,961 6,865,745 35,072,174 - - - - - 70,100,969 Subtotal 29,716,832 109,359,650 104,083,886 178,907,845 77,207 20,117,339 56,108 135,301 - 442,454,168 Total Operating Sources 352,812,933 404,292,942 140,800,994 371,683,788 77,207 20,117,339 56,108 135,301 - 1,289,976,612
Operating UsesInstruction 157,417,093 89,603,076 - 6,935,074 - - - - - 253,955,243 Research 20,829,666 46,468,357 - 100,944,304 - - - - - 168,242,327 Public Service 3,242,822 15,524,172 - 23,192,606 - - - - - 41,959,600 Academic Support 43,802,646 118,137,983 - 14,664,092 - - - - - 176,604,721 Student Services 6,337,108 24,289,061 - 2,189,652 - - - - - 32,815,821 Institutional Support 9,808,346 66,325,844 - 605,401 - - - - - 76,739,591 Operations and Maintenance of Plant 32,498,967 15,227,066 - 1,045,218 - - - - - 48,771,251 Scholarships and Fellowships 1,143,163 23,657,320 - 39,695,267 - - - - - 64,495,750 Auxiliary Enterprises (See FN9) - - 124,959,508 183,417 - - - - - 125,142,925 Capital Outlay from Current Fund Sources* 8,487,701 6,649,408 252,171 6,882,619 - - - - - 22,271,899 Other Expenses (See FN3) - 3,182,918 1,650,892 16,283 307,671 17,316,393 106,518,761 - - 128,992,918 Total Operating Uses 283,567,512 409,065,205 126,862,571 196,353,933 307,671 17,316,393 106,518,761 - - 1,139,992,046
Other Sources / (Uses) of FundsCapital Outlay from Non-Current Fund Sources** - - - - - - (174,128,357) - - (174,128,357) Mandatory and Non-mandatory Transfers (See FN10) (45,568,501) 6,318,499 7,167,813 (107,109,632) - (4,917,257) 55,757,611 80,582,446 150,710,833 142,941,812 Bond Proceeds Transfers In (See FN4) - - - - - - - - - - Debt Service Payments (See FN5) - - - - - - - (86,294,491) - (86,294,491) Subtotal (45,568,501) 6,318,499 7,167,813 (107,109,632) - (4,917,257) (118,370,746) (5,712,045) 150,710,833 (117,481,036)
Other Items Not for Current Operating UseUnrealized Gains / (Losses) (See FN6) - 7,649,257 - - - (3,341,885) - - - 4,307,372 Additions to Permanent Endowments (See FN7) - - - - - 9,920,474 - - - 9,920,474 Subtotal - 7,649,257 - - - 6,578,589 - - - 14,227,846
Total Sources Over / (Under) Uses (See FN 11) 23,676,920 9,195,493 21,106,236 68,220,223 (230,464) 4,462,278 (224,833,399) (5,576,744) 150,710,833 46,731,376
Bond Proceeds - - - - - - - - - - Depreciation Expense - - - - - - - - (82,352,335) (82,352,335) Transfer of Capital Asses(s) from System - - - - - - - - - - Other Post-Employment Benefit (OPEB) Expense - - - - - - - - - - Non-Cash Capital Gifts - - - - - - - - 2,465,801 2,465,801 Capital Outlay 8,487,701 6,649,408 252,171 6,882,619 - - 174,128,357 - - 196,400,256 Change in Net Assets (Total Agrees with AFR***) 32,164,621 15,844,901 21,358,407 75,102,842 (230,464) 4,462,278 (50,705,042) (5,576,744) 70,824,299 163,245,098
*Defined as any capital outlay expenses from Educational & General, Designated, Auxiliary, or Restricted Expendable Funds.**Defined as any capital outlay expense from funds other than Educational & General, Designated, Auxiliary, or Restricted Expendable.***As reported for "Changes in Net Position" shown on Schedule of Revenues, Expenses, and Changes in Net Position (SRECNP) in Annual Financial Report.
University of Houston - Academic & Health (A+H)
For the Year Ended August 31, 2019Source: FY 2019 Annual Financial Report
Detail Worksheet FY 2019
Texas Higher Education Coordinating Board 96 June, 2020

University of Houston - Academic & Health (A+H)(Excludes Medical School)For the Year Ended August 31, 2019Source: FY 2019 Annual Financial ReportFOOTNOTES:
FN1: Scholarship Discounts and Allowances are scholarships, fellowships, and grants applied to tuition. The discount eliminates tuition revenues that are paid for by University resources which are recorded as revenue elsewhere on the financial statements (i.e. federal and state contracts and grants revenues). In addition, Scholarship Discounts and Allowances eliminate tuition revenue that is exempted from payment due to tuition exemptions approved by the Texas Legislature. Waivers, remissions, and exemptions represent tuition and fee dollars forgone by the university - some are required by statute. See the Integrated Financial Reporting System (IFRS) report submitted to THECB for details on waivers, exemptions, tuition, and fees. Allocation methods to individual funds shown may vary between institutions.
FN2: Endowment and Interest Income includes interest income and endowment payouts.
FN3: Other Income is primarily Other Operating and Other Non-operating Revenues from the AFR. Other Expenses is primarily Other Nonoperating Expenses from the AFR.
FN4: Bond Proceeds are funds received from the sale of bonds and commercial paper used to finance capital projects. This amount includes actual proceeds and accrued or anticipated proceeds to be transferred from System. Independent institutions report only to the extent expended in current year.
FN5: Debt service payments are payments to service and retire debt issued to fund capital projects. System components do this via transfers to System Administrations. Independent institutions use direct payment to appropriate paying agents.
FN6: Unrealized Gains / (Losses) represent the increase in the Fair Market Value of Investments and Endowments. Unrealized Gains / (Losses) are accrued as non-cash transactions. Therefore, funds are not actually received for this revenue stream. Accordingly, this revenue is not cash revenue and cannot be used by the University to fund operations.
FN7: Additions to Permanent Endowments are additions to endowment principal. This revenue is restricted for investment purposes only and cannot be used to fund operations. Only interest income from these endowments, which is reported on the Endowment and Investment Income line of this report, can be used by the University to fund operations.
FN8: Distributions from the Available University Fund appropriated through the Appropriation Bill are first used to pay debt service costs on Permanent University Fund Bonds. Funds remaining are distributed to constitutionally designated institutions to promote academic excellence. Only the Excellence funding is shown at the institution level. The AUF funds used to pay debt service on PUF bonds are reported at the System level.
FN9: Auxiliary Enterprises include athletics, housing and food, student services, and parking and transportation. Auxiliary Enterprises are required to be self-supporting, and therefore must operate on the funds they generate.
FN10: Mandatory and non-mandatory transfers includes transfers between funds, transfers between the University System and institutions and transfers to and from other state agencies. In total, all transfers between funds net to zero with the exception of any amounts transferred between the University System, between other institutions, or to and from another state agency. There are no transfers of education and general funds provided by the State of Texas to restricted or auxiliary fund groups. Transfers between education and general funds and designated funds are related to Texas Public Education Grant as provided by the State of Texas.
FN11: Of the net increase of $46,731,376 approximately $32.5 million represents revenues received but not yet expended. This income is fully committed to program expenditures and capital disbursements. The remaining $14.2 million represents non-expendable funds from unrealized gains and additions to permanent endowments of approximately $4.3 million and $9.9 million respectively. Unrealized gains and additions to permanent endowments do not contribute to the availability of the institution's operating cash as discussed in FN6 and FN7.
Texas Higher Education Coordinating Board 97 June, 2020

University of Houston - Clear LakeFor the Year Ended August 31, 2019Source: FY 2019 Annual Financial Report
Non-Operating Funds are not included in above charts. See following page (Summary).Charts May Not Add to 100% Due to Rounding
Total Operating Sources $128,300,224
Total Operating Sources $128,300,224
Total Operating Uses $114,243,938
State of Texas$44,575,895
35%
Student & Parent$59,846,058
47%
Federal Government$15,621,102
12%
Institutional Resources$8,257,169
6%
Operating Sources by Category
State Appropriations$33,365,788
26%
State Grants & Contracts$3,204,991
2%
Higher Education Fund$8,005,116
6%
Tuition & Fees$59,846,058
47%
Federal Grants & Contracts
$15,621,10212%
Endowment & Interest Income
$1,955,2972%
Local Government Grants$10,000
0%
Private Gifts & Grants$2,412,837
2%
Sales & Services$1,387,026
1%
Net Auxiliary Enterprises$1,747,919
1% Other Income$744,090
1%
Operating Sources
Instruction$45,256,654
40%
Research$1,301,219
1%
Public Service$57,891
0%
Academic Support$17,478,498
15%
Student Services$5,826,069
5%Institutional Support
$17,318,52215%
Operations & Maintenance of Plant
$6,754,2226%
Scholarships & Fellowships$8,957,533
8%
Auxiliary Enterprises$6,853,030
6%Capital Outlay$2,785,481
2%
Other Expenses$1,654,819
2%
Operating Uses
Texas Higher Education Coordinating Board 98 June, 2020

University of Houston - Clear LakeFor the Year Ended August 31, 2019Source: FY 2019 Annual Financial Report
Summary Worksheet FY 2019 Amount Per FTSEInstitution State Funded FTSEs 6,523.88
Operating SourcesState of TexasState Appropriations 33,365,788$ 5,114$ State Grants and Contracts - Restricted 3,204,991 491 Higher Education Fund 8,005,116 1,227 Available University Fund Excellence (See FN8) - - Subtotal 44,575,895$ 6,832$
Student & ParentTuition - net 45,878,695$ 7,032$ Fees - net 13,967,363 2,141 Tuition and Fees (net of Scholarship Discounts and Allowances) 59,846,058$ 9,173$
Federal GovernmentFederal Grants and Contracts - Restricted 15,621,102$ 2,394$
Institutional ResourcesEndowment and Interest Income (See FN2) 1,955,297$ 300$ Local Government Grants - Restricted 10,000 2 Private Gifts and Grants - Restricted 2,412,837 370 Sales and Services 1,387,026 213 Net Auxiliary Enterprises (See FN9) 1,747,919 268 Other Income (See FN3) 744,090 114 Subtotal 8,257,169$ 1,267$ Total Operating Sources 128,300,224$ 19,666$
Operating UsesInstruction 45,256,654$ 6,937$ Research 1,301,219 199 Public Service 57,891 9 Academic Support 17,478,498 2,679 Student Services 5,826,069 893 Institutional Support 17,318,522 2,655 Operations and Maintenance of Plant 6,754,222 1,035 Scholarships and Fellowships 8,957,533 1,373 Auxiliary Enterprises (See FN9) 6,853,030 1,050 Capital Outlay from Current Fund Sources 2,785,481 427 Other Expenses (See FN3) 1,654,819 254 Total Operating Uses 114,243,938$ 17,511$
Other Sources / (Uses) of FundsCapital Outlay from Non-Current Fund Sources (33,972,045) (5,207)$ Mandatory and Non-mandatory Transfers (See FN10) 11,711,789 1,795 Bond Proceeds Transfers (See FN4) - - Debt Service Payments (See FN5) (12,603,250) (1,932) Subtotal (34,863,506)$ (5,344)$
Other Items Not for Current Operating UseUnrealized Gains / (Losses) (See FN6) 369,175 57$ Additions to Permanent Endowments (See FN7) 363,935 56 Subtotal 733,110$ 113$
Total Sources Over / (Under) Uses (See FN11) (20,074,110)$ (3,076)$
Texas Higher Education Coordinating Board 99 June, 2020

FY 2019
Operating SourcesEducational &
General DesignatedAuxiliary
EnterprisesRestricted Expendable Loan Funds
Annuity, Life & Endowment and
Similar FundsUnexpended
PlantRetirement of Indebtedness
Investment In Plant Primary University
State of TexasState Appropriations 33,365,788 - - - - - - - - 33,365,788 State Grants and Contracts - Restricted 420,965 - - 2,784,026 - - - - - 3,204,991 Higher Education Fund 8,005,116 - - - - - - - - 8,005,116 Available University Fund Excellence (See FN8) - - - - - - - - - - Subtotal 41,791,869 - - 2,784,026 - - - - - 44,575,895
Student & ParentTuition Potential 100% 17,184,042 42,348,432 - - - - - - - 59,532,474 Waivers - Statutory (Not Reported in AFR) (2,135,855) (450,587) - - - - - - - (2,586,442) Waivers - Institutional (Not Reported in AFR) - - - - - - - - - - Exemptions - Statutory (Not Reported in AFR) - - - - - - - - - - Exemptions - Institutional (Not Reported in AFR) - - - - - - - - - - Tuition - Gross - AFR Presentation 15,048,187 41,897,845 - - - - - - - 56,946,032 Waivers - Statutory (Reported in AFR) - - - - - - - - - - Waivers - Institutional (Reported in AFR) - - - - - - - - - - Exemptions - Statutory (Reported in AFR) (442,550) (1,501,935) - - - - - - - (1,944,485) Exemptions - Institutional (Reported in AFR) - - - - - - - - - - All Other Scholarship Disc.& Allow. (See FN1) (2,752,036) (6,370,816) - - - - - - - (9,122,852) Tuition - net 11,853,601 34,025,094 - - - - - - - 45,878,695
Fees Potential 100% - 9,596,973 7,685,360 - - - - - - 17,282,333 Waivers - Statutory (Not Reported in AFR) - (102,112) - - - - - - - (102,112) Waivers - Institutional (Not Reported in AFR) - - - - - - - - - - Exemptions - Statutory (Not Reported in AFR) - - - - - - - - - - Exemptions - Institutional (Not Reported in AFR) - - - - - - - - - - Fees - Gross - AFR Presentation - 9,494,861 7,685,360 - - - - - - 17,180,221 Waivers - Statutory (Reported in AFR) - - - - - - - - - - Waivers - Institutional (Reported in AFR) - - - - - - - - - - Exemptions - Statutory (Reported in AFR) - (340,367) (152,743) - - - - - - (493,110) Exemptions - Institutional (Reported in AFR) - - - - - - - - - - All Other Scholarship Disc.& Allow. (See FN1) - (1,443,750) (1,275,998) - - - - - - (2,719,748) Fees - net - 7,710,744 6,256,619 - - - - - - 13,967,363
Net Tuition and Fees (Funds Collected) 11,853,601 41,735,838 6,256,619 - - - - - - 59,846,058
Federal GovernmentFederal Grants and Contracts - Restricted - - - 15,621,102 - - - - - 15,621,102
Institutional ResourcesEndowment and Interest Income (See FN2) 190,770 850,468 - - 8,615 886,477 - 18,967 - 1,955,297 Local Government Grants - Restricted - - - 10,000 - - - - - 10,000 Private Gifts and Grants - Restricted - 292,632 50 2,119,753 - 402 - - - 2,412,837 Sales and Services - 1,387,026 - - - - - - - 1,387,026 Net Auxiliary Enterprises (See FN9) - - 1,747,919 - - - - - - 1,747,919 Other Income (See FN3) - 300,549 7 391,311 52,223 - - - - 744,090 Subtotal 190,770 2,830,675 1,747,976 2,521,064 60,838 886,879 - 18,967 - 8,257,169 Total Operating Sources 53,836,240 44,566,513 8,004,595 20,926,192 60,838 886,879 - 18,967 - 128,300,224
Operating UsesInstruction 29,867,874 14,202,062 - 1,186,718 - - - - - 45,256,654 Research 428,356 (123,960) - 996,823 - - - - - 1,301,219 Public Service - - - 57,891 - - - - - 57,891 Academic Support 5,322,410 11,131,124 - 1,024,964 - - - - - 17,478,498 Student Services 2,092,082 3,714,958 - 19,029 - - - - - 5,826,069 Institutional Support 8,959,140 8,321,336 - 38,046 - - - - - 17,318,522 Operations and Maintenance of Plant 2,119,350 4,629,819 - 5,053 - - - - - 6,754,222 Scholarships and Fellowships (195,098) 2,222,300 - 6,962,572 (32,241) - - - - 8,957,533 Auxiliary Enterprises (See FN9) - - 6,853,030 - - - - - - 6,853,030 Capital Outlay from Current Fund Sources* 2,089,070 377,532 43,968 274,911 - - - - - 2,785,481 Other Expenses (See FN3) 717,299 - - 34,252 - 903,268 - - - 1,654,819 Total Operating Uses 51,400,483 44,475,171 6,896,998 10,600,259 (32,241) 903,268 - - - 114,243,938
Other Sources / (Uses) of FundsCapital Outlay from Non-Current Fund Sources** - - - - - - (33,972,045) - - (33,972,045) Mandatory and Non-mandatory Transfers (See FN10) (4,431,495) 5,413,402 (1,627,712) (9,156,262) 41,578 (140,749) 501,574 11,785,218 9,326,235 11,711,789 Bond Proceeds Transfers In (See FN4) - - - - - - - - - - Debt Service Payments (See FN5) - - - - - - - (12,603,250) - (12,603,250) Subtotal (4,431,495) 5,413,402 (1,627,712) (9,156,262) 41,578 (140,749) (33,470,471) (818,032) 9,326,235 (34,863,506)
Other Items Not for Current Operating UseUnrealized Gains / (Losses) (See FN6) - 622,860 - - - (253,685) - - - 369,175 Additions to Permanent Endowments (See FN7) - - - - - 363,935 - - - 363,935 Subtotal - 622,860 - - - 110,250 - - - 733,110
Total Sources Over / (Under) Uses (See FN 11) (1,995,738) 6,127,604 (520,115) 1,169,671 134,657 (46,888) (33,470,471) (799,065) 9,326,235 (20,074,110)
Bond Proceeds - - - - - - - - - - Depreciation Expense - - - - - - - - (11,753,342) (11,753,342) Transfer of Capital Asses(s) from System - - - - - - - - - - Other Post-Employment Benefit (OPEB) Expense - - - - - - - - - - Non-Cash Capital Gifts - - - - - - - - - - Capital Outlay 2,089,070 377,532 43,968 274,911 - - 33,972,045 - - 36,757,526 Change in Net Assets (Total Agrees with AFR***) 93,332 6,505,136 (476,147) 1,444,582 134,657 (46,888) 501,574 (799,065) (2,427,107) 4,930,074
*Defined as any capital outlay expenses from Educational & General, Designated, Auxiliary, or Restricted Expendable Funds.**Defined as any capital outlay expense from funds other than Educational & General, Designated, Auxiliary, or Restricted Expendable.***As reported for "Changes in Net Position" shown on Schedule of Revenues, Expenses, and Changes in Net Position (SRECNP) in Annual Financial Report.
University of Houston - Clear LakeFor the Year Ended August 31, 2019Source: FY 2019 Annual Financial Report
Detail Worksheet FY 2019
Texas Higher Education Coordinating Board 100 June, 2020

University of Houston - Clear LakeFor the Year Ended August 31, 2019Source: FY 2019 Annual Financial Report
FOOTNOTES:
FN1: Scholarship Discounts and Allowances are scholarships, fellowships, and grants applied to tuition. The discount eliminates tuition revenues that are paid for by University resources which are recorded as revenue elsewhere on the financial statements (i.e. federal and state contracts and grants revenues). In addition, Scholarship Discounts and Allowances eliminate tuition revenue that is exempted from payment due to tuition exemptions approved by the Texas Legislature. Waivers, remissions, and exemptions represent tuition and fee dollars forgone by the university - some are required by statute. See the Integrated Financial Reporting System (IFRS) report submitted to THECB for details on waivers, exemptions, tuition, and fees. Allocation methods to individual funds shown may vary between institutions.
FN2: Endowment and Interest Income includes interest income and endowment payouts.
FN3: Other Income is primarily Other Operating and Other Non-operating Revenues from the AFR. Other Expenses is primarily Other Nonoperating Expenses from the AFR.
FN4: Bond Proceeds are funds received from the sale of bonds and commercial paper used to finance capital projects. This amount includes actual proceeds and accrued or anticipated proceeds to be transferred from System. Independent institutions report only to the extent expended in current year.
FN5: Debt service payments are payments to service and retire debt issued to fund capital projects. System components do this via transfers to System Administrations. Independent institutions use direct payment to appropriate paying agents.
FN6: Unrealized Gains / (Losses) represent the increase in the Fair Market Value of Investments and Endowments. Unrealized Gains / (Losses) are accrued as non-cash transactions. Therefore, funds are not actually received for this revenue stream. Accordingly, this revenue is not cash revenue and cannot be used by the University to fund operations.
FN7: Additions to Permanent Endowments are additions to endowment principal. This revenue is restricted for investment purposes only and cannot be used to fund operations. Only interest income from these endowments, which is reported on the Endowment and Investment Income line of this report, can be used by the University to fund operations.
FN8: Distributions from the Available University Fund appropriated through the Appropriation Bill are first used to pay debt service costs on Permanent University Fund Bonds. Funds remaining are distributed to constitutionally designated institutions to promote academic excellence. Only the Excellence funding is shown at the institution level. The AUF funds used to pay debt service on PUF bonds are reported at the System level.
FN9: Auxiliary Enterprises include athletics, housing and food, student services, and parking and transportation. Auxiliary Enterprises are required to be self-supporting, and therefore must operate on the funds they generate.
FN10: Mandatory and non-mandatory transfers includes transfers between funds, transfers between the University System and institutions and transfers to and from other state agencies. In total, all transfers between funds net to zero with the exception of any amounts transferred between the University System, between other institutions, or to and from another state agency. There are no transfers of education and general funds provided by the State of Texas to restricted or auxiliary fund groups. Transfers between education and general funds and designated funds are related to Texas Public Education Grant as provided by the State of Texas.
FN11. N/A
Texas Higher Education Coordinating Board 101 June, 2020

University of Houston - DowntownFor the Year Ended August 31, 2019Source: FY 2019 Annual Financial Report
Non-Operating Funds are not included in above charts. See following page (Summary).Charts May Not Add to 100% Due to Rounding
Total Operating Sources $165,785,060
Total Operating Sources $165,785,060
Total Operating Uses $162,597,365
State of Texas$51,113,160
31%
Student & Parent$70,150,816
42%
Federal Government$32,794,537
20%
Institutional Resources$11,726,547
7%
Operating Sources by Category
State Appropriations$31,399,131
19%
State Grants & Contracts$7,961,152
5%
Higher Education Fund$11,752,877
7%Tuition & Fees$70,150,816
42%
Federal Grants & Contracts
$32,794,53720%
Endowment & Interest Income
$2,311,0682%
Private Gifts & Grants$2,191,991
1%
Sales & Services$3,115,492
2%
Net Auxiliary Enterprises$2,064,309
1%
Other Income$2,018,278
1%
Operating Sources
Instruction$49,947,833
31%
Research$2,169,179
1%
Public Service$3,661,570
2%
Academic Support$27,282,022
17%
Student Services$7,886,259
5% Institutional Support$22,294,831
14%
Operations & Maintenance of Plant
$8,023,0025%
Scholarships & Fellowships$25,350,578
15%
Auxiliary Enterprises$9,214,962
6%Capital Outlay$3,846,180
2%
Other Expenses$2,920,949
2%
Operating Uses
Texas Higher Education Coordinating Board 102 June, 2020

University of Houston - DowntownFor the Year Ended August 31, 2019Source: FY 2019 Annual Financial Report
Summary Worksheet FY 2019 Amount Per FTSEInstitution State Funded FTSEs 9,617.91
Operating SourcesState of TexasState Appropriations 31,399,131$ 3,265$ State Grants and Contracts - Restricted 7,961,152 828 Higher Education Fund 11,752,877 1,222 Available University Fund Excellence (See FN8) - - Subtotal 51,113,160$ 5,315$
Student & ParentTuition - net 54,376,917$ 5,654$ Fees - net 15,773,899 1,640 Tuition and Fees (net of Scholarship Discounts and Allowances) 70,150,816$ 7,294$
Federal GovernmentFederal Grants and Contracts - Restricted 32,794,537$ 3,410$
Institutional ResourcesEndowment and Interest Income (See FN2) 2,311,068$ 240$ Local Government Grants - Restricted 25,409 3 Private Gifts and Grants - Restricted 2,191,991 228 Sales and Services 3,115,492 324 Net Auxiliary Enterprises (See FN9) 2,064,309 215 Other Income (See FN3) 2,018,278 210 Subtotal 11,726,547$ 1,220$ Total Operating Sources 165,785,060$ 17,239$
Operating UsesInstruction 49,947,833$ 5,193$ Research 2,169,179 226 Public Service 3,661,570 381 Academic Support 27,282,022 2,837 Student Services 7,886,259 820 Institutional Support 22,294,831 2,318 Operations and Maintenance of Plant 8,023,002 834 Scholarships and Fellowships 25,350,578 2,636 Auxiliary Enterprises (See FN9) 9,214,962 958 Capital Outlay from Current Fund Sources 3,846,180 400 Other Expenses (See FN3) 2,920,949 304 Total Operating Uses 162,597,365$ 16,907$
Other Sources / (Uses) of FundsCapital Outlay from Non-Current Fund Sources - -$ Mandatory and Non-mandatory Transfers (See FN10) 3,268,370 340 Bond Proceeds Transfers (See FN4) - - Debt Service Payments (See FN5) (4,024,271) (418) Subtotal (755,901)$ (78)$
Other Items Not for Current Operating UseUnrealized Gains / (Losses) (See FN6) 412,830 43$ Additions to Permanent Endowments (See FN7) 1,130,395 118 Subtotal 1,543,225$ 161$
Total Sources Over / (Under) Uses (See FN11) 3,975,019$ 415$
Texas Higher Education Coordinating Board 103 June, 2020

FY 2019
Operating SourcesEducational &
General DesignatedAuxiliary
EnterprisesRestricted Expendable Loan Funds
Annuity, Life & Endowment and
Similar FundsUnexpended
PlantRetirement of Indebtedness
Investment In Plant Primary University
State of TexasState Appropriations 31,399,131 - - - - - - - - 31,399,131 State Grants and Contracts - Restricted 113,175 - - 7,847,977 - - - - - 7,961,152 Higher Education Fund 11,752,877 - - - - - - - - 11,752,877 Available University Fund Excellence (See FN8) - - - - - - - - - - Subtotal 43,265,183 - - 7,847,977 - - - - - 51,113,160
Student & ParentTuition Potential 100% 20,954,545 56,385,738 - - - - - - - 77,340,283 Waivers - Statutory (Not Reported in AFR) (466,613) - - - - - - - - (466,613) Waivers - Institutional (Not Reported in AFR) - - - - - - - - - - Exemptions - Statutory (Not Reported in AFR) - - - - - - - - - - Exemptions - Institutional (Not Reported in AFR) - - - - - - - - - - Tuition - Gross - AFR Presentation 20,487,932 56,385,738 - - - - - - - 76,873,670 Waivers - Statutory (Reported in AFR) - - - - - - - - - - Waivers - Institutional (Reported in AFR) - - - - - - - - - - Exemptions - Statutory (Reported in AFR) (468,116) (1,520,185) - - - - - - - (1,988,301) Exemptions - Institutional (Reported in AFR) - - - - - - - - - - All Other Scholarship Disc.& Allow. (See FN1) (5,527,591) (14,980,861) - - - - - - - (20,508,452) Tuition - net 14,492,225 39,884,692 - - - - - - - 54,376,917
Fees Potential 100% - 16,176,860 6,122,998 - - - - - - 22,299,858 Waivers - Statutory (Not Reported in AFR) - - - - - - - - - - Waivers - Institutional (Not Reported in AFR) - - - - - - - - - - Exemptions - Statutory (Not Reported in AFR) - - - - - - - - - - Exemptions - Institutional (Not Reported in AFR) - - - - - - - - - - Fees - Gross - AFR Presentation - 16,176,860 6,122,998 - - - - - - 22,299,858 Waivers - Statutory (Reported in AFR) - - - - - - - - - - Waivers - Institutional (Reported in AFR) - - - - - - - - - - Exemptions - Statutory (Reported in AFR) - (436,135) (51,740) - - - - - - (487,875) Exemptions - Institutional (Reported in AFR) - - - - - - - - - - All Other Scholarship Disc.& Allow. (See FN1) - (4,297,954) (1,740,130) - - - - - - (6,038,084) Fees - net - 11,442,771 4,331,128 - - - - - - 15,773,899
Net Tuition and Fees (Funds Collected) 14,492,225 51,327,463 4,331,128 - - - - - - 70,150,816
Federal GovernmentFederal Grants and Contracts - Restricted - 167,362 - 32,627,175 - - - - - 32,794,537
Institutional ResourcesEndowment and Interest Income (See FN2) 86,440 749,806 - - 30,103 1,444,719 - - - 2,311,068 Local Government Grants - Restricted - - - 25,409 - - - - - 25,409 Private Gifts and Grants - Restricted - 4,349 - 2,185,020 - 2,622 - - - 2,191,991 Sales and Services - 3,115,492 - - - - - - - 3,115,492 Net Auxiliary Enterprises (See FN9) - - 2,064,309 - - - - - - 2,064,309 Other Income (See FN3) - 2,016,481 - 1,797 - - - - - 2,018,278 Subtotal 86,440 5,886,128 2,064,309 2,212,226 30,103 1,447,341 - - - 11,726,547 Total Operating Sources 57,843,848 57,380,953 6,395,437 42,687,378 30,103 1,447,341 - - - 165,785,060
Operating UsesInstruction 32,902,416 15,636,737 - 1,408,680 - - - - - 49,947,833 Research 205,948 426,371 - 1,536,860 - - - - - 2,169,179 Public Service 254,139 2,810,274 - 597,157 - - - - - 3,661,570 Academic Support 6,106,467 20,367,512 - 967,038 (158,995) - - - - 27,282,022 Student Services 849,273 6,835,147 - 201,839 - - - - - 7,886,259 Institutional Support 8,689,513 13,660,333 - (55,015) - - - - - 22,294,831 Operations and Maintenance of Plant 3,388,201 4,634,801 - - - - - - - 8,023,002 Scholarships and Fellowships 94,049 7,154,889 - 18,101,640 - - - - - 25,350,578 Auxiliary Enterprises (See FN9) - - 9,214,962 - - - - - - 9,214,962 Capital Outlay from Current Fund Sources* 3,596,364 154,900 74,918 19,998 - - - - - 3,846,180 Other Expenses (See FN3) (10,928) (455,874) (5,690) (824,728) 112,170 2,163,749 6,166,791 6,127,550 (10,352,091) 2,920,949 Total Operating Uses 56,075,442 71,225,090 9,284,190 21,953,469 (46,825) 2,163,749 6,166,791 6,127,550 (10,352,091) 162,597,365
Other Sources / (Uses) of FundsCapital Outlay from Non-Current Fund Sources** - - - - - - - - - - Mandatory and Non-mandatory Transfers (See FN10) (4,752,730) 9,678,318 1,100,279 (21,057,701) 214,734 (248,611) 7,051,860 11,282,221 - 3,268,370 Bond Proceeds Transfers In (See FN4) - - - - - - - - - - Debt Service Payments (See FN5) - - - - - - - (5,105,793) 1,081,522 (4,024,271) Subtotal (4,752,730) 9,678,318 1,100,279 (21,057,701) 214,734 (248,611) 7,051,860 6,176,428 1,081,522 (755,901)
Other Items Not for Current Operating UseUnrealized Gains / (Losses) (See FN6) - 793,323 - - - (380,493) - - - 412,830 Additions to Permanent Endowments (See FN7) - - - - - 1,130,395 - - - 1,130,395 Subtotal - 793,323 - - - 749,902 - - - 1,543,225
Total Sources Over / (Under) Uses (See FN 11) (2,984,324) (3,372,496) (1,788,474) (323,792) 291,662 (215,117) 885,069 48,878 11,433,613 3,975,019
Bond Proceeds - - - - - - - - - - Depreciation Expense - - - - - - - - (9,560,339) (9,560,339) Transfer of Capital Asses(s) from System - - - - - - - - - - Other Post-Employment Benefit (OPEB) Expense - - - - - - - - - - Non-Cash Capital Gifts - - - - - - - - - - Capital Outlay 3,596,364 154,900 74,918 19,998 - - - - 3,846,180 7,692,360 Change in Net Assets (Total Agrees with AFR***) 612,040 (3,217,596) (1,713,556) (303,794) 291,662 (215,117) 885,069 48,878 5,719,454 2,107,040
*Defined as any capital outlay expenses from Educational & General, Designated, Auxiliary, or Restricted Expendable Funds.**Defined as any capital outlay expense from funds other than Educational & General, Designated, Auxiliary, or Restricted Expendable.***As reported for "Changes in Net Position" shown on Schedule of Revenues, Expenses, and Changes in Net Position (SRECNP) in Annual Financial Report.
University of Houston - DowntownFor the Year Ended August 31, 2019Source: FY 2019 Annual Financial Report
Detail Worksheet FY 2019
Texas Higher Education Coordinating Board 104 June, 2020

University of Houston - DowntownFor the Year Ended August 31, 2019Source: FY 2019 Annual Financial Report
FOOTNOTES:
FN1: Scholarship Discounts and Allowances are scholarships, fellowships, and grants applied to tuition. The discount eliminates tuition revenues that are paid for by University resources which are recorded as revenue elsewhere on the financial statements (i.e. federal and state contracts and grants revenues). In addition, Scholarship Discounts and Allowances eliminate tuition revenue that is exempted from payment due to tuition exemptions approved by the Texas Legislature. Waivers, remissions, and exemptions represent tuition and fee dollars forgone by the university - some are required by statute. See the Integrated Financial Reporting System (IFRS) report submitted to THECB for details on waivers, exemptions, tuition, and fees. Allocation methods to individual funds shown may vary between institutions.
FN2: Endowment and Interest Income includes interest income and endowment payouts.
FN3: Other Income is primarily Other Operating and Other Non-operating Revenues from the AFR. Other Expenses is primarily Other Nonoperating Expenses from the AFR.
FN4: Bond Proceeds are funds received from the sale of bonds and commercial paper used to finance capital projects. This amount includes actual proceeds and accrued or anticipated proceeds to be transferred from System. Independent institutions report only to the extent expended in current year.
FN5: Debt service payments are payments to service and retire debt issued to fund capital projects. System components do this via transfers to System Administrations. Independent institutions use direct payment to appropriate paying agents.
FN6: Unrealized Gains / (Losses) represent the increase in the Fair Market Value of Investments and Endowments. Unrealized Gains / (Losses) are accrued as non-cash transactions. Therefore, funds are not actually received for this revenue stream. Accordingly, this revenue is not cash revenue and cannot be used by the University to fund operations.
FN7: Additions to Permanent Endowments are additions to endowment principal. This revenue is restricted for investment purposes only and cannot be used to fund operations. Only interest income from these endowments, which is reported on the Endowment and Investment Income line of this report, can be used by the University to fund operations.
FN8: Distributions from the Available University Fund appropriated through the Appropriation Bill are first used to pay debt service costs on Permanent University Fund Bonds. Funds remaining are distributed to constitutionally designated institutions to promote academic excellence. Only the Excellence funding is shown at the institution level. The AUF funds used to pay debt service on PUF bonds are reported at the System level.
FN9: Auxiliary Enterprises include athletics, housing and food, student services, and parking and transportation. Auxiliary Enterprises are required to be self-supporting, and therefore must operate on the funds they generate.
FN10: Mandatory and non-mandatory transfers includes transfers between funds, transfers between the University System and institutions and transfers to and from other state agencies. In total, all transfers between funds net to zero with the exception of any amounts transferred between the University System, between other institutions, or to and from another state agency. There are no transfers of education and general funds provided by the State of Texas to restricted or auxiliary fund groups. Transfers between education and general funds and designated funds are related to Texas Public Education Grant as provided by the State of Texas.
FN11: Of the net increase of $3,975,019 approximately $2.4 million represents revenues received but not yet expended. This income is fully committed to program expenditures and capital disbursements. The remaining $1.5 million represents non-expendable funds from unrealized gains and additions to permanent endowments of approximately $413 thousand and $1.1 million respectively. Unrealized gains and additions to permanent endowments do not contribute to the availability of the institution's operating cash as discussed in FN6 and FN7.
Texas Higher Education Coordinating Board 105 June, 2020

University of Houston - VictoriaFor the Year Ended August 31, 2019Source: FY 2019 Annual Financial Report
Non-Operating Funds are not included in above charts. See following page (Summary).Charts May Not Add to 100% Due to Rounding
Total Operating Sources $67,620,842
Total Operating Sources $67,620,842
Total Operating Uses $59,140,599
State of Texas$24,741,884
37%
Student & Parent$22,336,167
33%
Federal Government$9,405,730
14%
Institutional Resources$11,137,061
16%
Operating Sources by Category
State Appropriations$17,921,112
27%
State Grants & Contracts$2,544,911
4%
Higher Education Fund$4,275,861
6%Tuition & Fees
$22,336,16733%
Federal Grants & Contracts$9,405,730
14%
Endowment & Interest Income
$648,4581%
Private Gifts & Grants$2,780,226
4%
Sales & Services$201,062
0%
Net Auxiliary Enterprises$2,591,030
4% Other Income$4,916,285
7%
Operating Sources
Instruction$18,600,375
31%
Research$332,813
1%
Public Service$851,053
1%
Academic Support$10,817,709
18%
Student Services$7,553,177
13%Institutional Support
$6,126,26510%
Operations & Maintenance of Plant
$2,270,2984%
Scholarships & Fellowships$7,429,004
13%
Auxiliary Enterprises$2,208,733
4%Capital Outlay
$497,1381%
Other Expenses$2,454,034
4%
Operating Uses
Texas Higher Education Coordinating Board 106 June, 2020

University of Houston - VictoriaFor the Year Ended August 31, 2019Source: FY 2019 Annual Financial Report
Summary Worksheet FY 2019 Amount Per FTSEInstitution State Funded FTSEs 3,135.97
Operating SourcesState of TexasState Appropriations 17,921,112$ 5,715$ State Grants and Contracts - Restricted 2,544,911 812 Higher Education Fund 4,275,861 1,363 Available University Fund Excellence (See FN8) - - Subtotal 24,741,884$ 7,890$
Student & ParentTuition - net 15,952,821$ 5,087$ Fees - net 6,383,346 2,036 Tuition and Fees (net of Scholarship Discounts and Allowances) 22,336,167$ 7,123$
Federal GovernmentFederal Grants and Contracts - Restricted 9,405,730$ 2,999$
Institutional ResourcesEndowment and Interest Income (See FN2) 648,458$ 207$ Local Government Grants - Restricted - - Private Gifts and Grants - Restricted 2,780,226 887 Sales and Services 201,062 64 Net Auxiliary Enterprises (See FN9) 2,591,030 826 Other Income (See FN3) 4,916,285 1,568 Subtotal 11,137,061$ 3,552$ Total Operating Sources 67,620,842$ 21,564$
Operating UsesInstruction 18,600,375$ 5,931$ Research 332,813 106 Public Service 851,053 271 Academic Support 10,817,709 3,450 Student Services 7,553,177 2,409 Institutional Support 6,126,265 1,954 Operations and Maintenance of Plant 2,270,298 724 Scholarships and Fellowships 7,429,004 2,369 Auxiliary Enterprises (See FN9) 2,208,733 704 Capital Outlay from Current Fund Sources 497,138 159 Other Expenses (See FN3) 2,454,034 783 Total Operating Uses 59,140,599$ 18,860$
Other Sources / (Uses) of FundsCapital Outlay from Non-Current Fund Sources (29,129,277) (9,289)$ Mandatory and Non-mandatory Transfers (See FN10) 6,098,637 1,945 Bond Proceeds Transfers (See FN4) - - Debt Service Payments (See FN5) (8,748,545) (2,790) Subtotal (31,779,185)$ (10,134)$
Other Items Not for Current Operating UseUnrealized Gains / (Losses) (See FN6) (120,892) (39)$ Additions to Permanent Endowments (See FN7) 95,713 31 Subtotal (25,179)$ (8)$
Total Sources Over / (Under) Uses (See FN11) (23,324,121)$ (7,438)$
Texas Higher Education Coordinating Board 107 June, 2020

FY 2019
Operating SourcesEducational &
General DesignatedAuxiliary
EnterprisesRestricted Expendable Loan Funds
Annuity, Life & Endowment and
Similar FundsUnexpended
PlantRetirement of Indebtedness
Investment In Plant Primary University
State of TexasState Appropriations 17,921,112 - - - - - - - - 17,921,112 State Grants and Contracts - Restricted 45,994 - - 2,498,917 - - - - - 2,544,911 Higher Education Fund 4,275,861 - - - - - - - - 4,275,861 Available University Fund Excellence (See FN8) - - - - - - - - - - Subtotal 22,242,967 - - 2,498,917 - - - - - 24,741,884
Student & ParentTuition Potential 100% 6,685,283 15,663,173 - - - - - - - 22,348,456 Waivers - Statutory (Not Reported in AFR) (476,463) (745) - - - - - - - (477,208) Waivers - Institutional (Not Reported in AFR) - - - - - - - - - - Exemptions - Statutory (Not Reported in AFR) - - - - - - - - - - Exemptions - Institutional (Not Reported in AFR) - - - - - - - - - - Tuition - Gross - AFR Presentation 6,208,820 15,662,428 - - - - - - - 21,871,248 Waivers - Statutory (Reported in AFR) - - - - - - - - - - Waivers - Institutional (Reported in AFR) - - - - - - - - - - Exemptions - Statutory (Reported in AFR) (225,221) (597,473) - - - - - - - (822,694) Exemptions - Institutional (Reported in AFR) - - - - - - - - - - All Other Scholarship Disc.& Allow. (See FN1) (1,454,923) (3,640,810) - - - - - - - (5,095,733) Tuition - net 4,528,676 11,424,145 - - - - - - - 15,952,821
Fees Potential 100% 2,385 5,157,994 3,590,976 - - - - - - 8,751,355 Waivers - Statutory (Not Reported in AFR) - - - - - - - - - - Waivers - Institutional (Not Reported in AFR) - - - - - - - - - - Exemptions - Statutory (Not Reported in AFR) - - - - - - - - - - Exemptions - Institutional (Not Reported in AFR) - - - - - - - - - - Fees - Gross - AFR Presentation 2,385 5,157,994 3,590,976 - - - - - - 8,751,355 Waivers - Statutory (Reported in AFR) - - - - - - - - - - Waivers - Institutional (Reported in AFR) - - - - - - - - - - Exemptions - Statutory (Reported in AFR) (80) (196,752) (26,809) - - - - - - (223,641) Exemptions - Institutional (Reported in AFR) - - - - - - - - - - All Other Scholarship Disc.& Allow. (See FN1) (519) (1,198,944) (944,905) - - - - - - (2,144,368) Fees - net 1,786 3,762,298 2,619,262 - - - - - - 6,383,346
Net Tuition and Fees (Funds Collected) 4,530,462 15,186,443 2,619,262 - - - - - - 22,336,167
Federal GovernmentFederal Grants and Contracts - Restricted - - - 9,405,730 - - - - - 9,405,730
Institutional ResourcesEndowment and Interest Income (See FN2) 39,236 167,229 - - - 441,368 - 625 - 648,458 Local Government Grants - Restricted - - - - - - - - - - Private Gifts and Grants - Restricted - - 3,400 2,776,446 - 380 - - - 2,780,226 Sales and Services - 201,062 - - - - - - - 201,062 Net Auxiliary Enterprises (See FN9) - - 2,591,030 - - - - - - 2,591,030 Other Income (See FN3) - 4,831,071 - - - - - 85,214 - 4,916,285 Subtotal 39,236 5,199,362 2,594,430 2,776,446 - 441,748 - 85,839 - 11,137,061 Total Operating Sources 26,812,665 20,385,805 5,213,692 14,681,093 - 441,748 - 85,839 - 67,620,842
Operating UsesInstruction 15,800,514 2,712,675 - 87,186 - - - - - 18,600,375 Research 266,433 18,849 - 47,531 - - - - - 332,813 Public Service 331,299 197,271 9,667 312,816 - - - - - 851,053 Academic Support 3,897,720 6,564,616 - 355,373 - - - - - 10,817,709 Student Services 722,830 3,923,059 2,875,027 25,067 7,194 - - - - 7,553,177 Institutional Support 2,646,740 3,419,559 26,892 33,074 - - - - - 6,126,265 Operations and Maintenance of Plant 981,217 1,271,503 - 17,578 - - - - - 2,270,298 Scholarships and Fellowships 124,441 1,674,163 1,587 5,628,813 - - - - - 7,429,004 Auxiliary Enterprises (See FN9) - - 2,147,612 61,121 - - - - - 2,208,733 Capital Outlay from Current Fund Sources* 156,145 143,747 - 197,246 - - - - - 497,138 Other Expenses (See FN3) - 249,473 - - - - 2,195,933 7,872 756 2,454,034 Total Operating Uses 24,927,339 20,174,915 5,060,785 6,765,805 7,194 - 2,195,933 7,872 756 59,140,599
Other Sources / (Uses) of FundsCapital Outlay from Non-Current Fund Sources** - - - - - - (29,129,277) - - (29,129,277) Mandatory and Non-mandatory Transfers (See FN10) (1,838,055) 2,945,176 (2,484,209) (7,272,209) (50,000) (571,254) (4,384,041) 4,254,976 15,498,253 6,098,637 Bond Proceeds Transfers In (See FN4) - - - - - - - - - - Debt Service Payments (See FN5) - - - - - - - (8,748,545) - (8,748,545) Subtotal (1,838,055) 2,945,176 (2,484,209) (7,272,209) (50,000) (571,254) (33,513,318) (4,493,569) 15,498,253 (31,779,185)
Other Items Not for Current Operating UseUnrealized Gains / (Losses) (See FN6) - 21,613 - - - (142,505) - - - (120,892) Additions to Permanent Endowments (See FN7) - - - - - 95,713 - - - 95,713 Subtotal - 21,613 - - - (46,792) - - - (25,179)
Total Sources Over / (Under) Uses (See FN 11) 47,271 3,177,679 (2,331,302) 643,079 (57,194) (176,298) (35,709,251) (4,415,602) 15,497,497 (23,324,121)
Bond Proceeds - - - - - - - 4,453,644 - 4,453,644 Depreciation Expense - - - - - - - - (3,443,202) (3,443,202) Transfer of Capital Asses(s) from System - - - - - - - - - - Other Post-Employment Benefit (OPEB) Expense - - - - - - - - - - Non-Cash Capital Gifts - - - - - - - - - - Capital Outlay 156,145 143,747 - 197,246 - - 29,129,277 - - 29,626,415 Change in Net Assets (Total Agrees with AFR***) 203,416 3,321,426 (2,331,302) 840,325 (57,194) (176,298) (6,579,974) 38,042 12,054,295 7,312,736
*Defined as any capital outlay expenses from Educational & General, Designated, Auxiliary, or Restricted Expendable Funds.**Defined as any capital outlay expense from funds other than Educational & General, Designated, Auxiliary, or Restricted Expendable.***As reported for "Changes in Net Position" shown on Schedule of Revenues, Expenses, and Changes in Net Position (SRECNP) in Annual Financial Report.
University of Houston - VictoriaFor the Year Ended August 31, 2019Source: FY 2019 Annual Financial Report
Detail Worksheet FY 2019
Texas Higher Education Coordinating Board 108 June, 2020

University of Houston - VictoriaFor the Year Ended August 31, 2019Source: FY 2019 Annual Financial Report
FOOTNOTES:
FN1: Scholarship Discounts and Allowances are scholarships, fellowships, and grants applied to tuition. The discount eliminates tuition revenues that are paid for by University resources which are recorded as revenue elsewhere on the financial statements (i.e. federal and state contracts and grants revenues). In addition, Scholarship Discounts and Allowances eliminate tuition revenue that is exempted from payment due to tuition exemptions approved by the Texas Legislature. Waivers, remissions, and exemptions represent tuition and fee dollars forgone by the university - some are required by statute. See the Integrated Financial Reporting System (IFRS) report submitted to THECB for details on waivers, exemptions, tuition, and fees. Allocation methods to individual funds shown may vary between institutions.
FN2: Endowment and Interest Income includes interest income and endowment payouts.
FN3: Other Income is primarily Other Operating and Other Non-operating Revenues from the AFR. Other Expenses is primarily Other Nonoperating Expenses from the AFR.
FN4: Bond Proceeds are funds received from the sale of bonds and commercial paper used to finance capital projects. This amount includes actual proceeds and accrued or anticipated proceeds to be transferred from System. Independent institutions report only to the extent expended in current year.
FN5: Debt service payments are payments to service and retire debt issued to fund capital projects. System components do this via transfers to System Administrations. Independent institutions use direct payment to appropriate paying agents.
FN6: Unrealized Gains / (Losses) represent the increase in the Fair Market Value of Investments and Endowments. Unrealized Gains / (Losses) are accrued as non-cash transactions. Therefore, funds are not actually received for this revenue stream. Accordingly, this revenue is not cash revenue and cannot be used by the University to fund operations.
FN7: Additions to Permanent Endowments are additions to endowment principal. This revenue is restricted for investment purposes only and cannot be used to fund operations. Only interest income from these endowments, which is reported on the Endowment and Investment Income line of this report, can be used by the University to fund operations.
FN8: Distributions from the Available University Fund appropriated through the Appropriation Bill are first used to pay debt service costs on Permanent University Fund Bonds. Funds remaining are distributed to constitutionally designated institutions to promote academic excellence. Only the Excellence funding is shown at the institution level. The AUF funds used to pay debt service on PUF bonds are reported at the System level.
FN9: Auxiliary Enterprises include athletics, housing and food, student services, and parking and transportation. Auxiliary Enterprises are required to be self-supporting, and therefore must operate on the funds they generate.
FN10: Mandatory and non-mandatory transfers includes transfers between funds, transfers between the University System and institutions and transfers to and from other state agencies. In total, all transfers between funds net to zero with the exception of any amounts transferred between the University System, between other institutions, or to and from another state agency. There are no transfers of education and general funds provided by the State of Texas to restricted or auxiliary fund groups. Transfers between education and general funds and designated funds are related to Texas Public Education Grant as provided by the State of Texas.
FN11. N/A
Texas Higher Education Coordinating Board 109 June, 2020

Lamar University For the Year Ended August 31, 2019Source: FY 2019 Annual Financial Report
Non-Operating Funds are not included in above charts. See following page (Summary).Charts May Not Add to 100% Due to Rounding
Total Operating Sources $234,656,568
Total Operating Sources $234,656,568
Total Operating Uses $213,464,830
State of Texas$83,910,900
36%
Student & Parent$91,566,793
39%
Federal Government$22,741,363
10%
Institutional Resources$36,437,512
15%
Operating Sources by Category
State Appropriations$62,182,885
26%
State Grants & Contracts$7,626,133
3%
Higher Education Fund$14,101,882
6%Tuition & Fees
$91,566,79339%
Federal Grants & Contracts
$22,741,36310%
Endowment & Interest Income
$1,855,7781%
Local Government Grants
$1,836,9651%
Private Gifts & Grants$6,378,892
3%
Sales & Services$338,135
0%
Net Auxiliary Enterprises$24,644,399
10%
Other Income$1,383,343
1%
Operating Sources
Instruction$67,294,390
32%
Research$4,290,404
2%
Public Service$1,934,414
1%
Academic Support$34,261,022
16%
Student Services$10,430,468
5% Institutional Support$23,449,654
11%
Operations & Maintenance of Plant
$13,313,2936%
Scholarships & Fellowships$25,010,706
12%
Auxiliary Enterprises$30,711,983
14%Capital Outlay
$2,774,0891%
Other Expenses-$5,593
0%
Operating Uses
Texas Higher Education Coordinating Board 110 June, 2020

Lamar University For the Year Ended August 31, 2019Source: FY 2019 Annual Financial Report
Summary Worksheet FY 2019 Amount Per FTSEInstitution State Funded FTSEs 12,498.99
Operating SourcesState of TexasState Appropriations 62,182,885$ 4,975$ State Grants and Contracts - Restricted 7,626,133 610 Higher Education Fund 14,101,882 1,128 Available University Fund Excellence (See FN8) - - Subtotal 83,910,900$ 6,713$
Student & ParentTuition - net 68,150,146$ 5,452$ Fees - net 23,416,647 1,873 Tuition and Fees (net of Scholarship Discounts and Allowances) 91,566,793$ 7,325$
Federal GovernmentFederal Grants and Contracts - Restricted 22,741,363$ 1,819$
Institutional ResourcesEndowment and Interest Income (See FN2) 1,855,778$ 148$ Local Government Grants - Restricted 1,836,965 147 Private Gifts and Grants - Restricted 6,378,892 510 Sales and Services 338,135 27 Net Auxiliary Enterprises (See FN9) 24,644,399 1,972 Other Income (See FN3) 1,383,343 111 Subtotal 36,437,512$ 2,915$ Total Operating Sources 234,656,568$ 18,772$
Operating UsesInstruction 67,294,390$ 5,384$ Research 4,290,404 343 Public Service 1,934,414 155 Academic Support 34,261,022 2,741 Student Services 10,430,468 835 Institutional Support 23,449,654 1,876 Operations and Maintenance of Plant 13,313,293 1,065 Scholarships and Fellowships 25,010,706 2,001 Auxiliary Enterprises (See FN9) 30,711,983 2,457 Capital Outlay from Current Fund Sources 2,774,089 222 Other Expenses (See FN3) (5,593) - Total Operating Uses 213,464,830$ 17,079$
Other Sources / (Uses) of FundsCapital Outlay from Non-Current Fund Sources (2,381,020) (190)$ Mandatory and Non-mandatory Transfers (See FN10) (2,509,458) (201) Bond Proceeds Transfers (See FN4) - - Debt Service Payments (See FN5) (16,648,748) (1,332) Subtotal (21,539,226)$ (1,723)$
Other Items Not for Current Operating UseUnrealized Gains / (Losses) (See FN6) 61,111 5$ Additions to Permanent Endowments (See FN7) - - Subtotal 61,111$ 5$
Total Sources Over / (Under) Uses (See FN11) (286,377)$ (25)$
Texas Higher Education Coordinating Board 111 June, 2020

FY 2019
Operating SourcesEducational &
General DesignatedAuxiliary
EnterprisesRestricted Expendable Loan Funds
Annuity, Life & Endowment and
Similar FundsUnexpended
PlantRetirement of Indebtedness
Investment In Plant Primary University
State of TexasState Appropriations 62,182,885 - - - - - - - - 62,182,885 State Grants and Contracts - Restricted 459,969 - - 7,166,164 - - - - - 7,626,133 Higher Education Fund 14,101,882 - - - - - - - - 14,101,882 Available University Fund Excellence (See FN8) - - - - - - - - - - Subtotal 76,744,736 - - 7,166,164 - - - - - 83,910,900
Student & ParentTuition Potential 100% 25,103,615 70,720,551 - - - - - - - 95,824,166 Waivers - Statutory (Not Reported in AFR) (5,366,152) (41,812) - - - - - - - (5,407,964) Waivers - Institutional (Not Reported in AFR) - - - - - - - - - - Exemptions - Statutory (Not Reported in AFR) - - - - - - - - - - Exemptions - Institutional (Not Reported in AFR) - - - - - - - - - - Tuition - Gross - AFR Presentation 19,737,463 70,678,739 - - - - - - - 90,416,202 Waivers - Statutory (Reported in AFR) - - - - - - - - - - Waivers - Institutional (Reported in AFR) (167,635) (18,925) - - - - - - - (186,560) Exemptions - Statutory (Reported in AFR) (986,173) (3,231,060) - - - - - - - (4,217,233) Exemptions - Institutional (Reported in AFR) - - - - - - - - - - All Other Scholarship Disc.& Allow. (See FN1) (4,679,331) (13,182,932) - - - - - - - (17,862,263) Tuition - net 13,904,324 54,245,822 - - - - - - - 68,150,146
Fees Potential 100% 20,836 20,536,373 9,976,428 - - - - - - 30,533,637 Waivers - Statutory (Not Reported in AFR) (34) (11,522) (9,470) - - - - - - (21,026) Waivers - Institutional (Not Reported in AFR) - - - - - - - - - - Exemptions - Statutory (Not Reported in AFR) - - - - - - - - - - Exemptions - Institutional (Not Reported in AFR) - - - - - - - - - - Fees - Gross - AFR Presentation 20,802 20,524,851 9,966,958 - - - - - - 30,512,611 Waivers - Statutory (Reported in AFR) - - - - - - - - - - Waivers - Institutional (Reported in AFR) - - - - - - - - - - Exemptions - Statutory (Reported in AFR) (2,746) (993,667) (402,491) - - - - - - (1,398,904) Exemptions - Institutional (Reported in AFR) - - - - - - - - - - All Other Scholarship Disc.& Allow. (See FN1) (1,660) (3,766,093) (1,929,307) - - - - - - (5,697,060) Fees - net 16,396 15,765,091 7,635,160 - - - - - - 23,416,647
Net Tuition and Fees (Funds Collected) 13,920,720 70,010,913 7,635,160 - - - - - - 91,566,793
Federal GovernmentFederal Grants and Contracts - Restricted - - - 22,741,363 - - - - - 22,741,363
Institutional ResourcesEndowment and Interest Income (See FN2) 116,555 450,919 - 953,022 26,742 - 308,540 - - 1,855,778 Local Government Grants - Restricted - 242,024 - 1,594,941 - - - - - 1,836,965 Private Gifts and Grants - Restricted - 88,098 346,754 5,534,752 - 336,275 10,000 - 63,013 6,378,892 Sales and Services 9,957 - - 328,178 - - - - - 338,135 Net Auxiliary Enterprises (See FN9) - 2,052,232 22,592,167 - - - - - - 24,644,399 Other Income (See FN3) - 509,477 720,494 153,372 - - - - - 1,383,343 Subtotal 126,512 3,342,750 23,659,415 8,564,265 26,742 336,275 318,540 - 63,013 36,437,512 Total Operating Sources 90,791,968 73,353,663 31,294,575 38,471,792 26,742 336,275 318,540 - 63,013 234,656,568
Operating UsesInstruction 61,444,672 5,365,913 - 483,805 - - - - - 67,294,390 Research 776,796 1,416,464 - 2,097,144 - - - - - 4,290,404 Public Service 257,251 767,496 - 909,667 - - - - - 1,934,414 Academic Support 5,102,370 27,256,944 - 1,901,708 - - - - - 34,261,022 Student Services 6,991,796 3,346,486 - 92,186 - - - - - 10,430,468 Institutional Support 10,061,913 12,777,630 - 610,111 - - - - - 23,449,654 Operations and Maintenance of Plant 6,114,991 7,198,302 - - - - - - - 13,313,293 Scholarships and Fellowships (4,173,968) (1,527,257) - 30,711,931 - - - - - 25,010,706 Auxiliary Enterprises (See FN9) - - 30,711,983 - - - - - - 30,711,983 Capital Outlay from Current Fund Sources* 1,425,899 206,565 277,559 864,066 - - - - - 2,774,089 Other Expenses (See FN3) - - - - (5,593) - - - - (5,593) Total Operating Uses 88,001,720 56,808,543 30,989,542 37,670,618 (5,593) - - - - 213,464,830
Other Sources / (Uses) of FundsCapital Outlay from Non-Current Fund Sources** - - - - - - (24,813,913) - 22,432,893 (2,381,020) Mandatory and Non-mandatory Transfers (See FN10) 73,947 (20,810,852) 5,710,318 174,993 190,282 - 12,153,848 - (1,994) (2,509,458) Bond Proceeds Transfers In (See FN4) - - - - - - - - - - Debt Service Payments (See FN5) (6,470,138) (214,119) (9,964,491) - - - - - - (16,648,748) Subtotal (6,396,191) (21,024,971) (4,254,173) 174,993 190,282 - (12,660,065) - 22,430,899 (21,539,226)
Other Items Not for Current Operating UseUnrealized Gains / (Losses) (See FN6) - 163,310 - - - (102,199) - - - 61,111 Additions to Permanent Endowments (See FN7) - - - - - - - - - - Subtotal - 163,310 - - - (102,199) - - - 61,111
Total Sources Over / (Under) Uses (See FN 11) (3,605,943) (4,316,541) (3,949,140) 976,167 222,617 234,076 (12,341,525) - 22,493,912 (286,377)
Bond Proceeds - - - - - - - - - - Depreciation Expense - - - - - - - - (11,620,892) (11,620,892) Transfer of Capital Asses(s) from System - - - - - - - - - - Other Post-Employment Benefit (OPEB) Expense - - - - - - - - - - Non-Cash Capital Gifts - - - - - - - - - - Capital Outlay - - - - - - - - 2,774,089 2,774,089 Change in Net Assets (Total Agrees with AFR***) (3,605,943) (4,316,541) (3,949,140) 976,167 222,617 234,076 (12,341,525) - 13,647,109 (9,133,180)
*Defined as any capital outlay expenses from Educational & General, Designated, Auxiliary, or Restricted Expendable Funds.**Defined as any capital outlay expense from funds other than Educational & General, Designated, Auxiliary, or Restricted Expendable.***As reported for "Changes in Net Position" shown on Schedule of Revenues, Expenses, and Changes in Net Position (SRECNP) in Annual Financial Report.
Lamar University For the Year Ended August 31, 2019Source: FY 2019 Annual Financial Report
Detail Worksheet FY 2019
Texas Higher Education Coordinating Board 112 June, 2020

Lamar University For the Year Ended August 31, 2019Source: FY 2019 Annual Financial Report
FOOTNOTES:
FN1: Scholarship Discounts and Allowances are scholarships, fellowships, and grants applied to tuition. The discount eliminates tuition revenues that are paid for by University resources which are recorded as revenue elsewhere on the financial statements (i.e. federal and state contracts and grants revenues). In addition, Scholarship Discounts and Allowances eliminate tuition revenue that is exempted from payment due to tuition exemptions approved by the Texas Legislature. Waivers, remissions, and exemptions represent tuition and fee dollars forgone by the university - some are required by statute. See the Integrated Financial Reporting System (IFRS) report submitted to THECB for details on waivers, exemptions, tuition, and fees. Allocation methods to individual funds shown may vary between institutions.
FN2: Endowment and Interest Income includes interest income and endowment payouts.
FN3: Other Income is primarily Other Operating and Other Non-operating Revenues from the AFR. Other Expenses is primarily Other Nonoperating Expenses from the AFR.
FN4: Bond Proceeds are funds received from the sale of bonds and commercial paper used to finance capital projects. This amount includes actual proceeds and accrued or anticipated proceeds to be transferred from System. Independent institutions report only to the extent expended in current year.
FN5: Debt service payments are payments to service and retire debt issued to fund capital projects. System components do this via transfers to System Administrations. Independent institutions use direct payment to appropriate paying agents.
FN6: Unrealized Gains / (Losses) represent the increase in the Fair Market Value of Investments and Endowments. Unrealized Gains / (Losses) are accrued as non-cash transactions. Therefore, funds are not actually received for this revenue stream. Accordingly, this revenue is not cash revenue and cannot be used by the University to fund operations.
FN7: Additions to Permanent Endowments are additions to endowment principal. This revenue is restricted for investment purposes only and cannot be used to fund operations. Only interest income from these endowments, which is reported on the Endowment and Investment Income line of this report, can be used by the University to fund operations.
FN8: Distributions from the Available University Fund appropriated through the Appropriation Bill are first used to pay debt service costs on Permanent University Fund Bonds. Funds remaining are distributed to constitutionally designated institutions to promote academic excellence. Only the Excellence funding is shown at the institution level. The AUF funds used to pay debt service on PUF bonds are reported at the System level.
FN9: Auxiliary Enterprises include athletics, housing and food, student services, and parking and transportation. Auxiliary Enterprises are required to be self-supporting, and therefore must operate on the funds they generate.
FN10: Mandatory and non-mandatory transfers includes transfers between funds, transfers between the University System and institutions and transfers to and from other state agencies. In total, all transfers between funds net to zero with the exception of any amounts transferred between the University System, between other institutions, or to and from another state agency. There are no transfers of education and general funds provided by the State of Texas to restricted or auxiliary fund groups. Transfers between education and general funds and designated funds are related to Texas Public Education Grant as provided by the State of Texas.
FN11. N/A
Texas Higher Education Coordinating Board 113 June, 2020

Sam Houston State University - Academic & Health (A+H)(Excludes Medical School)For the Year Ended August 31, 2019Source: FY 2019 Annual Financial Report
Non-Operating Funds are not included in above charts. See following page (Summary).Charts May Not Add to 100% Due to Rounding
Total Operating Sources $382,754,352
Total Operating Sources $382,754,352
Total Operating Uses $323,461,292
State of Texas$107,919,525
28%
Student & Parent$165,358,086
43%
Federal Government$47,039,725
12%
Institutional Resources$62,437,016
17%
Operating Sources by Category
State Appropriations$71,685,627
19%
State Grants & Contracts
$18,904,0405%
Higher Education Fund$17,329,858
5%
Tuition & Fees$165,358,086
43%
Federal Grants & Contracts
$47,039,72512%
Endowment & Interest Income
$5,272,2121%
Local Government Grants
$3,982,6641%
Private Gifts & Grants$4,835,047
1%
Sales & Services$4,059,913
1%
Net Auxiliary Enterprises
$37,279,085…
Other Income$7,008,095
2%
Operating Sources
Instruction$102,806,526
32%
Research$9,000,749
3%
Public Service$12,353,689
4%
Academic Support$43,182,529
13%
Student Services$28,737,055
9%Institutional Support
$21,939,9157%
Operations & Maintenance of Plant
$23,059,2407%
Scholarships & Fellowships$30,981,653
9%
Auxiliary Enterprises$48,433,381
15%Capital Outlay$2,656,970
1%
Other Expenses$309,585
0%
Operating Uses
Texas Higher Education Coordinating Board 114 June, 2020

Sam Houston State University - Academic & Health (A+H)(Excludes Medical School)For the Year Ended August 31, 2019Source: FY 2019 Annual Financial Report
Summary Worksheet FY 2019 Amount Per FTSEInstitution State Funded FTSEs 18,153.95
Operating SourcesState of TexasState Appropriations 71,685,627$ 3,949$ State Grants and Contracts - Restricted 18,904,040 1,041 Higher Education Fund 17,329,858 955 Available University Fund Excellence (See FN8) - - Subtotal 107,919,525$ 5,945$
Student & ParentTuition - net 125,728,949$ 6,926$ Fees - net 39,629,137 2,183 Tuition and Fees (net of Scholarship Discounts and Allowances) 165,358,086$ 9,109$
Federal GovernmentFederal Grants and Contracts - Restricted 47,039,725$ 2,591$
Institutional ResourcesEndowment and Interest Income (See FN2) 5,272,212$ 290$ Local Government Grants - Restricted 3,982,664 219 Private Gifts and Grants - Restricted 4,835,047 266 Sales and Services 4,059,913 224 Net Auxiliary Enterprises (See FN9) 37,279,085 2,053 Other Income (See FN3) 7,008,095 386 Subtotal 62,437,016$ 3,438$ Total Operating Sources 382,754,352$ 21,083$
Operating UsesInstruction 102,806,526$ 5,663$ Research 9,000,749 496 Public Service 12,353,689 680 Academic Support 43,182,529 2,379 Student Services 28,737,055 1,583 Institutional Support 21,939,915 1,209 Operations and Maintenance of Plant 23,059,240 1,270 Scholarships and Fellowships 30,981,653 1,707 Auxiliary Enterprises (See FN9) 48,433,381 2,668 Capital Outlay from Current Fund Sources 2,656,970 146 Other Expenses (See FN3) 309,585 17 Total Operating Uses 323,461,292$ 17,818$
Other Sources / (Uses) of FundsCapital Outlay from Non-Current Fund Sources (73,442,215) (4,046)$ Mandatory and Non-mandatory Transfers (See FN10) 16,776,550 924 Bond Proceeds Transfers (See FN4) - - Debt Service Payments (See FN5) - - Subtotal (56,665,665)$ (3,122)$
Other Items Not for Current Operating UseUnrealized Gains / (Losses) (See FN6) (12,934,826) (713)$ Additions to Permanent Endowments (See FN7) 8,083,498 445 Subtotal (4,851,328)$ (268)$
Total Sources Over / (Under) Uses (See FN11) (2,223,933)$ (125)$
Texas Higher Education Coordinating Board 115 June, 2020

(Excludes Medical School)
FY 2019
Operating SourcesEducational &
General DesignatedAuxiliary
EnterprisesRestricted Expendable Loan Funds
Annuity, Life & Endowment and
Similar FundsUnexpended
PlantRetirement of Indebtedness
Investment In Plant Primary University
State of TexasState Appropriations 71,685,627 - - - - - - - - 71,685,627 State Grants and Contracts - Restricted - - - 18,904,040 - - - - - 18,904,040 Higher Education Fund 17,329,858 - - - - - - - - 17,329,858 Available University Fund Excellence (See FN8) - - - - - - - - - - Subtotal 89,015,485 - - 18,904,040 - - - - - 107,919,525
Student & ParentTuition Potential 100% 38,275,164 101,556,866 - - - - - - - 139,832,030 Waivers - Statutory (Not Reported in AFR) - - - - - - - - - - Waivers - Institutional (Not Reported in AFR) - - - - - - - - - - Exemptions - Statutory (Not Reported in AFR) - - - - - - - - - - Exemptions - Institutional (Not Reported in AFR) - - - - - - - - - - Tuition - Gross - AFR Presentation 38,275,164 101,556,866 - - - - - - - 139,832,030 Waivers - Statutory (Reported in AFR) (5,134,132) (39,739) - - - - - - - (5,173,871) Waivers - Institutional (Reported in AFR) - - - - - - - - - - Exemptions - Statutory (Reported in AFR) (3,110,675) (5,818,535) - - - - - - - (8,929,210) Exemptions - Institutional (Reported in AFR) - - - - - - - - - - All Other Scholarship Disc.& Allow. (See FN1) - - - - - - - - - - Tuition - net 30,030,357 95,698,592 - - - - - - - 125,728,949
Fees Potential 100% 458,062 71,734,854 10,868,988 - - - - - - 83,061,904 Waivers - Statutory (Not Reported in AFR) - - - - - - - - - - Waivers - Institutional (Not Reported in AFR) - - - - - - - - - - Exemptions - Statutory (Not Reported in AFR) - - - - - - - - - - Exemptions - Institutional (Not Reported in AFR) - - - - - - - - - - Fees - Gross - AFR Presentation 458,062 71,734,854 10,868,988 - - - - - - 83,061,904 Waivers - Statutory (Reported in AFR) - - - - - - - - - - Waivers - Institutional (Reported in AFR) - - - - - - - - - - Exemptions - Statutory (Reported in AFR) - (6,058,183) (74,002) - - - - - - (6,132,185) Exemptions - Institutional (Reported in AFR) - - - - - - - - - - All Other Scholarship Disc.& Allow. (See FN1) - (37,300,582) - - - - - - - (37,300,582) Fees - net 458,062 28,376,089 10,794,986 - - - - - - 39,629,137
Net Tuition and Fees (Funds Collected) 30,488,419 124,074,681 10,794,986 - - - - - - 165,358,086
Federal GovernmentFederal Grants and Contracts - Restricted - - - 47,039,725 - - - - - 47,039,725
Institutional ResourcesEndowment and Interest Income (See FN2) 28 3,170,067 190 - - 1,947,273 154,654 - - 5,272,212 Local Government Grants - Restricted - - - 3,982,664 - - - - - 3,982,664 Private Gifts and Grants - Restricted - 56,363 197,182 4,396,227 - - 185,275 - - 4,835,047 Sales and Services 341,292 2,134,691 110,647 1,473,283 - - - - - 4,059,913 Net Auxiliary Enterprises (See FN9) - - 37,279,085 - - - - - - 37,279,085 Other Income (See FN3) 5,541,498 707,126 724,546 307,508 129 - (272,712) - - 7,008,095 Subtotal 5,882,818 6,068,247 38,311,650 10,159,682 129 1,947,273 67,217 - - 62,437,016 Total Operating Sources 125,386,722 130,142,928 49,106,636 76,103,447 129 1,947,273 67,217 - - 382,754,352
Operating UsesInstruction 65,826,736 35,599,597 - 1,380,193 - - - - - 102,806,526 Research 1,188,843 3,185,107 - 4,626,799 - - - - - 9,000,749 Public Service 6,057,428 654,944 - 5,641,317 - - - - - 12,353,689 Academic Support 10,348,788 31,961,813 - 871,928 - - - - - 43,182,529 Student Services 5,217,642 23,198,948 359 139,134 31,814 - 149,158 - - 28,737,055 Institutional Support 6,060,003 15,297,072 - 365,162 - 209,627 8,051 - - 21,939,915 Operations and Maintenance of Plant 8,433,894 11,050,719 2,231 - - - 3,572,396 - - 23,059,240 Scholarships and Fellowships 500 16,572,630 - 14,408,523 - - - - - 30,981,653 Auxiliary Enterprises (See FN9) - 3,554,162 43,402,892 1,476,327 - - - - - 48,433,381 Capital Outlay from Current Fund Sources* 510,094 1,606,784 218,662 321,430 - - - - - 2,656,970 Other Expenses (See FN3) 188,090 122,667 - - (1,172) - - - - 309,585 Total Operating Uses 103,832,018 142,804,443 43,624,144 29,230,813 30,642 209,627 3,729,605 - - 323,461,292
Other Sources / (Uses) of FundsCapital Outlay from Non-Current Fund Sources** - - - - - - (73,442,215) - - (73,442,215) Mandatory and Non-mandatory Transfers (See FN10) (4,628,068) (11,501,162) (9,226,949) - - - 42,132,729 - - 16,776,550 Bond Proceeds Transfers In (See FN4) - - - - - - - - - - Debt Service Payments (See FN5) - - - - - - - - - - Subtotal (4,628,068) (11,501,162) (9,226,949) - - - (31,309,486) - - (56,665,665)
Other Items Not for Current Operating UseUnrealized Gains / (Losses) (See FN6) - (700,586) - - - (12,234,240) - - - (12,934,826) Additions to Permanent Endowments (See FN7) - - - - - 8,083,498 - - - 8,083,498 Subtotal - (700,586) - - - (4,150,742) - - - (4,851,328)
Total Sources Over / (Under) Uses (See FN 11) 16,926,636 (24,863,263) (3,744,457) 46,872,634 (30,513) (2,413,096) (34,971,874) - - (2,223,933)
Bond Proceeds - - - - - - - - - - Depreciation Expense - - - - - - (29,540,563) - - (29,540,563) Transfer of Capital Asses(s) from System - - - - - - - - - - Other Post-Employment Benefit (OPEB) Expense - - - - - - - - - - Non-Cash Capital Gifts - 93,700 - 150,000 - - - - - 243,700 Capital Outlay 510,094 1,513,084 218,662 171,429 - - 73,442,216 - - 75,855,485 Change in Net Assets (Total Agrees with AFR***) 17,436,730 (23,256,479) (3,525,795) 47,194,063 (30,513) (2,413,096) 8,929,779 - - 44,334,689
*Defined as any capital outlay expenses from Educational & General, Designated, Auxiliary, or Restricted Expendable Funds.**Defined as any capital outlay expense from funds other than Educational & General, Designated, Auxiliary, or Restricted Expendable.***As reported for "Changes in Net Position" shown on Schedule of Revenues, Expenses, and Changes in Net Position (SRECNP) in Annual Financial Report.
Sam Houston State University - Academic & Health (A+H)
For the Year Ended August 31, 2019Source: FY 2019 Annual Financial Report
Detail Worksheet FY 2019
Texas Higher Education Coordinating Board 116 June, 2020

Sam Houston State University - Academic & Health (A+H)(Excludes Medical School)For the Year Ended August 31, 2019Source: FY 2019 Annual Financial ReportFOOTNOTES:
FN1: Scholarship Discounts and Allowances are scholarships, fellowships, and grants applied to tuition. The discount eliminates tuition revenues that are paid for by University resources which are recorded as revenue elsewhere on the financial statements (i.e. federal and state contracts and grants revenues). In addition, Scholarship Discounts and Allowances eliminate tuition revenue that is exempted from payment due to tuition exemptions approved by the Texas Legislature. Waivers, remissions, and exemptions represent tuition and fee dollars forgone by the university - some are required by statute. See the Integrated Financial Reporting System (IFRS) report submitted to THECB for details on waivers, exemptions, tuition, and fees. Allocation methods to individual funds shown may vary between institutions.
FN2: Endowment and Interest Income includes interest income and endowment payouts.
FN3: Other Income is primarily Other Operating and Other Non-operating Revenues from the AFR. Other Expenses is primarily Other Nonoperating Expenses from the AFR.
FN4: Bond Proceeds are funds received from the sale of bonds and commercial paper used to finance capital projects. This amount includes actual proceeds and accrued or anticipated proceeds to be transferred from System. Independent institutions report only to the extent expended in current year.
FN5: Debt service payments are payments to service and retire debt issued to fund capital projects. System components do this via transfers to System Administrations. Independent institutions use direct payment to appropriate paying agents.
FN6: Unrealized Gains / (Losses) represent the increase in the Fair Market Value of Investments and Endowments. Unrealized Gains / (Losses) are accrued as non-cash transactions. Therefore, funds are not actually received for this revenue stream. Accordingly, this revenue is not cash revenue and cannot be used by the University to fund operations.
FN7: Additions to Permanent Endowments are additions to endowment principal. This revenue is restricted for investment purposes only and cannot be used to fund operations. Only interest income from these endowments, which is reported on the Endowment and Investment Income line of this report, can be used by the University to fund operations.
FN8: Distributions from the Available University Fund appropriated through the Appropriation Bill are first used to pay debt service costs on Permanent University Fund Bonds. Funds remaining are distributed to constitutionally designated institutions to promote academic excellence. Only the Excellence funding is shown at the institution level. The AUF funds used to pay debt service on PUF bonds are reported at the System level.
FN9: Auxiliary Enterprises include athletics, housing and food, student services, and parking and transportation. Auxiliary Enterprises are required to be self-supporting, and therefore must operate on the funds they generate.
FN10: Mandatory and non-mandatory transfers includes transfers between funds, transfers between the University System and institutions and transfers to and from other state agencies. In total, all transfers between funds net to zero with the exception of any amounts transferred between the University System, between other institutions, or to and from another state agency. There are no transfers of education and general funds provided by the State of Texas to restricted or auxiliary fund groups. Transfers between education and general funds and designated funds are related to Texas Public Education Grant as provided by the State of Texas.
FN11. N/A
Texas Higher Education Coordinating Board 117 June, 2020

Texas State UniversityFor the Year Ended August 31, 2019Source: FY 2019 Annual Financial Report
Non-Operating Funds are not included in above charts. See following page (Summary).Charts May Not Add to 100% Due to Rounding
Total Operating Sources $729,966,304
Total Operating Sources $729,966,304
Total Operating Uses $596,282,828
State of Texas$211,197,383
29%
Student & Parent$280,579,713
39%
Federal Government$97,998,921
13%
Institutional Resources$140,190,287
19%
Operating Sources by Category
State Appropriations$135,040,414
19%
State Grants & Contracts
$38,994,2145%
Higher Education Fund$37,162,755
5%Tuition & Fees$280,579,713
39%
Federal Grants & Contracts
$97,998,92113%
Endowment & Interest Income
$22,399,6833%
Private Gifts & Grants$14,882,297
2%
Sales & Services$14,474,134
2%
Net Auxiliary Enterprises$86,184,422
12%
Other Income$1,829,786
0%
Operating Sources
Instruction$218,093,236
37%
Research$57,341,070
10%
Public Service$4,241,082
1%
Academic Support$50,899,995
9%Student Services
$35,946,5686%
Institutional Support$36,799,540
6%
Operations & Maintenance of Plant
$44,013,6737%
Scholarships & Fellowships$55,532,938
9%
Auxiliary Enterprises$80,016,887
13%Capital Outlay
$11,100,8522%
Other Expenses$2,296,987
0%
Operating Uses
Texas Higher Education Coordinating Board 118 June, 2020
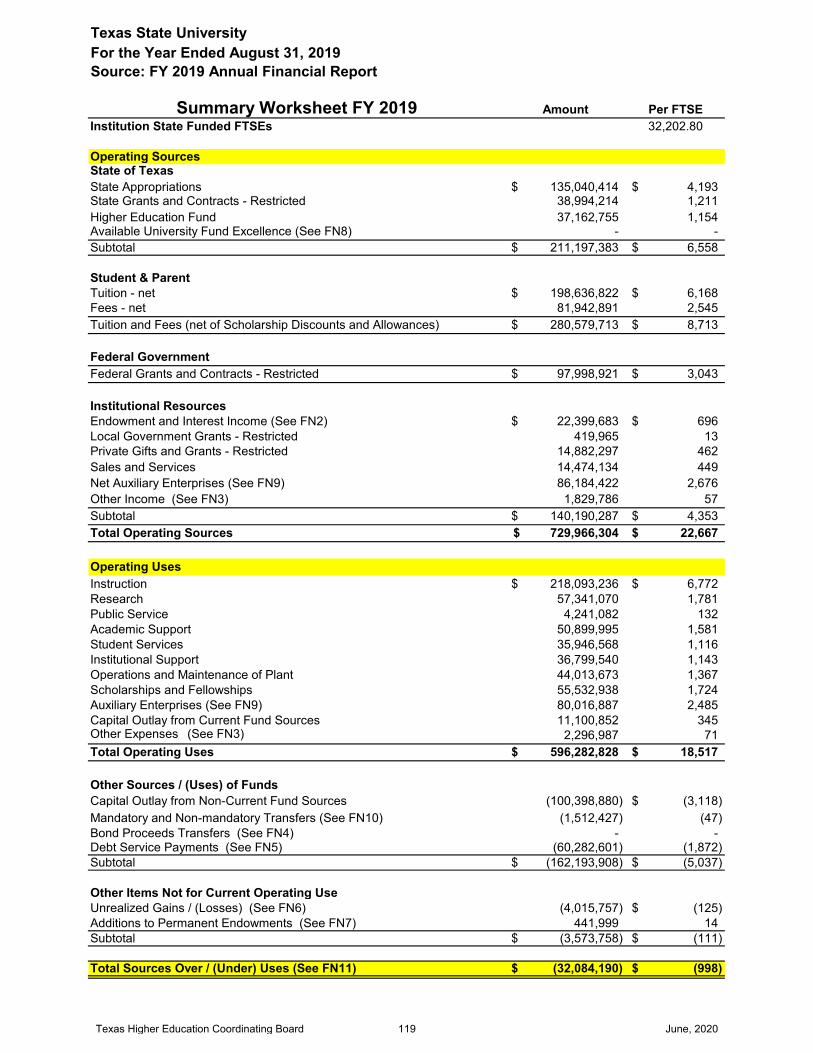
Texas State UniversityFor the Year Ended August 31, 2019Source: FY 2019 Annual Financial Report
Summary Worksheet FY 2019 Amount Per FTSEInstitution State Funded FTSEs 32,202.80
Operating SourcesState of TexasState Appropriations 135,040,414$ 4,193$ State Grants and Contracts - Restricted 38,994,214 1,211 Higher Education Fund 37,162,755 1,154 Available University Fund Excellence (See FN8) - - Subtotal 211,197,383$ 6,558$
Student & ParentTuition - net 198,636,822$ 6,168$ Fees - net 81,942,891 2,545 Tuition and Fees (net of Scholarship Discounts and Allowances) 280,579,713$ 8,713$
Federal GovernmentFederal Grants and Contracts - Restricted 97,998,921$ 3,043$
Institutional ResourcesEndowment and Interest Income (See FN2) 22,399,683$ 696$ Local Government Grants - Restricted 419,965 13 Private Gifts and Grants - Restricted 14,882,297 462 Sales and Services 14,474,134 449 Net Auxiliary Enterprises (See FN9) 86,184,422 2,676 Other Income (See FN3) 1,829,786 57 Subtotal 140,190,287$ 4,353$ Total Operating Sources 729,966,304$ 22,667$
Operating UsesInstruction 218,093,236$ 6,772$ Research 57,341,070 1,781 Public Service 4,241,082 132 Academic Support 50,899,995 1,581 Student Services 35,946,568 1,116 Institutional Support 36,799,540 1,143 Operations and Maintenance of Plant 44,013,673 1,367 Scholarships and Fellowships 55,532,938 1,724 Auxiliary Enterprises (See FN9) 80,016,887 2,485 Capital Outlay from Current Fund Sources 11,100,852 345 Other Expenses (See FN3) 2,296,987 71 Total Operating Uses 596,282,828$ 18,517$
Other Sources / (Uses) of FundsCapital Outlay from Non-Current Fund Sources (100,398,880) (3,118)$ Mandatory and Non-mandatory Transfers (See FN10) (1,512,427) (47) Bond Proceeds Transfers (See FN4) - - Debt Service Payments (See FN5) (60,282,601) (1,872) Subtotal (162,193,908)$ (5,037)$
Other Items Not for Current Operating UseUnrealized Gains / (Losses) (See FN6) (4,015,757) (125)$ Additions to Permanent Endowments (See FN7) 441,999 14 Subtotal (3,573,758)$ (111)$
Total Sources Over / (Under) Uses (See FN11) (32,084,190)$ (998)$
Texas Higher Education Coordinating Board 119 June, 2020

FY 2019
Operating SourcesEducational &
General DesignatedAuxiliary
EnterprisesRestricted Expendable Loan Funds
Annuity, Life & Endowment and
Similar FundsUnexpended
PlantRetirement of Indebtedness
Investment In Plant Primary University
State of TexasState Appropriations 135,040,414 - - - - - - - - 135,040,414 State Grants and Contracts - Restricted 339,351 5,282,615 - 33,372,248 - - - - - 38,994,214 Higher Education Fund 37,162,755 - - - - - - - - 37,162,755 Available University Fund Excellence (See FN8) - - - - - - - - - - Subtotal 172,542,520 5,282,615 - 33,372,248 - - - - - 211,197,383
Student & ParentTuition Potential 100% 63,613,356 220,684,449 - - - - - - - 284,297,805 Waivers - Statutory (Not Reported in AFR) (7,061,689) (131,452) - - - - - - - (7,193,141) Waivers - Institutional (Not Reported in AFR) - - - - - - - - - - Exemptions - Statutory (Not Reported in AFR) - - - - - - - - - - Exemptions - Institutional (Not Reported in AFR) - - - - - - - - - - Tuition - Gross - AFR Presentation 56,551,667 220,552,997 - - - - - - - 277,104,664 Waivers - Statutory (Reported in AFR) - - - - - - - - - - Waivers - Institutional (Reported in AFR) - - - - - - - - - - Exemptions - Statutory (Reported in AFR) (3,305,245) (14,694,705) - - - - - - - (17,999,950) Exemptions - Institutional (Reported in AFR) - - - - - - - - - - All Other Scholarship Disc.& Allow. (See FN1) (12,820,019) (47,647,873) - - - - - - - (60,467,892) Tuition - net 40,426,403 158,210,419 - - - - - - - 198,636,822
Fees Potential 100% 2,500,683 53,710,748 57,305,644 - - - - - - 113,517,075 Waivers - Statutory (Not Reported in AFR) - (17,574) (25,108) - - - - - - (42,682) Waivers - Institutional (Not Reported in AFR) - - - - - - - - - - Exemptions - Statutory (Not Reported in AFR) - - - - - - - - - - Exemptions - Institutional (Not Reported in AFR) - - - - - - - - - - Fees - Gross - AFR Presentation 2,500,683 53,693,174 57,280,536 - - - - - - 113,474,393 Waivers - Statutory (Reported in AFR) - - - - - - - - - - Waivers - Institutional (Reported in AFR) - - - - - - - - - - Exemptions - Statutory (Reported in AFR) (4,982) (2,814,820) (6,498,540) - - - - - - (9,318,342) Exemptions - Institutional (Reported in AFR) - - - - - - - - - - All Other Scholarship Disc.& Allow. (See FN1) (750,822) (12,581,946) (8,880,392) - - - - - - (22,213,160) Fees - net 1,744,879 38,296,408 41,901,604 - - - - - - 81,942,891
Net Tuition and Fees (Funds Collected) 42,171,282 196,506,827 41,901,604 - - - - - - 280,579,713
Federal GovernmentFederal Grants and Contracts - Restricted - - - 97,998,921 - - - - - 97,998,921
Institutional ResourcesEndowment and Interest Income (See FN2) 594,216 5,896,888 1,994,089 519,119 65,942 10,482,732 2,846,697 - - 22,399,683 Local Government Grants - Restricted - - - 419,965 - - - - - 419,965 Private Gifts and Grants - Restricted - 197,945 11,595 14,672,757 - - - - - 14,882,297 Sales and Services 1,313,800 12,995,378 - 161,275 - 3,681 - - - 14,474,134 Net Auxiliary Enterprises (See FN9) - - 86,184,422 - - - - - - 86,184,422 Other Income (See FN3) 12,379 1,387,937 159,558 1,816 101,697 - 166,399 - - 1,829,786 Subtotal 1,920,395 20,478,148 88,349,664 15,774,932 167,639 10,486,413 3,013,096 - - 140,190,287 Total Operating Sources 216,634,197 222,267,590 130,251,268 147,146,101 167,639 10,486,413 3,013,096 - - 729,966,304
Operating UsesInstruction 174,601,872 35,303,925 - 8,187,439 - - - - - 218,093,236 Research 11,749,283 10,266,076 - 35,325,711 - - - - - 57,341,070 Public Service 1,609,177 2,229,780 - 402,125 - - - - - 4,241,082 Academic Support 9,239,123 40,186,422 500 1,473,950 - - - - - 50,899,995 Student Services 6,715,895 10,611,619 17,674,542 944,512 - - - - - 35,946,568 Institutional Support 2,374,764 34,211,558 - 213,218 - - - - - 36,799,540 Operations and Maintenance of Plant 14,806,225 28,904,722 1,273,962 (971,236) - - - - - 44,013,673 Scholarships and Fellowships 242,568 15,273,038 1,984,724 38,032,608 - - - - - 55,532,938 Auxiliary Enterprises (See FN9) - - 79,990,240 26,647 - - - - - 80,016,887 Capital Outlay from Current Fund Sources* 3,264,680 6,238,732 1,279,246 318,194 - - - - - 11,100,852 Other Expenses (See FN3) 1,627,634 142,208 68,997 5,698 309,212 - 143,238 - - 2,296,987 Total Operating Uses 226,231,221 183,368,080 102,272,211 83,958,866 309,212 - 143,238 - - 596,282,828
Other Sources / (Uses) of FundsCapital Outlay from Non-Current Fund Sources** - - - - - - (100,398,880) - - (100,398,880) Mandatory and Non-mandatory Transfers (See FN10) 21,091,864 (88,307,980) 1,464,053 (1,596,983) 1,508 (372,574) 66,207,685 - - (1,512,427) Bond Proceeds Transfers In (See FN4) - - - - - - - - - - Debt Service Payments (See FN5) (23,238,445) (6,541,186) (29,402,970) - - - (1,100,000) - - (60,282,601) Subtotal (2,146,581) (94,849,166) (27,938,917) (1,596,983) 1,508 (372,574) (35,291,195) - - (162,193,908)
Other Items Not for Current Operating UseUnrealized Gains / (Losses) (See FN6) - - - - - (4,015,757) - - - (4,015,757) Additions to Permanent Endowments (See FN7) - - - - - 441,999 - - - 441,999 Subtotal - - - - - (3,573,758) - - - (3,573,758)
Total Sources Over / (Under) Uses (See FN 11) (11,743,605) (55,949,656) 40,140 61,590,252 (140,065) 6,540,081 (32,421,337) - - (32,084,190)
Bond Proceeds - - - - - - - - - - Depreciation Expense - - - - - - - - (61,111,778) (61,111,778) Transfer of Capital Asses(s) from System - - - - - - - - - - Other Post-Employment Benefit (OPEB) Expense - - - - - - - - - - Non-Cash Capital Gifts - 39,600 - - - - - - - 39,600 Capital Outlay 3,264,680 6,238,732 1,279,246 318,194 - - 100,398,880 - - 111,499,732 Change in Net Assets (Total Agrees with AFR***) (8,478,925) (49,671,324) 1,319,386 61,908,446 (140,065) 6,540,081 67,977,543 - (61,111,778) 18,343,364
*Defined as any capital outlay expenses from Educational & General, Designated, Auxiliary, or Restricted Expendable Funds.**Defined as any capital outlay expense from funds other than Educational & General, Designated, Auxiliary, or Restricted Expendable.***As reported for "Changes in Net Position" shown on Schedule of Revenues, Expenses, and Changes in Net Position (SRECNP) in Annual Financial Report.
Texas State UniversityFor the Year Ended August 31, 2019Source: FY 2019 Annual Financial Report
Detail Worksheet FY 2019
Texas Higher Education Coordinating Board 120 June, 2020

Texas State UniversityFor the Year Ended August 31, 2019Source: FY 2019 Annual Financial Report
FOOTNOTES:
FN1: Scholarship Discounts and Allowances are scholarships, fellowships, and grants applied to tuition. The discount eliminates tuition revenues that are paid for by University resources which are recorded as revenue elsewhere on the financial statements (i.e. federal and state contracts and grants revenues). In addition, Scholarship Discounts and Allowances eliminate tuition revenue that is exempted from payment due to tuition exemptions approved by the Texas Legislature. Waivers, remissions, and exemptions represent tuition and fee dollars forgone by the university - some are required by statute. See the Integrated Financial Reporting System (IFRS) report submitted to THECB for details on waivers, exemptions, tuition, and fees. Allocation methods to individual funds shown may vary between institutions.
FN2: Endowment and Interest Income includes interest income and endowment payouts.
FN3: Other Income is primarily Other Operating and Other Non-operating Revenues from the AFR. Other Expenses is primarily Other Nonoperating Expenses from the AFR.
FN4: Bond Proceeds are funds received from the sale of bonds and commercial paper used to finance capital projects. This amount includes actual proceeds and accrued or anticipated proceeds to be transferred from System. Independent institutions report only to the extent expended in current year.
FN5: Debt service payments are payments to service and retire debt issued to fund capital projects. System components do this via transfers to System Administrations. Independent institutions use direct payment to appropriate paying agents.
FN6: Unrealized Gains / (Losses) represent the increase in the Fair Market Value of Investments and Endowments. Unrealized Gains / (Losses) are accrued as non-cash transactions. Therefore, funds are not actually received for this revenue stream. Accordingly, this revenue is not cash revenue and cannot be used by the University to fund operations.
FN7: Additions to Permanent Endowments are additions to endowment principal. This revenue is restricted for investment purposes only and cannot be used to fund operations. Only interest income from these endowments, which is reported on the Endowment and Investment Income line of this report, can be used by the University to fund operations.
FN8: Distributions from the Available University Fund appropriated through the Appropriation Bill are first used to pay debt service costs on Permanent University Fund Bonds. Funds remaining are distributed to constitutionally designated institutions to promote academic excellence. Only the Excellence funding is shown at the institution level. The AUF funds used to pay debt service on PUF bonds are reported at the System level.
FN9: Auxiliary Enterprises include athletics, housing and food, student services, and parking and transportation. Auxiliary Enterprises are required to be self-supporting, and therefore must operate on the funds they generate.
FN10: Mandatory and non-mandatory transfers includes transfers between funds, transfers between the University System and institutions and transfers to and from other state agencies. In total, all transfers between funds net to zero with the exception of any amounts transferred between the University System, between other institutions, or to and from another state agency. There are no transfers of education and general funds provided by the State of Texas to restricted or auxiliary fund groups. Transfers between education and general funds and designated funds are related to Texas Public Education Grant as provided by the State of Texas.
FN11. N/A
Texas Higher Education Coordinating Board 121 June, 2020

Sul Ross State UniversityFor the Year Ended August 31, 2019Source: FY 2019 Annual Financial Report
Non-Operating Funds are not included in above charts. See following page (Summary).Charts May Not Add to 100% Due to Rounding
Total Operating Sources $52,074,876
Total Operating Sources $52,074,876
Total Operating Uses $49,409,447
State of Texas$24,638,865
47%
Student & Parent$6,907,812
13%
Federal Government$9,913,680
19%
Institutional Resources$10,614,519
21%
Operating Sources by Category
State Appropriations$20,029,760
39%
State Grants & Contracts$2,062,844
4%
Higher Education Fund$2,546,261
5%
Tuition & Fees$6,907,812
13%
Federal Grants & Contracts$9,913,680
19%
Endowment & Interest Income-$18,715
0%
Private Gifts & Grants$2,666,313
5%
Sales & Services$1,122,093
2%
Net Auxiliary Enterprises$5,069,934
10%Other Income
$1,774,8943%
Operating Sources
Instruction$12,858,119
26%
Research$1,662,548
3%
Public Service$1,806,937
4%
Academic Support$5,168,627
10%
Student Services$3,422,691
7%Institutional Support
$9,191,23519%Operations &
Maintenance of Plant$4,095,936
8%
Scholarships & Fellowships$2,968,275
6%
Auxiliary Enterprises$6,321,257
13%Capital Outlay$1,413,822
3%
Other Expenses$500,000
1%
Operating Uses
Texas Higher Education Coordinating Board 122 June, 2020

Sul Ross State UniversityFor the Year Ended August 31, 2019Source: FY 2019 Annual Financial Report
Summary Worksheet FY 2019 Amount Per FTSEInstitution State Funded FTSEs 1,985.41
Operating SourcesState of TexasState Appropriations 20,029,760$ 10,088$ State Grants and Contracts - Restricted 2,062,844 1,039 Higher Education Fund 2,546,261 1,282 Available University Fund Excellence (See FN8) - - Subtotal 24,638,865$ 12,409$
Student & ParentTuition - net 4,761,569$ 2,398$ Fees - net 2,146,243 1,081 Tuition and Fees (net of Scholarship Discounts and Allowances) 6,907,812$ 3,479$
Federal GovernmentFederal Grants and Contracts - Restricted 9,913,680$ 4,993$
Institutional ResourcesEndowment and Interest Income (See FN2) (18,715)$ (9)$ Local Government Grants - Restricted - - Private Gifts and Grants - Restricted 2,666,313 1,343 Sales and Services 1,122,093 565 Net Auxiliary Enterprises (See FN9) 5,069,934 2,554 Other Income (See FN3) 1,774,894 894 Subtotal 10,614,519$ 5,347$ Total Operating Sources 52,074,876$ 26,228$
Operating UsesInstruction 12,858,119$ 6,476$ Research 1,662,548 837 Public Service 1,806,937 910 Academic Support 5,168,627 2,603 Student Services 3,422,691 1,724 Institutional Support 9,191,235 4,629 Operations and Maintenance of Plant 4,095,936 2,063 Scholarships and Fellowships 2,968,275 1,495 Auxiliary Enterprises (See FN9) 6,321,257 3,184 Capital Outlay from Current Fund Sources 1,413,822 712 Other Expenses (See FN3) 500,000 252 Total Operating Uses 49,409,447$ 24,885$
Other Sources / (Uses) of FundsCapital Outlay from Non-Current Fund Sources - -$ Mandatory and Non-mandatory Transfers (See FN10) (3,480,904) (1,753) Bond Proceeds Transfers (See FN4) - - Debt Service Payments (See FN5) - - Subtotal (3,480,904)$ (1,753)$
Other Items Not for Current Operating UseUnrealized Gains / (Losses) (See FN6) 735,459 370$ Additions to Permanent Endowments (See FN7) 49,227 25 Subtotal 784,686$ 395$
Total Sources Over / (Under) Uses (See FN11) (30,789)$ (15)$
Texas Higher Education Coordinating Board 123 June, 2020

FY 2019
Operating SourcesEducational &
General DesignatedAuxiliary
EnterprisesRestricted Expendable Loan Funds
Annuity, Life & Endowment and
Similar FundsUnexpended
PlantRetirement of Indebtedness
Investment In Plant Primary University
State of TexasState Appropriations 20,029,760 - - - - - - - - 20,029,760 State Grants and Contracts - Restricted 108,409 - - 1,954,435 - - - - - 2,062,844 Higher Education Fund 2,546,261 - - - - - - - - 2,546,261 Available University Fund Excellence (See FN8) - - - - - - - - - - Subtotal 22,684,430 - - 1,954,435 - - - - - 24,638,865
Student & ParentTuition Potential 100% 3,656,367 8,010,396 - - - - - - - 11,666,763 Waivers - Statutory (Not Reported in AFR) (402,585) - - - - - - - - (402,585) Waivers - Institutional (Not Reported in AFR) (6,232) (35,690) - - - - - - - (41,922) Exemptions - Statutory (Not Reported in AFR) - - - - - - - - - - Exemptions - Institutional (Not Reported in AFR) - - - - - - - - - - Tuition - Gross - AFR Presentation 3,247,550 7,974,706 - - - - - - - 11,222,256 Waivers - Statutory (Reported in AFR) - - - - - - - - - - Waivers - Institutional (Reported in AFR) - - - - - - - - - - Exemptions - Statutory (Reported in AFR) (195,914) (578,372) - - - - - - - (774,286) Exemptions - Institutional (Reported in AFR) - - - - - - - - - - All Other Scholarship Disc.& Allow. (See FN1) (1,660,880) (4,025,521) - - - - - - - (5,686,401) Tuition - net 1,390,756 3,370,813 - - - - - - - 4,761,569
Fees Potential 100% 103,004 2,705,203 1,192,516 - - - - - - 4,000,723 Waivers - Statutory (Not Reported in AFR) - - - - - - - - - - Waivers - Institutional (Not Reported in AFR) (749) (15,010) (7,432) - - - - - - (23,191) Exemptions - Statutory (Not Reported in AFR) - - - - - - - - - - Exemptions - Institutional (Not Reported in AFR) - - - - - - - - - - Fees - Gross - AFR Presentation 102,255 2,690,193 1,185,084 - - - - - - 3,977,532 Waivers - Statutory (Reported in AFR) - - - - - - - - - - Waivers - Institutional (Reported in AFR) - - - - - - - - - - Exemptions - Statutory (Reported in AFR) (6,414) (172,007) (230,163) - - - - - - (408,584) Exemptions - Institutional (Reported in AFR) - - - - - - - - - - All Other Scholarship Disc.& Allow. (See FN1) (52,160) (1,370,545) - - - - - - - (1,422,705) Fees - net 43,681 1,147,641 954,921 - - - - - - 2,146,243
Net Tuition and Fees (Funds Collected) 1,434,437 4,518,454 954,921 - - - - - - 6,907,812
Federal GovernmentFederal Grants and Contracts - Restricted - - - 9,913,680 - - - - - 9,913,680
Institutional ResourcesEndowment and Interest Income (See FN2) - 300,704 19,630 23,942 - (374,567) 11,576 - - (18,715) Local Government Grants - Restricted - - - - - - - - - - Private Gifts and Grants - Restricted - 3,064 - 2,663,249 - - - - - 2,666,313 Sales and Services 8,240 550,270 - 563,583 - - - - - 1,122,093 Net Auxiliary Enterprises (See FN9) - - 5,069,934 - - - - - - 5,069,934 Other Income (See FN3) 29,500 376,331 - 442,309 4,336 922,418 - - - 1,774,894 Subtotal 37,740 1,230,369 5,089,564 3,693,083 4,336 547,851 11,576 - - 10,614,519 Total Operating Sources 24,156,607 5,748,823 6,044,485 15,561,198 4,336 547,851 11,576 - - 52,074,876
Operating UsesInstruction 10,869,713 1,981,047 - 7,359 - - - - - 12,858,119 Research 63,963 77,753 - 1,520,832 - - - - - 1,662,548 Public Service 895,118 - - 911,819 - - - - - 1,806,937 Academic Support 3,143,371 144,476 - 1,880,780 - - - - - 5,168,627 Student Services 1,585,018 278,017 - 1,559,656 - - - - - 3,422,691 Institutional Support 5,270,858 3,415,696 - 504,681 - - - - - 9,191,235 Operations and Maintenance of Plant 4,095,936 - - - - - - - - 4,095,936 Scholarships and Fellowships 22,133 1,203,703 - 1,742,439 - - - - - 2,968,275 Auxiliary Enterprises (See FN9) - - 6,321,257 - - - - - - 6,321,257 Capital Outlay from Current Fund Sources* 996,827 297,042 12,050 107,903 - - - - - 1,413,822 Other Expenses (See FN3) 36,705 28,788 42,706 64,042 - 127,744 200,015 - - 500,000 Total Operating Uses 26,979,642 7,426,522 6,376,013 8,299,511 - 127,744 200,015 - - 49,409,447
Other Sources / (Uses) of FundsCapital Outlay from Non-Current Fund Sources** - - - - - - - - - - Mandatory and Non-mandatory Transfers (See FN10) (1,464,964) (296,490) - - - - (1,719,450) - - (3,480,904) Bond Proceeds Transfers In (See FN4) - - - - - - - - - - Debt Service Payments (See FN5) - - - - - - - - - - Subtotal (1,464,964) (296,490) - - - - (1,719,450) - - (3,480,904)
Other Items Not for Current Operating UseUnrealized Gains / (Losses) (See FN6) - - - - - 735,459 - - - 735,459 Additions to Permanent Endowments (See FN7) - - - - - 49,227 - - - 49,227 Subtotal - - - - - 784,686 - - - 784,686
Total Sources Over / (Under) Uses (See FN 11) (4,287,999) (1,974,189) (331,528) 7,261,687 4,336 1,204,793 (1,907,889) - - (30,789)
Bond Proceeds - - - - - - - - - - Depreciation Expense - - - - - - - - (4,516,218) (4,516,218) Transfer of Capital Asses(s) from System - - - - - - 318 - - 318 Other Post-Employment Benefit (OPEB) Expense - - - - - - - - - - Non-Cash Capital Gifts - - - - - - - - - - Capital Outlay 996,827 297,042 12,050 107,903 - - - - - 1,413,822 Change in Net Assets (Total Agrees with AFR***) (3,291,172) (1,677,147) (319,478) 7,369,590 4,336 1,204,793 (1,907,571) - (4,516,218) (3,132,867)
*Defined as any capital outlay expenses from Educational & General, Designated, Auxiliary, or Restricted Expendable Funds.**Defined as any capital outlay expense from funds other than Educational & General, Designated, Auxiliary, or Restricted Expendable.***As reported for "Changes in Net Position" shown on Schedule of Revenues, Expenses, and Changes in Net Position (SRECNP) in Annual Financial Report.
Sul Ross State UniversityFor the Year Ended August 31, 2019Source: FY 2019 Annual Financial Report
Detail Worksheet FY 2019
Texas Higher Education Coordinating Board 124 June, 2020

Sul Ross State UniversityFor the Year Ended August 31, 2019Source: FY 2019 Annual Financial Report
FOOTNOTES:
FN1: Scholarship Discounts and Allowances are scholarships, fellowships, and grants applied to tuition. The discount eliminates tuition revenues that are paid for by University resources which are recorded as revenue elsewhere on the financial statements (i.e. federal and state contracts and grants revenues). In addition, Scholarship Discounts and Allowances eliminate tuition revenue that is exempted from payment due to tuition exemptions approved by the Texas Legislature. Waivers, remissions, and exemptions represent tuition and fee dollars forgone by the university - some are required by statute. See the Integrated Financial Reporting System (IFRS) report submitted to THECB for details on waivers, exemptions, tuition, and fees. Allocation methods to individual funds shown may vary between institutions.
FN2: Endowment and Interest Income includes interest income and endowment payouts.
FN3: Other Income is primarily Other Operating and Other Non-operating Revenues from the AFR. Other Expenses is primarily Other Nonoperating Expenses from the AFR.
FN4: Bond Proceeds are funds received from the sale of bonds and commercial paper used to finance capital projects. This amount includes actual proceeds and accrued or anticipated proceeds to be transferred from System. Independent institutions report only to the extent expended in current year.
FN5: Debt service payments are payments to service and retire debt issued to fund capital projects. System components do this via transfers to System Administrations. Independent institutions use direct payment to appropriate paying agents.
FN6: Unrealized Gains / (Losses) represent the increase in the Fair Market Value of Investments and Endowments. Unrealized Gains / (Losses) are accrued as non-cash transactions. Therefore, funds are not actually received for this revenue stream. Accordingly, this revenue is not cash revenue and cannot be used by the University to fund operations.
FN7: Additions to Permanent Endowments are additions to endowment principal. This revenue is restricted for investment purposes only and cannot be used to fund operations. Only interest income from these endowments, which is reported on the Endowment and Investment Income line of this report, can be used by the University to fund operations.
FN8: Distributions from the Available University Fund appropriated through the Appropriation Bill are first used to pay debt service costs on Permanent University Fund Bonds. Funds remaining are distributed to constitutionally designated institutions to promote academic excellence. Only the Excellence funding is shown at the institution level. The AUF funds used to pay debt service on PUF bonds are reported at the System level.
FN9: Auxiliary Enterprises include athletics, housing and food, student services, and parking and transportation. Auxiliary Enterprises are required to be self-supporting, and therefore must operate on the funds they generate.
FN10: Mandatory and non-mandatory transfers includes transfers between funds, transfers between the University System and institutions and transfers to and from other state agencies. In total, all transfers between funds net to zero with the exception of any amounts transferred between the University System, between other institutions, or to and from another state agency. There are no transfers of education and general funds provided by the State of Texas to restricted or auxiliary fund groups. Transfers between education and general funds and designated funds are related to Texas Public Education Grant as provided by the State of Texas.
FN11. N/A
Texas Higher Education Coordinating Board 125 June, 2020

Texas Tech UniversityFor the Year Ended August 31, 2019Source: FY 2019 Annual Financial Report
Non-Operating Funds are not included in above charts. See following page (Summary).Charts May Not Add to 100% Due to Rounding
Total Operating Sources $945,153,935
Total Operating Sources $945,153,935
Total Operating Uses $838,323,809
State of Texas$269,840,987
29%
Student & Parent$323,678,043
34%
Federal Government$85,234,898
9%
Institutional Resources$266,400,007
28%
Operating Sources by Category
State Appropriations$195,552,196
21%
State Grants & Contracts
$25,062,9823%
Higher Education Fund$49,225,809
5%
Tuition & Fees$323,678,043
34%
Federal Grants & Contracts
$85,234,8989%
Endowment & Interest Income
$9,370,7051%
Local Government Grants
$1,157,1390%
Private Gifts & Grants$69,538,198
7%
Sales & Services$12,116,302
1%
Net Auxiliary Enterprises
$169,918,48118%
Other Income$4,299,182
1%
Operating Sources
Instruction$202,623,022
24%
Research$157,421,739
19%
Public Service$13,976,678
2%
Academic Support$94,075,847
11%
Student Services$48,510,517
6%Institutional Support
$46,541,9256%
Operations & Maintenance of Plant
$51,561,0636%
Scholarships & Fellowships$45,576,763
5%
Auxiliary Enterprises$148,612,827
18%Capital Outlay$28,669,316
3%
Other Expenses$754,112
0%
Operating Uses
Texas Higher Education Coordinating Board 126 June, 2020

Texas Tech UniversityFor the Year Ended August 31, 2019Source: FY 2019 Annual Financial Report
Summary Worksheet FY 2019 Amount Per FTSEInstitution State Funded FTSEs 33,815.21
Operating SourcesState of TexasState Appropriations 195,552,196$ 5,783$ State Grants and Contracts - Restricted 25,062,982 741 Higher Education Fund 49,225,809 1,456 Available University Fund Excellence (See FN8) - - Subtotal 269,840,987$ 7,980$
Student & ParentTuition - net 217,423,864$ 6,430$ Fees - net 106,254,179 3,142 Tuition and Fees (net of Scholarship Discounts and Allowances) 323,678,043$ 9,572$
Federal GovernmentFederal Grants and Contracts - Restricted 85,234,898$ 2,521$
Institutional ResourcesEndowment and Interest Income (See FN2) 9,370,705$ 277$ Local Government Grants - Restricted 1,157,139 34 Private Gifts and Grants - Restricted 69,538,198 2,056 Sales and Services 12,116,302 358 Net Auxiliary Enterprises (See FN9) 169,918,481 5,025 Other Income (See FN3) 4,299,182 127 Subtotal 266,400,007$ 7,877$ Total Operating Sources 945,153,935$ 27,950$
Operating UsesInstruction 202,623,022$ 5,992$ Research 157,421,739 4,655 Public Service 13,976,678 413 Academic Support 94,075,847 2,782 Student Services 48,510,517 1,435 Institutional Support 46,541,925 1,376 Operations and Maintenance of Plant 51,561,063 1,525 Scholarships and Fellowships 45,576,763 1,348 Auxiliary Enterprises (See FN9) 148,612,827 4,395 Capital Outlay from Current Fund Sources 28,669,316 848 Other Expenses (See FN3) 754,112 22 Total Operating Uses 838,323,809$ 24,791$
Other Sources / (Uses) of FundsCapital Outlay from Non-Current Fund Sources (74,902,298) (2,215)$ Mandatory and Non-mandatory Transfers (See FN10) 4,272,633 126 Bond Proceeds Transfers (See FN4) 40,191,623 1,189 Debt Service Payments (See FN5) (72,716,926) (2,150) Subtotal (103,154,968)$ (3,050)$
Other Items Not for Current Operating UseUnrealized Gains / (Losses) (See FN6) 4,275,166 126$ Additions to Permanent Endowments (See FN7) 237,979 7 Subtotal 4,513,145$ 133$
Total Sources Over / (Under) Uses (See FN11) 8,188,303$ 242$
Texas Higher Education Coordinating Board 127 June, 2020

FY 2019
Operating SourcesEducational &
General DesignatedAuxiliary
EnterprisesRestricted Expendable Loan Funds
Annuity, Life & Endowment and
Similar FundsUnexpended
PlantRetirement of Indebtedness
Investment In Plant Primary University
State of TexasState Appropriations 195,552,196 - - - - - - - - 195,552,196 State Grants and Contracts - Restricted 687,166 8,481,612 - 15,894,204 - - - - - 25,062,982 Higher Education Fund 49,225,809 - - - - - - - - 49,225,809 Available University Fund Excellence (See FN8) - - - - - - - - - - Subtotal 245,465,171 8,481,612 - 15,894,204 - - - - - 269,840,987
Student & ParentTuition Potential 100% 106,541,147 228,756,944 - - - - - - - 335,298,091 Waivers - Statutory (Not Reported in AFR) (39,108,042) - - - - - - - - (39,108,042) Waivers - Institutional (Not Reported in AFR) - - - - - - - - - - Exemptions - Statutory (Not Reported in AFR) - - - - - - - - - - Exemptions - Institutional (Not Reported in AFR) - - - - - - - - - - Tuition - Gross - AFR Presentation 67,433,105 228,756,944 - - - - - - - 296,190,049 Waivers - Statutory (Reported in AFR) - - - - - - - - - - Waivers - Institutional (Reported in AFR) - - - - - - - - - - Exemptions - Statutory (Reported in AFR) (3,194,340) (15,017,392) - - - - - - - (18,211,732) Exemptions - Institutional (Reported in AFR) - - - - - - - - - - All Other Scholarship Disc.& Allow. (See FN1) (13,784,230) (46,770,223) - - - - - - - (60,554,453) Tuition - net 50,454,535 166,969,329 - - - - - - - 217,423,864
Fees Potential 100% - 129,932,208 15,419,341 - - - - - - 145,351,549 Waivers - Statutory (Not Reported in AFR) - - - - - - - - - - Waivers - Institutional (Not Reported in AFR) - - - - - - - - - - Exemptions - Statutory (Not Reported in AFR) - - - - - - - - - - Exemptions - Institutional (Not Reported in AFR) - - - - - - - - - - Fees - Gross - AFR Presentation - 129,932,208 15,419,341 - - - - - - 145,351,549 Waivers - Statutory (Reported in AFR) - - - - - - - - - - Waivers - Institutional (Reported in AFR) - - - - - - - - - - Exemptions - Statutory (Reported in AFR) - (8,529,765) (852,050) - - - - - - (9,381,815) Exemptions - Institutional (Reported in AFR) - - - - - - - - - - All Other Scholarship Disc.& Allow. (See FN1) - (26,565,132) (3,150,423) - - - - - - (29,715,555) Fees - net - 94,837,311 11,416,868 - - - - - - 106,254,179
Net Tuition and Fees (Funds Collected) 50,454,535 261,806,640 11,416,868 - - - - - - 323,678,043
Federal GovernmentFederal Grants and Contracts - Restricted - - - 85,234,898 - - - - - 85,234,898
Institutional ResourcesEndowment and Interest Income (See FN2) 1,513,136 17,343,039 2,221,365 8,925,410 111,277 (22,118,669) 9,552 1,365,595 - 9,370,705 Local Government Grants - Restricted - - - 1,157,139 - - - - - 1,157,139 Private Gifts and Grants - Restricted - 891,599 464,020 67,422,388 - 43,090 717,101 - - 69,538,198 Sales and Services - 9,938,043 - 2,178,259 - - - - - 12,116,302 Net Auxiliary Enterprises (See FN9) - - 169,918,481 - - - - - - 169,918,481 Other Income (See FN3) 47,409 2,137,464 1,068,960 656,846 2,967 - - - 385,536 4,299,182 Subtotal 1,560,545 30,310,145 173,672,826 80,340,042 114,244 (22,075,579) 726,653 1,365,595 385,536 266,400,007 Total Operating Sources 297,480,251 300,598,397 185,089,694 181,469,144 114,244 (22,075,579) 726,653 1,365,595 385,536 945,153,935
Operating UsesInstruction 111,882,921 85,276,152 - 5,463,949 - - - - - 202,623,022 Research 74,711,993 26,253,815 - 56,455,931 - - - - - 157,421,739 Public Service 2,212,688 5,608,153 9,789 6,146,048 - - - - - 13,976,678 Academic Support 30,583,975 53,855,643 - 9,636,229 - - - - - 94,075,847 Student Services 4,157,860 43,495,204 - 857,453 - - - - - 48,510,517 Institutional Support 16,690,315 29,459,606 - 392,004 - - - - - 46,541,925 Operations and Maintenance of Plant 11,993,005 30,878,862 - 293,948 - - 8,395,248 - - 51,561,063 Scholarships and Fellowships (85,369) 19,341,435 - 26,320,697 - - - - - 45,576,763 Auxiliary Enterprises (See FN9) - - 148,612,827 - - - - - - 148,612,827 Capital Outlay from Current Fund Sources* 11,031,499 11,677,915 1,181,544 4,778,358 - - - - - 28,669,316 Other Expenses (See FN3) - - 27,632 - 27,500 - - - 698,980 754,112 Total Operating Uses 263,178,887 305,846,785 149,831,792 110,344,617 27,500 - 8,395,248 - 698,980 838,323,809
Other Sources / (Uses) of FundsCapital Outlay from Non-Current Fund Sources** - - - - - - (74,902,298) - - (74,902,298) Mandatory and Non-mandatory Transfers (See FN10) (24,296,264) 42,637,809 (11,953,504) (56,845,004) (43,936) (2,740,392) 56,749,149 764,775 - 4,272,633 Bond Proceeds Transfers In (See FN4) - - - - - - 40,191,623 - - 40,191,623 Debt Service Payments (See FN5) (23,843,353) (15,058,114) (24,485,028) (6,155,017) - - - (3,175,414) - (72,716,926) Subtotal (48,139,617) 27,579,695 (36,438,532) (63,000,021) (43,936) (2,740,392) 22,038,474 (2,410,639) - (103,154,968)
Other Items Not for Current Operating UseUnrealized Gains / (Losses) (See FN6) - (2,821,183) (621,299) 114,338 (51,740) 8,381,037 (217,373) (508,614) - 4,275,166 Additions to Permanent Endowments (See FN7) - - - - - 237,979 - - - 237,979 Subtotal - (2,821,183) (621,299) 114,338 (51,740) 8,619,016 (217,373) (508,614) - 4,513,145
Total Sources Over / (Under) Uses (See FN 11) (13,838,253) 19,510,124 (1,801,929) 8,238,844 (8,932) (16,196,955) 14,152,506 (1,553,658) (313,444) 8,188,303
Bond Proceeds - - - - - - - - - - Depreciation Expense - - - - - - - - (90,906,402) (90,906,402) Transfer of Capital Asses(s) from System - - - - - - - - (178,020) (178,020) Other Post-Employment Benefit (OPEB) Expense - - - - - - - - - - Non-Cash Capital Gifts - - - - - - - - 5,455,235 5,455,235 Capital Outlay 11,031,499 11,677,915 1,181,544 4,778,358 - - 74,902,298 - - 103,571,614 Change in Net Assets (Total Agrees with AFR***) (2,806,754) 31,188,039 (620,385) 13,017,202 (8,932) (16,196,955) 89,054,804 (1,553,658) (85,942,631) 26,130,730
*Defined as any capital outlay expenses from Educational & General, Designated, Auxiliary, or Restricted Expendable Funds.**Defined as any capital outlay expense from funds other than Educational & General, Designated, Auxiliary, or Restricted Expendable.***As reported for "Changes in Net Position" shown on Schedule of Revenues, Expenses, and Changes in Net Position (SRECNP) in Annual Financial Report.
Texas Tech UniversityFor the Year Ended August 31, 2019Source: FY 2019 Annual Financial Report
Detail Worksheet FY 2019
Texas Higher Education Coordinating Board 128 June, 2020

Texas Tech UniversityFor the Year Ended August 31, 2019Source: FY 2019 Annual Financial Report
FOOTNOTES:
FN1: Scholarship Discounts and Allowances are scholarships, fellowships, and grants applied to tuition. The discount eliminates tuition revenues that are paid for by University resources which are recorded as revenue elsewhere on the financial statements (i.e. federal and state contracts and grants revenues). In addition, Scholarship Discounts and Allowances eliminate tuition revenue that is exempted from payment due to tuition exemptions approved by the Texas Legislature. Waivers, remissions, and exemptions represent tuition and fee dollars forgone by the university - some are required by statute. See the Integrated Financial Reporting System (IFRS) report submitted to THECB for details on waivers, exemptions, tuition, and fees. Allocation methods to individual funds shown may vary between institutions.
FN2: Endowment and Interest Income includes interest income and endowment payouts.
FN3: Other Income is primarily Other Operating and Other Non-operating Revenues from the AFR. Other Expenses is primarily Other Nonoperating Expenses from the AFR.
FN4: Bond Proceeds are funds received from the sale of bonds and commercial paper used to finance capital projects. This amount includes actual proceeds and accrued or anticipated proceeds to be transferred from System. Independent institutions report only to the extent expended in current year.
FN5: Debt service payments are payments to service and retire debt issued to fund capital projects. System components do this via transfers to System Administrations. Independent institutions use direct payment to appropriate paying agents.
FN6: Unrealized Gains / (Losses) represent the increase in the Fair Market Value of Investments and Endowments. Unrealized Gains / (Losses) are accrued as non-cash transactions. Therefore, funds are not actually received for this revenue stream. Accordingly, this revenue is not cash revenue and cannot be used by the University to fund operations.
FN7: Additions to Permanent Endowments are additions to endowment principal. This revenue is restricted for investment purposes only and cannot be used to fund operations. Only interest income from these endowments, which is reported on the Endowment and Investment Income line of this report, can be used by the University to fund operations.
FN8: Distributions from the Available University Fund appropriated through the Appropriation Bill are first used to pay debt service costs on Permanent University Fund Bonds. Funds remaining are distributed to constitutionally designated institutions to promote academic excellence. Only the Excellence funding is shown at the institution level. The AUF funds used to pay debt service on PUF bonds are reported at the System level.
FN9: Auxiliary Enterprises include athletics, housing and food, student services, and parking and transportation. Auxiliary Enterprises are required to be self-supporting, and therefore must operate on the funds they generate.
FN10: Mandatory and non-mandatory transfers includes transfers between funds, transfers between the University System and institutions and transfers to and from other state agencies. In total, all transfers between funds net to zero with the exception of any amounts transferred between the University System, between other institutions, or to and from another state agency. There are no transfers of education and general funds provided by the State of Texas to restricted or auxiliary fund groups. Transfers between education and general funds and designated funds are related to Texas Public Education Grant as provided by the State of Texas.
FN11: Of the net increase of $8,188,303 approximately $(868) thousand represents revenues received but not yet expended. This income is fully committed to program expenditures and capital disbursements. The remaining $9.1 million represents non-expendable funds from unrealized gains and additions to permanent endowments of approximately $8.8 million and $238 thousand respectively. Unrealized gains and additions to permanent endowments do not contribute to the availability of the institution's operating cash as discussed in FN6 and FN7.
Texas Higher Education Coordinating Board 129 June, 2020

Angelo State UniversityFor the Year Ended August 31, 2019Source: FY 2019 Annual Financial Report
Non-Operating Funds are not included in above charts. See following page (Summary).Charts May Not Add to 100% Due to Rounding
Total Operating Sources $155,049,552
Total Operating Sources $155,049,552
Total Operating Uses $135,452,918
State of Texas$46,326,520
30%
Student & Parent$49,525,924
32%
Federal Government$15,641,657
10%
Institutional Resources$43,555,451
28%
Operating Sources by Category
State Appropriations$34,043,956
22%
State Grants & Contracts$6,962,462
5%
Higher Education Fund$5,320,102
3%Tuition & Fees$49,525,924
32%
Federal Grants & Contracts
$15,641,65710%
Endowment & Interest Income
$12,009,0378%
Private Gifts & Grants$11,414,180
7%
Sales & Services$1,138,277
1%
Net Auxiliary Enterprises$14,575,410
9%
Other Income$4,418,547
3%
Operating Sources
Instruction$44,941,053
33%
Research$832,139
1%
Public Service$1,500,310
1%
Academic Support$7,378,199
5%
Student Services$8,154,638
6%
Institutional Support$17,328,237
13% Operations & Maintenance of Plant
$6,858,4945%
Scholarships & Fellowships$19,217,320
14%
Auxiliary Enterprises$19,002,237
14%
Capital Outlay$1,295,301
1%Other Expenses
$8,944,9907%
Operating Uses
Texas Higher Education Coordinating Board 130 June, 2020

Angelo State UniversityFor the Year Ended August 31, 2019Source: FY 2019 Annual Financial Report
Summary Worksheet FY 2019 Amount Per FTSEInstitution State Funded FTSEs 7,557.93
Operating SourcesState of TexasState Appropriations 34,043,956$ 4,504$ State Grants and Contracts - Restricted 6,962,462 921 Higher Education Fund 5,320,102 704 Available University Fund Excellence (See FN8) - - Subtotal 46,326,520$ 6,129$
Student & ParentTuition - net 29,183,893$ 3,861$ Fees - net 20,342,031 2,691 Tuition and Fees (net of Scholarship Discounts and Allowances) 49,525,924$ 6,552$
Federal GovernmentFederal Grants and Contracts - Restricted 15,641,657$ 2,070$
Institutional ResourcesEndowment and Interest Income (See FN2) 12,009,037$ 1,589$ Local Government Grants - Restricted - - Private Gifts and Grants - Restricted 11,414,180 1,510 Sales and Services 1,138,277 151 Net Auxiliary Enterprises (See FN9) 14,575,410 1,928 Other Income (See FN3) 4,418,547 585 Subtotal 43,555,451$ 5,763$ Total Operating Sources 155,049,552$ 20,514$
Operating UsesInstruction 44,941,053$ 5,946$ Research 832,139 110 Public Service 1,500,310 199 Academic Support 7,378,199 976 Student Services 8,154,638 1,079 Institutional Support 17,328,237 2,293 Operations and Maintenance of Plant 6,858,494 907 Scholarships and Fellowships 19,217,320 2,543 Auxiliary Enterprises (See FN9) 19,002,237 2,514 Capital Outlay from Current Fund Sources 1,295,301 171 Other Expenses (See FN3) 8,944,990 1,184 Total Operating Uses 135,452,918$ 17,922$
Other Sources / (Uses) of FundsCapital Outlay from Non-Current Fund Sources (8,986,925) (1,189)$ Mandatory and Non-mandatory Transfers (See FN10) 1,955,254 259 Bond Proceeds Transfers (See FN4) - - Debt Service Payments (See FN5) (9,283,097) (1,228) Subtotal (16,314,768)$ (2,158)$
Other Items Not for Current Operating UseUnrealized Gains / (Losses) (See FN6) (2,438,594) (323)$ Additions to Permanent Endowments (See FN7) - - Subtotal (2,438,594)$ (323)$
Total Sources Over / (Under) Uses (See FN11) 843,272$ 111$
Texas Higher Education Coordinating Board 131 June, 2020
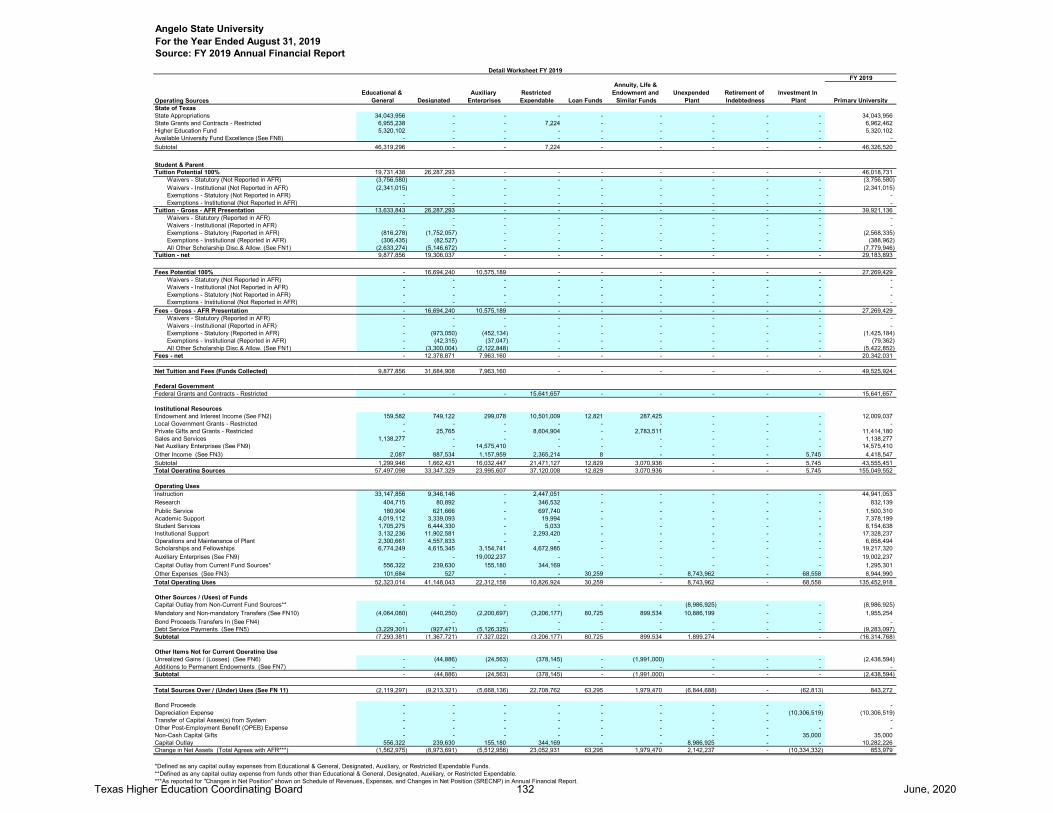
FY 2019
Operating SourcesEducational &
General DesignatedAuxiliary
EnterprisesRestricted Expendable Loan Funds
Annuity, Life & Endowment and
Similar FundsUnexpended
PlantRetirement of Indebtedness
Investment In Plant Primary University
State of TexasState Appropriations 34,043,956 - - - - - - - - 34,043,956 State Grants and Contracts - Restricted 6,955,238 - - 7,224 - - - - - 6,962,462 Higher Education Fund 5,320,102 - - - - - - - - 5,320,102 Available University Fund Excellence (See FN8) - - - - - - - - - - Subtotal 46,319,296 - - 7,224 - - - - - 46,326,520
Student & ParentTuition Potential 100% 19,731,438 26,287,293 - - - - - - - 46,018,731 Waivers - Statutory (Not Reported in AFR) (3,756,580) - - - - - - - - (3,756,580) Waivers - Institutional (Not Reported in AFR) (2,341,015) - - - - - - - - (2,341,015) Exemptions - Statutory (Not Reported in AFR) - - - - - - - - - - Exemptions - Institutional (Not Reported in AFR) - - - - - - - - - - Tuition - Gross - AFR Presentation 13,633,843 26,287,293 - - - - - - - 39,921,136 Waivers - Statutory (Reported in AFR) - - - - - - - - - - Waivers - Institutional (Reported in AFR) - - - - - - - - - - Exemptions - Statutory (Reported in AFR) (816,278) (1,752,057) - - - - - - - (2,568,335) Exemptions - Institutional (Reported in AFR) (306,435) (82,527) - - - - - - - (388,962) All Other Scholarship Disc.& Allow. (See FN1) (2,633,274) (5,146,672) - - - - - - - (7,779,946) Tuition - net 9,877,856 19,306,037 - - - - - - - 29,183,893
Fees Potential 100% - 16,694,240 10,575,189 - - - - - - 27,269,429 Waivers - Statutory (Not Reported in AFR) - - - - - - - - - - Waivers - Institutional (Not Reported in AFR) - - - - - - - - - - Exemptions - Statutory (Not Reported in AFR) - - - - - - - - - - Exemptions - Institutional (Not Reported in AFR) - - - - - - - - - - Fees - Gross - AFR Presentation - 16,694,240 10,575,189 - - - - - - 27,269,429 Waivers - Statutory (Reported in AFR) - - - - - - - - - - Waivers - Institutional (Reported in AFR) - - - - - - - - - - Exemptions - Statutory (Reported in AFR) - (973,050) (452,134) - - - - - - (1,425,184) Exemptions - Institutional (Reported in AFR) - (42,315) (37,047) - - - - - - (79,362) All Other Scholarship Disc.& Allow. (See FN1) - (3,300,004) (2,122,848) - - - - - - (5,422,852) Fees - net - 12,378,871 7,963,160 - - - - - - 20,342,031
Net Tuition and Fees (Funds Collected) 9,877,856 31,684,908 7,963,160 - - - - - - 49,525,924
Federal GovernmentFederal Grants and Contracts - Restricted - - - 15,641,657 - - - - - 15,641,657
Institutional ResourcesEndowment and Interest Income (See FN2) 159,582 749,122 299,078 10,501,009 12,821 287,425 - - - 12,009,037 Local Government Grants - Restricted - - - - - - - - - - Private Gifts and Grants - Restricted - 25,765 - 8,604,904 - 2,783,511 - - - 11,414,180 Sales and Services 1,138,277 - - - - - - - - 1,138,277 Net Auxiliary Enterprises (See FN9) - - 14,575,410 - - - - - - 14,575,410 Other Income (See FN3) 2,087 887,534 1,157,959 2,365,214 8 - - - 5,745 4,418,547 Subtotal 1,299,946 1,662,421 16,032,447 21,471,127 12,829 3,070,936 - - 5,745 43,555,451 Total Operating Sources 57,497,098 33,347,329 23,995,607 37,120,008 12,829 3,070,936 - - 5,745 155,049,552
Operating UsesInstruction 33,147,856 9,346,146 - 2,447,051 - - - - - 44,941,053 Research 404,715 80,892 - 346,532 - - - - - 832,139 Public Service 180,904 621,666 - 697,740 - - - - - 1,500,310 Academic Support 4,019,112 3,339,093 - 19,994 - - - - - 7,378,199 Student Services 1,705,275 6,444,330 - 5,033 - - - - - 8,154,638 Institutional Support 3,132,236 11,902,581 - 2,293,420 - - - - - 17,328,237 Operations and Maintenance of Plant 2,300,661 4,557,833 - - - - - - - 6,858,494 Scholarships and Fellowships 6,774,249 4,615,345 3,154,741 4,672,985 - - - - - 19,217,320 Auxiliary Enterprises (See FN9) - - 19,002,237 - - - - - - 19,002,237 Capital Outlay from Current Fund Sources* 556,322 239,630 155,180 344,169 - - - - - 1,295,301 Other Expenses (See FN3) 101,684 527 - - 30,259 - 8,743,962 - 68,558 8,944,990 Total Operating Uses 52,323,014 41,148,043 22,312,158 10,826,924 30,259 - 8,743,962 - 68,558 135,452,918
Other Sources / (Uses) of FundsCapital Outlay from Non-Current Fund Sources** - - - - - - (8,986,925) - - (8,986,925) Mandatory and Non-mandatory Transfers (See FN10) (4,064,080) (440,250) (2,200,697) (3,206,177) 80,725 899,534 10,886,199 - - 1,955,254 Bond Proceeds Transfers In (See FN4) - - - - - - - - - - Debt Service Payments (See FN5) (3,229,301) (927,471) (5,126,325) - - - - - - (9,283,097) Subtotal (7,293,381) (1,367,721) (7,327,022) (3,206,177) 80,725 899,534 1,899,274 - - (16,314,768)
Other Items Not for Current Operating UseUnrealized Gains / (Losses) (See FN6) - (44,886) (24,563) (378,145) - (1,991,000) - - - (2,438,594) Additions to Permanent Endowments (See FN7) - - - - - - - - - - Subtotal - (44,886) (24,563) (378,145) - (1,991,000) - - - (2,438,594)
Total Sources Over / (Under) Uses (See FN 11) (2,119,297) (9,213,321) (5,668,136) 22,708,762 63,295 1,979,470 (6,844,688) - (62,813) 843,272
Bond Proceeds - - - - - - - - - - Depreciation Expense - - - - - - - - (10,306,519) (10,306,519) Transfer of Capital Asses(s) from System - - - - - - - - - - Other Post-Employment Benefit (OPEB) Expense - - - - - - - - - - Non-Cash Capital Gifts - - - - - - - - 35,000 35,000 Capital Outlay 556,322 239,630 155,180 344,169 - - 8,986,925 - - 10,282,226 Change in Net Assets (Total Agrees with AFR***) (1,562,975) (8,973,691) (5,512,956) 23,052,931 63,295 1,979,470 2,142,237 - (10,334,332) 853,979
*Defined as any capital outlay expenses from Educational & General, Designated, Auxiliary, or Restricted Expendable Funds.**Defined as any capital outlay expense from funds other than Educational & General, Designated, Auxiliary, or Restricted Expendable.***As reported for "Changes in Net Position" shown on Schedule of Revenues, Expenses, and Changes in Net Position (SRECNP) in Annual Financial Report.
Angelo State UniversityFor the Year Ended August 31, 2019Source: FY 2019 Annual Financial Report
Detail Worksheet FY 2019
Texas Higher Education Coordinating Board 132 June, 2020

Angelo State UniversityFor the Year Ended August 31, 2019Source: FY 2019 Annual Financial Report
FOOTNOTES:
FN1: Scholarship Discounts and Allowances are scholarships, fellowships, and grants applied to tuition. The discount eliminates tuition revenues that are paid for by University resources which are recorded as revenue elsewhere on the financial statements (i.e. federal and state contracts and grants revenues). In addition, Scholarship Discounts and Allowances eliminate tuition revenue that is exempted from payment due to tuition exemptions approved by the Texas Legislature. Waivers, remissions, and exemptions represent tuition and fee dollars forgone by the university - some are required by statute. See the Integrated Financial Reporting System (IFRS) report submitted to THECB for details on waivers, exemptions, tuition, and fees. Allocation methods to individual funds shown may vary between institutions.
FN2: Endowment and Interest Income includes interest income and endowment payouts.
FN3: Other Income is primarily Other Operating and Other Non-operating Revenues from the AFR. Other Expenses is primarily Other Nonoperating Expenses from the AFR.
FN4: Bond Proceeds are funds received from the sale of bonds and commercial paper used to finance capital projects. This amount includes actual proceeds and accrued or anticipated proceeds to be transferred from System. Independent institutions report only to the extent expended in current year.
FN5: Debt service payments are payments to service and retire debt issued to fund capital projects. System components do this via transfers to System Administrations. Independent institutions use direct payment to appropriate paying agents.
FN6: Unrealized Gains / (Losses) represent the increase in the Fair Market Value of Investments and Endowments. Unrealized Gains / (Losses) are accrued as non-cash transactions. Therefore, funds are not actually received for this revenue stream. Accordingly, this revenue is not cash revenue and cannot be used by the University to fund operations.
FN7: Additions to Permanent Endowments are additions to endowment principal. This revenue is restricted for investment purposes only and cannot be used to fund operations. Only interest income from these endowments, which is reported on the Endowment and Investment Income line of this report, can be used by the University to fund operations.
FN8: Distributions from the Available University Fund appropriated through the Appropriation Bill are first used to pay debt service costs on Permanent University Fund Bonds. Funds remaining are distributed to constitutionally designated institutions to promote academic excellence. Only the Excellence funding is shown at the institution level. The AUF funds used to pay debt service on PUF bonds are reported at the System level.
FN9: Auxiliary Enterprises include athletics, housing and food, student services, and parking and transportation. Auxiliary Enterprises are required to be self-supporting, and therefore must operate on the funds they generate.
FN10: Mandatory and non-mandatory transfers includes transfers between funds, transfers between the University System and institutions and transfers to and from other state agencies. In total, all transfers between funds net to zero with the exception of any amounts transferred between the University System, between other institutions, or to and from another state agency. There are no transfers of education and general funds provided by the State of Texas to restricted or auxiliary fund groups. Transfers between education and general funds and designated funds are related to Texas Public Education Grant as provided by the State of Texas.
FN11: Of the net increase of $843,272 approximately $856 thousand represents revenues received but not yet expended. This income is fully committed to program expenditures and capital disbursements. The remaining $(12) thousand represents non-expendable funds from unrealized gains and additions to permanent endowments of approximately $0 and $(12) thousand respectively. Unrealized gains and additions to permanent endowments do not contribute to the availability of the institution's operating cash as discussed in FN6 and FN7.
Texas Higher Education Coordinating Board 133 June, 2020
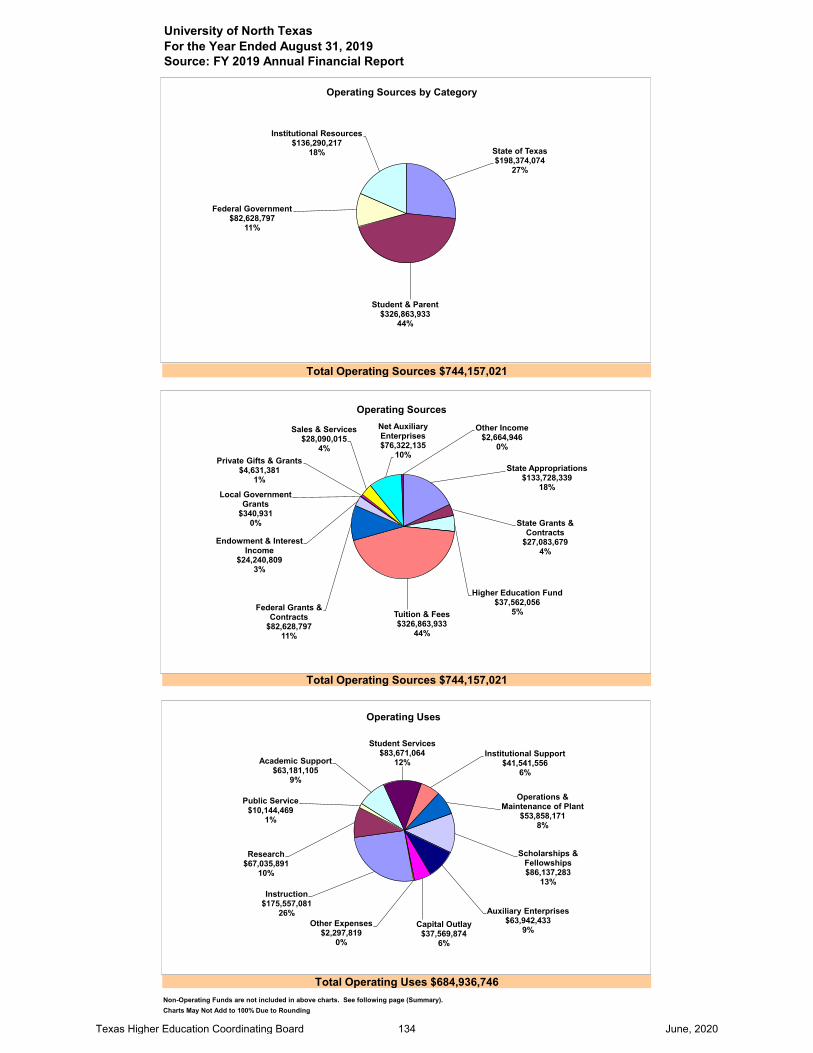
University of North TexasFor the Year Ended August 31, 2019Source: FY 2019 Annual Financial Report
Non-Operating Funds are not included in above charts. See following page (Summary).Charts May Not Add to 100% Due to Rounding
Total Operating Sources $744,157,021
Total Operating Sources $744,157,021
Total Operating Uses $684,936,746
State of Texas$198,374,074
27%
Student & Parent$326,863,933
44%
Federal Government$82,628,797
11%
Institutional Resources$136,290,217
18%
Operating Sources by Category
State Appropriations$133,728,339
18%
State Grants & Contracts
$27,083,6794%
Higher Education Fund$37,562,056
5%Tuition & Fees$326,863,933
44%
Federal Grants & Contracts
$82,628,79711%
Endowment & Interest Income
$24,240,8093%
Local Government Grants
$340,9310%
Private Gifts & Grants$4,631,381
1%
Sales & Services$28,090,015
4%
Net Auxiliary Enterprises$76,322,135
10%
Other Income$2,664,946
0%
Operating Sources
Instruction$175,557,081
26%
Research$67,035,891
10%
Public Service$10,144,469
1%
Academic Support$63,181,105
9%
Student Services$83,671,064
12%Institutional Support
$41,541,5566%
Operations & Maintenance of Plant
$53,858,1718%
Scholarships & Fellowships$86,137,283
13%
Auxiliary Enterprises$63,942,433
9%Capital Outlay$37,569,874
6%
Other Expenses$2,297,819
0%
Operating Uses
Texas Higher Education Coordinating Board 134 June, 2020

University of North TexasFor the Year Ended August 31, 2019Source: FY 2019 Annual Financial Report
Summary Worksheet FY 2019 Amount Per FTSEInstitution State Funded FTSEs 32,174.02
Operating SourcesState of TexasState Appropriations 133,728,339$ 4,156$ State Grants and Contracts - Restricted 27,083,679 842 Higher Education Fund 37,562,056 1,167 Available University Fund Excellence (See FN8) - - Subtotal 198,374,074$ 6,165$
Student & ParentTuition - net 279,383,891$ 8,684$ Fees - net 47,480,042 1,476 Tuition and Fees (net of Scholarship Discounts and Allowances) 326,863,933$ 10,160$
Federal GovernmentFederal Grants and Contracts - Restricted 82,628,797$ 2,568$
Institutional ResourcesEndowment and Interest Income (See FN2) 24,240,809$ 753$ Local Government Grants - Restricted 340,931 11 Private Gifts and Grants - Restricted 4,631,381 144 Sales and Services 28,090,015 873 Net Auxiliary Enterprises (See FN9) 76,322,135 2,372 Other Income (See FN3) 2,664,946 83 Subtotal 136,290,217$ 4,236$ Total Operating Sources 744,157,021$ 23,129$
Operating UsesInstruction 175,557,081$ 5,456$ Research 67,035,891 2,084 Public Service 10,144,469 315 Academic Support 63,181,105 1,964 Student Services 83,671,064 2,601 Institutional Support 41,541,556 1,291 Operations and Maintenance of Plant 53,858,171 1,674 Scholarships and Fellowships 86,137,283 2,677 Auxiliary Enterprises (See FN9) 63,942,433 1,987 Capital Outlay from Current Fund Sources 37,569,874 1,168 Other Expenses (See FN3) 2,297,819 71 Total Operating Uses 684,936,746$ 21,288$
Other Sources / (Uses) of FundsCapital Outlay from Non-Current Fund Sources (211,398,704) (6,570)$ Mandatory and Non-mandatory Transfers (See FN10) 56,522,297 1,757 Bond Proceeds Transfers (See FN4) - - Debt Service Payments (See FN5) (28,093) (1) Subtotal (154,904,500)$ (4,814)$
Other Items Not for Current Operating UseUnrealized Gains / (Losses) (See FN6) (2,583,884) (80)$ Additions to Permanent Endowments (See FN7) 514,883 16 Subtotal (2,069,001)$ (64)$
Total Sources Over / (Under) Uses (See FN11) (97,753,226)$ (3,037)$
Texas Higher Education Coordinating Board 135 June, 2020

FY 2019
Operating SourcesEducational &
General DesignatedAuxiliary
EnterprisesRestricted Expendable Loan Funds
Annuity, Life & Endowment and
Similar FundsUnexpended
PlantRetirement of Indebtedness
Investment In Plant Primary University
State of TexasState Appropriations 133,728,339 - - - - - - - - 133,728,339 State Grants and Contracts - Restricted 23,011,344 2,833,452 - 1,238,883 - - - - - 27,083,679 Higher Education Fund 37,562,056 - - - - - - - - 37,562,056 Available University Fund Excellence (See FN8) - - - - - - - - - - Subtotal 194,301,739 2,833,452 - 1,238,883 - - - - - 198,374,074
Student & ParentTuition Potential 100% 100,030,229 258,211,738 - - - - - - - 358,241,967 Waivers - Statutory (Not Reported in AFR) (21,232,270) (82,963) - - - - - - - (21,315,233) Waivers - Institutional (Not Reported in AFR) (326,102) (180,080) - - - - - - - (506,182) Exemptions - Statutory (Not Reported in AFR) (3,064,260) (16,488,411) - - - - - - - (19,552,671) Exemptions - Institutional (Not Reported in AFR) (2,355,596) (2,955,626) - - - - - - - (5,311,222) Tuition - Gross - AFR Presentation 73,052,001 238,504,658 - - - - - - - 311,556,659 Waivers - Statutory (Reported in AFR) - - - - - - - - - - Waivers - Institutional (Reported in AFR) - - - - - - - - - - Exemptions - Statutory (Reported in AFR) - - - - - - - - - - Exemptions - Institutional (Reported in AFR) - - - - - - - - - - All Other Scholarship Disc.& Allow. (See FN1) (18,591,645) (13,581,123) - - - - - - - (32,172,768) Tuition - net 54,460,356 224,923,535 - - - - - - - 279,383,891
Fees Potential 100% 429,387 107,362,271 17,029,591 - - - - - - 124,821,249 Waivers - Statutory (Not Reported in AFR) - - - - - - - - - - Waivers - Institutional (Not Reported in AFR) - - - - - - - - - - Exemptions - Statutory (Not Reported in AFR) - - - - - - - - - - Exemptions - Institutional (Not Reported in AFR) - - - - - - - - - - Fees - Gross - AFR Presentation 429,387 107,362,271 17,029,591 - - - - - - 124,821,249 Waivers - Statutory (Reported in AFR) - - - - - - - - - - Waivers - Institutional (Reported in AFR) - - - - - - - - - - Exemptions - Statutory (Reported in AFR) - - - - - - - - - - Exemptions - Institutional (Reported in AFR) - - - - - - - - - - All Other Scholarship Disc.& Allow. (See FN1) - (76,959,700) (381,507) - - - - - - (77,341,207) Fees - net 429,387 30,402,571 16,648,084 - - - - - - 47,480,042
Net Tuition and Fees (Funds Collected) 54,889,743 255,326,106 16,648,084 - - - - - - 326,863,933
Federal GovernmentFederal Grants and Contracts - Restricted - 63,159 - 82,565,638 - - - - - 82,628,797
Institutional ResourcesEndowment and Interest Income (See FN2) 413,310 9,574,528 247,690 12,348,820 20,477 1,463,502 - 172,482 - 24,240,809 Local Government Grants - Restricted - - - 340,931 - - - - - 340,931 Private Gifts and Grants - Restricted - - - 4,631,381 - - - - - 4,631,381 Sales and Services 426,439 25,749,813 - 1,910,938 2,825 - - - - 28,090,015 Net Auxiliary Enterprises (See FN9) - - 76,322,135 - - - - - - 76,322,135 Other Income (See FN3) 34,354 2,416,625 134,526 69,972 9,469 - - - - 2,664,946 Subtotal 874,103 37,740,966 76,704,351 19,302,042 32,771 1,463,502 - 172,482 - 136,290,217 Total Operating Sources 250,065,585 295,963,683 93,352,435 103,106,563 32,771 1,463,502 - 172,482 - 744,157,021
Operating UsesInstruction 99,459,508 72,730,495 - 3,367,078 - - - - - 175,557,081 Research 29,990,402 20,858,215 - 16,187,274 - - - - - 67,035,891 Public Service 530,066 5,489,143 - 4,125,260 - - - - - 10,144,469 Academic Support 19,338,075 42,818,598 - 1,024,432 - - - - - 63,181,105 Student Services 11,403,968 70,362,221 66 1,871,458 33,351 - - - - 83,671,064 Institutional Support 15,272,183 25,558,044 - 455,962 - 255,367 - - - 41,541,556 Operations and Maintenance of Plant 28,944,616 19,261,955 (1,125) 227,184 - - - - 5,425,541 53,858,171 Scholarships and Fellowships 17,668,218 (13,179) 744,630 67,721,778 15,836 - - - - 86,137,283 Auxiliary Enterprises (See FN9) - - 63,942,433 - - - - - - 63,942,433 Capital Outlay from Current Fund Sources* 25,942,139 6,966,679 2,521,525 2,139,531 - - - - - 37,569,874 Other Expenses (See FN3) 4 94,805 - - 1,150,391 - - - 1,052,619 2,297,819 Total Operating Uses 248,549,179 264,126,976 67,207,529 97,119,957 1,199,578 255,367 - - 6,478,160 684,936,746
Other Sources / (Uses) of FundsCapital Outlay from Non-Current Fund Sources** - - - - - - - - (211,398,704) (211,398,704) Mandatory and Non-mandatory Transfers (See FN10) (10,421,350) (48,597,683) (22,198,365) 2,200,235 (13,631) (1,462,872) - (26,298,548) 163,314,511 56,522,297 Bond Proceeds Transfers In (See FN4) - - - - - - - - - - Debt Service Payments (See FN5) - - - - - - - (28,093) - (28,093) Subtotal (10,421,350) (48,597,683) (22,198,365) 2,200,235 (13,631) (1,462,872) - (26,326,641) (48,084,193) (154,904,500)
Other Items Not for Current Operating UseUnrealized Gains / (Losses) (See FN6) - (2,765,313) - (667) - 182,096 - - - (2,583,884) Additions to Permanent Endowments (See FN7) - - - - - 514,883 - - - 514,883 Subtotal - (2,765,313) - (667) - 696,979 - - - (2,069,001)
Total Sources Over / (Under) Uses (See FN 11) (8,904,944) (19,526,289) 3,946,541 8,186,174 (1,180,438) 442,242 - (26,154,159) (54,562,353) (97,753,226)
Bond Proceeds - - - - - - - - - - Depreciation Expense - - - - - - - - (54,950,503) (54,950,503) Transfer of Capital Asses(s) from System - - - - - - - - (27,456) (27,456) Other Post-Employment Benefit (OPEB) Expense - - - - - - - - - - Non-Cash Capital Gifts - - - 235,981 - - - - 271,451 507,432 Capital Outlay - (7,150) - - - - - - 248,975,727 248,968,577 Change in Net Assets (Total Agrees with AFR***) (8,904,944) (19,533,439) 3,946,541 8,422,155 (1,180,438) 442,242 - (26,154,159) 139,706,866 96,744,824
*Defined as any capital outlay expenses from Educational & General, Designated, Auxiliary, or Restricted Expendable Funds.**Defined as any capital outlay expense from funds other than Educational & General, Designated, Auxiliary, or Restricted Expendable.***As reported for "Changes in Net Position" shown on Schedule of Revenues, Expenses, and Changes in Net Position (SRECNP) in Annual Financial Report.
University of North TexasFor the Year Ended August 31, 2019Source: FY 2019 Annual Financial Report
Detail Worksheet FY 2019
Texas Higher Education Coordinating Board 136 June, 2020
University of North TexasFor the Year Ended August 31, 2019Source: FY 2019 Annual Financial Report
FOOTNOTES:
FN1: Scholarship Discounts and Allowances are scholarships, fellowships, and grants applied to tuition. The discount eliminates tuition revenues that are paid for by University resources which are recorded as revenue elsewhere on the financial statements (i.e. federal and state contracts and grants revenues). In addition, Scholarship Discounts and Allowances eliminate tuition revenue that is exempted from payment due to tuition exemptions approved by the Texas Legislature. Waivers, remissions, and exemptions represent tuition and fee dollars forgone by the university - some are required by statute. See the Integrated Financial Reporting System (IFRS) report submitted to THECB for details on waivers, exemptions, tuition, and fees. Allocation methods to individual funds shown may vary between institutions.
FN2: Endowment and Interest Income includes interest income and endowment payouts.
FN3: Other Income is primarily Other Operating and Other Non-operating Revenues from the AFR. Other Expenses is primarily Other Nonoperating Expenses from the AFR.
FN4: Bond Proceeds are funds received from the sale of bonds and commercial paper used to finance capital projects. This amount includes actual proceeds and accrued or anticipated proceeds to be transferred from System. Independent institutions report only to the extent expended in current year.
FN5: Debt service payments are payments to service and retire debt issued to fund capital projects. System components do this via transfers to System Administrations. Independent institutions use direct payment to appropriate paying agents.
FN6: Unrealized Gains / (Losses) represent the increase in the Fair Market Value of Investments and Endowments. Unrealized Gains / (Losses) are accrued as non-cash transactions. Therefore, funds are not actually received for this revenue stream. Accordingly, this revenue is not cash revenue and cannot be used by the University to fund operations.
FN7: Additions to Permanent Endowments are additions to endowment principal. This revenue is restricted for investment purposes only and cannot be used to fund operations. Only interest income from these endowments, which is reported on the Endowment and Investment Income line of this report, can be used by the University to fund operations.
FN8: Distributions from the Available University Fund appropriated through the Appropriation Bill are first used to pay debt service costs on Permanent University Fund Bonds. Funds remaining are distributed to constitutionally designated institutions to promote academic excellence. Only the Excellence funding is shown at the institution level. The AUF funds used to pay debt service on PUF bonds are reported at the System level.
FN9: Auxiliary Enterprises include athletics, housing and food, student services, and parking and transportation. Auxiliary Enterprises are required to be self-supporting, and therefore must operate on the funds they generate.
FN10: Mandatory and non-mandatory transfers includes transfers between funds, transfers between the University System and institutions and transfers to and from other state agencies. In total, all transfers between funds net to zero with the exception of any amounts transferred between the University System, between other institutions, or to and from another state agency. There are no transfers of education and general funds provided by the State of Texas to restricted or auxiliary fund groups. Transfers between education and general funds and designated funds are related to Texas Public Education Grant as provided by the State of Texas.
FN11. N/A
Texas Higher Education Coordinating Board 137 June, 2020

University of North Texas at DallasFor the Year Ended August 31, 2019Source: FY 2019 Annual Financial Report
Non-Operating Funds are not included in above charts. See following page (Summary).Charts May Not Add to 100% Due to Rounding
Total Operating Uses $54,684,880
Total Operating Sources $70,298,189
Total Operating Sources $70,298,189
State of Texas$30,094,764
43%
Student & Parent$24,808,920
35%
Federal Government$9,828,053
14%
Institutional Resources$5,566,452
8%
Operating Sources by Category
State Appropriations$25,354,250
36%
State Grants & Contracts$2,627,510
4%Higher Education Fund
$2,113,0043%
Tuition & Fees$24,808,920
35%
Federal Grants & Contracts$9,828,053
14%
Endowment & Interest Income
$3,067,7974%
Private Gifts & Grants$415,470
1%
Sales & Services$177,280
0%
Net Auxiliary Enterprises$1,266,122
2% Other Income$639,783
1%
Operating Sources
Instruction$16,064,637
29%
Research$30,815
0%
Public Service$1,669,114
3%
Academic Support$4,742,256
9%
Student Services$7,763,426
14% Institutional Support$6,651,794
12%
Operations & Maintenance of Plant
$3,664,8317%
Scholarships & Fellowships$11,955,795
22%
Auxiliary Enterprises$1,120,091
2%
Capital Outlay$985,298
2%
Operating Uses
Texas Higher Education Coordinating Board 138 June, 2020

University of North Texas at DallasFor the Year Ended August 31, 2019Source: FY 2019 Annual Financial Report
Summary Worksheet FY 2019 Amount Per FTSEInstitution State Funded FTSEs 3,089.34
Operating SourcesState of TexasState Appropriations 25,354,250$ 8,207$ State Grants and Contracts - Restricted 2,627,510 851 Higher Education Fund 2,113,004 684 Available University Fund Excellence (See FN8) - - Subtotal 30,094,764$ 9,742$
Student & ParentTuition - net 20,404,547$ 6,605$ Fees - net 4,404,373 1,426 Tuition and Fees (net of Scholarship Discounts and Allowances) 24,808,920$ 8,031$
Federal GovernmentFederal Grants and Contracts - Restricted 9,828,053$ 3,181$
Institutional ResourcesEndowment and Interest Income (See FN2) 3,067,797$ 993$ Local Government Grants - Restricted - - Private Gifts and Grants - Restricted 415,470 134 Sales and Services 177,280 57 Net Auxiliary Enterprises (See FN9) 1,266,122 410 Other Income (See FN3) 639,783 207 Subtotal 5,566,452$ 1,801$ Total Operating Sources 70,298,189$ 22,755$
Operating UsesInstruction 16,064,637$ 5,200$ Research 30,815 10 Public Service 1,669,114 540 Academic Support 4,742,256 1,535 Student Services 7,763,426 2,513 Institutional Support 6,651,794 2,153 Operations and Maintenance of Plant 3,664,831 1,186 Scholarships and Fellowships 11,955,795 3,870 Auxiliary Enterprises (See FN9) 1,120,091 363 Capital Outlay from Current Fund Sources 985,298 319 Other Expenses (See FN3) 36,823 12 Total Operating Uses 54,684,880$ 17,701$
Other Sources / (Uses) of FundsCapital Outlay from Non-Current Fund Sources (62,112,130) (20,105)$ Mandatory and Non-mandatory Transfers (See FN10) (14,325,030) (4,637) Bond Proceeds Transfers (See FN4) - - Debt Service Payments (See FN5) - - Subtotal (76,437,160)$ (24,742)$
Other Items Not for Current Operating UseUnrealized Gains / (Losses) (See FN6) (238,423) (77)$ Additions to Permanent Endowments (See FN7) (289,012) (94) Subtotal (527,435)$ (171)$
Total Sources Over / (Under) Uses (See FN11) (61,351,286)$ (19,859)$
Texas Higher Education Coordinating Board 139 June, 2020

FY 2019
Operating SourcesEducational &
General DesignatedAuxiliary
EnterprisesRestricted Expendable Loan Funds
Annuity, Life & Endowment and
Similar FundsUnexpended
PlantRetirement of Indebtedness
Investment In Plant Primary University
State of TexasState Appropriations 25,354,250 - - - - - - - - 25,354,250 State Grants and Contracts - Restricted 2,560,297 - - 67,213 - - - - - 2,627,510 Higher Education Fund 2,113,004 - - - - - - - - 2,113,004 Available University Fund Excellence (See FN8) - - - - - - - - - - Subtotal 30,027,551 - - 67,213 - - - - - 30,094,764
Student & ParentTuition Potential 100% 8,197,386 20,266,252 - - - - - - - 28,463,638 Waivers - Statutory (Not Reported in AFR) (182,377) - - - - - - - - (182,377) Waivers - Institutional (Not Reported in AFR) - - - - - - - - - - Exemptions - Statutory (Not Reported in AFR) (386,372) - - - - - - - - (386,372) Exemptions - Institutional (Not Reported in AFR) - (853,565) - - - - - - - (853,565) Tuition - Gross - AFR Presentation 7,628,637 19,412,687 - - - - - - - 27,041,324 Waivers - Statutory (Reported in AFR) - - - - - - - - - - Waivers - Institutional (Reported in AFR) - - - - - - - - - - Exemptions - Statutory (Reported in AFR) - - - - - - - - - - Exemptions - Institutional (Reported in AFR) - - - - - - - - - - All Other Scholarship Disc.& Allow. (See FN1) (1,689,358) (4,947,419) - - - - - - - (6,636,777) Tuition - net 5,939,279 14,465,268 - - - - - - - 20,404,547
Fees Potential 100% - 4,387,573 16,800 - - - - - - 4,404,373 Waivers - Statutory (Not Reported in AFR) - - - - - - - - - - Waivers - Institutional (Not Reported in AFR) - - - - - - - - - - Exemptions - Statutory (Not Reported in AFR) - - - - - - - - - - Exemptions - Institutional (Not Reported in AFR) - - - - - - - - - - Fees - Gross - AFR Presentation - 4,387,573 16,800 - - - - - - 4,404,373 Waivers - Statutory (Reported in AFR) - - - - - - - - - - Waivers - Institutional (Reported in AFR) - - - - - - - - - - Exemptions - Statutory (Reported in AFR) - - - - - - - - - - Exemptions - Institutional (Reported in AFR) - - - - - - - - - - All Other Scholarship Disc.& Allow. (See FN1) - - - - - - - - - - Fees - net - 4,387,573 16,800 - - - - - - 4,404,373
Net Tuition and Fees (Funds Collected) 5,939,279 18,852,841 16,800 - - - - - - 24,808,920
Federal GovernmentFederal Grants and Contracts - Restricted - 23,017 - 9,805,036 - - - - - 9,828,053
Institutional ResourcesEndowment and Interest Income (See FN2) 87,276 584,529 - 1,772,181 - 22,735 - 518,553 82,523 3,067,797 Local Government Grants - Restricted - - - - - - - - - - Private Gifts and Grants - Restricted - - - 415,470 - - - - - 415,470 Sales and Services - 177,280 - - - - - - - 177,280 Net Auxiliary Enterprises (See FN9) - - 1,266,122 - - - - - - 1,266,122 Other Income (See FN3) - 22,111 32,407 5,123 - - - - 580,142 639,783 Subtotal 87,276 783,920 1,298,529 2,192,774 - 22,735 - 518,553 662,665 5,566,452 Total Operating Sources 36,054,106 19,659,778 1,315,329 12,065,023 - 22,735 - 518,553 662,665 70,298,189
Operating UsesInstruction 11,053,035 3,724,541 - 1,287,061 - - - - - 16,064,637 Research 2,445 9,651 - 18,719 - - - - - 30,815 Public Service - 81,051 - 1,588,063 - - - - - 1,669,114 Academic Support 3,297,270 1,361,844 - 83,142 - - - - - 4,742,256 Student Services 3,658,984 4,024,605 - 79,837 - - - - - 7,763,426 Institutional Support 4,401,745 2,238,768 - - - 11,281 - - - 6,651,794 Operations and Maintenance of Plant 2,115,390 1,203,953 - - - - - - 345,488 3,664,831 Scholarships and Fellowships 2,549,499 811,103 - 8,595,193 - - - - - 11,955,795 Auxiliary Enterprises (See FN9) - (59,529) 1,179,620 - - - - - - 1,120,091 Capital Outlay from Current Fund Sources* 625,415 263,202 64,378 32,303 - - - - - 985,298 Other Expenses (See FN3) 16,252 2,890 - - - - - - 17,681 36,823 Total Operating Uses 27,720,035 13,662,079 1,243,998 11,684,318 - 11,281 - - 363,169 54,684,880
Other Sources / (Uses) of FundsCapital Outlay from Non-Current Fund Sources** - - - - - - - - (62,112,130) (62,112,130) Mandatory and Non-mandatory Transfers (See FN10) (7,891,935) (5,553,933) (283,950) - - - - (24,474,377) 23,879,165 (14,325,030) Bond Proceeds Transfers In (See FN4) - - - - - - - - - - Debt Service Payments (See FN5) - - - - - - - - - - Subtotal (7,891,935) (5,553,933) (283,950) - - - - (24,474,377) (38,232,965) (76,437,160)
Other Items Not for Current Operating UseUnrealized Gains / (Losses) (See FN6) - (242,071) - - - 3,648 - - - (238,423) Additions to Permanent Endowments (See FN7) - - - - - (289,012) - - - (289,012) Subtotal - (242,071) - - - (285,364) - - - (527,435)
Total Sources Over / (Under) Uses (See FN 11) 442,136 201,695 (212,619) 380,705 - (273,910) - (23,955,824) (37,933,469) (61,351,286)
Bond Proceeds - - - - - - - - - - Depreciation Expense - - - - - - - - (5,466,095) (5,466,095) Transfer of Capital Asses(s) from System - - - - - - - - 44,142,775 44,142,775 Other Post-Employment Benefit (OPEB) Expense - - - - - - - - - - Non-Cash Capital Gifts - - - - - - - - - - Capital Outlay - - - 750,000 - - - - 63,097,428 63,847,428 Change in Net Assets (Total Agrees with AFR***) 442,136 201,695 (212,619) 1,130,705 - (273,910) - (23,955,824) 63,840,639 41,172,822
*Defined as any capital outlay expenses from Educational & General, Designated, Auxiliary, or Restricted Expendable Funds.**Defined as any capital outlay expense from funds other than Educational & General, Designated, Auxiliary, or Restricted Expendable.***As reported for "Changes in Net Position" shown on Schedule of Revenues, Expenses, and Changes in Net Position (SRECNP) in Annual Financial Report.
Detail Worksheet FY 2019
University of North Texas at DallasFor the Year Ended August 31, 2019Source: FY 2019 Annual Financial Report
Texas Higher Education Coordinating Board 140 June, 2020

University of North Texas at DallasFor the Year Ended August 31, 2019Source: FY 2019 Annual Financial Report
FOOTNOTES:
FN1: Scholarship Discounts and Allowances are scholarships, fellowships, and grants applied to tuition. The discount eliminates tuition revenues that are paid for by University resources which are recorded as revenue elsewhere on the financial statements (i.e. federal and state contracts and grants revenues). In addition, Scholarship Discounts and Allowances eliminate tuition revenue that is exempted from payment due to tuition exemptions approved by the Texas Legislature. Waivers, remissions, and exemptions represent tuition and fee dollars forgone by the university - some are required by statute. See the Integrated Financial Reporting System (IFRS) report submitted to THECB for details on waivers, exemptions, tuition, and fees. Allocation methods to individual funds shown may vary between institutions.
FN2: Endowment and Interest Income includes interest income and endowment payouts.
FN3: Other Income is primarily Other Operating and Other Non-operating Revenues from the AFR. Other Expenses is primarily Other Nonoperating Expenses from the AFR.
FN4: Bond Proceeds are funds received from the sale of bonds and commercial paper used to finance capital projects. This amount includes actual proceeds and accrued or anticipated proceeds to be transferred from System. Independent institutions report only to the extent expended in current year.
FN5: Debt service payments are payments to service and retire debt issued to fund capital projects. System components do this via transfers to System Administrations. Independent institutions use direct payment to appropriate paying agents.
FN6: Unrealized Gains / (Losses) represent the increase in the Fair Market Value of Investments and Endowments. Unrealized Gains / (Losses) are accrued as non-cash transactions. Therefore, funds are not actually received for this revenue stream. Accordingly, this revenue is not cash revenue and cannot be used by the University to fund operations.
FN7: Additions to Permanent Endowments are additions to endowment principal. This revenue is restricted for investment purposes only and cannot be used to fund operations. Only interest income from these endowments, which is reported on the Endowment and Investment Income line of this report, can be used by the University to fund operations.
FN8: Distributions from the Available University Fund appropriated through the Appropriation Bill are first used to pay debt service costs on Permanent University Fund Bonds. Funds remaining are distributed to constitutionally designated institutions to promote academic excellence. Only the Excellence funding is shown at the institution level. The AUF funds used to pay debt service on PUF bonds are reported at the System level.
FN9: Auxiliary Enterprises include athletics, housing and food, student services, and parking and transportation. Auxiliary Enterprises are required to be self-supporting, and therefore must operate on the funds they generate.
FN10: Mandatory and non-mandatory transfers includes transfers between funds, transfers between the University System and institutions and transfers to and from other state agencies. In total, all transfers between funds net to zero with the exception of any amounts transferred between the University System, between other institutions, or to and from another state agency. There are no transfers of education and general funds provided by the State of Texas to restricted or auxiliary fund groups. Transfers between education and general funds and designated funds are related to Texas Public Education Grant as provided by the State of Texas.
FN11. N/A
Texas Higher Education Coordinating Board 141 June, 2020

Midwestern State UniversityFor the Year Ended August 31, 2019Source: FY 2019 Annual Financial Report
Non-Operating Funds are not included in above charts. See following page (Summary).Charts May Not Add to 100% Due to Rounding
Total Operating Sources $123,028,161
Total Operating Sources $123,028,161
Total Operating Uses $110,802,742
State of Texas$37,071,657
30%
Student & Parent$35,507,877
29%
Federal Government$12,546,934
10%
Institutional Resources$37,901,693
31%
Operating Sources by Category
State Appropriations$27,682,291
23%
State Grants & Contracts$4,327,954
4%
Higher Education Fund$5,061,412
4%Tuition & Fees
$35,507,87729%
Federal Grants & Contracts
$12,546,93410%
Endowment & Interest Income
$3,048,2572%
Private Gifts & Grants$14,313,332
12%
Sales & Services$1,627,903
1%
Net Auxiliary Enterprises$13,883,717
11%
Other Income$5,028,484
4%
Operating Sources
Instruction$39,087,564
35%
Research$1,099,772
1%
Public Service$1,183,091
1%
Academic Support$11,044,085
10%
Student Services$14,200,958
13%
Institutional Support$9,159,132
8%
Operations & Maintenance of Plant
$8,039,1777%
Scholarships & Fellowships$12,698,325
12%
Auxiliary Enterprises$8,598,507
8%Capital Outlay
$5,680,6495%
Other Expenses$11,482
0%
Operating Uses
Texas Higher Education Coordinating Board 142 June, 2020

Midwestern State UniversityFor the Year Ended August 31, 2019Source: FY 2019 Annual Financial Report
Summary Worksheet FY 2019 Amount Per FTSEInstitution State Funded FTSEs 4,714.99
Operating SourcesState of TexasState Appropriations 27,682,291$ 5,871$ State Grants and Contracts - Restricted 4,327,954 918 Higher Education Fund 5,061,412 1,073 Available University Fund Excellence (See FN8) - - Subtotal 37,071,657$ 7,862$
Student & ParentTuition - net 19,017,762$ 4,033$ Fees - net 16,490,115 3,497 Tuition and Fees (net of Scholarship Discounts and Allowances) 35,507,877$ 7,530$
Federal GovernmentFederal Grants and Contracts - Restricted 12,546,934$ 2,661$
Institutional ResourcesEndowment and Interest Income (See FN2) 3,048,257$ 647$ Local Government Grants - Restricted - - Private Gifts and Grants - Restricted 14,313,332 3,036 Sales and Services 1,627,903 345 Net Auxiliary Enterprises (See FN9) 13,883,717 2,945 Other Income (See FN3) 5,028,484 1,066 Subtotal 37,901,693$ 8,039$ Total Operating Sources 123,028,161$ 26,092$
Operating UsesInstruction 39,087,564$ 8,290$ Research 1,099,772 233 Public Service 1,183,091 251 Academic Support 11,044,085 2,342 Student Services 14,200,958 3,012 Institutional Support 9,159,132 1,943 Operations and Maintenance of Plant 8,039,177 1,705 Scholarships and Fellowships 12,698,325 2,693 Auxiliary Enterprises (See FN9) 8,598,507 1,824 Capital Outlay from Current Fund Sources 5,680,649 1,205 Other Expenses (See FN3) 11,482 2 Total Operating Uses 110,802,742$ 23,500$
Other Sources / (Uses) of FundsCapital Outlay from Non-Current Fund Sources (31,482,811) (6,677)$ Mandatory and Non-mandatory Transfers (See FN10) (2,037,233) (432) Bond Proceeds Transfers (See FN4) 31,438,874 6,668 Debt Service Payments (See FN5) (11,931,841) (2,531) Subtotal (14,013,011)$ (2,972)$
Other Items Not for Current Operating UseUnrealized Gains / (Losses) (See FN6) (439,404) (93)$ Additions to Permanent Endowments (See FN7) 172,472 37 Subtotal (266,932)$ (56)$
Total Sources Over / (Under) Uses (See FN11) (2,054,524)$ (436)$
Texas Higher Education Coordinating Board 143 June, 2020
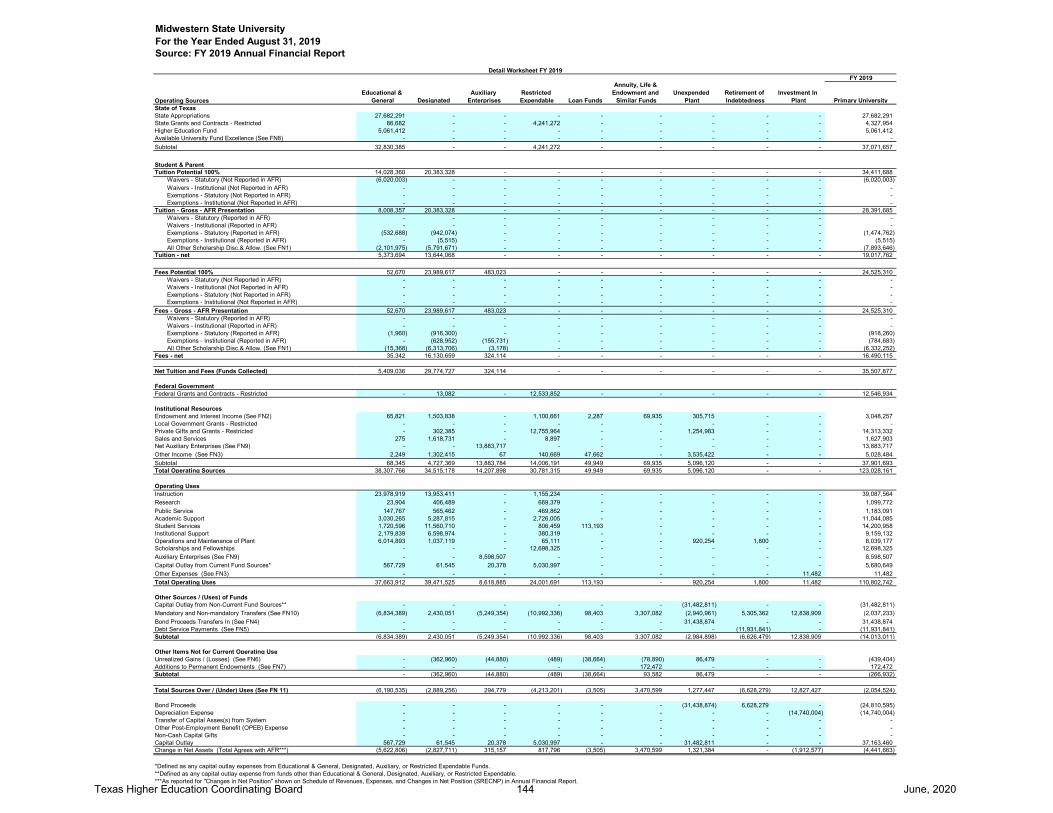
FY 2019
Operating SourcesEducational &
General DesignatedAuxiliary
EnterprisesRestricted Expendable Loan Funds
Annuity, Life & Endowment and
Similar FundsUnexpended
PlantRetirement of Indebtedness
Investment In Plant Primary University
State of TexasState Appropriations 27,682,291 - - - - - - - - 27,682,291 State Grants and Contracts - Restricted 86,682 - - 4,241,272 - - - - - 4,327,954 Higher Education Fund 5,061,412 - - - - - - - - 5,061,412 Available University Fund Excellence (See FN8) - - - - - - - - - - Subtotal 32,830,385 - - 4,241,272 - - - - - 37,071,657
Student & ParentTuition Potential 100% 14,028,360 20,383,328 - - - - - - - 34,411,688 Waivers - Statutory (Not Reported in AFR) (6,020,003) - - - - - - - - (6,020,003) Waivers - Institutional (Not Reported in AFR) - - - - - - - - - - Exemptions - Statutory (Not Reported in AFR) - - - - - - - - - - Exemptions - Institutional (Not Reported in AFR) - - - - - - - - - - Tuition - Gross - AFR Presentation 8,008,357 20,383,328 - - - - - - - 28,391,685 Waivers - Statutory (Reported in AFR) - - - - - - - - - - Waivers - Institutional (Reported in AFR) - - - - - - - - - - Exemptions - Statutory (Reported in AFR) (532,688) (942,074) - - - - - - - (1,474,762) Exemptions - Institutional (Reported in AFR) - (5,515) - - - - - - - (5,515) All Other Scholarship Disc.& Allow. (See FN1) (2,101,975) (5,791,671) - - - - - - - (7,893,646) Tuition - net 5,373,694 13,644,068 - - - - - - - 19,017,762
Fees Potential 100% 52,670 23,989,617 483,023 - - - - - - 24,525,310 Waivers - Statutory (Not Reported in AFR) - - - - - - - - - - Waivers - Institutional (Not Reported in AFR) - - - - - - - - - - Exemptions - Statutory (Not Reported in AFR) - - - - - - - - - - Exemptions - Institutional (Not Reported in AFR) - - - - - - - - - - Fees - Gross - AFR Presentation 52,670 23,989,617 483,023 - - - - - - 24,525,310 Waivers - Statutory (Reported in AFR) - - - - - - - - - - Waivers - Institutional (Reported in AFR) - - - - - - - - - - Exemptions - Statutory (Reported in AFR) (1,960) (916,300) - - - - - - - (918,260) Exemptions - Institutional (Reported in AFR) - (628,952) (155,731) - - - - - - (784,683) All Other Scholarship Disc.& Allow. (See FN1) (15,368) (6,313,706) (3,178) - - - - - - (6,332,252) Fees - net 35,342 16,130,659 324,114 - - - - - - 16,490,115
Net Tuition and Fees (Funds Collected) 5,409,036 29,774,727 324,114 - - - - - - 35,507,877
Federal GovernmentFederal Grants and Contracts - Restricted - 13,082 - 12,533,852 - - - - - 12,546,934
Institutional ResourcesEndowment and Interest Income (See FN2) 65,821 1,503,838 - 1,100,661 2,287 69,935 305,715 - - 3,048,257 Local Government Grants - Restricted - - - - - - - - - - Private Gifts and Grants - Restricted - 302,385 - 12,755,964 - - 1,254,983 - - 14,313,332 Sales and Services 275 1,618,731 - 8,897 - - - - - 1,627,903 Net Auxiliary Enterprises (See FN9) - - 13,883,717 - - - - - - 13,883,717 Other Income (See FN3) 2,249 1,302,415 67 140,669 47,662 - 3,535,422 - - 5,028,484 Subtotal 68,345 4,727,369 13,883,784 14,006,191 49,949 69,935 5,096,120 - - 37,901,693 Total Operating Sources 38,307,766 34,515,178 14,207,898 30,781,315 49,949 69,935 5,096,120 - - 123,028,161
Operating UsesInstruction 23,978,919 13,953,411 - 1,155,234 - - - - - 39,087,564 Research 23,904 406,489 - 669,379 - - - - - 1,099,772 Public Service 147,767 565,462 - 469,862 - - - - - 1,183,091 Academic Support 3,030,265 5,287,815 - 2,726,005 - - - - - 11,044,085 Student Services 1,720,596 11,560,710 - 806,459 113,193 - - - - 14,200,958 Institutional Support 2,179,839 6,598,974 - 380,319 - - - - - 9,159,132 Operations and Maintenance of Plant 6,014,893 1,037,119 - 65,111 - - 920,254 1,800 - 8,039,177 Scholarships and Fellowships - - - 12,698,325 - - - - - 12,698,325 Auxiliary Enterprises (See FN9) - - 8,598,507 - - - - - - 8,598,507 Capital Outlay from Current Fund Sources* 567,729 61,545 20,378 5,030,997 - - - - - 5,680,649 Other Expenses (See FN3) - - - - - - - - 11,482 11,482 Total Operating Uses 37,663,912 39,471,525 8,618,885 24,001,691 113,193 - 920,254 1,800 11,482 110,802,742
Other Sources / (Uses) of FundsCapital Outlay from Non-Current Fund Sources** - - - - - - (31,482,811) - - (31,482,811) Mandatory and Non-mandatory Transfers (See FN10) (6,834,389) 2,430,051 (5,249,354) (10,992,336) 98,403 3,307,082 (2,940,961) 5,305,362 12,838,909 (2,037,233) Bond Proceeds Transfers In (See FN4) - - - - - - 31,438,874 - - 31,438,874 Debt Service Payments (See FN5) - - - - - - - (11,931,841) - (11,931,841) Subtotal (6,834,389) 2,430,051 (5,249,354) (10,992,336) 98,403 3,307,082 (2,984,898) (6,626,479) 12,838,909 (14,013,011)
Other Items Not for Current Operating UseUnrealized Gains / (Losses) (See FN6) - (362,960) (44,880) (489) (38,664) (78,890) 86,479 - - (439,404) Additions to Permanent Endowments (See FN7) - - - - - 172,472 - - - 172,472 Subtotal - (362,960) (44,880) (489) (38,664) 93,582 86,479 - - (266,932)
Total Sources Over / (Under) Uses (See FN 11) (6,190,535) (2,889,256) 294,779 (4,213,201) (3,505) 3,470,599 1,277,447 (6,628,279) 12,827,427 (2,054,524)
Bond Proceeds - - - - - - (31,438,874) 6,628,279 - (24,810,595) Depreciation Expense - - - - - - - - (14,740,004) (14,740,004) Transfer of Capital Asses(s) from System - - - - - - - - - - Other Post-Employment Benefit (OPEB) Expense - - - - - - - - - - Non-Cash Capital Gifts - - - - - - - - - - Capital Outlay 567,729 61,545 20,378 5,030,997 - - 31,482,811 - - 37,163,460 Change in Net Assets (Total Agrees with AFR***) (5,622,806) (2,827,711) 315,157 817,796 (3,505) 3,470,599 1,321,384 - (1,912,577) (4,441,663)
*Defined as any capital outlay expenses from Educational & General, Designated, Auxiliary, or Restricted Expendable Funds.**Defined as any capital outlay expense from funds other than Educational & General, Designated, Auxiliary, or Restricted Expendable.***As reported for "Changes in Net Position" shown on Schedule of Revenues, Expenses, and Changes in Net Position (SRECNP) in Annual Financial Report.
Midwestern State UniversityFor the Year Ended August 31, 2019Source: FY 2019 Annual Financial Report
Detail Worksheet FY 2019
Texas Higher Education Coordinating Board 144 June, 2020

Midwestern State UniversityFor the Year Ended August 31, 2019Source: FY 2019 Annual Financial Report
FOOTNOTES:
FN1: Scholarship Discounts and Allowances are scholarships, fellowships, and grants applied to tuition. The discount eliminates tuition revenues that are paid for by University resources which are recorded as revenue elsewhere on the financial statements (i.e. federal and state contracts and grants revenues). In addition, Scholarship Discounts and Allowances eliminate tuition revenue that is exempted from payment due to tuition exemptions approved by the Texas Legislature. Waivers, remissions, and exemptions represent tuition and fee dollars forgone by the university - some are required by statute. See the Integrated Financial Reporting System (IFRS) report submitted to THECB for details on waivers, exemptions, tuition, and fees. Allocation methods to individual funds shown may vary between institutions.
FN2: Endowment and Interest Income includes interest income and endowment payouts.
FN3: Other Income is primarily Other Operating and Other Non-operating Revenues from the AFR. Other Expenses is primarily Other Nonoperating Expenses from the AFR.
FN4: Bond Proceeds are funds received from the sale of bonds and commercial paper used to finance capital projects. This amount includes actual proceeds and accrued or anticipated proceeds to be transferred from System. Independent institutions report only to the extent expended in current year.
FN5: Debt service payments are payments to service and retire debt issued to fund capital projects. System components do this via transfers to System Administrations. Independent institutions use direct payment to appropriate paying agents.
FN6: Unrealized Gains / (Losses) represent the increase in the Fair Market Value of Investments and Endowments. Unrealized Gains / (Losses) are accrued as non-cash transactions. Therefore, funds are not actually received for this revenue stream. Accordingly, this revenue is not cash revenue and cannot be used by the University to fund operations.
FN7: Additions to Permanent Endowments are additions to endowment principal. This revenue is restricted for investment purposes only and cannot be used to fund operations. Only interest income from these endowments, which is reported on the Endowment and Investment Income line of this report, can be used by the University to fund operations.
FN8: Distributions from the Available University Fund appropriated through the Appropriation Bill are first used to pay debt service costs on Permanent University Fund Bonds. Funds remaining are distributed to constitutionally designated institutions to promote academic excellence. Only the Excellence funding is shown at the institution level. The AUF funds used to pay debt service on PUF bonds are reported at the System level.
FN9: Auxiliary Enterprises include athletics, housing and food, student services, and parking and transportation. Auxiliary Enterprises are required to be self-supporting, and therefore must operate on the funds they generate.
FN10: Mandatory and non-mandatory transfers includes transfers between funds, transfers between the University System and institutions and transfers to and from other state agencies. In total, all transfers between funds net to zero with the exception of any amounts transferred between the University System, between other institutions, or to and from another state agency. There are no transfers of education and general funds provided by the State of Texas to restricted or auxiliary fund groups. Transfers between education and general funds and designated funds are related to Texas Public Education Grant as provided by the State of Texas.
FN11. N/A
Texas Higher Education Coordinating Board 145 June, 2020

Stephen F. Austin State UniversityFor the Year Ended August 31, 2019Source: FY 2019 Annual Financial Report
Non-Operating Funds are not included in above charts. See following page (Summary).Charts May Not Add to 100% Due to Rounding
Total Operating Sources $242,373,708
Total Operating Sources $242,373,708
Total Operating Uses $246,271,536
State of Texas$75,615,738
31%
Student & Parent$87,942,671
36%
Federal Government$26,132,046
11%
Institutional Resources$52,683,253
22%
Operating Sources by Category
State Appropriations$51,627,619
21%State Grants &
Contracts$12,351,956
5%
Higher Education Fund$11,636,163
5%
Tuition & Fees$87,942,671
36%
Federal Grants & Contracts
$26,132,04611%
Endowment & Interest Income
$7,223,1433%
Local Government Grants
$585,7260%
Private Gifts & Grants$5,307,772
2%
Sales & Services$6,534,052
3%
Net Auxiliary Enterprises$30,759,968
13%
Other Income$2,272,592
1%
Operating Sources
Instruction$77,568,902
31%
Research$3,870,806
2%
Public Service$2,236,760
1%
Academic Support$21,546,223
9%
Student Services$27,445,073
11% Institutional Support$31,597,414
13%
Operations & Maintenance of Plant
$17,509,6737%
Scholarships & Fellowships$18,996,489
8%
Auxiliary Enterprises$36,324,779
15%Capital Outlay$1,189,780
0%
Other Expenses$7,985,637
3%
Operating Uses
Texas Higher Education Coordinating Board 146 June, 2020

Stephen F. Austin State UniversityFor the Year Ended August 31, 2019Source: FY 2019 Annual Financial Report
Summary Worksheet FY 2019 Amount Per FTSEInstitution State Funded FTSEs 10,822.10
Operating SourcesState of TexasState Appropriations 51,627,619$ 4,771$ State Grants and Contracts - Restricted 12,351,956 1,141 Higher Education Fund 11,636,163 1,075 Available University Fund Excellence (See FN8) - - Subtotal 75,615,738$ 6,987$
Student & ParentTuition - net 59,366,969$ 5,486$ Fees - net 28,575,702 2,640 Tuition and Fees (net of Scholarship Discounts and Allowances) 87,942,671$ 8,126$
Federal GovernmentFederal Grants and Contracts - Restricted 26,132,046$ 2,415$
Institutional ResourcesEndowment and Interest Income (See FN2) 7,223,143$ 667$ Local Government Grants - Restricted 585,726 54 Private Gifts and Grants - Restricted 5,307,772 490 Sales and Services 6,534,052 604 Net Auxiliary Enterprises (See FN9) 30,759,968 2,842 Other Income (See FN3) 2,272,592 210 Subtotal 52,683,253$ 4,867$ Total Operating Sources 242,373,708$ 22,395$
Operating UsesInstruction 77,568,902$ 7,168$ Research 3,870,806 358 Public Service 2,236,760 207 Academic Support 21,546,223 1,991 Student Services 27,445,073 2,536 Institutional Support 31,597,414 2,920 Operations and Maintenance of Plant 17,509,673 1,618 Scholarships and Fellowships 18,996,489 1,755 Auxiliary Enterprises (See FN9) 36,324,779 3,357 Capital Outlay from Current Fund Sources 1,189,780 110 Other Expenses (See FN3) 7,985,637 738 Total Operating Uses 246,271,536$ 22,758$
Other Sources / (Uses) of FundsCapital Outlay from Non-Current Fund Sources (13,831,675) (1,278)$ Mandatory and Non-mandatory Transfers (See FN10) 497,640 46 Bond Proceeds Transfers (See FN4) 6,735,534 622 Debt Service Payments (See FN5) (21,643,088) (2,000) Subtotal (28,241,589)$ (2,610)$
Other Items Not for Current Operating UseUnrealized Gains / (Losses) (See FN6) (915,121) (85)$ Additions to Permanent Endowments (See FN7) 18,576 2 Subtotal (896,545)$ (83)$
Total Sources Over / (Under) Uses (See FN11) (33,035,962)$ (3,056)$
Texas Higher Education Coordinating Board 147 June, 2020

FY 2019
Operating SourcesEducational &
General DesignatedAuxiliary
EnterprisesRestricted Expendable Loan Funds
Annuity, Life & Endowment and
Similar FundsUnexpended
PlantRetirement of Indebtedness
Investment In Plant Primary University
State of TexasState Appropriations 51,627,619 - - - - - - - - 51,627,619 State Grants and Contracts - Restricted 10,097,212 - - 2,254,744 - - - - - 12,351,956 Higher Education Fund 11,636,163 - - - - - - - - 11,636,163 Available University Fund Excellence (See FN8) - - - - - - - - - - Subtotal 73,360,994 - - 2,254,744 - - - - - 75,615,738
Student & ParentTuition Potential 100% 22,218,706 65,737,773 - - - - - - - 87,956,479 Waivers - Statutory (Not Reported in AFR) (2,964,079) (31,296) - - - - - - - (2,995,375) Waivers - Institutional (Not Reported in AFR) - - - - - - - - - - Exemptions - Statutory (Not Reported in AFR) - - - - - - - - - - Exemptions - Institutional (Not Reported in AFR) - - - - - - - - - - Tuition - Gross - AFR Presentation 19,254,627 65,706,477 - - - - - - - 84,961,104 Waivers - Statutory (Reported in AFR) - - - - - - - - - - Waivers - Institutional (Reported in AFR) - - - - - - - - - - Exemptions - Statutory (Reported in AFR) (1,602,176) (5,463,466) - - - - - - - (7,065,642) Exemptions - Institutional (Reported in AFR) - - - - - - - - - - All Other Scholarship Disc.& Allow. (See FN1) (4,244,299) (14,284,194) - - - - - - - (18,528,493) Tuition - net 13,408,152 45,958,817 - - - - - - - 59,366,969
Fees Potential 100% 441,324 31,998,511 7,010,786 - - - - - - 39,450,621 Waivers - Statutory (Not Reported in AFR) - - - - - - - - - - Waivers - Institutional (Not Reported in AFR) - - - - - - - - - - Exemptions - Statutory (Not Reported in AFR) - - - - - - - - - - Exemptions - Institutional (Not Reported in AFR) - - - - - - - - - - Fees - Gross - AFR Presentation 441,324 31,998,511 7,010,786 - - - - - - 39,450,621 Waivers - Statutory (Reported in AFR) - - - - - - - - - - Waivers - Institutional (Reported in AFR) - - - - - - - - - - Exemptions - Statutory (Reported in AFR) (23,340) (3,405,163) (744,867) - - - - - - (4,173,370) Exemptions - Institutional (Reported in AFR) - - - - - - - - - - All Other Scholarship Disc.& Allow. (See FN1) (102,274) (4,815,438) (1,783,837) - - - - - - (6,701,549) Fees - net 315,710 23,777,910 4,482,082 - - - - - - 28,575,702
Net Tuition and Fees (Funds Collected) 13,723,862 69,736,727 4,482,082 - - - - - - 87,942,671
Federal GovernmentFederal Grants and Contracts - Restricted - - - 26,132,046 - - - - - 26,132,046
Institutional ResourcesEndowment and Interest Income (See FN2) 103,343 3,434,340 417,777 912,231 161 580,094 1,775,197 - - 7,223,143 Local Government Grants - Restricted 3,262 - - 582,464 - - - - - 585,726 Private Gifts and Grants - Restricted - - - 5,302,247 - - 5,525 - - 5,307,772 Sales and Services 924,564 4,770,936 - 838,552 - - - - - 6,534,052 Net Auxiliary Enterprises (See FN9) - - 30,759,968 - - - - - - 30,759,968 Other Income (See FN3) 12,569 895,800 148,445 164,204 336,594 - 714,980 - - 2,272,592 Subtotal 1,043,738 9,101,076 31,326,190 7,799,698 336,755 580,094 2,495,702 - - 52,683,253 Total Operating Sources 88,128,594 78,837,803 35,808,272 36,186,488 336,755 580,094 2,495,702 - - 242,373,708
Operating UsesInstruction 47,109,597 27,454,980 - 3,004,325 - - - - - 77,568,902 Research 1,144,366 1,328,809 - 1,397,631 - - - - - 3,870,806 Public Service 135,204 1,337,488 - 764,068 - - - - - 2,236,760 Academic Support 5,250,068 14,414,928 - 1,755,127 - - 126,100 - - 21,546,223 Student Services 75,893 13,339,496 11,829,846 1,275,315 924,523 - - - - 27,445,073 Institutional Support 6,930,962 23,855,236 - 673,252 - - 137,964 - - 31,597,414 Operations and Maintenance of Plant 3,534,747 11,335,286 - 14,760 - - 2,624,880 - - 17,509,673 Scholarships and Fellowships 3,320,939 4,781,838 1,766,299 9,127,413 - - - - - 18,996,489 Auxiliary Enterprises (See FN9) - 2,867,640 33,457,139 - - - - - - 36,324,779 Capital Outlay from Current Fund Sources* 787,030 188,540 178,870 35,340 - - - - - 1,189,780 Other Expenses (See FN3) - 187,823 43,373 346,531 (54,373) 138,988 861,695 7,892,775 (1,431,175) 7,985,637 Total Operating Uses 68,288,806 101,092,064 47,275,527 18,393,762 870,150 138,988 3,750,639 7,892,775 (1,431,175) 246,271,536
Other Sources / (Uses) of FundsCapital Outlay from Non-Current Fund Sources** - - - - - - (13,831,675) - - (13,831,675) Mandatory and Non-mandatory Transfers (See FN10) (22,573,757) (5,019,418) 10,957,516 (17,650,160) - - 13,146,888 21,636,571 - 497,640 Bond Proceeds Transfers In (See FN4) - - - - - - 6,735,534 - - 6,735,534 Debt Service Payments (See FN5) - - - - - - - (14,907,555) (6,735,533) (21,643,088) Subtotal (22,573,757) (5,019,418) 10,957,516 (17,650,160) - - 6,050,747 6,729,016 (6,735,533) (28,241,589)
Other Items Not for Current Operating UseUnrealized Gains / (Losses) (See FN6) - (463,354) (97,921) - - (193,142) - - (160,704) (915,121) Additions to Permanent Endowments (See FN7) - - - - - 18,576 - - - 18,576 Subtotal - (463,354) (97,921) - - (174,566) - - (160,704) (896,545)
Total Sources Over / (Under) Uses (See FN 11) (2,733,969) (27,737,033) (607,660) 142,566 (533,395) 266,540 4,795,810 (1,163,759) (5,465,062) (33,035,962)
Bond Proceeds - - - - - - - - 14,965,715 14,965,715 Depreciation Expense - - - - - - - - (18,711,720) (18,711,720) Transfer of Capital Asses(s) from System - - - - - - - - - - Other Post-Employment Benefit (OPEB) Expense - - - - - - - - - - Non-Cash Capital Gifts - - - - - - - - - - Capital Outlay - - - - - - - - 15,021,455 15,021,455 Change in Net Assets (Total Agrees with AFR***) (2,733,969) (27,737,033) (607,660) 142,566 (533,395) 266,540 4,795,810 (1,163,759) 5,810,388 (21,760,512)
*Defined as any capital outlay expenses from Educational & General, Designated, Auxiliary, or Restricted Expendable Funds.**Defined as any capital outlay expense from funds other than Educational & General, Designated, Auxiliary, or Restricted Expendable.***As reported for "Changes in Net Position" shown on Schedule of Revenues, Expenses, and Changes in Net Position (SRECNP) in Annual Financial Report.
Stephen F. Austin State UniversityFor the Year Ended August 31, 2019Source: FY 2019 Annual Financial Report
Detail Worksheet FY 2019
Texas Higher Education Coordinating Board 148 June, 2020

Stephen F. Austin State UniversityFor the Year Ended August 31, 2019Source: FY 2019 Annual Financial Report
FOOTNOTES:
FN1: Scholarship Discounts and Allowances are scholarships, fellowships, and grants applied to tuition. The discount eliminates tuition revenues that are paid for by University resources which are recorded as revenue elsewhere on the financial statements (i.e. federal and state contracts and grants revenues). In addition, Scholarship Discounts and Allowances eliminate tuition revenue that is exempted from payment due to tuition exemptions approved by the Texas Legislature. Waivers, remissions, and exemptions represent tuition and fee dollars forgone by the university - some are required by statute. See the Integrated Financial Reporting System (IFRS) report submitted to THECB for details on waivers, exemptions, tuition, and fees. Allocation methods to individual funds shown may vary between institutions.
FN2: Endowment and Interest Income includes interest income and endowment payouts.
FN3: Other Income is primarily Other Operating and Other Non-operating Revenues from the AFR. Other Expenses is primarily Other Nonoperating Expenses from the AFR.
FN4: Bond Proceeds are funds received from the sale of bonds and commercial paper used to finance capital projects. This amount includes actual proceeds and accrued or anticipated proceeds to be transferred from System. Independent institutions report only to the extent expended in current year.
FN5: Debt service payments are payments to service and retire debt issued to fund capital projects. System components do this via transfers to System Administrations. Independent institutions use direct payment to appropriate paying agents.
FN6: Unrealized Gains / (Losses) represent the increase in the Fair Market Value of Investments and Endowments. Unrealized Gains / (Losses) are accrued as non-cash transactions. Therefore, funds are not actually received for this revenue stream. Accordingly, this revenue is not cash revenue and cannot be used by the University to fund operations.
FN7: Additions to Permanent Endowments are additions to endowment principal. This revenue is restricted for investment purposes only and cannot be used to fund operations. Only interest income from these endowments, which is reported on the Endowment and Investment Income line of this report, can be used by the University to fund operations.
FN8: Distributions from the Available University Fund appropriated through the Appropriation Bill are first used to pay debt service costs on Permanent University Fund Bonds. Funds remaining are distributed to constitutionally designated institutions to promote academic excellence. Only the Excellence funding is shown at the institution level. The AUF funds used to pay debt service on PUF bonds are reported at the System level.
FN9: Auxiliary Enterprises include athletics, housing and food, student services, and parking and transportation. Auxiliary Enterprises are required to be self-supporting, and therefore must operate on the funds they generate.
FN10: Mandatory and non-mandatory transfers includes transfers between funds, transfers between the University System and institutions and transfers to and from other state agencies. In total, all transfers between funds net to zero with the exception of any amounts transferred between the University System, between other institutions, or to and from another state agency. There are no transfers of education and general funds provided by the State of Texas to restricted or auxiliary fund groups. Transfers between education and general funds and designated funds are related to Texas Public Education Grant as provided by the State of Texas.
FN11. N/A
Texas Higher Education Coordinating Board 149 June, 2020

Texas Southern UniversityFor the Year Ended August 31, 2019Source: FY 2019 Annual Financial Report
Non-Operating Funds are not included in above charts. See following page (Summary).Charts May Not Add to 100% Due to Rounding
Total Operating Sources $240,737,598
Total Operating Sources $240,737,598
Total Operating Uses $216,332,938
State of Texas$88,349,259
37%
Student & Parent$69,107,923
29%
Federal Government$51,670,168
21%
Institutional Resources$31,610,248
13%
Operating Sources by Category
State Appropriations$66,497,233
28%
State Grants & Contracts
$10,192,1834%
Higher Education Fund$11,659,843
5%Tuition & Fees$69,107,923
29%
Federal Grants & Contracts
$51,670,16822%
Endowment & Interest Income
$5,340,4202%
Local Government Grants
$325,7580%
Private Gifts & Grants$3,387,358
1%
Sales & Services$99,520
0%
Net Auxiliary Enterprises$17,734,426
7% Other Income$4,722,766
2%
Operating Sources
Instruction$80,757,815
37%
Research$4,893,014
2%
Public Service$1,858,815
1%
Academic Support$13,481,384
6%
Student Services$15,317,910
7%Institutional Support
$46,436,38622%
Operations & Maintenance of Plant
$15,367,4977%
Scholarships & Fellowships$16,443,264
8%Auxiliary Enterprises
$17,388,0578%Capital Outlay
$3,890,5542%
Other Expenses$498,242
0%
Operating Uses
Texas Higher Education Coordinating Board 150 June, 2020

Texas Southern UniversityFor the Year Ended August 31, 2019Source: FY 2019 Annual Financial Report
Summary Worksheet FY 2019 Amount Per FTSEInstitution State Funded FTSEs 8,765.96
Operating SourcesState of TexasState Appropriations 66,497,233$ 7,586$ State Grants and Contracts - Restricted 10,192,183 1,163 Higher Education Fund 11,659,843 1,330 Available University Fund Excellence (See FN8) - - Subtotal 88,349,259$ 10,079$
Student & ParentTuition - net 54,386,052$ 6,204$ Fees - net 14,721,871 1,679 Tuition and Fees (net of Scholarship Discounts and Allowances) 69,107,923$ 7,883$
Federal GovernmentFederal Grants and Contracts - Restricted 51,670,168$ 5,894$
Institutional ResourcesEndowment and Interest Income (See FN2) 5,340,420$ 609$ Local Government Grants - Restricted 325,758 37 Private Gifts and Grants - Restricted 3,387,358 386 Sales and Services 99,520 11 Net Auxiliary Enterprises (See FN9) 17,734,426 2,023 Other Income (See FN3) 4,722,766 539 Subtotal 31,610,248$ 3,605$ Total Operating Sources 240,737,598$ 27,461$
Operating UsesInstruction 80,757,815$ 9,213$ Research 4,893,014 558 Public Service 1,858,815 212 Academic Support 13,481,384 1,538 Student Services 15,317,910 1,747 Institutional Support 46,436,386 5,297 Operations and Maintenance of Plant 15,367,497 1,753 Scholarships and Fellowships 16,443,264 1,876 Auxiliary Enterprises (See FN9) 17,388,057 1,984 Capital Outlay from Current Fund Sources 3,890,554 444 Other Expenses (See FN3) 498,242 57 Total Operating Uses 216,332,938$ 24,679$
Other Sources / (Uses) of FundsCapital Outlay from Non-Current Fund Sources (41,653,476) (4,752)$ Mandatory and Non-mandatory Transfers (See FN10) (483,275) (55) Bond Proceeds Transfers (See FN4) - - Debt Service Payments (See FN5) (20,310,664) (2,317) Subtotal (62,447,415)$ (7,124)$
Other Items Not for Current Operating UseUnrealized Gains / (Losses) (See FN6) (1,595,087) (182)$ Additions to Permanent Endowments (See FN7) 448,892 51 Subtotal (1,146,195)$ (131)$
Total Sources Over / (Under) Uses (See FN11) (39,188,950)$ (4,473)$
Texas Higher Education Coordinating Board 151 June, 2020

FY 2019
Operating SourcesEducational &
General DesignatedAuxiliary
EnterprisesRestricted Expendable Loan Funds
Annuity, Life & Endowment and
Similar FundsUnexpended
PlantRetirement of Indebtedness
Investment In Plant Primary University
State of TexasState Appropriations 66,497,233 - - - - - - - - 66,497,233 State Grants and Contracts - Restricted 9,210,005 - - 982,178 - - - - - 10,192,183 Higher Education Fund 11,659,843 - - - - - - - - 11,659,843 Available University Fund Excellence (See FN8) - - - - - - - - - - Subtotal 87,367,081 - - 982,178 - - - - - 88,349,259
Student & ParentTuition Potential 100% 42,181,290 49,623,756 - - - - - - - 91,805,046 Waivers - Statutory (Not Reported in AFR) (5,813,022) - - - - - - - - (5,813,022) Waivers - Institutional (Not Reported in AFR) - - - - - - - - - - Exemptions - Statutory (Not Reported in AFR) - - - - - - - - - - Exemptions - Institutional (Not Reported in AFR) - - - - - - - - - - Tuition - Gross - AFR Presentation 36,368,268 49,623,756 - - - - - - - 85,992,024 Waivers - Statutory (Reported in AFR) - - - - - - - - - - Waivers - Institutional (Reported in AFR) - - - - - - - - - - Exemptions - Statutory (Reported in AFR) (3,858,473) - - - - - - - - (3,858,473) Exemptions - Institutional (Reported in AFR) - - - - - - - - - - All Other Scholarship Disc.& Allow. (See FN1) (11,352,461) (16,395,038) - - - - - - - (27,747,499) Tuition - net 21,157,334 33,228,718 - - - - - - - 54,386,052
Fees Potential 100% 779,035 13,791,248 7,415,354 - - - - - - 21,985,637 Waivers - Statutory (Not Reported in AFR) - - - - - - - - - - Waivers - Institutional (Not Reported in AFR) - - - - - - - - - - Exemptions - Statutory (Not Reported in AFR) - - - - - - - - - - Exemptions - Institutional (Not Reported in AFR) - - - - - - - - - - Fees - Gross - AFR Presentation 779,035 13,791,248 7,415,354 - - - - - - 21,985,637 Waivers - Statutory (Reported in AFR) - - - - - - - - - - Waivers - Institutional (Reported in AFR) - - - - - - - - - - Exemptions - Statutory (Reported in AFR) - - - - - - - - - - Exemptions - Institutional (Reported in AFR) - - - - - - - - - - All Other Scholarship Disc.& Allow. (See FN1) (2,189,676) (4,556,386) (517,704) - - - - - - (7,263,766) Fees - net (1,410,641) 9,234,862 6,897,650 - - - - - - 14,721,871
Net Tuition and Fees (Funds Collected) 19,746,693 42,463,580 6,897,650 - - - - - - 69,107,923
Federal GovernmentFederal Grants and Contracts - Restricted - - - 51,670,168 - - - - - 51,670,168
Institutional ResourcesEndowment and Interest Income (See FN2) 492,256 1,752,840 23,986 165,487 - 1,270,354 726,125 909,372 - 5,340,420 Local Government Grants - Restricted - - - 325,758 - - - - - 325,758 Private Gifts and Grants - Restricted (630,183) 732,436 30,000 3,026,039 - 1,480 227,586 - - 3,387,358 Sales and Services 55,918 43,602 - - - - - - - 99,520 Net Auxiliary Enterprises (See FN9) - - 17,734,426 - - - - - - 17,734,426 Other Income (See FN3) 122,456 4,080,938 327,141 - - - 192,231 - - 4,722,766 Subtotal 40,447 6,609,816 18,115,553 3,517,284 - 1,271,834 1,145,942 909,372 - 31,610,248 Total Operating Sources 107,154,221 49,073,396 25,013,203 56,169,630 - 1,271,834 1,145,942 909,372 - 240,737,598
Operating UsesInstruction 58,506,153 16,408,103 - 5,843,559 - - - - - 80,757,815 Research 695,047 - - 4,197,967 - - - - - 4,893,014 Public Service 145,847 446,005 - 1,266,963 - - - - - 1,858,815 Academic Support 3,939,465 4,887,662 - 4,654,257 - - - - - 13,481,384 Student Services 1,487,015 10,970,205 - 2,860,690 - - - - - 15,317,910 Institutional Support 33,542,483 11,109,600 - 1,738,140 - - 46,163 - - 46,436,386 Operations and Maintenance of Plant 4,232,651 6,359,350 - 5,513 - - 4,769,983 - - 15,367,497 Scholarships and Fellowships (3,654,423) (14,406,754) - 34,504,441 - - - - - 16,443,264 Auxiliary Enterprises (See FN9) - - 17,388,057 - - - - - - 17,388,057 Capital Outlay from Current Fund Sources* 1,260,948 1,289,064 - 1,340,542 - - - - - 3,890,554 Other Expenses (See FN3) - - - - - 498,242 - - - 498,242 Total Operating Uses 100,155,186 37,063,235 17,388,057 56,412,072 - 498,242 4,816,146 - - 216,332,938
Other Sources / (Uses) of FundsCapital Outlay from Non-Current Fund Sources** - - - - - - (41,653,476) - - (41,653,476) Mandatory and Non-mandatory Transfers (See FN10) (483,275) - - - - - - - - (483,275) Bond Proceeds Transfers In (See FN4) - - - - - - - - - - Debt Service Payments (See FN5) (7,905,154) (2,504,386) (5,204,288) - - - (2,237,338) (1,356,013) (1,103,485) (20,310,664) Subtotal (8,388,429) (2,504,386) (5,204,288) - - - (43,890,814) (1,356,013) (1,103,485) (62,447,415)
Other Items Not for Current Operating UseUnrealized Gains / (Losses) (See FN6) - - - - - (1,595,087) - - - (1,595,087) Additions to Permanent Endowments (See FN7) - - - - - 448,892 - - - 448,892 Subtotal - - - - - (1,146,195) - - - (1,146,195)
Total Sources Over / (Under) Uses (See FN 11) (1,389,394) 9,505,775 2,420,858 (242,442) - (372,603) (47,561,018) (446,641) (1,103,485) (39,188,950)
Bond Proceeds 7,905,000 1,930,759 3,645,579 - - - 124,727 - - 13,606,065 Depreciation Expense - - - - - - - - (19,810,066) (19,810,066) Transfer of Capital Asses(s) from System - - - - - - - - - - Other Post-Employment Benefit (OPEB) Expense - - - - - - - - - - Non-Cash Capital Gifts - - - - - - - - - - Capital Outlay 1,260,948 1,289,064 - 1,340,542 - - 41,653,476 - - 45,544,030 Change in Net Assets (Total Agrees with AFR***) 7,776,554 12,725,598 6,066,437 1,098,100 - (372,603) (5,782,815) (446,641) (20,913,551) 151,079
*Defined as any capital outlay expenses from Educational & General, Designated, Auxiliary, or Restricted Expendable Funds.**Defined as any capital outlay expense from funds other than Educational & General, Designated, Auxiliary, or Restricted Expendable.***As reported for "Changes in Net Position" shown on Schedule of Revenues, Expenses, and Changes in Net Position (SRECNP) in Annual Financial Report.
Texas Southern UniversityFor the Year Ended August 31, 2019Source: FY 2019 Annual Financial Report
Detail Worksheet FY 2019
Texas Higher Education Coordinating Board 152 June, 2020

Texas Southern UniversityFor the Year Ended August 31, 2019Source: FY 2019 Annual Financial Report
FOOTNOTES:
FN1: Scholarship Discounts and Allowances are scholarships, fellowships, and grants applied to tuition. The discount eliminates tuition revenues that are paid for by University resources which are recorded as revenue elsewhere on the financial statements (i.e. federal and state contracts and grants revenues). In addition, Scholarship Discounts and Allowances eliminate tuition revenue that is exempted from payment due to tuition exemptions approved by the Texas Legislature. Waivers, remissions, and exemptions represent tuition and fee dollars forgone by the university - some are required by statute. See the Integrated Financial Reporting System (IFRS) report submitted to THECB for details on waivers, exemptions, tuition, and fees. Allocation methods to individual funds shown may vary between institutions.
FN2: Endowment and Interest Income includes interest income and endowment payouts.
FN3: Other Income is primarily Other Operating and Other Non-operating Revenues from the AFR. Other Expenses is primarily Other Nonoperating Expenses from the AFR.
FN4: Bond Proceeds are funds received from the sale of bonds and commercial paper used to finance capital projects. This amount includes actual proceeds and accrued or anticipated proceeds to be transferred from System. Independent institutions report only to the extent expended in current year.
FN5: Debt service payments are payments to service and retire debt issued to fund capital projects. System components do this via transfers to System Administrations. Independent institutions use direct payment to appropriate paying agents.
FN6: Unrealized Gains / (Losses) represent the increase in the Fair Market Value of Investments and Endowments. Unrealized Gains / (Losses) are accrued as non-cash transactions. Therefore, funds are not actually received for this revenue stream. Accordingly, this revenue is not cash revenue and cannot be used by the University to fund operations.
FN7: Additions to Permanent Endowments are additions to endowment principal. This revenue is restricted for investment purposes only and cannot be used to fund operations. Only interest income from these endowments, which is reported on the Endowment and Investment Income line of this report, can be used by the University to fund operations.
FN8: Distributions from the Available University Fund appropriated through the Appropriation Bill are first used to pay debt service costs on Permanent University Fund Bonds. Funds remaining are distributed to constitutionally designated institutions to promote academic excellence. Only the Excellence funding is shown at the institution level. The AUF funds used to pay debt service on PUF bonds are reported at the System level.
FN9: Auxiliary Enterprises include athletics, housing and food, student services, and parking and transportation. Auxiliary Enterprises are required to be self-supporting, and therefore must operate on the funds they generate.
FN10: Mandatory and non-mandatory transfers includes transfers between funds, transfers between the University System and institutions and transfers to and from other state agencies. In total, all transfers between funds net to zero with the exception of any amounts transferred between the University System, between other institutions, or to and from another state agency. There are no transfers of education and general funds provided by the State of Texas to restricted or auxiliary fund groups. Transfers between education and general funds and designated funds are related to Texas Public Education Grant as provided by the State of Texas.
FN11. N/A
Texas Higher Education Coordinating Board 153 June, 2020

Texas Woman's UniversityFor the Year Ended August 31, 2019Source: FY 2019 Annual Financial Report
Non-Operating Funds are not included in above charts. See following page (Summary).Charts May Not Add to 100% Due to Rounding
Total Operating Sources $239,438,973
Total Operating Sources $239,438,973
Total Operating Uses $223,218,829
State of Texas$92,495,779
39%
Student & Parent$77,541,183
32%
Federal Government$25,830,688
11%
Institutional Resources$43,571,323
18%
Operating Sources by Category
State Appropriations$69,277,548
29%
State Grants & Contracts$8,371,673
3%
Higher Education Fund$14,846,558
6%
Tuition & Fees$77,541,183
32%
Federal Grants & Contracts
$25,830,68811%
Endowment & Interest Income
$13,100,4385%
Local Government Grants
$1,582,6891%
Private Gifts & Grants$4,504,453
2%
Net Auxiliary Enterprises$22,982,096
10%Other Income
$1,401,6471%
Operating Sources
Instruction$87,662,752
39%
Research$5,084,232
2%
Public Service$1,075,425
1%
Academic Support$30,433,744
14%Student Services
$15,933,9767%
Institutional Support$23,142,725
11%
Operations & Maintenance of Plant
$18,221,7988%
Scholarships & Fellowships$10,912,592
5%
Auxiliary Enterprises$29,751,349
13%
Capital Outlay$624,925
0%
Other Expenses$375,311
0%
Operating Uses
Texas Higher Education Coordinating Board 154 June, 2020
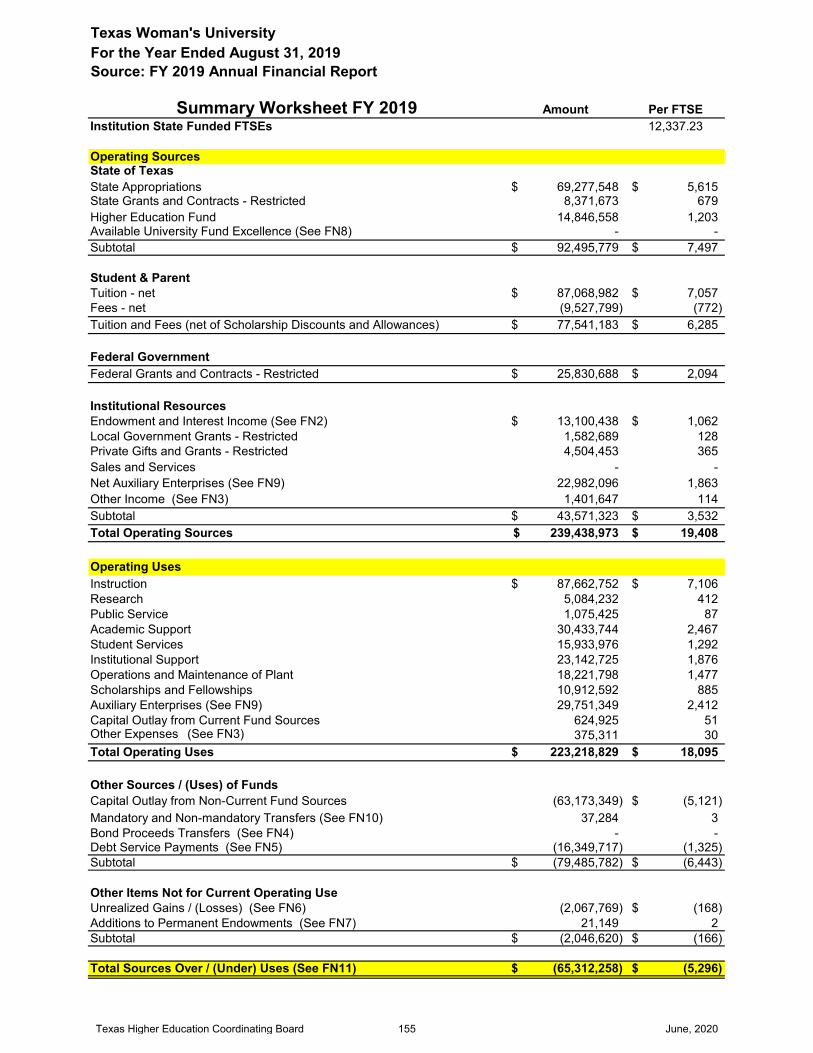
Texas Woman's UniversityFor the Year Ended August 31, 2019Source: FY 2019 Annual Financial Report
Summary Worksheet FY 2019 Amount Per FTSEInstitution State Funded FTSEs 12,337.23
Operating SourcesState of TexasState Appropriations 69,277,548$ 5,615$ State Grants and Contracts - Restricted 8,371,673 679 Higher Education Fund 14,846,558 1,203 Available University Fund Excellence (See FN8) - - Subtotal 92,495,779$ 7,497$
Student & ParentTuition - net 87,068,982$ 7,057$ Fees - net (9,527,799) (772) Tuition and Fees (net of Scholarship Discounts and Allowances) 77,541,183$ 6,285$
Federal GovernmentFederal Grants and Contracts - Restricted 25,830,688$ 2,094$
Institutional ResourcesEndowment and Interest Income (See FN2) 13,100,438$ 1,062$ Local Government Grants - Restricted 1,582,689 128 Private Gifts and Grants - Restricted 4,504,453 365 Sales and Services - - Net Auxiliary Enterprises (See FN9) 22,982,096 1,863 Other Income (See FN3) 1,401,647 114 Subtotal 43,571,323$ 3,532$ Total Operating Sources 239,438,973$ 19,408$
Operating UsesInstruction 87,662,752$ 7,106$ Research 5,084,232 412 Public Service 1,075,425 87 Academic Support 30,433,744 2,467 Student Services 15,933,976 1,292 Institutional Support 23,142,725 1,876 Operations and Maintenance of Plant 18,221,798 1,477 Scholarships and Fellowships 10,912,592 885 Auxiliary Enterprises (See FN9) 29,751,349 2,412 Capital Outlay from Current Fund Sources 624,925 51 Other Expenses (See FN3) 375,311 30 Total Operating Uses 223,218,829$ 18,095$
Other Sources / (Uses) of FundsCapital Outlay from Non-Current Fund Sources (63,173,349) (5,121)$ Mandatory and Non-mandatory Transfers (See FN10) 37,284 3 Bond Proceeds Transfers (See FN4) - - Debt Service Payments (See FN5) (16,349,717) (1,325) Subtotal (79,485,782)$ (6,443)$
Other Items Not for Current Operating UseUnrealized Gains / (Losses) (See FN6) (2,067,769) (168)$ Additions to Permanent Endowments (See FN7) 21,149 2 Subtotal (2,046,620)$ (166)$
Total Sources Over / (Under) Uses (See FN11) (65,312,258)$ (5,296)$
Texas Higher Education Coordinating Board 155 June, 2020

FY 2019
Operating SourcesEducational &
General DesignatedAuxiliary
EnterprisesRestricted Expendable Loan Funds
Annuity, Life & Endowment and
Similar FundsUnexpended
PlantRetirement of Indebtedness
Investment In Plant Primary University
State of TexasState Appropriations 69,277,548 - - - - - - - - 69,277,548 State Grants and Contracts - Restricted - - - 8,371,673 - - - - - 8,371,673 Higher Education Fund 14,846,558 - - - - - - - - 14,846,558 Available University Fund Excellence (See FN8) - - - - - - - - - - Subtotal 84,124,106 - - 8,371,673 - - - - - 92,495,779
Student & ParentTuition Potential 100% 30,296,905 64,384,211 - - - - - - - 94,681,116 Waivers - Statutory (Not Reported in AFR) - - - - - - - - - - Waivers - Institutional (Not Reported in AFR) - - - - - - - - - - Exemptions - Statutory (Not Reported in AFR) - - - - - - - - - - Exemptions - Institutional (Not Reported in AFR) - - - - - - - - - - Tuition - Gross - AFR Presentation 30,296,905 64,384,211 - - - - - - - 94,681,116 Waivers - Statutory (Reported in AFR) (4,618,120) - - - - - - - - (4,618,120) Waivers - Institutional (Reported in AFR) - - - - - - - - - - Exemptions - Statutory (Reported in AFR) (2,994,014) - - - - - - - - (2,994,014) Exemptions - Institutional (Reported in AFR) - - - - - - - - - - All Other Scholarship Disc.& Allow. (See FN1) - - - - - - - - - - Tuition - net 22,684,771 64,384,211 - - - - - - - 87,068,982
Fees Potential 100% 585,154 21,547,690 - - - - - - - 22,132,844 Waivers - Statutory (Not Reported in AFR) - - - - - - - - - - Waivers - Institutional (Not Reported in AFR) - - - - - - - - - - Exemptions - Statutory (Not Reported in AFR) - - - - - - - - - - Exemptions - Institutional (Not Reported in AFR) - - - - - - - - - - Fees - Gross - AFR Presentation 585,154 21,547,690 - - - - - - - 22,132,844 Waivers - Statutory (Reported in AFR) - - - - - - - - - - Waivers - Institutional (Reported in AFR) - (25) - - - - - - - (25) Exemptions - Statutory (Reported in AFR) (1,243,703) - - - - - - - - (1,243,703) Exemptions - Institutional (Reported in AFR) - - - - - - - - - - All Other Scholarship Disc.& Allow. (See FN1) (8,041,307) (22,375,608) - - - - - - - (30,416,915) Fees - net (8,699,856) (827,943) - - - - - - - (9,527,799)
Net Tuition and Fees (Funds Collected) 13,984,915 63,556,268 - - - - - - - 77,541,183
Federal GovernmentFederal Grants and Contracts - Restricted - - - 25,830,688 - - - - - 25,830,688
Institutional ResourcesEndowment and Interest Income (See FN2) 179,677 8,779,564 350,368 257,102 18,129 840,048 2,675,550 - - 13,100,438 Local Government Grants - Restricted - - - 1,582,689 - - - - - 1,582,689 Private Gifts and Grants - Restricted - 124,140 1,500 4,359,939 - 18,874 - - - 4,504,453 Sales and Services - - - - - - - - - - Net Auxiliary Enterprises (See FN9) - - 22,982,096 - - - - - - 22,982,096 Other Income (See FN3) 13,719 256,884 561,273 569,771 - - - - - 1,401,647 Subtotal 193,396 9,160,588 23,895,237 6,769,501 18,129 858,922 2,675,550 - - 43,571,323 Total Operating Sources 98,302,417 72,716,856 23,895,237 40,971,862 18,129 858,922 2,675,550 - - 239,438,973
Operating UsesInstruction 76,675,215 9,607,393 - 1,380,144 - - - - - 87,662,752 Research 1,201,821 349,767 - 3,532,644 - - - - - 5,084,232 Public Service 4,167 66,480 - 1,004,778 - - - - - 1,075,425 Academic Support 7,196,823 22,861,038 - 375,883 - - - - - 30,433,744 Student Services 2,688,770 11,049,169 - 2,106,690 - - 89,347 - - 15,933,976 Institutional Support 7,961,369 14,360,102 - 232,623 461,941 126,690 - - - 23,142,725 Operations and Maintenance of Plant 5,762,160 7,262,000 533 749 - - 5,196,356 - - 18,221,798 Scholarships and Fellowships - 1,560,688 - 9,351,904 - - - - - 10,912,592 Auxiliary Enterprises (See FN9) - - 29,688,189 63,160 - - - - - 29,751,349 Capital Outlay from Current Fund Sources* 85,420 399,834 107,055 32,616 - - - - - 624,925 Other Expenses (See FN3) - 351,710 - - - - - 1,025 22,576 375,311 Total Operating Uses 101,575,745 67,868,181 29,795,777 18,081,191 461,941 126,690 5,285,703 1,025 22,576 223,218,829
Other Sources / (Uses) of FundsCapital Outlay from Non-Current Fund Sources** - - - - - - (63,173,349) - - (63,173,349) Mandatory and Non-mandatory Transfers (See FN10) (11,035,858) (8,900,329) 6,972,377 (19,166,052) 276,661 (145,364) 15,711,669 16,324,180 - 37,284 Bond Proceeds Transfers In (See FN4) - - - - - - - - - - Debt Service Payments (See FN5) - - - - - - - (16,349,717) - (16,349,717) Subtotal (11,035,858) (8,900,329) 6,972,377 (19,166,052) 276,661 (145,364) (47,461,680) (25,537) - (79,485,782)
Other Items Not for Current Operating UseUnrealized Gains / (Losses) (See FN6) - (1,942,251) - - - (125,518) - - - (2,067,769) Additions to Permanent Endowments (See FN7) - - - - - 21,149 - - - 21,149 Subtotal - (1,942,251) - - - (104,369) - - - (2,046,620)
Total Sources Over / (Under) Uses (See FN 11) (14,309,186) (5,993,905) 1,071,837 3,724,619 (167,151) 482,499 (50,071,833) (26,562) (22,576) (65,312,258)
Bond Proceeds - - - - - - - 11,304,071 - 11,304,071 Depreciation Expense - - - - - - - - (16,325,971) (16,325,971) Transfer of Capital Asses(s) from System - - - - - - - - - - Other Post-Employment Benefit (OPEB) Expense - - - - - - - - - - Non-Cash Capital Gifts - - - - - - - - - - Capital Outlay 85,420 399,834 107,055 32,616 - - 63,173,349 - - 63,798,274 Change in Net Assets (Total Agrees with AFR***) (14,223,766) (5,594,071) 1,178,892 3,757,235 (167,151) 482,499 13,101,516 11,277,509 (16,348,547) (6,535,884)
*Defined as any capital outlay expenses from Educational & General, Designated, Auxiliary, or Restricted Expendable Funds.**Defined as any capital outlay expense from funds other than Educational & General, Designated, Auxiliary, or Restricted Expendable.***As reported for "Changes in Net Position" shown on Schedule of Revenues, Expenses, and Changes in Net Position (SRECNP) in Annual Financial Report.
Texas Woman's UniversityFor the Year Ended August 31, 2019Source: FY 2019 Annual Financial Report
Detail Worksheet FY 2019
Texas Higher Education Coordinating Board 156 June, 2020

Texas Woman's UniversityFor the Year Ended August 31, 2019Source: FY 2019 Annual Financial Report
FOOTNOTES:
FN1: Scholarship Discounts and Allowances are scholarships, fellowships, and grants applied to tuition. The discount eliminates tuition revenues that are paid for by University resources which are recorded as revenue elsewhere on the financial statements (i.e. federal and state contracts and grants revenues). In addition, Scholarship Discounts and Allowances eliminate tuition revenue that is exempted from payment due to tuition exemptions approved by the Texas Legislature. Waivers, remissions, and exemptions represent tuition and fee dollars forgone by the university - some are required by statute. See the Integrated Financial Reporting System (IFRS) report submitted to THECB for details on waivers, exemptions, tuition, and fees. Allocation methods to individual funds shown may vary between institutions.
FN2: Endowment and Interest Income includes interest income and endowment payouts.
FN3: Other Income is primarily Other Operating and Other Non-operating Revenues from the AFR. Other Expenses is primarily Other Nonoperating Expenses from the AFR.
FN4: Bond Proceeds are funds received from the sale of bonds and commercial paper used to finance capital projects. This amount includes actual proceeds and accrued or anticipated proceeds to be transferred from System. Independent institutions report only to the extent expended in current year.
FN5: Debt service payments are payments to service and retire debt issued to fund capital projects. System components do this via transfers to System Administrations. Independent institutions use direct payment to appropriate paying agents.
FN6: Unrealized Gains / (Losses) represent the increase in the Fair Market Value of Investments and Endowments. Unrealized Gains / (Losses) are accrued as non-cash transactions. Therefore, funds are not actually received for this revenue stream. Accordingly, this revenue is not cash revenue and cannot be used by the University to fund operations.
FN7: Additions to Permanent Endowments are additions to endowment principal. This revenue is restricted for investment purposes only and cannot be used to fund operations. Only interest income from these endowments, which is reported on the Endowment and Investment Income line of this report, can be used by the University to fund operations.
FN8: Distributions from the Available University Fund appropriated through the Appropriation Bill are first used to pay debt service costs on Permanent University Fund Bonds. Funds remaining are distributed to constitutionally designated institutions to promote academic excellence. Only the Excellence funding is shown at the institution level. The AUF funds used to pay debt service on PUF bonds are reported at the System level.
FN9: Auxiliary Enterprises include athletics, housing and food, student services, and parking and transportation. Auxiliary Enterprises are required to be self-supporting, and therefore must operate on the funds they generate.
FN10: Mandatory and non-mandatory transfers includes transfers between funds, transfers between the University System and institutions and transfers to and from other state agencies. In total, all transfers between funds net to zero with the exception of any amounts transferred between the University System, between other institutions, or to and from another state agency. There are no transfers of education and general funds provided by the State of Texas to restricted or auxiliary fund groups. Transfers between education and general funds and designated funds are related to Texas Public Education Grant as provided by the State of Texas.
FN11. N/A
Texas Higher Education Coordinating Board 157 June, 2020

The University of Texas at Austin - All Disciplines (A+H+M)For the Year Ended August 31, 2019Source: FY 2019 Annual Financial ReportThis data is not included in the Academic Institution summary listing, since it mixes the academic institution and the medical school.
Non-Operating Funds are not included in above charts. See following page (Summary).Charts May Not Add to 100% Due to Rounding
Total Operating Sources $3,269,451,047
Total Operating Sources $3,263,422,047
Total Operating Uses $2,694,050,252
State of Texas$821,272,937
25%
Student & Parent$515,579,983
16%Federal Government$502,985,758
15%
Institutional Resources$1,423,583,369
44%
Hospitals, Clinics, Professional Fees
$6,029,0000%
Operating Sources by Category
State Appropriations$355,856,714
11%
State Grants & Contracts
$61,464,2232%
Higher Education Fund$00%
Available University Fund Excellence
$403,952,00012%
Tuition & Fees$515,579,983
16%
Federal Grants & Contracts
$502,985,75815%
Endowment & Interest Income
$277,991,4228%
Local Government Grants
$49,555,4822%
Private Gifts & Grants$414,610,308
13%
Sales & Services$308,277,067
9%
Net Auxiliary Enterprises
$349,624,68611%
Other Income$23,524,404
1%
Hospitals, Clinics, Professional Fees
$6,029,0000%
Operating Sources
Instruction$676,702,612
25%
Research$516,252,929
19%
Public Service$126,117,791
5%
Academic Support$351,620,955
13%
Student Services$52,333,307
2%Institutional Support
$183,972,7337%
Operations & Maintenance of Plant
$223,019,0808%
Scholarships & Fellowships$122,587,499
5%
Auxiliary Enterprises$323,388,375
12%Capital Outlay
$83,723,3913%
Other Expenses$716,193
0%
Hospitals & Clinics$33,615,387
1%
Operating Uses
Texas Higher Education Coordinating Board 158 June, 2020

The University of Texas at Austin - All Disciplines (A+H+M)For the Year Ended August 31, 2019Source: FY 2019 Annual Financial Report
Summary Worksheet FY 2019 Amount Per FTSEInstitution State Funded FTSEs 47,971.06
Operating SourcesState of TexasState Appropriations 355,856,714$ 7,418$ State Grants and Contracts - Restricted 61,464,223 1,281 Higher Education Fund - - Available University Fund Excellence (See FN8) 403,952,000 8,421 Subtotal 821,272,937$ 17,120$
Student & ParentTuition - net 397,405,671$ 8,284$ Fees - net 118,174,312 2,463 Tuition and Fees (net of Scholarship Discounts and Allowances) 515,579,983$ 10,747$
Federal GovernmentFederal Grants and Contracts - Restricted 502,985,758$ 10,485$
Professional FeesAll Sources (Net) 6,029,000$ 126$
Hospitals and ClinicsAll Sources (Net) -$ -$
Institutional ResourcesEndowment and Interest Income (See FN2) 277,991,422$ 5,795$ Local Government Grants - Restricted 49,555,482 1,033 Private Gifts and Grants - Restricted 414,610,308 8,643 Sales and Services 308,277,067 6,426 Net Auxiliary Enterprises (See FN9) 349,624,686 7,288 Other Income (See FN3) 23,524,404 490 Subtotal 1,423,583,369$ 29,675$ Total Operating Sources 3,269,451,047$ 68,153$
Operating UsesInstruction 676,702,612$ 14,106$ Research 516,252,929 10,762 Public Service 126,117,791 2,629 Hospitals and Clinics 33,615,387 701 Academic Support 351,620,955 7,330 Student Services 52,333,307 1,091 Institutional Support 183,972,733 3,835 Operations and Maintenance of Plant 223,019,080 4,649 Scholarships and Fellowships 122,587,499 2,555 Auxiliary Enterprises (See FN9) 323,388,375 6,741 Capital Outlay from Current Fund Sources 83,723,391 1,745 Other Expenses (See FN3) 716,193 15 Total Operating Uses 2,694,050,252$ 56,159$
Other Sources / (Uses) of FundsCapital Outlay from Non-Current Fund Sources (312,486,941) (6,514)$ Mandatory and Non-mandatory Transfers (See FN10) 1,921,940 40 Bond Proceeds Transfers (See FN4) 118,087,031 2,462 Debt Service Payments (See FN5) (150,335,347) (3,134) Subtotal (342,813,317)$ (7,146)$
Other Items Not for Current Operating UseUnrealized Gains / (Losses) (See FN6) 123,032,573 2,565$ Additions to Permanent Endowments (See FN7) 121,040,430 2,523 Subtotal 244,073,003$ 5,088$
Total Sources Over / (Under) Uses (See FN11) 476,660,481$ 9,936$
This data is not included in the Academic Institution summary listing, since it mixes the academic institution and the medical school.
Texas Higher Education Coordinating Board 159 June, 2020
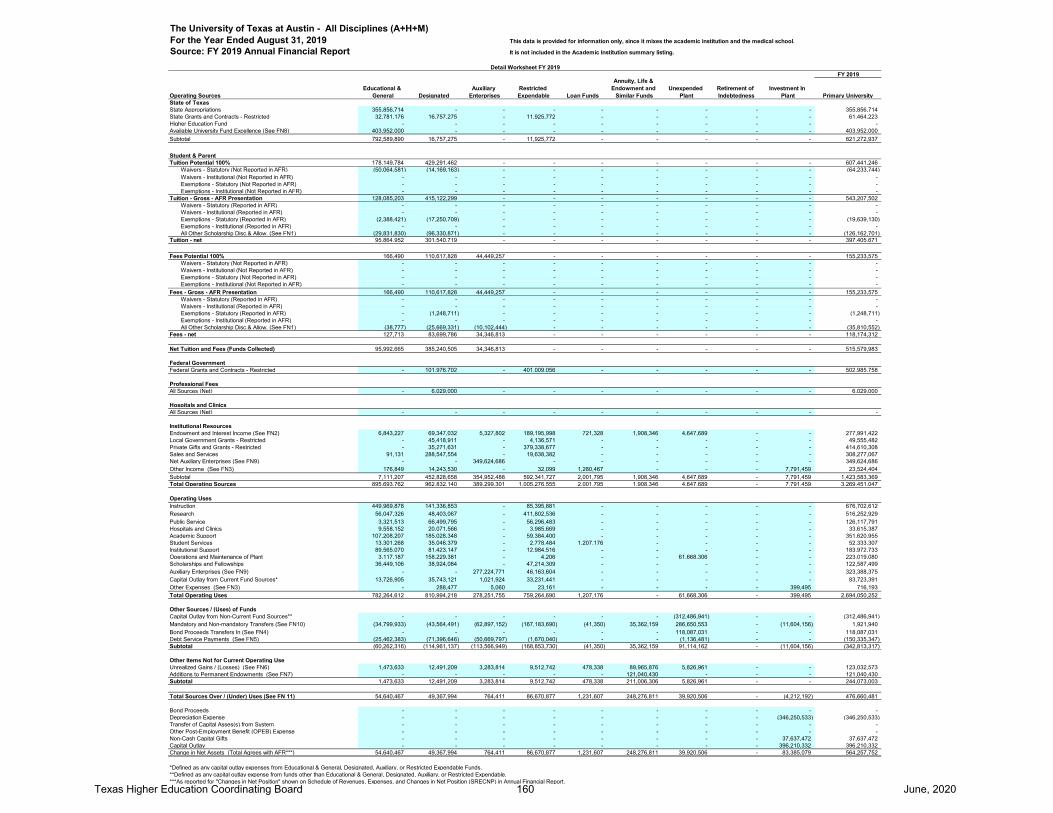
This data is provided for information only, since it mixes the academic institution and the medical school.
It is not included in the Academic Institution summary listing.
FY 2019
Operating SourcesEducational &
General DesignatedAuxiliary
EnterprisesRestricted Expendable Loan Funds
Annuity, Life & Endowment and
Similar FundsUnexpended
PlantRetirement of Indebtedness
Investment In Plant Primary University
State of TexasState Appropriations 355,856,714 - - - - - - - - 355,856,714 State Grants and Contracts - Restricted 32,781,176 16,757,275 - 11,925,772 - - - - - 61,464,223 Higher Education Fund - - - - - - - - - - Available University Fund Excellence (See FN8) 403,952,000 - - - - - - - - 403,952,000 Subtotal 792,589,890 16,757,275 - 11,925,772 - - - - - 821,272,937
Student & ParentTuition Potential 100% 178,149,784 429,291,462 - - - - - - - 607,441,246 Waivers - Statutory (Not Reported in AFR) (50,064,581) (14,169,163) - - - - - - - (64,233,744) Waivers - Institutional (Not Reported in AFR) - - - - - - - - - - Exemptions - Statutory (Not Reported in AFR) - - - - - - - - - - Exemptions - Institutional (Not Reported in AFR) - - - - - - - - - - Tuition - Gross - AFR Presentation 128,085,203 415,122,299 - - - - - - - 543,207,502 Waivers - Statutory (Reported in AFR) - - - - - - - - - - Waivers - Institutional (Reported in AFR) - - - - - - - - - - Exemptions - Statutory (Reported in AFR) (2,388,421) (17,250,709) - - - - - - - (19,639,130) Exemptions - Institutional (Reported in AFR) - - - - - - - - - - All Other Scholarship Disc.& Allow. (See FN1) (29,831,830) (96,330,871) - - - - - - - (126,162,701) Tuition - net 95,864,952 301,540,719 - - - - - - - 397,405,671
Fees Potential 100% 166,490 110,617,828 44,449,257 - - - - - - 155,233,575 Waivers - Statutory (Not Reported in AFR) - - - - - - - - - - Waivers - Institutional (Not Reported in AFR) - - - - - - - - - - Exemptions - Statutory (Not Reported in AFR) - - - - - - - - - - Exemptions - Institutional (Not Reported in AFR) - - - - - - - - - - Fees - Gross - AFR Presentation 166,490 110,617,828 44,449,257 - - - - - - 155,233,575 Waivers - Statutory (Reported in AFR) - - - - - - - - - - Waivers - Institutional (Reported in AFR) - - - - - - - - - - Exemptions - Statutory (Reported in AFR) - (1,248,711) - - - - - - - (1,248,711) Exemptions - Institutional (Reported in AFR) - - - - - - - - - - All Other Scholarship Disc.& Allow. (See FN1) (38,777) (25,669,331) (10,102,444) - - - - - - (35,810,552) Fees - net 127,713 83,699,786 34,346,813 - - - - - - 118,174,312
Net Tuition and Fees (Funds Collected) 95,992,665 385,240,505 34,346,813 - - - - - - 515,579,983
Federal GovernmentFederal Grants and Contracts - Restricted - 101,976,702 - 401,009,056 - - - - - 502,985,758
Professional FeesAll Sources (Net) - 6,029,000 - - - - - - - 6,029,000
Hospitals and ClinicsAll Sources (Net) - - - - - - - - - -
Institutional ResourcesEndowment and Interest Income (See FN2) 6,843,227 69,347,032 5,327,802 189,195,998 721,328 1,908,346 4,647,689 - - 277,991,422 Local Government Grants - Restricted - 45,418,911 - 4,136,571 - - - - - 49,555,482 Private Gifts and Grants - Restricted - 35,271,631 - 379,338,677 - - - - - 414,610,308 Sales and Services 91,131 288,547,554 - 19,638,382 - - - - - 308,277,067 Net Auxiliary Enterprises (See FN9) - - 349,624,686 - - - - - - 349,624,686 Other Income (See FN3) 176,849 14,243,530 - 32,099 1,280,467 - - - 7,791,459 23,524,404 Subtotal 7,111,207 452,828,658 354,952,488 592,341,727 2,001,795 1,908,346 4,647,689 - 7,791,459 1,423,583,369 Total Operating Sources 895,693,762 962,832,140 389,299,301 1,005,276,555 2,001,795 1,908,346 4,647,689 - 7,791,459 3,269,451,047
Operating UsesInstruction 449,969,878 141,336,853 - 85,395,881 - - - - - 676,702,612 Research 56,047,326 48,403,067 - 411,802,536 - - - - - 516,252,929 Public Service 3,321,513 66,499,795 - 56,296,483 - - - - - 126,117,791 Hospitals and Clinics 9,558,152 20,071,566 - 3,985,669 - - - - - 33,615,387 Academic Support 107,208,207 185,028,348 - 59,384,400 - - - - - 351,620,955 Student Services 13,301,268 35,046,379 - 2,778,484 1,207,176 - - - - 52,333,307 Institutional Support 89,565,070 81,423,147 - 12,984,516 - - - - - 183,972,733 Operations and Maintenance of Plant 3,117,187 158,229,381 - 4,206 - - 61,668,306 - - 223,019,080 Scholarships and Fellowships 36,449,106 38,924,084 - 47,214,309 - - - - - 122,587,499 Auxiliary Enterprises (See FN9) - - 277,224,771 46,163,604 - - - - - 323,388,375 Capital Outlay from Current Fund Sources* 13,726,905 35,743,121 1,021,924 33,231,441 - - - - - 83,723,391 Other Expenses (See FN3) - 288,477 5,060 23,161 - - - - 399,495 716,193 Total Operating Uses 782,264,612 810,994,218 278,251,755 759,264,690 1,207,176 - 61,668,306 - 399,495 2,694,050,252
Other Sources / (Uses) of FundsCapital Outlay from Non-Current Fund Sources** - - - - - - (312,486,941) - - (312,486,941) Mandatory and Non-mandatory Transfers (See FN10) (34,799,933) (43,564,491) (62,897,152) (167,183,690) (41,350) 35,362,159 286,650,553 - (11,604,156) 1,921,940 Bond Proceeds Transfers In (See FN4) - - - - - - 118,087,031 - - 118,087,031 Debt Service Payments (See FN5) (25,462,383) (71,396,646) (50,669,797) (1,670,040) - - (1,136,481) - - (150,335,347) Subtotal (60,262,316) (114,961,137) (113,566,949) (168,853,730) (41,350) 35,362,159 91,114,162 - (11,604,156) (342,813,317)
Other Items Not for Current Operating UseUnrealized Gains / (Losses) (See FN6) 1,473,633 12,491,209 3,283,814 9,512,742 478,338 89,965,876 5,826,961 - - 123,032,573 Additions to Permanent Endowments (See FN7) - - - - - 121,040,430 - - - 121,040,430 Subtotal 1,473,633 12,491,209 3,283,814 9,512,742 478,338 211,006,306 5,826,961 - - 244,073,003
Total Sources Over / (Under) Uses (See FN 11) 54,640,467 49,367,994 764,411 86,670,877 1,231,607 248,276,811 39,920,506 - (4,212,192) 476,660,481
Bond Proceeds - - - - - - - - - - Depreciation Expense - - - - - - - - (346,250,533) (346,250,533) Transfer of Capital Asses(s) from System - - - - - - - - - - Other Post-Employment Benefit (OPEB) Expense - - - - - - - - - - Non-Cash Capital Gifts - - - - - - - - 37,637,472 37,637,472 Capital Outlay - - - - - - - - 396,210,332 396,210,332 Change in Net Assets (Total Agrees with AFR***) 54,640,467 49,367,994 764,411 86,670,877 1,231,607 248,276,811 39,920,506 - 83,385,079 564,257,752
*Defined as any capital outlay expenses from Educational & General, Designated, Auxiliary, or Restricted Expendable Funds.**Defined as any capital outlay expense from funds other than Educational & General, Designated, Auxiliary, or Restricted Expendable.***As reported for "Changes in Net Position" shown on Schedule of Revenues, Expenses, and Changes in Net Position (SRECNP) in Annual Financial Report.
The University of Texas at Austin - All Disciplines (A+H+M)For the Year Ended August 31, 2019Source: FY 2019 Annual Financial Report
Detail Worksheet FY 2019
Texas Higher Education Coordinating Board 160 June, 2020
The University of Texas at Austin - All Disciplines (A+H+M)For the Year Ended August 31, 2019Source: FY 2019 Annual Financial Report
FOOTNOTES:
FN1: Scholarship Discounts and Allowances are scholarships, fellowships, and grants applied to tuition. The discount eliminates tuition revenues that are paid for by University resources which are recorded as revenue elsewhere on the financial statements (i.e. federal and state contracts and grants revenues). In addition, Scholarship Discounts and Allowances eliminate tuition revenue that is exempted from payment due to tuition exemptions approved by the Texas Legislature. Waivers, remissions, and exemptions represent tuition and fee dollars forgone by the university - some are required by statute. See the Integrated Financial Reporting System (IFRS) report submitted to THECB for details on waivers, exemptions, tuition, and fees. Allocation methods to individual funds shown may vary between institutions.
FN2: Endowment and Interest Income includes interest income and endowment payouts.
FN3: Other Income is primarily Other Operating and Other Non-operating Revenues from the AFR. Other Expenses is primarily Other Nonoperating Expenses from the AFR.
FN4: Bond Proceeds are funds received from the sale of bonds and commercial paper used to finance capital projects. This amount includes actual proceeds and accrued or anticipated proceeds to be transferred from System. Independent institutions report only to the extent expended in current year.
FN5: Debt service payments are payments to service and retire debt issued to fund capital projects. System components do this via transfers to System Administrations. Independent institutions use direct payment to appropriate paying agents.
FN6: Unrealized Gains / (Losses) represent the increase in the Fair Market Value of Investments and Endowments. Unrealized Gains / (Losses) are accrued as non-cash transactions. Therefore, funds are not actually received for this revenue stream. Accordingly, this revenue is not cash revenue and cannot be used by the University to fund operations.
FN7: Additions to Permanent Endowments are additions to endowment principal. This revenue is restricted for investment purposes only and cannot be used to fund operations. Only interest income from these endowments, which is reported on the Endowment and Investment Income line of this report, can be used by the University to fund operations.
FN8: Distributions from the Available University Fund appropriated through the Appropriation Bill are first used to pay debt service costs on Permanent University Fund Bonds. Funds remaining are distributed to constitutionally designated institutions to promote academic excellence. Only the Excellence funding is shown at the institution level. The AUF funds used to pay debt service on PUF bonds are reported at the System level.
FN9: Auxiliary Enterprises include athletics, housing and food, student services, and parking and transportation. Auxiliary Enterprises are required to be self-supporting, and therefore must operate on the funds they generate.
FN10: Mandatory and non-mandatory transfers includes transfers between funds, transfers between the University System and institutions and transfers to and from other state agencies. In total, all transfers between funds net to zero with the exception of any amounts transferred between the University System, between other institutions, or to and from another state agency. There are no transfers of education and general funds provided by the State of Texas to restricted or auxiliary fund groups. Transfers between education and general funds and designated funds are related to Texas Public Education Grant as provided by the State of Texas.
FN11: Of the net increase of $476,660,481 approximately $232.6 million represents revenues received but not yet expended. This income is fully committed to program expenditures and capital disbursements. The remaining $244.1 million represents non-expendable funds from unrealized gains and additions to permanent endowments of approximately $123.0 million and $121.0 million respectively. Unrealized gains and additions to permanent endowments do not contribute to the availability of the institution's operating cash as discussed in FN6 and FN7.
Texas Higher Education Coordinating Board 161 June, 2020

The University of Texas RGV - All Disciplines (A+H+M)For the Year Ended August 31, 2019Source: FY 2019 Annual Financial ReportThis data is not included in the Academic Institution summary listing, since it mixes the academic institution and the medical school.
Non-Operating Funds are not included in above charts. See following page (Summary).Charts May Not Add to 100% Due to Rounding
Total Operating Uses $494,239,906
Total Operating Sources $507,725,403
Total Operating Sources $502,508,664
State of Texas$184,116,743
36%
Student & Parent$105,217,214
21%
Federal Government$133,045,224
26%
Institutional Resources$80,129,483
16%
Hospitals, Clinics, Professional Fees
$5,216,7391%
Operating Sources by Category
State Appropriations$141,962,682
28%
State Grants & Contracts
$42,154,0618%
Higher Education Fund$00%
Tuition & Fees$105,217,214
21%
Federal Grants & Contracts
$133,045,22426%
Endowment & Interest Income
$9,695,5682%
Local Government Grants
$26,469,7545%
Private Gifts & Grants$13,398,832
3%
Sales & Services$7,736,328
1%
Net Auxiliary Enterprises$9,425,690
2%
Other Income$13,403,311
3%Hospitals, Clinics, Professional Fees
$5,216,7391%
Operating Sources
Instruction$153,791,028
31%
Research$44,386,004
9%
Public Service$19,015,672
4%
Academic Support$53,187,982
11%
Student Services$30,497,238
6%Institutional Support
$37,830,8008%
Operations & Maintenance of Plant
$36,575,8197%
Scholarships & Fellowships$53,491,586
11%
Auxiliary Enterprises$28,221,316
6%
Capital Outlay$7,842,232
1%
Other Expenses$80,000
0%
Hospitals & Clinics$29,320,229
6%
Operating Uses
Texas Higher Education Coordinating Board 162 June, 2020

The University of Texas RGV - All Disciplines (A+H+M)For the Year Ended August 31, 2019Source: FY 2019 Annual Financial Report
Summary Worksheet FY 2019 Amount Per FTSEInstitution State Funded FTSEs 25,073.01
Operating SourcesState of TexasState Appropriations 141,962,682$ 5,662$ State Grants and Contracts - Restricted 42,154,061 1,681 Higher Education Fund - - Available University Fund Excellence (See FN8) - - Subtotal 184,116,743$ 7,343$
Student & ParentTuition - net 70,598,763$ 2,816$ Fees - net 34,618,451 1,381 Tuition and Fees (net of Scholarship Discounts and Allowances) 105,217,214$ 4,197$
Federal GovernmentFederal Grants and Contracts - Restricted 133,045,224$ 5,306$
Professional FeesAll Sources (Net) 5,216,739$ 208$
Hospitals and ClinicsAll Sources (Net) -$ -$
Institutional ResourcesEndowment and Interest Income (See FN2) 9,695,568$ 387$ Local Government Grants - Restricted 26,469,754 1,056 Private Gifts and Grants - Restricted 13,398,832 534 Sales and Services 7,736,328 309 Net Auxiliary Enterprises (See FN9) 9,425,690 376 Other Income (See FN3) 13,403,311 535 Subtotal 80,129,483$ 3,197$ Total Operating Sources 507,725,403$ 20,251$
Operating UsesInstruction 153,791,028$ 6,134$ Research 44,386,004 1,770 Public Service 19,015,672 758 Hospitals and Clinics 29,320,229 1,169 Academic Support 53,187,982 2,121 Student Services 30,497,238 1,216 Institutional Support 37,830,800 1,509 Operations and Maintenance of Plant 36,575,819 1,459 Scholarships and Fellowships 53,491,586 2,133 Auxiliary Enterprises (See FN9) 28,221,316 1,126 Capital Outlay from Current Fund Sources 7,842,232 313 Other Expenses (See FN3) 80,000 3 Total Operating Uses 494,239,906$ 19,711$
Other Sources / (Uses) of FundsCapital Outlay from Non-Current Fund Sources (48,699,625) (1,942)$ Mandatory and Non-mandatory Transfers (See FN10) 1,433,074 57 Bond Proceeds Transfers (See FN4) 51,607,032 2,058 Debt Service Payments (See FN5) (25,529,026) (1,018) Subtotal (21,188,545)$ (845)$
Other Items Not for Current Operating UseUnrealized Gains / (Losses) (See FN6) 2,076,315 83$ Additions to Permanent Endowments (See FN7) 2,375,149 95 Subtotal 4,451,464$ 178$
Total Sources Over / (Under) Uses (See FN11) (3,251,584)$ (127)$
This data is not included in the Academic Institution summary listing, since it mixes the academic institution and the medical school.
Texas Higher Education Coordinating Board 163 June, 2020

This data is provided for information only, since it mixes the academic institution and the medical school.
It is not included in the Academic Institution summary listing.
FY 2019
Operating SourcesEducational &
General DesignatedAuxiliary
EnterprisesRestricted Expendable Loan Funds
Annuity, Life & Endowment and
Similar FundsUnexpended
PlantRetirement of Indebtedness
Investment In Plant Primary University
State of TexasState Appropriations 141,962,682 - - - - - - - - 141,962,682 State Grants and Contracts - Restricted 40,793,060 1,352,274 - 8,727 - - - - - 42,154,061 Higher Education Fund - - - - - - - - - - Available University Fund Excellence (See FN8) - - - - - - - - - - Subtotal 182,755,742 1,352,274 - 8,727 - - - - - 184,116,743
Student & ParentTuition Potential 100% 50,588,369 132,279,725 - - - - - - - 182,868,094 Waivers - Statutory (Not Reported in AFR) (8,873,811) - - - - - - - - (8,873,811) Waivers - Institutional (Not Reported in AFR) - (7,116) - - - - - - - (7,116) Exemptions - Statutory (Not Reported in AFR) - - - - - - - - - - Exemptions - Institutional (Not Reported in AFR) - - - - - - - - - - Tuition - Gross - AFR Presentation 41,714,558 132,272,609 - - - - - - - 173,987,167 Waivers - Statutory (Reported in AFR) - - - - - - - - - - Waivers - Institutional (Reported in AFR) - - - - - - - - - - Exemptions - Statutory (Reported in AFR) (2,458,520) (4,604,452) - - - - - - - (7,062,972) Exemptions - Institutional (Reported in AFR) - - - - - - - - - - All Other Scholarship Disc.& Allow. (See FN1) (20,972,939) (75,352,493) - - - - - - - (96,325,432) Tuition - net 18,283,099 52,315,664 - - - - - - - 70,598,763
Fees Potential 100% 1,561,032 22,026,551 22,934,513 - - - - - - 46,522,096 Waivers - Statutory (Not Reported in AFR) - - - - - - - - - - Waivers - Institutional (Not Reported in AFR) - - - - - - - - - - Exemptions - Statutory (Not Reported in AFR) - - - - - - - - - - Exemptions - Institutional (Not Reported in AFR) - - - - - - - - - - Fees - Gross - AFR Presentation 1,561,032 22,026,551 22,934,513 - - - - - - 46,522,096 Waivers - Statutory (Reported in AFR) - - - - - - - - - - Waivers - Institutional (Reported in AFR) - - - - - - - - - - Exemptions - Statutory (Reported in AFR) - - (618,088) - - - - - - (618,088) Exemptions - Institutional (Reported in AFR) - - - - - - - - - - All Other Scholarship Disc.& Allow. (See FN1) - - (11,285,557) - - - - - - (11,285,557) Fees - net 1,561,032 22,026,551 11,030,868 - - - - - - 34,618,451
Net Tuition and Fees (Funds Collected) 19,844,131 74,342,215 11,030,868 - - - - - - 105,217,214
Federal GovernmentFederal Grants and Contracts - Restricted - 5,014,973 - 128,030,251 - - - - - 133,045,224
Professional FeesAll Sources (Net) - 5,216,739 - - - - - - - 5,216,739
Hospitals and ClinicsAll Sources (Net) - - - - - - - - - -
Institutional ResourcesEndowment and Interest Income (See FN2) 1,734,357 5,263,532 455,563 2,019,416 23,513 24,414 174,773 - - 9,695,568 Local Government Grants - Restricted - 26,242,238 - 227,516 - - - - - 26,469,754 Private Gifts and Grants - Restricted - 2,484,284 - 10,914,548 - - - - - 13,398,832 Sales and Services - 5,840,616 - 1,895,712 - - - - - 7,736,328 Net Auxiliary Enterprises (See FN9) - - 9,425,690 - - - - - - 9,425,690 Other Income (See FN3) 311,328 12,143,287 - 355,973 610,173 - - - (17,450) 13,403,311 Subtotal 2,045,685 51,973,957 9,881,253 15,413,165 633,686 24,414 174,773 - (17,450) 80,129,483 Total Operating Sources 204,645,558 137,900,158 20,912,121 143,452,143 633,686 24,414 174,773 - (17,450) 507,725,403
Operating UsesInstruction 128,074,233 19,659,491 - 6,057,304 - - - - - 153,791,028 Research 4,977,110 23,226,891 - 16,182,003 - - - - - 44,386,004 Public Service 3,114,279 1,217,723 - 14,683,670 - - - - - 19,015,672 Hospitals and Clinics 1,063,266 28,256,963 - - - - - - - 29,320,229 Academic Support 30,417,156 18,376,992 - 4,393,834 - - - - - 53,187,982 Student Services 12,570,858 9,797,272 - 7,785,278 343,830 - - - - 30,497,238 Institutional Support 22,143,273 14,963,948 - 723,579 - - - - - 37,830,800 Operations and Maintenance of Plant 21,992,907 9,005,702 - 140,542 - - 5,436,668 - - 36,575,819 Scholarships and Fellowships 8,737,800 12,180,082 - 32,573,704 - - - - - 53,491,586 Auxiliary Enterprises (See FN9) - 1,799,118 26,152,288 269,910 - - - - - 28,221,316 Capital Outlay from Current Fund Sources* 1,392,051 5,496,870 131,276 822,035 - - - - - 7,842,232 Other Expenses (See FN3) - 80,000 - - - - - - - 80,000 Total Operating Uses 234,482,933 144,061,052 26,283,564 83,631,859 343,830 - 5,436,668 - - 494,239,906
Other Sources / (Uses) of FundsCapital Outlay from Non-Current Fund Sources** - - - - - - (48,699,625) - - (48,699,625) Mandatory and Non-mandatory Transfers (See FN10) 49,861,794 (896,292) 11,268,746 (64,552,189) (2,175,361) 82,613 7,843,763 - - 1,433,074 Bond Proceeds Transfers In (See FN4) - - - - - - 51,607,032 - - 51,607,032 Debt Service Payments (See FN5) (18,020,250) (3,378,060) (4,130,716) - - - - - - (25,529,026) Subtotal 31,841,544 (4,274,352) 7,138,030 (64,552,189) (2,175,361) 82,613 10,751,170 - - (21,188,545)
Other Items Not for Current Operating UseUnrealized Gains / (Losses) (See FN6) - 2,017,364 338,060 49,236 17,448 (475,487) 129,694 - - 2,076,315 Additions to Permanent Endowments (See FN7) - - - - - 2,375,149 - - - 2,375,149 Subtotal - 2,017,364 338,060 49,236 17,448 1,899,662 129,694 - - 4,451,464
Total Sources Over / (Under) Uses (See FN 11) 2,004,169 (8,417,882) 2,104,647 (4,682,669) (1,868,057) 2,006,689 5,618,969 - (17,450) (3,251,584)
Bond Proceeds - - - - - - - - - - Depreciation Expense - - - - - - - - (48,650,302) (48,650,302) Transfer of Capital Asses(s) from System - - - - - - - - - - Other Post-Employment Benefit (OPEB) Expense - - - - - - - - - - Non-Cash Capital Gifts - - - - - - - - 1,263,922 1,263,922 Capital Outlay - - - - - - - - 56,541,857 56,541,857 Change in Net Assets (Total Agrees with AFR***) 2,004,169 (8,417,882) 2,104,647 (4,682,669) (1,868,057) 2,006,689 5,618,969 - 9,138,027 5,903,893
*Defined as any capital outlay expenses from Educational & General, Designated, Auxiliary, or Restricted Expendable Funds.**Defined as any capital outlay expense from funds other than Educational & General, Designated, Auxiliary, or Restricted Expendable.***As reported for "Changes in Net Position" shown on Schedule of Revenues, Expenses, and Changes in Net Position (SRECNP) in Annual Financial Report.
The University of Texas RGV - All Disciplines (A+H+M)For the Year Ended August 31, 2019Source: FY 2019 Annual Financial Report
Detail Worksheet FY 2019
Texas Higher Education Coordinating Board 164 June, 2020

The University of Texas RGV - All Disciplines (A+H+M)For the Year Ended August 31, 2019Source: FY 2019 Annual Financial Report
FOOTNOTES:
FN1: Scholarship Discounts and Allowances are scholarships, fellowships, and grants applied to tuition. The discount eliminates tuition revenues that are paid for by University resources which are recorded as revenue elsewhere on the financial statements (i.e. federal and state contracts and grants revenues). In addition, Scholarship Discounts and Allowances eliminate tuition revenue that is exempted from payment due to tuition exemptions approved by the Texas Legislature. Waivers, remissions, and exemptions represent tuition and fee dollars forgone by the university - some are required by statute. See the Integrated Financial Reporting System (IFRS) report submitted to THECB for details on waivers, exemptions, tuition, and fees. Allocation methods to individual funds shown may vary between institutions.
FN2: Endowment and Interest Income includes interest income and endowment payouts.
FN3: Other Income is primarily Other Operating and Other Non-operating Revenues from the AFR. Other Expenses is primarily Other Nonoperating Expenses from the AFR.
FN4: Bond Proceeds are funds received from the sale of bonds and commercial paper used to finance capital projects. This amount includes actual proceeds and accrued or anticipated proceeds to be transferred from System. Independent institutions report only to the extent expended in current year.
FN5: Debt service payments are payments to service and retire debt issued to fund capital projects. System components do this via transfers to System Administrations. Independent institutions use direct payment to appropriate paying agents.
FN6: Unrealized Gains / (Losses) represent the increase in the Fair Market Value of Investments and Endowments. Unrealized Gains / (Losses) are accrued as non-cash transactions. Therefore, funds are not actually received for this revenue stream. Accordingly, this revenue is not cash revenue and cannot be used by the University to fund operations.
FN7: Additions to Permanent Endowments are additions to endowment principal. This revenue is restricted for investment purposes only and cannot be used to fund operations. Only interest income from these endowments, which is reported on the Endowment and Investment Income line of this report, can be used by the University to fund operations.
FN8: Distributions from the Available University Fund appropriated through the Appropriation Bill are first used to pay debt service costs on Permanent University Fund Bonds. Funds remaining are distributed to constitutionally designated institutions to promote academic excellence. Only the Excellence funding is shown at the institution level. The AUF funds used to pay debt service on PUF bonds are reported at the System level.
FN9: Auxiliary Enterprises include athletics, housing and food, student services, and parking and transportation. Auxiliary Enterprises are required to be self-supporting, and therefore must operate on the funds they generate.
FN10: Mandatory and non-mandatory transfers includes transfers between funds, transfers between the University System and institutions and transfers to and from other state agencies. In total, all transfers between funds net to zero with the exception of any amounts transferred between the University System, between other institutions, or to and from another state agency. There are no transfers of education and general funds provided by the State of Texas to restricted or auxiliary fund groups. Transfers between education and general funds and designated funds are related to Texas Public Education Grant as provided by the State of Texas.
FN11. N/A
Texas Higher Education Coordinating Board 165 June, 2020

University of Houston - All Disciplines (A+H+M)For the Year Ended August 31, 2019Source: FY 2019 Annual Financial ReportThis data is not included in the Academic Institution summary listing, since it mixes the academic institution and the medical school.
Non-Operating Funds are not included in above charts. See following page (Summary).Charts May Not Add to 100% Due to Rounding
Total Operating Uses $1,144,687,547
Total Operating Sources $1,294,043,573
Total Operating Sources $1,294,043,573
State of Texas$303,832,633
23%
Student & Parent$397,368,725
31%
Federal Government$146,321,086
11%
Institutional Resources$446,521,129
35%
Hospitals, Clinics, Professional Fees
$00%
Operating Sources by Category
State Appropriations$204,320,720
16%
State Grants & Contracts
$46,741,8594%
Higher Education Fund$52,770,054
4%
Tuition & Fees$397,368,725
31%Federal Grants & Contracts
$146,321,08611%
Endowment & Interest Income
$30,858,7382%
Local Government Grants
$9,112,4281%
Private Gifts & Grants$147,807,147
11%
Sales & Services$91,781,792
7%
Net Auxiliary Enterprises$96,860,055
8%
Other Income$70,100,969
5%
Hospitals, Clinics, Professional Fees
$00%
Operating Sources
Instruction$256,473,297
22%
Research$168,247,607
15%
Public Service$41,959,600
4%
Academic Support$178,776,888
15%
Student Services$32,815,821
3%
Institutional Support$76,739,591
7%Operations &
Maintenance of Plant$48,771,251
4%Scholarships &
Fellowships$64,495,750
6%
Auxiliary Enterprises$125,142,925
11%
Capital Outlay$22,271,899
2%Other Expenses$128,992,918
11%
Hospitals & Clinics$00%
Operating Uses
Texas Higher Education Coordinating Board 166 June, 2020

University of Houston - All Disciplines (A+H+M)For the Year Ended August 31, 2019Source: FY 2019 Annual Financial Report
Summary Worksheet FY 2019 Amount Per FTSEInstitution State Funded FTSEs 39,553.88
Operating SourcesState of TexasState Appropriations 204,320,720$ 5,166$ State Grants and Contracts - Restricted 46,741,859 1,182 Higher Education Fund 52,770,054 1,334 Available University Fund Excellence (See FN8) - - Subtotal 303,832,633$ 7,682$
Student & ParentTuition - net 279,079,570$ 7,056$ Fees - net 118,289,155 2,991 Tuition and Fees (net of Scholarship Discounts and Allowances) 397,368,725$ 10,047$
Federal GovernmentFederal Grants and Contracts - Restricted 146,321,086$ 3,699$
Professional FeesAll Sources (Net) -$ -$
Hospitals and ClinicsAll Sources (Net) -$ -$
Institutional ResourcesEndowment and Interest Income (See FN2) 30,858,738$ 780$ Local Government Grants - Restricted 9,112,428 230 Private Gifts and Grants - Restricted 147,807,147 3,737 Sales and Services 91,781,792 2,320 Net Auxiliary Enterprises (See FN9) 96,860,055 2,449 Other Income (See FN3) 70,100,969 1,772 Subtotal 446,521,129$ 11,288$ Total Operating Sources 1,294,043,573$ 32,716$
Operating UsesInstruction 256,473,297$ 6,484$ Research 168,247,607 4,254 Public Service 41,959,600 1,061 Hospitals and Clinics - - Academic Support 178,776,888 4,520 Student Services 32,815,821 830 Institutional Support 76,739,591 1,940 Operations and Maintenance of Plant 48,771,251 1,233 Scholarships and Fellowships 64,495,750 1,631 Auxiliary Enterprises (See FN9) 125,142,925 3,164 Capital Outlay from Current Fund Sources 22,271,899 563 Other Expenses (See FN3) 128,992,918 3,261 Total Operating Uses 1,144,687,547$ 28,941$
Other Sources / (Uses) of FundsCapital Outlay from Non-Current Fund Sources (174,128,357) (4,402)$ Mandatory and Non-mandatory Transfers (See FN10) 147,575,407 3,731 Bond Proceeds Transfers (See FN4) - - Debt Service Payments (See FN5) (86,294,491) (2,182) Subtotal (112,847,441)$ (2,853)$
Other Items Not for Current Operating UseUnrealized Gains / (Losses) (See FN6) 4,307,372 109$ Additions to Permanent Endowments (See FN7) 9,920,474 251 Subtotal 14,227,846$ 360$
Total Sources Over / (Under) Uses (See FN11) 50,736,431$ 1,282$
This data is not included in the Academic Institution summary listing, since it mixes the academic institution and the medical school.
Texas Higher Education Coordinating Board 167 June, 2020

This data is provided for information only, since it mixes the academic institution and the medical school.
It is not included in the Academic Institution summary listing.
FY 2019
Operating SourcesEducational &
General DesignatedAuxiliary
EnterprisesRestricted Expendable Loan Funds
Annuity, Life & Endowment and
Similar FundsUnexpended
PlantRetirement of Indebtedness Investment In Plant Primary University
State of TexasState Appropriations 204,320,720 - - - - - - - - 204,320,720 State Grants and Contracts - Restricted 265,522 - - 46,476,337 - - - - - 46,741,859 Higher Education Fund 52,770,054 - - - - - - - - 52,770,054 Available University Fund Excellence (See FN8) - - - - - - - - - - Subtotal 257,356,296 - - 46,476,337 - - - - - 303,832,633
Student & ParentTuition Potential 100% 113,507,045 289,732,530 - - - - - - - 403,239,575 Waivers - Statutory (Not Reported in AFR) (26,900,379) (6,517,232) - - - - - - - (33,417,611) Waivers - Institutional (Not Reported in AFR) - - - - - - - - - - Exemptions - Statutory (Not Reported in AFR) - - - - - - - - - - Exemptions - Institutional (Not Reported in AFR) - - - - - - - - - - Tuition - Gross - AFR Presentation 86,606,666 283,215,298 - - - - - - - 369,821,964 Waivers - Statutory (Reported in AFR) - - - - - - - - - - Waivers - Institutional (Reported in AFR) - - - - - - - - - - Exemptions - Statutory (Reported in AFR) (2,549,967) (7,529,596) - - - - - - - (10,079,563) Exemptions - Institutional (Reported in AFR) - - - - - - - - - - All Other Scholarship Disc.& Allow. (See FN1) (18,683,229) (61,979,602) - - - - - - - (80,662,831) Tuition - net 65,373,470 213,706,100 - - - - - - - 279,079,570
Fees Potential 100% 470,554 107,436,449 48,644,546 - - - - - - 156,551,549 Waivers - Statutory (Not Reported in AFR) (4) (19,314) (10,030) - - - - - - (29,348) Waivers - Institutional (Not Reported in AFR) - - - - - - - - - - Exemptions - Statutory (Not Reported in AFR) - - - - - - - - - - Exemptions - Institutional (Not Reported in AFR) - - - - - - - - - - Fees - Gross - AFR Presentation 470,550 107,417,135 48,634,516 - - - - - - 156,522,201 Waivers - Statutory (Reported in AFR) - - - - - - - - - - Waivers - Institutional (Reported in AFR) - - - - - - - - - - Exemptions - Statutory (Reported in AFR) (2,779) (2,704,277) (711,477) - - - - - - (3,418,533) Exemptions - Institutional (Reported in AFR) - - - - - - - - - - All Other Scholarship Disc.& Allow. (See FN1) (101,436) (23,507,146) (11,205,931) - - - - - - (34,814,513) Fees - net 366,335 81,205,712 36,717,108 - - - - - - 118,289,155
Net Tuition and Fees (Funds Collected) 65,739,805 294,911,812 36,717,108 - - - - - - 397,368,725
Federal GovernmentFederal Grants and Contracts - Restricted - 21,480 - 146,299,606 - - - - - 146,321,086
Professional FeesAll Sources (Net) - - - - - - - - - -
Hospitals and ClinicsAll Sources (Net) - - - - - - - - - -
Institutional ResourcesEndowment and Interest Income (See FN2) 2,803,929 7,580,621 - 198,871 77,207 20,006,701 56,108 135,301 - 30,858,738 Local Government Grants - Restricted - 8,256,328 - 856,100 - - - - - 9,112,428 Private Gifts and Grants - Restricted - 727,526 358,086 146,610,897 - 110,638 - - - 147,807,147 Sales and Services 12,814 91,594,259 - 174,719 - - - - - 91,781,792 Net Auxiliary Enterprises (See FN9) - - 96,860,055 - - - - - - 96,860,055 Other Income (See FN3) 26,900,089 1,262,961 6,865,745 35,072,174 - - - - - 70,100,969 Subtotal 29,716,832 109,421,695 104,083,886 182,912,761 77,207 20,117,339 56,108 135,301 - 446,521,129 Total Operating Sources 352,812,933 404,354,987 140,800,994 375,688,704 77,207 20,117,339 56,108 135,301 - 1,294,043,573
Operating UsesInstruction 157,417,093 92,118,609 - 6,937,595 - - - - - 256,473,297 Research 20,829,666 46,468,357 - 100,949,584 - - - - - 168,247,607 Public Service 3,242,822 15,524,172 - 23,192,606 - - - - - 41,959,600 Hospitals and Clinics - - - - - - - - - - Academic Support 43,802,646 120,302,010 - 14,672,232 - - - - - 178,776,888 Student Services 6,337,108 24,289,061 - 2,189,652 - - - - - 32,815,821 Institutional Support 9,808,346 66,325,844 - 605,401 - - - - - 76,739,591 Operations and Maintenance of Plant 32,498,967 15,227,066 - 1,045,218 - - - - - 48,771,251 Scholarships and Fellowships 1,143,163 23,657,320 - 39,695,267 - - - - - 64,495,750 Auxiliary Enterprises (See FN9) - - 124,959,508 183,417 - - - - - 125,142,925 Capital Outlay from Current Fund Sources* 8,487,701 6,649,408 252,171 6,882,619 - - - - - 22,271,899 Other Expenses (See FN3) - 3,182,918 1,650,892 16,283 307,671 17,316,393 106,518,761 - - 128,992,918 Total Operating Uses 283,567,512 413,744,765 126,862,571 196,369,874 307,671 17,316,393 106,518,761 - - 1,144,687,547
Other Sources / (Uses) of FundsCapital Outlay from Non-Current Fund Sources** - - - - - - (174,128,357) - - (174,128,357) Mandatory and Non-mandatory Transfers (See FN10) (45,568,501) 10,910,885 7,167,813 (107,068,423) - (4,917,257) 55,757,611 80,582,446 150,710,833 147,575,407 Bond Proceeds Transfers In (See FN4) - - - - - - - - - - Debt Service Payments (See FN5) - - - - - - - (86,294,491) - (86,294,491) Subtotal (45,568,501) 10,910,885 7,167,813 (107,068,423) - (4,917,257) (118,370,746) (5,712,045) 150,710,833 (112,847,441)
Other Items Not for Current Operating UseUnrealized Gains / (Losses) (See FN6) - 7,649,257 - - - (3,341,885) - - - 4,307,372 Additions to Permanent Endowments (See FN7) - - - - - 9,920,474 - - - 9,920,474 Subtotal - 7,649,257 - - - 6,578,589 - - - 14,227,846
Total Sources Over / (Under) Uses (See FN 11) 23,676,920 9,170,364 21,106,236 72,250,407 (230,464) 4,462,278 (224,833,399) (5,576,744) 150,710,833 50,736,431
Bond Proceeds - - - - - - - - - - Depreciation Expense - - - - - - - - (82,352,335) (82,352,335) Transfer of Capital Asses(s) from System - - - - - - - - - - Other Post-Employment Benefit (OPEB) Expense - - - - - - - - - - Non-Cash Capital Gifts - - - - - - - - 2,465,801 2,465,801 Capital Outlay 8,487,701 6,649,408 252,171 6,882,619 - - 174,128,357 - - 196,400,256 Change in Net Assets (Total Agrees with AFR***) 32,164,621 15,819,772 21,358,407 79,133,026 (230,464) 4,462,278 (50,705,042) (5,576,744) 70,824,299 167,250,153
*Defined as any capital outlay expenses from Educational & General, Designated, Auxiliary, or Restricted Expendable Funds.**Defined as any capital outlay expense from funds other than Educational & General, Designated, Auxiliary, or Restricted Expendable.***As reported for "Changes in Net Position" shown on Schedule of Revenues, Expenses, and Changes in Net Position (SRECNP) in Annual Financial Report.
University of Houston - All Disciplines (A+H+M)For the Year Ended August 31, 2019Source: FY 2019 Annual Financial Report
Detail Worksheet FY 2019
Texas Higher Education Coordinating Board 168 June, 2020

University of Houston - All Disciplines (A+H+M)For the Year Ended August 31, 2019Source: FY 2019 Annual Financial Report
FOOTNOTES:
FN1: Scholarship Discounts and Allowances are scholarships, fellowships, and grants applied to tuition. The discount eliminates tuition revenues that are paid for by University resources which are recorded as revenue elsewhere on the financial statements (i.e. federal and state contracts and grants revenues). In addition, Scholarship Discounts and Allowances eliminate tuition revenue that is exempted from payment due to tuition exemptions approved by the Texas Legislature. Waivers, remissions, and exemptions represent tuition and fee dollars forgone by the university - some are required by statute. See the Integrated Financial Reporting System (IFRS) report submitted to THECB for details on waivers, exemptions, tuition, and fees. Allocation methods to individual funds shown may vary between institutions.
FN2: Endowment and Interest Income includes interest income and endowment payouts.
FN3: Other Income is primarily Other Operating and Other Non-operating Revenues from the AFR. Other Expenses is primarily Other Nonoperating Expenses from the AFR.
FN4: Bond Proceeds are funds received from the sale of bonds and commercial paper used to finance capital projects. This amount includes actual proceeds and accrued or anticipated proceeds to be transferred from System. Independent institutions report only to the extent expended in current year.
FN5: Debt service payments are payments to service and retire debt issued to fund capital projects. System components do this via transfers to System Administrations. Independent institutions use direct payment to appropriate paying agents.
FN6: Unrealized Gains / (Losses) represent the increase in the Fair Market Value of Investments and Endowments. Unrealized Gains / (Losses) are accrued as non-cash transactions. Therefore, funds are not actually received for this revenue stream. Accordingly, this revenue is not cash revenue and cannot be used by the University to fund operations.
FN7: Additions to Permanent Endowments are additions to endowment principal. This revenue is restricted for investment purposes only and cannot be used to fund operations. Only interest income from these endowments, which is reported on the Endowment and Investment Income line of this report, can be used by the University to fund operations.
FN8: Distributions from the Available University Fund appropriated through the Appropriation Bill are first used to pay debt service costs on Permanent University Fund Bonds. Funds remaining are distributed to constitutionally designated institutions to promote academic excellence. Only the Excellence funding is shown at the institution level. The AUF funds used to pay debt service on PUF bonds are reported at the System level.
FN9: Auxiliary Enterprises include athletics, housing and food, student services, and parking and transportation. Auxiliary Enterprises are required to be self-supporting, and therefore must operate on the funds they generate.
FN10: Mandatory and non-mandatory transfers includes transfers between funds, transfers between the University System and institutions and transfers to and from other state agencies. In total, all transfers between funds net to zero with the exception of any amounts transferred between the University System, between other institutions, or to and from another state agency. There are no transfers of education and general funds provided by the State of Texas to restricted or auxiliary fund groups. Transfers between education and general funds and designated funds are related to Texas Public Education Grant as provided by the State of Texas.
FN11: Of the net increase of $50,736,431 approximately $36.5 million represents revenues received but not yet expended. This income is fully committed to program expenditures and capital disbursements. The remaining $14.2 million represents non-expendable funds from unrealized gains and additions to permanent endowments of approximately $4.3 million and $9.9 million respectively. Unrealized gains and additions to permanent endowments do not contribute to the availability of the institution's operating cash as discussed in FN6 and FN7.
Texas Higher Education Coordinating Board 169 June, 2020

Sam Houston State University - All Disciplines (A+H+NF)For the Year Ended August 31, 2019Source: FY 2019 Annual Financial ReportThis data is not included in the Academic Institution summary listing, since it mixes the academic institution and the medical school.
Non-Operating Funds are not included in above charts. See following page (Summary).Charts May Not Add to 100% Due to Rounding
Total Operating Uses $1,144,687,547
Total Operating Sources $1,294,043,573
Total Operating Sources $1,294,043,573
State of Texas$303,832,633
23%
Student & Parent$397,368,725
31%
Federal Government$146,321,086
11%
Institutional Resources$446,521,129
35%
Hospitals, Clinics, Professional Fees
$00%
Operating Sources by Category
State Appropriations$204,320,720
16%
State Grants & Contracts
$46,741,8594%
Higher Education Fund$52,770,054
4%
Tuition & Fees$397,368,725
31%Federal Grants & Contracts
$146,321,08611%
Endowment & Interest Income
$30,858,7382%
Local Government Grants
$9,112,4281%
Private Gifts & Grants$147,807,147
11%
Sales & Services$91,781,792
7%
Net Auxiliary Enterprises$96,860,055
8%
Other Income$70,100,969
5%
Hospitals, Clinics, Professional Fees
$00%
Operating Sources
Instruction$256,473,297
22%
Research$168,247,607
15%
Public Service$41,959,600
4%
Academic Support$178,776,888
15%
Student Services$32,815,821
3%Institutional Support
$76,739,5917%
Operations & Maintenance of Plant
$48,771,2514%
Scholarships & Fellowships$64,495,750
6%
Auxiliary Enterprises$125,142,925
11%
Capital Outlay$22,271,899
2%
Other Expenses$128,992,918
11%
Hospitals & Clinics$00%
Operating Uses
Texas Higher Education Coordinating Board 170 June, 2020

Sam Houston State University - All Disciplines (A+H+NF)For the Year Ended August 31, 2019Source: FY 2019 Annual Financial Report
Summary Worksheet FY 2019 Amount Per FTSEInstitution State Funded FTSEs 18,153.95
Operating SourcesState of TexasState Appropriations 71,685,627$ 3,949$ State Grants and Contracts - Restricted 18,904,040 1,041 Higher Education Fund 17,329,858 955 Available University Fund Excellence (See FN8) - - Subtotal 107,919,525$ 5,945$
Student & ParentTuition - net 125,728,949$ 6,926$ Fees - net 39,629,137 2,183 Tuition and Fees (net of Scholarship Discounts and Allowances) 165,358,086$ 9,109$
Federal GovernmentFederal Grants and Contracts - Restricted 47,039,725$ 2,591$
Professional FeesAll Sources (Net) -$ -$
Hospitals and ClinicsAll Sources (Net) -$ -$
Institutional ResourcesEndowment and Interest Income (See FN2) 5,272,415$ 290$ Local Government Grants - Restricted 3,982,664 219 Private Gifts and Grants - Restricted 9,797,775 540 Sales and Services 4,059,913 224 Net Auxiliary Enterprises (See FN9) 37,279,085 2,053 Other Income (See FN3) 7,008,095 386 Subtotal 67,399,947$ 3,712$ Total Operating Sources 387,717,283$ 21,357$
Operating UsesInstruction 103,061,986$ 5,677$ Research 9,000,749 496 Public Service 12,353,689 680 Hospitals and Clinics 17,814 1 Academic Support 46,042,232 2,536 Student Services 28,939,982 1,594 Institutional Support 22,528,286 1,241 Operations and Maintenance of Plant 23,059,240 1,270 Scholarships and Fellowships 30,981,653 1,707 Auxiliary Enterprises (See FN9) 48,433,381 2,668 Capital Outlay from Current Fund Sources 5,732,682 316 Other Expenses (See FN3) 309,585 17 Total Operating Uses 330,461,279$ 18,203$
Other Sources / (Uses) of FundsCapital Outlay from Non-Current Fund Sources (111,864,609) (6,162)$ Mandatory and Non-mandatory Transfers (See FN10) 49,569,722 2,731 Bond Proceeds Transfers (See FN4) - - Debt Service Payments (See FN5) - - Subtotal (62,294,887)$ (3,431)$
Other Items Not for Current Operating UseUnrealized Gains / (Losses) (See FN6) (12,934,623) (712)$ Additions to Permanent Endowments (See FN7) 8,133,498 448 Subtotal (4,801,125)$ (264)$
Total Sources Over / (Under) Uses (See FN11) (9,840,008)$ (541)$
This data is not included in the Academic Institution summary listing, since it mixes the academic institution and the medical school.
Texas Higher Education Coordinating Board 171 June, 2020

This data is provided for information only, since it mixes the academic institution and the medical school.
It is not included in the Academic Institution summary listing.
FY 2019
Operating SourcesEducational &
General DesignatedAuxiliary
EnterprisesRestricted Expendable Loan Funds
Annuity, Life & Endowment and
Similar FundsUnexpended
PlantRetirement of Indebtedness Investment In Plant Primary University
State of TexasState Appropriations 71,685,627 - - - - - - - - 71,685,627 State Grants and Contracts - Restricted - - - 18,904,040 - - - - - 18,904,040 Higher Education Fund 17,329,858 - - - - - - - - 17,329,858 Available University Fund Excellence (See FN8) - - - - - - - - - - Subtotal 89,015,485 - - 18,904,040 - - - - - 107,919,525
Student & ParentTuition Potential 100% 38,275,164 101,556,866 - - - - - - - 139,832,030 Waivers - Statutory (Not Reported in AFR) - - - - - - - - - - Waivers - Institutional (Not Reported in AFR) - - - - - - - - - - Exemptions - Statutory (Not Reported in AFR) - - - - - - - - - - Exemptions - Institutional (Not Reported in AFR) - - - - - - - - - - Tuition - Gross - AFR Presentation 38,275,164 101,556,866 - - - - - - - 139,832,030 Waivers - Statutory (Reported in AFR) (5,134,132) (39,739) - - - - - - - (5,173,871) Waivers - Institutional (Reported in AFR) - - - - - - - - - - Exemptions - Statutory (Reported in AFR) (3,110,675) (5,818,535) - - - - - - - (8,929,210) Exemptions - Institutional (Reported in AFR) - - - - - - - - - - All Other Scholarship Disc.& Allow. (See FN1) - - - - - - - - - - Tuition - net 30,030,357 95,698,592 - - - - - - - 125,728,949
Fees Potential 100% 458,062 71,734,854 10,868,988 - - - - - - 83,061,904 Waivers - Statutory (Not Reported in AFR) - - - - - - - - - - Waivers - Institutional (Not Reported in AFR) - - - - - - - - - - Exemptions - Statutory (Not Reported in AFR) - - - - - - - - - - Exemptions - Institutional (Not Reported in AFR) - - - - - - - - - - Fees - Gross - AFR Presentation 458,062 71,734,854 10,868,988 - - - - - - 83,061,904 Waivers - Statutory (Reported in AFR) - - - - - - - - - - Waivers - Institutional (Reported in AFR) - - - - - - - - - - Exemptions - Statutory (Reported in AFR) - (6,058,183) (74,002) - - - - - - (6,132,185) Exemptions - Institutional (Reported in AFR) - - - - - - - - - - All Other Scholarship Disc.& Allow. (See FN1) - (37,300,582) - - - - - - - (37,300,582) Fees - net 458,062 28,376,089 10,794,986 - - - - - - 39,629,137
Net Tuition and Fees (Funds Collected) 30,488,419 124,074,681 10,794,986 - - - - - - 165,358,086
Federal GovernmentFederal Grants and Contracts - Restricted - - - 47,039,725 - - - - - 47,039,725
Professional FeesAll Sources (Net) - - - - - - - - - -
Hospitals and ClinicsAll Sources (Net) - - - - - - - - - -
Institutional ResourcesEndowment and Interest Income (See FN2) 28 3,170,067 190 - - 1,947,476 154,654 - - 5,272,415 Local Government Grants - Restricted - - - 3,982,664 - - - - - 3,982,664 Private Gifts and Grants - Restricted - 56,363 197,182 9,358,955 - - 185,275 - - 9,797,775 Sales and Services 341,292 2,134,691 110,647 1,473,283 - - - - - 4,059,913 Net Auxiliary Enterprises (See FN9) - - 37,279,085 - - - - - - 37,279,085 Other Income (See FN3) 5,541,498 707,126 724,546 307,508 129 - (272,712) - - 7,008,095 Subtotal 5,882,818 6,068,247 38,311,650 15,122,410 129 1,947,476 67,217 - - 67,399,947 Total Operating Sources 125,386,722 130,142,928 49,106,636 81,066,175 129 1,947,476 67,217 - - 387,717,283
Operating UsesInstruction 65,826,736 35,599,597 - 1,635,653 - - - - - 103,061,986 Research 1,188,843 3,185,107 - 4,626,799 - - - - - 9,000,749 Public Service 6,057,428 654,944 - 5,641,317 - - - - - 12,353,689 Hospitals and Clinics - - 17,814 - - - - - - 17,814 Academic Support 10,348,788 31,961,814 - 3,731,630 - - - - - 46,042,232 Student Services 5,217,642 23,198,948 359 342,061 31,814 - 149,158 - - 28,939,982 Institutional Support 6,060,003 15,297,072 - 953,533 - 209,627 8,051 - - 22,528,286 Operations and Maintenance of Plant 8,433,894 11,050,719 2,231 - - - 3,572,396 - - 23,059,240 Scholarships and Fellowships 500 16,572,630 - 14,408,523 - - - - - 30,981,653 Auxiliary Enterprises (See FN9) - 3,554,162 43,402,892 1,476,327 - - - - - 48,433,381 Capital Outlay from Current Fund Sources* 510,094 1,606,784 218,662 3,397,142 - - - - - 5,732,682 Other Expenses (See FN3) 188,090 122,667 - - (1,172) - - - - 309,585 Total Operating Uses 103,832,018 142,804,444 43,641,958 36,212,985 30,642 209,627 3,729,605 - - 330,461,279
Other Sources / (Uses) of FundsCapital Outlay from Non-Current Fund Sources** - - - - - - (111,864,609) - - (111,864,609) Mandatory and Non-mandatory Transfers (See FN10) (4,628,068) (11,501,162) (9,226,949) - - - 74,925,901 - - 49,569,722 Bond Proceeds Transfers In (See FN4) - - - - - - - - - - Debt Service Payments (See FN5) - - - - - - - - - - Subtotal (4,628,068) (11,501,162) (9,226,949) - - - (36,938,708) - - (62,294,887)
Other Items Not for Current Operating UseUnrealized Gains / (Losses) (See FN6) - (700,586) - - - (12,234,037) - - - (12,934,623) Additions to Permanent Endowments (See FN7) - - - - - 8,133,498 - - - 8,133,498 Subtotal - (700,586) - - - (4,100,539) - - - (4,801,125)
Total Sources Over / (Under) Uses (See FN 11) 16,926,636 (24,863,264) (3,762,271) 44,853,190 (30,513) (2,362,690) (40,601,096) - - (9,840,008)
Bond Proceeds - - - - - - - - - - Depreciation Expense - - - - - - (29,545,340) - - (29,545,340) Transfer of Capital Asses(s) from System - - - - - - - - - - Other Post-Employment Benefit (OPEB) Expense - - - - - - - - - - Non-Cash Capital Gifts - 93,700 - 3,150,000 - - - - - 3,243,700 Capital Outlay 510,094 1,513,084 218,662 247,142 - - 111,864,609 - - 114,353,591 Change in Net Assets (Total Agrees with AFR***) 17,436,730 (23,256,480) (3,543,609) 48,250,332 (30,513) (2,362,690) 41,718,173 - - 78,211,943
*Defined as any capital outlay expenses from Educational & General, Designated, Auxiliary, or Restricted Expendable Funds.**Defined as any capital outlay expense from funds other than Educational & General, Designated, Auxiliary, or Restricted Expendable.***As reported for "Changes in Net Position" shown on Schedule of Revenues, Expenses, and Changes in Net Position (SRECNP) in Annual Financial Report.
Sam Houston State University - All Disciplines (A+H+NF)For the Year Ended August 31, 2019Source: FY 2019 Annual Financial Report
Detail Worksheet FY 2019
Texas Higher Education Coordinating Board 172 June, 2020

Sam Houston State University - All Disciplines (A+H+NF)For the Year Ended August 31, 2019Source: FY 2019 Annual Financial Report
FOOTNOTES:
FN1: Scholarship Discounts and Allowances are scholarships, fellowships, and grants applied to tuition. The discount eliminates tuition revenues that are paid for by University resources which are recorded as revenue elsewhere on the financial statements (i.e. federal and state contracts and grants revenues). In addition, Scholarship Discounts and Allowances eliminate tuition revenue that is exempted from payment due to tuition exemptions approved by the Texas Legislature. Waivers, remissions, and exemptions represent tuition and fee dollars forgone by the university - some are required by statute. See the Integrated Financial Reporting System (IFRS) report submitted to THECB for details on waivers, exemptions, tuition, and fees. Allocation methods to individual funds shown may vary between institutions.
FN2: Endowment and Interest Income includes interest income and endowment payouts.
FN3: Other Income is primarily Other Operating and Other Non-operating Revenues from the AFR. Other Expenses is primarily Other Nonoperating Expenses from the AFR.
FN4: Bond Proceeds are funds received from the sale of bonds and commercial paper used to finance capital projects. This amount includes actual proceeds and accrued or anticipated proceeds to be transferred from System. Independent institutions report only to the extent expended in current year.
FN5: Debt service payments are payments to service and retire debt issued to fund capital projects. System components do this via transfers to System Administrations. Independent institutions use direct payment to appropriate paying agents.
FN6: Unrealized Gains / (Losses) represent the increase in the Fair Market Value of Investments and Endowments. Unrealized Gains / (Losses) are accrued as non-cash transactions. Therefore, funds are not actually received for this revenue stream. Accordingly, this revenue is not cash revenue and cannot be used by the University to fund operations.
FN7: Additions to Permanent Endowments are additions to endowment principal. This revenue is restricted for investment purposes only and cannot be used to fund operations. Only interest income from these endowments, which is reported on the Endowment and Investment Income line of this report, can be used by the University to fund operations.
FN8: Distributions from the Available University Fund appropriated through the Appropriation Bill are first used to pay debt service costs on Permanent University Fund Bonds. Funds remaining are distributed to constitutionally designated institutions to promote academic excellence. Only the Excellence funding is shown at the institution level. The AUF funds used to pay debt service on PUF bonds are reported at the System level.
FN9: Auxiliary Enterprises include athletics, housing and food, student services, and parking and transportation. Auxiliary Enterprises are required to be self-supporting, and therefore must operate on the funds they generate.
FN10: Mandatory and non-mandatory transfers includes transfers between funds, transfers between the University System and institutions and transfers to and from other state agencies. In total, all transfers between funds net to zero with the exception of any amounts transferred between the University System, between other institutions, or to and from another state agency. There are no transfers of education and general funds provided by the State of Texas to restricted or auxiliary fund groups. Transfers between education and general funds and designated funds are related to Texas Public Education Grant as provided by the State of Texas.
FN11. N/A
Texas Higher Education Coordinating Board 173 June, 2020

Blank Page
Texas Higher Education Coordinating Board 174 June, 2020

Health-Related Institutions
Texas Higher Education Coordinating Board 175 June, 2020

Summary of All Health-Related InstitutionsFor the Year Ended August 31, 2019Source: FY 2019 Annual Financial Report
Non-operating Funds are not included in charts above. See following page (Summary).May not add to 100% due to rounding.
Total Operating Sources $16,308,293,095
Total Operating Uses $14,424,571,642
Total Operating Sources $16,308,293,095
State of Texas$2,069,436,677
13% Student & Parent$326,796,769
2%
Federal Government$958,402,278
6%
Institutional Resources$3,610,983,076
22%
Hospitals, Clinics, Professional Fees
$9,342,674,29557%
Operating Sources by Category
State Appropriations$1,765,339,331
11%
State Grants & Contracts
$179,638,8291%
Higher Education Fund$25,744,834, 0%
Tuition & Fees$206,155,560, 2%
Federal Grants & Contracts
$966,627,400, 9%
Endowment & Interest Income
$273,761,377, 3%
Local Government Grants
$997,829,3696%
Private Gifts & Grants$1,061,672,885
7%Sales & Services
$215,785,6641%
Net Auxiliary Enterprises
$123,827,7041%
Other Income$500,332,235
3%
Professional Fees$2,325,490,734
14%
Hospitals, Clinics, Professional Fees
$7,017,183,56143%
Operating Sources
Instruction$3,141,329,631
22%
Research$1,832,941,781
13%
Public Service$360,790,635
3%
Academic Support$638,194,256
4%
Student Services$59,053,112
0%
Institutional Support$595,507,203
4%
Operations & Maintenance of Plant
$560,062,8524%
Scholarships & Fellowships$43,895,394
0%
Auxiliary Enterprises$94,640,279
1%Capital Outlay$335,609,236
2%Other Expenses
$18,945,3560%
Hospitals & Clinics$6,743,601,907
47%
Operating Uses
Texas Higher Education Coordinating Board 176 June, 2020

Summary of All Health-Related InstitutionsFor the Year Ended August 31, 2019Source: FY 2019 Annual Financial Report
Summary Worksheet FY 2019 Amount Per FTSEInstitution State Funded FTSEs 28,154.75
Operating SourcesState of Texas See Note BelowState Appropriations (Includes Research, Patient Care, & Public Service) 1,765,339,331$ 62,701$ State Grants and Contracts - Restricted 179,638,829 6,380 Higher Education Fund 46,698,327 1,659 Available University Fund Excellence (See FN8) 77,760,190 2,762 Subtotal 2,069,436,677$ 73,502$
Student & ParentTuition - net 255,138,373$ 9,062$ Fees - net 71,658,396 2,545 Tuition and Fees (net of Scholarship Discounts and Allowances) 326,796,769$ 11,607$
Federal GovernmentFederal Grants and Contracts - Restricted 958,402,278$
Professional FeesAll Sources (Net) 2,325,490,734$
Hospitals and ClinicsAll Sources (Net) 7,017,183,561$
Institutional ResourcesEndowment and Interest Income (See FN2) 711,535,219$ Local Government Grants - Restricted 997,829,369 Private Gifts and Grants - Restricted 1,061,672,885 Sales and Services 215,785,664 Net Auxiliary Enterprises (See FN9) 123,827,704 Other Income (See FN3) 500,332,235 Subtotal 3,610,983,076$ Total Operating Sources 16,308,293,095$
Operating UsesInstruction 3,141,329,631$ 111,574$ Research 1,832,941,781 65,102 Public Service 360,790,635 Hospitals and Clinics 6,743,601,907 Academic Support 638,194,256 22,667 Student Services 59,053,112 2,097 Institutional Support 595,507,203 21,151 Operations and Maintenance of Plant 560,062,852 Scholarships and Fellowships 43,895,394 1,559 Auxiliary Enterprises (See FN9) 94,640,279 Capital Outlay from Current Fund Sources 335,609,236 11,920 Other Expenses (See FN3) 18,945,356 Total Operating Uses 14,424,571,642$
Other Sources / (Uses) of FundsCapital Outlay from Non-Current Fund Sources (1,069,700,608)$ Mandatory and Non-mandatory Transfers (See FN10) 101,212,782 Bond Transfers In (See FN4) 510,354,679 Debt Service Payments (See FN5) (442,991,378) Subtotal (901,124,525)$
Other Items Not for Current Operating UseUnrealized Gains / (Losses) (See FN6) 52,020,511$ Additions to Permanent Endowments (See FN7) 85,843,242 Subtotal 137,863,753$
Total Sources Over / (Under) Uses (See FN11) 1,120,460,681$
Note: Due to the nature of Health-Related Institutions, per FTSE calculations are provided on selected line items.
Texas Higher Education Coordinating Board 177 June, 2020

Ret
FY 2019
Operating SourcesEducational &
General DesignatedAuxiliary
EnterprisesRestricted
Expendable Loan Funds
Annuity, Life & Endowment and
Similar FundsUnexpended
PlantRetirement of Indebtedness
Investment In Plant Primary University
State of TexasState Appropriations 1,752,518,674 - - 12,820,657 - - - - - 1,765,339,331 State Grants and Contracts - Restricted 23,538,016 9,949,053 - 146,151,760 - - - - - 179,638,829 Higher Education Fund 46,698,327 - - - - - - - - 46,698,327 Available University Fund Excellence (See FN8) 25,010,190 52,750,000 - - - - - - - 77,760,190 Subtotal 1,847,765,207 62,699,053 - 158,972,417 - - - - - 2,069,436,677
Student & ParentTuition Potential 100% 143,713,872 161,387,404 - - - - - - - 305,101,276 Waivers - Statutory (Not Reported in AFR) (25,977,258) (71,252) - - - - - - - (26,048,510) Waivers - Institutional (Not Reported in AFR) (1,597,464) (530,408) - - - - - - - (2,127,872) Exemptions - Statutory (Not Reported in AFR) - - - - - - - - - - Exemptions - Institutional (Not Reported in AFR) - - - - - - - - - - Tuition - Gross - AFR Presentation 116,139,150 160,785,744 - - - - - - - 276,924,894 Waivers - Statutory (Reported in AFR) - - - - - - - - - - Waivers - Institutional (Reported in AFR) (360,669) - - - - - - - - (360,669) Exemptions - Statutory (Reported in AFR) (2,556,329) (2,188,385) - - - - - - - (4,744,714) Exemptions - Institutional (Reported in AFR) - (11,773) - - - - - - - (11,773) All Other Scholarship Disc.& Allow. (See FN1) (6,842,779) (9,826,586) - - - - - - - (16,669,365) Tuition - net 106,379,373 148,759,000 - - - - - - - 255,138,373
Fees Potential 100% 1,222,112 66,328,265 8,942,924 - - - - - - 76,493,301 Waivers - Statutory (Not Reported in AFR) - - - - - - - - - - Waivers - Institutional (Not Reported in AFR) - - - - - - - - - - Exemptions - Statutory (Not Reported in AFR) - - - - - - - - - - Exemptions - Institutional (Not Reported in AFR) - - - - - - - - - - Fees - Gross - AFR Presentation 1,222,112 66,328,265 8,942,924 - - - - - - 76,493,301 Waivers - Statutory (Reported in AFR) - - - - - - - - - - Waivers - Institutional (Reported in AFR) - - - - - - - - - - Exemptions - Statutory (Reported in AFR) (142,198) (1,799,297) (55,603) - - - - - - (1,997,098) Exemptions - Institutional (Reported in AFR) - (5,996) - - - - - - - (5,996) All Other Scholarship Disc.& Allow. (See FN1) (204,083) (2,117,008) (510,720) - - - - - - (2,831,811) Fees - net 875,831 62,405,964 8,376,601 - - - - - - 71,658,396
Net Tuition and Fees (Funds Collected) 107,255,204 211,164,964 8,376,601 - - - - - - 326,796,769
Federal GovernmentFederal Grants and Contracts - Restricted - 237,982,485 - 719,419,298 - - 1,000,495 - - 958,402,278
Professional FeesAll Sources (Net) - 2,214,212,181 - 111,278,553 - - - - - 2,325,490,734
Hospitals and ClinicsAll Sources (Net) 4,878,193,334 2,138,990,227 - - - - - - - 7,017,183,561
Institutional ResourcesEndowment and Interest Income (See FN2) 129,660,542 406,318,489 1,455,932 179,452,652 472,456 (8,026,425) 2,201,573 - - 711,535,219 Local Government Grants - Restricted 15,000 920,403,165 - 77,411,204 - - - - - 997,829,369 Private Gifts and Grants - Restricted 3,286,016 409,287,654 367,510 600,025,358 - - 48,706,347 - - 1,061,672,885 Sales and Services - Educational Activities (Net) 24,051,782 137,724,241 - 54,009,002 639 - - - - 215,785,664 Net Auxiliary Enterprises (See FN9) - - 123,827,704 - - - - - - 123,827,704 Other Income (See FN3) 50,671,852 448,993,706 40,812 7,119,266 735,522 - 492,661 - (7,721,584) 500,332,235 Subtotal 207,685,192 2,322,727,255 125,691,958 918,017,482 1,208,617 (8,026,425) 51,400,581 - (7,721,584) 3,610,983,076 Total Operating Sources 7,040,898,937 7,187,776,165 134,068,559 1,907,687,750 1,208,617 (8,026,425) 52,401,076 - (7,721,584) 16,308,293,095
Operating UsesInstruction 701,758,605 2,304,048,393 - 135,511,497 11,136 - - - - 3,141,329,631 Research 344,670,207 266,056,284 - 1,222,162,417 - - 52,873 - - 1,832,941,781 Public Service 22,240,958 98,218,081 - 240,305,360 - - 26,236 - - 360,790,635 Hospitals and Clinics 3,342,346,239 3,344,807,137 - 56,448,531 - - - - - 6,743,601,907 Academic Support 397,415,998 217,759,247 - 20,302,186 - - 2,716,825 - - 638,194,256 Student Services 21,500,075 33,254,593 - 3,821,294 477,150 - - - - 59,053,112 Institutional Support 385,359,279 188,160,434 - 21,836,124 - 102,626 48,740 - - 595,507,203 Operations and Maintenance of Plant 376,137,330 105,239,230 - 5,227,212 - - 73,404,134 - 54,946 560,062,852 Scholarships and Fellowships 2,392,583 12,890,963 - 28,444,432 167,416 - - - - 43,895,394 Auxiliary Enterprises (See FN9) - 843,082 93,648,453 148,744 - - - - - 94,640,279 Capital Outlay from Current Fund Sources* 157,845,862 134,614,061 2,056,755 41,092,558 - - - - - 335,609,236 Other Expenses (See FN3) 562,241 13,885,641 - 197,837 2,503,199 - (650,096) - 2,446,534 18,945,356 Total Operating Uses 5,752,229,377 6,719,777,146 95,705,208 1,775,498,192 3,158,901 102,626 75,598,712 - 2,501,480 14,424,571,642
Other Sources / (Uses) of FundsCapital Outlay from Non-Current Fund Sources** - - - - - - (1,072,294,238) - 2,593,630 (1,069,700,608) Mandatory and Non-mandatory Transfers (See FN10) (282,488,422) (100,733,180) 8,395,633 (100,257,602) 3,370,008 40,051,084 476,843,803 50,789,408 5,242,050 101,212,782 Bond Transfers In (See FN4) - - - - - - 510,354,679 - - 510,354,679 Debt Service Payments (See FN5) (273,545,571) (126,804,256) (30,079,070) (20,000) - - (12,542,481) - - (442,991,378) Subtotal (556,033,993) (227,537,436) (21,683,437) (100,277,602) 3,370,008 40,051,084 (97,638,237) 50,789,408 7,835,680 (901,124,525)
Other Items Not for Current Operating UseUnrealized Gains / (Losses) (See FN6) 67,968,172 3,245,682 73,874 4,288,278 24,171 (23,633,678) 54,012 - - 52,020,511 Additions to Permanent Endowments (See FN7) - - - 4,782,771 - 81,060,471 - - - 85,843,242 Subtotal 67,968,172 3,245,682 73,874 9,071,049 24,171 57,426,793 54,012 - - 137,863,753
Total Sources Over / (Under) Uses (See FN 11) 800,603,739 243,707,265 16,753,788 40,983,005 1,443,895 89,348,826 (120,781,861) 50,789,408 (2,387,384) 1,120,460,681
Depreciation Expense (300,168) - - - - - - - (973,227,680) (973,527,848) Transfer of Capital Asset(s) from System - - - (58,768) - - - - 87,396,776 87,338,008 Other Post-Employment Benefit (OPEB) Expense - - - - - - - - - - Non-Cash Capital Gifts - 541,892 - 1,000,000 - - - - 2,774,827 4,316,719 Capital Outlay 2,301,051 9,589,546 10,026 2,815,991 - - 67,967,359 - 1,305,063,756 1,387,747,729 Change in Net Assets (Total Agrees with AFR***) 802,604,622 253,838,703 16,763,814 44,740,228 1,443,895 89,348,826 (52,814,502) 50,789,408 419,620,295 1,626,335,289
*Defined as any capital outlay expenses from Educational & General, Designated, Auxiliary, or Restricted Expendable Funds.**Defined as any capital outlay expense from funds other than Educational & General, Designated, Auxiliary, or Restricted Expendable.***As reported for "Changes in Net Position" shown on Schedule of Revenues, Expenses, and Changes in Net Position (SRECNP) in Annual Financial Report.
Summary of All Health-Related InstitutionsFor the Year Ended August 31, 2019Source: FY 2019 Annual Financial Report
Detail Worksheet FY 2019
Texas Higher Education Coordinating Board 178 June, 2020

Summary of All Health-Related InstitutionsFor the Year Ended August 31, 2019Source: FY 2019 Annual Financial Report
FOOTNOTES:
FN1: Scholarship Discounts and Allowances are scholarships, fellowships, and grants applied to tuition. The discount eliminates tuition revenues that are paid for by University resources which are recorded as revenue elsewhere on the financial statements (i.e. federal and state contracts and grants revenues). In addition, Scholarship Discounts and Allowances eliminate tuition revenue that is exempted from payment due to tuition exemptions approved by the Texas Legislature. Waivers, remissions, and exemptions represent tuition and fee dollars forgone by the university - some are required by statute. See the Integrated Financial Reporting System (IFRS) report submitted to THECB for details on waivers, exemptions, tuition, and fees. Allocation methods to individual funds shown may vary between institutions.
FN2: Endowment and Interest Income includes interest income and endowment payouts.
FN3: Other Income is primarily Other Operating and Other Non-operating Revenues from the AFR. Other Expenses is primarily Other Nonoperating Expenses from the AFR.
FN4: Bond Proceeds are funds received from the sale of bonds and commercial paper used to finance capital projects. This amount includes actual proceeds and accrued or anticipated proceeds to be transferred from System. Independent institutions report only to the extent expended in current year.
FN5: Debt service payments are payments to service and retire debt issued to fund capital projects. System components do this via transfers to System Administrations. Independent institutions use direct payment to appropriate paying agents.
FN6: Unrealized Gains / (Losses) represent the increase in the Fair Market Value of Investments and Endowments. Unrealized Gains / (Losses) are accrued as non-cash transactions. Therefore, funds are not actually received for this revenue stream. Accordingly, this revenue is not cash revenue and cannot be used by the University to fund operations.
FN7: Additions to Permanent Endowments are additions to endowment principal. This revenue is restricted for investment purposes only and cannot be used to fund operations. Only interest income from these endowments, which is reported on the Endowment and Investment Income line of this report, can be used by the University to fund operations.
FN8: Distributions from the Available University Fund appropriated through the Appropriation Bill are first used to pay debt service costs on Permanent University Fund Bonds. Funds remaining are distributed to constitutionally designated institutions to promote academic excellence. Only the Excellence funding is shown at the institution level. The AUF funds used to pay debt service on PUF bonds are reported at the System level.
FN9: Auxiliary Enterprises include athletics, housing and food, student services, and parking and transportation. Auxiliary Enterprises are required to be self-supporting, and therefore must operate on the funds they generate.
FN10: Mandatory and non-mandatory transfers includes transfers between funds, transfers between the University System and institutions and transfers to and from other state agencies. In total, all transfers between funds net to zero with the exception of any amounts transferred between the University System, between other institutions, or to and from another state agency. There are no transfers of education and general funds provided by the State of Texas to restricted or auxiliary fund groups. Transfers between education and general funds and designated funds are related to Texas Public Education Grant as provided by the State of Texas.
FN11: See each individual institution for the revenues received but not yet expended for each institution. This income is fully committed to program expenditures and capital disbursements. The amount of Non-expendable funds for each institution is provided. Non-expendable funds, including unrealized gains (losses) and additions (reductions) to permanent endowments, are provided for each institution. Unrealized gains (losses) and additions (reductions) to permanent endowments do not contribute to the availability of the institution's operating cash as discussed in FN6 and FN7 above. The total overall increase in Sources Over Uses is provided. If Sources Over Uses is negative, this footnote will be marked N/A.
Texas Higher Education Coordinating Board 179 June, 2020

The University of Texas Southwestern Medical CenterFor the Year Ended August 31, 2019Source: FY 2019 Annual Financial Report
Non-operating Funds are not included in charts above. See following page (Summary).May not add to 100% due to rounding.
Total Operating Uses $3,072,155,625
Total Operating Sources $3,413,956,402
Total Operating Sources $3,413,956,402
State of Texas$239,383,849
7% Student & Parent$26,161,864
1%
Federal Government$205,477,997
6%
Institutional Resources$760,143,091
22%
Hospitals, Clinics, Professional Fees
$2,182,789,60164%
Operating Sources by Category
State Appropriations$194,083,838
6%
State Grants & Contracts
$45,300,0111%
Tuition & Fees$26,161,864
1%Federal Grants &
Contracts$205,477,997
6%
Endowment & Interest Income
$186,628,8695%
Local Government Grants
$130,062,8154%
Private Gifts & Grants$283,167,192
8%
Sales & Services$14,137,740
0%Net Auxiliary Enterprises$24,046,599
1%
Other Income$122,099,876
4%
Professional Fees$706,413,794
21%
Hospitals, Clinics, Professional Fees
$1,476,375,80743%
Operating Sources
Instruction$966,468,296
32%
Research$377,797,166
12%
Public Service$32,314,762
1%
Academic Support$62,776,863
2%
Student Services$6,436,410
0%
Institutional Support$84,544,967
3%
Operations & Maintenance of Plant
$92,371,3943%
Scholarships & Fellowships$2,429,870
0%
Auxiliary Enterprises$27,112,448
1%
Capital Outlay$18,860,540
1%
Other Expenses$8,166,582
0%
Hospitals & Clinics$1,392,876,327
45%
Operating Uses
Texas Higher Education Coordinating Board 180 June, 2020

The University of Texas Southwestern Medical CenterFor the Year Ended August 31, 2019Source: FY 2019 Annual Financial Report
Summary Worksheet FY 2019 Amount Per FTSEInstitution State Funded FTSEs 2,263.33
Operating SourcesState of Texas See Note BelowState Appropriations (Includes Research, Patient Care, & Public Service) 194,083,838$ 85,751$ State Grants and Contracts - Restricted 45,300,011 20,015 Higher Education Fund - - Available University Fund Excellence (See FN8) - - Subtotal 239,383,849$ 105,766$
Student & ParentTuition - net 23,882,362$ 10,552$ Fees - net 2,279,502 1,007 Tuition and Fees (net of Scholarship Discounts and Allowances) 26,161,864$ 11,559$
Federal GovernmentFederal Grants and Contracts - Restricted 205,477,997$
Professional FeesAll Sources (Net) 706,413,794$
Hospitals and ClinicsAll Sources (Net) 1,476,375,807$
Institutional ResourcesEndowment and Interest Income (See FN2) 186,628,869$ Local Government Grants - Restricted 130,062,815 Private Gifts and Grants - Restricted 283,167,192 Sales and Services 14,137,740 Net Auxiliary Enterprises (See FN9) 24,046,599 Other Income (See FN3) 122,099,876 Subtotal 760,143,091$ Total Operating Sources 3,413,956,402$
Operating UsesInstruction 966,468,296$ 427,012$ Research 377,797,166 166,921 Public Service 32,314,762 Hospitals and Clinics 1,392,876,327 Academic Support 62,776,863 27,737 Student Services 6,436,410 2,844 Institutional Support 84,544,967 37,354 Operations and Maintenance of Plant 92,371,394 Scholarships and Fellowships 2,429,870 1,074 Auxiliary Enterprises (See FN9) 27,112,448 Capital Outlay from Current Fund Sources 18,860,540 8,333 Other Expenses (See FN3) 8,166,582 Total Operating Uses 3,072,155,625$
Other Sources / (Uses) of FundsCapital Outlay from Non-Current Fund Sources (294,915,104) Mandatory and Non-mandatory Transfers (See FN10) 1,154,730 Bond Transfers In (See FN4) 154,981,122 Debt Service Payments (See FN5) (107,981,841) Subtotal (246,761,093)$
Other Items Not for Current Operating UseUnrealized Gains / (Losses) (See FN6) (24,515,680) Additions to Permanent Endowments (See FN7) 13,796,206 Subtotal (10,719,474)$
Total Sources Over / (Under) Uses (See FN11) 84,320,210$
Note: Due to the nature of Health-Related Institutions, per FTSE calculations are provided on selected line items.
Texas Higher Education Coordinating Board 181 June, 2020

FY 2019
Operating SourcesEducational &
General DesignatedAuxiliary
EnterprisesRestricted
Expendable Loan Funds
Annuity, Life & Endowment and
Similar FundsUnexpended
PlantRetirement of Indebtedness
Investment In Plant Primary University
State of TexasState Appropriations 194,083,838 - - - - - - - - 194,083,838 State Grants and Contracts - Restricted 2,925,000 2,266,401 - 40,108,610 - - - - - 45,300,011 Higher Education Fund - - - - - - - - - - Available University Fund Excellence (See FN8) - - - - - - - - - - Subtotal 197,008,838 2,266,401 - 40,108,610 - - - - - 239,383,849
Student & ParentTuition Potential 100% 14,292,906 17,130,285 - - - - - - - 31,423,191 Waivers - Statutory (Not Reported in AFR) (6,517,218) - - - - - - - - (6,517,218) Waivers - Institutional (Not Reported in AFR) - - - - - - - - - - Exemptions - Statutory (Not Reported in AFR) - - - - - - - - - - Exemptions - Institutional (Not Reported in AFR) - - - - - - - - - - Tuition - Gross - AFR Presentation 7,775,688 17,130,285 - - - - - - - 24,905,973 Waivers - Statutory (Reported in AFR) - - - - - - - - - - Waivers - Institutional (Reported in AFR) (360,669) - - - - - - - - (360,669) Exemptions - Statutory (Reported in AFR) - - - - - - - - - - Exemptions - Institutional (Reported in AFR) - - - - - - - - - - All Other Scholarship Disc.& Allow. (See FN1) (49,046) (613,896) - - - - - - - (662,942) Tuition - net 7,365,973 16,516,389 - - - - - - - 23,882,362
Fees Potential 100% 48,856 1,010,126 1,655,746 - - - - - - 2,714,728 Waivers - Statutory (Not Reported in AFR) - - - - - - - - - - Waivers - Institutional (Not Reported in AFR) - - - - - - - - - - Exemptions - Statutory (Not Reported in AFR) - - - - - - - - - - Exemptions - Institutional (Not Reported in AFR) - - - - - - - - - - Fees - Gross - AFR Presentation 48,856 1,010,126 1,655,746 - - - - - - 2,714,728 Waivers - Statutory (Reported in AFR) - - - - - - - - - - Waivers - Institutional (Reported in AFR) - - - - - - - - - - Exemptions - Statutory (Reported in AFR) - - - - - - - - - - Exemptions - Institutional (Reported in AFR) - - - - - - - - - - All Other Scholarship Disc.& Allow. (See FN1) (2,473) (36,418) (396,335) - - - - - - (435,226) Fees - net 46,383 973,708 1,259,411 - - - - - - 2,279,502
Net Tuition and Fees (Funds Collected) 7,412,356 17,490,097 1,259,411 - - - - - - 26,161,864
Federal GovernmentFederal Grants and Contracts - Restricted - 64,552,191 - 140,925,806 - - - - - 205,477,997
Professional FeesAll Sources (Net) - 706,413,794 - - - - - - - 706,413,794
Hospitals and ClinicsAll Sources (Net) - 1,476,375,807 - - - - - - - 1,476,375,807
Institutional ResourcesEndowment and Interest Income (See FN2) 413,129 107,929,125 397,312 76,811,654 9,115 779,860 288,674 - - 186,628,869 Local Government Grants - Restricted - 129,931,609 - 131,206 - - - - - 130,062,815 Private Gifts and Grants - Restricted - 134,751,847 - 148,415,345 - - - - - 283,167,192 Sales and Services - Educational Activities (Net) - 9,443,336 - 4,694,404 - - - - - 14,137,740 Net Auxiliary Enterprises (See FN9) - - 24,046,599 - - - - - - 24,046,599 Other Income (See FN3) 35,180 121,003,679 - 590,163 150,667 - - - 320,187 122,099,876 Subtotal 448,309 503,059,596 24,443,911 230,642,772 159,782 779,860 288,674 - 320,187 760,143,091 Total Operating Sources 204,869,503 2,770,157,886 25,703,322 411,677,188 159,782 779,860 288,674 - 320,187 3,413,956,402
Operating UsesInstruction 80,434,739 880,062,522 - 5,971,035 - - - - - 966,468,296 Research 32,496,447 33,532,273 - 311,768,446 - - - - - 377,797,166 Public Service 37,482 31,099,298 - 1,177,982 - - - - - 32,314,762 Hospitals and Clinics - 1,392,852,030 - 24,297 - - - - - 1,392,876,327 Academic Support 23,012,499 37,371,487 - 2,392,877 - - - - - 62,776,863 Student Services 2,707,992 3,486,174 - 137,030 105,214 - - - - 6,436,410 Institutional Support 24,254,400 54,180,947 - 6,109,620 - - - - - 84,544,967 Operations and Maintenance of Plant 19,104,351 27,793,449 - 828,220 - - 44,645,374 - - 92,371,394 Scholarships and Fellowships - 70,811 - 2,359,059 - - - - - 2,429,870 Auxiliary Enterprises (See FN9) - - 27,112,448 - - - - - - 27,112,448 Capital Outlay from Current Fund Sources* - 9,161,309 17,487 9,681,744 - - - - - 18,860,540 Other Expenses (See FN3) - 8,154,385 - - - - 12,197 - - 8,166,582 Total Operating Uses 182,047,910 2,477,764,685 27,129,935 340,450,310 105,214 - 44,657,571 - - 3,072,155,625
Other Sources / (Uses) of FundsCapital Outlay from Non-Current Fund Sources** - - - - - - (294,915,104) - - (294,915,104) Mandatory and Non-mandatory Transfers (See FN10) (1,712,054) (137,034,492) 9,500,384 (7,693,329) 251,429 11,222,537 126,932,428 - (312,173) 1,154,730 Bond Transfers In (See FN4) - - - - - - 154,981,122 - - 154,981,122 Debt Service Payments (See FN5) (18,517,800) (79,903,875) (9,560,166) - - - - - - (107,981,841) Subtotal (20,229,854) (216,938,367) (59,782) (7,693,329) 251,429 11,222,537 (13,001,554) - (312,173) (246,761,093)
Other Items Not for Current Operating UseUnrealized Gains / (Losses) (See FN6) - (19,813,755) 73,874 3,575,966 1,706 (8,407,483) 54,012 - - (24,515,680) Additions to Permanent Endowments (See FN7) - - - 921,069 - 12,875,137 - - - 13,796,206 Subtotal - (19,813,755) 73,874 4,497,035 1,706 4,467,654 54,012 - - (10,719,474)
Total Sources Over / (Under) Uses (See FN 11) 2,591,739 55,641,079 (1,412,521) 68,030,584 307,703 16,470,051 (57,316,439) - 8,014 84,320,210
Depreciation Expense - - - - - - - - (183,365,468) (183,365,468) Transfer of Capital Asset(s) from System - - - - - - - - - - Other Post-Employment Benefit (OPEB) Expense - - - - - - - - - - Non-Cash Capital Gifts - - - - - - - - 112,500 112,500 Capital Outlay - - - - - - - - 313,775,644 313,775,644 Change in Net Assets (Total Agrees with AFR***) 2,591,739 55,641,079 (1,412,521) 68,030,584 307,703 16,470,051 (57,316,439) - 130,530,690 214,842,886
*Defined as any capital outlay expenses from Educational & General, Designated, Auxiliary, or Restricted Expendable Funds.**Defined as any capital outlay expense from funds other than Educational & General, Designated, Auxiliary, or Restricted Expendable.***As reported for "Changes in Net Position" shown on Schedule of Revenues, Expenses, and Changes in Net Position (SRECNP) in Annual Financial Report.
The University of Texas Southwestern Medical CenterFor the Year Ended August 31, 2019Source: FY 2019 Annual Financial Report
Detail Worksheet FY 2019
Texas Higher Education Coordinating Board 182 June, 2020

The University of Texas Southwestern Medical CenterFor the Year Ended August 31, 2019Source: FY 2019 Annual Financial Report
FOOTNOTES:
FN1: Scholarship Discounts and Allowances are scholarships, fellowships, and grants applied to tuition. The discount eliminates tuition revenues that are paid for by University resources which are recorded as revenue elsewhere on the financial statements (i.e. federal and state contracts and grants revenues). In addition, Scholarship Discounts and Allowances eliminate tuition revenue that is exempted from payment due to tuition exemptions approved by the Texas Legislature. Waivers, remissions, and exemptions represent tuition and fee dollars forgone by the university - some are required by statute. See the Integrated Financial Reporting System (IFRS) report submitted to THECB for details on waivers, exemptions, tuition, and fees. Allocation methods to individual funds shown may vary between institutions.
FN2: Endowment and Interest Income includes interest income and endowment payouts.
FN3: Other Income is primarily Other Operating and Other Non-operating Revenues from the AFR. Other Expenses is primarily Other Nonoperating Expenses from the AFR.
FN4: Bond Proceeds are funds received from the sale of bonds and commercial paper used to finance capital projects. This amount includes actual proceeds and accrued or anticipated proceeds to be transferred from System. Independent institutions report only to the extent expended in current year.
FN5: Debt service payments are payments to service and retire debt issued to fund capital projects. System components do this via transfers to System Administrations. Independent institutions use direct payment to appropriate paying agents.
FN6: Unrealized Gains / (Losses) represent the increase in the Fair Market Value of Investments and Endowments. Unrealized Gains / (Losses) are accrued as non-cash transactions. Therefore, funds are not actually received for this revenue stream. Accordingly, this revenue is not cash revenue and cannot be used by the University to fund operations.
FN7: Additions to Permanent Endowments are additions to endowment principal. This revenue is restricted for investment purposes only and cannot be used to fund operations. Only interest income from these endowments, which is reported on the Endowment and Investment Income line of this report, can be used by the University to fund operations.
FN8: Distributions from the Available University Fund appropriated through the Appropriation Bill are first used to pay debt service costs on Permanent University Fund Bonds. Funds remaining are distributed to constitutionally designated institutions to promote academic excellence. Only the Excellence funding is shown at the institution level. The AUF funds used to pay debt service on PUF bonds are reported at the System level.
FN9: Auxiliary Enterprises include athletics, housing and food, student services, and parking and transportation. Auxiliary Enterprises are required to be self-supporting, and therefore must operate on the funds they generate.
FN10: Mandatory and non-mandatory transfers includes transfers between funds, transfers between the University System and institutions and transfers to and from other state agencies. In total, all transfers between funds net to zero with the exception of any amounts transferred between the University System, between other institutions, or to and from another state agency. There are no transfers of education and general funds provided by the State of Texas to restricted or auxiliary fund groups. Transfers between education and general funds and designated funds are related to Texas Public Education Grant as provided by the State of Texas.
FN11: Of the net increase of $84,320,210 approximately $95.0 million represents revenues received but not year expended. This income is fully committed to program expenditures and capital disbursements. The remaining $(10.7) million represents non-expendable funds from unrealized gains and additions to permanent endowments of approximately $(24.5) million and $13.8 million respectively. Unrealized gains and additions to permanent endowments do not contribute to the availability of the institution's operating cash as discussed in FN6 and FN7.
Texas Higher Education Coordinating Board 183 June, 2020

The University of Texas Medical Branch at GalvestonFor the Year Ended August 31, 2019Source: FY 2019 Annual Financial Report
Non-operating Funds are not included in charts above. See following page (Summary).May not add to 100% due to rounding.
Total Operating Uses $2,151,327,663
Total Operating Sources $2,320,825,448
Total Operating Sources $2,320,825,448
State of Texas$383,035,096
16%
Student & Parent$44,011,035
2%
Federal Government$132,817,924
6%
Institutional Resources$255,781,518
11%
Hospitals, Clinics, Professional Fees
$1,505,179,87565%
Operating Sources by Category
State Appropriations$372,128,944
16%
State Grants & Contracts
$10,906,1520%
Tuition & Fees$29,189,304, 2%
Federal Grants & Contracts
$145,564,500, 9%
Endowment & Interest Income
$26,827,258, 2%
Local Government Grants
$787,1030%
Private Gifts & Grants$115,146,815
5%
Sales & Services$13,685,165
1%Net Auxiliary Enterprises$14,605,584
1%
Other Income$44,641,159
2%
Professional Fees$217,303,981
9%
Hospitals, Clinics, Professional Fees
$1,287,875,89455%
Operating Sources
Instruction$367,614,547
17%Research
$109,642,787 5%
Public Service$19,200,221
1%
Academic Support$37,626,762
2%
Student Services$6,909,864
0%
Institutional Support$92,403,218
4%
Operations & Maintenance of Plant
$57,135,167 3%
Scholarships & Fellowships$9,277,220
1%
Auxiliary Enterprises$12,878,622
1%
Capital Outlay$46,730,646
2%
Other Expenses$6,337,141
0%
Hospitals & Clinics$1,385,571,468
64%
Operating Uses
Texas Higher Education Coordinating Board 184 June, 2020

The University of Texas Medical Branch at GalvestonFor the Year Ended August 31, 2019Source: FY 2019 Annual Financial Report
Summary Worksheet FY 2019 Amount Per FTSEInstitution State Funded FTSEs 3,729.75
Operating SourcesState of TexasState Appropriations (Includes Research, Patient Care, & Public Service) 372,128,944$ 99,773$ State Grants and Contracts - Restricted 10,906,152 2,924 Higher Education Fund - - Available University Fund Excellence (See FN8) - - Subtotal 383,035,096$ 102,697$
Student & ParentTuition - net 34,751,171$ 9,317$ Fees - net 9,259,864 2,483 Tuition and Fees (net of Scholarship Discounts and Allowances) 44,011,035$ 11,800$
Federal GovernmentFederal Grants and Contracts - Restricted 132,817,924$
Professional FeesAll Sources (Net) 217,303,981$
Hospitals and ClinicsAll Sources (Net) 1,287,875,894$
Institutional ResourcesEndowment and Interest Income (See FN2) 66,915,692$ Local Government Grants - Restricted 787,103 Private Gifts and Grants - Restricted 115,146,815 Sales and Services 13,685,165 Net Auxiliary Enterprises (See FN9) 14,605,584 Other Income (See FN3) 44,641,159 Subtotal 255,781,518$ Total Operating Sources 2,320,825,448$
Operating UsesInstruction 367,614,547$ 98,563$ Research 109,642,787 29,397 Public Service 19,200,221 Hospitals and Clinics 1,385,571,468 Academic Support 37,626,762 10,088 Student Services 6,909,864 1,853 Institutional Support 92,403,218 24,775 Operations and Maintenance of Plant 57,135,167 Scholarships and Fellowships 9,277,220 2,487 Auxiliary Enterprises (See FN9) 12,878,622 Capital Outlay from Current Fund Sources 46,730,646 12,529 Other Expenses (See FN3) 6,337,141 Total Operating Uses 2,151,327,663$ 179,692$
Other Sources / (Uses) of FundsCapital Outlay from Non-Current Fund Sources (206,581,844) Mandatory and Non-mandatory Transfers (See FN10) 683,601 Bond Transfers In (See FN4) 123,142,595 Debt Service Payments (See FN5) (89,465,330) Subtotal (172,220,978)$
Other Items Not for Current Operating UseUnrealized Gains / (Losses) (See FN6) 5,058,277 Additions to Permanent Endowments (See FN7) 3,197,506 Subtotal 8,255,783$
Total Sources Over / (Under) Uses (See FN11) 5,532,590$
Note: Due to the nature of Health-Related Institutions, per FTSE calculations are provided on selected line items.
Texas Higher Education Coordinating Board 185 June, 2020

FY 2019
Operating SourcesEducational &
General DesignatedAuxiliary
EnterprisesRestricted
Expendable Loan Funds
Annuity, Life & Endowment and
Similar FundsUnexpended
PlantRetirement of Indebtedness Investment In Plant Primary University
State of TexasState Appropriations 372,128,944 - - - - - - - - 372,128,944 State Grants and Contracts - Restricted 72,500 - - 10,833,652 - - - - - 10,906,152 Higher Education Fund - - - - - - - - - - Available University Fund Excellence (See FN8) - - - - - - - - - - Subtotal 372,201,444 - - 10,833,652 - - - - - 383,035,096
Student & ParentTuition Potential 100% 14,782,480 24,313,441 - - - - - - - 39,095,921 Waivers - Statutory (Not Reported in AFR) (1,156,553) (1,264) - - - - - - - (1,157,817) Waivers - Institutional (Not Reported in AFR) - - - - - - - - - - Exemptions - Statutory (Not Reported in AFR) - - - - - - - - - - Exemptions - Institutional (Not Reported in AFR) - - - - - - - - - - Tuition - Gross - AFR Presentation 13,625,927 24,312,177 - - - - - - - 37,938,104 Waivers - Statutory (Reported in AFR) - - - - - - - - - - Waivers - Institutional (Reported in AFR) - - - - - - - - - - Exemptions - Statutory (Reported in AFR) (192,005) (480,891) - - - - - - - (672,896) Exemptions - Institutional (Reported in AFR) - - - - - - - - - - All Other Scholarship Disc.& Allow. (See FN1) (1,064,945) (1,449,092) - - - - - - - (2,514,037) Tuition - net 12,368,977 22,382,194 - - - - - - - 34,751,171
Fees Potential 100% 878,661 8,290,861 648,851 - - - - - - 9,818,373 Waivers - Statutory (Not Reported in AFR) - - - - - - - - - - Waivers - Institutional (Not Reported in AFR) - - - - - - - - - - Exemptions - Statutory (Not Reported in AFR) - - - - - - - - - - Exemptions - Institutional (Not Reported in AFR) - - - - - - - - - - Fees - Gross - AFR Presentation 878,661 8,290,861 648,851 - - - - - - 9,818,373 Waivers - Statutory (Reported in AFR) - - - - - - - - - - Waivers - Institutional (Reported in AFR) - - - - - - - - - - Exemptions - Statutory (Reported in AFR) - - - - - - - - - - Exemptions - Institutional (Reported in AFR) - - - - - - - - - - All Other Scholarship Disc.& Allow. (See FN1) (53,550) (494,165) (10,794) - - - - - - (558,509) Fees - net 825,111 7,796,696 638,057 - - - - - - 9,259,864
Net Tuition and Fees (Funds Collected) 13,194,088 30,178,890 638,057 - - - - - - 44,011,035
Federal GovernmentFederal Grants and Contracts - Restricted - 34,146,833 - 97,670,596 - - 1,000,495 - - 132,817,924
Professional FeesAll Sources (Net) - 217,303,981 - - - - - - - 217,303,981
Hospitals and ClinicsAll Sources (Net) 651,569,022 636,306,872 - - - - - - - 1,287,875,894
Institutional ResourcesEndowment and Interest Income (See FN2) 4,755,787 34,389,739 - 26,022,674 104,576 1,642,916 - - - 66,915,692 Local Government Grants - Restricted 15,000 307,283 - 464,820 - - - - - 787,103 Private Gifts and Grants - Restricted 1,543,835 48,107,323 367,510 18,631,664 - - 46,496,483 - - 115,146,815 Sales and Services - Educational Activities (Net) - 2,543,520 - 11,141,645 - - - - - 13,685,165 Net Auxiliary Enterprises (See FN9) - - 14,605,584 - - - - - - 14,605,584 Other Income (See FN3) 27,632,919 19,220,423 - 177,651 (18,341) - 492,661 - (2,864,154) 44,641,159 Subtotal 33,947,541 104,568,288 14,973,094 56,438,454 86,235 1,642,916 46,989,144 - (2,864,154) 255,781,518 Total Operating Sources 1,070,912,095 1,022,504,864 15,611,151 164,942,702 86,235 1,642,916 47,989,639 - (2,864,154) 2,320,825,448
Operating UsesInstruction 84,037,794 268,404,532 - 15,172,221 - - - - - 367,614,547 Research 872,069 16,734,711 - 92,036,007 - - - - - 109,642,787 Public Service 2,318,088 3,996,207 - 12,885,926 - - - - - 19,200,221 Hospitals and Clinics 643,414,696 721,704,193 - 20,452,579 - - - - - 1,385,571,468 Academic Support 22,476,076 14,105,576 - 1,045,110 - - - - - 37,626,762 Student Services 4,308,971 2,024,820 - 576,042 31 - - - - 6,909,864 Institutional Support 61,983,628 27,579,854 - 2,839,736 - - - - - 92,403,218 Operations and Maintenance of Plant 36,850,638 7,859,793 - 3,869,046 - - 8,555,690 - - 57,135,167 Scholarships and Fellowships 72,500 2,133,796 - 7,070,924 - - - - - 9,277,220 Auxiliary Enterprises (See FN9) - 843,082 11,886,796 148,744 - - - - - 12,878,622 Capital Outlay from Current Fund Sources* 3,451,934 38,401,711 49,945 4,827,056 - - - - - 46,730,646 Other Expenses (See FN3) 377,988 4,850,535 - 24,466 1,746,445 - (662,293) - - 6,337,141 Total Operating Uses 860,164,382 1,108,638,810 11,936,741 160,947,857 1,746,476 - 7,893,397 - - 2,151,327,663
Other Sources / (Uses) of FundsCapital Outlay from Non-Current Fund Sources** - - - - - - (206,581,844) - - (206,581,844) Mandatory and Non-mandatory Transfers (See FN10) (68,164,527) 36,176,182 - (4,190,222) (721) 3,406,669 40,864,715 - (7,408,495) 683,601 Bond Transfers In (See FN4) - - - - - - 123,142,595 - - 123,142,595 Debt Service Payments (See FN5) (70,498,715) (7,216,752) (1,391,741) - - - (10,358,122) - - (89,465,330) Subtotal (138,663,242) 28,959,430 (1,391,741) (4,190,222) (721) 3,406,669 (52,932,656) - (7,408,495) (172,220,978)
Other Items Not for Current Operating UseUnrealized Gains / (Losses) (See FN6) 1,043 9,929,100 - - - (4,871,866) - - - 5,058,277 Additions to Permanent Endowments (See FN7) - - - 750,888 - 2,446,618 - - - 3,197,506 Subtotal 1,043 9,929,100 - 750,888 - (2,425,248) - - - 8,255,783
Total Sources Over / (Under) Uses (See FN 11) 72,085,514 (47,245,416) 2,282,669 555,511 (1,660,962) 2,624,337 (12,836,414) - (10,272,649) 5,532,590
Depreciation Expense - - - - - - - - (179,980,597) (179,980,597) Transfer of Capital Asset(s) from System - - - - - - - - - - Other Post-Employment Benefit (OPEB) Expense - - - - - - - - - - Non-Cash Capital Gifts - - - - - - - - - - Capital Outlay - - - - - - - - 253,312,490 253,312,490 Change in Net Assets (Total Agrees with AFR***) 72,085,514 (47,245,416) 2,282,669 555,511 (1,660,962) 2,624,337 (12,836,414) - 63,059,244 78,864,483
*Defined as any capital outlay expenses from Educational & General, Designated, Auxiliary, or Restricted Expendable Funds.**Defined as any capital outlay expense from funds other than Educational & General, Designated, Auxiliary, or Restricted Expendable.***As reported for "Changes in Net Position" shown on Schedule of Revenues, Expenses, and Changes in Net Position (SRECNP) in Annual Financial Report.
The University of Texas Medical Branch at GalvestonFor the Year Ended August 31, 2019Source: FY 2019 Annual Financial Report
Detail Worksheet FY 2019
Texas Higher Education Coordinating Board 186 June, 2020

The University of Texas Medical Branch at GalvestonFor the Year Ended August 31, 2019Source: FY 2019 Annual Financial Report
FOOTNOTES:
FN1: Scholarship Discounts and Allowances are scholarships, fellowships, and grants applied to tuition. The discount eliminates tuition revenues that are paid for by University resources which are recorded as revenue elsewhere on the financial statements (i.e. federal and state contracts and grants revenues). In addition, Scholarship Discounts and Allowances eliminate tuition revenue that is exempted from payment due to tuition exemptions approved by the Texas Legislature. Waivers, remissions, and exemptions represent tuition and fee dollars forgone by the university - some are required by statute. See the Integrated Financial Reporting System (IFRS) report submitted to THECB for details on waivers, exemptions, tuition, and fees. Allocation methods to individual funds shown may vary between institutions.
FN2: Endowment and Interest Income includes interest income and endowment payouts.
FN3: Other Income is primarily Other Operating and Other Non-operating Revenues from the AFR. Other Expenses is primarily Other Nonoperating Expenses from the AFR.
FN4: Bond Proceeds are funds received from the sale of bonds and commercial paper used to finance capital projects. This amount includes actual proceeds and accrued or anticipated proceeds to be transferred from System. Independent institutions report only to the extent expended in current year.
FN5: Debt service payments are payments to service and retire debt issued to fund capital projects. System components do this via transfers to System Administrations. Independent institutions use direct payment to appropriate paying agents.
FN6: Unrealized Gains / (Losses) represent the increase in the Fair Market Value of Investments and Endowments. Unrealized Gains / (Losses) are accrued as non-cash transactions. Therefore, funds are not actually received for this revenue stream. Accordingly, this revenue is not cash revenue and cannot be used by the University to fund operations.
FN7: Additions to Permanent Endowments are additions to endowment principal. This revenue is restricted for investment purposes only and cannot be used to fund operations. Only interest income from these endowments, which is reported on the Endowment and Investment Income line of this report, can be used by the University to fund operations.
FN8: Distributions from the Available University Fund appropriated through the Appropriation Bill are first used to pay debt service costs on Permanent University Fund Bonds. Funds remaining are distributed to constitutionally designated institutions to promote academic excellence. Only the Excellence funding is shown at the institution level. The AUF funds used to pay debt service on PUF bonds are reported at the System level.
FN9: Auxiliary Enterprises include athletics, housing and food, student services, and parking and transportation. Auxiliary Enterprises are required to be self-supporting, and therefore must operate on the funds they generate.
FN10: Mandatory and non-mandatory transfers includes transfers between funds, transfers between the University System and institutions and transfers to and from other state agencies. In total, all transfers between funds net to zero with the exception of any amounts transferred between the University System, between other institutions, or to and from another state agency. There are no transfers of education and general funds provided by the State of Texas to restricted or auxiliary fund groups. Transfers between education and general funds and designated funds are related to Texas Public Education Grant as provided by the State of Texas.
FN11: Of the net increase of $5,532,590 approximately $(2.7) million represents revenues received but not year expended. This income is fully committed to program expenditures and capital disbursements. The remaining $8.3 million represents non-expendable funds from unrealized gains and additions to permanent endowments of approximately $5.1 million and $3.2 million respectively. Unrealized gains and additions to permanent endowments do not contribute to the availability of the institution's operating cash as discussed in FN6 and FN7.
Texas Higher Education Coordinating Board 187 June, 2020

The University of Texas Health Science Center at HoustonFor the Year Ended August 31, 2019Source: FY 2019 Annual Financial Report
Non-operating Funds are not included in charts above. See following page (Summary).May not add to 100% due to rounding.
Total Operating Uses $1,661,947,432
Total Operating Sources $1,770,393,889
Total Operating Sources $1,770,393,889
State of Texas$239,773,203
14%
Student & Parent$59,692,493
3%
Federal Government$160,012,077
9%
Institutional Resources$852,883,127
48%
Hospitals, Clinics, Professional Fees
$458,032,98926%
Operating Sources by Category
State Appropriations$216,669,543
12% State Grants & Contracts
$23,103,6601%
Tuition & Fees$59,692,493
4%
Federal Grants & Contracts
$160,012,0779%
Endowment & Interest Income
$67,099,4244%
Local Government Grants
$480,170,47827%
Private Gifts & Grants$164,737,366
9%
Sales & Services$39,268,166
2%
Net Auxiliary Enterprises$27,154,291
2%
Other Income$74,453,402
4%
Professional Fees$383,487,265
22%
Hospitals, Clinics, Professional Fees
$74,545,7244%
Operating Sources
Instruction$745,849,630
45%
Research$204,772,052
12%
Public Service$33,696,444
2%
Academic Support$56,879,367
3%
Student Services$10,531,009
1%Institutional Support
$76,655,2594%
Operations & Maintenance of Plant
$43,659,0443%
Scholarships & Fellowships$10,570,159
1%Auxiliary Enterprises
$17,498,9421%
Capital Outlay$13,256,663
1%Other Expenses$41,500
0%Hospitals & Clinics
$448,537,36327%
Operating Uses
Texas Higher Education Coordinating Board 188 June, 2020

The University of Texas Health Science Center at HoustonFor the Year Ended August 31, 2019Source: FY 2019 Annual Financial Report
Summary Worksheet FY 2019 Amount Per FTSEInstitution State Funded FTSEs 4,927.42
Operating SourcesState of TexasState Appropriations (Includes Research, Patient Care, & Public Service) 216,669,543$ 43,972$ State Grants and Contracts - Restricted 23,103,660 4,689 Higher Education Fund - - Available University Fund Excellence (See FN8) - - Subtotal 239,773,203$ 48,661$
Student & ParentTuition - net 47,083,017$ 9,555$ Fees - net 12,609,476 2,559 Tuition and Fees (net of Scholarship Discounts and Allowances) 59,692,493$ 12,114$
Federal GovernmentFederal Grants and Contracts - Restricted 160,012,077$
Professional FeesAll Sources (Net) 383,487,265$
Hospitals and ClinicsAll Sources (Net) 74,545,724$
Institutional ResourcesEndowment and Interest Income (See FN2) 67,099,424$ Local Government Grants - Restricted 480,170,478 Private Gifts and Grants - Restricted 164,737,366 Sales and Services 39,268,166 Net Auxiliary Enterprises (See FN9) 27,154,291 Other Income (See FN3) 74,453,402 Subtotal 852,883,127$ Total Operating Sources 1,770,393,889$
Operating UsesInstruction 745,849,630$ 151,367$ Research 204,772,052 41,558 Public Service 33,696,444 Hospitals and Clinics 448,537,363 Academic Support 56,879,367 11,543 Student Services 10,531,009 2,137 Institutional Support 76,655,259 15,557 Operations and Maintenance of Plant 43,659,044 Scholarships and Fellowships 10,570,159 2,145 Auxiliary Enterprises (See FN9) 17,498,942 Capital Outlay from Current Fund Sources 13,256,663 2,690 Other Expenses (See FN3) 41,500 Total Operating Uses 1,661,947,432$ 226,997$
Other Sources / (Uses) of FundsCapital Outlay from Non-Current Fund Sources (62,744,532) Mandatory and Non-mandatory Transfers (See FN10) 2,737,029 Bond Transfers In (See FN4) 39,887,601 Debt Service Payments (See FN5) (32,452,538) Subtotal (52,572,440)$
Other Items Not for Current Operating UseUnrealized Gains / (Losses) (See FN6) (3,486,190) Additions to Permanent Endowments (See FN7) 24,176,513 Subtotal 20,690,323$
Total Sources Over / (Under) Uses (See FN11) 76,564,340$
Note: Due to the nature of Health-Related Institutions, per FTSE calculations are provided on selected line items.
Texas Higher Education Coordinating Board 189 June, 2020

FY 2019
Operating SourcesEducational &
General DesignatedAuxiliary
EnterprisesRestricted
Expendable Loan Funds
Annuity, Life & Endowment and
Similar FundsUnexpended
PlantRetirement of Indebtedness
Investment In Plant Primary University
State of TexasState Appropriations 216,669,543 - - - - - - - - 216,669,543 State Grants and Contracts - Restricted 7,290,660 417,076 - 15,395,924 - - - - - 23,103,660 Higher Education Fund - - - - - - - - - - Available University Fund Excellence (See FN8) - - - - - - - - - - Subtotal 223,960,203 417,076 - 15,395,924 - - - - - 239,773,203
Student & ParentTuition Potential 100% 31,730,849 23,634,392 - - - - - - - 55,365,241 Waivers - Statutory (Not Reported in AFR) (7,040,461) (69,988) - - - - - - - (7,110,449) Waivers - Institutional (Not Reported in AFR) - - - - - - - - - - Exemptions - Statutory (Not Reported in AFR) - - - - - - - - - - Exemptions - Institutional (Not Reported in AFR) - - - - - - - - - - Tuition - Gross - AFR Presentation 24,690,388 23,564,404 - - - - - - - 48,254,792 Waivers - Statutory (Reported in AFR) - - - - - - - - - - Waivers - Institutional (Reported in AFR) - - - - - - - - - - Exemptions - Statutory (Reported in AFR) (230,446) (166,083) - - - - - - - (396,529) Exemptions - Institutional (Reported in AFR) - - - - - - - - - - All Other Scholarship Disc.& Allow. (See FN1) (344,568) (430,678) - - - - - - - (775,246) Tuition - net 24,115,374 22,967,643 - - - - - - - 47,083,017
Fees Potential 100% 194,341 10,283,441 2,371,829 - - - - - - 12,849,611 Waivers - Statutory (Not Reported in AFR) - - - - - - - - - - Waivers - Institutional (Not Reported in AFR) - - - - - - - - - - Exemptions - Statutory (Not Reported in AFR) - - - - - - - - - - Exemptions - Institutional (Not Reported in AFR) - - - - - - - - - - Fees - Gross - AFR Presentation 194,341 10,283,441 2,371,829 - - - - - - 12,849,611 Waivers - Statutory (Reported in AFR) - - - - - - - - - - Waivers - Institutional (Reported in AFR) - - - - - - - - - - Exemptions - Statutory (Reported in AFR) - (185,338) (18,491) - - - - - - (203,829) Exemptions - Institutional (Reported in AFR) - - - - - - - - - - All Other Scholarship Disc.& Allow. (See FN1) - - (36,306) - - - - - - (36,306) Fees - net 194,341 10,098,103 2,317,032 - - - - - - 12,609,476
Net Tuition and Fees (Funds Collected) 24,309,715 33,065,746 2,317,032 - - - - - - 59,692,493
Federal GovernmentFederal Grants and Contracts - Restricted - 39,926,087 - 120,085,990 - - - - - 160,012,077
Professional FeesAll Sources (Net) - 383,487,265 - - - - - - - 383,487,265
Hospitals and ClinicsAll Sources (Net) 48,238,176 26,307,548 - - - - - - - 74,545,724
Institutional ResourcesEndowment and Interest Income (See FN2) 3,568,749 37,763,457 993,791 22,796,100 172,897 676,840 1,127,590 - - 67,099,424 Local Government Grants - Restricted - 461,676,663 - 18,493,815 - - - - - 480,170,478 Private Gifts and Grants - Restricted - 74,010,003 - 90,727,363 - - - - - 164,737,366 Sales and Services - Educational Activities (Net) 8,854,749 15,878,673 - 14,534,744 - - - - - 39,268,166 Net Auxiliary Enterprises (See FN9) - - 27,154,291 - - - - - - 27,154,291 Other Income (See FN3) 120,017 73,496,251 - 1,005,552 320,230 - - - (488,648) 74,453,402 Subtotal 12,543,515 662,825,047 28,148,082 147,557,574 493,127 676,840 1,127,590 - (488,648) 852,883,127 Total Operating Sources 309,051,609 1,146,028,769 30,465,114 283,039,488 493,127 676,840 1,127,590 - (488,648) 1,770,393,889
Operating UsesInstruction 108,447,086 627,961,447 - 9,441,097 - - - - - 745,849,630 Research 22,903,383 26,572,829 - 155,295,840 - - - - - 204,772,052 Public Service 200,438 3,147,497 - 30,348,509 - - - - - 33,696,444 Hospitals and Clinics 58,737,470 377,077,045 - 12,722,848 - - - - - 448,537,363 Academic Support 28,528,052 25,570,294 - 2,781,021 - - - - - 56,879,367 Student Services 2,484,954 6,485,007 - 1,488,292 72,756 - - - - 10,531,009 Institutional Support 36,263,304 38,036,444 - 2,355,511 - - - - - 76,655,259 Operations and Maintenance of Plant 20,179,600 16,644,532 - 274,242 - - 6,560,670 - - 43,659,044 Scholarships and Fellowships 89,530 3,322,976 - 7,157,653 - - - - - 10,570,159 Auxiliary Enterprises (See FN9) - - 17,498,942 - - - - - - 17,498,942 Capital Outlay from Current Fund Sources* 212,338 9,104,180 149,339 3,790,806 - - - - - 13,256,663 Other Expenses (See FN3) - - - - 41,500 - - - - 41,500 Total Operating Uses 278,046,155 1,133,922,251 17,648,281 225,655,819 114,256 - 6,560,670 - - 1,661,947,432
Other Sources / (Uses) of FundsCapital Outlay from Non-Current Fund Sources** - - - - - - (62,744,532) - - (62,744,532) Mandatory and Non-mandatory Transfers (See FN10) (3,032,466) 50,988,704 3,285,768 (55,576,124) - 913,063 6,293,136 - (135,052) 2,737,029 Bond Transfers In (See FN4) - - - - - - 39,887,601 - - 39,887,601 Debt Service Payments (See FN5) (18,748,850) (8,735,451) (4,968,237) - - - - - - (32,452,538) Subtotal (21,781,316) 42,253,253 (1,682,469) (55,576,124) - 913,063 (16,563,795) - (135,052) (52,572,440)
Other Items Not for Current Operating UseUnrealized Gains / (Losses) (See FN6) - (1,186,032) - 765 - (2,300,923) - - - (3,486,190) Additions to Permanent Endowments (See FN7) - - - - - 24,176,513 - - - 24,176,513 Subtotal - (1,186,032) - 765 - 21,875,590 - - - 20,690,323
Total Sources Over / (Under) Uses (See FN 11) 9,224,138 53,173,739 11,134,364 1,808,310 378,871 23,465,493 (21,996,875) - (623,700) 76,564,340
Depreciation Expense - - - - - - - - (68,136,691) (68,136,691) Transfer of Capital Asset(s) from System - - - - - - - - - - Other Post-Employment Benefit (OPEB) Expense - - - - - - - - - - Non-Cash Capital Gifts - - - - - - - - - - Capital Outlay - - - - - - - - 76,001,194 76,001,194 Change in Net Assets (Total Agrees with AFR***) 9,224,138 53,173,739 11,134,364 1,808,310 378,871 23,465,493 (21,996,875) - 7,240,803 84,428,843
*Defined as any capital outlay expenses from Educational & General, Designated, Auxiliary, or Restricted Expendable Funds.**Defined as any capital outlay expense from funds other than Educational & General, Designated, Auxiliary, or Restricted Expendable.***As reported for "Changes in Net Position" shown on Schedule of Revenues, Expenses, and Changes in Net Position (SRECNP) in Annual Financial Report.
The University of Texas Health Science Center at HoustonFor the Year Ended August 31, 2019Source: FY 2019 Annual Financial Report
Detail Worksheet FY 2019
Texas Higher Education Coordinating Board 190 June, 2020

The University of Texas Health Science Center at HoustonFor the Year Ended August 31, 2019Source: FY 2019 Annual Financial Report
FOOTNOTES:
FN1: Scholarship Discounts and Allowances are scholarships, fellowships, and grants applied to tuition. The discount eliminates tuition revenues that are paid for by University resources which are recorded as revenue elsewhere on the financial statements (i.e. federal and state contracts and grants revenues). In addition, Scholarship Discounts and Allowances eliminate tuition revenue that is exempted from payment due to tuition exemptions approved by the Texas Legislature. Waivers, remissions, and exemptions represent tuition and fee dollars forgone by the university - some are required by statute. See the Integrated Financial Reporting System (IFRS) report submitted to THECB for details on waivers, exemptions, tuition, and fees. Allocation methods to individual funds shown may vary between institutions.
FN2: Endowment and Interest Income includes interest income and endowment payouts.
FN3: Other Income is primarily Other Operating and Other Non-operating Revenues from the AFR. Other Expenses is primarily Other Nonoperating Expenses from the AFR.
FN4: Bond Proceeds are funds received from the sale of bonds and commercial paper used to finance capital projects. This amount includes actual proceeds and accrued or anticipated proceeds to be transferred from System. Independent institutions report only to the extent expended in current year.
FN5: Debt service payments are payments to service and retire debt issued to fund capital projects. System components do this via transfers to System Administrations. Independent institutions use direct payment to appropriate paying agents.
FN6: Unrealized Gains / (Losses) represent the increase in the Fair Market Value of Investments and Endowments. Unrealized Gains / (Losses) are accrued as non-cash transactions. Therefore, funds are not actually received for this revenue stream. Accordingly, this revenue is not cash revenue and cannot be used by the University to fund operations.
FN7: Additions to Permanent Endowments are additions to endowment principal. This revenue is restricted for investment purposes only and cannot be used to fund operations. Only interest income from these endowments, which is reported on the Endowment and Investment Income line of this report, can be used by the University to fund operations.
FN8: Distributions from the Available University Fund appropriated through the Appropriation Bill are first used to pay debt service costs on Permanent University Fund Bonds. Funds remaining are distributed to constitutionally designated institutions to promote academic excellence. Only the Excellence funding is shown at the institution level. The AUF funds used to pay debt service on PUF bonds are reported at the System level.
FN9: Auxiliary Enterprises include athletics, housing and food, student services, and parking and transportation. Auxiliary Enterprises are required to be self-supporting, and therefore must operate on the funds they generate.
FN10: Mandatory and non-mandatory transfers includes transfers between funds, transfers between the University System and institutions and transfers to and from other state agencies. In total, all transfers between funds net to zero with the exception of any amounts transferred between the University System, between other institutions, or to and from another state agency. There are no transfers of education and general funds provided by the State of Texas to restricted or auxiliary fund groups. Transfers between education and general funds and designated funds are related to Texas Public Education Grant as provided by the State of Texas.
FN11: Of the net increase of $76,564,340 approximately $55.9 million represents revenues received but not year expended. This income is fully committed to program expenditures and capital disbursements. The remaining $20.7 million represents non-expendable funds from unrealized gains and additions to permanent endowments of approximately $(3.5) million and $24.2 million respectively. Unrealized gains and additions to permanent endowments do not contribute to the availability of the institution's operating cash as discussed in FN6 and FN7.
Texas Higher Education Coordinating Board 191 June, 2020

The University of Texas Health Science Center at San AntonioFor the Year Ended August 31, 2019Source: FY 2019 Annual Financial Report
Non-operating Funds are not included in charts above. See following page (Summary).May not add to 100% due to rounding.
Total Operating Uses $903,662,866
Total Operating Sources $941,090,299
Total Operating Sources $941,090,299
State of Texas$187,156,458
20%
Student & Parent$48,740,553
5%
Federal Government$122,197,469
13%Institutional Resources
$342,825,95236%
Hospitals, Clinics, Professional Fees
$240,169,86726%
Operating Sources by Category
State Appropriations$172,544,762
18%State Grants &
Contracts$14,611,696
2%
Tuition & Fees$48,740,553
5%
Federal Grants & Contracts
$122,197,46913%
Endowment & Interest Income
$48,386,2545%
Local Government Grants
$182,382,41219%
Private Gifts & Grants$40,311,369
4%
Sales & Services$41,387,632
4%
Net Auxiliary Enterprises$5,270,528
1%
Other Income$25,087,757
3%
Professional Fees$240,169,867
26%
Hospitals, Clinics, Professional Fees
$00%
Operating Sources
Instruction$419,188,827
46%
Research$136,963,943
15%
Public Service$42,922,577
5%
Academic Support$46,407,373
5%Student Services
$2,250,8350%
Institutional Support$47,374,795
5%Operations &
Maintenance of Plant$36,651,386
4%Scholarships &
Fellowships$7,392,271
1%Auxiliary Enterprises
$5,671,5551%
Capital Outlay$22,684,971
3%
Other Expenses$221,407
0%
Hospitals & Clinics$135,932,926
15%
Operating Uses
Texas Higher Education Coordinating Board 192 June, 2020

The University of Texas Health Science Center at San AntonioFor the Year Ended August 31, 2019Source: FY 2019 Annual Financial Report
Summary Worksheet FY 2019 Amount Per FTSEInstitution State Funded FTSEs 3,698.82
Operating SourcesState of TexasState Appropriations (Includes Research, Patient Care, & Public Service) 172,544,762$ 46,649$ State Grants and Contracts - Restricted 14,611,696 3,950 Higher Education Fund - - Available University Fund Excellence (See FN8) - - Subtotal 187,156,458$ 50,599$
Student & ParentTuition - net 46,124,568$ 12,470$ Fees - net 2,615,985 707 Tuition and Fees (net of Scholarship Discounts and Allowances) 48,740,553$ 13,177$
Federal GovernmentFederal Grants and Contracts - Restricted 122,197,469$
Professional FeesAll Sources (Net) 240,169,867$
Hospitals and ClinicsAll Sources (Net) -$
Institutional ResourcesEndowment and Interest Income (See FN2) 48,386,254$ Local Government Grants - Restricted 182,382,412 Private Gifts and Grants - Restricted 40,311,369 Sales and Services 41,387,632 Net Auxiliary Enterprises (See FN9) 5,270,528 Other Income (See FN3) 25,087,757 Subtotal 342,825,952$ Total Operating Sources 941,090,299$
Operating UsesInstruction 419,188,827$ 113,330$ Research 136,963,943 37,029 Public Service 42,922,577 Hospitals and Clinics 135,932,926 Academic Support 46,407,373 12,547 Student Services 2,250,835 609 Institutional Support 47,374,795 12,808 Operations and Maintenance of Plant 36,651,386 Scholarships and Fellowships 7,392,271 1,999 Auxiliary Enterprises (See FN9) 5,671,555 Capital Outlay from Current Fund Sources 22,684,971 6,133 Other Expenses (See FN3) 221,407 Total Operating Uses 903,662,866$ 184,455$
Other Sources / (Uses) of FundsCapital Outlay from Non-Current Fund Sources (75,832,188) Mandatory and Non-mandatory Transfers (See FN10) 1,438,193 Bond Transfers In (See FN4) 57,337,188 Debt Service Payments (See FN5) (30,486,216) Subtotal (47,543,023)$
Other Items Not for Current Operating UseUnrealized Gains / (Losses) (See FN6) 4,240,196 Additions to Permanent Endowments (See FN7) 23,221,398 Subtotal 27,461,594$
Total Sources Over / (Under) Uses (See FN11) 17,346,004$
Note: Due to the nature of Health-Related Institutions, per FTSE calculations are provided on selected line items.
Texas Higher Education Coordinating Board 193 June, 2020

FY 2019
Operating SourcesEducational &
General DesignatedAuxiliary
EnterprisesRestricted
Expendable Loan Funds
Annuity, Life & Endowment and
Similar FundsUnexpended
PlantRetirement of Indebtedness
Investment In Plant Primary University
State of TexasState Appropriations 172,544,762 - - - - - - - - 172,544,762 State Grants and Contracts - Restricted 2,275,626 1,731,922 - 10,604,148 - - - - - 14,611,696 Higher Education Fund - - - - - - - - - - Available University Fund Excellence (See FN8) - - - - - - - - - - Subtotal 174,820,388 1,731,922 - 10,604,148 - - - - - 187,156,458
Student & ParentTuition Potential 100% 20,900,129 32,478,780 - - - - - - - 53,378,909 Waivers - Statutory (Not Reported in AFR) (4,691,375) - - - - - - - - (4,691,375) Waivers - Institutional (Not Reported in AFR) - - - - - - - - - - Exemptions - Statutory (Not Reported in AFR) - - - - - - - - - - Exemptions - Institutional (Not Reported in AFR) - - - - - - - - - - Tuition - Gross - AFR Presentation 16,208,754 32,478,780 - - - - - - - 48,687,534 Waivers - Statutory (Reported in AFR) - - - - - - - - - - Waivers - Institutional (Reported in AFR) - - - - - - - - - - Exemptions - Statutory (Reported in AFR) (1,271,030) - - - - - - - - (1,271,030) Exemptions - Institutional (Reported in AFR) - - - - - - - - - - All Other Scholarship Disc.& Allow. (See FN1) (1,291,936) - - - - - - - - (1,291,936) Tuition - net 13,645,788 32,478,780 - - - - - - - 46,124,568
Fees Potential 100% - - 2,900,760 - - - - - - 2,900,760 Waivers - Statutory (Not Reported in AFR) - - - - - - - - - - Waivers - Institutional (Not Reported in AFR) - - - - - - - - - - Exemptions - Statutory (Not Reported in AFR) - - - - - - - - - - Exemptions - Institutional (Not Reported in AFR) - - - - - - - - - - Fees - Gross - AFR Presentation - - 2,900,760 - - - - - - 2,900,760 Waivers - Statutory (Reported in AFR) - - - - - - - - - - Waivers - Institutional (Reported in AFR) - - - - - - - - - - Exemptions - Statutory (Reported in AFR) (141,226) - - - - - - - - (141,226) Exemptions - Institutional (Reported in AFR) - - - - - - - - - - All Other Scholarship Disc.& Allow. (See FN1) (143,549) - - - - - - - - (143,549) Fees - net (284,775) - 2,900,760 - - - - - - 2,615,985
Net Tuition and Fees (Funds Collected) 13,361,013 32,478,780 2,900,760 - - - - - - 48,740,553
Federal GovernmentFederal Grants and Contracts - Restricted - 27,132,808 - 95,064,661 - - - - - 122,197,469
Professional FeesAll Sources (Net) - 240,169,867 - - - - - - - 240,169,867
Hospitals and ClinicsAll Sources (Net) - - - - - - - - - -
Institutional ResourcesEndowment and Interest Income (See FN2) 200,692 34,453,341 - 13,633,021 5,370 93,830 - - - 48,386,254 Local Government Grants - Restricted - 179,836,776 - 2,545,636 - - - - - 182,382,412 Private Gifts and Grants - Restricted - 4,528,282 - 35,623,899 - - 159,188 - - 40,311,369 Sales and Services - Educational Activities (Net) 5,535,131 13,587,045 - 22,265,456 - - - - - 41,387,632 Net Auxiliary Enterprises (See FN9) - - 5,270,528 - - - - - - 5,270,528 Other Income (See FN3) 1,741 28,320,258 - 906,591 106,226 - - - (4,247,059) 25,087,757 Subtotal 5,737,564 260,725,702 5,270,528 74,974,603 111,596 93,830 159,188 - (4,247,059) 342,825,952 Total Operating Sources 193,918,965 562,239,079 8,171,288 180,643,412 111,596 93,830 159,188 - (4,247,059) 941,090,299
Operating UsesInstruction 101,022,481 301,577,752 - 16,588,594 - - - - - 419,188,827 Research 12,607,141 20,008,327 - 104,348,475 - - - - - 136,963,943 Public Service - 5,011,761 - 37,910,816 - - - - - 42,922,577 Hospitals and Clinics - 135,850,010 - 82,916 - - - - - 135,932,926 Academic Support 35,266,859 9,632,625 - 1,507,889 - - - - - 46,407,373 Student Services 1,806,373 280,017 - 940 163,505 - - - - 2,250,835 Institutional Support 29,038,966 17,488,491 - 847,338 - - - - - 47,374,795 Operations and Maintenance of Plant 16,242,089 18,164,600 - 13,470 - - 2,231,227 - - 36,651,386 Scholarships and Fellowships 1,587,597 2,668,368 - 3,136,306 - - - - - 7,392,271 Auxiliary Enterprises (See FN9) - - 5,671,555 - - - - - - 5,671,555 Capital Outlay from Current Fund Sources* 1,616,765 10,250,017 1,633,197 9,184,992 - - - - - 22,684,971 Other Expenses (See FN3) - 221,407 - - - - - - - 221,407 Total Operating Uses 199,188,271 521,153,375 7,304,752 173,621,736 163,505 - 2,231,227 - - 903,662,866
Other Sources / (Uses) of FundsCapital Outlay from Non-Current Fund Sources** - - - - - - (75,832,188) - - (75,832,188) Mandatory and Non-mandatory Transfers (See FN10) 21,146,659 (30,558,252) (427,401) (9,026,140) 2,115 6,138,389 13,756,399 - 406,424 1,438,193 Bond Transfers In (See FN4) - - - - - - 57,337,188 - - 57,337,188 Debt Service Payments (See FN5) (15,895,862) (13,173,887) (1,416,467) - - - - - - (30,486,216) Subtotal 5,250,797 (43,732,139) (1,843,868) (9,026,140) 2,115 6,138,389 (4,738,601) - 406,424 (47,543,023)
Other Items Not for Current Operating UseUnrealized Gains / (Losses) (See FN6) - 4,010,799 - 1,549,187 22,465 (1,342,255) - - - 4,240,196 Additions to Permanent Endowments (See FN7) - - - 3,591,812 - 19,629,586 - - - 23,221,398 Subtotal - 4,010,799 - 5,140,999 22,465 18,287,331 - - - 27,461,594
Total Sources Over / (Under) Uses (See FN 11) (18,509) 1,364,364 (977,332) 3,136,535 (27,329) 24,519,550 (6,810,640) - (3,840,635) 17,346,004
Depreciation Expense - - - - - - - - (58,318,282) (58,318,282) Transfer of Capital Asset(s) from System - - - - - - - - - - Other Post-Employment Benefit (OPEB) Expense - - - - - - - - - - Non-Cash Capital Gifts - - - - - - - - 64,927 64,927 Capital Outlay - - - - - - - - 98,517,159 98,517,159 Change in Net Assets (Total Agrees with AFR***) (18,509) 1,364,364 (977,332) 3,136,535 (27,329) 24,519,550 (6,810,640) - 36,423,169 57,609,808
*Defined as any capital outlay expenses from Educational & General, Designated, Auxiliary, or Restricted Expendable Funds.**Defined as any capital outlay expense from funds other than Educational & General, Designated, Auxiliary, or Restricted Expendable.***As reported for "Changes in Net Position" shown on Schedule of Revenues, Expenses, and Changes in Net Position (SRECNP) in Annual Financial Report.
The University of Texas Health Science Center at San AntonioFor the Year Ended August 31, 2019Source: FY 2019 Annual Financial Report
Detail Worksheet FY 2019
Texas Higher Education Coordinating Board 194 June, 2020

The University of Texas Health Science Center at San AntonioFor the Year Ended August 31, 2019Source: FY 2019 Annual Financial Report FOOTNOTES:
FN1: Scholarship Discounts and Allowances are scholarships, fellowships, and grants applied to tuition. The discount eliminates tuition revenues that are paid for by University resources which are recorded as revenue elsewhere on the financial statements (i.e. federal and state contracts and grants revenues). In addition, Scholarship Discounts and Allowances eliminate tuition revenue that is exempted from payment due to tuition exemptions approved by the Texas Legislature. Waivers, remissions, and exemptions represent tuition and fee dollars forgone by the university - some are required by statute. See the Integrated Financial Reporting System (IFRS) report submitted to THECB for details on waivers, exemptions, tuition, and fees. Allocation methods to individual funds shown may vary between institutions.
FN2: Endowment and Interest Income includes interest income and endowment payouts.
FN3: Other Income is primarily Other Operating and Other Non-operating Revenues from the AFR. Other Expenses is primarily Other Nonoperating Expenses from the AFR.
FN4: Bond Proceeds are funds received from the sale of bonds and commercial paper used to finance capital projects. This amount includes actual proceeds and accrued or anticipated proceeds to be transferred from System. Independent institutions report only to the extent expended in current year.
FN5: Debt service payments are payments to service and retire debt issued to fund capital projects. System components do this via transfers to System Administrations. Independent institutions use direct payment to appropriate paying agents.
FN6: Unrealized Gains / (Losses) represent the increase in the Fair Market Value of Investments and Endowments. Unrealized Gains / (Losses) are accrued as non-cash transactions. Therefore, funds are not actually received for this revenue stream. Accordingly, this revenue is not cash revenue and cannot be used by the University to fund operations.
FN7: Additions to Permanent Endowments are additions to endowment principal. This revenue is restricted for investment purposes only and cannot be used to fund operations. Only interest income from these endowments, which is reported on the Endowment and Investment Income line of this report, can be used by the University to fund operations.
FN8: Distributions from the Available University Fund appropriated through the Appropriation Bill are first used to pay debt service costs on Permanent University Fund Bonds. Funds remaining are distributed to constitutionally designated institutions to promote academic excellence. Only the Excellence funding is shown at the institution level. The AUF funds used to pay debt service on PUF bonds are reported at the System level.
FN9: Auxiliary Enterprises include athletics, housing and food, student services, and parking and transportation. Auxiliary Enterprises are required to be self-supporting, and therefore must operate on the funds they generate.
FN10: Mandatory and non-mandatory transfers includes transfers between funds, transfers between the University System and institutions and transfers to and from other state agencies. In total, all transfers between funds net to zero with the exception of any amounts transferred between the University System, between other institutions, or to and from another state agency. There are no transfers of education and general funds provided by the State of Texas to restricted or auxiliary fund groups. Transfers between education and general funds and designated funds are related to Texas Public Education Grant as provided by the State of Texas.
FN11: Of the net increase of $17,346,004 approximately $(10.1) million represents revenues received but not year expended. This income is fully committed to program expenditures and capital disbursements. The remaining $27.5 million represents non-expendable funds from unrealized gains and additions to permanent endowments of approximately $4.2 million and $23.2 million respectively. Unrealized gains and additions to permanent endowments do not contribute to the availability of the institution's operating cash as discussed in FN6 and FN7.
Texas Higher Education Coordinating Board 195 June, 2020

The University of Texas M.D. Anderson Cancer CenterFor the Year Ended August 31, 2019Source: FY 2019 Annual Financial Report
Non-operating Funds are not included in charts above. See following page (Summary).May not add to 100% due to rounding.
Total Operating Uses $4,727,216,928
Total Operating Sources $5,805,710,590
Total Operating Sources $5,805,710,590
State of Texas$255,054,303
4%
Student & Parent$1,815,921
0%
Federal Government$209,539,413
4%
Institutional Resources$765,460,665
13%
Hospitals, Clinics, Professional Fees
$4,573,840,28879%
Operating Sources by Category
State Appropriations$209,733,573
4%
State Grants & Contracts
$45,320,7301%
Tuition & Fees$599,819, 0%
Federal Grants & Contracts
$193,841,961, 7%Endowment & Interest
Income$57,917,314, 2%
Private Gifts & Grants$180,582,064, 6%
Sales & Services$1,813,222, 0%
Net Auxiliary Enterprises$45,855,795
1%
Other Income$153,006,444
3%Professional Fees
$451,272,4218%
Hospitals, Clinics, Professional Fees
$4,122,567,86771%
Operating Sources
Instruction$79,836,560
2%Research
$784,212,60117%
Public Service$22,931,878
0%
Academic Support$155,871,136
3%
Student Services$624,298
0%
Institutional Support$177,650,583
4%
Operations & Maintenance of Plant
$224,596,1685%
Scholarships & Fellowships$2,902,703
0%
Auxiliary Enterprises$25,365,457
1%
Capital Outlay$164,748,432
3%
Other Expenses$151,659
0%
Hospitals & Clinics$3,088,325,453
65%
Operating Uses
Texas Higher Education Coordinating Board 196 June, 2020

The University of Texas M.D. Anderson Cancer CenterFor the Year Ended August 31, 2019Source: FY 2019 Annual Financial Report
Summary Worksheet FY 2019 Amount Per FTSEInstitution State Funded FTSEs 404.86
Operating SourcesState of Texas See Note BelowState Appropriations (Includes Research, Patient Care, & Public Service) 209,733,573$ State Grants and Contracts - Restricted 45,320,730 Higher Education Fund - Available University Fund Excellence (See FN8) - Subtotal 255,054,303$
Student & ParentTuition - net 1,464,398$ Fees - net 351,523 Tuition and Fees (net of Scholarship Discounts and Allowances) 1,815,921$
Federal GovernmentFederal Grants and Contracts - Restricted 209,539,413$
Professional FeesAll Sources (Net) 451,272,421$
Hospitals and ClinicsAll Sources (Net) 4,122,567,867$
Institutional ResourcesEndowment and Interest Income (See FN2) 301,369,140$ Local Government Grants - Restricted - Private Gifts and Grants - Restricted 262,511,150 Sales and Services 2,718,136 Net Auxiliary Enterprises (See FN9) 45,855,795 Other Income (See FN3) 153,006,444 Subtotal 765,460,665$ Total Operating Sources 5,805,710,590$
Operating UsesInstruction 79,836,560$ Research 784,212,601 Public Service 22,931,878 Hospitals and Clinics 3,088,325,453 Academic Support 155,871,136 Student Services 624,298 Institutional Support 177,650,583 Operations and Maintenance of Plant 224,596,168 Scholarships and Fellowships 2,902,703 Auxiliary Enterprises (See FN9) 25,365,457 Capital Outlay from Current Fund Sources 164,748,432 Other Expenses (See FN3) 151,659 Total Operating Uses 4,727,216,928$
Other Sources / (Uses) of FundsCapital Outlay from Non-Current Fund Sources (301,441,114) Mandatory and Non-mandatory Transfers (See FN10) 64,289,470 Bond Transfers In (See FN4) 59,191,248 Debt Service Payments (See FN5) (101,458,032) Subtotal (279,418,428)$
Other Items Not for Current Operating UseUnrealized Gains / (Losses) (See FN6) 73,571,995 Additions to Permanent Endowments (See FN7) 15,423,613 Subtotal 88,995,608$
Total Sources Over / (Under) Uses (See FN11) 888,070,842$
Note: Due to the nature of M.D. Anderson's operations and the small number of students, no per student amounts were calculated.
Texas Higher Education Coordinating Board 197 June, 2020

FY 2019
Operating SourcesEducational &
General DesignatedAuxiliary
EnterprisesRestricted
Expendable Loan Funds
Annuity, Life & Endowment and
Similar FundsUnexpended
PlantRetirement of Indebtedness
Investment In Plant Primary University
State of TexasState Appropriations 209,733,573 - - - - - - - - 209,733,573 State Grants and Contracts - Restricted 96,049 1,971,113 - 43,253,568 - - - - - 45,320,730 Higher Education Fund - - - - - - - - - - Available University Fund Excellence (See FN8) - - - - - - - - - - Subtotal 209,829,622 1,971,113 - 43,253,568 - - - - - 255,054,303
Student & ParentTuition Potential 100% 1,133,233 623,388 - - - - - - - 1,756,621 Waivers - Statutory (Not Reported in AFR) (268,800) - - - - - - - - (268,800) Waivers - Institutional (Not Reported in AFR) - - - - - - - - - - Exemptions - Statutory (Not Reported in AFR) - - - - - - - - - - Exemptions - Institutional (Not Reported in AFR) - - - - - - - - - - Tuition - Gross - AFR Presentation 864,433 623,388 - - - - - - - 1,487,821 Waivers - Statutory (Reported in AFR) - - - - - - - - - - Waivers - Institutional (Reported in AFR) - - - - - - - - - - Exemptions - Statutory (Reported in AFR) (11,650) - - - - - - - - (11,650) Exemptions - Institutional (Reported in AFR) - (11,773) - - - - - - - (11,773) All Other Scholarship Disc.& Allow. (See FN1) - - - - - - - - - - Tuition - net 852,783 611,615 - - - - - - - 1,464,398
Fees Potential 100% - 357,519 - - - - - - - 357,519 Waivers - Statutory (Not Reported in AFR) - - - - - - - - - - Waivers - Institutional (Not Reported in AFR) - - - - - - - - - - Exemptions - Statutory (Not Reported in AFR) - - - - - - - - - - Exemptions - Institutional (Not Reported in AFR) - - - - - - - - - - Fees - Gross - AFR Presentation - 357,519 - - - - - - - 357,519 Waivers - Statutory (Reported in AFR) - - - - - - - - - - Waivers - Institutional (Reported in AFR) - - - - - - - - - - Exemptions - Statutory (Reported in AFR) - - - - - - - - - - Exemptions - Institutional (Reported in AFR) - (5,996) - - - - - - - (5,996) All Other Scholarship Disc.& Allow. (See FN1) - - - - - - - - - - Fees - net - 351,523 - - - - - - - 351,523
Net Tuition and Fees (Funds Collected) 852,783 963,138 - - - - - - - 1,815,921
Federal GovernmentFederal Grants and Contracts - Restricted - 58,936,415 - 150,602,998 - - - - - 209,539,413
Professional FeesAll Sources (Net) - 451,272,421 - - - - - - - 451,272,421
Hospitals and ClinicsAll Sources (Net) 4,122,567,867 - - - - - - - - 4,122,567,867
Institutional ResourcesEndowment and Interest Income (See FN2) 117,240,401 155,767,740 - 28,260,783 - 100,216 - - - 301,369,140 Local Government Grants - Restricted - - - - - - - - - - Private Gifts and Grants - Restricted - 52,686,171 - 209,135,776 - - 689,203 - - 262,511,150 Sales and Services - Educational Activities (Net) - 2,718,136 - - - - - - - 2,718,136 Net Auxiliary Enterprises (See FN9) - - 45,855,795 - - - - - - 45,855,795 Other Income (See FN3) 22,060,756 127,028,424 - 3,657,975 - - - - 259,289 153,006,444 Subtotal 139,301,157 338,200,471 45,855,795 241,054,534 - 100,216 689,203 - 259,289 765,460,665 Total Operating Sources 4,472,551,429 851,343,558 45,855,795 434,911,100 - 100,216 689,203 - 259,289 5,805,710,590
Operating UsesInstruction 73,596,775 3,349,583 - 2,890,202 - - - - - 79,836,560 Research 216,905,341 123,730,017 - 443,577,243 - - - - - 784,212,601 Public Service 3,259,093 7,823,470 - 11,849,315 - - - - - 22,931,878 Hospitals and Clinics 2,529,837,902 553,219,861 - 5,267,690 - - - - - 3,088,325,453 Academic Support 152,136,140 2,632,708 - 1,102,288 - - - - - 155,871,136 Student Services 624,298 - - - - - - - - 624,298 Institutional Support 145,269,311 28,484,302 - 3,896,970 - - - - - 177,650,583 Operations and Maintenance of Plant 224,253,814 292,551 - 49,803 - - - - - 224,596,168 Scholarships and Fellowships 96,049 836,636 - 1,970,018 - - - - - 2,902,703 Auxiliary Enterprises (See FN9) - - 25,365,457 - - - - - - 25,365,457 Capital Outlay from Current Fund Sources* 140,234,032 14,584,180 171,811 9,758,409 - - - - - 164,748,432 Other Expenses (See FN3) 131,867 19,792 - - - - - - - 151,659 Total Operating Uses 3,486,344,622 734,973,100 25,537,268 480,361,938 - - - - - 4,727,216,928
Other Sources / (Uses) of FundsCapital Outlay from Non-Current Fund Sources** - - - - - - (301,441,114) - - (301,441,114) Mandatory and Non-mandatory Transfers (See FN10) (176,047,983) 5,971,486 (3,705,769) 1,639,328 - 5,392,037 232,652,990 - (1,612,619) 64,289,470 Bond Transfers In (See FN4) - - - - - - 59,191,248 - - 59,191,248 Debt Service Payments (See FN5) (91,938,940) - (9,519,092) - - - - - - (101,458,032) Subtotal (267,986,923) 5,971,486 (13,224,861) 1,639,328 - 5,392,037 (9,596,876) - (1,612,619) (279,418,428)
Other Items Not for Current Operating UseUnrealized Gains / (Losses) (See FN6) 68,810,273 13,888,473 - - - (9,126,751) - - - 73,571,995 Additions to Permanent Endowments (See FN7) - - - (480,998) - 15,904,611 - - - 15,423,613 Subtotal 68,810,273 13,888,473 - (480,998) - 6,777,860 - - - 88,995,608
Total Sources Over / (Under) Uses (See FN 11) 787,030,157 136,230,417 7,093,666 (44,292,508) - 12,270,113 (8,907,673) - (1,353,330) 888,070,842
Depreciation Expense (300,168) - - - - - - - (360,757,722) (361,057,890) Transfer of Capital Asset(s) from System - - - - - - - - - - Other Post-Employment Benefit (OPEB) Expense - - - - - - - - - - Non-Cash Capital Gifts - - - - - - - - 149,000 149,000 Capital Outlay - - - - - - - - 466,189,546 466,189,546 Change in Net Assets (Total Agrees with AFR***) 786,729,989 136,230,417 7,093,666 (44,292,508) - 12,270,113 (8,907,673) - 104,227,494 993,351,498
*Defined as any capital outlay expenses from Educational & General, Designated, Auxiliary, or Restricted Expendable Funds.**Defined as any capital outlay expense from funds other than Educational & General, Designated, Auxiliary, or Restricted Expendable.***As reported for "Changes in Net Position" shown on Schedule of Revenues, Expenses, and Changes in Net Position (SRECNP) in Annual Financial Report.
The University of Texas M.D. Anderson Cancer CenterFor the Year Ended August 31, 2019Source: FY 2019 Annual Financial Report
Detail Worksheet FY 2019
Texas Higher Education Coordinating Board 198 June, 2020

The University of Texas M.D. Anderson Cancer CenterFor the Year Ended August 31, 2019Source: FY 2019 Annual Financial Report
FOOTNOTES:
FN1: Scholarship Discounts and Allowances are scholarships, fellowships, and grants applied to tuition. The discount eliminates tuition revenues that are paid for by University resources which are recorded as revenue elsewhere on the financial statements (i.e. federal and state contracts and grants revenues). In addition, Scholarship Discounts and Allowances eliminate tuition revenue that is exempted from payment due to tuition exemptions approved by the Texas Legislature. Waivers, remissions, and exemptions represent tuition and fee dollars forgone by the university - some are required by statute. See the Integrated Financial Reporting System (IFRS) report submitted to THECB for details on waivers, exemptions, tuition, and fees. Allocation methods to individual funds shown may vary between institutions.
FN2: Endowment and Interest Income includes interest income and endowment payouts.
FN3: Other Income is primarily Other Operating and Other Non-operating Revenues from the AFR. Other Expenses is primarily Other Nonoperating Expenses from the AFR.
FN4: Bond Proceeds are funds received from the sale of bonds and commercial paper used to finance capital projects. This amount includes actual proceeds and accrued or anticipated proceeds to be transferred from System. Independent institutions report only to the extent expended in current year.
FN5: Debt service payments are payments to service and retire debt issued to fund capital projects. System components do this via transfers to System Administrations. Independent institutions use direct payment to appropriate paying agents.
FN6: Unrealized Gains / (Losses) represent the increase in the Fair Market Value of Investments and Endowments. Unrealized Gains / (Losses) are accrued as non-cash transactions. Therefore, funds are not actually received for this revenue stream. Accordingly, this revenue is not cash revenue and cannot be used by the University to fund operations.
FN7: Additions to Permanent Endowments are additions to endowment principal. This revenue is restricted for investment purposes only and cannot be used to fund operations. Only interest income from these endowments, which is reported on the Endowment and Investment Income line of this report, can be used by the University to fund operations.
FN8: Distributions from the Available University Fund appropriated through the Appropriation Bill are first used to pay debt service costs on Permanent University Fund Bonds. Funds remaining are distributed to constitutionally designated institutions to promote academic excellence. Only the Excellence funding is shown at the institution level. The AUF funds used to pay debt service on PUF bonds are reported at the System level.
FN9: Auxiliary Enterprises include athletics, housing and food, student services, and parking and transportation. Auxiliary Enterprises are required to be self-supporting, and therefore must operate on the funds they generate.
FN10: Mandatory and non-mandatory transfers includes transfers between funds, transfers between the University System and institutions and transfers to and from other state agencies. In total, all transfers between funds net to zero with the exception of any amounts transferred between the University System, between other institutions, or to and from another state agency. There are no transfers of education and general funds provided by the State of Texas to restricted or auxiliary fund groups. Transfers between education and general funds and designated funds are related to Texas Public Education Grant as provided by the State of Texas.
FN11: Of the net increase of $888,070,842 approximately $799.1 million represents revenues received but not year expended. This income is fully committed to program expenditures and capital disbursements. The remaining $89.0 million represents non-expendable funds from unrealized gains and additions to permanent endowments of approximately $73.6 million and $15.4 million respectively. Unrealized gains and additions to permanent endowments do not contribute to the availability of the institution's operating cash as discussed in FN6 and FN7.
Texas Higher Education Coordinating Board 199 June, 2020

The University of Texas Health Science Center at TylerFor the Year Ended August 31, 2019Source: FY 2019 Annual Financial Report
Non-operating Funds are not included in charts above. See following page (Summary).May not add to 100% due to rounding.
Total Operating Uses $186,745,865
Total Operating Sources $193,466,695
Total Operating Sources $193,466,695
State of Texas$58,139,906
30%
Student & Parent$262,489
0%
Federal Government$9,442,610
5%
Institutional Resources$53,014,955
27%
Hospitals, Clinics, Professional Fees
$72,606,73538%
Operating Sources by Category
State Appropriations$52,557,483
27%
State Grants & Contracts$5,582,423
3% Tuition & Fees$262,489
0%
Federal Grants & Contracts$9,442,610
5%
Endowment & Interest Income
$3,801,8842%
Local Government Grants
$00%Private Gifts & Grants
$12,084,9716%
Sales & Services$4,885,476
2%
Net Auxiliary Enterprises
$160,1790%
Other Income$32,082,445
17%
Professional Fees$16,788,466
9%
Hospitals, Clinics, Professional Fees
$55,818,26929%
Operating Sources
Instruction$18,611,945
10%Research
$15,200,7218%
Academic Support$1,559,384
1%
Institutional Support$11,652,614
6%
Operations & Maintenance of Plant
$10,092,1096%
Scholarships & Fellowships
$47,1400%
Auxiliary Enterprises$154,824
0%
Capital Outlay$1,912,897
1%
Other Expenses$48,500
0%
Hospitals & Clinics$127,363,322
68%
Operating Uses
Texas Higher Education Coordinating Board 200 June, 2020
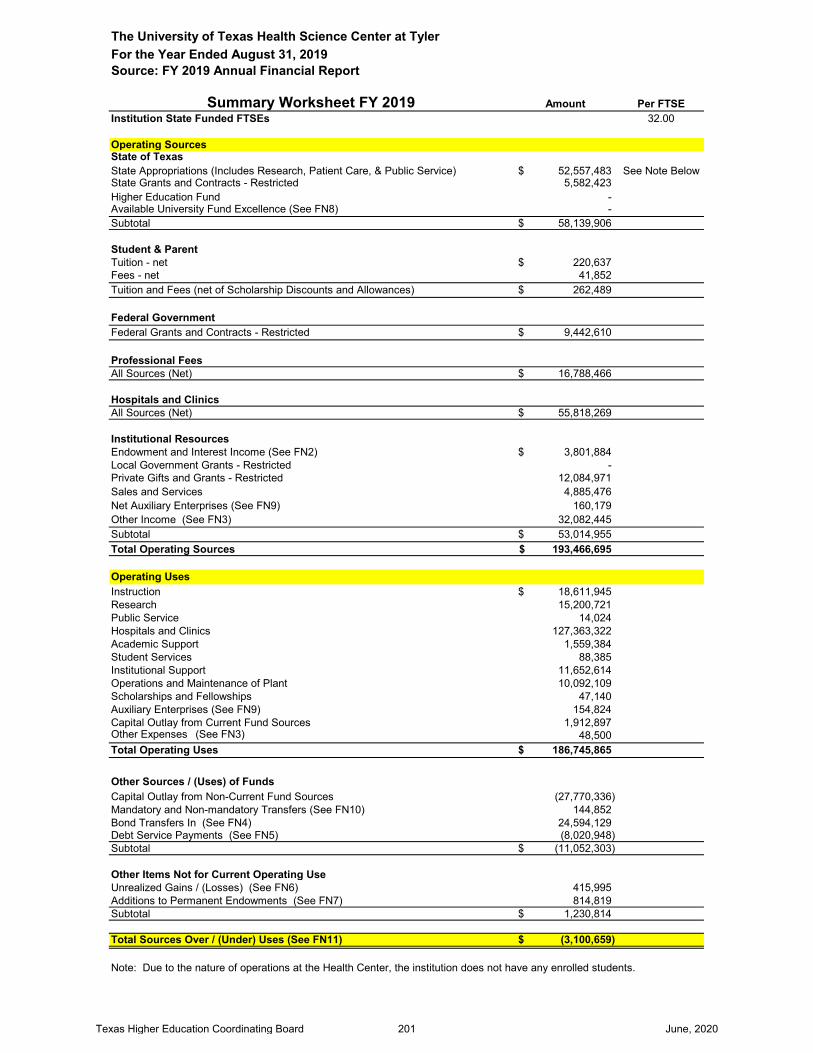
The University of Texas Health Science Center at TylerFor the Year Ended August 31, 2019Source: FY 2019 Annual Financial Report
Summary Worksheet FY 2019 Amount Per FTSEInstitution State Funded FTSEs 32.00
Operating SourcesState of TexasState Appropriations (Includes Research, Patient Care, & Public Service) 52,557,483$ See Note BelowState Grants and Contracts - Restricted 5,582,423 Higher Education Fund - Available University Fund Excellence (See FN8) - Subtotal 58,139,906$
Student & ParentTuition - net 220,637$ Fees - net 41,852 Tuition and Fees (net of Scholarship Discounts and Allowances) 262,489$
Federal GovernmentFederal Grants and Contracts - Restricted 9,442,610$
Professional FeesAll Sources (Net) 16,788,466$
Hospitals and ClinicsAll Sources (Net) 55,818,269$
Institutional ResourcesEndowment and Interest Income (See FN2) 3,801,884$ Local Government Grants - Restricted - Private Gifts and Grants - Restricted 12,084,971 Sales and Services 4,885,476 Net Auxiliary Enterprises (See FN9) 160,179 Other Income (See FN3) 32,082,445 Subtotal 53,014,955$ Total Operating Sources 193,466,695$
Operating UsesInstruction 18,611,945$ Research 15,200,721 Public Service 14,024 Hospitals and Clinics 127,363,322 Academic Support 1,559,384 Student Services 88,385 Institutional Support 11,652,614 Operations and Maintenance of Plant 10,092,109 Scholarships and Fellowships 47,140 Auxiliary Enterprises (See FN9) 154,824 Capital Outlay from Current Fund Sources 1,912,897 Other Expenses (See FN3) 48,500 Total Operating Uses 186,745,865$
Other Sources / (Uses) of FundsCapital Outlay from Non-Current Fund Sources (27,770,336) Mandatory and Non-mandatory Transfers (See FN10) 144,852 Bond Transfers In (See FN4) 24,594,129 Debt Service Payments (See FN5) (8,020,948) Subtotal (11,052,303)$
Other Items Not for Current Operating UseUnrealized Gains / (Losses) (See FN6) 415,995 Additions to Permanent Endowments (See FN7) 814,819 Subtotal 1,230,814$
Total Sources Over / (Under) Uses (See FN11) (3,100,659)$
Note: Due to the nature of operations at the Health Center, the institution does not have any enrolled students.
Texas Higher Education Coordinating Board 201 June, 2020

FY 2019
Operating SourcesEducational &
General DesignatedAuxiliary
EnterprisesRestricted
Expendable Loan Funds
Annuity, Life & Endowment and
Similar FundsUnexpended
PlantRetirement of Indebtedness
Investment In Plant Primary University
State of TexasState Appropriations 52,557,483 - - - - - - - - 52,557,483 State Grants and Contracts - Restricted - 843,473 - 4,738,950 - - - - - 5,582,423 Higher Education Fund - - - - - - - - - - Available University Fund Excellence (See FN8) - - - - - - - - - - Subtotal 52,557,483 843,473 - 4,738,950 - - - - - 58,139,906
Student & ParentTuition Potential 100% 97,095 123,542 - - - - - - - 220,637 Waivers - Statutory (Not Reported in AFR) - - - - - - - - - - Waivers - Institutional (Not Reported in AFR) - - - - - - - - - - Exemptions - Statutory (Not Reported in AFR) - - - - - - - - - - Exemptions - Institutional (Not Reported in AFR) - - - - - - - - - - Tuition - Gross - AFR Presentation 97,095 123,542 - - - - - - - 220,637 Waivers - Statutory (Reported in AFR) - - - - - - - - - - Waivers - Institutional (Reported in AFR) - - - - - - - - - - Exemptions - Statutory (Reported in AFR) - - - - - - - - - - Exemptions - Institutional (Reported in AFR) - - - - - - - - - - All Other Scholarship Disc.& Allow. (See FN1) - - - - - - - - - - Tuition - net 97,095 123,542 - - - - - - - 220,637
Fees Potential 100% 1,378 40,474 - - - - - - - 41,852 Waivers - Statutory (Not Reported in AFR) - - - - - - - - - - Waivers - Institutional (Not Reported in AFR) - - - - - - - - - - Exemptions - Statutory (Not Reported in AFR) - - - - - - - - - - Exemptions - Institutional (Not Reported in AFR) - - - - - - - - - - Fees - Gross - AFR Presentation 1,378 40,474 - - - - - - - 41,852 Waivers - Statutory (Reported in AFR) - - - - - - - - - - Waivers - Institutional (Reported in AFR) - - - - - - - - - - Exemptions - Statutory (Reported in AFR) - - - - - - - - - - Exemptions - Institutional (Reported in AFR) - - - - - - - - - - All Other Scholarship Disc.& Allow. (See FN1) - - - - - - - - - - Fees - net 1,378 40,474 - - - - - - - 41,852
Net Tuition and Fees (Funds Collected) 98,473 164,016 - - - - - - - 262,489
Federal GovernmentFederal Grants and Contracts - Restricted - 1,802,936 - 7,639,674 - - - - - 9,442,610
Professional FeesAll Sources (Net) - 16,788,466 - - - - - - - 16,788,466
Hospitals and ClinicsAll Sources (Net) 55,818,269 - - - - - - - - 55,818,269
Institutional ResourcesEndowment and Interest Income (See FN2) 19,488 3,096,264 - 686,132 - - - - - 3,801,884 Local Government Grants - Restricted - - - - - - - - - - Private Gifts and Grants - Restricted 1,730,181 4,209,771 - 5,809,746 - - 335,273 - - 12,084,971 Sales and Services - Educational Activities (Net) 1,250,001 3,272,819 - 362,656 - - - - - 4,885,476 Net Auxiliary Enterprises (See FN9) - - 160,179 - - - - - - 160,179 Other Income (See FN3) 666,576 31,368,731 - 39,569 - - - - 7,569 32,082,445 Subtotal 3,666,246 41,947,585 160,179 6,898,103 - - 335,273 - 7,569 53,014,955 Total Operating Sources 112,140,471 61,546,476 160,179 19,276,727 - - 335,273 - 7,569 193,466,695
Operating UsesInstruction 9,076,221 3,341,797 - 6,193,927 - - - - - 18,611,945 Research 5,346,577 2,094,157 - 7,759,987 - - - - - 15,200,721 Public Service - - - 14,024 - - - - - 14,024 Hospitals and Clinics 96,076,425 29,148,232 - 2,138,665 - - - - - 127,363,322 Academic Support 1,502,827 18,219 - 38,338 - - - - - 1,559,384 Student Services - 88,385 - - - - - - - 88,385 Institutional Support 9,332,587 2,139,183 - 180,844 - - - - - 11,652,614 Operations and Maintenance of Plant 8,783,774 - - - - - 1,308,335 - - 10,092,109 Scholarships and Fellowships - - - 47,140 - - - - - 47,140 Auxiliary Enterprises (See FN9) - - 154,824 - - - - - - 154,824 Capital Outlay from Current Fund Sources* 1,474,717 21,587 - 416,593 - - - - - 1,912,897 Other Expenses (See FN3) 48,500 - - - - - - - - 48,500 Total Operating Uses 131,641,628 36,851,560 154,824 16,789,518 - - 1,308,335 - - 186,745,865
Other Sources / (Uses) of FundsCapital Outlay from Non-Current Fund Sources** - - - - - - (27,770,336) - - (27,770,336) Mandatory and Non-mandatory Transfers (See FN10) 27,458,447 (27,116,019) 2,231 (2,749,067) - 87,502 2,529,180 - (67,422) 144,852 Bond Transfers In (See FN4) - - - - - - 24,594,129 - - 24,594,129 Debt Service Payments (See FN5) (7,318,204) - - - - - (702,744) - - (8,020,948) Subtotal 20,140,243 (27,116,019) 2,231 (2,749,067) - 87,502 (1,349,771) - (67,422) (11,052,303)
Other Items Not for Current Operating UseUnrealized Gains / (Losses) (See FN6) 20,495 512,582 - (51,857) - (65,225) - - - 415,995 Additions to Permanent Endowments (See FN7) - - - - - 814,819 - - - 814,819 Subtotal 20,495 512,582 - (51,857) - 749,594 - - - 1,230,814
Total Sources Over / (Under) Uses (See FN 11) 659,581 (1,908,521) 7,586 (313,715) - 837,096 (2,322,833) - (59,853) (3,100,659)
Depreciation Expense - - - - - - - - (14,948,198) (14,948,198) Transfer of Capital Asset(s) from System - - - - - - - - - - Other Post-Employment Benefit (OPEB) Expense - - - - - - - - - - Non-Cash Capital Gifts - - - - - - - - 10 10 Capital Outlay - - - - - - - - 29,683,233 29,683,233 Change in Net Assets (Total Agrees with AFR***) 659,581 (1,908,521) 7,586 (313,715) - 837,096 (2,322,833) - 14,675,192 11,634,386
*Defined as any capital outlay expenses from Educational & General, Designated, Auxiliary, or Restricted Expendable Funds.**Defined as any capital outlay expense from funds other than Educational & General, Designated, Auxiliary, or Restricted Expendable.***As reported for "Changes in Net Position" shown on Schedule of Revenues, Expenses, and Changes in Net Position (SRECNP) in Annual Financial Report.
The University of Texas Health Science Center at TylerFor the Year Ended August 31, 2019Source: FY 2019 Annual Financial Report
Detail Worksheet FY 2019
Texas Higher Education Coordinating Board 202 June, 2020

The University of Texas Health Science Center at TylerFor the Year Ended August 31, 2019Source: FY 2019 Annual Financial Report
FOOTNOTES:
FN1: Scholarship Discounts and Allowances are scholarships, fellowships, and grants applied to tuition. The discount eliminates tuition revenues that are paid for by University resources which are recorded as revenue elsewhere on the financial statements (i.e. federal and state contracts and grants revenues). In addition, Scholarship Discounts and Allowances eliminate tuition revenue that is exempted from payment due to tuition exemptions approved by the Texas Legislature. Waivers, remissions, and exemptions represent tuition and fee dollars forgone by the university - some are required by statute. See the Integrated Financial Reporting System (IFRS) report submitted to THECB for details on waivers, exemptions, tuition, and fees. Allocation methods to individual funds shown may vary between institutions.
FN2: Endowment and Interest Income includes interest income and endowment payouts.
FN3: Other Income is primarily Other Operating and Other Non-operating Revenues from the AFR. Other Expenses is primarily Other Nonoperating Expenses from the AFR.
FN4: Bond Proceeds are funds received from the sale of bonds and commercial paper used to finance capital projects. This amount includes actual proceeds and accrued or anticipated proceeds to be transferred from System. Independent institutions report only to the extent expended in current year.
FN5: Debt service payments are payments to service and retire debt issued to fund capital projects. System components do this via transfers to System Administrations. Independent institutions use direct payment to appropriate paying agents.
FN6: Unrealized Gains / (Losses) represent the increase in the Fair Market Value of Investments and Endowments. Unrealized Gains / (Losses) are accrued as non-cash transactions. Therefore, funds are not actually received for this revenue stream. Accordingly, this revenue is not cash revenue and cannot be used by the University to fund operations.
FN7: Additions to Permanent Endowments are additions to endowment principal. This revenue is restricted for investment purposes only and cannot be used to fund operations. Only interest income from these endowments, which is reported on the Endowment and Investment Income line of this report, can be used by the University to fund operations.
FN8: Distributions from the Available University Fund appropriated through the Appropriation Bill are first used to pay debt service costs on Permanent University Fund Bonds. Funds remaining are distributed to constitutionally designated institutions to promote academic excellence. Only the Excellence funding is shown at the institution level. The AUF funds used to pay debt service on PUF bonds are reported at the System level.
FN9: Auxiliary Enterprises include athletics, housing and food, student services, and parking and transportation. Auxiliary Enterprises are required to be self-supporting, and therefore must operate on the funds they generate.
FN10: Mandatory and non-mandatory transfers includes transfers between funds, transfers between the University System and institutions and transfers to and from other state agencies. In total, all transfers between funds net to zero with the exception of any amounts transferred between the University System, between other institutions, or to and from another state agency. There are no transfers of education and general funds provided by the State of Texas to restricted or auxiliary fund groups. Transfers between education and general funds and designated funds are related to Texas Public Education Grant as provided by the State of Texas.
FN11. N/A
Texas Higher Education Coordinating Board 203 June, 2020

Texas A&M University System Health Science CenterFor the Year Ended August 31, 2019Source: FY 2019 Annual Financial Report
Non-operating Funds are not included in charts above. See following page (Summary).May not add to 100% due to rounding.
Total Operating Uses $296,776,799
Total Operating Sources $383,562,689
Total Operating Sources $383,562,689
State of Texas$223,252,666
58%
Student & Parent$40,213,693
11%
Federal Government$42,724,142
11%
Institutional Resources$77,372,188
20%
Operating Sources by Category
State Appropriations$163,778,712
43%
State Grants & Contracts$6,723,954
2%Available University
Fund Excellence$52,750,000
14%
Tuition & Fees$40,213,693
11%
Federal Grants & Contracts
$42,724,14211%
Endowment & Interest Income
$13,096,4563%
Private Gifts & Grants$13,029,610
3%
Sales & Services$39,554,422
10%
Net Auxiliary Enterprises$1,696,704
0% Other Income$9,994,996
3%
Operating Sources
Instruction$122,154,593
41%
Research$70,031,164
24%
Public Service$10,477,296
3%Academic Support
$38,603,78213%
Student Services$4,431,302
1%
Institutional Support$13,475,633
5%Operations &
Maintenance of Plant$22,772,248
8%
Scholarships & Fellowships$2,395,759
1%Auxiliary Enterprises$2,627,315
1%
Capital Outlay$6,553,841
2%
Other Expenses$3,253,866
1%
Operating Uses
Texas Higher Education Coordinating Board 204 June, 2020

Texas A&M University System Health Science CenterFor the Year Ended August 31, 2019Source: FY 2019 Annual Financial Report
Summary Worksheet FY 2019 Amount Per FTSEInstitution State Funded FTSEs 3,187.53
Operating SourcesState of TexasState Appropriations (Includes Research, Patient Care, & Public Service) 163,778,712$ 51,381$ State Grants and Contracts - Restricted 6,723,954 2,109 Higher Education Fund - - Available University Fund Excellence (See FN8) 52,750,000 16,549 Subtotal 223,252,666$ 70,039$
Student & ParentTuition - net 26,257,324$ 8,238$ Fees - net 13,956,369 4,378 Tuition and Fees (net of Scholarship Discounts and Allowances) 40,213,693$ 12,616$
Federal GovernmentFederal Grants and Contracts - Restricted 42,724,142$
Professional FeesAll Sources (Net) -$
Hospitals and ClinicsAll Sources (Net) -$
Institutional ResourcesEndowment and Interest Income (See FN2) 13,096,456$ Local Government Grants - Restricted - Private Gifts and Grants - Restricted 13,029,610 Sales and Services 39,554,422 Net Auxiliary Enterprises (See FN9) 1,696,704 Other Income (See FN3) 9,994,996 Subtotal 77,372,188$ Total Operating Sources 383,562,689$
Operating UsesInstruction 122,154,593$ 38,323$ Research 70,031,164 21,970 Public Service 10,477,296 Hospitals and Clinics - Academic Support 38,603,782 12,111 Student Services 4,431,302 1,390 Institutional Support 13,475,633 4,228 Operations and Maintenance of Plant 22,772,248 Scholarships and Fellowships 2,395,759 752 Auxiliary Enterprises (See FN9) 2,627,315 Capital Outlay from Current Fund Sources 6,553,841 2,056 Other Expenses (See FN3) 3,253,866 Total Operating Uses 296,776,799$ 80,830$
Other Sources / (Uses) of FundsCapital Outlay from Non-Current Fund Sources - Mandatory and Non-mandatory Transfers (See FN10) 5,539,314 Bond Transfers In (See FN4) - Debt Service Payments (See FN5) (21,638,037) Subtotal (16,098,723)$
Other Items Not for Current Operating UseUnrealized Gains / (Losses) (See FN6) (3,687,788) Additions to Permanent Endowments (See FN7) 3,215 Subtotal (3,684,573)$
Total Sources Over / (Under) Uses (See FN11) 67,002,594$
Note: Due to the nature of Health-Related Institutions, per FTSE calculations are provided on selected line items.
Texas Higher Education Coordinating Board 205 June, 2020

FY 2019
Operating SourcesEducational &
General DesignatedAuxiliary
EnterprisesRestricted
Expendable Loan Funds
Annuity, Life & Endowment and
Similar FundsUnexpended
PlantRetirement of Indebtedness
Investment In Plant Primary University
State of TexasState Appropriations 163,778,712 - - - - - - - - 163,778,712 State Grants and Contracts - Restricted 551,262 378,391 - 5,794,301 - - - - - 6,723,954 Higher Education Fund - - - - - - - - - - Available University Fund Excellence (See FN8) - 52,750,000 - - - - - - - 52,750,000 Subtotal 164,329,974 53,128,391 - 5,794,301 - - - - - 223,252,666
Student & ParentTuition Potential 100% 20,431,621 10,904,937 - - - - - - - 31,336,558 Waivers - Statutory (Not Reported in AFR) (2,621,494) - - - - - - - - (2,621,494) Waivers - Institutional (Not Reported in AFR) - - - - - - - - - - Exemptions - Statutory (Not Reported in AFR) - - - - - - - - - - Exemptions - Institutional (Not Reported in AFR) - - - - - - - - - - Tuition - Gross - AFR Presentation 17,810,127 10,904,937 - - - - - - - 28,715,064 Waivers - Statutory (Reported in AFR) - - - - - - - - - - Waivers - Institutional (Reported in AFR) - - - - - - - - - - Exemptions - Statutory (Reported in AFR) (296,807) (246,233) - - - - - - - (543,040) Exemptions - Institutional (Reported in AFR) - - - - - - - - - - All Other Scholarship Disc.& Allow. (See FN1) (1,227,573) (687,127) - - - - - - - (1,914,700) Tuition - net 16,285,747 9,971,577 - - - - - - - 26,257,324
Fees Potential 100% 64,061 13,978,924 1,219,729 - - - - - - 15,262,714 Waivers - Statutory (Not Reported in AFR) - - - - - - - - - - Waivers - Institutional (Not Reported in AFR) - - - - - - - - - - Exemptions - Statutory (Not Reported in AFR) - - - - - - - - - - Exemptions - Institutional (Not Reported in AFR) - - - - - - - - - - Fees - Gross - AFR Presentation 64,061 13,978,924 1,219,729 - - - - - - 15,262,714 Waivers - Statutory (Reported in AFR) - - - - - - - - - - Waivers - Institutional (Reported in AFR) - - - - - - - - - - Exemptions - Statutory (Reported in AFR) (972) (267,977) (37,112) - - - - - - (306,061) Exemptions - Institutional (Reported in AFR) - - - - - - - - - - All Other Scholarship Disc.& Allow. (See FN1) (4,511) (928,488) (67,285) - - - - - - (1,000,284) Fees - net 58,578 12,782,459 1,115,332 - - - - - - 13,956,369
Net Tuition and Fees (Funds Collected) 16,344,325 22,754,036 1,115,332 - - - - - - 40,213,693
Federal GovernmentFederal Grants and Contracts - Restricted - 10,029,931 - 32,694,211 - - - - - 42,724,142
Professional FeesAll Sources (Net) - - - - - - - - - -
Hospitals and ClinicsAll Sources (Net) - - - - - - - - - -
Institutional ResourcesEndowment and Interest Income (See FN2) 2,646,605 9,642,167 - 280,194 37,110 490,380 - - - 13,096,456 Local Government Grants - Restricted - - - - - - - - - - Private Gifts and Grants - Restricted - 1,332,559 - 11,697,051 - - - - - 13,029,610 Sales and Services - Educational Activities (Net) 8,411,901 31,126,048 - 16,473 - - - - - 39,554,422 Net Auxiliary Enterprises (See FN9) - - 1,696,704 - - - - - - 1,696,704 Other Income (See FN3) - 9,463,467 40,810 730,351 99,044 - - - (338,676) 9,994,996 Subtotal 11,058,506 51,564,241 1,737,514 12,724,069 136,154 490,380 - - (338,676) 77,372,188 Total Operating Sources 191,732,805 137,476,599 2,852,846 51,212,581 136,154 490,380 - - (338,676) 383,562,689
Operating UsesInstruction 88,728,852 31,086,734 - 2,339,007 - - - - - 122,154,593 Research 15,189,283 12,804,175 - 42,037,706 - - - - - 70,031,164 Public Service 2,808,101 5,572,553 - 2,096,642 - - - - - 10,477,296 Hospitals and Clinics - - - - - - - - - - Academic Support 27,961,196 10,092,977 - 549,609 - - - - - 38,603,782 Student Services 3,270,629 1,078,920 - 80,870 883 - - - - 4,431,302 Institutional Support 11,910,244 1,516,776 - 48,613 - - - - - 13,475,633 Operations and Maintenance of Plant 12,077,243 10,872,533 - (9,278) - - (168,250) - - 22,772,248 Scholarships and Fellowships 263,952 1,647,368 - 484,439 - - - - - 2,395,759 Auxiliary Enterprises (See FN9) - - 2,627,315 - - - - - - 2,627,315 Capital Outlay from Current Fund Sources* 380,935 4,961,044 - 1,211,862 - - - - - 6,553,841 Other Expenses (See FN3) - 633,961 - 173,371 - - - - 2,446,534 3,253,866 Total Operating Uses 162,590,435 80,267,041 2,627,315 49,012,841 883 - (168,250) - 2,446,534 296,776,799
Other Sources / (Uses) of FundsCapital Outlay from Non-Current Fund Sources** - - - - - - - - - - Mandatory and Non-mandatory Transfers (See FN10) 812,990 5,296,946 117,113 (1,096,694) - 859,459 (450,500) - - 5,539,314 Bond Transfers In (See FN4) - - - - - - - - - - Debt Service Payments (See FN5) (21,012,156) (625,881) - - - - - - - (21,638,037) Subtotal (20,199,166) 4,671,065 117,113 (1,096,694) - 859,459 (450,500) - - (16,098,723)
Other Items Not for Current Operating UseUnrealized Gains / (Losses) (See FN6) (863,639) (957,830) - - - (1,866,319) - - - (3,687,788) Additions to Permanent Endowments (See FN7) - - - - - 3,215 - - - 3,215 Subtotal (863,639) (957,830) - - - (1,863,104) - - - (3,684,573)
Total Sources Over / (Under) Uses (See FN 11) 8,079,565 60,922,793 342,644 1,103,046 135,271 (513,265) (282,250) - (2,785,210) 67,002,594
Depreciation Expense - - - - - - - - (20,016,163) (20,016,163) Transfer of Capital Asset(s) from System - - - - - - - - 87,540,242 87,540,242 Other Post-Employment Benefit (OPEB) Expense - - - - - - - - - - Non-Cash Capital Gifts - - - - - - - - - - Capital Outlay 380,935 4,961,044 - 1,904,752 - - - - - 7,246,731 Change in Net Assets (Total Agrees with AFR***) 8,460,500 65,883,837 342,644 3,007,798 135,271 (513,265) (282,250) - 64,738,869 141,773,404
*Defined as any capital outlay expenses from Educational & General, Designated, Auxiliary, or Restricted Expendable Funds.**Defined as any capital outlay expense from funds other than Educational & General, Designated, Auxiliary, or Restricted Expendable.***As reported for "Changes in Net Position" shown on Schedule of Revenues, Expenses, and Changes in Net Position (SRECNP) in Annual Financial Report.
Texas A&M University System Health Science CenterFor the Year Ended August 31, 2019Source: FY 2019 Annual Financial Report
Detail Worksheet FY 2019
Texas Higher Education Coordinating Board 206 June, 2020

Texas A&M University System Health Science CenterFor the Year Ended August 31, 2019Source: FY 2019 Annual Financial Report
FOOTNOTES:
FN1: Scholarship Discounts and Allowances are scholarships, fellowships, and grants applied to tuition. The discount eliminates tuition revenues that are paid for by University resources which are recorded as revenue elsewhere on the financial statements (i.e. federal and state contracts and grants revenues). In addition, Scholarship Discounts and Allowances eliminate tuition revenue that is exempted from payment due to tuition exemptions approved by the Texas Legislature. Waivers, remissions, and exemptions represent tuition and fee dollars forgone by the university - some are required by statute. See the Integrated Financial Reporting System (IFRS) report submitted to THECB for details on waivers, exemptions, tuition, and fees. Allocation methods to individual funds shown may vary between institutions.
FN2: Endowment and Interest Income includes interest income and endowment payouts.
FN3: Other Income is primarily Other Operating and Other Non-operating Revenues from the AFR. Other Expenses is primarily Other Nonoperating Expenses from the AFR.
FN4: Bond Proceeds are funds received from the sale of bonds and commercial paper used to finance capital projects. This amount includes actual proceeds and accrued or anticipated proceeds to be transferred from System. Independent institutions report only to the extent expended in current year.
FN5: Debt service payments are payments to service and retire debt issued to fund capital projects. System components do this via transfers to System Administrations. Independent institutions use direct payment to appropriate paying agents.
FN6: Unrealized Gains / (Losses) represent the increase in the Fair Market Value of Investments and Endowments. Unrealized Gains / (Losses) are accrued as non-cash transactions. Therefore, funds are not actually received for this revenue stream. Accordingly, this revenue is not cash revenue and cannot be used by the University to fund operations.
FN7: Additions to Permanent Endowments are additions to endowment principal. This revenue is restricted for investment purposes only and cannot be used to fund operations. Only interest income from these endowments, which is reported on the Endowment and Investment Income line of this report, can be used by the University to fund operations.
FN8: Distributions from the Available University Fund appropriated through the Appropriation Bill are first used to pay debt service costs on Permanent University Fund Bonds. Funds remaining are distributed to constitutionally designated institutions to promote academic excellence. Only the Excellence funding is shown at the institution level. The AUF funds used to pay debt service on PUF bonds are reported at the System level.
FN9: Auxiliary Enterprises include athletics, housing and food, student services, and parking and transportation. Auxiliary Enterprises are required to be self-supporting, and therefore must operate on the funds they generate.
FN10: Mandatory and non-mandatory transfers includes transfers between funds, transfers between the University System and institutions and transfers to and from other state agencies. In total, all transfers between funds net to zero with the exception of any amounts transferred between the University System, between other institutions, or to and from another state agency. There are no transfers of education and general funds provided by the State of Texas to restricted or auxiliary fund groups. Transfers between education and general funds and designated funds are related to Texas Public Education Grant as provided by the State of Texas.
FN11: Of the net increase of $67,002,594 approximately $70.7 million represents revenues received but not year expended. This income is fully committed to program expenditures and capital disbursements. The remaining $(3.7) million represents non-expendable funds from unrealized gains and additions to permanent endowments of approximately $(3.7) million and $3 thousand respectively. Unrealized gains and additions to permanent endowments do not contribute to the availability of the institution's operating cash as discussed in FN6 and FN7.
Texas Higher Education Coordinating Board 207 June, 2020

University of North Texas Health Science Center at Fort Worth (Public Medical)(Excludes Private Medical School)
For the Year Ended August 31, 2019Source: FY 2019 Annual Financial Report
Non-operating Funds are not included in charts above. See following page (Summary).May not add to 100% due to rounding.
Total Operating Uses $262,620,272
Total Operating Sources $264,836,416
Total Operating Sources $264,836,416
State of Texas$124,099,105
47%
Student & Parent$30,598,820
11%
Federal Government$36,086,900
14%
Institutional Resources$62,633,434
24%
Hospitals, Clinics, Professional Fees
$11,418,1574%
Operating Sources by Category
State Appropriations, $103,540,523, 39%
State Grants & Contracts, $3,466,726,
1%
Higher Education Fund, $17,091,856, 7%
Available University Fund Excellence, $0,
0%
Tuition & Fees, $30,598,820, 12%
Federal Grants & Contracts, $36,086,900,
14%
Endowment & Interest Income, $10,765,161,
4%
Local Government Grants, $113,270, 0%
Private Gifts & Grants, $4,609,173, 2%
Sales & Services, $45,978,671, 17%
Net Auxiliary Enterprises, $667,918,
0%
Other Income, $499,241, 0%
Professional Fees, $11,418,157, 4%
Hospitals, Clinics, Professional Fees, $0,
0%
Operating Sources
Instruction$68,255,097
26%
Research$36,962,580
14%
Public Service$42,252,757
16%
Academic Support$20,048,187
8%Student Services
$6,085,7002%
Institutional Support$17,303,303
7%
Operations & Maintenance of Plant
$19,136,3507%
Scholarships & Fellowships$1,186,094
1%
Auxiliary Enterprises$686,321
0%
Capital Outlay$49,983,788
19%
Other Expenses$720,095
0%
Operating Uses
Texas Higher Education Coordinating Board 208 June, 2020

University of North Texas Health Science Center at Fort Worth (Public Medical)For the Year Ended August 31, 2019Source: FY 2019 Annual Financial Report(Excludes Private Medical School)
Summary Worksheet FY 2019 Amount Per FTSEInstitution State Funded FTSEs 2,817.98
Operating SourcesState of TexasState Appropriations (Includes Research, Patient Care, & Public Service) 103,540,523$ 36,743 State Grants and Contracts - Restricted 3,466,726 1,230 Higher Education Fund 17,091,856 6,065 Available University Fund Excellence (See FN8) - - Subtotal 124,099,105$ 44,038
Student & ParentTuition - net 21,852,587$ 7,755 Fees - net 8,746,233 3,104 Tuition and Fees (net of Scholarship Discounts and Allowances) 30,598,820$ 10,859
Federal GovernmentFederal Grants and Contracts - Restricted 36,086,900$
Professional FeesAll Sources (Net) 11,418,157$
Hospitals and ClinicsAll Sources (Net) -$
Institutional ResourcesEndowment and Interest Income (See FN2) 10,765,161$ Local Government Grants - Restricted 113,270 Private Gifts and Grants - Restricted 4,609,173 Sales and Services 45,978,671 Net Auxiliary Enterprises (See FN9) 667,918 Other Income (See FN3) 499,241 Subtotal 62,633,434$ Total Operating Sources 264,836,416$
Operating UsesInstruction 68,255,097$ 24,221$ Research 36,962,580 13,117 Public Service 42,252,757 Hospitals and Clinics - Academic Support 20,048,187 7,114 Student Services 6,085,700 2,160 Institutional Support 17,303,303 6,140 Operations and Maintenance of Plant 19,136,350 Scholarships and Fellowships 1,186,094 421 Auxiliary Enterprises (See FN9) 686,321 Capital Outlay from Current Fund Sources 49,983,788 17,737 Other Expenses (See FN3) 720,095 Total Operating Uses 262,620,272$ 70,910$
Other Sources / (Uses) of FundsCapital Outlay from Non-Current Fund Sources 2,593,630 Mandatory and Non-mandatory Transfers (See FN10) 41,395,792 Bond Transfers In (See FN4) - Debt Service Payments (See FN5) - Subtotal 43,989,422$
Other Items Not for Current Operating UseUnrealized Gains / (Losses) (See FN6) (1,324,572) Additions to Permanent Endowments (See FN7) 2,000,000 Subtotal 675,428$
Total Sources Over / (Under) Uses (See FN11) 46,880,994$
Note: Due to the nature of Health-Related Institutions, per FTSE calculations are provided on selected line items.
Texas Higher Education Coordinating Board 209 June, 2020

(Excludes Private Medical School)
FY 2019
Operating SourcesEducational &
General DesignatedAuxiliary
EnterprisesRestricted
Expendable Loan Funds
Annuity, Life & Endowment and
Similar FundsUnexpended
PlantRetirement of Indebtedness
Investment In Plant Primary University
State of TexasState Appropriations 103,540,523 - - - - - - - - 103,540,523 State Grants and Contracts - Restricted 346,387 911,076 - 2,209,263 - - - - - 3,466,726 Higher Education Fund 17,091,856 - - - - - - - - 17,091,856 Available University Fund Excellence (See FN8) - - - - - - - - - - Subtotal 120,978,766 911,076 - 2,209,263 - - - - - 124,099,105
Student & ParentTuition Potential 100% 12,968,208 12,907,495 - - - - - - - 25,875,703 Waivers - Statutory (Not Reported in AFR) - - - - - - - - - - Waivers - Institutional (Not Reported in AFR) (1,597,464) (530,408) - - - - - - - (2,127,872) Exemptions - Statutory (Not Reported in AFR) - - - - - - - - - - Exemptions - Institutional (Not Reported in AFR) - - - - - - - - - - Tuition - Gross - AFR Presentation 11,370,744 12,377,087 - - - - - - - 23,747,831 Waivers - Statutory (Reported in AFR) - - - - - - - - - - Waivers - Institutional (Reported in AFR) - - - - - - - - - - Exemptions - Statutory (Reported in AFR) - - - - - - - - - - Exemptions - Institutional (Reported in AFR) - - - - - - - - - - All Other Scholarship Disc.& Allow. (See FN1) (614,068) (1,281,176) - - - - - - - (1,895,244) Tuition - net 10,756,676 11,095,911 - - - - - - - 21,852,587
Fees Potential 100% 25,051 9,165,895 - - - - - - - 9,190,946 Waivers - Statutory (Not Reported in AFR) - - - - - - - - - - Waivers - Institutional (Not Reported in AFR) - - - - - - - - - - Exemptions - Statutory (Not Reported in AFR) - - - - - - - - - - Exemptions - Institutional (Not Reported in AFR) - - - - - - - - - - Fees - Gross - AFR Presentation 25,051 9,165,895 - - - - - - - 9,190,946 Waivers - Statutory (Reported in AFR) - - - - - - - - - - Waivers - Institutional (Reported in AFR) - - - - - - - - - - Exemptions - Statutory (Reported in AFR) - - - - - - - - - - Exemptions - Institutional (Reported in AFR) - - - - - - - - - - All Other Scholarship Disc.& Allow. (See FN1) - (444,713) - - - - - - - (444,713) Fees - net 25,051 8,721,182 - - - - - - - 8,746,233
Net Tuition and Fees (Funds Collected) 10,781,727 19,817,093 - - - - - - - 30,598,820
Federal GovernmentFederal Grants and Contracts - Restricted - 61,523 - 36,025,377 - - - - - 36,086,900
Professional FeesAll Sources (Net) - 11,418,157 - - - - - - - 11,418,157
Hospitals and ClinicsAll Sources (Net) - - - - - - - - - -
Institutional ResourcesEndowment and Interest Income (See FN2) 111,963 6,869,283 - 2,597,676 42,388 1,143,851 - - - 10,765,161 Local Government Grants - Restricted - - - 113,270 - - - - - 113,270 Private Gifts and Grants - Restricted - 1,251,588 - 3,357,585 - - - - - 4,609,173 Sales and Services - Educational Activities (Net) - 45,826,855 - 151,177 639 - - - - 45,978,671 Net Auxiliary Enterprises (See FN9) - - 667,918 - - - - - - 667,918 Other Income (See FN3) 85,069 621,329 - - 77,232 - - - (284,389) 499,241 Subtotal 197,032 54,569,055 667,918 6,219,708 120,259 1,143,851 - - (284,389) 62,633,434 Total Operating Sources 131,957,525 86,776,904 667,918 44,454,348 120,259 1,143,851 - - (284,389) 264,836,416
Operating UsesInstruction 47,305,034 18,467,267 - 2,471,660 11,136 - - - - 68,255,097 Research 8,064,320 5,016,498 - 23,881,762 - - - - - 36,962,580 Public Service 8,233,772 26,837,917 - 7,181,068 - - - - - 42,252,757 Hospitals and Clinics - - - - - - - - - - Academic Support 13,344,383 6,300,757 - 403,047 - - - - - 20,048,187 Student Services 3,443,714 2,630,747 - 1,853 9,386 - - - - 6,085,700 Institutional Support 12,543,078 4,619,070 - 38,529 - 102,626 - - - 17,303,303 Operations and Maintenance of Plant 11,908,678 7,172,726 - - - - - - 54,946 19,136,350 Scholarships and Fellowships 180,096 273,632 - 664,950 67,416 - - - - 1,186,094 Auxiliary Enterprises (See FN9) - - 686,321 - - - - - - 686,321 Capital Outlay from Current Fund Sources* 7,435,385 42,301,076 24,950 222,377 - - - - - 49,983,788 Other Expenses (See FN3) 3,886 955 - - 715,254 - - - - 720,095 Total Operating Uses 112,462,346 113,620,645 711,271 34,865,246 803,192 102,626 - - 54,946 262,620,272
Other Sources / (Uses) of FundsCapital Outlay from Non-Current Fund Sources** - - - - - - - - 2,593,630 2,593,630 Mandatory and Non-mandatory Transfers (See FN10) (22,767,506) (3,352,723) - 210,304 3,070,871 (1,175,949) - 50,789,408 14,621,387 41,395,792 Bond Transfers In (See FN4) - - - - - - - - - - Debt Service Payments (See FN5) - - - - - - - - - - Subtotal (22,767,506) (3,352,723) - 210,304 3,070,871 (1,175,949) - 50,789,408 17,215,017 43,989,422
Other Items Not for Current Operating UseUnrealized Gains / (Losses) (See FN6) - (836,000) - (1,638) - (486,934) - - - (1,324,572) Additions to Permanent Endowments (See FN7) - - - - - 2,000,000 - - - 2,000,000 Subtotal - (836,000) - (1,638) - 1,513,066 - - - 675,428
Total Sources Over / (Under) Uses (See FN 11) (3,272,327) (31,032,464) (43,353) 9,797,768 2,387,938 1,378,342 - 50,789,408 16,875,682 46,880,994
Depreciation Expense - - - - - - - - (16,769,886) (16,769,886) Transfer of Capital Asset(s) from System - - - - - - - - (7,517) (7,517) Other Post-Employment Benefit (OPEB) Expense - - - - - - - - - - Non-Cash Capital Gifts - 541,892 - 1,000,000 - - - - 269,206 1,811,098 Capital Outlay - - - - - - - - 47,390,157 47,390,157 Change in Net Assets (Total Agrees with AFR***) (3,272,327) (30,490,572) (43,353) 10,797,768 2,387,938 1,378,342 - 50,789,408 47,757,642 79,304,846
*Defined as any capital outlay expenses from Educational & General, Designated, Auxiliary, or Restricted Expendable Funds.**Defined as any capital outlay expense from funds other than Educational & General, Designated, Auxiliary, or Restricted Expendable.***As reported for "Changes in Net Position" shown on Schedule of Revenues, Expenses, and Changes in Net Position (SRECNP) in Annual Financial Report.
University of North Texas Health Science Center at Fort Worth (Public Medical)
For the Year Ended August 31, 2019Source: FY 2019 Annual Financial Report
Detail Worksheet FY 2019
Texas Higher Education Coordinating Board 210 June, 2020

University of North Texas Health Science Center at Fort Worth (Public Medical)(Excludes Private Medical School)For the Year Ended August 31, 2019Source: FY 2019 Annual Financial ReportFOOTNOTES:
FN1: Scholarship Discounts and Allowances are scholarships, fellowships, and grants applied to tuition. The discount eliminates tuition revenues that are paid for by University resources which are recorded as revenue elsewhere on the financial statements (i.e. federal and state contracts and grants revenues). In addition, Scholarship Discounts and Allowances eliminate tuition revenue that is exempted from payment due to tuition exemptions approved by the Texas Legislature. Waivers, remissions, and exemptions represent tuition and fee dollars forgone by the university - some are required by statute. See the Integrated Financial Reporting System (IFRS) report submitted to THECB for details on waivers, exemptions, tuition, and fees. Allocation methods to individual funds shown may vary between institutions.
FN2: Endowment and Interest Income includes interest income and endowment payouts.
FN3: Other Income is primarily Other Operating and Other Non-operating Revenues from the AFR. Other Expenses is primarily Other Nonoperating Expenses from the AFR.
FN4: Bond Proceeds are funds received from the sale of bonds and commercial paper used to finance capital projects. This amount includes actual proceeds and accrued or anticipated proceeds to be transferred from System. Independent institutions report only to the extent expended in current year.
FN5: Debt service payments are payments to service and retire debt issued to fund capital projects. System components do this via transfers to System Administrations. Independent institutions use direct payment to appropriate paying agents.
FN6: Unrealized Gains / (Losses) represent the increase in the Fair Market Value of Investments and Endowments. Unrealized Gains / (Losses) are accrued as non-cash transactions. Therefore, funds are not actually received for this revenue stream. Accordingly, this revenue is not cash revenue and cannot be used by the University to fund operations.
FN7: Additions to Permanent Endowments are additions to endowment principal. This revenue is restricted for investment purposes only and cannot be used to fund operations. Only interest income from these endowments, which is reported on the Endowment and Investment Income line of this report, can be used by the University to fund operations.
FN8: Distributions from the Available University Fund appropriated through the Appropriation Bill are first used to pay debt service costs on Permanent University Fund Bonds. Funds remaining are distributed to constitutionally designated institutions to promote academic excellence. Only the Excellence funding is shown at the institution level. The AUF funds used to pay debt service on PUF bonds are reported at the System level.
FN9: Auxiliary Enterprises include athletics, housing and food, student services, and parking and transportation. Auxiliary Enterprises are required to be self-supporting, and therefore must operate on the funds they generate.
FN10: Mandatory and non-mandatory transfers includes transfers between funds, transfers between the University System and institutions and transfers to and from other state agencies. In total, all transfers between funds net to zero with the exception of any amounts transferred between the University System, between other institutions, or to and from another state agency. There are no transfers of education and general funds provided by the State of Texas to restricted or auxiliary fund groups. Transfers between education and general funds and designated funds are related to Texas Public Education Grant as provided by the State of Texas.
FN11: Of the net increase of $46,880,994 approximately $48.2 million represents revenues received but not year expended. This income is fully committed to program expenditures and capital disbursements. The remaining $(1.3) million represents non-expendable funds from unrealized gains and additions to permanent endowments of approximately $(1.3) million and $0 respectively. Unrealized gains and additions to permanent endowments do not contribute to the availability of the institution's operating cash as discussed in FN6 and FN7.
Texas Higher Education Coordinating Board 211 June, 2020

Texas Tech University Health Sciences CenterFor the Year Ended August 31, 2019Source: FY 2019 Annual Financial Report
Non-operating Funds are not included in charts above. See following page (Summary).May not add to 100% due to rounding.
Total Operating Uses $668,085,279
Total Operating Sources $698,955,194
Total Operating Sources $698,955,194
State of Texas$202,030,539
29%
Student & Parent$58,132,912
8%
Federal Government$22,864,015
3%
Institutional Resources$184,834,305
27%
Hospitals, Clinics, Professional Fees
$231,093,42333%
Operating Sources by Category
State Appropriations$167,937,655
24%State Grants &
Contracts$10,720,488
2%
Higher Education Fund$23,372,396
3%
Tuition & Fees$58,132,912
8%
Federal Grants & Contracts
$22,864,0153%
Endowment & Interest Income
$6,505,3241%
Local Government Grants
$72,644,10411%
Private Gifts & Grants$78,810,774
11%
Sales & Services$11,444,009
2%
Net Auxiliary Enterprises
$836,0330%
Other Income$14,594,061
2%
Professional Fees$231,093,423
33%
Operating Sources
Instruction$204,707,225
31%
Research$37,994,903
6%
Public Service$146,620,180
22%
Academic Support$111,900,559
17%
Student Services$16,467,323
2%
Institutional Support$30,647,384
4%
Operations & Maintenance of Plant
$30,822,7135%
Scholarships & Fellowships$3,278,945
0%
Auxiliary Enterprises$506,421
0%Capital Outlay$5,061,994
1%
Other Expenses$00%
Hospitals & Clinics$80,077,632
12%
Operating Uses
Texas Higher Education Coordinating Board 212 June, 2020

Texas Tech University Health Sciences CenterFor the Year Ended August 31, 2019Source: FY 2019 Annual Financial Report
Summary Worksheet FY 2019 Amount Per FTSEInstitution State Funded FTSEs 5,952.71
Operating SourcesState of TexasState Appropriations (Includes Research, Patient Care, & Public Service) 167,937,655$ 28,212$ State Grants and Contracts - Restricted 10,720,488 1,801 Higher Education Fund 23,372,396 3,926 Available University Fund Excellence (See FN8) - - Subtotal 202,030,539$ 33,939$
Student & ParentTuition - net 41,226,220$ 6,926$ Fees - net 16,906,692 2,840 Tuition and Fees (net of Scholarship Discounts and Allowances) 58,132,912$ 9,766$
Federal GovernmentFederal Grants and Contracts - Restricted 22,864,015$
Professional FeesAll Sources (Net) 231,093,423$
Hospitals and ClinicsAll Sources (Net) -$
Institutional ResourcesEndowment and Interest Income (See FN2) 6,505,324$ Local Government Grants - Restricted 72,644,104 Private Gifts and Grants - Restricted 78,810,774 Sales and Services 11,444,009 Net Auxiliary Enterprises (See FN9) 836,033 Other Income (See FN3) 14,594,061 Subtotal 184,834,305$ Total Operating Sources 698,955,194$
Operating UsesInstruction 204,707,225$ 34,389$ Research 37,994,903 6,383 Public Service 146,620,180 Hospitals and Clinics 80,077,632 Academic Support 111,900,559 18,798 Student Services 16,467,323 2,766 Institutional Support 30,647,384 5,148 Operations and Maintenance of Plant 30,822,713 Scholarships and Fellowships 3,278,945 551 Auxiliary Enterprises (See FN9) 506,421 Capital Outlay from Current Fund Sources 5,061,994 850 Other Expenses (See FN3) - Total Operating Uses 668,085,279$ 68,885$
Other Sources / (Uses) of FundsCapital Outlay from Non-Current Fund Sources (48,609,176) Mandatory and Non-mandatory Transfers (See FN10) (4,050,765) Bond Transfers In (See FN4) 27,229,641 Debt Service Payments (See FN5) (13,942,586) Subtotal (39,372,886)$
Other Items Not for Current Operating UseUnrealized Gains / (Losses) (See FN6) 991,087 Additions to Permanent Endowments (See FN7) 140,626 Subtotal 1,131,713$
Total Sources Over / (Under) Uses (See FN11) (7,371,258)$
Note: Due to the nature of Health-Related Institutions, per FTSE calculations are provided on selected line items.
Texas Higher Education Coordinating Board 213 June, 2020

FY 2019
Operating SourcesEducational &
General DesignatedAuxiliary
EnterprisesRestricted
Expendable Loan Funds
Annuity, Life & Endowment and
Similar FundsUnexpended
PlantRetirement of Indebtedness
Investment In Plant Primary University
State of TexasState Appropriations 155,116,998 - - 12,820,657 - - - - - 167,937,655 State Grants and Contracts - Restricted 4,433,016 79,100 - 6,208,372 - - - - - 10,720,488 Higher Education Fund 23,372,396 - - - - - - - - 23,372,396 Available University Fund Excellence (See FN8) - - - - - - - - - - Subtotal 182,922,410 79,100 - 19,029,029 - - - - - 202,030,539
Student & ParentTuition Potential 100% 21,332,705 30,318,104 - - - - - - - 51,650,809 Waivers - Statutory (Not Reported in AFR) (3,223,895) - - - - - - - - (3,223,895) Waivers - Institutional (Not Reported in AFR) - - - - - - - - - - Exemptions - Statutory (Not Reported in AFR) - - - - - - - - - - Exemptions - Institutional (Not Reported in AFR) - - - - - - - - - - Tuition - Gross - AFR Presentation 18,108,810 30,318,104 - - - - - - - 48,426,914 Waivers - Statutory (Reported in AFR) - - - - - - - - - - Waivers - Institutional (Reported in AFR) - - - - - - - - - - Exemptions - Statutory (Reported in AFR) (466,985) (1,170,497) - - - - - - - (1,637,482) Exemptions - Institutional (Reported in AFR) - - - - - - - - - - All Other Scholarship Disc.& Allow. (See FN1) (1,505,470) (4,057,742) - - - - - - - (5,563,212) Tuition - net 16,136,355 25,089,865 - - - - - - - 41,226,220
Fees Potential 100% - 18,139,120 - - - - - - - 18,139,120 Waivers - Statutory (Not Reported in AFR) - - - - - - - - - - Waivers - Institutional (Not Reported in AFR) - - - - - - - - - - Exemptions - Statutory (Not Reported in AFR) - - - - - - - - - - Exemptions - Institutional (Not Reported in AFR) - - - - - - - - - - Fees - Gross - AFR Presentation - 18,139,120 - - - - - - - 18,139,120 Waivers - Statutory (Reported in AFR) - - - - - - - - - - Waivers - Institutional (Reported in AFR) - - - - - - - - - - Exemptions - Statutory (Reported in AFR) - (1,232,428) - - - - - - - (1,232,428) Exemptions - Institutional (Reported in AFR) - - - - - - - - - - All Other Scholarship Disc.& Allow. (See FN1) - - - - - - - - - - Fees - net - 16,906,692 - - - - - - - 16,906,692
Net Tuition and Fees (Funds Collected) 16,136,355 41,996,557 - - - - - - - 58,132,912
Federal GovernmentFederal Grants and Contracts - Restricted - 1,321,117 - 21,542,898 - - - - - 22,864,015
Professional FeesAll Sources (Net) - 119,814,870 - 111,278,553 - - - - - 231,093,423
Hospitals and ClinicsAll Sources (Net) - - - - - - - - - -
Institutional ResourcesEndowment and Interest Income (See FN2) 606,153 7,976,641 54,042 5,455,004 79,014 (8,401,375) 735,845 - - 6,505,324 Local Government Grants - Restricted - 30,770,243 - 41,873,861 - - - - - 72,644,104 Private Gifts and Grants - Restricted 12,000 42,816,332 - 35,982,442 - - - - - 78,810,774 Sales and Services - Educational Activities (Net) - 10,942,776 - 501,233 - - - - - 11,444,009 Net Auxiliary Enterprises (See FN9) - - 836,033 - - - - - - 836,033 Other Income (See FN3) 67,252 14,601,968 - 5,914 464 - - - (81,537) 14,594,061 Subtotal 685,405 107,107,960 890,075 83,818,454 79,478 (8,401,375) 735,845 - (81,537) 184,834,305 Total Operating Sources 199,744,170 270,319,604 890,075 235,668,934 79,478 (8,401,375) 735,845 - (81,537) 698,955,194
Operating UsesInstruction 70,394,274 77,171,854 - 57,141,097 - - - - - 204,707,225 Research 11,594,945 11,020,645 - 15,326,440 - - 52,873 - - 37,994,903 Public Service 4,469,425 11,180,624 - 130,943,895 - - 26,236 - - 146,620,180 Hospitals and Clinics 1,352,155 67,325,100 - 11,400,377 - - - - - 80,077,632 Academic Support 46,202,340 59,203,877 - 3,777,517 - - 2,716,825 - - 111,900,559 Student Services 1,548,093 14,793,549 - 7,623 118,058 - - - - 16,467,323 Institutional Support 22,160,582 6,535,884 - 1,902,178 - - 48,740 - - 30,647,384 Operations and Maintenance of Plant 16,292,142 4,950,812 - 201,709 - - 9,378,050 - - 30,822,713 Scholarships and Fellowships - 650,695 - 2,628,250 - - - - - 3,278,945 Auxiliary Enterprises (See FN9) - - 506,421 - - - - - - 506,421 Capital Outlay from Current Fund Sources* 751,548 3,180,186 10,026 1,120,234 - - - - - 5,061,994 Other Expenses (See FN3) - - - - - - - - - - Total Operating Uses 174,765,504 256,013,226 516,447 224,449,320 118,058 - 12,222,724 - - 668,085,279
Other Sources / (Uses) of FundsCapital Outlay from Non-Current Fund Sources** - - - - - - (48,609,176) - - (48,609,176) Mandatory and Non-mandatory Transfers (See FN10) (25,937,843) (7,860,216) (282,880) (15,737,052) - 1,098,286 44,918,940 - (250,000) (4,050,765) Bond Transfers In (See FN4) - - - - - - 27,229,641 - - 27,229,641 Debt Service Payments (See FN5) (13,942,586) - - - - - - - - (13,942,586) Subtotal (39,880,429) (7,860,216) (282,880) (15,737,052) - 1,098,286 23,539,405 - (250,000) (39,372,886)
Other Items Not for Current Operating UseUnrealized Gains / (Losses) (See FN6) - (1,311,769) - (839,104) - 3,141,960 - - - 991,087 Additions to Permanent Endowments (See FN7) - - - - - 140,626 - - - 140,626 Subtotal - (1,311,769) - (839,104) - 3,282,586 - - - 1,131,713
Total Sources Over / (Under) Uses (See FN 11) (14,901,763) 5,134,393 90,748 (5,356,542) (38,580) (4,020,503) 12,052,526 - (331,537) (7,371,258)
Depreciation Expense - - - - - - - - (19,931,847) (19,931,847) Transfer of Capital Asset(s) from System - - - (58,768) - - - - (143,466) (202,234) Other Post-Employment Benefit (OPEB) Expense - - - - - - - - - - Non-Cash Capital Gifts - - - - - - - - 2,152,241 2,152,241 Capital Outlay 751,548 3,180,186 10,026 1,120,234 - - 48,609,176 - - 53,671,170 Change in Net Assets (Total Agrees with AFR***) (14,150,215) 8,314,579 100,774 (4,295,076) (38,580) (4,020,503) 60,661,702 - (18,254,609) 28,318,072
*Defined as any capital outlay expenses from Educational & General, Designated, Auxiliary, or Restricted Expendable Funds.**Defined as any capital outlay expense from funds other than Educational & General, Designated, Auxiliary, or Restricted Expendable.***As reported for "Changes in Net Position" shown on Schedule of Revenues, Expenses, and Changes in Net Position (SRECNP) in Annual Financial Report.
Texas Tech University Health Sciences CenterFor the Year Ended August 31, 2019Source: FY 2019 Annual Financial Report
Detail Worksheet FY 2019
Texas Higher Education Coordinating Board 214 June, 2020

Texas Tech University Health Sciences CenterFor the Year Ended August 31, 2019Source: FY 2019 Annual Financial Report
FOOTNOTES:
FN1: Scholarship Discounts and Allowances are scholarships, fellowships, and grants applied to tuition. The discount eliminates tuition revenues that are paid for by University resources which are recorded as revenue elsewhere on the financial statements (i.e. federal and state contracts and grants revenues). In addition, Scholarship Discounts and Allowances eliminate tuition revenue that is exempted from payment due to tuition exemptions approved by the Texas Legislature. Waivers, remissions, and exemptions represent tuition and fee dollars forgone by the university - some are required by statute. See the Integrated Financial Reporting System (IFRS) report submitted to THECB for details on waivers, exemptions, tuition, and fees. Allocation methods to individual funds shown may vary between institutions.
FN2: Endowment and Interest Income includes interest income and endowment payouts.
FN3: Other Income is primarily Other Operating and Other Non-operating Revenues from the AFR. Other Expenses is primarily Other Nonoperating Expenses from the AFR.
FN4: Bond Proceeds are funds received from the sale of bonds and commercial paper used to finance capital projects. This amount includes actual proceeds and accrued or anticipated proceeds to be transferred from System. Independent institutions report only to the extent expended in current year.
FN5: Debt service payments are payments to service and retire debt issued to fund capital projects. System components do this via transfers to System Administrations. Independent institutions use direct payment to appropriate paying agents.
FN6: Unrealized Gains / (Losses) represent the increase in the Fair Market Value of Investments and Endowments. Unrealized Gains / (Losses) are accrued as non-cash transactions. Therefore, funds are not actually received for this revenue stream. Accordingly, this revenue is not cash revenue and cannot be used by the University to fund operations.
FN7: Additions to Permanent Endowments are additions to endowment principal. This revenue is restricted for investment purposes only and cannot be used to fund operations. Only interest income from these endowments, which is reported on the Endowment and Investment Income line of this report, can be used by the University to fund operations.
FN8: Distributions from the Available University Fund appropriated through the Appropriation Bill are first used to pay debt service costs on Permanent University Fund Bonds. Funds remaining are distributed to constitutionally designated institutions to promote academic excellence. Only the Excellence funding is shown at the institution level. The AUF funds used to pay debt service on PUF bonds are reported at the System level.
FN9: Auxiliary Enterprises include athletics, housing and food, student services, and parking and transportation. Auxiliary Enterprises are required to be self-supporting, and therefore must operate on the funds they generate.
FN10: Mandatory and non-mandatory transfers includes transfers between funds, transfers between the University System and institutions and transfers to and from other state agencies. In total, all transfers between funds net to zero with the exception of any amounts transferred between the University System, between other institutions, or to and from another state agency. There are no transfers of education and general funds provided by the State of Texas to restricted or auxiliary fund groups. Transfers between education and general funds and designated funds are related to Texas Public Education Grant as provided by the State of Texas.
FN11. N/A
Texas Higher Education Coordinating Board 215 June, 2020

Texas Tech University Health Sciences Center at El PasoFor the Year Ended August 31, 2019Source: FY 2019 Annual Financial Report
Non-operating Funds are not included in charts above. See following page (Summary).May not add to 100% due to rounding.
Total Operating Uses $230,061,068
Total Operating Sources $260,897,505
Total Operating Sources $260,897,505
State of Texas$88,949,990
34%
Student & Parent$10,151,693
4%
Federal Government$3,629,247
1%
Institutional Resources$101,868,954
39%
Hospitals, Clinics, Professional Fees
$56,297,62122%
Operating Sources by Category
State Appropriations$75,844,369
29%
State Grants & Contracts$6,871,546
3%
Higher Education Fund$6,234,075
2%
Tuition & Fees$10,151,693
4%
Federal Grants & Contracts$3,629,247
1%
Endowment & Interest Income
$3,010,5001%
Local Government Grants
$60,493,21723%
Private Gifts & Grants$28,255,451
11%
Sales & Services$383,818
0%
Net Auxiliary Enterprises
$285,3940%
Other Income$9,440,574
4%
Professional Fees$56,297,621
22%
Operating Sources
Instruction$114,917,540
50%
Research$10,429,611
5%
Public Service$1,312,368
1%
Academic Support$47,035,816
20%Student Services
$2,948,8011%
Institutional Support$18,145,432
8%
Operations & Maintenance of Plant
$9,739,0194%
Scholarships & Fellowships
$947,5100%
Auxiliary Enterprises$190,677
0%Capital Outlay$2,407,888
1%
Other Expenses$4,606
0%
Hospitals & Clinics$21,981,800
10%
Operating Uses
Texas Higher Education Coordinating Board 216 June, 2020

Texas Tech University Health Sciences Center at El PasoFor the Year Ended August 31, 2019Source: FY 2019 Annual Financial Report
Summary Worksheet FY 2019 Amount Per FTSEInstitution State Funded FTSEs 789.35
Operating SourcesState of TexasState Appropriations (Includes Research, Patient Care, & Public Service) 75,844,369$ 96,085$ State Grants and Contracts - Restricted 6,871,546 8,705 Higher Education Fund 6,234,075 7,898 Available University Fund Excellence (See FN8) - - Subtotal 88,949,990$ 112,688$
Student & ParentTuition - net 6,660,997$ 8,439$ Fees - net 3,490,696 4,422 Tuition and Fees (net of Scholarship Discounts and Allowances) 10,151,693$ 12,861$
Federal GovernmentFederal Grants and Contracts - Restricted 3,629,247$
Professional FeesAll Sources (Net) 56,297,621$
Hospitals and ClinicsAll Sources (Net) -$
Institutional ResourcesEndowment and Interest Income (See FN2) 3,010,500$ Local Government Grants - Restricted 60,493,217 Private Gifts and Grants - Restricted 28,255,451 Sales and Services 383,818 Net Auxiliary Enterprises (See FN9) 285,394 Other Income (See FN3) 9,440,574 Subtotal 101,868,954$ Total Operating Sources 260,897,505$
Operating UsesInstruction 114,917,540$ 145,585$ Research 10,429,611 13,213 Public Service 1,312,368 Hospitals and Clinics 21,981,800 Academic Support 47,035,816 59,588 Student Services 2,948,801 3,736 Institutional Support 18,145,432 22,988 Operations and Maintenance of Plant 9,739,019 Scholarships and Fellowships 947,510 1,200 Auxiliary Enterprises (See FN9) 190,677 Capital Outlay from Current Fund Sources 2,407,888 3,050 Other Expenses (See FN3) 4,606 Total Operating Uses 230,061,068$ 249,360$
Other Sources / (Uses) of FundsCapital Outlay from Non-Current Fund Sources (19,358,183) Mandatory and Non-mandatory Transfers (See FN10) (1,942,675) Bond Transfers In (See FN4) 12,639,926 Debt Service Payments (See FN5) (12,509,602) Subtotal (21,170,534)$
Other Items Not for Current Operating UseUnrealized Gains / (Losses) (See FN6) 712,462 Additions to Permanent Endowments (See FN7) 620 Subtotal 713,082$
Total Sources Over / (Under) Uses (See FN11) 10,378,985$
Note: Due to the nature of Health-Related Institutions, per FTSE calculations are provided on selected line items.
Texas Higher Education Coordinating Board 217 June, 2020

FY 2019
Operating SourcesEducational &
General DesignatedAuxiliary
EnterprisesRestricted
Expendable Loan Funds
Annuity, Life & Endowment and
Similar FundsUnexpended
PlantRetirement of Indebtedness
Investment In Plant Primary University
State of TexasState Appropriations 75,844,369 - - - - - - - - 75,844,369 State Grants and Contracts - Restricted 1,797,516 202,630 - 4,871,400 - - - - - 6,871,546 Higher Education Fund 6,234,075 - - - - - - - - 6,234,075 Available University Fund Excellence (See FN8) - - - - - - - - - - Subtotal 83,875,960 202,630 - 4,871,400 - - - - - 88,949,990
Student & ParentTuition Potential 100% 3,530,222 5,368,108 - - - - - - - 8,898,330 Waivers - Statutory (Not Reported in AFR) (289,820) - - - - - - - - (289,820) Waivers - Institutional (Not Reported in AFR) - - - - - - - - - - Exemptions - Statutory (Not Reported in AFR) - - - - - - - - - - Exemptions - Institutional (Not Reported in AFR) - - - - - - - - - - Tuition - Gross - AFR Presentation 3,240,402 5,368,108 - - - - - - - 8,608,510 Waivers - Statutory (Reported in AFR) - - - - - - - - - - Waivers - Institutional (Reported in AFR) - - - - - - - - - - Exemptions - Statutory (Reported in AFR) (69,108) (124,681) - - - - - - - (193,789) Exemptions - Institutional (Reported in AFR) - - - - - - - - - - All Other Scholarship Disc.& Allow. (See FN1) (446,849) (1,306,875) - - - - - - - (1,753,724) Tuition - net 2,724,445 3,936,552 - - - - - - - 6,660,997
Fees Potential 100% - 3,604,250 - - - - - - - 3,604,250 Waivers - Statutory (Not Reported in AFR) - - - - - - - - - - Waivers - Institutional (Not Reported in AFR) - - - - - - - - - - Exemptions - Statutory (Not Reported in AFR) - - - - - - - - - - Exemptions - Institutional (Not Reported in AFR) - - - - - - - - - - Fees - Gross - AFR Presentation - 3,604,250 - - - - - - - 3,604,250 Waivers - Statutory (Reported in AFR) - - - - - - - - - - Waivers - Institutional (Reported in AFR) - - - - - - - - - - Exemptions - Statutory (Reported in AFR) - (113,554) - - - - - - - (113,554) Exemptions - Institutional (Reported in AFR) - - - - - - - - - - All Other Scholarship Disc.& Allow. (See FN1) - - - - - - - - - - Fees - net - 3,490,696 - - - - - - - 3,490,696
Net Tuition and Fees (Funds Collected) 2,724,445 7,427,248 - - - - - - - 10,151,693
Federal GovernmentFederal Grants and Contracts - Restricted - 72,644 - 3,556,603 - - - - - 3,629,247
Professional FeesAll Sources (Net) - 56,297,621 - - - - - - - 56,297,621
Hospitals and ClinicsAll Sources (Net) - - - - - - - - - -
Institutional ResourcesEndowment and Interest Income (See FN2) 97,575 6,171,089 10,787 1,210,777 21,986 (4,551,178) 49,464 - - 3,010,500 Local Government Grants - Restricted - 46,735,254 - 13,757,963 - - - - - 60,493,217 Private Gifts and Grants - Restricted - 22,495,829 - 4,733,422 - - 1,026,200 - - 28,255,451 Sales and Services - Educational Activities (Net) - 383,818 - - - - - - - 383,818 Net Auxiliary Enterprises (See FN9) - - 285,394 - - - - - - 285,394 Other Income (See FN3) 2,342 9,436,896 2 5,500 - - - - (4,166) 9,440,574 Subtotal 99,917 85,222,886 296,183 19,707,662 21,986 (4,551,178) 1,075,664 - (4,166) 101,868,954 Total Operating Sources 86,700,322 149,223,029 296,183 28,135,665 21,986 (4,551,178) 1,075,664 - (4,166) 260,897,505
Operating UsesInstruction 21,886,460 77,257,539 - 15,773,541 - - - - - 114,917,540 Research 3,248,881 2,623,094 - 4,557,636 - - - - - 10,429,611 Public Service 132,887 416,262 - 763,219 - - - - - 1,312,368 Hospitals and Clinics 2,306,173 19,302,137 - 373,490 - - - - - 21,981,800 Academic Support 16,533,024 29,336,917 - 1,165,875 - - - - - 47,035,816 Student Services 922,012 2,019,472 - - 7,317 - - - - 2,948,801 Institutional Support 13,912,563 4,231,286 - 1,583 - - - - - 18,145,432 Operations and Maintenance of Plant 5,223,709 3,982,743 - - - - 532,567 - - 9,739,019 Scholarships and Fellowships - 266,668 - 580,842 100,000 - - - - 947,510 Auxiliary Enterprises (See FN9) - - 190,677 - - - - - - 190,677 Capital Outlay from Current Fund Sources* 1,168,567 1,448,316 - (208,995) - - - - - 2,407,888 Other Expenses (See FN3) - 4,606 - - - - - - - 4,606 Total Operating Uses 65,334,276 140,889,040 190,677 23,007,191 107,317 - 532,567 - - 230,061,068
Other Sources / (Uses) of FundsCapital Outlay from Non-Current Fund Sources** - - - - - - (19,358,183) - - (19,358,183) Mandatory and Non-mandatory Transfers (See FN10) (8,887,474) (592,043) - (8,540,164) 46,314 5,723,413 10,307,279 - - (1,942,675) Bond Transfers In (See FN4) - - - - - - 12,639,926 - - 12,639,926 Debt Service Payments (See FN5) (11,027,987) - - - - - (1,481,615) - - (12,509,602) Subtotal (19,915,461) (592,043) - (8,540,164) 46,314 5,723,413 2,107,407 - - (21,170,534)
Other Items Not for Current Operating UseUnrealized Gains / (Losses) (See FN6) - (989,886) - - - 1,702,348 - - - 712,462 Additions to Permanent Endowments (See FN7) - - - - - 620 - - - 620 Subtotal - (989,886) - - - 1,702,968 - - - 713,082
Total Sources Over / (Under) Uses (See FN 11) 1,450,585 6,752,060 105,506 (3,411,690) (39,017) 2,875,203 2,650,504 - (4,166) 10,378,985
Depreciation Expense - - - - - - - - (10,244,376) (10,244,376) Transfer of Capital Asset(s) from System - - - - - - - - 7,517 7,517 Other Post-Employment Benefit (OPEB) Expense - - - - - - - - - - Non-Cash Capital Gifts - - - - - - - - 26,943 26,943 Capital Outlay 1,168,568 1,448,316 - (208,995) - - 19,358,183 - - 21,766,072 Change in Net Assets (Total Agrees with AFR***) 2,619,153 8,200,376 105,506 (3,620,685) (39,017) 2,875,203 22,008,687 - (10,214,082) 21,935,141
*Defined as any capital outlay expenses from Educational & General, Designated, Auxiliary, or Restricted Expendable Funds.**Defined as any capital outlay expense from funds other than Educational & General, Designated, Auxiliary, or Restricted Expendable.***As reported for "Changes in Net Position" shown on Schedule of Revenues, Expenses, and Changes in Net Position (SRECNP) in Annual Financial Report.
Texas Tech University Health Sciences Center at El PasoFor the Year Ended August 31, 2019Source: FY 2019 Annual Financial Report
Detail Worksheet FY 2019
Texas Higher Education Coordinating Board 218 June, 2020

Texas Tech University Health Sciences Center at El PasoFor the Year Ended August 31, 2019Source: FY 2019 Annual Financial Report
FOOTNOTES:
FN1: Scholarship Discounts and Allowances are scholarships, fellowships, and grants applied to tuition. The discount eliminates tuition revenues that are paid for by University resources which are recorded as revenue elsewhere on the financial statements (i.e. federal and state contracts and grants revenues). In addition, Scholarship Discounts and Allowances eliminate tuition revenue that is exempted from payment due to tuition exemptions approved by the Texas Legislature. Waivers, remissions, and exemptions represent tuition and fee dollars forgone by the university - some are required by statute. See the Integrated Financial Reporting System (IFRS) report submitted to THECB for details on waivers, exemptions, tuition, and fees. Allocation methods to individual funds shown may vary between institutions.
FN2: Endowment and Interest Income includes interest income and endowment payouts.
FN3: Other Income is primarily Other Operating and Other Non-operating Revenues from the AFR. Other Expenses is primarily Other Nonoperating Expenses from the AFR.
FN4: Bond Proceeds are funds received from the sale of bonds and commercial paper used to finance capital projects. This amount includes actual proceeds and accrued or anticipated proceeds to be transferred from System. Independent institutions report only to the extent expended in current year.
FN5: Debt service payments are payments to service and retire debt issued to fund capital projects. System components do this via transfers to System Administrations. Independent institutions use direct payment to appropriate paying agents.
FN6: Unrealized Gains / (Losses) represent the increase in the Fair Market Value of Investments and Endowments. Unrealized Gains / (Losses) are accrued as non-cash transactions. Therefore, funds are not actually received for this revenue stream. Accordingly, this revenue is not cash revenue and cannot be used by the University to fund operations.
FN7: Additions to Permanent Endowments are additions to endowment principal. This revenue is restricted for investment purposes only and cannot be used to fund operations. Only interest income from these endowments, which is reported on the Endowment and Investment Income line of this report, can be used by the University to fund operations.
FN8: Distributions from the Available University Fund appropriated through the Appropriation Bill are first used to pay debt service costs on Permanent University Fund Bonds. Funds remaining are distributed to constitutionally designated institutions to promote academic excellence. Only the Excellence funding is shown at the institution level. The AUF funds used to pay debt service on PUF bonds are reported at the System level.
FN9: Auxiliary Enterprises include athletics, housing and food, student services, and parking and transportation. Auxiliary Enterprises are required to be self-supporting, and therefore must operate on the funds they generate.
FN10: Mandatory and non-mandatory transfers includes transfers between funds, transfers between the University System and institutions and transfers to and from other state agencies. In total, all transfers between funds net to zero with the exception of any amounts transferred between the University System, between other institutions, or to and from another state agency. There are no transfers of education and general funds provided by the State of Texas to restricted or auxiliary fund groups. Transfers between education and general funds and designated funds are related to Texas Public Education Grant as provided by the State of Texas.
FN11. N/A
Texas Higher Education Coordinating Board 219 June, 2020

The University of Texas at Austin Medical School (M)For the Year Ended August 31, 2019Source: FY 2019 Annual Financial Report
Non-operating Funds are not included in charts above. See following page (Summary).May not add to 100% due to rounding.
Total Operating Uses $163,304,864
Total Operating Sources $155,952,781
Total Operating Sources $155,952,781
State of Texas$34,362,976
22%
Student & Parent$3,631,944
2%
Federal Government$7,497,846
5%
Institutional Resources$104,431,015
67%
Hospitals, Clinics, Professional Fees
$6,029,0004%
Operating Sources by Category
State Appropriations$6,071,343
4%State Grants &
Contracts$3,281,443
2%
Available University Fund Excellence
$25,010,19016%
Tuition & Fees$3,631,944
2%
Federal Grants & Contracts$7,497,846
5%Endowment &
Interest Income$2,494,384
2%
Local Government Grants
$44,962,62229%
Private Gifts & Grants$48,594,037
31%
Sales & Services$1,798,994
1%
Net Auxiliary Enterprises$3,248,679
2%
Other Income$3,332,299
2%
Operating Sources
Instruction$6,174,967
4%
Research$32,518,883
20%
Public Service$6,516,636
4%
Academic Support$45,215,048
28%
Institutional Support$23,102,899
14%
Operations & Maintenance of Plant
$10,785,8327%
Scholarships & Fellowships$1,986,170
1%
Capital Outlay$1,448,901
1%Hospitals &
Clinics$33,615,387
20%
Operating Uses
Texas Higher Education Coordinating Board 220 June, 2020

The University of Texas at Austin Medical School (M)For the Year Ended August 31, 2019Source: FY 2019 Annual Financial Report
Summary Worksheet FY 2019 Amount Per FTSEInstitution State Funded FTSEs 196.00
Operating SourcesState of TexasState Appropriations (Includes Research, Patient Care, & Public Service) 6,071,343$ State Grants and Contracts - Restricted 3,281,443 Higher Education Fund - Available University Fund Excellence (See FN8) 25,010,190 Subtotal 34,362,976$ -$
Student & ParentTuition - net 2,926,312$ Fees - net 705,632 Tuition and Fees (net of Scholarship Discounts and Allowances) 3,631,944$ -$
Federal GovernmentFederal Grants and Contracts - Restricted 7,497,846$
Professional FeesAll Sources (Net) 6,029,000$
Hospitals and ClinicsAll Sources (Net) -$
Institutional ResourcesEndowment and Interest Income (See FN2) 2,494,384$ Local Government Grants - Restricted 44,962,622 Private Gifts and Grants - Restricted 48,594,037 Sales and Services 1,798,994 Net Auxiliary Enterprises (See FN9) 3,248,679 Other Income (See FN3) 3,332,299 Subtotal 104,431,015$ Total Operating Sources 155,952,781$
Operating UsesInstruction 6,174,967$ Research 32,518,883 Public Service 6,516,636 Hospitals and Clinics 33,615,387 Academic Support 45,215,048 Student Services - Institutional Support 23,102,899 Operations and Maintenance of Plant 10,785,832 Scholarships and Fellowships 1,986,170 Auxiliary Enterprises (See FN9) 1,940,141 Capital Outlay from Current Fund Sources 1,448,901 Other Expenses (See FN3) - Total Operating Uses 163,304,864$ -$
Other Sources / (Uses) of FundsCapital Outlay from Non-Current Fund Sources (18,745,433) Mandatory and Non-mandatory Transfers (See FN10) (16,619,746) Bond Transfers In (See FN4) 1,348,961 Debt Service Payments (See FN5) (25,036,248) Subtotal (59,052,466)$
Other Items Not for Current Operating UseUnrealized Gains / (Losses) (See FN6) 44,729 Additions to Permanent Endowments (See FN7) 3,068,726 Subtotal 3,113,455$
Total Sources Over / (Under) Uses (See FN11) (63,291,094)$
Note: Due to the nature of Health-Related Institutions, per FTSE calculations are provided on selected line items.
Texas Higher Education Coordinating Board 221 June, 2020

FY 2019
Operating SourcesEducational &
General DesignatedAuxiliary
EnterprisesRestricted
Expendable Loan Funds
Annuity, Life & Endowment and
Similar FundsUnexpended
PlantRetirement of Indebtedness
Investment In Plant Primary University
State of TexasState Appropriations 6,071,343 - - - - - - - - 6,071,343 State Grants and Contracts - Restricted - 1,147,871 - 2,133,572 - - - - - 3,281,443 Higher Education Fund - - - - - - - - - - Available University Fund Excellence (See FN8) 25,010,190 - - - - - - - - 25,010,190 Subtotal 31,081,533 1,147,871 - 2,133,572 - - - - - 34,362,976
Student & ParentTuition Potential 100% 1,280,875 1,943,761 - - - - - - - 3,224,636 Waivers - Statutory (Not Reported in AFR) - - - - - - - - - - Waivers - Institutional (Not Reported in AFR) - - - - - - - - - - Exemptions - Statutory (Not Reported in AFR) - - - - - - - - - - Exemptions - Institutional (Not Reported in AFR) - - - - - - - - - - Tuition - Gross - AFR Presentation 1,280,875 1,943,761 - - - - - - - 3,224,636 Waivers - Statutory (Reported in AFR) - - - - - - - - - - Waivers - Institutional (Reported in AFR) - - - - - - - - - - Exemptions - Statutory (Reported in AFR) - - - - - - - - - - Exemptions - Institutional (Reported in AFR) - - - - - - - - - - All Other Scholarship Disc.& Allow. (See FN1) (298,324) - - - - - - - - (298,324) Tuition - net 982,551 1,943,761 - - - - - - - 2,926,312
Fees Potential 100% - 918,856 - - - - - - - 918,856 Waivers - Statutory (Not Reported in AFR) - - - - - - - - - - Waivers - Institutional (Not Reported in AFR) - - - - - - - - - - Exemptions - Statutory (Not Reported in AFR) - - - - - - - - - - Exemptions - Institutional (Not Reported in AFR) - - - - - - - - - - Fees - Gross - AFR Presentation - 918,856 - - - - - - - 918,856 Waivers - Statutory (Reported in AFR) - - - - - - - - - - Waivers - Institutional (Reported in AFR) - - - - - - - - - - Exemptions - Statutory (Reported in AFR) - - - - - - - - - - Exemptions - Institutional (Reported in AFR) - - - - - - - - - - All Other Scholarship Disc.& Allow. (See FN1) - (213,224) - - - - - - - (213,224) Fees - net - 705,632 - - - - - - - 705,632
Net Tuition and Fees (Funds Collected) 982,551 2,649,393 - - - - - - - 3,631,944
Federal GovernmentFederal Grants and Contracts - Restricted - - - 7,497,846 - - - - - 7,497,846
Professional FeesAll Sources (Net) - 6,029,000 - - - - - - - 6,029,000
Hospitals and ClinicsAll Sources (Net) - - - - - - - - - -
Institutional ResourcesEndowment and Interest Income (See FN2) - 933,085 - 1,563,064 - (1,765) - - - 2,494,384 Local Government Grants - Restricted - 44,931,989 - 30,633 - - - - - 44,962,622 Private Gifts and Grants - Restricted - 22,696,494 - 25,897,543 - - - - - 48,594,037 Sales and Services - Educational Activities (Net) - 1,798,994 - - - - - - - 1,798,994 Net Auxiliary Enterprises (See FN9) - - 3,248,679 - - - - - - 3,248,679 Other Income (See FN3) - 3,332,299 - - - - - - - 3,332,299 Subtotal - 73,692,861 3,248,679 27,491,240 - (1,765) - - - 104,431,015 Total Operating Sources 32,064,084 83,519,125 3,248,679 37,122,658 - (1,765) - - - 155,952,781
Operating UsesInstruction 2,442,537 2,854,276 - 878,154 - - - - - 6,174,967 Research 12,067,645 7,291,821 - 13,159,417 - - - - - 32,518,883 Public Service 767,335 3,126,844 - 2,622,457 - - - - - 6,516,636 Hospitals and Clinics 9,558,152 20,071,566 - 3,985,669 - - - - - 33,615,387 Academic Support 19,835,676 21,236,708 - 4,142,664 - - - - - 45,215,048 Student Services - - - - - - - - - - Institutional Support 16,120,645 3,373,747 - 3,608,507 - - - - - 23,102,899 Operations and Maintenance of Plant 2,779,622 7,897,315 - - - - 108,895 - - 10,785,832 Scholarships and Fellowships 102,859 425,853 - 1,457,458 - - - - - 1,986,170 Auxiliary Enterprises (See FN9) - - 1,940,141 - - - - - - 1,940,141 Capital Outlay from Current Fund Sources* 515,219 102,581 - 831,101 - - - - - 1,448,901 Other Expenses (See FN3) - - - - - - - - - - Total Operating Uses 64,189,690 66,380,711 1,940,141 30,685,427 - - 108,895 - - 163,304,864
Other Sources / (Uses) of FundsCapital Outlay from Non-Current Fund Sources** - - - - - - (18,745,433) - - (18,745,433) Mandatory and Non-mandatory Transfers (See FN10) (25,237,768) 1,324,190 (29,646) 937,800 - 6,385,678 - - - (16,619,746) Bond Transfers In (See FN4) - - - - - - 1,348,961 - - 1,348,961 Debt Service Payments (See FN5) (4,644,471) (17,148,410) (3,223,367) (20,000) - - - - - (25,036,248) Subtotal (29,882,239) (15,824,220) (3,253,013) 917,800 - 6,385,678 (17,396,472) - - (59,052,466)
Other Items Not for Current Operating UseUnrealized Gains / (Losses) (See FN6) - - - 54,959 - (10,230) - - - 44,729 Additions to Permanent Endowments (See FN7) - - - - - 3,068,726 - - - 3,068,726 Subtotal - - - 54,959 - 3,058,496 - - - 3,113,455
Total Sources Over / (Under) Uses (See FN 11) (62,007,845) 1,314,194 (1,944,475) 7,409,990 - 9,442,409 (17,505,367) - - (63,291,094)
Depreciation Expense - - - - - - - - (32,253,613) (32,253,613) Transfer of Capital Asset(s) from System - - - - - - - - - - Other Post-Employment Benefit (OPEB) Expense - - - - - - - - - - Non-Cash Capital Gifts - - - - - - - - - - Capital Outlay - - - - - - - - 20,194,333 20,194,333 Change in Net Assets (Total Agrees with AFR***) (62,007,845) 1,314,194 (1,944,475) 7,409,990 - 9,442,409 (17,505,367) - (12,059,280) (75,350,374)
*Defined as any capital outlay expenses from Educational & General, Designated, Auxiliary, or Restricted Expendable Funds.**Defined as any capital outlay expense from funds other than Educational & General, Designated, Auxiliary, or Restricted Expendable.***As reported for "Changes in Net Position" shown on Schedule of Revenues, Expenses, and Changes in Net Position (SRECNP) in Annual Financial Report.
The University of Texas at Austin Medical School (M)For the Year Ended August 31, 2019Source: FY 2019 Annual Financial Report
Detail Worksheet FY 2019
Texas Higher Education Coordinating Board 222 June, 2020

The University of Texas at Austin Medical School (M)For the Year Ended August 31, 2019Source: FY 2019 Annual Financial Report
FOOTNOTES:
FN1: Scholarship Discounts and Allowances are scholarships, fellowships, and grants applied to tuition. The discount eliminates tuition revenues that are paid for by University resources which are recorded as revenue elsewhere on the financial statements (i.e. federal and state contracts and grants revenues). In addition, Scholarship Discounts and Allowances eliminate tuition revenue that is exempted from payment due to tuition exemptions approved by the Texas Legislature. Waivers, remissions, and exemptions represent tuition and fee dollars forgone by the university - some are required by statute. See the Integrated Financial Reporting System (IFRS) report submitted to THECB for details on waivers, exemptions, tuition, and fees. Allocation methods to individual funds shown may vary between institutions.
FN2: Endowment and Interest Income includes interest income and endowment payouts.
FN3: Other Income is primarily Other Operating and Other Non-operating Revenues from the AFR. Other Expenses is primarily Other Nonoperating Expenses from the AFR.
FN4: Bond Proceeds are funds received from the sale of bonds and commercial paper used to finance capital projects. This amount includes actual proceeds and accrued or anticipated proceeds to be transferred from System. Independent institutions report only to the extent expended in current year.
FN5: Debt service payments are payments to service and retire debt issued to fund capital projects. System components do this via transfers to System Administrations. Independent institutions use direct payment to appropriate paying agents.
FN6: Unrealized Gains / (Losses) represent the increase in the Fair Market Value of Investments and Endowments. Unrealized Gains / (Losses) are accrued as non-cash transactions. Therefore, funds are not actually received for this revenue stream. Accordingly, this revenue is not cash revenue and cannot be used by the University to fund operations.
FN7: Additions to Permanent Endowments are additions to endowment principal. This revenue is restricted for investment purposes only and cannot be used to fund operations. Only interest income from these endowments, which is reported on the Endowment and Investment Income line of this report, can be used by the University to fund operations.
FN8: Distributions from the Available University Fund appropriated through the Appropriation Bill are first used to pay debt service costs on Permanent University Fund Bonds. Funds remaining are distributed to constitutionally designated institutions to promote academic excellence. Only the Excellence funding is shown at the institution level. The AUF funds used to pay debt service on PUF bonds are reported at the System level.
FN9: Auxiliary Enterprises include athletics, housing and food, student services, and parking and transportation. Auxiliary Enterprises are required to be self-supporting, and therefore must operate on the funds they generate.
FN10: Mandatory and non-mandatory transfers includes transfers between funds, transfers between the University System and institutions and transfers to and from other state agencies. In total, all transfers between funds net to zero with the exception of any amounts transferred between the University System, between other institutions, or to and from another state agency. There are no transfers of education and general funds provided by the State of Texas to restricted or auxiliary fund groups. Transfers between education and general funds and designated funds are related to Texas Public Education Grant as provided by the State of Texas.
FN11. N/A
Texas Higher Education Coordinating Board 223 June, 2020

The University of Texas Rio Grande Valley Medical School (M)For the Year Ended August 31, 2019Source: FY 2019 Annual Financial Report
Non-operating Funds are not included in charts above. See following page (Summary).May not add to 100% due to rounding.
Total Operating Uses $95,971,480
Total Operating Sources $94,578,226
Total Operating Sources $94,578,226
State of Texas$34,198,586
36%
Student & Parent$3,383,352
4%Federal Government
$6,112,6386%
Institutional Resources$45,666,911
48%
Hospitals, Clinics, Professional Fees
$5,216,7396%
Operating Sources by Category
State Appropriations$30,448,586
32%
State Grants & Contracts$3,750,000
4%
Higher Education Fund$00%
Tuition & Fees$3,383,352
4%Federal Grants &
Contracts$6,112,638
6%
Endowment & Interest Income
$1,462,1312%
Local Government Grants
$26,213,34828%
Private Gifts & Grants$6,405,031
7%
Sales & Services$486,420
0%
Net Auxiliary Enterprises
$00%
Other Income$11,099,981
12%
Professional Fees$5,216,739
5%
Operating Sources
Instruction$25,032,350
26%
Research$16,410,090
17%
Public Service$2,531,492
3%
Academic Support$12,097,812
13%
Student Services$2,279,185
2%
Institutional Support$2,551,116
3%
Operations & Maintenance of Plant
$2,301,4222% Scholarships &
Fellowships$1,481,553
1%Auxiliary Enterprises
$7,5560%
Capital Outlay$1,958,675
2%
Other Expenses$00%
Hospitals & Clinics$29,320,229
31%
Operating Uses
Texas Higher Education Coordinating Board 224 June, 2020

The University of Texas Rio Grande Valley Medical School (M)For the Year Ended August 31, 2019Source: FY 2019 Annual Financial Report
Summary Worksheet FY 2019 Amount Per FTSEInstitution State Funded FTSEs 155.00
Operating SourcesState of TexasState Appropriations (Includes Research, Patient Care, & Public Service) 30,448,586$ State Grants and Contracts - Restricted 3,750,000 Higher Education Fund - Available University Fund Excellence (See FN8) - Subtotal 34,198,586$ -$
Student & ParentTuition - net 2,688,780$ Fees - net 694,572 Tuition and Fees (net of Scholarship Discounts and Allowances) 3,383,352$ -$
Federal GovernmentFederal Grants and Contracts - Restricted 6,112,638$
Professional FeesAll Sources (Net) 5,216,739$
Hospitals and ClinicsAll Sources (Net) -$
Institutional ResourcesEndowment and Interest Income (See FN2) 1,462,131$ Local Government Grants - Restricted 26,213,348 Private Gifts and Grants - Restricted 6,405,031 Sales and Services 486,420 Net Auxiliary Enterprises (See FN9) - Other Income (See FN3) 11,099,981 Subtotal 45,666,911$ Total Operating Sources 94,578,226$
Operating UsesInstruction 25,032,350$ Research 16,410,090 Public Service 2,531,492 Hospitals and Clinics 29,320,229 Academic Support 12,097,812 Student Services 2,279,185 Institutional Support 2,551,116 Operations and Maintenance of Plant 2,301,422 Scholarships and Fellowships 1,481,553 Auxiliary Enterprises (See FN9) 7,556 Capital Outlay from Current Fund Sources 1,958,675 Other Expenses (See FN3) - Total Operating Uses 95,971,480$ -$
Other Sources / (Uses) of FundsCapital Outlay from Non-Current Fund Sources (16,296,328) Mandatory and Non-mandatory Transfers (See FN10) 1,809,392 Bond Transfers In (See FN4) 10,002,268 Debt Service Payments (See FN5) - Subtotal (4,484,668)$
Other Items Not for Current Operating UseUnrealized Gains / (Losses) (See FN6) - Additions to Permanent Endowments (See FN7) - Subtotal -$
Total Sources Over / (Under) Uses (See FN11) (5,877,922)$
Note: Due to the nature of Health-Related Institutions, per FTSE calculations are provided on selected line items.
Texas Higher Education Coordinating Board 225 June, 2020

FY 2019
Operating SourcesEducational &
General DesignatedAuxiliary
EnterprisesRestricted
Expendable Loan Funds
Annuity, Life & Endowment and
Similar FundsUnexpended
PlantRetirement of Indebtedness
Investment In Plant Primary University
State of TexasState Appropriations 30,448,586 - - - - - - - - 30,448,586 State Grants and Contracts - Restricted 3,750,000 - - - - - - - - 3,750,000 Higher Education Fund - - - - - - - - - - Available University Fund Excellence (See FN8) - - - - - - - - - - Subtotal 34,198,586 - - - - - - - - 34,198,586
Student & ParentTuition Potential 100% 1,233,549 1,641,171 - - - - - - - 2,874,720 Waivers - Statutory (Not Reported in AFR) (167,642) - - - - - - - - (167,642) Waivers - Institutional (Not Reported in AFR) - - - - - - - - - - Exemptions - Statutory (Not Reported in AFR) - - - - - - - - - - Exemptions - Institutional (Not Reported in AFR) - - - - - - - - - - Tuition - Gross - AFR Presentation 1,065,907 1,641,171 - - - - - - - 2,707,078 Waivers - Statutory (Reported in AFR) - - - - - - - - - - Waivers - Institutional (Reported in AFR) - - - - - - - - - - Exemptions - Statutory (Reported in AFR) (18,298) - - - - - - - - (18,298) Exemptions - Institutional (Reported in AFR) - - - - - - - - - - All Other Scholarship Disc.& Allow. (See FN1) - - - - - - - - - - Tuition - net 1,047,609 1,641,171 - - - - - - - 2,688,780
Fees Potential 100% 9,764 538,799 146,009 - - - - - - 694,572 Waivers - Statutory (Not Reported in AFR) - - - - - - - - - - Waivers - Institutional (Not Reported in AFR) - - - - - - - - - - Exemptions - Statutory (Not Reported in AFR) - - - - - - - - - - Exemptions - Institutional (Not Reported in AFR) - - - - - - - - - - Fees - Gross - AFR Presentation 9,764 538,799 146,009 - - - - - - 694,572 Waivers - Statutory (Reported in AFR) - - - - - - - - - - Waivers - Institutional (Reported in AFR) - - - - - - - - - - Exemptions - Statutory (Reported in AFR) - - - - - - - - - - Exemptions - Institutional (Reported in AFR) - - - - - - - - - - All Other Scholarship Disc.& Allow. (See FN1) - - - - - - - - - - Fees - net 9,764 538,799 146,009 - - - - - - 694,572
Net Tuition and Fees (Funds Collected) 1,057,373 2,179,970 146,009 - - - - - - 3,383,352
Federal GovernmentFederal Grants and Contracts - Restricted - - - 6,112,638 - - - - - 6,112,638
Professional FeesAll Sources (Net) - 5,216,739 - - - - - - - 5,216,739
Hospitals and ClinicsAll Sources (Net) - - - - - - - - - -
Institutional ResourcesEndowment and Interest Income (See FN2) - 1,326,558 - 135,573 - - - - - 1,462,131 Local Government Grants - Restricted - 26,213,348 - - - - - - - 26,213,348 Private Gifts and Grants - Restricted - 396,425 - 6,008,606 - - - - - 6,405,031 Sales and Services - Educational Activities (Net) - 145,206 - 341,214 - - - - - 486,420 Net Auxiliary Enterprises (See FN9) - - - - - - - - - - Other Income (See FN3) - 11,099,981 - - - - - - - 11,099,981 Subtotal - 39,181,518 - 6,485,393 - - - - - 45,666,911 Total Operating Sources 35,255,959 46,578,227 146,009 12,598,031 - - - - - 94,578,226
Operating UsesInstruction 14,386,352 9,997,557 - 648,441 - - - - - 25,032,350 Research 3,374,175 4,627,737 - 8,408,178 - - - - - 16,410,090 Public Service 14,337 5,648 - 2,511,507 - - - - - 2,531,492 Hospitals and Clinics 1,063,266 28,256,963 - - - - - - - 29,320,229 Academic Support 10,616,926 93,075 - 1,387,811 - - - - - 12,097,812 Student Services 383,039 367,502 - 1,528,644 - - - - - 2,279,185 Institutional Support 2,569,971 (25,550) - 6,695 - - - - - 2,551,116 Operations and Maintenance of Plant 2,441,670 (391,824) - - - - 251,576 - - 2,301,422 Scholarships and Fellowships - 594,160 - 887,393 - - - - - 1,481,553 Auxiliary Enterprises (See FN9) - - 7,556 - - - - - - 7,556 Capital Outlay from Current Fund Sources* 604,422 1,097,874 - 256,379 - - - - - 1,958,675 Other Expenses (See FN3) - - - - - - - - - - Total Operating Uses 35,454,158 44,623,142 7,556 15,635,048 - - 251,576 - - 95,971,480
Other Sources / (Uses) of FundsCapital Outlay from Non-Current Fund Sources** - - - - - - (16,296,328) - - (16,296,328) Mandatory and Non-mandatory Transfers (See FN10) (118,897) 1,430,671 (64,167) 1,522,549 - - (960,764) - - 1,809,392 Bond Transfers In (See FN4) - - - - - - 10,002,268 - - 10,002,268 Debt Service Payments (See FN5) - - - - - - - - - - Subtotal (118,897) 1,430,671 (64,167) 1,522,549 - - (7,254,824) - - (4,484,668)
Other Items Not for Current Operating UseUnrealized Gains / (Losses) (See FN6) - - - - - - - - - - Additions to Permanent Endowments (See FN7) - - - - - - - - - - Subtotal - - - - - - - - - -
Total Sources Over / (Under) Uses (See FN 11) (317,096) 3,385,756 74,286 (1,514,468) - - (7,506,400) - - (5,877,922)
Depreciation Expense - - - - - - - - (8,504,837) (8,504,837) Transfer of Capital Asset(s) from System - - - - - - - - - - Other Post-Employment Benefit (OPEB) Expense - - - - - - - - - - Non-Cash Capital Gifts - - - - - - - - - - Capital Outlay - - - - - - - - - - Change in Net Assets (Total Agrees with AFR***) (317,096) 3,385,756 74,286 (1,514,468) - - (7,506,400) - (8,504,837) (14,382,759)
*Defined as any capital outlay expenses from Educational & General, Designated, Auxiliary, or Restricted Expendable Funds.**Defined as any capital outlay expense from funds other than Educational & General, Designated, Auxiliary, or Restricted Expendable.***As reported for "Changes in Net Position" shown on Schedule of Revenues, Expenses, and Changes in Net Position (SRECNP) in Annual Financial Report.
The University of Texas Rio Grande Valley Medical School (M)For the Year Ended August 31, 2019Source: FY 2019 Annual Financial Report
Detail Worksheet FY 2019
Texas Higher Education Coordinating Board 226 June, 2020

The University of Texas Rio Grande Valley Medical School (M)For the Year Ended August 31, 2019Source: FY 2019 Annual Financial Report
FOOTNOTES:
FN1: Scholarship Discounts and Allowances are scholarships, fellowships, and grants applied to tuition. The discount eliminates tuition revenues that are paid for by University resources which are recorded as revenue elsewhere on the financial statements (i.e. federal and state contracts and grants revenues). In addition, Scholarship Discounts and Allowances eliminate tuition revenue that is exempted from payment due to tuition exemptions approved by the Texas Legislature. Waivers, remissions, and exemptions represent tuition and fee dollars forgone by the university - some are required by statute. See the Integrated Financial Reporting System (IFRS) report submitted to THECB for details on waivers, exemptions, tuition, and fees. Allocation methods to individual funds shown may vary between institutions.
FN2: Endowment and Interest Income includes interest income and endowment payouts.
FN3: Other Income is primarily Other Operating and Other Non-operating Revenues from the AFR. Other Expenses is primarily Other Nonoperating Expenses from the AFR.
FN4: Bond Proceeds are funds received from the sale of bonds and commercial paper used to finance capital projects. This amount includes actual proceeds and accrued or anticipated proceeds to be transferred from System. Independent institutions report only to the extent expended in current year.
FN5: Debt service payments are payments to service and retire debt issued to fund capital projects. System components do this via transfers to System Administrations. Independent institutions use direct payment to appropriate paying agents.
FN6: Unrealized Gains / (Losses) represent the increase in the Fair Market Value of Investments and Endowments. Unrealized Gains / (Losses) are accrued as non-cash transactions. Therefore, funds are not actually received for this revenue stream. Accordingly, this revenue is not cash revenue and cannot be used by the University to fund operations.
FN7: Additions to Permanent Endowments are additions to endowment principal. This revenue is restricted for investment purposes only and cannot be used to fund operations. Only interest income from these endowments, which is reported on the Endowment and Investment Income line of this report, can be used by the University to fund operations.
FN8: Distributions from the Available University Fund appropriated through the Appropriation Bill are first used to pay debt service costs on Permanent University Fund Bonds. Funds remaining are distributed to constitutionally designated institutions to promote academic excellence. Only the Excellence funding is shown at the institution level. The AUF funds used to pay debt service on PUF bonds are reported at the System level.
FN9: Auxiliary Enterprises include athletics, housing and food, student services, and parking and transportation. Auxiliary Enterprises are required to be self-supporting, and therefore must operate on the funds they generate.
FN10: Mandatory and non-mandatory transfers includes transfers between funds, transfers between the University System and institutions and transfers to and from other state agencies. In total, all transfers between funds net to zero with the exception of any amounts transferred between the University System, between other institutions, or to and from another state agency. There are no transfers of education and general funds provided by the State of Texas to restricted or auxiliary fund groups. Transfers between education and general funds and designated funds are related to Texas Public Education Grant as provided by the State of Texas.
FN11. N/A
Texas Higher Education Coordinating Board 227 June, 2020

University of Houston Medical School (M)For the Year Ended August 31, 2019Source: FY 2019 Annual Financial Report
Non-operating Funds are not included in charts above. See following page (Summary).May not add to 100% due to rounding.
Total Operating Uses $4,695,501
Total Operating Sources $4,066,961
Total Operating Sources $4,066,961
State of Texas$00%
Student & Parent$00%
Federal Government$00%
Institutional Resources$4,066,961
100%
Hospitals, Clinics, Professional Fees
$00%
Operating Sources by Category
State Appropriations$00%
State Grants & Contracts
$0, 0%
Higher Education Fund$0, 0%
Tuition & Fees$00%
Federal Grants & Contracts
$0, 0%
Endowment & Interest Income$0, 0%
Local Government Grants$0, 0%
Private Gifts & Grants$4,009,946
99%
Sales & Services$57,015
1%
Net Auxiliary Enterprises
$0, 0%Other Income
$0, 0%Professional Fees
$0, 0%
Operating Sources
Instruction$2,518,054
54%
Research$5,280
0%
Public Service$00%
Academic Support$2,172,167
46%
Student Services$0, 0%
Institutional Support$0, 0%
Operations & Maintenance of Plant
$0, 0%Scholarships &
Fellowships$0, 0%
Auxiliary Enterprises$00%
Capital Outlay$00%
Other Expenses$00%
Hospitals & Clinics$00%
Operating Uses
Texas Higher Education Coordinating Board 228 June, 2020

University of Houston Medical School (M)For the Year Ended August 31, 2019Source: FY 2019 Annual Financial Report
Summary Worksheet FY 2019 Amount Per FTSEInstitution State Funded FTSEs 0.00
Operating SourcesState of TexasState Appropriations (Includes Research, Patient Care, & Public Service) -$ State Grants and Contracts - Restricted - Higher Education Fund - Available University Fund Excellence (See FN8) - Subtotal -$ -$
Student & ParentTuition - net -$ Fees - net - Tuition and Fees (net of Scholarship Discounts and Allowances) -$ -$
Federal GovernmentFederal Grants and Contracts - Restricted -$
Professional FeesAll Sources (Net) -$
Hospitals and ClinicsAll Sources (Net) -$
Institutional ResourcesEndowment and Interest Income (See FN2) -$ Local Government Grants - Restricted - Private Gifts and Grants - Restricted 4,009,946 Sales and Services 57,015 Net Auxiliary Enterprises (See FN9) - Other Income (See FN3) - Subtotal 4,066,961$ Total Operating Sources 4,066,961$
Operating UsesInstruction 2,518,054$ Research 5,280 Public Service - Hospitals and Clinics - Academic Support 2,172,167 Student Services - Institutional Support - Operations and Maintenance of Plant - Scholarships and Fellowships - Auxiliary Enterprises (See FN9) - Capital Outlay from Current Fund Sources - Other Expenses (See FN3) - Total Operating Uses 4,695,501$ -$
Other Sources / (Uses) of FundsCapital Outlay from Non-Current Fund Sources - Mandatory and Non-mandatory Transfers (See FN10) 4,633,595 Bond Transfers In (See FN4) - Debt Service Payments (See FN5) - Subtotal 4,633,595$
Other Items Not for Current Operating UseUnrealized Gains / (Losses) (See FN6) - Additions to Permanent Endowments (See FN7) - Subtotal -$
Total Sources Over / (Under) Uses (See FN11) 4,005,055$
Note: Due to the nature of Health-Related Institutions, per FTSE calculations are provided on selected line items.
Texas Higher Education Coordinating Board 229 June, 2020

FY 2019
Operating SourcesEducational &
General DesignatedAuxiliary
EnterprisesRestricted
Expendable Loan Funds
Annuity, Life & Endowment and
Similar FundsUnexpended
PlantRetirement of Indebtedness
Investment In Plant Primary University
State of TexasState Appropriations - - - - - - - - - - State Grants and Contracts - Restricted - - - - - - - - - - Higher Education Fund - - - - - - - - - - Available University Fund Excellence (See FN8) - - - - - - - - - - Subtotal - - - - - - - - - -
Student & ParentTuition Potential 100% - - - - - - - - - - Waivers - Statutory (Not Reported in AFR) - - - - - - - - - - Waivers - Institutional (Not Reported in AFR) - - - - - - - - - - Exemptions - Statutory (Not Reported in AFR) - - - - - - - - - - Exemptions - Institutional (Not Reported in AFR) - - - - - - - - - - Tuition - Gross - AFR Presentation - - - - - - - - - - Waivers - Statutory (Reported in AFR) - - - - - - - - - - Waivers - Institutional (Reported in AFR) - - - - - - - - - - Exemptions - Statutory (Reported in AFR) - - - - - - - - - - Exemptions - Institutional (Reported in AFR) - - - - - - - - - - All Other Scholarship Disc.& Allow. (See FN1) - - - - - - - - - - Tuition - net - - - - - - - - - -
Fees Potential 100% - - - - - - - - - - Waivers - Statutory (Not Reported in AFR) - - - - - - - - - - Waivers - Institutional (Not Reported in AFR) - - - - - - - - - - Exemptions - Statutory (Not Reported in AFR) - - - - - - - - - - Exemptions - Institutional (Not Reported in AFR) - - - - - - - - - - Fees - Gross - AFR Presentation - - - - - - - - - - Waivers - Statutory (Reported in AFR) - - - - - - - - - - Waivers - Institutional (Reported in AFR) - - - - - - - - - - Exemptions - Statutory (Reported in AFR) - - - - - - - - - - Exemptions - Institutional (Reported in AFR) - - - - - - - - - - All Other Scholarship Disc.& Allow. (See FN1) - - - - - - - - - - Fees - net - - - - - - - - - -
Net Tuition and Fees (Funds Collected) - - - - - - - - - -
Federal GovernmentFederal Grants and Contracts - Restricted - - - - - - - - - -
Professional FeesAll Sources (Net) - - - - - - - - - -
Hospitals and ClinicsAll Sources (Net) - - - - - - - - - -
Institutional ResourcesEndowment and Interest Income (See FN2) - - - - - - - - - - Local Government Grants - Restricted - - - - - - - - - - Private Gifts and Grants - Restricted - 5,030 - 4,004,916 - - - - - 4,009,946 Sales and Services - Educational Activities (Net) - 57,015 - - - - - - - 57,015 Net Auxiliary Enterprises (See FN9) - - - - - - - - - - Other Income (See FN3) - - - - - - - - - - Subtotal - 62,045 - 4,004,916 - - - - - 4,066,961 Total Operating Sources - 62,045 - 4,004,916 - - - - - 4,066,961
Operating UsesInstruction - 2,515,533 - 2,521 - - - - - 2,518,054 Research - - - 5,280 - - - - - 5,280 Public Service - - - - - - - - - - Hospitals and Clinics - - - - - - - - - - Academic Support - 2,164,027 - 8,140 - - - - - 2,172,167 Student Services - - - - - - - - - - Institutional Support - - - - - - - - - - Operations and Maintenance of Plant - - - - - - - - - - Scholarships and Fellowships - - - - - - - - - - Auxiliary Enterprises (See FN9) - - - - - - - - - - Capital Outlay from Current Fund Sources* - - - - - - - - - - Other Expenses (See FN3) - - - - - - - - - - Total Operating Uses - 4,679,560 - 15,941 - - - - - 4,695,501
Other Sources / (Uses) of FundsCapital Outlay from Non-Current Fund Sources** - - - - - - - - - - Mandatory and Non-mandatory Transfers (See FN10) - 4,592,386 - 41,209 - - - - - 4,633,595 Bond Transfers In (See FN4) - - - - - - - - - - Debt Service Payments (See FN5) - - - - - - - - - - Subtotal - 4,592,386 - 41,209 - - - - - 4,633,595
Other Items Not for Current Operating UseUnrealized Gains / (Losses) (See FN6) - - - - - - - - - - Additions to Permanent Endowments (See FN7) - - - - - - - - - - Subtotal - - - - - - - - - -
Total Sources Over / (Under) Uses (See FN 11) - (25,129) - 4,030,184 - - - - - 4,005,055
Depreciation Expense - - - - - - - - - - Transfer of Capital Asset(s) from System - - - - - - - - - - Other Post-Employment Benefit (OPEB) Expense - - - - - - - - - - Non-Cash Capital Gifts - - - - - - - - - - Capital Outlay - - - - - - - - - - Change in Net Assets (Total Agrees with AFR***) - (25,129) - 4,030,184 - - - - - 4,005,055
*Defined as any capital outlay expenses from Educational & General, Designated, Auxiliary, or Restricted Expendable Funds.**Defined as any capital outlay expense from funds other than Educational & General, Designated, Auxiliary, or Restricted Expendable.***As reported for "Changes in Net Position" shown on Schedule of Revenues, Expenses, and Changes in Net Position (SRECNP) in Annual Financial Report.
University of Houston Medical School (M)For the Year Ended August 31, 2019Source: FY 2019 Annual Financial Report
Detail Worksheet FY 2019
Texas Higher Education Coordinating Board 230 June, 2020

University of Houston Medical School (M)For the Year Ended August 31, 2019Source: FY 2019 Annual Financial Report
FOOTNOTES:
FN1: Scholarship Discounts and Allowances are scholarships, fellowships, and grants applied to tuition. The discount eliminates tuition revenues that are paid for by University resources which are recorded as revenue elsewhere on the financial statements (i.e. federal and state contracts and grants revenues). In addition, Scholarship Discounts and Allowances eliminate tuition revenue that is exempted from payment due to tuition exemptions approved by the Texas Legislature. Waivers, remissions, and exemptions represent tuition and fee dollars forgone by the university - some are required by statute. See the Integrated Financial Reporting System (IFRS) report submitted to THECB for details on waivers, exemptions, tuition, and fees. Allocation methods to individual funds shown may vary between institutions.
FN2: Endowment and Interest Income includes interest income and endowment payouts.
FN3: Other Income is primarily Other Operating and Other Non-operating Revenues from the AFR. Other Expenses is primarily Other Nonoperating Expenses from the AFR.
FN4: Bond Proceeds are funds received from the sale of bonds and commercial paper used to finance capital projects. This amount includes actual proceeds and accrued or anticipated proceeds to be transferred from System. Independent institutions report only to the extent expended in current year.
FN5: Debt service payments are payments to service and retire debt issued to fund capital projects. System components do this via transfers to System Administrations. Independent institutions use direct payment to appropriate paying agents.
FN6: Unrealized Gains / (Losses) represent the increase in the Fair Market Value of Investments and Endowments. Unrealized Gains / (Losses) are accrued as non-cash transactions. Therefore, funds are not actually received for this revenue stream. Accordingly, this revenue is not cash revenue and cannot be used by the University to fund operations.
FN7: Additions to Permanent Endowments are additions to endowment principal. This revenue is restricted for investment purposes only and cannot be used to fund operations. Only interest income from these endowments, which is reported on the Endowment and Investment Income line of this report, can be used by the University to fund operations.
FN8: Distributions from the Available University Fund appropriated through the Appropriation Bill are first used to pay debt service costs on Permanent University Fund Bonds. Funds remaining are distributed to constitutionally designated institutions to promote academic excellence. Only the Excellence funding is shown at the institution level. The AUF funds used to pay debt service on PUF bonds are reported at the System level.
FN9: Auxiliary Enterprises include athletics, housing and food, student services, and parking and transportation. Auxiliary Enterprises are required to be self-supporting, and therefore must operate on the funds they generate.
FN10: Mandatory and non-mandatory transfers includes transfers between funds, transfers between the University System and institutions and transfers to and from other state agencies. In total, all transfers between funds net to zero with the exception of any amounts transferred between the University System, between other institutions, or to and from another state agency. There are no transfers of education and general funds provided by the State of Texas to restricted or auxiliary fund groups. Transfers between education and general funds and designated funds are related to Texas Public Education Grant as provided by the State of Texas.
FN11: Of the net increase of $4,005,055 approximately $4.0 million represents revenues received but not year expended. This income is fully committed to program expenditures and capital disbursements. The remaining $0 represents non-expendable funds from unrealized gains and additions to permanent endowments of approximately $0 and $0 respectively. Unrealized gains and additions to permanent endowments do not contribute to the availability of the institution's operating cash as discussed in FN6 and FN7.
Texas Higher Education Coordinating Board 231 June, 2020

Sam Houston State University Medical School (Non-Formula)For the Year Ended August 31, 2019Source: FY 2019 Annual Financial ReportThis data is not included in the Health-Related Institution summary listing, since it is non-formula funded.
Non-operating Funds are not included in charts above. See following page (Summary).May not add to 100% due to rounding.
Total Operating Uses $6,999,987
Total Operating Sources $4,962,931
Total Operating Sources $4,962,931
State of Texas$00%
Student & Parent$00%
Federal Government$00%
Institutional Resources$4,962,931
100%
Hospitals, Clinics, Professional Fees
$00%
Operating Sources by Category
State Appropriations$00%
State Grants & Contracts
$0, 0%
Higher Education Fund$0, 0%
Tuition & Fees$00%
Federal Grants & Contracts
$0, 0%
Endowment & Interest Income
$203, 0%
Local Government Grants$0, 0%
Private Gifts & Grants$4,962,728
100%
Sales & Services$00%
Net Auxiliary Enterprises
$0, 0%
Other Income$0, 0%
Professional Fees$0, 0%
Operating Sources
Instruction$255,460
4%
Research$00%
Public Service$00%
Academic Support$2,859,703
41%
Student Services$202,927, 3%
Institutional Support$588,371, 8%
Operations & Maintenance of Plant
$0, 0% Scholarships & Fellowships
$0, 0%
Auxiliary Enterprises$00%
Capital Outlay$3,075,712
44%
Other Expenses$00%Hospitals & Clinics
$17,8140%
Operating Uses
Texas Higher Education Coordinating Board 232 June, 2020

Sam Houston State University Medical School (Non-Formula)For the Year Ended August 31, 2019Source: FY 2019 Annual Financial ReportThis data is not included in the Health-Related Institution summary listing, since it is non-formula funded.
Summary Worksheet FY 2019 Amount Per FTSEInstitution State Funded FTSEs 0.00
Operating SourcesState of TexasState Appropriations (Includes Research, Patient Care, & Public Service) -$ State Grants and Contracts - Restricted - Higher Education Fund - Available University Fund Excellence (See FN8) - Subtotal -$ -$
Student & ParentTuition - net -$ Fees - net - Tuition and Fees (net of Scholarship Discounts and Allowances) -$ -$
Federal GovernmentFederal Grants and Contracts - Restricted -$
Professional FeesAll Sources (Net) -$
Hospitals and ClinicsAll Sources (Net) -$
Institutional ResourcesEndowment and Interest Income (See FN2) 203$ Local Government Grants - Restricted - Private Gifts and Grants - Restricted 4,962,728 Sales and Services - Net Auxiliary Enterprises (See FN9) - Other Income (See FN3) - Subtotal 4,962,931$ Total Operating Sources 4,962,931$
Operating UsesInstruction 255,460$ Research - Public Service - Hospitals and Clinics 17,814 Academic Support 2,859,703 Student Services 202,927 Institutional Support 588,371 Operations and Maintenance of Plant - Scholarships and Fellowships - Auxiliary Enterprises (See FN9) - Capital Outlay from Current Fund Sources 3,075,712 Other Expenses (See FN3) - Total Operating Uses 6,999,987$ -$
Other Sources / (Uses) of FundsCapital Outlay from Non-Current Fund Sources (38,422,394) Mandatory and Non-mandatory Transfers (See FN10) 32,793,172 Bond Transfers In (See FN4) - Debt Service Payments (See FN5) - Subtotal (5,629,222)$
Other Items Not for Current Operating UseUnrealized Gains / (Losses) (See FN6) 203 Additions to Permanent Endowments (See FN7) 50,000 Subtotal 50,203$
Total Sources Over / (Under) Uses (See FN11) (7,616,075)$
Note: Due to the nature of Health-Related Institutions, per FTSE calculations are provided on selected line items.
Texas Higher Education Coordinating Board 233 June, 2020
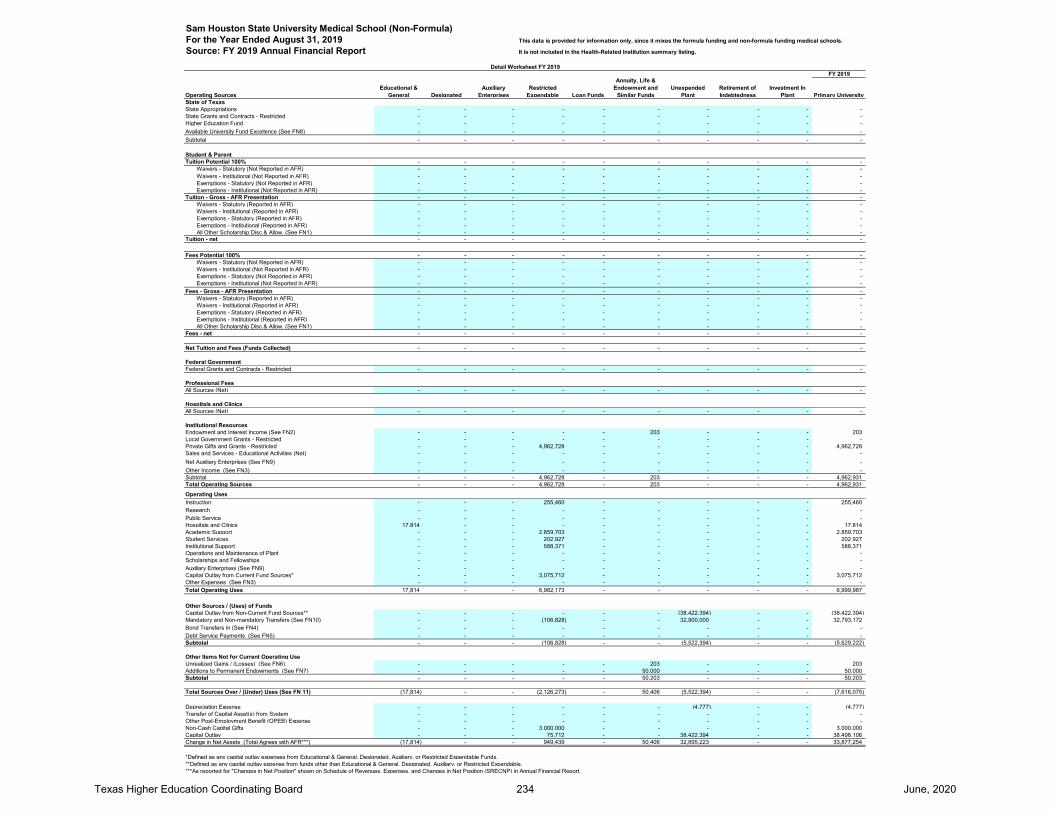
This data is provided for information only, since it mixes the formula funding and non-formula funding medical schools.
It is not included in the Health-Related Institution summary listing.
FY 2019
Operating SourcesEducational &
General DesignatedAuxiliary
EnterprisesRestricted
Expendable Loan Funds
Annuity, Life & Endowment and
Similar FundsUnexpended
PlantRetirement of Indebtedness
Investment In Plant Primary University
State of TexasState Appropriations - - - - - - - - - - State Grants and Contracts - Restricted - - - - - - - - - - Higher Education Fund - - - - - - - - - - Available University Fund Excellence (See FN8) - - - - - - - - - - Subtotal - - - - - - - - - -
Student & ParentTuition Potential 100% - - - - - - - - - - Waivers - Statutory (Not Reported in AFR) - - - - - - - - - - Waivers - Institutional (Not Reported in AFR) - - - - - - - - - - Exemptions - Statutory (Not Reported in AFR) - - - - - - - - - - Exemptions - Institutional (Not Reported in AFR) - - - - - - - - - - Tuition - Gross - AFR Presentation - - - - - - - - - - Waivers - Statutory (Reported in AFR) - - - - - - - - - - Waivers - Institutional (Reported in AFR) - - - - - - - - - - Exemptions - Statutory (Reported in AFR) - - - - - - - - - - Exemptions - Institutional (Reported in AFR) - - - - - - - - - - All Other Scholarship Disc.& Allow. (See FN1) - - - - - - - - - - Tuition - net - - - - - - - - - -
Fees Potential 100% - - - - - - - - - - Waivers - Statutory (Not Reported in AFR) - - - - - - - - - - Waivers - Institutional (Not Reported in AFR) - - - - - - - - - - Exemptions - Statutory (Not Reported in AFR) - - - - - - - - - - Exemptions - Institutional (Not Reported in AFR) - - - - - - - - - - Fees - Gross - AFR Presentation - - - - - - - - - - Waivers - Statutory (Reported in AFR) - - - - - - - - - - Waivers - Institutional (Reported in AFR) - - - - - - - - - - Exemptions - Statutory (Reported in AFR) - - - - - - - - - - Exemptions - Institutional (Reported in AFR) - - - - - - - - - - All Other Scholarship Disc.& Allow. (See FN1) - - - - - - - - - - Fees - net - - - - - - - - - -
Net Tuition and Fees (Funds Collected) - - - - - - - - - -
Federal GovernmentFederal Grants and Contracts - Restricted - - - - - - - - - -
Professional FeesAll Sources (Net) - - - - - - - - - -
Hospitals and ClinicsAll Sources (Net) - - - - - - - - - -
Institutional ResourcesEndowment and Interest Income (See FN2) - - - - - 203 - - - 203 Local Government Grants - Restricted - - - - - - - - - - Private Gifts and Grants - Restricted - - - 4,962,728 - - - - - 4,962,728 Sales and Services - Educational Activities (Net) - - - - - - - - - - Net Auxiliary Enterprises (See FN9) - - - - - - - - - - Other Income (See FN3) - - - - - - - - - - Subtotal - - - 4,962,728 - 203 - - - 4,962,931 Total Operating Sources - - - 4,962,728 - 203 - - - 4,962,931
Operating UsesInstruction - - - 255,460 - - - - - 255,460 Research - - - - - - - - - - Public Service - - - - - - - - - - Hospitals and Clinics 17,814 - - - - - - - - 17,814 Academic Support - - - 2,859,703 - - - - - 2,859,703 Student Services - - - 202,927 - - - - - 202,927 Institutional Support - - - 588,371 - - - - - 588,371 Operations and Maintenance of Plant - - - - - - - - - - Scholarships and Fellowships - - - - - - - - - - Auxiliary Enterprises (See FN9) - - - - - - - - - - Capital Outlay from Current Fund Sources* - - - 3,075,712 - - - - - 3,075,712 Other Expenses (See FN3) - - - - - - - - - - Total Operating Uses 17,814 - - 6,982,173 - - - - - 6,999,987
Other Sources / (Uses) of FundsCapital Outlay from Non-Current Fund Sources** - - - - - - (38,422,394) - - (38,422,394) Mandatory and Non-mandatory Transfers (See FN10) - - - (106,828) - - 32,900,000 - - 32,793,172 Bond Transfers In (See FN4) - - - - - - - - - - Debt Service Payments (See FN5) - - - - - - - - - - Subtotal - - - (106,828) - - (5,522,394) - - (5,629,222)
Other Items Not for Current Operating UseUnrealized Gains / (Losses) (See FN6) - - - - - 203 - - - 203 Additions to Permanent Endowments (See FN7) - - - - - 50,000 - - - 50,000 Subtotal - - - - - 50,203 - - - 50,203
Total Sources Over / (Under) Uses (See FN 11) (17,814) - - (2,126,273) - 50,406 (5,522,394) - - (7,616,075)
Depreciation Expense - - - - - - (4,777) - - (4,777) Transfer of Capital Asset(s) from System - - - - - - - - - - Other Post-Employment Benefit (OPEB) Expense - - - - - - - - - - Non-Cash Capital Gifts - - - 3,000,000 - - - - - 3,000,000 Capital Outlay - - - 75,712 - - 38,422,394 - - 38,498,106 Change in Net Assets (Total Agrees with AFR***) (17,814) - - 949,439 - 50,406 32,895,223 - - 33,877,254
*Defined as any capital outlay expenses from Educational & General, Designated, Auxiliary, or Restricted Expendable Funds.**Defined as any capital outlay expense from funds other than Educational & General, Designated, Auxiliary, or Restricted Expendable.***As reported for "Changes in Net Position" shown on Schedule of Revenues, Expenses, and Changes in Net Position (SRECNP) in Annual Financial Report.
Sam Houston State University Medical School (Non-Formula)For the Year Ended August 31, 2019Source: FY 2019 Annual Financial Report
Detail Worksheet FY 2019
Texas Higher Education Coordinating Board 234 June, 2020

Sam Houston State University Medical School (Non-Formula)For the Year Ended August 31, 2019Source: FY 2019 Annual Financial Report
FOOTNOTES:
FN1: Scholarship Discounts and Allowances are scholarships, fellowships, and grants applied to tuition. The discount eliminates tuition revenues that are paid for by University resources which are recorded as revenue elsewhere on the financial statements (i.e. federal and state contracts and grants revenues). In addition, Scholarship Discounts and Allowances eliminate tuition revenue that is exempted from payment due to tuition exemptions approved by the Texas Legislature. Waivers, remissions, and exemptions represent tuition and fee dollars forgone by the university - some are required by statute. See the Integrated Financial Reporting System (IFRS) report submitted to THECB for details on waivers, exemptions, tuition, and fees. Allocation methods to individual funds shown may vary between institutions.
FN2: Endowment and Interest Income includes interest income and endowment payouts.
FN3: Other Income is primarily Other Operating and Other Non-operating Revenues from the AFR. Other Expenses is primarily Other Nonoperating Expenses from the AFR.
FN4: Bond Proceeds are funds received from the sale of bonds and commercial paper used to finance capital projects. This amount includes actual proceeds and accrued or anticipated proceeds to be transferred from System. Independent institutions report only to the extent expended in current year.
FN5: Debt service payments are payments to service and retire debt issued to fund capital projects. System components do this via transfers to System Administrations. Independent institutions use direct payment to appropriate paying agents.
FN6: Unrealized Gains / (Losses) represent the increase in the Fair Market Value of Investments and Endowments. Unrealized Gains / (Losses) are accrued as non-cash transactions. Therefore, funds are not actually received for this revenue stream. Accordingly, this revenue is not cash revenue and cannot be used by the University to fund operations.
FN7: Additions to Permanent Endowments are additions to endowment principal. This revenue is restricted for investment purposes only and cannot be used to fund operations. Only interest income from these endowments, which is reported on the Endowment and Investment Income line of this report, can be used by the University to fund operations.
FN8: Distributions from the Available University Fund appropriated through the Appropriation Bill are first used to pay debt service costs on Permanent University Fund Bonds. Funds remaining are distributed to constitutionally designated institutions to promote academic excellence. Only the Excellence funding is shown at the institution level. The AUF funds used to pay debt service on PUF bonds are reported at the System level.
FN9: Auxiliary Enterprises include athletics, housing and food, student services, and parking and transportation. Auxiliary Enterprises are required to be self-supporting, and therefore must operate on the funds they generate.
FN10: Mandatory and non-mandatory transfers includes transfers between funds, transfers between the University System and institutions and transfers to and from other state agencies. In total, all transfers between funds net to zero with the exception of any amounts transferred between the University System, between other institutions, or to and from another state agency. There are no transfers of education and general funds provided by the State of Texas to restricted or auxiliary fund groups. Transfers between education and general funds and designated funds are related to Texas Public Education Grant as provided by the State of Texas.
FN11. N/A
Texas Higher Education Coordinating Board 235 June, 2020

Blank Page
Texas Higher Education Coordinating Board 236 June, 2020

Lamar State Colleges & Texas State Technical Colleges
Texas Higher Education Coordinating Board 237 June, 2020

Statewide Summary - Lamar State Colleges & Texas State Technical CollegesFor the Year Ended August 31, 2019Source: FY 2019 Annual Financial Report
Non-Operating Funds are not included in above charts. See following page (Summary).Charts May Not Add to 100% Due to Rounding
Total Operating Uses $238,297,343
Total Operating Sources $305,341,537
Total Operating Sources $305,341,537
State of Texas$176,965,541
58%
Student & Parent$47,612,180
16%
Federal Government$49,965,113
16%
Institutional Resources$30,798,703
10%
Operating Sources by Category
State Appropriations$154,320,942
51%
State Grants & Contracts$7,549,451
2%
Higher Education Fund$15,095,148
5%
Tuition and Fees$47,612,180
16%
Federal Grants & Contracts
$49,965,11316%
Endowment & Interest Income
$1,154,6360%
Local Government Grants
$2,181,3221%
Private Gifts & Grants$2,779,926
1%
Sales & Services$6,384,494
2%
Net Auxiliary Enterprises$8,513,728
3%Other Income
$9,784,5973%
Operating Sources
Instruction$88,924,558
37%
Public Service$2,145,351
1%
Academic Support$22,230,516
10%
Student Services$21,636,024
9% Institutional Support$28,510,886
12%Operations &
Maintenance of Plant$21,533,170
9%
Scholarships & Fellowships$24,428,780
10%
Auxiliary Enterprises$14,043,497
6%Capital Outlay$7,549,185
3%
Other Expenses$7,266,754
3%
Operating Uses
Texas Higher Education Coordinating Board 238 June, 2020

Statewide Summary - Lamar State Colleges & Texas State Technical CollegesFor the Year Ended August 31, 2019Source: FY 2019 Annual Financial Report
Summary Worksheet FY 2019 Amount Per FTSEInstitution State Funded FTSEs 14,387.92
Operating SourcesState of TexasState Appropriations 154,320,942$ 10,726$ State Grants and Contracts - Restricted 7,549,451 525 Higher Education Fund 15,095,148 1,049 Available University Fund Excellence (See FN8) - - Subtotal 176,965,541$ 12,300$
Student & ParentTuition - net 39,618,055$ 2,754$ Fees - net 7,994,125 556 Tuition and Fees (net of Scholarship Discounts and Allowances) 47,612,180$ 3,310$
Federal GovernmentFederal Grants and Contracts - Restricted 49,965,113$ 3,473$
Institutional ResourcesEndowment and Interest Income (See FN2) 1,154,636$ 80$ Local Government Grants - Restricted 2,181,322 152 Private Gifts and Grants - Restricted 2,779,926 193 Sales and Services 6,384,494 444 Net Auxiliary Enterprises (See FN9) 8,513,728 592 Other Income (See FN3) 9,784,597 680 Subtotal 30,798,703$ 2,141$ Total Operating Sources 305,341,537$ 21,224$
Operating UsesInstruction 88,924,558$ 6,181$ Research 28,622 2 Public Service 2,145,351 149 Academic Support 22,230,516 1,545 Student Services 21,636,024 1,504 Institutional Support 28,510,886 1,982 Operations and Maintenance of Plant 21,533,170 1,497 Scholarships and Fellowships 24,428,780 1,698 Auxiliary Enterprises (See FN9) 14,043,497 976 Capital Outlay from Current Fund Sources 7,549,185 525 Other Expenses (See FN3) 7,266,754 505 Total Operating Uses 238,297,343$ 16,564$
Other Sources / (Uses) of FundsCapital Outlay from Non-Current Fund Sources (4,259,570)$ (296)$ Mandatory and Non-mandatory Transfers (See FN10) (7,128,145) (495) Bond Proceeds Transfers (See FN4) 2,057,525 143 Debt Service Payments (See FN5) (7,861,070) (546) Subtotal (17,191,260)$ (1,194)$
Other Items Not for Current Operating UseUnrealized Gains / (Losses) (See FN6) (87,596)$ (6)$ Additions to Permanent Endowments (See FN7) - - Subtotal (87,596)$ (6)$
Total Sources Over / (Under) Uses (See FN11) 49,765,338$ 3,460$
Texas Higher Education Coordinating Board 239 June, 2020

FY 2019
Operating SourcesEducational &
General DesignatedAuxiliary
EnterprisesRestricted
Expendable Loan Funds
Annuity, Life & Endowment and Similar Funds
Unexpended Plant
Retirement of Indebtedness
Investment In Plant Primary University
State of TexasState Appropriations 154,320,942 - - - - - - - - 154,320,942 State Grants and Contracts - Restricted 1,475,150 10,058 - 6,064,243 - - - - - 7,549,451 Research Development Funds/ Texas Competitive Knowledge Funds - - - - - - - - - - Higher Education Fund 15,095,148 - - - - - - - - 15,095,148 Available University Fund Excellence (See FN8) - - - - - - - - - - Subtotal 170,891,240 10,058 - 6,064,243 - - - - - 176,965,541
Student & ParentTuition Potential 100% 17,694,632 53,361,840 - - - - - - - 71,056,472 Waivers - Statutory (Not Reported in AFR) (2,530,590) (55,428) - - - - - - - (2,586,018) Waivers - Institutional (Not Reported in AFR) - - - - - - - - - - Exemptions - Statutory (Not Reported in AFR) (183,985) (304,413) - - - - - - - (488,398) Exemptions - Institutional (Not Reported in AFR) - - - - - - - - - - Tuition - Gross - AFR Presentation 14,980,057 53,001,999 - - - - - - - 67,982,056 Waivers - Statutory (Reported in AFR) - - - - - - - - - - Waivers - Institutional (Reported in AFR) - - - - - - - - - - Exemptions - Statutory (Reported in AFR) (1,068,605) (3,591,497) - - - - - - - (4,660,102) Exemptions - Institutional (Reported in AFR) - - - - - - - - - - All Other Scholarship Disc.& Allow. (See FN1) (5,415,145) (18,288,754) - - - - - - - (23,703,899) Tuition - net 8,496,307 31,121,748 - - - - - - - 39,618,055
Fees Potential 100% 65,041 8,162,822 4,627,892 - - - - - - 12,855,755 Waivers - Statutory (Not Reported in AFR) (4) (609) (867) - - - - - - (1,480) Waivers - Institutional (Not Reported in AFR) - - - - - - - - - - Exemptions - Statutory (Not Reported in AFR) (3,425) (93,800) (172,407) - - - - - - (269,632) Exemptions - Institutional (Not Reported in AFR) - - - - - - - - - - Fees - Gross - AFR Presentation 61,612 8,068,413 4,454,618 - - - - - - 12,584,643 Waivers - Statutory (Reported in AFR) - - - - - - - - - - Waivers - Institutional (Reported in AFR) - - - - - - - - - - Exemptions - Statutory (Reported in AFR) (6,068) (495,599) (588,342) - - - - - - (1,090,009) Exemptions - Institutional (Reported in AFR) - - - - - - - - - - All Other Scholarship Disc.& Allow. (See FN1) (15,509) (2,565,860) (919,140) - - - - - - (3,500,509) Fees - net 40,035 5,006,954 2,947,136 - - - - - - 7,994,125
Net Tuition and Fees (Funds Collected) 8,536,342 36,128,702 2,947,136 - - - - - - 47,612,180
Federal GovernmentFederal Grants and Contracts - Restricted - 58,879 - 49,872,440 - - 33,794 - - 49,965,113
Institutional ResourcesEndowment and Interest Income (See FN2) 125,609 760,698 128,932 45,481 - 5,924 87,992 - - 1,154,636 Local Government Grants - Restricted - - - 1,095,334 - - - 1,085,988 - 2,181,322 Private Gifts and Grants - Restricted - 314,801 - 2,465,125 - - - - - 2,779,926 Sales and Services - 5,966,386 271,819 146,289 - - - - - 6,384,494 Net Auxiliary Enterprises (See FN9) - - 8,513,728 - - - - - - 8,513,728 Other Income (See FN3) 342,364 706,603 108,035 92,697 56,725 - 1,267,315 - 7,210,858 9,784,597 Subtotal 467,973 7,748,488 9,022,514 3,844,926 56,725 5,924 1,355,307 1,085,988 7,210,858 30,798,703 Total Operating Sources 179,895,555 43,946,127 11,969,650 59,781,609 56,725 5,924 1,389,101 1,085,988 7,210,858 305,341,537
Operating UsesInstruction 73,304,992 12,468,763 - 3,150,803 - - - - - 88,924,558 Research - - - 28,622 - - - - - 28,622 Public Service 1,302,797 773,299 - 69,255 - - - - - 2,145,351 Academic Support 16,432,121 3,043,949 - 2,754,446 - - - - - 22,230,516 Student Services 14,631,512 5,176,272 550,318 1,277,922 - - - - - 21,636,024 Institutional Support 20,484,612 7,733,595 - 292,679 - - - - - 28,510,886 Operations and Maintenance of Plant 10,920,781 10,566,389 - 46,000 - - - - - 21,533,170 Scholarships and Fellowships 671,382 1,505,659 - 22,251,739 - - - - - 24,428,780 Auxiliary Enterprises (See FN9) - - 14,043,497 - - - - - - 14,043,497 Capital Outlay from Current Fund Sources* 2,894,888 1,542,602 501,173 2,610,522 - - - - - 7,549,185 Other Expenses (See FN3) 93,733 (2,498) - - 287,438 - 6,888,081 - - 7,266,754 Total Operating Uses 140,736,818 42,808,030 15,094,988 32,481,988 287,438 - 6,888,081 - - 238,297,343
Other Sources / (Uses) of FundsCapital Outlay from Non-Current Fund Sources** - - - - - - (4,259,570) - - (4,259,570) Mandatory and Non-mandatory Transfers (See FN10) (41,514,630) (297,973) 3,029,679 (19,193,756) 1,182,605 29,996 38,885,425 10,772,915 (22,406) (7,128,145) Bond Proceeds Transfers In (See FN4) - - - - - - 2,057,525 - - 2,057,525 Debt Service Payments (See FN5) (4,530,861) (93,590) (231,496) - - - (207,910) (11,858,903) 9,061,690 (7,861,070) Subtotal (46,045,491) (391,563) 2,798,183 (19,193,756) 1,182,605 29,996 36,475,470 (1,085,988) 9,039,284 (17,191,260)
Other Items Not for Current Operating UseUnrealized Gains / (Losses) (See FN6) - 200 - - - - - - (87,796) (87,596) Additions to Permanent Endowments (See FN7) - - - - - - - - - - Subtotal - 200 - - - - - - (87,796) (87,596)
Total Sources Over / (Under) Uses (See FN 11) (6,886,754) 746,734 (327,155) 8,105,865 951,892 35,920 30,976,490 - 16,162,346 49,765,338
Bond Proceeds - - - - - - (2,057,525) - - (2,057,525) Depreciation Expense - - - - - - - - (20,589,316) (20,589,316) Transfer of Capital Asses(s) from System - - - - - - - - 395,497 395,497 Other Post-Employment Benefit (OPEB) Expense - - - - - - - - - - Non-Cash Capital Gifts - - - - - - - - 3,230,757 3,230,757 Capital Outlay 622,497 1,438,986 253,096 2,425,315 - - 6,739,049 - - 11,478,943 Change in Net Assets (Total Agrees with AFR***) (6,264,257) 2,185,720 (74,059) 10,531,180 951,892 35,920 35,658,014 - (800,716) 42,223,694
*Defined as any capital outlay expenses from Educational & General, Designated, Auxiliary, or Restricted Expendable Funds.**Defined as any capital outlay expense from funds other than Educational & General, Designated, Auxiliary, or Restricted Expendable.***As reported for "Changes in Net Position" shown on Schedule of Revenues, Expenses, and Changes in Net Position (SRECNP) in Annual Financial Report.
Detail Worksheet FY 2019
For the Year Ended August 31, 2019Source: FY 2019 Annual Financial Report
Statewide Summary - Lamar State Colleges & Texas State Technical Colleges
Texas Higher Education Coordinating Board 240 June, 2020

Statewide Summary - Lamar State Colleges & Texas State Technical CollegesFor the Year Ended August 31, 2019Source: FY 2019 Annual Financial Report
FOOTNOTES:
FN1: Scholarship Discounts and Allowances are scholarships, fellowships, and grants applied to tuition. The discount eliminates tuition revenues that are paid for by University resources which are recorded as revenue elsewhere on the financial statements (i.e. federal and state contracts and grants revenues). In addition, Scholarship Discounts and Allowances eliminate tuition revenue that is exempted from payment due to tuition exemptions approved by the Texas Legislature. Waivers, remissions, and exemptions represent tuition and fee dollars forgone by the university - some are required by statute. See the Integrated Financial Reporting System (IFRS) report submitted to THECB for details on waivers, exemptions, tuition, and fees. Allocation methods to individual funds shown may vary between institutions.
FN2: Endowment and Interest Income includes interest income and endowment payouts.
FN3: Other Income is primarily Other Operating and Other Non-operating Revenues from the AFR. Other Expenses is primarily Other Nonoperating Expenses from the AFR.
FN4: Bond Proceeds are funds received from the sale of bonds and commercial paper used to finance capital projects. This amount includes actual proceeds and accrued or anticipated proceeds to be transferred from System. Independent institutions report only to the extent expended in current year.
FN5: Debt service payments are payments to service and retire debt issued to fund capital projects. System components do this via transfers to System Administrations. Independent institutions use direct payment to appropriate paying agents.
FN6: Unrealized Gains / (Losses) represent the increase in the Fair Market Value of Investments and Endowments. Unrealized Gains / (Losses) are accrued as non-cash transactions. Therefore, funds are not actually received for this revenue stream. Accordingly, this revenue is not cash revenue and cannot be used by the University to fund operations.
FN7: Additions to Permanent Endowments are additions to endowment principal. This revenue is restricted for investment purposes only and cannot be used to fund operations. Only interest income from these endowments, which is reported on the Endowment and Investment Income line of this report, can be used by the University to fund operations.
FN8: Distributions from the Available University Fund appropriated through the Appropriation Bill are first used to pay debt service costs on Permanent University Fund Bonds. Funds remaining are distributed to constitutionally designated institutions to promote academic excellence. Only the Excellence funding is shown at the institution level. The AUF funds used to pay debt service on PUF bonds are reported at the System level.
FN9: Auxiliary Enterprises include athletics, housing and food, student services, and parking and transportation. Auxiliary Enterprises are required to be self-supporting, and therefore must operate on the funds they generate.
FN10: Mandatory and non-mandatory transfers includes transfers between funds, transfers between the University System and institutions and transfers to and from other state agencies. In total, all transfers between funds net to zero with the exception of any amounts transferred between the University System, between other institutions, or to and from another state agency. There are no transfers of education and general funds provided by the State of Texas to restricted or auxiliary fund groups. Transfers between education and general funds and designated funds are related to Texas Public Education Grant as provided by the State of Texas.
FN11: See each individual institution for the revenues received but not yet expended for each institution. This income is fully committed to program expenditures and capital disbursements. The amount of Non-expendable funds for each institution is provided. Non-expendable funds, including unrealized gains (losses) and additions (reductions) to permanent endowments, are provided for each institution. Unrealized gains (losses) and additions (reductions) to permanent endowments do not contribute to the availability of the institution's operating cash as discussed in FN6 and FN7 above. The total overall increase in Sources Over Uses is provided. If Sources Over Uses is negative, this footnote will be marked N/A.
Texas Higher Education Coordinating Board 241 June, 2020
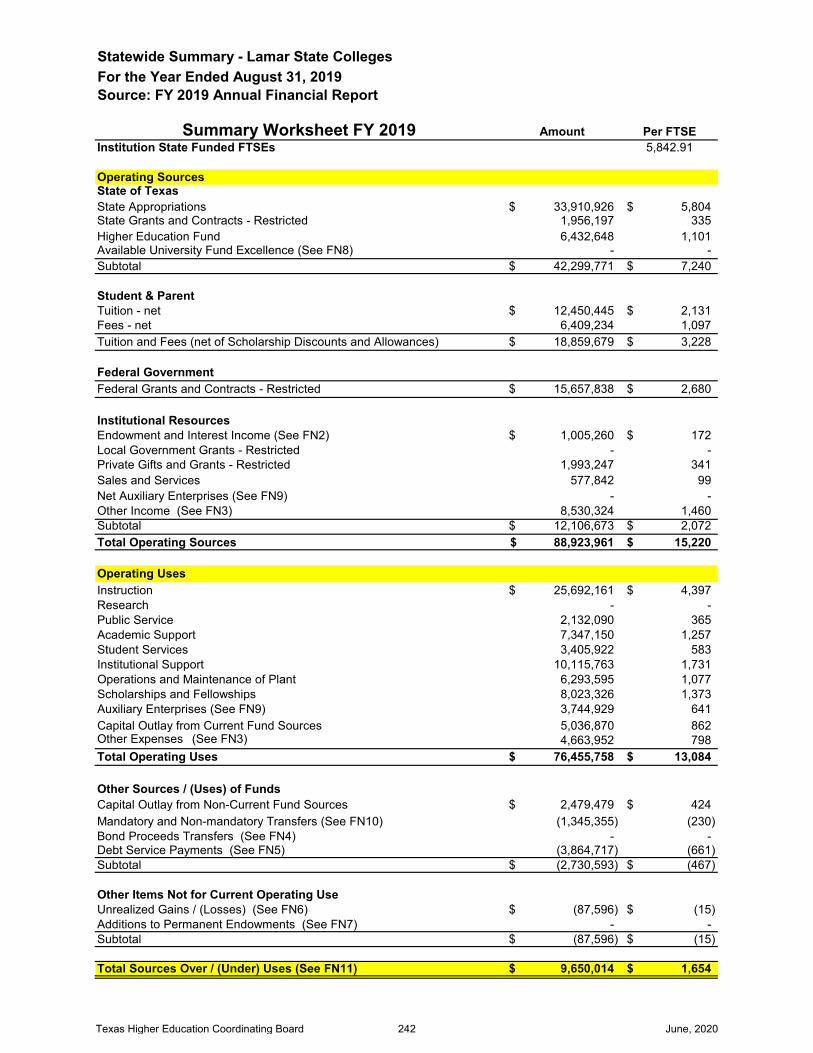
Statewide Summary - Lamar State CollegesFor the Year Ended August 31, 2019Source: FY 2019 Annual Financial Report
Summary Worksheet FY 2019 Amount Per FTSEInstitution State Funded FTSEs 5,842.91
Operating SourcesState of TexasState Appropriations 33,910,926$ 5,804$ State Grants and Contracts - Restricted 1,956,197 335 Higher Education Fund 6,432,648 1,101 Available University Fund Excellence (See FN8) - - Subtotal 42,299,771$ 7,240$
Student & ParentTuition - net 12,450,445$ 2,131$ Fees - net 6,409,234 1,097 Tuition and Fees (net of Scholarship Discounts and Allowances) 18,859,679$ 3,228$
Federal GovernmentFederal Grants and Contracts - Restricted 15,657,838$ 2,680$
Institutional ResourcesEndowment and Interest Income (See FN2) 1,005,260$ 172$ Local Government Grants - Restricted - - Private Gifts and Grants - Restricted 1,993,247 341 Sales and Services 577,842 99 Net Auxiliary Enterprises (See FN9) - - Other Income (See FN3) 8,530,324 1,460 Subtotal 12,106,673$ 2,072$ Total Operating Sources 88,923,961$ 15,220$
Operating UsesInstruction 25,692,161$ 4,397$ Research - - Public Service 2,132,090 365 Academic Support 7,347,150 1,257 Student Services 3,405,922 583 Institutional Support 10,115,763 1,731 Operations and Maintenance of Plant 6,293,595 1,077 Scholarships and Fellowships 8,023,326 1,373 Auxiliary Enterprises (See FN9) 3,744,929 641 Capital Outlay from Current Fund Sources 5,036,870 862 Other Expenses (See FN3) 4,663,952 798 Total Operating Uses 76,455,758$ 13,084$
Other Sources / (Uses) of FundsCapital Outlay from Non-Current Fund Sources 2,479,479$ 424$ Mandatory and Non-mandatory Transfers (See FN10) (1,345,355) (230) Bond Proceeds Transfers (See FN4) - - Debt Service Payments (See FN5) (3,864,717) (661) Subtotal (2,730,593)$ (467)$
Other Items Not for Current Operating UseUnrealized Gains / (Losses) (See FN6) (87,596)$ (15)$ Additions to Permanent Endowments (See FN7) - - Subtotal (87,596)$ (15)$
Total Sources Over / (Under) Uses (See FN11) 9,650,014$ 1,654$
Texas Higher Education Coordinating Board 242 June, 2020

FY 2019
Operating SourcesEducational &
General DesignatedAuxiliary
EnterprisesRestricted
Expendable Loan Funds
Annuity, Life & Endowment and
Similar FundsUnexpended
PlantRetirement of Indebtedness
Investment In Plant Primary University
State of TexasState Appropriations 33,910,926 - - - - - - - - 33,910,926 State Grants and Contracts - Restricted 1,066,979 10,058 - 879,160 - - - - - 1,956,197 Research Development Funds/ Texas Competitive Knowledge Funds - - - - - - - - - - Higher Education Fund 6,432,648 - - - - - - - - 6,432,648 Available University Fund Excellence (See FN8) - - - - - - - - - - Subtotal 41,410,553 10,058 - 879,160 - - - - - 42,299,771
Student & ParentTuition Potential 100% 10,102,445 13,549,976 - - - - - - - 23,652,421 Waivers - Statutory (Not Reported in AFR) (2,300,158) (55,428) - - - - - - - (2,355,586) Waivers - Institutional (Not Reported in AFR) - - - - - - - - - - Exemptions - Statutory (Not Reported in AFR) (183,985) (304,413) - - - - - - - (488,398) Exemptions - Institutional (Not Reported in AFR) - - - - - - - - - - Tuition - Gross - AFR Presentation 7,618,302 13,190,135 - - - - - - - 20,808,437 Waivers - Statutory (Reported in AFR) - - - - - - - - - - Waivers - Institutional (Reported in AFR) - - - - - - - - - - Exemptions - Statutory (Reported in AFR) (148,562) (994,204) - - - - - - - (1,142,766) Exemptions - Institutional (Reported in AFR) - - - - - - - - - - All Other Scholarship Disc.& Allow. (See FN1) (3,264,693) (3,950,533) - - - - - - - (7,215,226) Tuition - net 4,205,047 8,245,398 - - - - - - - 12,450,445
Fees Potential 100% 65,041 5,602,675 4,627,892 - - - - - - 10,295,608 Waivers - Statutory (Not Reported in AFR) (4) (609) (867) - - - - - - (1,480) Waivers - Institutional (Not Reported in AFR) - - - - - - - - - - Exemptions - Statutory (Not Reported in AFR) (3,425) (93,800) (172,407) - - - - - - (269,632) Exemptions - Institutional (Not Reported in AFR) - - - - - - - - - - Fees - Gross - AFR Presentation 61,612 5,508,266 4,454,618 - - - - - - 10,024,496 Waivers - Statutory (Reported in AFR) - - - - - - - - - - Waivers - Institutional (Reported in AFR) - - - - - - - - - - Exemptions - Statutory (Reported in AFR) (6,068) (485,649) (588,342) - - - - - - (1,080,059) Exemptions - Institutional (Reported in AFR) - - - - - - - - - - All Other Scholarship Disc.& Allow. (See FN1) (15,509) (1,600,554) (919,140) - - - - - - (2,535,203) Fees - net 40,035 3,422,063 2,947,136 - - - - - - 6,409,234
Net Tuition and Fees (Funds Collected) 4,245,082 11,667,461 2,947,136 - - - - - - 18,859,679
Federal GovernmentFederal Grants and Contracts - Restricted - 58,879 - 15,565,165 - - 33,794 - - 15,657,838
Institutional ResourcesEndowment and Interest Income (See FN2) 125,609 748,045 94,329 36,676 - - 601 - - 1,005,260 Local Government Grants - Restricted - - - - - - - - - - Private Gifts and Grants - Restricted - 6,875 - 1,986,372 - - - - - 1,993,247 Sales and Services - 159,734 271,819 146,289 - - - - - 577,842 Net Auxiliary Enterprises (See FN9) - - - - - - - - - - Other Income (See FN3) 342,364 706,603 108,035 92,697 56,725 - 13,042 - 7,210,858 8,530,324 Subtotal 467,973 1,621,257 474,183 2,262,034 56,725 - 13,643 - 7,210,858 12,106,673 Total Operating Sources 46,123,608 13,357,655 3,421,319 18,706,359 56,725 - 47,437 - 7,210,858 88,923,961
Operating UsesInstruction 21,680,611 2,546,824 - 1,464,726 - - - - - 25,692,161 Research - - - - - - - - - - Public Service 1,302,797 760,038 - 69,255 - - - - - 2,132,090 Academic Support 5,289,963 2,051,911 - 5,276 - - - - - 7,347,150 Student Services 2,392,871 252,210 550,318 210,523 - - - - - 3,405,922 Institutional Support 5,835,782 4,277,653 - 2,328 - - - - - 10,115,763 Operations and Maintenance of Plant 3,636,969 2,656,626 - - - - - - - 6,293,595 Scholarships and Fellowships 663,331 1,505,659 - 5,854,336 - - - - - 8,023,326 Auxiliary Enterprises (See FN9) - - 3,744,929 - - - - - - 3,744,929 Capital Outlay from Current Fund Sources* 2,805,721 304,446 271,205 1,655,498 - - - - - 5,036,870 Other Expenses (See FN3) 93,733 (1,349) - - 289,343 - 4,282,225 - - 4,663,952 Total Operating Uses 43,701,778 14,354,018 4,566,452 9,261,942 289,343 - 4,282,225 - - 76,455,758
Other Sources / (Uses) of FundsCapital Outlay from Non-Current Fund Sources** - - - - - - 2,479,479 - - 2,479,479 Mandatory and Non-mandatory Transfers (See FN10) (1,477,718) (188,568) 96,206 (536,839) 690,083 29,996 63,891 - (22,406) (1,345,355) Bond Proceeds Transfers In (See FN4) - - - - - - - - - -
Statewide Summary - Lamar State Colleges For the Year Ended August 31, 2019Source: FY 2019 Annual Financial Report
Detail Worksheet FY 2019
Texas Higher Education Coordinating Board 243 June, 2020

Statewide Summary - Texas State Technical CollegesFor the Year Ended August 31, 2019Source: FY 2019 Annual Financial Report
Summary Worksheet FY 2019 Amount Per FTSEInstitution State Funded FTSEs 8,545.01
Operating SourcesState of TexasState Appropriations 120,410,016$ 14,091$ State Grants and Contracts - Restricted 5,593,254 655 Higher Education Fund 8,662,500 1,014 Available University Fund Excellence (See FN8) - - Subtotal 134,665,770$ 15,760$
Student & ParentTuition - net 27,167,610$ 3,179$ Fees - net 1,584,891 185 Tuition and Fees (net of Scholarship Discounts and Allowances) 28,752,501$ 3,364$
Federal GovernmentFederal Grants and Contracts - Restricted 34,307,275$ 4,015$
Institutional ResourcesEndowment and Interest Income (See FN2) 149,376$ 17$ Local Government Grants - Restricted 2,181,322 255 Private Gifts and Grants - Restricted 786,679 92 Sales and Services 5,806,652 680 Net Auxiliary Enterprises (See FN9) 8,513,728 996 Other Income (See FN3) 1,254,273 147 Subtotal 18,692,030$ 2,187$ Total Operating Sources 216,417,576$ 25,326$
Operating UsesInstruction 63,232,397$ 7,400$ Research 28,622 3 Public Service 13,261 2 Academic Support 14,883,366 1,742 Student Services 18,230,102 2,133 Institutional Support 18,395,123 2,153 Operations and Maintenance of Plant 15,239,575 1,783 Scholarships and Fellowships 16,405,454 1,920 Auxiliary Enterprises (See FN9) 10,298,568 1,205 Capital Outlay from Current Fund Sources 2,512,315 294 Other Expenses (See FN3) 2,602,802 305 Total Operating Uses 161,841,585$ 18,940$
Other Sources / (Uses) of FundsCapital Outlay from Non-Current Fund Sources (6,739,049)$ (789)$ Mandatory and Non-mandatory Transfers (See FN10) (5,782,790) (677) Bond Proceeds Transfers (See FN4) 2,057,525 241 Debt Service Payments (See FN5) (3,996,353) (468) Subtotal (14,460,667)$ (1,693)$
Other Items Not for Current Operating UseUnrealized Gains / (Losses) (See FN6) -$ -$ Additions to Permanent Endowments (See FN7) - - Subtotal -$ -$
Total Sources Over / (Under) Uses (See FN11) 40,115,324$ 4,693$
Texas Higher Education Coordinating Board 244 June, 2020

FY 2019
Operating SourcesEducational &
General DesignatedAuxiliary
EnterprisesRestricted
Expendable Loan Funds
Annuity, Life & Endowment and
Similar FundsUnexpended
PlantRetirement of Indebtedness
Investment In Plant Primary University
State of TexasState Appropriations 120,410,016 - - - - - - - - 120,410,016 State Grants and Contracts - Restricted 408,171 - - 5,185,083 - - - - - 5,593,254 Research Development Funds/ Texas Competitive Knowledge Funds - - - - - - - - - - Higher Education Fund 8,662,500 - - - - - - - - 8,662,500 Available University Fund Excellence (See FN8) - - - - - - - - - - Subtotal 129,480,687 - - 5,185,083 - - - - - 134,665,770
Student & ParentTuition Potential 100% 7,592,187 39,811,864 - - - - - - - 47,404,051 Waivers - Statutory (Not Reported in AFR) (230,432) - - - - - - - - (230,432) Waivers - Institutional (Not Reported in AFR) - - - - - - - - - - Exemptions - Statutory (Not Reported in AFR) - - - - - - - - - - Exemptions - Institutional (Not Reported in AFR) - - - - - - - - - - Tuition - Gross - AFR Presentation 7,361,755 39,811,864 - - - - - - - 47,173,619 Waivers - Statutory (Reported in AFR) - - - - - - - - - - Waivers - Institutional (Reported in AFR) - - - - - - - - - - Exemptions - Statutory (Reported in AFR) (920,043) (2,597,293) - - - - - - - (3,517,336) Exemptions - Institutional (Reported in AFR) - - - - - - - - - - All Other Scholarship Disc.& Allow. (See FN1) (2,150,452) (14,338,221) - - - - - - - (16,488,673) Tuition - net 4,291,260 22,876,350 - - - - - - - 27,167,610
Fees Potential 100% - 2,560,147 - - - - - - - 2,560,147 Waivers - Statutory (Not Reported in AFR) - - - - - - - - - - Waivers - Institutional (Not Reported in AFR) - - - - - - - - - - Exemptions - Statutory (Not Reported in AFR) - - - - - - - - - - Exemptions - Institutional (Not Reported in AFR) - - - - - - - - - - Fees - Gross - AFR Presentation - 2,560,147 - - - - - - - 2,560,147 Waivers - Statutory (Reported in AFR) - - - - - - - - - - Waivers - Institutional (Reported in AFR) - - - - - - - - - - Exemptions - Statutory (Reported in AFR) - (9,950) - - - - - - - (9,950) Exemptions - Institutional (Reported in AFR) - - - - - - - - - - All Other Scholarship Disc.& Allow. (See FN1) - (965,306) - - - - - - - (965,306) Fees - net - 1,584,891 - - - - - - - 1,584,891
Net Tuition and Fees (Funds Collected) 4,291,260 24,461,241 - - - - - - - 28,752,501
Federal GovernmentFederal Grants and Contracts - Restricted - - - 34,307,275 - - - - - 34,307,275
Institutional ResourcesEndowment and Interest Income (See FN2) - 12,653 34,603 8,805 - 5,924 87,391 - - 149,376 Local Government Grants - Restricted - - - 1,095,334 - - - 1,085,988 - 2,181,322 Private Gifts and Grants - Restricted - 307,926 - 478,753 - - - - - 786,679 Sales and Services - 5,806,652 - - - - - - - 5,806,652 Net Auxiliary Enterprises (See FN9) - - 8,513,728 - - - - - - 8,513,728 Other Income (See FN3) - - - - - - 1,254,273 - - 1,254,273 Subtotal - 6,127,231 8,548,331 1,582,892 - 5,924 1,341,664 1,085,988 - 18,692,030 Total Operating Sources 133,771,947 30,588,472 8,548,331 41,075,250 - 5,924 1,341,664 1,085,988 - 216,417,576
Operating UsesInstruction 51,624,381 9,921,939 - 1,686,077 - - - - - 63,232,397 Research - - - 28,622 - - - - - 28,622 Public Service - 13,261 - - - - - - - 13,261 Academic Support 11,142,158 992,038 - 2,749,170 - - - - - 14,883,366 Student Services 12,238,641 4,924,062 - 1,067,399 - - - - - 18,230,102 Institutional Support 14,648,830 3,455,942 - 290,351 - - - - - 18,395,123 Operations and Maintenance of Plant 7,283,812 7,909,763 - 46,000 - - - - - 15,239,575 Scholarships and Fellowships 8,051 - - 16,397,403 - - - - - 16,405,454 Auxiliary Enterprises (See FN9) - - 10,298,568 - - - - - - 10,298,568 Capital Outlay from Current Fund Sources* 89,167 1,238,156 229,968 955,024 - - - - - 2,512,315 Other Expenses (See FN3) - (1,149) - - (1,905) - 2,605,856 - - 2,602,802 Total Operating Uses 97,035,040 28,454,012 10,528,536 23,220,046 (1,905) - 2,605,856 - - 161,841,585
Other Sources / (Uses) of FundsCapital Outlay from Non-Current Fund Sources** - - - - - - (6,739,049) - - (6,739,049) Mandatory and Non-mandatory Transfers (See FN10) (40,036,912) (109,405) 2,933,473 (18,656,917) 492,522 - 38,821,534 10,772,915 - (5,782,790) Bond Proceeds Transfers In (See FN4) - - - - - - 2,057,525 - - 2,057,525
Statewide Summary - Texas State Technical CollegesFor the Year Ended August 31, 2019Source: FY 2019 Annual Financial Report
Detail Worksheet FY 2019
Texas Higher Education Coordinating Board 245 June, 2020

Lamar Institute of TechnologyFor the Year Ended August 31, 2019Source: FY 2019 Annual Financial Report
Non-Operating Funds are not included in above charts. See following page (Summary).Charts May Not Add to 100% Due to Rounding
Total Operating Uses $32,170,723
Total Operating Sources $37,441,834
Total Operating Sources $37,441,834
State of Texas$15,142,302
41%
Student & Parent$7,187,488
19%
Federal Government$6,131,058
16%
Institutional Resources$8,980,986
24%
Operating Sources by Category
State Appropriations$12,248,772
33%
State Grants & Contracts$313,009
1%
Higher Education Fund$2,580,521
7%Tuition & Fees$7,187,488
19%
Federal Grants & Contracts$6,131,058
16%
Endowment & Interest Income
$105,5530%
Private Gifts & Grants$1,118,310
3%
Sales & Services$110,667
0%
Other Income$7,646,456
21%
Operating Sources
Instruction$10,807,202
34%
Public Service$1,124,224
3%
Academic Support$1,903,108
6%
Student Services$742,283
2%
Institutional Support$3,577,115
11%
Operations & Maintenance of Plant
$1,726,4915%
Scholarships & Fellowships$2,890,185
9%
Auxiliary Enterprises$1,922,132
6%
Other Expenses$4,668,691
15%
Operating Uses
Texas Higher Education Coordinating Board 246 June, 2020

Lamar Institute of TechnologyFor the Year Ended August 31, 2019Source: FY 2019 Annual Financial Report
Summary Worksheet FY 2019 Amount Per FTSEInstitution State Funded FTSEs 2,410.65
Operating SourcesState of TexasState Appropriations 12,248,772$ 5,081$ State Grants and Contracts - Restricted 313,009 130 Higher Education Fund 2,580,521 1,070 Available University Fund Excellence (See FN8) - - Subtotal 15,142,302$ 6,281$
Student & ParentTuition - net 4,797,515$ 1,990$ Fees - net 2,389,973 991 Tuition and Fees (net of Scholarship Discounts and Allowances) 7,187,488$ 2,981$
Federal GovernmentFederal Grants and Contracts - Restricted 6,131,058$ 2,543$
Institutional ResourcesEndowment and Interest Income (See FN2) 105,553$ 44$ Local Government Grants - Restricted - - Private Gifts and Grants - Restricted 1,118,310 464 Sales and Services 110,667 46 Net Auxiliary Enterprises (See FN9) - - Other Income (See FN3) 7,646,456 3,172 Subtotal 8,980,986$ 3,726$ Total Operating Sources 37,441,834$ 15,531$
Operating UsesInstruction 10,807,202$ 4,483$ Research - - Public Service 1,124,224 466 Academic Support 1,903,108 789 Student Services 742,283 308 Institutional Support 3,577,115 1,484 Operations and Maintenance of Plant 1,726,491 716 Scholarships and Fellowships 2,890,185 1,199 Auxiliary Enterprises (See FN9) 1,922,132 797 Capital Outlay from Current Fund Sources 2,809,292 1,165 Other Expenses (See FN3) 4,668,691 1,937 Total Operating Uses 32,170,723$ 13,344$
Other Sources / (Uses) of FundsCapital Outlay from Non-Current Fund Sources 2,479,479 1,029$ Mandatory and Non-mandatory Transfers (See FN10) (1,317,871) (547) Bond Proceeds Transfers (See FN4) - - Debt Service Payments (See FN5) (1,335,494) (554) Subtotal (173,886)$ (72)$
Other Items Not for Current Operating UseUnrealized Gains / (Losses) (See FN6) - -$ Additions to Permanent Endowments (See FN7) - - Subtotal -$ -$
Total Sources Over / (Under) Uses (See FN11) 5,097,225$ 2,115$
Texas Higher Education Coordinating Board 247 June, 2020

FY 2019
Operating SourcesEducational &
General DesignatedAuxiliary
EnterprisesRestricted
Expendable Loan Funds
Annuity, Life & Endowment and Similar Funds
Unexpended Plant
Retirement of Indebtedness
Investment In Plant Primary University
State of TexasState Appropriations 12,248,772 - - - - - - - - 12,248,772 State Grants and Contracts - Restricted 313,009 - - - - - - - - 313,009 Higher Education Fund 2,580,521 - - - - - - - - 2,580,521 Available University Fund Excellence (See FN8) - - - - - - - - - - Subtotal 15,142,302 - - - - - - - - 15,142,302
Student & ParentTuition Potential 100% 3,460,494 5,375,269 - - - - - - - 8,835,763 Waivers - Statutory (Not Reported in AFR) (315,399) - - - - - - - - (315,399) Waivers - Institutional (Not Reported in AFR) - - - - - - - - - - Exemptions - Statutory (Not Reported in AFR) (183,985) (304,413) - - - - - - - (488,398) Exemptions - Institutional (Not Reported in AFR) - - - - - - - - - - Tuition - Gross - AFR Presentation 2,961,110 5,070,856 - - - - - - - 8,031,966 Waivers - Statutory (Reported in AFR) - - - - - - - - - - Waivers - Institutional (Reported in AFR) - - - - - - - - - - Exemptions - Statutory (Reported in AFR) - - - - - - - - - - Exemptions - Institutional (Reported in AFR) - - - - - - - - - - All Other Scholarship Disc.& Allow. (See FN1) (1,192,431) (2,042,020) - - - - - - - (3,234,451) Tuition - net 1,768,679 3,028,836 - - - - - - - 4,797,515
Fees Potential 100% 18,945 2,290,458 1,961,505 - - - - - - 4,270,908 Waivers - Statutory (Not Reported in AFR) - - - - - - - - - - Waivers - Institutional (Not Reported in AFR) - - - - - - - - - - Exemptions - Statutory (Not Reported in AFR) (3,425) (93,800) (172,407) - - - - - - (269,632) Exemptions - Institutional (Not Reported in AFR) - - - - - - - - - - Fees - Gross - AFR Presentation 15,520 2,196,658 1,789,098 - - - - - - 4,001,276 Waivers - Statutory (Reported in AFR) - - - - - - - - - - Waivers - Institutional (Reported in AFR) - - - - - - - - - - Exemptions - Statutory (Reported in AFR) - - - - - - - - - - Exemptions - Institutional (Reported in AFR) - - - - - - - - - - All Other Scholarship Disc.& Allow. (See FN1) (6,250) (884,588) (720,465) - - - - - - (1,611,303) Fees - net 9,270 1,312,070 1,068,633 - - - - - - 2,389,973
Net Tuition and Fees (Funds Collected) 1,777,949 4,340,906 1,068,633 - - - - - - 7,187,488
Federal GovernmentFederal Grants and Contracts - Restricted - 53,334 - 6,077,724 - - - - - 6,131,058
Institutional ResourcesEndowment and Interest Income (See FN2) 34,812 65,784 4,957 - - - - - - 105,553 Local Government Grants - Restricted - - - - - - - - - - Private Gifts and Grants - Restricted - - - 1,118,310 - - - - - 1,118,310 Sales and Services - - 110,667 - - - - - - 110,667 Net Auxiliary Enterprises (See FN9) - - - - - - - - - - Other Income (See FN3) 204,497 87,803 28,247 45,284 56,725 - 13,042 - 7,210,858 7,646,456 Subtotal 239,309 153,587 143,871 1,163,594 56,725 - 13,042 - 7,210,858 8,980,986 Total Operating Sources 17,159,560 4,547,827 1,212,504 7,241,318 56,725 - 13,042 - 7,210,858 37,441,834
Operating UsesInstruction 8,951,976 1,639,972 - 215,254 - - - - - 10,807,202 Research - - - - - - - - - - Public Service 969,810 154,414 - - - - - - - 1,124,224 Academic Support 1,711,309 191,799 - - - - - - - 1,903,108 Student Services 453,850 84,703 - 203,730 - - - - - 742,283 Institutional Support 1,866,295 1,710,820 - - - - - - - 3,577,115 Operations and Maintenance of Plant 736,655 989,836 - - - - - - - 1,726,491 Scholarships and Fellowships - - - 2,890,185 - - - - - 2,890,185 Auxiliary Enterprises (See FN9) - - 1,922,132 - - - - - - 1,922,132 Capital Outlay from Current Fund Sources* 2,272,391 103,616 248,077 185,208 - - - - - 2,809,292 Other Expenses (See FN3) 93,733 8,315 - - 109,876 - 4,456,767 - - 4,668,691 Total Operating Uses 17,056,019 4,883,475 2,170,209 3,494,377 109,876 - 4,456,767 - - 32,170,723
Other Sources / (Uses) of FundsCapital Outlay from Non-Current Fund Sources** - - - - - - 2,479,479 - - 2,479,479 Mandatory and Non-mandatory Transfers (See FN10) (1,509,372) (496,515) - - 688,016 - - - - (1,317,871) Bond Proceeds Transfers In (See FN4) - - - - - - - - - - Debt Service Payments (See FN5) (1,332,052) (3,442) - - - - - - - (1,335,494) Subtotal (2,841,424) (499,957) - - 688,016 - 2,479,479 - - (173,886)
Other Items Not for Current Operating UseUnrealized Gains / (Losses) (See FN6) - - - - - - - - - - Additions to Permanent Endowments (See FN7) - - - - - - - - - - Subtotal - - - - - - - - - -
Total Sources Over / (Under) Uses (See FN 11) (2,737,883) (835,605) (957,705) 3,746,941 634,865 - (1,964,246) - 7,210,858 5,097,225
Bond Proceeds - - - - - - - - - - Depreciation Expense - - - - - - - - (1,827,662) (1,827,662) Transfer of Capital Asses(s) from System - - - - - - - - 1,994 1,994 Other Post-Employment Benefit (OPEB) Expense - - - - - - - - - - Non-Cash Capital Gifts - - - - - - - - - - Capital Outlay - - - - - - - - - - Change in Net Assets (Total Agrees with AFR***) (2,737,883) (835,605) (957,705) 3,746,941 634,865 - (1,964,246) - 5,385,190 3,271,557
*Defined as any capital outlay expenses from Educational & General, Designated, Auxiliary, or Restricted Expendable Funds.**Defined as any capital outlay expense from funds other than Educational & General, Designated, Auxiliary, or Restricted Expendable.***As reported for "Changes in Net Position" shown on Schedule of Revenues, Expenses, and Changes in Net Position (SRECNP) in Annual Financial Report.
Detail Worksheet FY 2019
Lamar Institute of TechnologyFor the Year Ended August 31, 2019Source: FY 2019 Annual Financial Report
Texas Higher Education Coordinating Board 248 June, 2020

Lamar Institute of TechnologyFor the Year Ended August 31, 2019Source: FY 2019 Annual Financial Report
FOOTNOTES:
FN1: Scholarship Discounts and Allowances are scholarships, fellowships, and grants applied to tuition. The discount eliminates tuition revenues that are paid for by University resources which are recorded as revenue elsewhere on the financial statements (i.e. federal and state contracts and grants revenues). In addition, Scholarship Discounts and Allowances eliminate tuition revenue that is exempted from payment due to tuition exemptions approved by the Texas Legislature. Waivers, remissions, and exemptions represent tuition and fee dollars forgone by the university - some are required by statute. See the Integrated Financial Reporting System (IFRS) report submitted to THECB for details on waivers, exemptions, tuition, and fees. Allocation methods to individual funds shown may vary between institutions.
FN2: Endowment and Interest Income includes interest income and endowment payouts.
FN3: Other Income is primarily Other Operating and Other Non-operating Revenues from the AFR. Other Expenses is primarily Other Nonoperating Expenses from the AFR.
FN4: Bond Proceeds are funds received from the sale of bonds and commercial paper used to finance capital projects. This amount includes actual proceeds and accrued or anticipated proceeds to be transferred from System. Independent institutions report only to the extent expended in current year.
FN5: Debt service payments are payments to service and retire debt issued to fund capital projects. System components do this via transfers to System Administrations. Independent institutions use direct payment to appropriate paying agents.
FN6: Unrealized Gains / (Losses) represent the increase in the Fair Market Value of Investments and Endowments. Unrealized Gains / (Losses) are accrued as non-cash transactions. Therefore, funds are not actually received for this revenue stream. Accordingly, this revenue is not cash revenue and cannot be used by the University to fund operations.
FN7: Additions to Permanent Endowments are additions to endowment principal. This revenue is restricted for investment purposes only and cannot be used to fund operations. Only interest income from these endowments, which is reported on the Endowment and Investment Income line of this report, can be used by the University to fund operations.
FN8: Distributions from the Available University Fund appropriated through the Appropriation Bill are first used to pay debt service costs on Permanent University Fund Bonds. Funds remaining are distributed to constitutionally designated institutions to promote academic excellence. Only the Excellence funding is shown at the institution level. The AUF funds used to pay debt service on PUF bonds are reported at the System level.
FN9: Auxiliary Enterprises include athletics, housing and food, student services, and parking and transportation. Auxiliary Enterprises are required to be self-supporting, and therefore must operate on the funds they generate.
FN10: Mandatory and non-mandatory transfers includes transfers between funds, transfers between the University System and institutions and transfers to and from other state agencies. In total, all transfers between funds net to zero with the exception of any amounts transferred between the University System, between other institutions, or to and from another state agency. There are no transfers of education and general funds provided by the State of Texas to restricted or auxiliary fund groups. Transfers between education and general funds and designated funds are related to Texas Public Education Grant as provided by the State of Texas.
FN11: Of the net increase of $5,097,225 approximately $5.1 million represents revenues received but not yet expended. This income is fully committed to program expenditures and capital disbursements. The remaining $0 represents non-expendable funds from unrealized gains and additions to permanent endowments of approximately $0 and $0 respectively. Unrealized gains and additions to permanent endowments do not contribute to the availability of the institution's operating cash as discussed in FN6 and FN7.
Texas Higher Education Coordinating Board 249 June, 2020

Lamar State College - OrangeFor the Year Ended August 31, 2019Source: FY 2019 Annual Financial Report
Non-Operating Funds are not included in above charts. See following page (Summary).Charts May Not Add to 100% Due to Rounding
Total Operating Uses $19,385,754
Total Operating Sources $23,210,118
Total Operating Sources $23,210,118
State of Texas$12,494,117
54%
Student & Parent$5,199,475
22%
Federal Government$3,978,324
17%
Institutional Resources$1,538,202
7%
Operating Sources by Category
State Appropriations$10,022,870
43%
State Grants & Contracts$776,904
3%Higher Education Fund$1,694,343
7%
Tuition & Fees$5,199,475
23%
Federal Grants & Contracts$3,978,324
17%
Endowment & Interest Income
$645,0223%
Private Gifts & Grants$289,373
1%
Sales & Services$211,027
1% Other Income$392,780
2%
Operating Sources
Instruction$6,812,417
35%
Public Service$813,865
4%
Academic Support$2,598,531
13%
Student Services$1,582,975
8%
Institutional Support$3,066,658
16%
Operations & Maintenance of Plant
$1,905,65010%
Scholarships & Fellowships$2,318,130
12%Capital Outlay
$292,2672%
Other Expenses-$4,739
0%
Operating Uses
Texas Higher Education Coordinating Board 250 June, 2020

Lamar State College - OrangeFor the Year Ended August 31, 2019Source: FY 2019 Annual Financial Report
Summary Worksheet FY 2019 Amount Per FTSEInstitution State Funded FTSEs 1,449.38
Operating SourcesState of TexasState Appropriations 10,022,870$ 6,915$ State Grants and Contracts - Restricted 776,904 536 Higher Education Fund 1,694,343 1,169 Available University Fund Excellence (See FN8) - - Subtotal 12,494,117$ 8,620$
Student & ParentTuition - net 3,508,000$ 2,420$ Fees - net 1,691,475 1,167 Tuition and Fees (net of Scholarship Discounts and Allowances) 5,199,475$ 3,587$
Federal GovernmentFederal Grants and Contracts - Restricted 3,978,324$ 2,745$
Institutional ResourcesEndowment and Interest Income (See FN2) 645,022$ 445$ Local Government Grants - Restricted - - Private Gifts and Grants - Restricted 289,373 200 Sales and Services 211,027 146 Net Auxiliary Enterprises (See FN9) - - Other Income (See FN3) 392,780 271 Subtotal 1,538,202$ 1,062$ Total Operating Sources 23,210,118$ 16,014$
Operating UsesInstruction 6,812,417$ 4,700$ Research - - Public Service 813,865 562 Academic Support 2,598,531 1,793 Student Services 1,582,975 1,092 Institutional Support 3,066,658 2,116 Operations and Maintenance of Plant 1,905,650 1,315 Scholarships and Fellowships 2,318,130 1,599 Auxiliary Enterprises (See FN9) - - Capital Outlay from Current Fund Sources 292,267 202 Other Expenses (See FN3) (4,739) (3) Total Operating Uses 19,385,754$ 13,376$
Other Sources / (Uses) of FundsCapital Outlay from Non-Current Fund Sources - -$ Mandatory and Non-mandatory Transfers (See FN10) 280,961 194 Bond Proceeds Transfers (See FN4) - - Debt Service Payments (See FN5) (1,261,043) (870) Subtotal (980,082)$ (676)$
Other Items Not for Current Operating UseUnrealized Gains / (Losses) (See FN6) (87,596) (60)$ Additions to Permanent Endowments (See FN7) - - Subtotal (87,596)$ (60)$
Total Sources Over / (Under) Uses (See FN11) 2,756,686$ 1,902$
Texas Higher Education Coordinating Board 251 June, 2020

FY 2019
Operating SourcesEducational &
General DesignatedAuxiliary
EnterprisesRestricted
Expendable Loan Funds
Annuity, Life & Endowment and Similar Funds
Unexpended Plant
Retirement of Indebtedness
Investment In Plant Primary University
State of TexasState Appropriations 10,022,870 - - - - - - - - 10,022,870 State Grants and Contracts - Restricted 334,248 - - 442,656 - - - - - 776,904 Higher Education Fund 1,694,343 - - - - - - - - 1,694,343 Available University Fund Excellence (See FN8) - - - - - - - - - - Subtotal 12,051,461 - - 442,656 - - - - - 12,494,117
Student & ParentTuition Potential 100% 3,901,308 3,887,847 - - - - - - - 7,789,155 Waivers - Statutory (Not Reported in AFR) (1,727,178) - - - - - - - - (1,727,178) Waivers - Institutional (Not Reported in AFR) - - - - - - - - - - Exemptions - Statutory (Not Reported in AFR) - - - - - - - - - - Exemptions - Institutional (Not Reported in AFR) - - - - - - - - - - Tuition - Gross - AFR Presentation 2,174,130 3,887,847 - - - - - - - 6,061,977 Waivers - Statutory (Reported in AFR) - - - - - - - - - - Waivers - Institutional (Reported in AFR) - - - - - - - - - - Exemptions - Statutory (Reported in AFR) (77,925) (420,628) - - - - - - - (498,553) Exemptions - Institutional (Reported in AFR) - - - - - - - - - - All Other Scholarship Disc.& Allow. (See FN1) (1,121,714) (933,710) - - - - - - - (2,055,424) Tuition - net 974,491 2,533,509 - - - - - - - 3,508,000
Fees Potential 100% 29,981 1,555,789 843,298 - - - - - - 2,429,068 Waivers - Statutory (Not Reported in AFR) - - - - - - - - - - Waivers - Institutional (Not Reported in AFR) - - - - - - - - - - Exemptions - Statutory (Not Reported in AFR) - - - - - - - - - - Exemptions - Institutional (Not Reported in AFR) - - - - - - - - - - Fees - Gross - AFR Presentation 29,981 1,555,789 843,298 - - - - - - 2,429,068 Waivers - Statutory (Reported in AFR) - - - - - - - - - - Waivers - Institutional (Reported in AFR) - - - - - - - - - - Exemptions - Statutory (Reported in AFR) (4,387) (294,582) (178,575) - - - - - - (477,544) Exemptions - Institutional (Reported in AFR) - - - - - - - - - - All Other Scholarship Disc.& Allow. (See FN1) (4,832) (244,670) (10,547) - - - - - - (260,049) Fees - net 20,762 1,016,537 654,176 - - - - - - 1,691,475
Net Tuition and Fees (Funds Collected) 995,253 3,550,046 654,176 - - - - - - 5,199,475
Federal GovernmentFederal Grants and Contracts - Restricted - - - 3,944,530 - - 33,794 - - 3,978,324
Institutional ResourcesEndowment and Interest Income (See FN2) 33,584 505,292 89,372 16,173 - - 601 - - 645,022 Local Government Grants - Restricted - - - - - - - - - - Private Gifts and Grants - Restricted - 6,500 - 282,873 - - - - - 289,373 Sales and Services - 150,854 60,173 - - - - - - 211,027 Net Auxiliary Enterprises (See FN9) - - - - - - - - - - Other Income (See FN3) - 391,150 1,630 - - - - - - 392,780 Subtotal 33,584 1,053,796 151,175 299,046 - - 601 - - 1,538,202 Total Operating Sources 13,080,298 4,603,842 805,351 4,686,232 - - 34,395 - - 23,210,118
Operating UsesInstruction 5,587,450 549,735 - 675,232 - - - - - 6,812,417 Research - - - - - - - - - - Public Service 176,273 597,635 - 39,957 - - - - - 813,865 Academic Support 1,640,274 958,257 - - - - - - - 2,598,531 Student Services 950,352 82,305 550,318 - - - - - - 1,582,975 Institutional Support 1,728,149 1,338,509 - - - - - - - 3,066,658 Operations and Maintenance of Plant 1,447,839 457,811 - - - - - - - 1,905,650 Scholarships and Fellowships 171,291 248,353 - 1,898,486 - - - - - 2,318,130 Auxiliary Enterprises (See FN9) - - - - - - - - - - Capital Outlay from Current Fund Sources* 101,356 69,826 - 121,085 - - - - - 292,267 Other Expenses (See FN3) - (9,664) - - 179,467 - (174,542) - - (4,739) Total Operating Uses 11,802,984 4,292,767 550,318 2,734,760 179,467 - (174,542) - - 19,385,754
Other Sources / (Uses) of FundsCapital Outlay from Non-Current Fund Sources** - - - - - - - - - - Mandatory and Non-mandatory Transfers (See FN10) 374,047 (156,977) - - - - 63,891 - - 280,961 Bond Proceeds Transfers In (See FN4) - - - - - - - - - - Debt Service Payments (See FN5) (1,259,659) (1,384) - - - - - - - (1,261,043) Subtotal (885,612) (158,361) - - - - 63,891 - - (980,082)
Other Items Not for Current Operating UseUnrealized Gains / (Losses) (See FN6) - 200 - - - - - - (87,796) (87,596) Additions to Permanent Endowments (See FN7) - - - - - - - - - - Subtotal - 200 - - - - - - (87,796) (87,596)
Total Sources Over / (Under) Uses (See FN 11) 391,702 152,914 255,033 1,951,472 (179,467) - 272,828 - (87,796) 2,756,686
Bond Proceeds - - - - - - - - - - Depreciation Expense - - - - - - - - (1,985,335) (1,985,335) Transfer of Capital Asses(s) from System - - - - - - - - - - Other Post-Employment Benefit (OPEB) Expense - - - - - - - - - - Non-Cash Capital Gifts - - - - - - - - - - Capital Outlay 101,356 69,826 - 121,085 - - - - - 292,267 Change in Net Assets (Total Agrees with AFR***) 493,058 222,740 255,033 2,072,557 (179,467) - 272,828 - (2,073,131) 1,063,618
*Defined as any capital outlay expenses from Educational & General, Designated, Auxiliary, or Restricted Expendable Funds.**Defined as any capital outlay expense from funds other than Educational & General, Designated, Auxiliary, or Restricted Expendable.***As reported for "Changes in Net Position" shown on Schedule of Revenues, Expenses, and Changes in Net Position (SRECNP) in Annual Financial Report.
Detail Worksheet FY 2019
Lamar State College - OrangeFor the Year Ended August 31, 2019Source: FY 2019 Annual Financial Report
Texas Higher Education Coordinating Board 252 June, 2020

Lamar State College - OrangeFor the Year Ended August 31, 2019Source: FY 2019 Annual Financial Report
FOOTNOTES:
FN1: Scholarship Discounts and Allowances are scholarships, fellowships, and grants applied to tuition. The discount eliminates tuition revenues that are paid for by University resources which are recorded as revenue elsewhere on the financial statements (i.e. federal and state contracts and grants revenues). In addition, Scholarship Discounts and Allowances eliminate tuition revenue that is exempted from payment due to tuition exemptions approved by the Texas Legislature. Waivers, remissions, and exemptions represent tuition and fee dollars forgone by the university - some are required by statute. See the Integrated Financial Reporting System (IFRS) report submitted to THECB for details on waivers, exemptions, tuition, and fees. Allocation methods to individual funds shown may vary between institutions.
FN2: Endowment and Interest Income includes interest income and endowment payouts.
FN3: Other Income is primarily Other Operating and Other Non-operating Revenues from the AFR. Other Expenses is primarily Other Nonoperating Expenses from the AFR.
FN4: Bond Proceeds are funds received from the sale of bonds and commercial paper used to finance capital projects. This amount includes actual proceeds and accrued or anticipated proceeds to be transferred from System. Independent institutions report only to the extent expended in current year.
FN5: Debt service payments are payments to service and retire debt issued to fund capital projects. System components do this via transfers to System Administrations. Independent institutions use direct payment to appropriate paying agents.
FN6: Unrealized Gains / (Losses) represent the increase in the Fair Market Value of Investments and Endowments. Unrealized Gains / (Losses) are accrued as non-cash transactions. Therefore, funds are not actually received for this revenue stream. Accordingly, this revenue is not cash revenue and cannot be used by the University to fund operations.
FN7: Additions to Permanent Endowments are additions to endowment principal. This revenue is restricted for investment purposes only and cannot be used to fund operations. Only interest income from these endowments, which is reported on the Endowment and Investment Income line of this report, can be used by the University to fund operations.
FN8: Distributions from the Available University Fund appropriated through the Appropriation Bill are first used to pay debt service costs on Permanent University Fund Bonds. Funds remaining are distributed to constitutionally designated institutions to promote academic excellence. Only the Excellence funding is shown at the institution level. The AUF funds used to pay debt service on PUF bonds are reported at the System level.
FN9: Auxiliary Enterprises include athletics, housing and food, student services, and parking and transportation. Auxiliary Enterprises are required to be self-supporting, and therefore must operate on the funds they generate.
FN10: Mandatory and non-mandatory transfers includes transfers between funds, transfers between the University System and institutions and transfers to and from other state agencies. In total, all transfers between funds net to zero with the exception of any amounts transferred between the University System, between other institutions, or to and from another state agency. There are no transfers of education and general funds provided by the State of Texas to restricted or auxiliary fund groups. Transfers between education and general funds and designated funds are related to Texas Public Education Grant as provided by the State of Texas.
FN11: Of the net increase of $2,756,686 approximately $2.8 million represents revenues received but not yet expended. This income is fully committed to program expenditures and capital disbursements. The remaining $0 represents non-expendable funds from unrealized gains and additions to permanent endowments of approximately $0 and $0 respectively. Unrealized gains and additions to permanent endowments do not contribute to the availability of the institution's operating cash as discussed in FN6 and FN7.
Texas Higher Education Coordinating Board 253 June, 2020

Lamar State College - Port ArthurFor the Year Ended August 31, 2019Source: FY 2019 Annual Financial Report
Non-Operating Funds are not included in above charts. See following page (Summary).Charts May Not Add to 100% Due to Rounding
Total Operating Uses $24,899,281
Total Operating Sources $28,272,009
Total Operating Sources $28,272,009
State of Texas$14,663,352
52%
Student & Parent$6,472,716
23%
Federal Government$5,548,456
20%
Institutional Resources$1,587,485
5%
Operating Sources by Category
State Appropriations$11,639,284
41%
State Grants & Contracts$866,284
3%Higher Education Fund
$2,157,7848%
Tuition & Fees$6,472,716
23%
Federal Grants & Contracts$5,548,456
19%
Endowment & Interest Income
$254,6851%
Private Gifts & Grants$585,564
2%
Sales & Services$256,148
1% Other Income$491,088
2%
Operating Sources
Instruction$8,072,542
32%
Public Service$194,001
1%
Academic Support$2,845,511
12%
Student Services$1,080,664
4%
Institutional Support$3,471,990
14% Operations & Maintenance of Plant
$2,661,45411%
Scholarships & Fellowships$2,815,011
11%
Auxiliary Enterprises$1,822,797
7%Capital Outlay
$1,935,3118%
Operating Uses
Texas Higher Education Coordinating Board 254 June, 2020

Lamar State College - Port ArthurFor the Year Ended August 31, 2019Source: FY 2019 Annual Financial Report
Summary Worksheet FY 2019 Amount Per FTSEInstitution State Funded FTSEs 1,982.88
Operating SourcesState of TexasState Appropriations 11,639,284$ 5,870$ State Grants and Contracts - Restricted 866,284 437 Higher Education Fund 2,157,784 1,088 Available University Fund Excellence (See FN8) - - Subtotal 14,663,352$ 7,395$
Student & ParentTuition - net 4,144,930$ 2,090$ Fees - net 2,327,786 1,174 Tuition and Fees (net of Scholarship Discounts and Allowances) 6,472,716$ 3,264$
Federal GovernmentFederal Grants and Contracts - Restricted 5,548,456$ 2,798$
Institutional ResourcesEndowment and Interest Income (See FN2) 254,685$ 128$ Local Government Grants - Restricted - - Private Gifts and Grants - Restricted 585,564 295 Sales and Services 256,148 129 Net Auxiliary Enterprises (See FN9) - - Other Income (See FN3) 491,088 248 Subtotal 1,587,485$ 800$ Total Operating Sources 28,272,009$ 14,257$
Operating UsesInstruction 8,072,542$ 4,071$ Research - - Public Service 194,001 98 Academic Support 2,845,511 1,435 Student Services 1,080,664 545 Institutional Support 3,471,990 1,751 Operations and Maintenance of Plant 2,661,454 1,342 Scholarships and Fellowships 2,815,011 1,420 Auxiliary Enterprises (See FN9) 1,822,797 919 Capital Outlay from Current Fund Sources 1,935,311 976 Other Expenses (See FN3) - - Total Operating Uses 24,899,281$ 12,557$
Other Sources / (Uses) of FundsCapital Outlay from Non-Current Fund Sources - -$ Mandatory and Non-mandatory Transfers (See FN10) (308,445) (156) Bond Proceeds Transfers (See FN4) - - Debt Service Payments (See FN5) (1,268,180) (640) Subtotal (1,576,625)$ (796)$
Other Items Not for Current Operating UseUnrealized Gains / (Losses) (See FN6) - -$ Additions to Permanent Endowments (See FN7) - - Subtotal -$ -$
Total Sources Over / (Under) Uses (See FN11) 1,796,103$ 904$
Texas Higher Education Coordinating Board 255 June, 2020

FY 2019
Operating SourcesEducational &
General DesignatedAuxiliary
EnterprisesRestricted
Expendable Loan Funds
Annuity, Life & Endowment and Similar Funds
Unexpended Plant
Retirement of Indebtedness
Investment In Plant Primary University
State of TexasState Appropriations 11,639,284 - - - - - - - - 11,639,284 State Grants and Contracts - Restricted 419,722 10,058 - 436,504 - - - - - 866,284 Higher Education Fund 2,157,784 - - - - - - - - 2,157,784 Available University Fund Excellence (See FN8) - - - - - - - - - - Subtotal 14,216,790 10,058 - 436,504 - - - - - 14,663,352
Student & ParentTuition Potential 100% 2,740,643 4,286,860 - - - - - - - 7,027,503 Waivers - Statutory (Not Reported in AFR) (257,581) (55,428) - - - - - - - (313,009) Waivers - Institutional (Not Reported in AFR) - - - - - - - - - - Exemptions - Statutory (Not Reported in AFR) - - - - - - - - - - Exemptions - Institutional (Not Reported in AFR) - - - - - - - - - - Tuition - Gross - AFR Presentation 2,483,062 4,231,432 - - - - - - - 6,714,494 Waivers - Statutory (Reported in AFR) - - - - - - - - - - Waivers - Institutional (Reported in AFR) - - - - - - - - - - Exemptions - Statutory (Reported in AFR) (70,637) (573,576) - - - - - - - (644,213) Exemptions - Institutional (Reported in AFR) - - - - - - - - - - All Other Scholarship Disc.& Allow. (See FN1) (950,548) (974,803) - - - - - - - (1,925,351) Tuition - net 1,461,877 2,683,053 - - - - - - - 4,144,930
Fees Potential 100% 16,115 1,756,428 1,823,089 - - - - - - 3,595,632 Waivers - Statutory (Not Reported in AFR) (4) (609) (867) - - - - - - (1,480) Waivers - Institutional (Not Reported in AFR) - - - - - - - - - - Exemptions - Statutory (Not Reported in AFR) - - - - - - - - - - Exemptions - Institutional (Not Reported in AFR) - - - - - - - - - - Fees - Gross - AFR Presentation 16,111 1,755,819 1,822,222 - - - - - - 3,594,152 Waivers - Statutory (Reported in AFR) - - - - - - - - - - Waivers - Institutional (Reported in AFR) - - - - - - - - - - Exemptions - Statutory (Reported in AFR) (1,681) (191,067) (409,767) - - - - - - (602,515) Exemptions - Institutional (Reported in AFR) - - - - - - - - - - All Other Scholarship Disc.& Allow. (See FN1) (4,427) (471,296) (188,128) - - - - - - (663,851) Fees - net 10,003 1,093,456 1,224,327 - - - - - - 2,327,786
Net Tuition and Fees (Funds Collected) 1,471,880 3,776,509 1,224,327 - - - - - - 6,472,716
Federal GovernmentFederal Grants and Contracts - Restricted - 5,545 - 5,542,911 - - - - - 5,548,456
Institutional ResourcesEndowment and Interest Income (See FN2) 57,213 176,969 - 20,503 - - - - - 254,685 Local Government Grants - Restricted - - - - - - - - - - Private Gifts and Grants - Restricted - 375 - 585,189 - - - - - 585,564 Sales and Services - 8,880 100,979 146,289 - - - - - 256,148 Net Auxiliary Enterprises (See FN9) - - - - - - - - - - Other Income (See FN3) 137,867 227,650 78,158 47,413 - - - - - 491,088 Subtotal 195,080 413,874 179,137 799,394 - - - - - 1,587,485 Total Operating Sources 15,883,750 4,205,986 1,403,464 6,778,809 - - - - - 28,272,009
Operating UsesInstruction 7,141,185 357,117 - 574,240 - - - - - 8,072,542 Research - - - - - - - - - - Public Service 156,714 7,989 - 29,298 - - - - - 194,001 Academic Support 1,938,380 901,855 - 5,276 - - - - - 2,845,511 Student Services 988,669 85,202 - 6,793 - - - - - 1,080,664 Institutional Support 2,241,338 1,228,324 - 2,328 - - - - - 3,471,990 Operations and Maintenance of Plant 1,452,475 1,208,979 - - - - - - - 2,661,454 Scholarships and Fellowships 492,040 1,257,306 - 1,065,665 - - - - - 2,815,011 Auxiliary Enterprises (See FN9) - - 1,822,797 - - - - - - 1,822,797 Capital Outlay from Current Fund Sources* 431,974 131,004 23,128 1,349,205 - - - - - 1,935,311 Other Expenses (See FN3) - - - - - - - - - - Total Operating Uses 14,842,775 5,177,776 1,845,925 3,032,805 - - - - - 24,899,281
Other Sources / (Uses) of FundsCapital Outlay from Non-Current Fund Sources** - - - - - - - - - - Mandatory and Non-mandatory Transfers (See FN10) (342,393) 464,924 96,206 (536,839) 2,067 29,996 - - (22,406) (308,445) Bond Proceeds Transfers In (See FN4) - - - - - - - - - - Debt Service Payments (See FN5) (1,268,180) - - - - - - - - (1,268,180) Subtotal (1,610,573) 464,924 96,206 (536,839) 2,067 29,996 - - (22,406) (1,576,625)
Other Items Not for Current Operating UseUnrealized Gains / (Losses) (See FN6) - - - - - - - - - - Additions to Permanent Endowments (See FN7) - - - - - - - - - - Subtotal - - - - - - - - - -
Total Sources Over / (Under) Uses (See FN 11) (569,598) (506,866) (346,255) 3,209,165 2,067 29,996 - - (22,406) 1,796,103
Bond Proceeds - - - - - - - - - - Depreciation Expense - - - - - - - - (1,808,768) (1,808,768) Transfer of Capital Asses(s) from System - - - - - - - - - - Other Post-Employment Benefit (OPEB) Expense - - - - - - - - - - Non-Cash Capital Gifts - - - - - - - - - - Capital Outlay 431,974 131,004 23,128 1,349,205 - - - - - 1,935,311 Change in Net Assets (Total Agrees with AFR***) (137,624) (375,862) (323,127) 4,558,370 2,067 29,996 - - (1,831,174) 1,922,646
*Defined as any capital outlay expenses from Educational & General, Designated, Auxiliary, or Restricted Expendable Funds.**Defined as any capital outlay expense from funds other than Educational & General, Designated, Auxiliary, or Restricted Expendable.***As reported for "Changes in Net Position" shown on Schedule of Revenues, Expenses, and Changes in Net Position (SRECNP) in Annual Financial Report.
Detail Worksheet FY 2019
Lamar State College - Port ArthurFor the Year Ended August 31, 2019Source: FY 2019 Annual Financial Report
Texas Higher Education Coordinating Board 256 June, 2020

Lamar State College - Port ArthurFor the Year Ended August 31, 2019Source: FY 2019 Annual Financial Report
FOOTNOTES:
FN1: Scholarship Discounts and Allowances are scholarships, fellowships, and grants applied to tuition. The discount eliminates tuition revenues that are paid for by University resources which are recorded as revenue elsewhere on the financial statements (i.e. federal and state contracts and grants revenues). In addition, Scholarship Discounts and Allowances eliminate tuition revenue that is exempted from payment due to tuition exemptions approved by the Texas Legislature. Waivers, remissions, and exemptions represent tuition and fee dollars forgone by the university - some are required by statute. See the Integrated Financial Reporting System (IFRS) report submitted to THECB for details on waivers, exemptions, tuition, and fees. Allocation methods to individual funds shown may vary between institutions.
FN2: Endowment and Interest Income includes interest income and endowment payouts.
FN3: Other Income is primarily Other Operating and Other Non-operating Revenues from the AFR. Other Expenses is primarily Other Nonoperating Expenses from the AFR.
FN4: Bond Proceeds are funds received from the sale of bonds and commercial paper used to finance capital projects. This amount includes actual proceeds and accrued or anticipated proceeds to be transferred from System. Independent institutions report only to the extent expended in current year.
FN5: Debt service payments are payments to service and retire debt issued to fund capital projects. System components do this via transfers to System Administrations. Independent institutions use direct payment to appropriate paying agents.
FN6: Unrealized Gains / (Losses) represent the increase in the Fair Market Value of Investments and Endowments. Unrealized Gains / (Losses) are accrued as non-cash transactions. Therefore, funds are not actually received for this revenue stream. Accordingly, this revenue is not cash revenue and cannot be used by the University to fund operations.
FN7: Additions to Permanent Endowments are additions to endowment principal. This revenue is restricted for investment purposes only and cannot be used to fund operations. Only interest income from these endowments, which is reported on the Endowment and Investment Income line of this report, can be used by the University to fund operations.
FN8: Distributions from the Available University Fund appropriated through the Appropriation Bill are first used to pay debt service costs on Permanent University Fund Bonds. Funds remaining are distributed to constitutionally designated institutions to promote academic excellence. Only the Excellence funding is shown at the institution level. The AUF funds used to pay debt service on PUF bonds are reported at the System level.
FN9: Auxiliary Enterprises include athletics, housing and food, student services, and parking and transportation. Auxiliary Enterprises are required to be self-supporting, and therefore must operate on the funds they generate.
FN10: Mandatory and non-mandatory transfers includes transfers between funds, transfers between the University System and institutions and transfers to and from other state agencies. In total, all transfers between funds net to zero with the exception of any amounts transferred between the University System, between other institutions, or to and from another state agency. There are no transfers of education and general funds provided by the State of Texas to restricted or auxiliary fund groups. Transfers between education and general funds and designated funds are related to Texas Public Education Grant as provided by the State of Texas.
FN11: Of the net increase of $1,796,103 approximately $1.8 million represents revenues received but not yet expended. This income is fully committed to program expenditures and capital disbursements. The remaining $0 represents non-expendable funds from unrealized gains and additions to permanent endowments of approximately $0 and $0 respectively. Unrealized gains and additions to permanent endowments do not contribute to the availability of the institution's operating cash as discussed in FN6 and FN7.
Texas Higher Education Coordinating Board 257 June, 2020

Texas State Technical College - HarlingenFor the Year Ended August 31, 2019Source: FY 2019 Annual Financial Report
Non-Operating Funds are not included in above charts. See following page (Summary).Charts May Not Add to 100% Due to Rounding
Total Operating Uses $46,680,963
Total Operating Sources $55,301,397
Total Operating Sources $55,301,397
State of Texas$28,579,520
52%
Student & Parent$7,135,153
13%
Federal Government$15,658,234
28%
Institutional Resources$3,928,490
7%
Operating Sources by Category
State Appropriations$24,202,283
44%
State Grants & Contracts$1,926,957
4%Higher Education Fund
$2,450,2805%
Tuition & Fees$7,135,153
13%
Federal Grants & Contracts
$15,658,23428%
Endowment & Interest Income$32,069
0%
Local Government Grants
$216,1180%
Private Gifts & Grants$147,731
0%
Sales & Services$2,200,486
4% Net Auxiliary Enterprises$1,332,086
2%
Operating Sources
Instruction$17,855,642
38%
Public Service$13,261
0%
Academic Support$4,862,762
10%Student Services
$5,130,96511% Institutional Support
$4,739,12810%
Operations & Maintenance of Plant
$3,999,5529%
Scholarships & Fellowships$7,091,208
15%
Auxiliary Enterprises$1,662,734
4%
Capital Outlay$673,095
2%
Other Expenses$623,994
1%
Operating Uses
Texas Higher Education Coordinating Board 258 June, 2020

Texas State Technical College - HarlingenFor the Year Ended August 31, 2019Source: FY 2019 Annual Financial Report
Summary Worksheet FY 2019 Amount Per FTSEInstitution State Funded FTSEs 3,012.98
Operating SourcesState of TexasState Appropriations 24,202,283$ 8,033$ State Grants and Contracts - Restricted 1,926,957 640 Higher Education Fund 2,450,280 813 Available University Fund Excellence (See FN8) - - Subtotal 28,579,520$ 9,486$
Student & ParentTuition - net 6,980,540$ 2,317$ Fees - net 154,613 51 Tuition and Fees (net of Scholarship Discounts and Allowances) 7,135,153$ 2,368$
Federal GovernmentFederal Grants and Contracts - Restricted 15,658,234$ 5,197$
Institutional ResourcesEndowment and Interest Income (See FN2) 32,069$ 11$ Local Government Grants - Restricted 216,118 72 Private Gifts and Grants - Restricted 147,731 49 Sales and Services 2,200,486 730 Net Auxiliary Enterprises (See FN9) 1,332,086 442 Other Income (See FN3) - - Subtotal 3,928,490$ 1,304$ Total Operating Sources 55,301,397$ 18,355$
Operating UsesInstruction 17,855,642$ 5,926$ Research 28,622 9 Public Service 13,261 4 Academic Support 4,862,762 1,614 Student Services 5,130,965 1,703 Institutional Support 4,739,128 1,573 Operations and Maintenance of Plant 3,999,552 1,327 Scholarships and Fellowships 7,091,208 2,354 Auxiliary Enterprises (See FN9) 1,662,734 552 Capital Outlay from Current Fund Sources 673,095 223 Other Expenses (See FN3) 623,994 207 Total Operating Uses 46,680,963$ 15,492$
Other Sources / (Uses) of FundsCapital Outlay from Non-Current Fund Sources (4,918,373) (1,632)$ Mandatory and Non-mandatory Transfers (See FN10) (2,242,293) (744) Bond Proceeds Transfers (See FN4) 387,239 129 Debt Service Payments (See FN5) (630,273) (209) Subtotal (7,403,700)$ (2,456)$
Other Items Not for Current Operating UseUnrealized Gains / (Losses) (See FN6) - -$ Additions to Permanent Endowments (See FN7) - - Subtotal -$ -$
Total Sources Over / (Under) Uses (See FN11) 1,216,734$ 407$
Texas Higher Education Coordinating Board 259 June, 2020

FY 2019
Operating SourcesEducational &
General DesignatedAuxiliary
EnterprisesRestricted
Expendable Loan Funds
Annuity, Life & Endowment and Similar Funds
Unexpended Plant
Retirement of Indebtedness
Investment In Plant Primary University
State of TexasState Appropriations 24,202,283 - - - - - - - - 24,202,283 State Grants and Contracts - Restricted 129,361 - - 1,797,596 - - - - - 1,926,957 Higher Education Fund 2,450,280 - - - - - - - - 2,450,280 Available University Fund Excellence (See FN8) - - - - - - - - - - Subtotal 26,781,924 - - 1,797,596 - - - - - 28,579,520
Student & ParentTuition Potential 100% 2,397,572 12,958,592 - - - - - - - 15,356,164 Waivers - Statutory (Not Reported in AFR) (27,730) - - - - - - - - (27,730) Waivers - Institutional (Not Reported in AFR) - - - - - - - - - - Exemptions - Statutory (Not Reported in AFR) - - - - - - - - - - Exemptions - Institutional (Not Reported in AFR) - - - - - - - - - - Tuition - Gross - AFR Presentation 2,369,842 12,958,592 - - - - - - - 15,328,434 Waivers - Statutory (Reported in AFR) - - - - - - - - - - Waivers - Institutional (Reported in AFR) - - - - - - - - - - Exemptions - Statutory (Reported in AFR) (180,714) (661,441) - - - - - - - (842,155) Exemptions - Institutional (Reported in AFR) - - - - - - - - - - All Other Scholarship Disc.& Allow. (See FN1) (1,078,415) (6,427,324) - - - - - - - (7,505,739) Tuition - net 1,110,713 5,869,827 - - - - - - - 6,980,540
Fees Potential 100% - 237,424 - - - - - - - 237,424 Waivers - Statutory (Not Reported in AFR) - - - - - - - - - - Waivers - Institutional (Not Reported in AFR) - - - - - - - - - - Exemptions - Statutory (Not Reported in AFR) - - - - - - - - - - Exemptions - Institutional (Not Reported in AFR) - - - - - - - - - - Fees - Gross - AFR Presentation - 237,424 - - - - - - - 237,424 Waivers - Statutory (Reported in AFR) - - - - - - - - - - Waivers - Institutional (Reported in AFR) - - - - - - - - - - Exemptions - Statutory (Reported in AFR) - (200) - - - - - - - (200) Exemptions - Institutional (Reported in AFR) - - - - - - - - - - All Other Scholarship Disc.& Allow. (See FN1) - (82,611) - - - - - - - (82,611) Fees - net - 154,613 - - - - - - - 154,613
Net Tuition and Fees (Funds Collected) 1,110,713 6,024,440 - - - - - - - 7,135,153
Federal GovernmentFederal Grants and Contracts - Restricted - - - 15,658,234 - - - - - 15,658,234
Institutional ResourcesEndowment and Interest Income (See FN2) - 7,398 - 3,335 - - 21,336 - - 32,069 Local Government Grants - Restricted - - - 216,118 - - - - - 216,118 Private Gifts and Grants - Restricted - 66,247 - 81,484 - - - - - 147,731 Sales and Services - 2,200,486 - - - - - - - 2,200,486 Net Auxiliary Enterprises (See FN9) - - 1,332,086 - - - - - - 1,332,086 Other Income (See FN3) - - - - - - - - - - Subtotal - 2,274,131 1,332,086 300,937 - - 21,336 - - 3,928,490 Total Operating Sources 27,892,637 8,298,571 1,332,086 17,756,767 - - 21,336 - - 55,301,397
Operating UsesInstruction 14,893,055 2,042,430 - 920,157 - - - - - 17,855,642 Research - - - 28,622 - - - - - 28,622 Public Service - 13,261 - - - - - - - 13,261 Academic Support 3,296,904 275,705 - 1,290,153 - - - - - 4,862,762 Student Services 3,018,037 1,603,636 - 509,292 - - - - - 5,130,965 Institutional Support 3,874,337 780,526 - 84,265 - - - - - 4,739,128 Operations and Maintenance of Plant 2,164,083 1,835,469 - - - - - - - 3,999,552 Scholarships and Fellowships - - - 7,091,208 - - - - - 7,091,208 Auxiliary Enterprises (See FN9) - - 1,662,734 - - - - - - 1,662,734 Capital Outlay from Current Fund Sources* 52,362 271,520 - 349,213 - - - - - 673,095 Other Expenses (See FN3) - - - - - - 623,994 - - 623,994 Total Operating Uses 27,298,778 6,822,547 1,662,734 10,272,910 - - 623,994 - - 46,680,963
Other Sources / (Uses) of FundsCapital Outlay from Non-Current Fund Sources** - - - - - - (4,918,373) - - (4,918,373) Mandatory and Non-mandatory Transfers (See FN10) (1,842,321) (2,171,659) 438,250 (7,511,700) 164,380 - 6,406,919 2,273,838 - (2,242,293) Bond Proceeds Transfers In (See FN4) - - - - - - 387,239 - - 387,239 Debt Service Payments (See FN5) (181,844) - - - - - (207,910) (2,273,838) 2,033,319 (630,273) Subtotal (2,024,165) (2,171,659) 438,250 (7,511,700) 164,380 - 1,667,875 - 2,033,319 (7,403,700)
Other Items Not for Current Operating UseUnrealized Gains / (Losses) (See FN6) - - - - - - - - - - Additions to Permanent Endowments (See FN7) - - - - - - - - - - Subtotal - - - - - - - - - -
Total Sources Over / (Under) Uses (See FN 11) (1,430,306) (695,635) 107,602 (27,843) 164,380 - 1,065,217 - 2,033,319 1,216,734
Bond Proceeds - - - - - - (387,239) - - (387,239) Depreciation Expense - - - - - - - - (2,985,095) (2,985,095) Transfer of Capital Asses(s) from System - - - - - - - - 723,024 723,024 Other Post-Employment Benefit (OPEB) Expense - - - - - - - - - - Non-Cash Capital Gifts - - - - - - - - 1,453,363 1,453,363 Capital Outlay 52,362 271,520 - 349,213 - - 4,918,373 - - 5,591,468 Change in Net Assets (Total Agrees with AFR***) (1,377,944) (424,115) 107,602 321,370 164,380 - 5,596,351 - 1,224,611 5,612,255
*Defined as any capital outlay expenses from Educational & General, Designated, Auxiliary, or Restricted Expendable Funds.**Defined as any capital outlay expense from funds other than Educational & General, Designated, Auxiliary, or Restricted Expendable.***As reported for "Changes in Net Position" shown on Schedule of Revenues, Expenses, and Changes in Net Position (SRECNP) in Annual Financial Report.
Detail Worksheet FY 2019
Texas State Technical College - HarlingenFor the Year Ended August 31, 2019Source: FY 2019 Annual Financial Report
Texas Higher Education Coordinating Board 260 June, 2020

Texas State Technical College - HarlingenFor the Year Ended August 31, 2019Source: FY 2019 Annual Financial Report
FOOTNOTES:
FN1: Scholarship Discounts and Allowances are scholarships, fellowships, and grants applied to tuition. The discount eliminates tuition revenues that are paid for by University resources which are recorded as revenue elsewhere on the financial statements (i.e. federal and state contracts and grants revenues). In addition, Scholarship Discounts and Allowances eliminate tuition revenue that is exempted from payment due to tuition exemptions approved by the Texas Legislature. Waivers, remissions, and exemptions represent tuition and fee dollars forgone by the university - some are required by statute. See the Integrated Financial Reporting System (IFRS) report submitted to THECB for details on waivers, exemptions, tuition, and fees. Allocation methods to individual funds shown may vary between institutions.
FN2: Endowment and Interest Income includes interest income and endowment payouts.
FN3: Other Income is primarily Other Operating and Other Non-operating Revenues from the AFR. Other Expenses is primarily Other Nonoperating Expenses from the AFR.
FN4: Bond Proceeds are funds received from the sale of bonds and commercial paper used to finance capital projects. This amount includes actual proceeds and accrued or anticipated proceeds to be transferred from System. Independent institutions report only to the extent expended in current year.
FN5: Debt service payments are payments to service and retire debt issued to fund capital projects. System components do this via transfers to System Administrations. Independent institutions use direct payment to appropriate paying agents.
FN6: Unrealized Gains / (Losses) represent the increase in the Fair Market Value of Investments and Endowments. Unrealized Gains / (Losses) are accrued as non-cash transactions. Therefore, funds are not actually received for this revenue stream. Accordingly, this revenue is not cash revenue and cannot be used by the University to fund operations.
FN7: Additions to Permanent Endowments are additions to endowment principal. This revenue is restricted for investment purposes only and cannot be used to fund operations. Only interest income from these endowments, which is reported on the Endowment and Investment Income line of this report, can be used by the University to fund operations.
FN8: Distributions from the Available University Fund appropriated through the Appropriation Bill are first used to pay debt service costs on Permanent University Fund Bonds. Funds remaining are distributed to constitutionally designated institutions to promote academic excellence. Only the Excellence funding is shown at the institution level. The AUF funds used to pay debt service on PUF bonds are reported at the System level.
FN9: Auxiliary Enterprises include athletics, housing and food, student services, and parking and transportation. Auxiliary Enterprises are required to be self-supporting, and therefore must operate on the funds they generate.
FN10: Mandatory and non-mandatory transfers includes transfers between funds, transfers between the University System and institutions and transfers to and from other state agencies. In total, all transfers between funds net to zero with the exception of any amounts transferred between the University System, between other institutions, or to and from another state agency. There are no transfers of education and general funds provided by the State of Texas to restricted or auxiliary fund groups. Transfers between education and general funds and designated funds are related to Texas Public Education Grant as provided by the State of Texas.
FN11: Of the net increase of $1,216,734 approximately $1.2 million represents revenues received but not yet expended. This income is fully committed to program expenditures and capital disbursements. The remaining $0 represents non-expendable funds from unrealized gains and additions to permanent endowments of approximately $0 and $0 respectively. Unrealized gains and additions to permanent endowments do not contribute to the availability of the institution's operating cash as discussed in FN6 and FN7.
Texas Higher Education Coordinating Board 261 June, 2020

Texas State Technical College - West TexasFor the Year Ended August 31, 2019Source: FY 2019 Annual Financial Report
Non-Operating Funds are not included in above charts. See following page (Summary).Charts May Not Add to 100% Due to Rounding
Total Operating Uses $23,257,956
Total Operating Sources $26,795,141
Total Operating Sources $26,795,141
State of Texas$16,503,324
62%
Student & Parent$4,093,533
15%
Federal Government$3,241,995
12%
Institutional Resources$2,956,289
11%
Operating Sources by Category
State Appropriations$14,498,744
54%
State Grants & Contracts$672,271
3%
Higher Education Fund$1,332,309
5%
Tuition & Fees$4,093,533
15%
Federal Grants & Contracts$3,241,995
12%
Endowment & Interest Income$33,499
0%
Local Government Grants$3,250
0%
Private Gifts & Grants$123,423
0%
Sales & Services$1,813,364
7%
Net Auxiliary Enterprises$1,033,722
4% Other Income-$50,969
0%
Operating Sources
Instruction$8,475,281
36%
Academic Support$2,414,763
10%
Student Services$3,044,117
13% Institutional Support$2,879,844
12%
Operations & Maintenance of Plant
$2,782,47112%
Scholarships & Fellowships$1,271,627
6%
Auxiliary Enterprises$1,515,313
7%Capital Outlay
$174,1811%
Other Expenses$700,359
3%
Operating Uses
Texas Higher Education Coordinating Board 262 June, 2020

Texas State Technical College - West TexasFor the Year Ended August 31, 2019Source: FY 2019 Annual Financial Report
Summary Worksheet FY 2019 Amount Per FTSEInstitution State Funded FTSEs 1,112.19
Operating SourcesState of TexasState Appropriations 14,498,744$ 13,036$ State Grants and Contracts - Restricted 672,271 604 Higher Education Fund 1,332,309 1,198 Available University Fund Excellence (See FN8) - - Subtotal 16,503,324$ 14,838$
Student & ParentTuition - net 4,057,177$ 3,648$ Fees - net 36,356 33 Tuition and Fees (net of Scholarship Discounts and Allowances) 4,093,533$ 3,681$
Federal GovernmentFederal Grants and Contracts - Restricted 3,241,995$ 2,915$
Institutional ResourcesEndowment and Interest Income (See FN2) 33,499$ 30$ Local Government Grants - Restricted 3,250 3 Private Gifts and Grants - Restricted 123,423 111 Sales and Services 1,813,364 1,630 Net Auxiliary Enterprises (See FN9) 1,033,722 929 Other Income (See FN3) (50,969) (46) Subtotal 2,956,289$ 2,657$ Total Operating Sources 26,795,141$ 24,091$
Operating UsesInstruction 8,475,281$ 7,620$ Research - - Public Service - - Academic Support 2,414,763 2,171 Student Services 3,044,117 2,737 Institutional Support 2,879,844 2,589 Operations and Maintenance of Plant 2,782,471 2,502 Scholarships and Fellowships 1,271,627 1,143 Auxiliary Enterprises (See FN9) 1,515,313 1,362 Capital Outlay from Current Fund Sources 174,181 157 Other Expenses (See FN3) 700,359 630 Total Operating Uses 23,257,956$ 20,911$
Other Sources / (Uses) of FundsCapital Outlay from Non-Current Fund Sources (243,470) (219)$ Mandatory and Non-mandatory Transfers (See FN10) (4,617) (4) Bond Proceeds Transfers (See FN4) 391,567 352 Debt Service Payments (See FN5) (547,198) (492) Subtotal (403,718)$ (363)$
Other Items Not for Current Operating UseUnrealized Gains / (Losses) (See FN6) - -$ Additions to Permanent Endowments (See FN7) - - Subtotal -$ -$
Total Sources Over / (Under) Uses (See FN11) 3,133,467$ 2,817$
Texas Higher Education Coordinating Board 263 June, 2020

FY 2019
Operating SourcesEducational &
General DesignatedAuxiliary
EnterprisesRestricted
Expendable Loan Funds
Annuity, Life & Endowment and Similar Funds
Unexpended Plant
Retirement of Indebtedness
Investment In Plant Primary University
State of TexasState Appropriations 14,498,744 - - - - - - - - 14,498,744 State Grants and Contracts - Restricted 265,075 - - 407,196 - - - - - 672,271 Higher Education Fund 1,332,309 - - - - - - - - 1,332,309 Available University Fund Excellence (See FN8) - - - - - - - - - - Subtotal 16,096,128 - - 407,196 - - - - - 16,503,324
Student & ParentTuition Potential 100% 1,163,228 5,288,739 - - - - - - - 6,451,967 Waivers - Statutory (Not Reported in AFR) (43,486) - - - - - - - - (43,486) Waivers - Institutional (Not Reported in AFR) - - - - - - - - - - Exemptions - Statutory (Not Reported in AFR) - - - - - - - - - - Exemptions - Institutional (Not Reported in AFR) - - - - - - - - - - Tuition - Gross - AFR Presentation 1,119,742 5,288,739 - - - - - - - 6,408,481 Waivers - Statutory (Reported in AFR) - - - - - - - - - - Waivers - Institutional (Reported in AFR) - - - - - - - - - - Exemptions - Statutory (Reported in AFR) (257,929) (442,758) - - - - - - - (700,687) Exemptions - Institutional (Reported in AFR) - - - - - - - - - - All Other Scholarship Disc.& Allow. (See FN1) (97,067) (1,553,550) - - - - - - - (1,650,617) Tuition - net 764,746 3,292,431 - - - - - - - 4,057,177
Fees Potential 100% - 62,982 - - - - - - - 62,982 Waivers - Statutory (Not Reported in AFR) - - - - - - - - - - Waivers - Institutional (Not Reported in AFR) - - - - - - - - - - Exemptions - Statutory (Not Reported in AFR) - - - - - - - - - - Exemptions - Institutional (Not Reported in AFR) - - - - - - - - - - Fees - Gross - AFR Presentation - 62,982 - - - - - - - 62,982 Waivers - Statutory (Reported in AFR) - - - - - - - - - - Waivers - Institutional (Reported in AFR) - - - - - - - - - - Exemptions - Statutory (Reported in AFR) - - - - - - - - - - Exemptions - Institutional (Reported in AFR) - - - - - - - - - - All Other Scholarship Disc.& Allow. (See FN1) - (26,626) - - - - - - - (26,626) Fees - net - 36,356 - - - - - - - 36,356
Net Tuition and Fees (Funds Collected) 764,746 3,328,787 - - - - - - - 4,093,533
Federal GovernmentFederal Grants and Contracts - Restricted - - - 3,241,995 - - - - - 3,241,995
Institutional ResourcesEndowment and Interest Income (See FN2) - - 5,742 1,286 - - 26,471 - - 33,499 Local Government Grants - Restricted - - - 3,250 - - - - - 3,250 Private Gifts and Grants - Restricted - 66,715 - 56,708 - - - - - 123,423 Sales and Services - 1,813,364 - - - - - - - 1,813,364 Net Auxiliary Enterprises (See FN9) - - 1,033,722 - - - - - - 1,033,722 Other Income (See FN3) - - - - - - (50,969) - - (50,969) Subtotal - 1,880,079 1,039,464 61,244 - - (24,498) - - 2,956,289 Total Operating Sources 16,860,874 5,208,866 1,039,464 3,710,435 - - (24,498) - - 26,795,141
Operating UsesInstruction 6,913,138 1,535,221 - 26,922 - - - - - 8,475,281 Research - - - - - - - - - - Public Service - - - - - - - - - - Academic Support 2,064,605 94,400 - 255,758 - - - - - 2,414,763 Student Services 2,191,556 771,295 - 81,266 - - - - - 3,044,117 Institutional Support 2,484,166 395,678 - - - - - - - 2,879,844 Operations and Maintenance of Plant 1,239,523 1,542,948 - - - - - - - 2,782,471 Scholarships and Fellowships - - - 1,271,627 - - - - - 1,271,627 Auxiliary Enterprises (See FN9) - - 1,515,313 - - - - - - 1,515,313 Capital Outlay from Current Fund Sources* - 34,780 15,922 123,479 - - - - - 174,181 Other Expenses (See FN3) - (2,574) - - - - 702,933 - - 700,359 Total Operating Uses 14,892,988 4,371,748 1,531,235 1,759,052 - - 702,933 - - 23,257,956
Other Sources / (Uses) of FundsCapital Outlay from Non-Current Fund Sources** - - - - - - (243,470) - - (243,470) Mandatory and Non-mandatory Transfers (See FN10) (2,388,574) 1,294,596 457,351 (1,950,857) 64,078 - 862,614 1,656,175 - (4,617) Bond Proceeds Transfers In (See FN4) - - - - - - 391,567 - - 391,567 Debt Service Payments (See FN5) - (764) - - - - - (1,656,175) 1,109,741 (547,198) Subtotal (2,388,574) 1,293,832 457,351 (1,950,857) 64,078 - 1,010,711 - 1,109,741 (403,718)
Other Items Not for Current Operating UseUnrealized Gains / (Losses) (See FN6) - - - - - - - - - - Additions to Permanent Endowments (See FN7) - - - - - - - - - - Subtotal - - - - - - - - - -
Total Sources Over / (Under) Uses (See FN 11) (420,688) 2,130,950 (34,420) 526 64,078 - 283,280 - 1,109,741 3,133,467
Bond Proceeds - - - - - - (391,567) - - (391,567) Depreciation Expense - - - - - - - - (2,317,752) (2,317,752) Transfer of Capital Asses(s) from System - - - - - - - - 247,037 247,037 Other Post-Employment Benefit (OPEB) Expense - - - - - - - - - - Non-Cash Capital Gifts - - - - - - - - 592,841 592,841 Capital Outlay - 34,780 15,922 123,480 - - 243,470 - - 417,652 Change in Net Assets (Total Agrees with AFR***) (420,688) 2,165,730 (18,498) 124,006 64,078 - 135,183 - (368,133) 1,681,678
*Defined as any capital outlay expenses from Educational & General, Designated, Auxiliary, or Restricted Expendable Funds.**Defined as any capital outlay expense from funds other than Educational & General, Designated, Auxiliary, or Restricted Expendable.***As reported for "Changes in Net Position" shown on Schedule of Revenues, Expenses, and Changes in Net Position (SRECNP) in Annual Financial Report.
Detail Worksheet FY 2019
Texas State Technical College - West TexasFor the Year Ended August 31, 2019Source: FY 2019 Annual Financial Report
Texas Higher Education Coordinating Board 264 June, 2020

Texas State Technical College - West TexasFor the Year Ended August 31, 2019Source: FY 2019 Annual Financial Report
FOOTNOTES:
FN1: Scholarship Discounts and Allowances are scholarships, fellowships, and grants applied to tuition. The discount eliminates tuition revenues that are paid for by University resources which are recorded as revenue elsewhere on the financial statements (i.e. federal and state contracts and grants revenues). In addition, Scholarship Discounts and Allowances eliminate tuition revenue that is exempted from payment due to tuition exemptions approved by the Texas Legislature. Waivers, remissions, and exemptions represent tuition and fee dollars forgone by the university - some are required by statute. See the Integrated Financial Reporting System (IFRS) report submitted to THECB for details on waivers, exemptions, tuition, and fees. Allocation methods to individual funds shown may vary between institutions.
FN2: Endowment and Interest Income includes interest income and endowment payouts.
FN3: Other Income is primarily Other Operating and Other Non-operating Revenues from the AFR. Other Expenses is primarily Other Nonoperating Expenses from the AFR.
FN4: Bond Proceeds are funds received from the sale of bonds and commercial paper used to finance capital projects. This amount includes actual proceeds and accrued or anticipated proceeds to be transferred from System. Independent institutions report only to the extent expended in current year.
FN5: Debt service payments are payments to service and retire debt issued to fund capital projects. System components do this via transfers to System Administrations. Independent institutions use direct payment to appropriate paying agents.
FN6: Unrealized Gains / (Losses) represent the increase in the Fair Market Value of Investments and Endowments. Unrealized Gains / (Losses) are accrued as non-cash transactions. Therefore, funds are not actually received for this revenue stream. Accordingly, this revenue is not cash revenue and cannot be used by the University to fund operations.
FN7: Additions to Permanent Endowments are additions to endowment principal. This revenue is restricted for investment purposes only and cannot be used to fund operations. Only interest income from these endowments, which is reported on the Endowment and Investment Income line of this report, can be used by the University to fund operations.
FN8: Distributions from the Available University Fund appropriated through the Appropriation Bill are first used to pay debt service costs on Permanent University Fund Bonds. Funds remaining are distributed to constitutionally designated institutions to promote academic excellence. Only the Excellence funding is shown at the institution level. The AUF funds used to pay debt service on PUF bonds are reported at the System level.
FN9: Auxiliary Enterprises include athletics, housing and food, student services, and parking and transportation. Auxiliary Enterprises are required to be self-supporting, and therefore must operate on the funds they generate.
FN10: Mandatory and non-mandatory transfers includes transfers between funds, transfers between the University System and institutions and transfers to and from other state agencies. In total, all transfers between funds net to zero with the exception of any amounts transferred between the University System, between other institutions, or to and from another state agency. There are no transfers of education and general funds provided by the State of Texas to restricted or auxiliary fund groups. Transfers between education and general funds and designated funds are related to Texas Public Education Grant as provided by the State of Texas.
FN11: Of the net increase of $33,552,083 approximately $33.6 million represents revenues received but not yet expended. This income is fully committed to program expenditures and capital disbursements. The remaining $0 represents non-expendable funds from unrealized gains and additions to permanent endowments of approximately $0 and $0 respectively. Unrealized gains and additions to permanent endowments do not contribute to the availability of the institution's operating cash as discussed in FN6 and FN7.
Texas Higher Education Coordinating Board 265 June, 2020

Texas State Technical College - MarshallFor the Year Ended August 31, 2019Source: FY 2019 Annual Financial Report
Non-Operating Funds are not included in above charts. See following page (Summary).Charts May Not Add to 100% Due to Rounding
Total Operating Uses $9,472,023
Total Operating Sources $10,581,402
Total Operating Sources $10,581,402
State of Texas$7,196,685
68%
Student & Parent$1,371,882
13%
Federal Government$1,575,517
15%
Institutional Resources$437,318
4%
Operating Sources by Category
State Appropriations$6,073,872
58%
State Grants & Contracts$445,802
4%
Higher Education Fund$677,011
6%
Tuition & Fees$1,371,882
13%
Federal Grants & Contracts$1,575,517
15%
Endowment & Interest Income$8,072
0%
Private Gifts & Grants$128,912
1%
Sales & Services-$267
0% Net Auxiliary Enterprises
$299,1013%
Operating Sources
Instruction$3,554,991
38%
Academic Support$575,362
6%
Student Services$1,394,351
15% Institutional Support$1,260,186
13%
Operations & Maintenance of Plant
$966,41410%
Scholarships & Fellowships
$776,6008%
Auxiliary Enterprises$456,370
5%Capital Outlay
$251,7333%
Other Expenses$236,016
2%
Operating Uses
Texas Higher Education Coordinating Board 266 June, 2020

Texas State Technical College - MarshallFor the Year Ended August 31, 2019Source: FY 2019 Annual Financial Report
Summary Worksheet FY 2019 Amount Per FTSEInstitution State Funded FTSEs 413.11
Operating SourcesState of TexasState Appropriations 6,073,872$ 14,703$ State Grants and Contracts - Restricted 445,802 1,079 Higher Education Fund 677,011 1,639 Available University Fund Excellence (See FN8) - - Subtotal 7,196,685$ 17,421$
Student & ParentTuition - net 1,363,426$ 3,300$ Fees - net 8,456 20 Tuition and Fees (net of Scholarship Discounts and Allowances) 1,371,882$ 3,320$
Federal GovernmentFederal Grants and Contracts - Restricted 1,575,517$ 3,814$
Institutional ResourcesEndowment and Interest Income (See FN2) 8,072$ 20$ Local Government Grants - Restricted 1,500 4 Private Gifts and Grants - Restricted 128,912 312 Sales and Services (267) (1) Net Auxiliary Enterprises (See FN9) 299,101 724 Other Income (See FN3) - - Subtotal 437,318$ 1,059$ Total Operating Sources 10,581,402$ 25,614$
Operating UsesInstruction 3,554,991$ 8,605$ Research - - Public Service - - Academic Support 575,362 1,393 Student Services 1,394,351 3,375 Institutional Support 1,260,186 3,050 Operations and Maintenance of Plant 966,414 2,339 Scholarships and Fellowships 776,600 1,880 Auxiliary Enterprises (See FN9) 456,370 1,105 Capital Outlay from Current Fund Sources 251,733 609 Other Expenses (See FN3) 236,016 571 Total Operating Uses 9,472,023$ 22,927$
Other Sources / (Uses) of FundsCapital Outlay from Non-Current Fund Sources (285,217) (690)$ Mandatory and Non-mandatory Transfers (See FN10) (447,253) (1,083) Bond Proceeds Transfers (See FN4) 221,236 536 Debt Service Payments (See FN5) (142,252) (344) Subtotal (653,486)$ (1,581)$
Other Items Not for Current Operating UseUnrealized Gains / (Losses) (See FN6) - -$ Additions to Permanent Endowments (See FN7) - - Subtotal -$ -$
Total Sources Over / (Under) Uses (See FN11) 455,893$ 1,106$
Texas Higher Education Coordinating Board 267 June, 2020
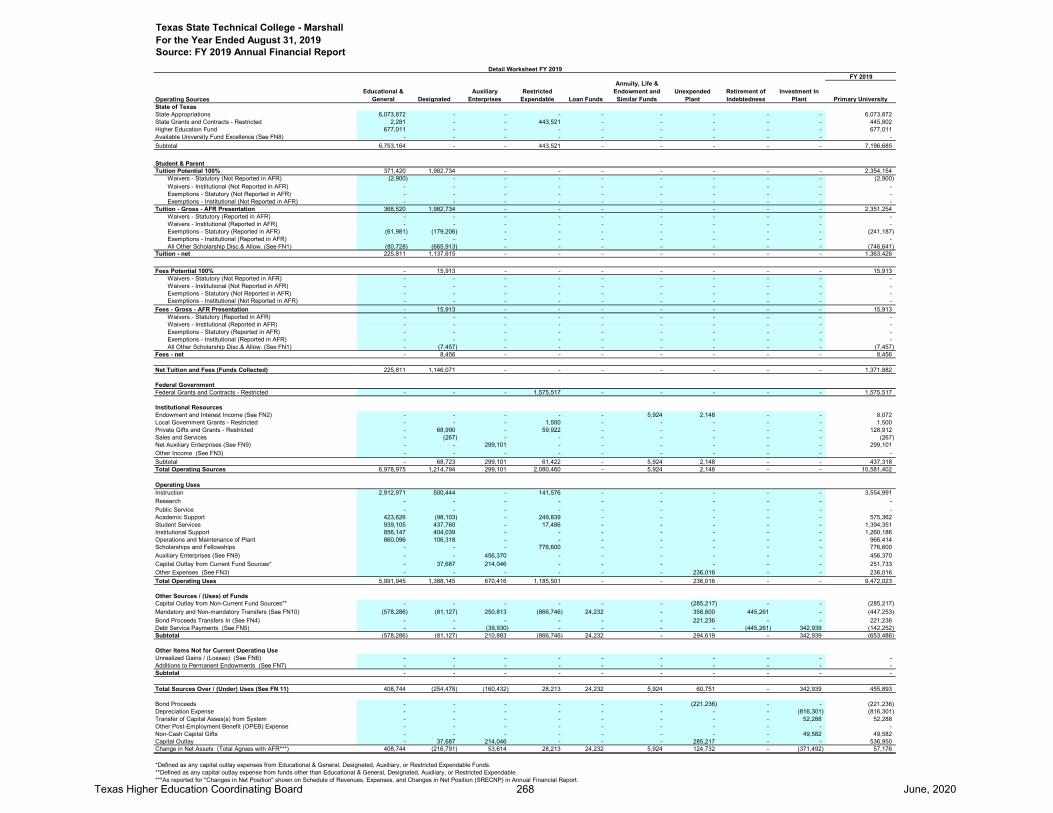
FY 2019
Operating SourcesEducational &
General DesignatedAuxiliary
EnterprisesRestricted
Expendable Loan Funds
Annuity, Life & Endowment and Similar Funds
Unexpended Plant
Retirement of Indebtedness
Investment In Plant Primary University
State of TexasState Appropriations 6,073,872 - - - - - - - - 6,073,872 State Grants and Contracts - Restricted 2,281 - - 443,521 - - - - - 445,802 Higher Education Fund 677,011 - - - - - - - - 677,011 Available University Fund Excellence (See FN8) - - - - - - - - - - Subtotal 6,753,164 - - 443,521 - - - - - 7,196,685
Student & ParentTuition Potential 100% 371,420 1,982,734 - - - - - - - 2,354,154 Waivers - Statutory (Not Reported in AFR) (2,900) - - - - - - - - (2,900) Waivers - Institutional (Not Reported in AFR) - - - - - - - - - - Exemptions - Statutory (Not Reported in AFR) - - - - - - - - - - Exemptions - Institutional (Not Reported in AFR) - - - - - - - - - - Tuition - Gross - AFR Presentation 368,520 1,982,734 - - - - - - - 2,351,254 Waivers - Statutory (Reported in AFR) - - - - - - - - - - Waivers - Institutional (Reported in AFR) - - - - - - - - - - Exemptions - Statutory (Reported in AFR) (61,981) (179,206) - - - - - - - (241,187) Exemptions - Institutional (Reported in AFR) - - - - - - - - - - All Other Scholarship Disc.& Allow. (See FN1) (80,728) (665,913) - - - - - - - (746,641) Tuition - net 225,811 1,137,615 - - - - - - - 1,363,426
Fees Potential 100% - 15,913 - - - - - - - 15,913 Waivers - Statutory (Not Reported in AFR) - - - - - - - - - - Waivers - Institutional (Not Reported in AFR) - - - - - - - - - - Exemptions - Statutory (Not Reported in AFR) - - - - - - - - - - Exemptions - Institutional (Not Reported in AFR) - - - - - - - - - - Fees - Gross - AFR Presentation - 15,913 - - - - - - - 15,913 Waivers - Statutory (Reported in AFR) - - - - - - - - - - Waivers - Institutional (Reported in AFR) - - - - - - - - - - Exemptions - Statutory (Reported in AFR) - - - - - - - - - - Exemptions - Institutional (Reported in AFR) - - - - - - - - - - All Other Scholarship Disc.& Allow. (See FN1) - (7,457) - - - - - - - (7,457) Fees - net - 8,456 - - - - - - - 8,456
Net Tuition and Fees (Funds Collected) 225,811 1,146,071 - - - - - - - 1,371,882
Federal GovernmentFederal Grants and Contracts - Restricted - - - 1,575,517 - - - - - 1,575,517
Institutional ResourcesEndowment and Interest Income (See FN2) - - - - - 5,924 2,148 - - 8,072 Local Government Grants - Restricted - - - 1,500 - - - - - 1,500 Private Gifts and Grants - Restricted - 68,990 - 59,922 - - - - - 128,912 Sales and Services - (267) - - - - - - - (267) Net Auxiliary Enterprises (See FN9) - - 299,101 - - - - - - 299,101 Other Income (See FN3) - - - - - - - - - - Subtotal - 68,723 299,101 61,422 - 5,924 2,148 - - 437,318 Total Operating Sources 6,978,975 1,214,794 299,101 2,080,460 - 5,924 2,148 - - 10,581,402
Operating UsesInstruction 2,912,971 500,444 - 141,576 - - - - - 3,554,991 Research - - - - - - - - - - Public Service - - - - - - - - - - Academic Support 423,626 (98,103) - 249,839 - - - - - 575,362 Student Services 939,105 437,760 - 17,486 - - - - - 1,394,351 Institutional Support 856,147 404,039 - - - - - - - 1,260,186 Operations and Maintenance of Plant 860,096 106,318 - - - - - - - 966,414 Scholarships and Fellowships - - - 776,600 - - - - - 776,600 Auxiliary Enterprises (See FN9) - - 456,370 - - - - - - 456,370 Capital Outlay from Current Fund Sources* - 37,687 214,046 - - - - - - 251,733 Other Expenses (See FN3) - - - - - - 236,016 - - 236,016 Total Operating Uses 5,991,945 1,388,145 670,416 1,185,501 - - 236,016 - - 9,472,023
Other Sources / (Uses) of FundsCapital Outlay from Non-Current Fund Sources** - - - - - - (285,217) - - (285,217) Mandatory and Non-mandatory Transfers (See FN10) (578,286) (81,127) 250,813 (866,746) 24,232 - 358,600 445,261 - (447,253) Bond Proceeds Transfers In (See FN4) - - - - - - 221,236 - - 221,236 Debt Service Payments (See FN5) - - (39,930) - - - - (445,261) 342,939 (142,252) Subtotal (578,286) (81,127) 210,883 (866,746) 24,232 - 294,619 - 342,939 (653,486)
Other Items Not for Current Operating UseUnrealized Gains / (Losses) (See FN6) - - - - - - - - - - Additions to Permanent Endowments (See FN7) - - - - - - - - - - Subtotal - - - - - - - - - -
Total Sources Over / (Under) Uses (See FN 11) 408,744 (254,478) (160,432) 28,213 24,232 5,924 60,751 - 342,939 455,893
Bond Proceeds - - - - - - (221,236) - - (221,236) Depreciation Expense - - - - - - - - (816,301) (816,301) Transfer of Capital Asses(s) from System - - - - - - - - 52,288 52,288 Other Post-Employment Benefit (OPEB) Expense - - - - - - - - - - Non-Cash Capital Gifts - - - - - - - - 49,582 49,582 Capital Outlay - 37,687 214,046 - - - 285,217 - - 536,950 Change in Net Assets (Total Agrees with AFR***) 408,744 (216,791) 53,614 28,213 24,232 5,924 124,732 - (371,492) 57,176
*Defined as any capital outlay expenses from Educational & General, Designated, Auxiliary, or Restricted Expendable Funds.**Defined as any capital outlay expense from funds other than Educational & General, Designated, Auxiliary, or Restricted Expendable.***As reported for "Changes in Net Position" shown on Schedule of Revenues, Expenses, and Changes in Net Position (SRECNP) in Annual Financial Report.
Detail Worksheet FY 2019
Texas State Technical College - MarshallFor the Year Ended August 31, 2019Source: FY 2019 Annual Financial Report
Texas Higher Education Coordinating Board 268 June, 2020

Texas State Technical College - MarshallFor the Year Ended August 31, 2019Source: FY 2019 Annual Financial Report
FOOTNOTES:
FN1: Scholarship Discounts and Allowances are scholarships, fellowships, and grants applied to tuition. The discount eliminates tuition revenues that are paid for by University resources which are recorded as revenue elsewhere on the financial statements (i.e. federal and state contracts and grants revenues). In addition, Scholarship Discounts and Allowances eliminate tuition revenue that is exempted from payment due to tuition exemptions approved by the Texas Legislature. Waivers, remissions, and exemptions represent tuition and fee dollars forgone by the university - some are required by statute. See the Integrated Financial Reporting System (IFRS) report submitted to THECB for details on waivers, exemptions, tuition, and fees. Allocation methods to individual funds shown may vary between institutions.
FN2: Endowment and Interest Income includes interest income and endowment payouts.
FN3: Other Income is primarily Other Operating and Other Non-operating Revenues from the AFR. Other Expenses is primarily Other Nonoperating Expenses from the AFR.
FN4: Bond Proceeds are funds received from the sale of bonds and commercial paper used to finance capital projects. This amount includes actual proceeds and accrued or anticipated proceeds to be transferred from System. Independent institutions report only to the extent expended in current year.
FN5: Debt service payments are payments to service and retire debt issued to fund capital projects. System components do this via transfers to System Administrations. Independent institutions use direct payment to appropriate paying agents.
FN6: Unrealized Gains / (Losses) represent the increase in the Fair Market Value of Investments and Endowments. Unrealized Gains / (Losses) are accrued as non-cash transactions. Therefore, funds are not actually received for this revenue stream. Accordingly, this revenue is not cash revenue and cannot be used by the University to fund operations.
FN7: Additions to Permanent Endowments are additions to endowment principal. This revenue is restricted for investment purposes only and cannot be used to fund operations. Only interest income from these endowments, which is reported on the Endowment and Investment Income line of this report, can be used by the University to fund operations.
FN8: Distributions from the Available University Fund appropriated through the Appropriation Bill are first used to pay debt service costs on Permanent University Fund Bonds. Funds remaining are distributed to constitutionally designated institutions to promote academic excellence. Only the Excellence funding is shown at the institution level. The AUF funds used to pay debt service on PUF bonds are reported at the System level.
FN9: Auxiliary Enterprises include athletics, housing and food, student services, and parking and transportation. Auxiliary Enterprises are required to be self-supporting, and therefore must operate on the funds they generate.
FN10: Mandatory and non-mandatory transfers includes transfers between funds, transfers between the University System and institutions and transfers to and from other state agencies. In total, all transfers between funds net to zero with the exception of any amounts transferred between the University System, between other institutions, or to and from another state agency. There are no transfers of education and general funds provided by the State of Texas to restricted or auxiliary fund groups. Transfers between education and general funds and designated funds are related to Texas Public Education Grant as provided by the State of Texas.
FN11: Of the net increase of $455,893 approximately $450 thousand represents revenues received but not yet expended. This income is fully committed to program expenditures and capital disbursements. The remaining $6 thousand represents non-expendable funds from unrealized gains and additions to permanent endowments of approximately $0 and $6 thousand respectively. Unrealized gains and additions to permanent endowments do not contribute to the availability of the institution's operating cash as discussed in FN6 and FN7.
Texas Higher Education Coordinating Board 269 June, 2020

Texas State Technical College - WacoFor the Year Ended August 31, 2019Source: FY 2019 Annual Financial Report
Non-Operating Funds are not included in above charts. See following page (Summary).Charts May Not Add to 100% Due to Rounding
Total Operating Uses $68,706,513
Total Operating Sources $106,788,815
Total Operating Sources $106,788,815
State of Texas$69,677,157
65%
Student & Parent$14,083,664
13%
Federal Government$12,136,505
12%
Institutional Resources$10,891,489
10%
Operating Sources by Category
State Appropriations$65,199,313
61%
State Grants & Contracts$2,066,822
2%
Higher Education Fund$2,411,022
2%
Tuition & Fees$14,083,664
13%
Federal Grants & Contracts
$12,136,50511%
Endowment & Interest Income$68,487
0%
Local Government Grants
$1,896,3292%
Private Gifts & Grants$193,635
0%
Sales & Services$1,664,360
2%Net Auxiliary Enterprises$5,763,436
6%Other Income
$1,305,2421%
Operating Sources
Instruction$28,041,888
41%
Public Service$00%
Academic Support$5,888,017
9%
Student Services$6,270,558
9%Institutional Support
$7,584,14911%
Operations & Maintenance of Plant
$6,272,3749%
Scholarships & Fellowships$6,371,987
9%
Auxiliary Enterprises$6,479,004
10%
Capital Outlay$821,774
1%
Other Expenses$976,762
1%
Operating Uses
Texas Higher Education Coordinating Board 270 June, 2020

Texas State Technical College - WacoFor the Year Ended August 31, 2019Source: FY 2019 Annual Financial Report
Summary Worksheet FY 2019 Amount Per FTSEInstitution State Funded FTSEs 3,439.86
Operating SourcesState of TexasState Appropriations 65,199,313$ 18,954$ State Grants and Contracts - Restricted 2,066,822 601 Higher Education Fund 2,411,022 701 Available University Fund Excellence (See FN8) - - Subtotal 69,677,157$ 20,256$
Student & ParentTuition - net 12,718,885$ 3,698$ Fees - net 1,364,779 397 Tuition and Fees (net of Scholarship Discounts and Allowances) 14,083,664$ 4,095$
Federal GovernmentFederal Grants and Contracts - Restricted 12,136,505$ 3,528$
Institutional ResourcesEndowment and Interest Income (See FN2) 68,487$ 20$ Local Government Grants - Restricted 1,896,329 551 Private Gifts and Grants - Restricted 193,635 56 Sales and Services 1,664,360 484 Net Auxiliary Enterprises (See FN9) 5,763,436 1,675 Other Income (See FN3) 1,305,242 379 Subtotal 10,891,489$ 3,165$ Total Operating Sources 106,788,815$ 31,044$
Operating UsesInstruction 28,041,888$ 8,152$ Research - - Public Service - - Academic Support 5,888,017 1,712 Student Services 6,270,558 1,823 Institutional Support 7,584,149 2,205 Operations and Maintenance of Plant 6,272,374 1,823 Scholarships and Fellowships 6,371,987 1,852 Auxiliary Enterprises (See FN9) 6,479,004 1,884 Capital Outlay from Current Fund Sources 821,774 239 Other Expenses (See FN3) 976,762 284 Total Operating Uses 68,706,513$ 19,974$
Other Sources / (Uses) of FundsCapital Outlay from Non-Current Fund Sources (1,239,064) (360)$ Mandatory and Non-mandatory Transfers (See FN10) (2,608,525) (758) Bond Proceeds Transfers (See FN4) 1,057,483 307 Debt Service Payments (See FN5) (1,740,113) (506) Subtotal (4,530,219)$ (1,317)$
Other Items Not for Current Operating UseUnrealized Gains / (Losses) (See FN6) - -$ Additions to Permanent Endowments (See FN7) - - Subtotal -$ -$
Total Sources Over / (Under) Uses (See FN11) 33,552,083$ 9,753$
Texas Higher Education Coordinating Board 271 June, 2020

FY 2019
Operating SourcesEducational &
General DesignatedAuxiliary
EnterprisesRestricted
Expendable Loan Funds
Annuity, Life & Endowment and Similar Funds
Unexpended Plant
Retirement of Indebtedness
Investment In Plant Primary University
State of TexasState Appropriations 65,199,313 - - - - - - - - 65,199,313 State Grants and Contracts - Restricted 8,195 - - 2,058,627 - - - - - 2,066,822 Higher Education Fund 2,411,022 - - - - - - - - 2,411,022 Available University Fund Excellence (See FN8) - - - - - - - - - - Subtotal 67,618,530 - - 2,058,627 - - - - - 69,677,157
Student & ParentTuition Potential 100% 3,129,292 16,766,869 - - - - - - - 19,896,161 Waivers - Statutory (Not Reported in AFR) (151,676) - - - - - - - - (151,676) Waivers - Institutional (Not Reported in AFR) - - - - - - - - - - Exemptions - Statutory (Not Reported in AFR) - - - - - - - - - - Exemptions - Institutional (Not Reported in AFR) - - - - - - - - - - Tuition - Gross - AFR Presentation 2,977,616 16,766,869 - - - - - - - 19,744,485 Waivers - Statutory (Reported in AFR) - - - - - - - - - - Waivers - Institutional (Reported in AFR) - - - - - - - - - - Exemptions - Statutory (Reported in AFR) (356,703) (1,227,093) - - - - - - - (1,583,796) Exemptions - Institutional (Reported in AFR) - - - - - - - - - - All Other Scholarship Disc.& Allow. (See FN1) (773,209) (4,668,595) - - - - - - - (5,441,804) Tuition - net 1,847,704 10,871,181 - - - - - - - 12,718,885
Fees Potential 100% - 2,209,017 - - - - - - - 2,209,017 Waivers - Statutory (Not Reported in AFR) - - - - - - - - - - Waivers - Institutional (Not Reported in AFR) - - - - - - - - - - Exemptions - Statutory (Not Reported in AFR) - - - - - - - - - - Exemptions - Institutional (Not Reported in AFR) - - - - - - - - - - Fees - Gross - AFR Presentation - 2,209,017 - - - - - - - 2,209,017 Waivers - Statutory (Reported in AFR) - - - - - - - - - - Waivers - Institutional (Reported in AFR) - - - - - - - - - - Exemptions - Statutory (Reported in AFR) - (9,750) - - - - - - - (9,750) Exemptions - Institutional (Reported in AFR) - - - - - - - - - - All Other Scholarship Disc.& Allow. (See FN1) - (834,488) - - - - - - - (834,488) Fees - net - 1,364,779 - - - - - - - 1,364,779
Net Tuition and Fees (Funds Collected) 1,847,704 12,235,960 - - - - - - - 14,083,664
Federal GovernmentFederal Grants and Contracts - Restricted - - - 12,136,505 - - - - - 12,136,505
Institutional ResourcesEndowment and Interest Income (See FN2) - - 28,861 4,184 - - 35,442 - - 68,487 Local Government Grants - Restricted - - - 810,341 - - - 1,085,988 - 1,896,329 Private Gifts and Grants - Restricted - 73,044 - 120,591 - - - - - 193,635 Sales and Services - 1,664,360 - - - - - - - 1,664,360 Net Auxiliary Enterprises (See FN9) - - 5,763,436 - - - - - - 5,763,436 Other Income (See FN3) - - - - - - 1,305,242 - - 1,305,242 Subtotal - 1,737,404 5,792,297 935,116 - - 1,340,684 1,085,988 - 10,891,489 Total Operating Sources 69,466,234 13,973,364 5,792,297 15,130,248 - - 1,340,684 1,085,988 - 106,788,815
Operating UsesInstruction 22,414,104 5,118,320 - 509,464 - - - - - 28,041,888 Research - - - - - - - - - - Public Service - - - - - - - - - - Academic Support 4,468,625 750,307 - 669,085 - - - - - 5,888,017 Student Services 4,288,897 1,529,936 - 451,725 - - - - - 6,270,558 Institutional Support 5,957,139 1,420,924 - 206,086 - - - - - 7,584,149 Operations and Maintenance of Plant 2,384,463 3,841,911 - 46,000 - - - - - 6,272,374 Scholarships and Fellowships - - - 6,371,987 - - - - - 6,371,987 Auxiliary Enterprises (See FN9) - - 6,479,004 - - - - - - 6,479,004 Capital Outlay from Current Fund Sources* - 559,123 - 262,651 - - - - - 821,774 Other Expenses (See FN3) - 1,425 - - (1,905) - 977,242 - - 976,762 Total Operating Uses 39,513,228 13,221,946 6,479,004 8,516,998 (1,905) - 977,242 - - 68,706,513
Other Sources / (Uses) of FundsCapital Outlay from Non-Current Fund Sources** - - - - - - (1,239,064) - - (1,239,064) Mandatory and Non-mandatory Transfers (See FN10) (32,424,113) 538,782 1,778,903 (7,347,491) 205,154 - 30,832,730 3,807,510 - (2,608,525) Bond Proceeds Transfers In (See FN4) - - - - - - 1,057,483 - - 1,057,483 Debt Service Payments (See FN5) (489,126) (88,000) (191,566) - - - - (4,893,498) 3,922,077 (1,740,113) Subtotal (32,913,239) 450,782 1,587,337 (7,347,491) 205,154 - 30,651,149 (1,085,988) 3,922,077 (4,530,219)
Other Items Not for Current Operating UseUnrealized Gains / (Losses) (See FN6) - - - - - - - - - - Additions to Permanent Endowments (See FN7) - - - - - - - - - - Subtotal - - - - - - - - - -
Total Sources Over / (Under) Uses (See FN 11) (2,960,233) 1,202,200 900,630 (734,241) 207,059 - 31,014,591 - 3,922,077 33,552,083
Bond Proceeds - - - - - - (1,057,483) - - (1,057,483) Depreciation Expense - - - - - - - - (5,700,918) (5,700,918) Transfer of Capital Asses(s) from System - - - - - - - - (449,773) (449,773) Other Post-Employment Benefit (OPEB) Expense - - - - - - - - - - Non-Cash Capital Gifts - - - - - - - - 698,022 698,022 Capital Outlay - 559,123 - 262,651 - - 1,239,064 - - 2,060,838 Change in Net Assets (Total Agrees with AFR***) (2,960,233) 1,761,323 900,630 (471,590) 207,059 - 31,196,172 - (1,530,592) 29,102,769
*Defined as any capital outlay expenses from Educational & General, Designated, Auxiliary, or Restricted Expendable Funds.**Defined as any capital outlay expense from funds other than Educational & General, Designated, Auxiliary, or Restricted Expendable.***As reported for "Changes in Net Position" shown on Schedule of Revenues, Expenses, and Changes in Net Position (SRECNP) in Annual Financial Report.
Detail Worksheet FY 2019
Texas State Technical College - WacoFor the Year Ended August 31, 2019Source: FY 2019 Annual Financial Report
Texas Higher Education Coordinating Board 272 June, 2020

Texas State Technical College - WacoFor the Year Ended August 31, 2019Source: FY 2019 Annual Financial Report
FOOTNOTES:
FN1: Scholarship Discounts and Allowances are scholarships, fellowships, and grants applied to tuition. The discount eliminates tuition revenues that are paid for by University resources which are recorded as revenue elsewhere on the financial statements (i.e. federal and state contracts and grants revenues). In addition, Scholarship Discounts and Allowances eliminate tuition revenue that is exempted from payment due to tuition exemptions approved by the Texas Legislature. Waivers, remissions, and exemptions represent tuition and fee dollars forgone by the university - some are required by statute. See the Integrated Financial Reporting System (IFRS) report submitted to THECB for details on waivers, exemptions, tuition, and fees. Allocation methods to individual funds shown may vary between institutions.
FN2: Endowment and Interest Income includes interest income and endowment payouts.
FN3: Other Income is primarily Other Operating and Other Non-operating Revenues from the AFR. Other Expenses is primarily Other Nonoperating Expenses from the AFR.
FN4: Bond Proceeds are funds received from the sale of bonds and commercial paper used to finance capital projects. This amount includes actual proceeds and accrued or anticipated proceeds to be transferred from System. Independent institutions report only to the extent expended in current year.
FN5: Debt service payments are payments to service and retire debt issued to fund capital projects. System components do this via transfers to System Administrations. Independent institutions use direct payment to appropriate paying agents.
FN6: Unrealized Gains / (Losses) represent the increase in the Fair Market Value of Investments and Endowments. Unrealized Gains / (Losses) are accrued as non-cash transactions. Therefore, funds are not actually received for this revenue stream. Accordingly, this revenue is not cash revenue and cannot be used by the University to fund operations.
FN7: Additions to Permanent Endowments are additions to endowment principal. This revenue is restricted for investment purposes only and cannot be used to fund operations. Only interest income from these endowments, which is reported on the Endowment and Investment Income line of this report, can be used by the University to fund operations.
FN8: Distributions from the Available University Fund appropriated through the Appropriation Bill are first used to pay debt service costs on Permanent University Fund Bonds. Funds remaining are distributed to constitutionally designated institutions to promote academic excellence. Only the Excellence funding is shown at the institution level. The AUF funds used to pay debt service on PUF bonds are reported at the System level.
FN9: Auxiliary Enterprises include athletics, housing and food, student services, and parking and transportation. Auxiliary Enterprises are required to be self-supporting, and therefore must operate on the funds they generate.
FN10: Mandatory and non-mandatory transfers includes transfers between funds, transfers between the University System and institutions and transfers to and from other state agencies. In total, all transfers between funds net to zero with the exception of any amounts transferred between the University System, between other institutions, or to and from another state agency. There are no transfers of education and general funds provided by the State of Texas to restricted or auxiliary fund groups. Transfers between education and general funds and designated funds are related to Texas Public Education Grant as provided by the State of Texas.
FN11: Of the net increase of $33,552,083 approximately $33.6 million represents revenues received but not yet expended. This income is fully committed to program expenditures and capital disbursements. The remaining $0 represents non-expendable funds from unrealized gains and additions to permanent endowments of approximately $0 and $0 respectively. Unrealized gains and additions to permanent endowments do not contribute to the availability of the institution's operating cash as discussed in FN6 and FN7.
Texas Higher Education Coordinating Board 273 June, 2020

Texas State Technical College - North TexasFor the Year Ended August 31, 2019Source: FY 2019 Annual Financial Report
Non-Operating Funds are not included in above charts. See following page (Summary).Charts May Not Add to 100% Due to Rounding
Total Operating Uses $5,060,525
Total Operating Sources $5,645,795
Total Operating Sources $5,645,795
State of Texas$4,267,400
76%
Student & Parent$826,762
15%
Federal Government$537,498
9%Institutional Resources
$14,1350%
Operating Sources by Category
State Appropriations$3,959,100
70%
State Grants & Contracts$39,130
1%
Higher Education Fund$269,170
5%
Available University Fund Excellence
$00%
Tuition & Fees$826,762
15%
Federal Grants & Contracts$537,498
9%
Endowment & Interest Income$5,578
0%
Private Gifts & Grants$2900%
Sales & Services$2,513
0%Net Auxiliary Enterprises
$5,1290%
Operating Sources
Instruction$1,996,774
39%
Public Service$00%
Academic Support$341,890
7%
Student Services$974,967
19%
Institutional Support$581,524
12%
Operations & Maintenance of Plant
$436,8869%
Scholarships & Fellowships
$215,8034%
Auxiliary Enterprises$00%
Capital Outlay$495,070
10%
Other Expenses$17,611
0%
Operating Uses
Texas Higher Education Coordinating Board 274 June, 2020

Texas State Technical College - North TexasFor the Year Ended August 31, 2019Source: FY 2019 Annual Financial Report
Summary Worksheet FY 2019 Amount Per FTSEInstitution State Funded FTSEs 195.07
Operating SourcesState of TexasState Appropriations 3,959,100$ 20,296$ State Grants and Contracts - Restricted 39,130 201 Higher Education Fund 269,170 1,380 Available University Fund Excellence (See FN8) - - Subtotal 4,267,400$ 21,877$
Student & ParentTuition - net 818,785$ 4,197$ Fees - net 7,977 41 Tuition and Fees (net of Scholarship Discounts and Allowances) 826,762$ 4,238$
Federal GovernmentFederal Grants and Contracts - Restricted 537,498$ 2,755$
Institutional ResourcesEndowment and Interest Income (See FN2) 5,578$ 29$ Local Government Grants - Restricted 625 3 Private Gifts and Grants - Restricted 290 1 Sales and Services 2,513 13 Net Auxiliary Enterprises (See FN9) 5,129 26 Other Income (See FN3) - - Subtotal 14,135$ 72$ Total Operating Sources 5,645,795$ 28,942$
Operating UsesInstruction 1,996,774$ 10,236$ Research - - Public Service - - Academic Support 341,890 1,753 Student Services 974,967 4,998 Institutional Support 581,524 2,981 Operations and Maintenance of Plant 436,886 2,240 Scholarships and Fellowships 215,803 1,106 Auxiliary Enterprises (See FN9) - - Capital Outlay from Current Fund Sources 495,070 2,538 Other Expenses (See FN3) 17,611 90 Total Operating Uses 5,060,525$ 25,942$
Other Sources / (Uses) of FundsCapital Outlay from Non-Current Fund Sources (52,925) (271)$ Mandatory and Non-mandatory Transfers (See FN10) (6,522) (33) Bond Proceeds Transfers (See FN4) - - Debt Service Payments (See FN5) (316,102) (1,620) Subtotal (375,549)$ (1,924)$
Other Items Not for Current Operating UseUnrealized Gains / (Losses) (See FN6) - -$ Additions to Permanent Endowments (See FN7) - - Subtotal -$ -$
Total Sources Over / (Under) Uses (See FN11) 209,721$ 1,076$
Texas Higher Education Coordinating Board 275 June, 2020
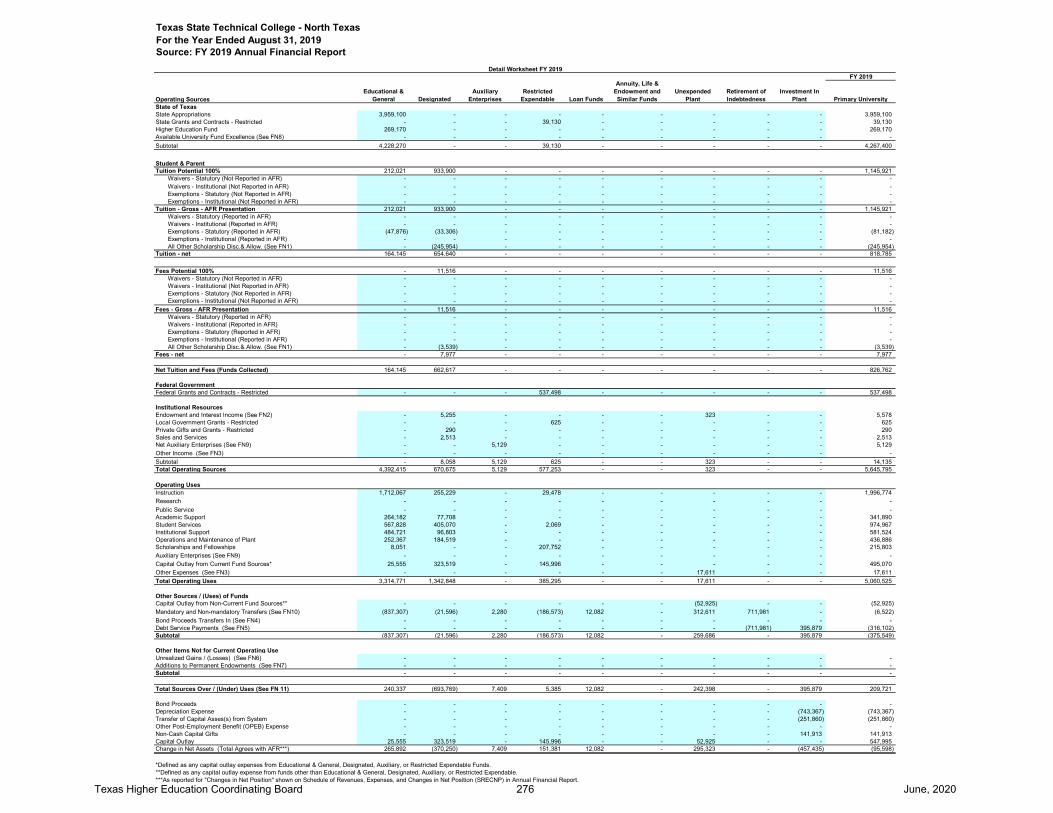
FY 2019
Operating SourcesEducational &
General DesignatedAuxiliary
EnterprisesRestricted
Expendable Loan Funds
Annuity, Life & Endowment and Similar Funds
Unexpended Plant
Retirement of Indebtedness
Investment In Plant Primary University
State of TexasState Appropriations 3,959,100 - - - - - - - - 3,959,100 State Grants and Contracts - Restricted - - - 39,130 - - - - - 39,130 Higher Education Fund 269,170 - - - - - - - - 269,170 Available University Fund Excellence (See FN8) - - - - - - - - - - Subtotal 4,228,270 - - 39,130 - - - - - 4,267,400
Student & ParentTuition Potential 100% 212,021 933,900 - - - - - - - 1,145,921 Waivers - Statutory (Not Reported in AFR) - - - - - - - - - - Waivers - Institutional (Not Reported in AFR) - - - - - - - - - - Exemptions - Statutory (Not Reported in AFR) - - - - - - - - - - Exemptions - Institutional (Not Reported in AFR) - - - - - - - - - - Tuition - Gross - AFR Presentation 212,021 933,900 - - - - - - - 1,145,921 Waivers - Statutory (Reported in AFR) - - - - - - - - - - Waivers - Institutional (Reported in AFR) - - - - - - - - - - Exemptions - Statutory (Reported in AFR) (47,876) (33,306) - - - - - - - (81,182) Exemptions - Institutional (Reported in AFR) - - - - - - - - - - All Other Scholarship Disc.& Allow. (See FN1) - (245,954) - - - - - - - (245,954) Tuition - net 164,145 654,640 - - - - - - - 818,785
Fees Potential 100% - 11,516 - - - - - - - 11,516 Waivers - Statutory (Not Reported in AFR) - - - - - - - - - - Waivers - Institutional (Not Reported in AFR) - - - - - - - - - - Exemptions - Statutory (Not Reported in AFR) - - - - - - - - - - Exemptions - Institutional (Not Reported in AFR) - - - - - - - - - - Fees - Gross - AFR Presentation - 11,516 - - - - - - - 11,516 Waivers - Statutory (Reported in AFR) - - - - - - - - - - Waivers - Institutional (Reported in AFR) - - - - - - - - - - Exemptions - Statutory (Reported in AFR) - - - - - - - - - - Exemptions - Institutional (Reported in AFR) - - - - - - - - - - All Other Scholarship Disc.& Allow. (See FN1) - (3,539) - - - - - - - (3,539) Fees - net - 7,977 - - - - - - - 7,977
Net Tuition and Fees (Funds Collected) 164,145 662,617 - - - - - - - 826,762
Federal GovernmentFederal Grants and Contracts - Restricted - - - 537,498 - - - - - 537,498
Institutional ResourcesEndowment and Interest Income (See FN2) - 5,255 - - - - 323 - - 5,578 Local Government Grants - Restricted - - - 625 - - - - - 625 Private Gifts and Grants - Restricted - 290 - - - - - - - 290 Sales and Services - 2,513 - - - - - - - 2,513 Net Auxiliary Enterprises (See FN9) - - 5,129 - - - - - - 5,129 Other Income (See FN3) - - - - - - - - - - Subtotal - 8,058 5,129 625 - - 323 - - 14,135 Total Operating Sources 4,392,415 670,675 5,129 577,253 - - 323 - - 5,645,795
Operating UsesInstruction 1,712,067 255,229 - 29,478 - - - - - 1,996,774 Research - - - - - - - - - - Public Service - - - - - - - - - - Academic Support 264,182 77,708 - - - - - - - 341,890 Student Services 567,828 405,070 - 2,069 - - - - - 974,967 Institutional Support 484,721 96,803 - - - - - - - 581,524 Operations and Maintenance of Plant 252,367 184,519 - - - - - - - 436,886 Scholarships and Fellowships 8,051 - - 207,752 - - - - - 215,803 Auxiliary Enterprises (See FN9) - - - - - - - - - - Capital Outlay from Current Fund Sources* 25,555 323,519 - 145,996 - - - - - 495,070 Other Expenses (See FN3) - - - - - - 17,611 - - 17,611 Total Operating Uses 3,314,771 1,342,848 - 385,295 - - 17,611 - - 5,060,525
Other Sources / (Uses) of FundsCapital Outlay from Non-Current Fund Sources** - - - - - - (52,925) - - (52,925) Mandatory and Non-mandatory Transfers (See FN10) (837,307) (21,596) 2,280 (186,573) 12,082 - 312,611 711,981 - (6,522) Bond Proceeds Transfers In (See FN4) - - - - - - - - - - Debt Service Payments (See FN5) - - - - - - - (711,981) 395,879 (316,102) Subtotal (837,307) (21,596) 2,280 (186,573) 12,082 - 259,686 - 395,879 (375,549)
Other Items Not for Current Operating UseUnrealized Gains / (Losses) (See FN6) - - - - - - - - - - Additions to Permanent Endowments (See FN7) - - - - - - - - - - Subtotal - - - - - - - - - -
Total Sources Over / (Under) Uses (See FN 11) 240,337 (693,769) 7,409 5,385 12,082 - 242,398 - 395,879 209,721
Bond Proceeds - - - - - - - - - - Depreciation Expense - - - - - - - - (743,367) (743,367) Transfer of Capital Asses(s) from System - - - - - - - - (251,860) (251,860) Other Post-Employment Benefit (OPEB) Expense - - - - - - - - - - Non-Cash Capital Gifts - - - - - - - - 141,913 141,913 Capital Outlay 25,555 323,519 - 145,996 - - 52,925 - - 547,995 Change in Net Assets (Total Agrees with AFR***) 265,892 (370,250) 7,409 151,381 12,082 - 295,323 - (457,435) (95,598)
*Defined as any capital outlay expenses from Educational & General, Designated, Auxiliary, or Restricted Expendable Funds.**Defined as any capital outlay expense from funds other than Educational & General, Designated, Auxiliary, or Restricted Expendable.***As reported for "Changes in Net Position" shown on Schedule of Revenues, Expenses, and Changes in Net Position (SRECNP) in Annual Financial Report.
Texas State Technical College - North TexasFor the Year Ended August 31, 2019Source: FY 2019 Annual Financial Report
Detail Worksheet FY 2019
Texas Higher Education Coordinating Board 276 June, 2020

Texas State Technical College - North TexasFor the Year Ended August 31, 2019Source: FY 2019 Annual Financial Report
FOOTNOTES:
FN1: Scholarship Discounts and Allowances are scholarships, fellowships, and grants applied to tuition. The discount eliminates tuition revenues that are paid for by University resources which are recorded as revenue elsewhere on the financial statements (i.e. federal and state contracts and grants revenues). In addition, Scholarship Discounts and Allowances eliminate tuition revenue that is exempted from payment due to tuition exemptions approved by the Texas Legislature. Waivers, remissions, and exemptions represent tuition and fee dollars forgone by the university - some are required by statute. See the Integrated Financial Reporting System (IFRS) report submitted to THECB for details on waivers, exemptions, tuition, and fees. Allocation methods to individual funds shown may vary between institutions.
FN2: Endowment and Interest Income includes interest income and endowment payouts.
FN3: Other Income is primarily Other Operating and Other Non-operating Revenues from the AFR. Other Expenses is primarily Other Nonoperating Expenses from the AFR.
FN4: Bond Proceeds are funds received from the sale of bonds and commercial paper used to finance capital projects. This amount includes actual proceeds and accrued or anticipated proceeds to be transferred from System. Independent institutions report only to the extent expended in current year.
FN5: Debt service payments are payments to service and retire debt issued to fund capital projects. System components do this via transfers to System Administrations. Independent institutions use direct payment to appropriate paying agents.
FN6: Unrealized Gains / (Losses) represent the increase in the Fair Market Value of Investments and Endowments. Unrealized Gains / (Losses) are accrued as non-cash transactions. Therefore, funds are not actually received for this revenue stream. Accordingly, this revenue is not cash revenue and cannot be used by the University to fund operations.
FN7: Additions to Permanent Endowments are additions to endowment principal. This revenue is restricted for investment purposes only and cannot be used to fund operations. Only interest income from these endowments, which is reported on the Endowment and Investment Income line of this report, can be used by the University to fund operations.
FN8: Distributions from the Available University Fund appropriated through the Appropriation Bill are first used to pay debt service costs on Permanent University Fund Bonds. Funds remaining are distributed to constitutionally designated institutions to promote academic excellence. Only the Excellence funding is shown at the institution level. The AUF funds used to pay debt service on PUF bonds are reported at the System level.
FN9: Auxiliary Enterprises include athletics, housing and food, student services, and parking and transportation. Auxiliary Enterprises are required to be self-supporting, and therefore must operate on the funds they generate.
FN10: Mandatory and non-mandatory transfers includes transfers between funds, transfers between the University System and institutions and transfers to and from other state agencies. In total, all transfers between funds net to zero with the exception of any amounts transferred between the University System, between other institutions, or to and from another state agency. There are no transfers of education and general funds provided by the State of Texas to restricted or auxiliary fund groups. Transfers between education and general funds and designated funds are related to Texas Public Education Grant as provided by the State of Texas.
FN11: Of the net increase of $209,721 approximately $210 thousand represents revenues received but not yet expended. This income is fully committed to program expenditures and capital disbursements. The remaining $0 represents non-expendable funds from unrealized gains and additions to permanent endowments of approximately $0 and $0 respectively. Unrealized gains and additions to permanent endowments do not contribute to the availability of the institution's operating cash as discussed in FN6 and FN7.
Texas Higher Education Coordinating Board 277 June, 2020

Texas State Technical College - Fort BendFor the Year Ended August 31, 2019Source: FY 2019 Annual Financial Report
Non-Operating Funds are not included in above charts. See following page (Summary).Charts May Not Add to 100% Due to Rounding
Total Operating Uses $8,663,605
Total Operating Sources $11,305,026
Total Operating Sources $11,305,026
State of Texas$8,441,684
75%
Student & Parent$1,241,507
11%
Federal Government$1,157,526
10%
Institutional Resources$464,309
4%
Operating Sources by Category
State Appropriations$6,476,704
57%
State Grants & Contracts$442,272
4%
Higher Education Fund$1,522,708
13%
Tuition & Fees$1,241,507
11%
Federal Grants & Contracts$1,157,526
10%
Endowment & Interest Income$1,671
0%
Local Government Grants$63,500
1%
Private Gifts & Grants$192,688
2%Sales & Services
$126,1961%
Net Auxiliary Enterprises
$80,2541%
Operating Sources
Instruction$3,307,821
38%
Public Service$00%
Academic Support$800,572
9%
Student Services$1,415,144
16%Institutional Support
$1,350,29216%
Operations & Maintenance of Plant
$781,8789%
Scholarships & Fellowships
$678,2298%
Auxiliary Enterprises$185,147
2%
Capital Outlay$96,462
1%
Other Expenses$48,060
1%
Operating Uses
Texas Higher Education Coordinating Board 278 June, 2020

Texas State Technical College - Fort BendFor the Year Ended August 31, 2019Source: FY 2019 Annual Financial Report
Summary Worksheet FY 2019 Amount Per FTSEInstitution State Funded FTSEs 371.80
Operating SourcesState of TexasState Appropriations 6,476,704$ 17,420$ State Grants and Contracts - Restricted 442,272 1,190 Higher Education Fund 1,522,708 4,096 Available University Fund Excellence (See FN8) - - Subtotal 8,441,684$ 22,706$
Student & ParentTuition - net 1,228,797$ 3,305$ Fees - net 12,710 34 Tuition and Fees (net of Scholarship Discounts and Allowances) 1,241,507$ 3,339$
Federal GovernmentFederal Grants and Contracts - Restricted 1,157,526$ 3,113$
Institutional ResourcesEndowment and Interest Income (See FN2) 1,671$ 4$ Local Government Grants - Restricted 63,500 171 Private Gifts and Grants - Restricted 192,688 518 Sales and Services 126,196 339 Net Auxiliary Enterprises (See FN9) 80,254 216 Other Income (See FN3) - - Subtotal 464,309$ 1,248$ Total Operating Sources 11,305,026$ 30,406$
Operating UsesInstruction 3,307,821$ 8,897$ Research - - Public Service - - Academic Support 800,572 2,153 Student Services 1,415,144 3,806 Institutional Support 1,350,292 3,632 Operations and Maintenance of Plant 781,878 2,103 Scholarships and Fellowships 678,229 1,824 Auxiliary Enterprises (See FN9) 185,147 498 Capital Outlay from Current Fund Sources 96,462 259 Other Expenses (See FN3) 48,060 129 Total Operating Uses 8,663,605$ 23,301$
Other Sources / (Uses) of FundsCapital Outlay from Non-Current Fund Sources - -$ Mandatory and Non-mandatory Transfers (See FN10) (473,580) (1,274) Bond Proceeds Transfers (See FN4) - - Debt Service Payments (See FN5) (620,415) (1,669) Subtotal (1,093,995)$ (2,943)$
Other Items Not for Current Operating UseUnrealized Gains / (Losses) (See FN6) - -$ Additions to Permanent Endowments (See FN7) - - Subtotal -$ -$
Total Sources Over / (Under) Uses (See FN11) 1,547,426$ 4,162$
Texas Higher Education Coordinating Board 279 June, 2020

FY 2019
Operating SourcesEducational &
General DesignatedAuxiliary
EnterprisesRestricted
Expendable Loan Funds
Annuity, Life & Endowment and Similar Funds
Unexpended Plant
Retirement of Indebtedness
Investment In Plant Primary University
State of TexasState Appropriations 6,476,704 - - - - - - - - 6,476,704 State Grants and Contracts - Restricted 3,259 - - 439,013 - - - - - 442,272 Higher Education Fund 1,522,708 - - - - - - - - 1,522,708 Available University Fund Excellence (See FN8) - - - - - - - - - - Subtotal 8,002,671 - - 439,013 - - - - - 8,441,684
Student & ParentTuition Potential 100% 318,654 1,881,030 - - - - - - - 2,199,684 Waivers - Statutory (Not Reported in AFR) (4,640) - - - - - - - - (4,640) Waivers - Institutional (Not Reported in AFR) - - - - - - - - - - Exemptions - Statutory (Not Reported in AFR) - - - - - - - - - - Exemptions - Institutional (Not Reported in AFR) - - - - - - - - - - Tuition - Gross - AFR Presentation 314,014 1,881,030 - - - - - - - 2,195,044 Waivers - Statutory (Reported in AFR) - - - - - - - - - - Waivers - Institutional (Reported in AFR) - - - - - - - - - - Exemptions - Statutory (Reported in AFR) (14,840) (53,489) - - - - - - - (68,329) Exemptions - Institutional (Reported in AFR) - - - - - - - - - - All Other Scholarship Disc.& Allow. (See FN1) (121,033) (776,885) - - - - - - - (897,918) Tuition - net 178,141 1,050,656 - - - - - - - 1,228,797
Fees Potential 100% - 23,295 - - - - - - - 23,295 Waivers - Statutory (Not Reported in AFR) - - - - - - - - - - Waivers - Institutional (Not Reported in AFR) - - - - - - - - - - Exemptions - Statutory (Not Reported in AFR) - - - - - - - - - - Exemptions - Institutional (Not Reported in AFR) - - - - - - - - - - Fees - Gross - AFR Presentation - 23,295 - - - - - - - 23,295 Waivers - Statutory (Reported in AFR) - - - - - - - - - - Waivers - Institutional (Reported in AFR) - - - - - - - - - - Exemptions - Statutory (Reported in AFR) - - - - - - - - - - Exemptions - Institutional (Reported in AFR) - - - - - - - - - - All Other Scholarship Disc.& Allow. (See FN1) - (10,585) - - - - - - - (10,585) Fees - net - 12,710 - - - - - - - 12,710
Net Tuition and Fees (Funds Collected) 178,141 1,063,366 - - - - - - - 1,241,507
Federal GovernmentFederal Grants and Contracts - Restricted - - - 1,157,526 - - - - - 1,157,526
Institutional ResourcesEndowment and Interest Income (See FN2) - - - - - - 1,671 - - 1,671 Local Government Grants - Restricted - - - 63,500 - - - - - 63,500 Private Gifts and Grants - Restricted - 32,640 - 160,048 - - - - - 192,688 Sales and Services - 126,196 - - - - - - - 126,196 Net Auxiliary Enterprises (See FN9) - - 80,254 - - - - - - 80,254 Other Income (See FN3) - - - - - - - - - - Subtotal - 158,836 80,254 223,548 - - 1,671 - - 464,309 Total Operating Sources 8,180,812 1,222,202 80,254 1,820,087 - - 1,671 - - 11,305,026
Operating UsesInstruction 2,779,046 470,295 - 58,480 - - - - - 3,307,821 Research - - - - - - - - - - Public Service - - - - - - - - - - Academic Support 624,216 (107,979) - 284,335 - - - - - 800,572 Student Services 1,233,218 176,365 - 5,561 - - - - - 1,415,144 Institutional Support 992,320 357,972 - - - - - - - 1,350,292 Operations and Maintenance of Plant 383,280 398,598 - - - - - - - 781,878 Scholarships and Fellowships - - - 678,229 - - - - - 678,229 Auxiliary Enterprises (See FN9) - - 185,147 - - - - - - 185,147 Capital Outlay from Current Fund Sources* 11,250 11,527 - 73,685 - - - - - 96,462 Other Expenses (See FN3) - - - - - - 48,060 - - 48,060 Total Operating Uses 6,023,330 1,306,778 185,147 1,100,290 - - 48,060 - - 8,663,605
Other Sources / (Uses) of FundsCapital Outlay from Non-Current Fund Sources** - - - - - - - - - - Mandatory and Non-mandatory Transfers (See FN10) (1,966,311) 331,599 5,876 (793,550) 22,596 - 48,060 1,878,150 - (473,580) Bond Proceeds Transfers In (See FN4) - - - - - - - - - - Debt Service Payments (See FN5) - - - - - - - (1,878,150) 1,257,735 (620,415) Subtotal (1,966,311) 331,599 5,876 (793,550) 22,596 - 48,060 - 1,257,735 (1,093,995)
Other Items Not for Current Operating UseUnrealized Gains / (Losses) (See FN6) - - - - - - - - - - Additions to Permanent Endowments (See FN7) - - - - - - - - - - Subtotal - - - - - - - - - -
Total Sources Over / (Under) Uses (See FN 11) 191,171 247,023 (99,017) (73,753) 22,596 - 1,671 - 1,257,735 1,547,426
Bond Proceeds - - - - - - - - - - Depreciation Expense - - - - - - - - (2,404,118) (2,404,118) Transfer of Capital Asses(s) from System - - - - - - - - 72,787 72,787 Other Post-Employment Benefit (OPEB) Expense - - - - - - - - - - Non-Cash Capital Gifts - - - - - - - - 295,036 295,036 Capital Outlay 11,250 11,527 - 73,685 - - - - - 96,462 Change in Net Assets (Total Agrees with AFR***) 202,421 258,550 (99,017) (68) 22,596 - 1,671 - (778,560) (392,407)
*Defined as any capital outlay expenses from Educational & General, Designated, Auxiliary, or Restricted Expendable Funds.**Defined as any capital outlay expense from funds other than Educational & General, Designated, Auxiliary, or Restricted Expendable.***As reported for "Changes in Net Position" shown on Schedule of Revenues, Expenses, and Changes in Net Position (SRECNP) in Annual Financial Report.
Texas State Technical College - Fort BendFor the Year Ended August 31, 2019Source: FY 2019 Annual Financial Report
Detail Worksheet FY 2019
Texas Higher Education Coordinating Board 280 June, 2020

Texas State Technical College - Fort BendFor the Year Ended August 31, 2019Source: FY 2019 Annual Financial Report
FOOTNOTES:
FN1: Scholarship Discounts and Allowances are scholarships, fellowships, and grants applied to tuition. The discount eliminates tuition revenues that are paid for by University resources which are recorded as revenue elsewhere on the financial statements (i.e. federal and state contracts and grants revenues). In addition, Scholarship Discounts and Allowances eliminate tuition revenue that is exempted from payment due to tuition exemptions approved by the Texas Legislature. Waivers, remissions, and exemptions represent tuition and fee dollars forgone by the university - some are required by statute. See the Integrated Financial Reporting System (IFRS) report submitted to THECB for details on waivers, exemptions, tuition, and fees. Allocation methods to individual funds shown may vary between institutions.
FN2: Endowment and Interest Income includes interest income and endowment payouts.
FN3: Other Income is primarily Other Operating and Other Non-operating Revenues from the AFR. Other Expenses is primarily Other Nonoperating Expenses from the AFR.
FN4: Bond Proceeds are funds received from the sale of bonds and commercial paper used to finance capital projects. This amount includes actual proceeds and accrued or anticipated proceeds to be transferred from System. Independent institutions report only to the extent expended in current year.
FN5: Debt service payments are payments to service and retire debt issued to fund capital projects. System components do this via transfers to System Administrations. Independent institutions use direct payment to appropriate paying agents.
FN6: Unrealized Gains / (Losses) represent the increase in the Fair Market Value of Investments and Endowments. Unrealized Gains / (Losses) are accrued as non-cash transactions. Therefore, funds are not actually received for this revenue stream. Accordingly, this revenue is not cash revenue and cannot be used by the University to fund operations.
FN7: Additions to Permanent Endowments are additions to endowment principal. This revenue is restricted for investment purposes only and cannot be used to fund operations. Only interest income from these endowments, which is reported on the Endowment and Investment Income line of this report, can be used by the University to fund operations.
FN8: Distributions from the Available University Fund appropriated through the Appropriation Bill are first used to pay debt service costs on Permanent University Fund Bonds. Funds remaining are distributed to constitutionally designated institutions to promote academic excellence. Only the Excellence funding is shown at the institution level. The AUF funds used to pay debt service on PUF bonds are reported at the System level.
FN9: Auxiliary Enterprises include athletics, housing and food, student services, and parking and transportation. Auxiliary Enterprises are required to be self-supporting, and therefore must operate on the funds they generate.
FN10: Mandatory and non-mandatory transfers includes transfers between funds, transfers between the University System and institutions and transfers to and from other state agencies. In total, all transfers between funds net to zero with the exception of any amounts transferred between the University System, between other institutions, or to and from another state agency. There are no transfers of education and general funds provided by the State of Texas to restricted or auxiliary fund groups. Transfers between education and general funds and designated funds are related to Texas Public Education Grant as provided by the State of Texas.
FN11: Of the net increase of $1,547,426 approximately $1.5 million represents revenues received but not yet expended. This income is fully committed to program expenditures and capital disbursements. The remaining $0 represents non-expendable funds from unrealized gains and additions to permanent endowments of approximately $0 and $0 respectively. Unrealized gains and additions to permanent endowments do not contribute to the availability of the institution's operating cash as discussed in FN6 and FN7.
Texas Higher Education Coordinating Board 281 June, 2020

This document is available on the Texas Higher Education Coordinating Board website: http://www.thecb.state.tx.us
For more information contact:
External Relations – 512-427-6111 [email protected]
Or
Emily CormierStrategic Planning and Funding Division Texas Higher Education Coordinating Board P. O. Box 12788 Austin, Texas 78711 Phone: 512-427-6548 Fax: 512-427-6147 [email protected]