south africa: logistics and infrastructure 9 june 2016 ... · 6/9/2016 · south africa: logistics...
TRANSCRIPT

South Africa: Logistics and Infrastructure
The American Chamber of Commerce
Regional Trade Forum
9 June 2016
FreightPartner : representing SAAFF

SAAFF – Advocacy Hub
Sea Carriers
SAAFF
Ports
Customs
Air carriers
NRCS
CAA
Members
Other Associations
Industry changes
FIATA
SADC
Donor Funders
Govt Depts. Learning

About SAAFF
www.saaff.org.za
SAAFF, the South African Association of Freight Forwarders is a powerful
advocate on all matters affecting the diverse scope of the Forwarding and
Customs Clearing sector.
Freight Forwarders facilitate trade by providing value adding services to
importers and exporters by enabling a compliant and efficient passage of
goods into and out of, the country.

South Africa Logistics and Infrastructure
So, where do we start?
First, with what we do not have to contend with…
www.bluefletch.com

Case Study: Kazangula: Botswana to Zambia
Crossing the Zambezi River – could be the new preferred border on the N_S corridor
Current capacity: 9 to 18 Trucks per hour.
Projected Capacity : 100 if a OSB is installed
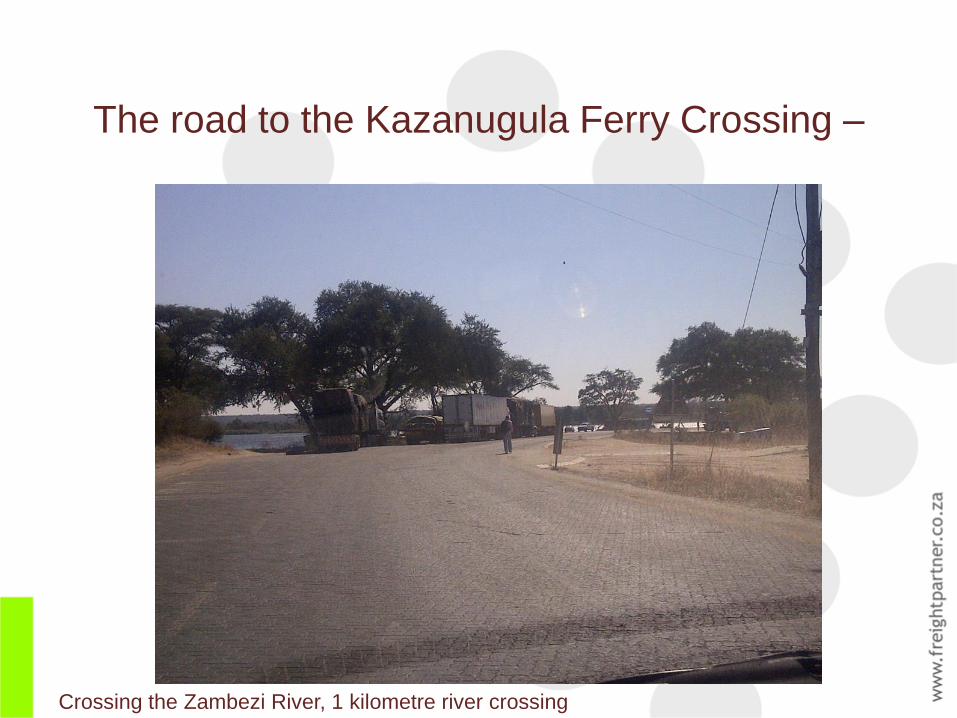
The road to the Kazanugula Ferry Crossing –
Crossing the Zambezi River, 1 kilometre river crossing
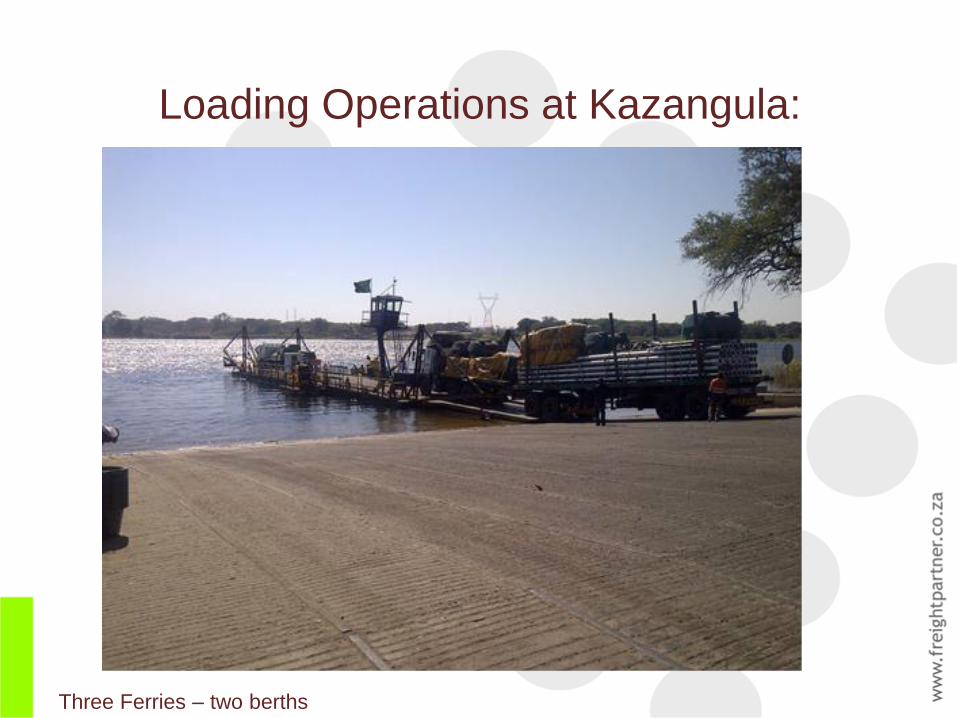
Loading Operations at Kazangula:
Three Ferries – two berths
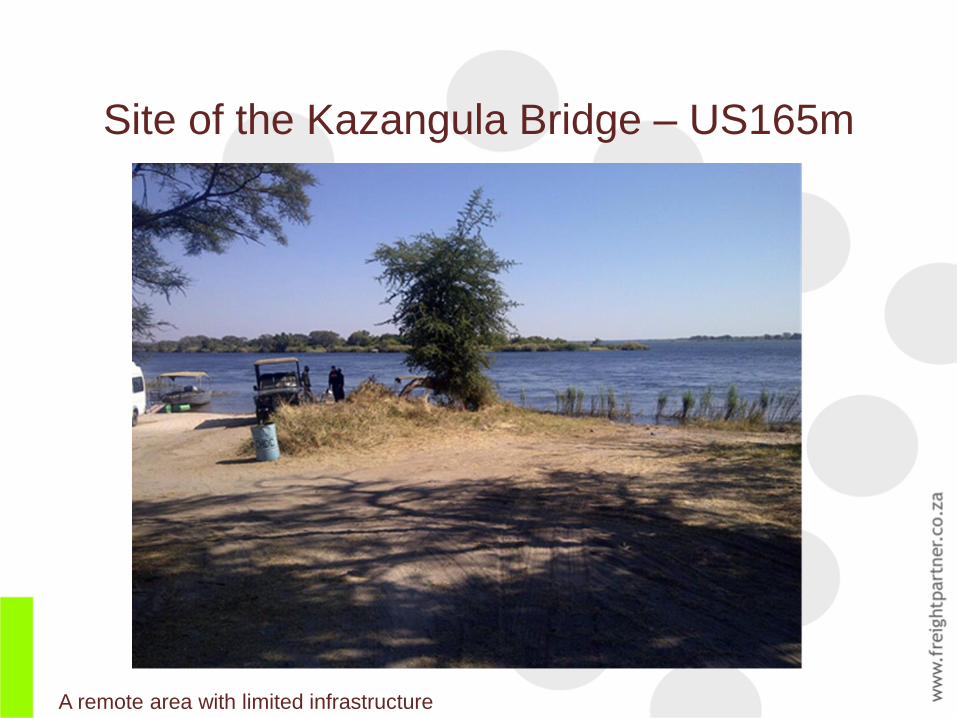
Site of the Kazangula Bridge – US165m
A remote area with limited infrastructure

The Port of Durban
www.fad.co.za
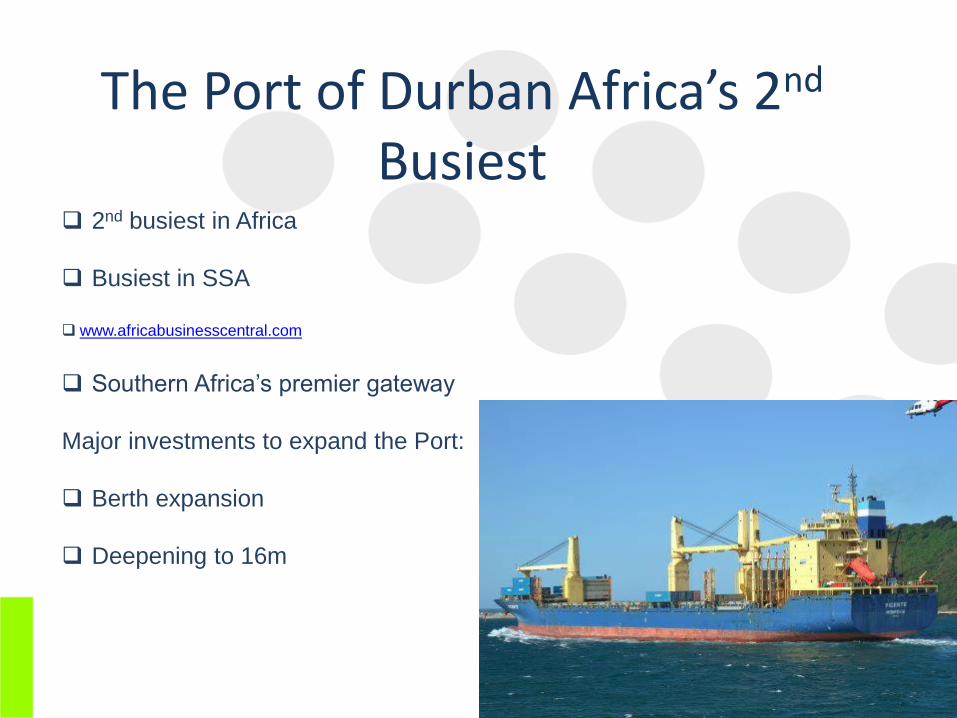
The Port of Durban Africa’s 2nd Busiest
2nd busiest in Africa
Busiest in SSA
www.africabusinesscentral.com
Southern Africa’s premier gateway
Major investments to expand the Port:
Berth expansion
Deepening to 16m
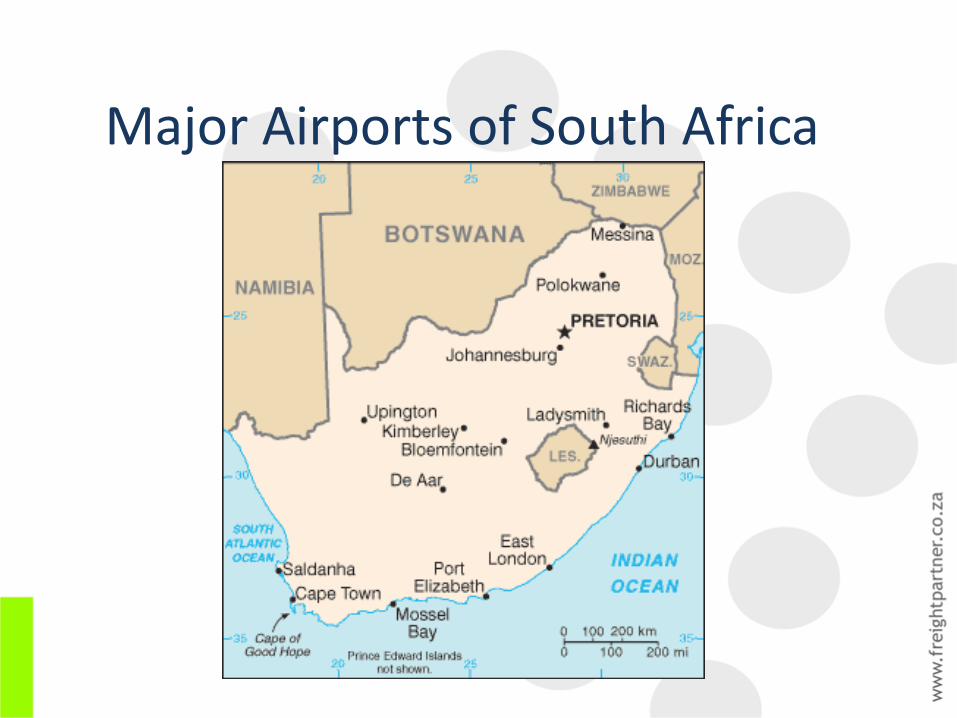
Major Airports of South Africa

OR Tambo International Airport
Africa's biggest and busiest airport,
19 million passengers a year.
Capacity for 28 million passengers
50 percent of National throughput.
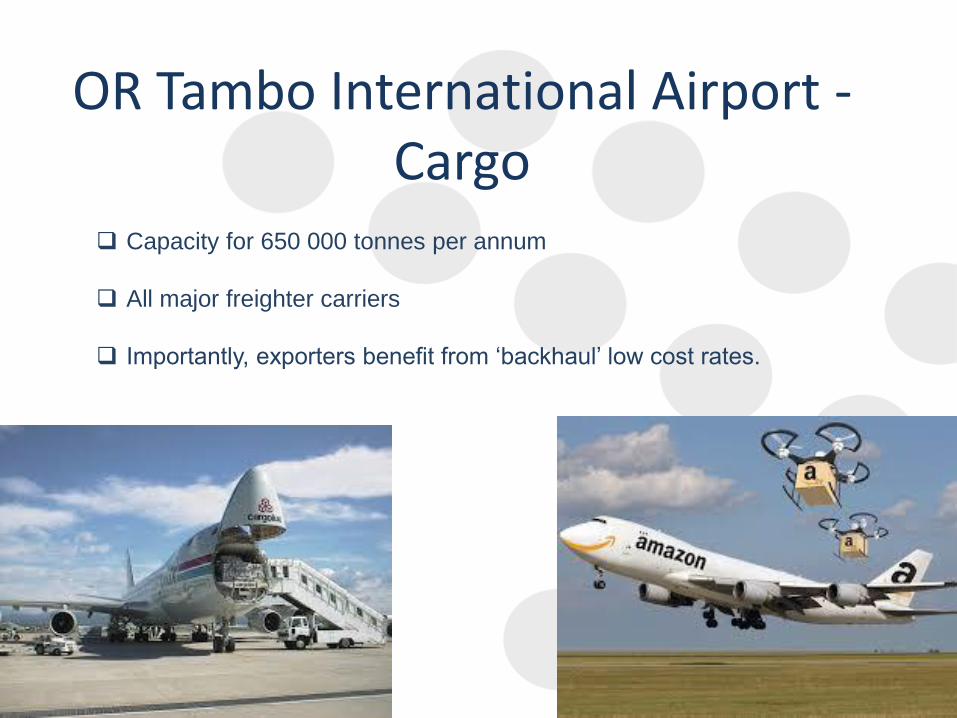
OR Tambo International Airport - Cargo
Capacity for 650 000 tonnes per annum
All major freighter carriers
Importantly, exporters benefit from ‘backhaul’ low cost rates.
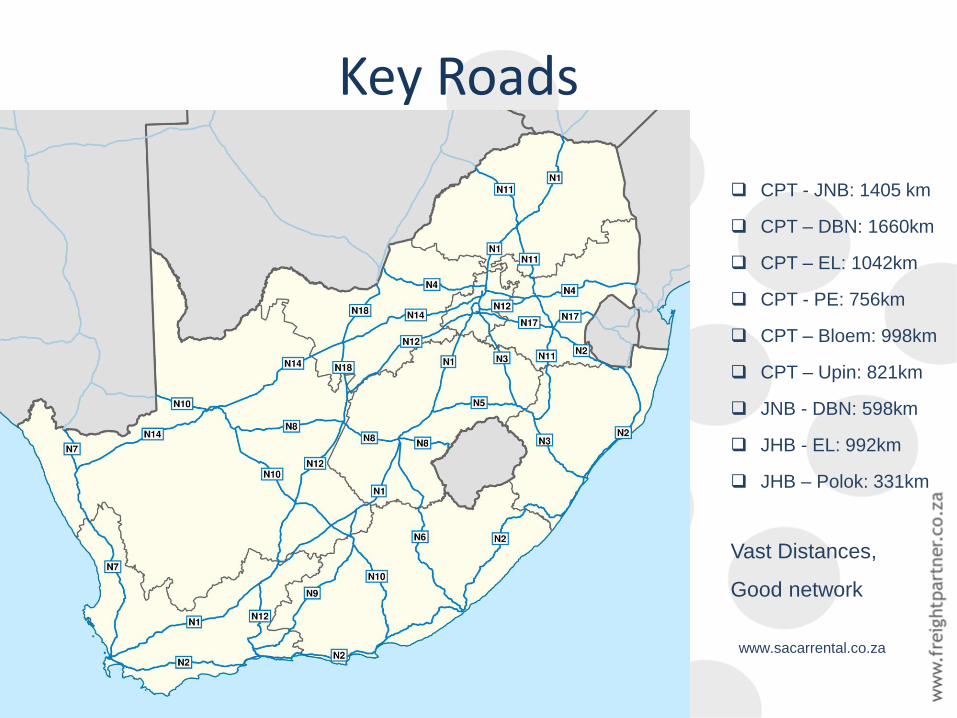
Key Roads
www.sacarrental.co.za
CPT - JNB: 1405 km
CPT – DBN: 1660km
CPT – EL: 1042km
CPT - PE: 756km
CPT – Bloem: 998km
CPT – Upin: 821km
JNB - DBN: 598km
JHB - EL: 992km
JHB – Polok: 331km
Vast Distances,
Good network
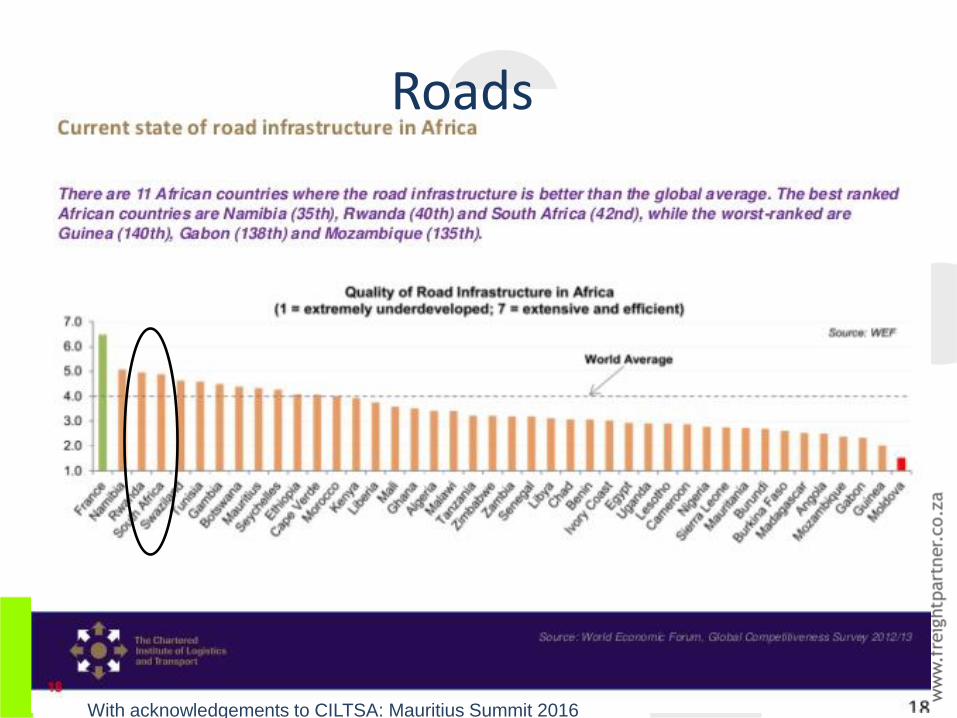
Roads
With acknowledgements to CILTSA: Mauritius Summit 2016
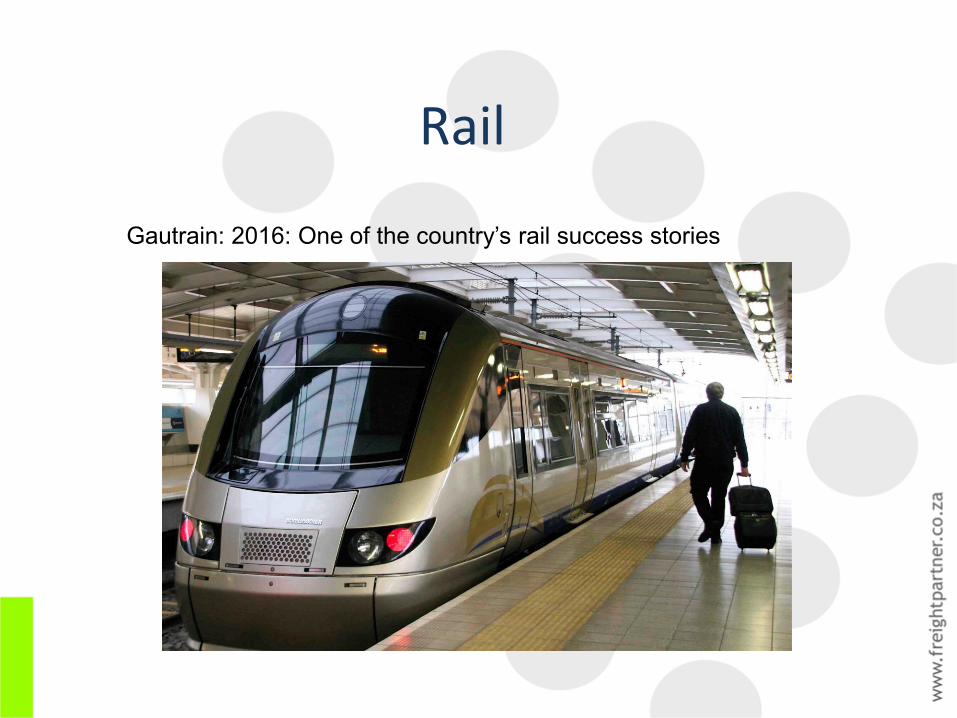
Rail
Gautrain: 2016: One of the country’s rail success stories

Rail
With acknowledgements to Transnet Freight Rail

Rail
With acknowledgements to CILTSA: Mauritius Summit 2016
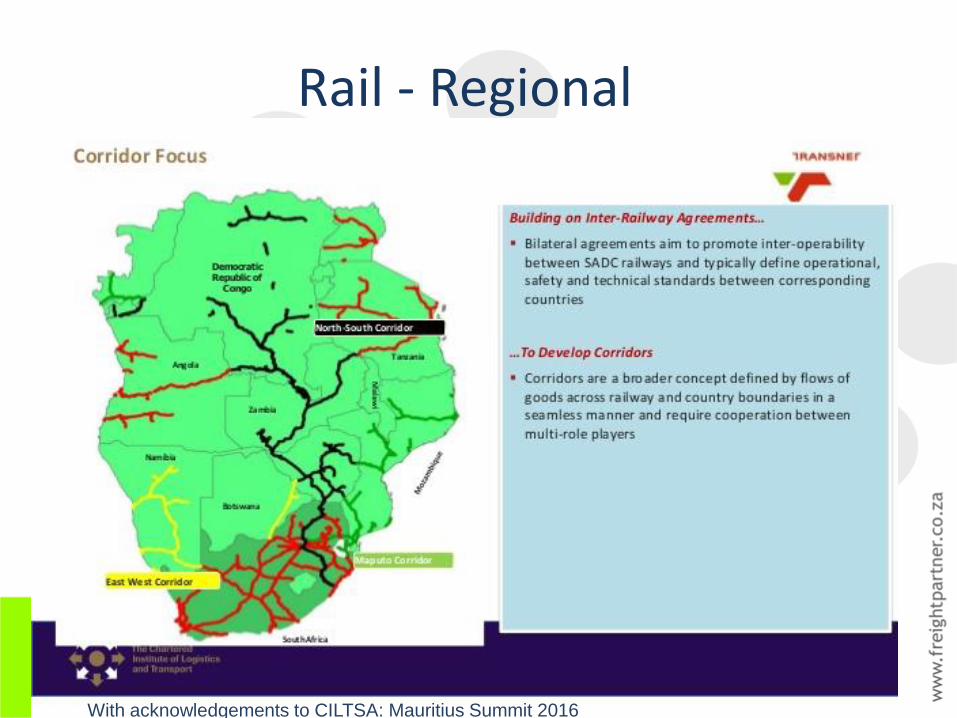
Rail - Regional
With acknowledgements to CILTSA: Mauritius Summit 2016

7 year plan from 2012:
R221 Billion.
Springbok flats
Infrastructure
Waterberg Feeder
Coal Backbone
System.
Coal Export Line.
Swazi Link System:
Lephalale Musina
Lothair Maputo
Komatipoort Ermelo
Ogies.
Pyramid
Broodsnyersplaas
Richards Bay CFM
New
Rail – Development Projects
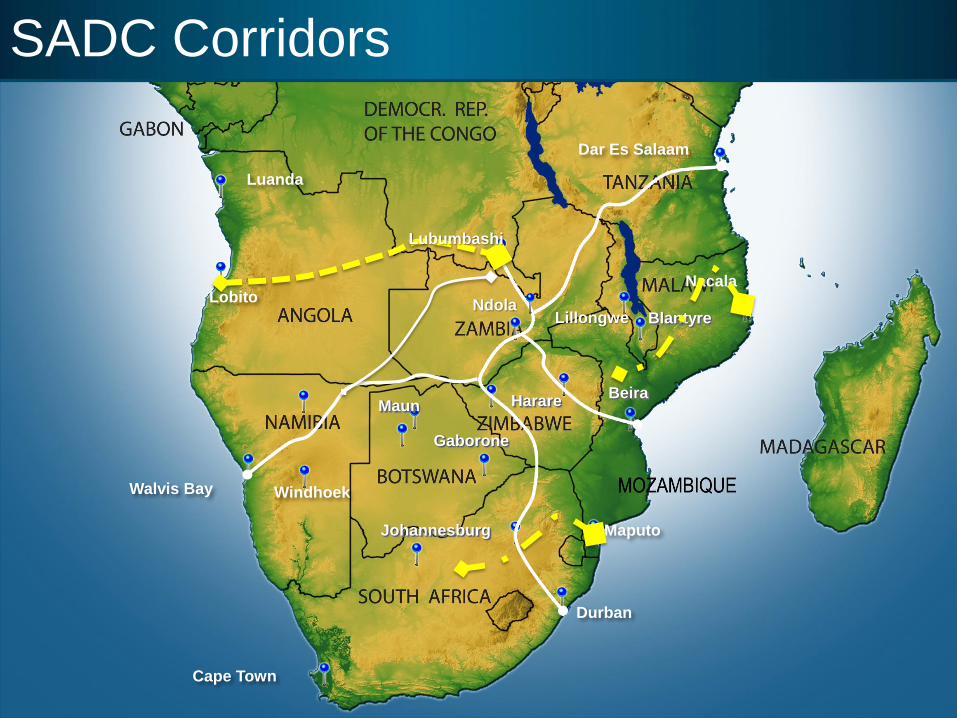
Dar Es Salaam
Lillongwe Blantyre
Johannesburg
Durban
Cape Town
Beira
Maputo
Walvis Bay
Luanda
Lobito
Windhoek
Nacala
SADC Corridors
Ndola
Harare
Lubumbashi
Gaborone
Maun

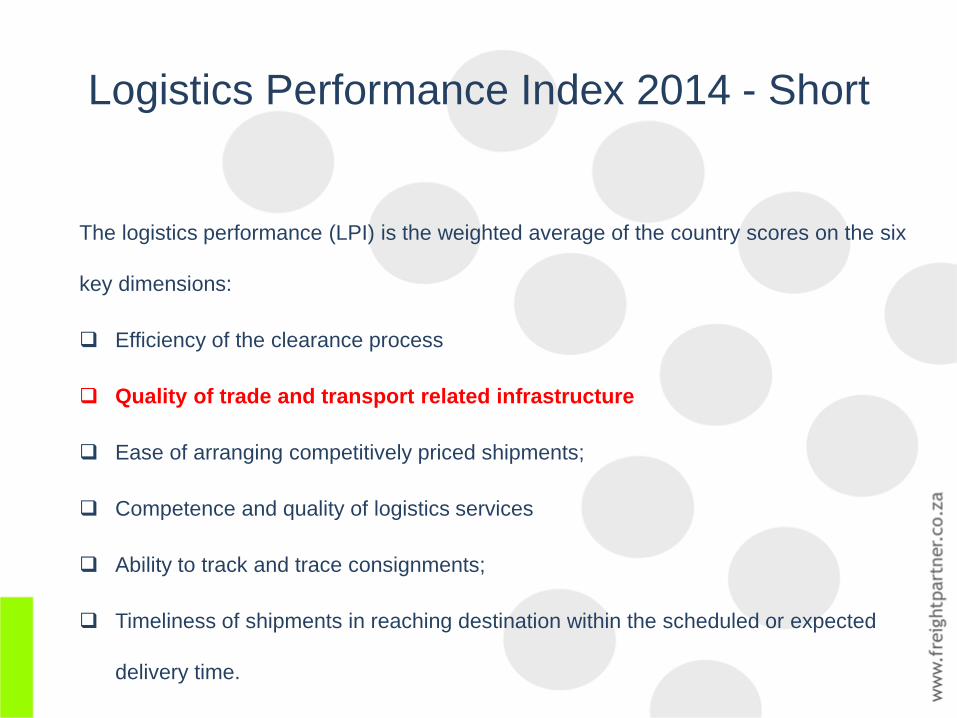
Logistics Performance Index 2014 - Short
The logistics performance (LPI) is the weighted average of the country scores on the six
key dimensions:
Efficiency of the clearance process
Quality of trade and transport related infrastructure
Ease of arranging competitively priced shipments;
Competence and quality of logistics services
Ability to track and trace consignments;
Timeliness of shipments in reaching destination within the scheduled or expected
delivery time.

Logistics Performance Index 2014 - Short
The logistics performance (LPI) is the weighted average of the country scores on the six
key dimensions:
Efficiency of the clearance process
Quality of trade and transport related infrastructure.
Ease of arranging competitively priced shipments;
Competence and quality of logistics services
Ability to track and trace consignments;
Timeliness of shipments in reaching destination within the scheduled or expected
delivery time.
34
42
38
25 24
41
33
OVERALL LPI RANK CUSTOMS INFRASTRUCTURE INTERNATIONAL SHIPMENTS
LOGISTICS QUALITY AND COMPETENCE
TRACKING AND TRACING TIMELINESS
World Bank LPI Ranking: 2014 South Africa
overall LPI rank Customs Infrastructure International shipments Logistics quality and competence Tracking and tracing Timeliness

3.43 2.81 2.81 2.76 2.66 2.57 2.54 2.49 2.46 2.37 2.34 2.33 2.23 1.88
34
73 74 80
93
107 112
120 123
133 137 138
147
159
ZAF MWI KEN RWA NAM BDI AGO BWA ZMB LSO ZWE TZA MOZ ZAR
SOUTH AFRICA MALAWI KENYA RWANDA NAMIBIA BURUNDI ANGOLA BOTSWANA ZAMBIA LESOTHO ZIMBABWE TANZANIA MOZAMBIQUE CONGO, DEM. REP.
SADC : LPI Ranking of SADC Countries as at 2014 Red = Landlocked country
score rank

Summarising
South Africa has world class infrastructure;
It is continually re-investing in key infrastructure;
It functions well with a most a dominant position in the LPI rankings;
It holds gateway status to most of the inland SADC States.
It is working hard to retain its premier gateway status.
Traders have choice and efficiency for the most part.
Can be proud that it can hold its own against larger trading countries.

Thank You