south africa market overview
TRANSCRIPT
7/31/2019 South Africa Market Overview
http://slidepdf.com/reader/full/south-africa-market-overview 1/3
1
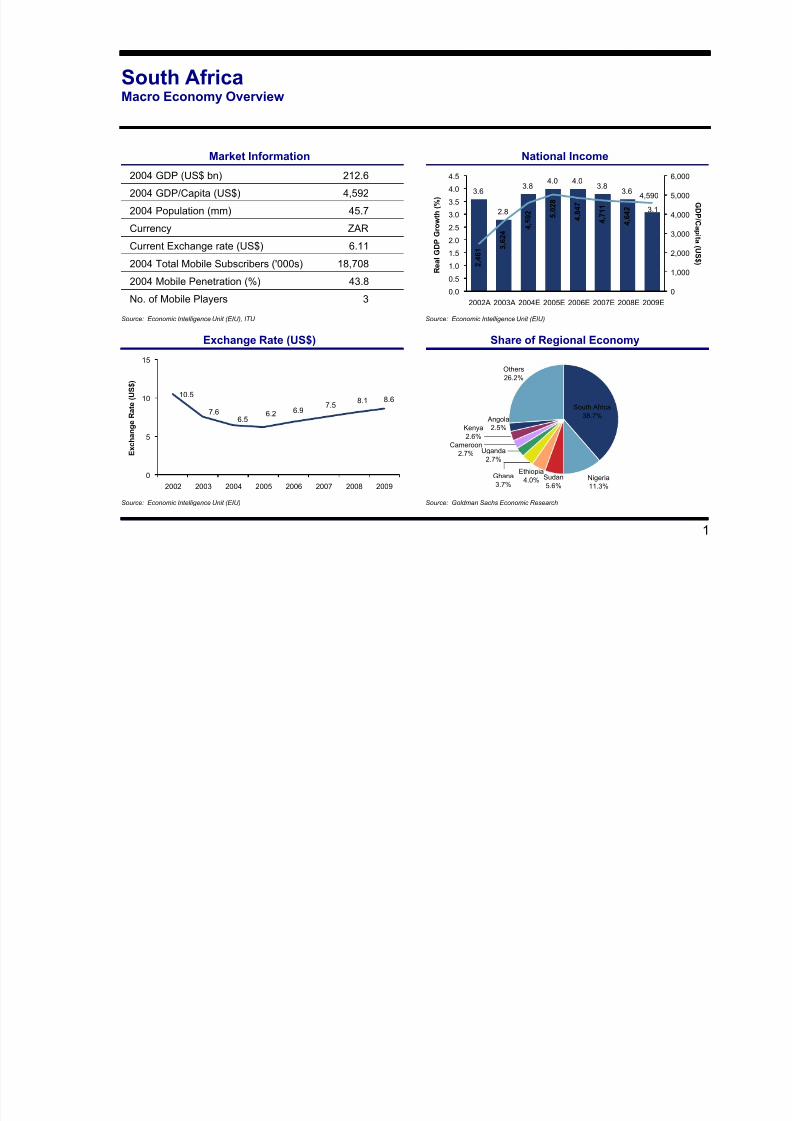
South AfricaMacro Economy Overview
Market Information National Income
2004 GDP (US$ bn) 212.6
2004 GDP/Capita (US$) 4,5922004 Population (mm) 45.7
Currency ZAR
Current Exchange rate (US$) 6.11
2004 Total Mobile Subscribers ('000s) 18,708
2004 Mobile Penetration (%) 43.8
No. of Mobile Players 3
3.6
2.8
3.84.0 4.0
3.83.6
3.1
4,590
4 , 6 4 2
4 , 7 1 1
4 , 8 4 7
5 , 0 2 8
4 , 5 9 2
3 , 6 2 4
2 , 4 6 1
0.0
0.5
1.0
1.5
2.0
2.5
3.0
3.5
4.0
4.5
2002A 2003A 2004E 2005E 2006E 2007E 2008E 2009E
R e a l G D P G r o w t h ( % )
0
1,000
2,000
3,000
4,000
5,000
6,000
GDP / C a pi t a ( U S $ )
Source: Economic Intelligence Unit (EIU), ITU Source: Economic Intelligence Unit (EIU)
Exchange Rate (US$) Share of Regional Economy
10.58.68.1
7.5
6.2 6.97.66.5
0
5
10
15
2002 2003 2004 2005 2006 2007 2008 2009
E x c h a n g e R a t e ( U S
$ )
South Africa
38.7%
Nigeria
11.3%
Sudan
5.6%
Ethiopia
4.0%Ghana
3.7%
Uganda
2.7%
Cameroon
2.7%
Kenya
2.6%
Angola
2.5%
Others
26.2%
Source: Economic Intelligence Unit (EIU) Source: Goldman Sachs Economic Research

7/31/2019 South Africa Market Overview
http://slidepdf.com/reader/full/south-africa-market-overview 2/3
2
South AfricaMobile Market Overview
Mobile Subscribers ARPU
18,708
22,544
26,248
29,200 31,313
32,658
43.9
79.9
75.7
69.9
62.3
53.1
0
10,000
20,000
30,000
40,000
2004E 2005E 2006E 2007E 2008E 2009E
S u b s c r i b e r s ( ' 0 0 0 )
0
20
40
60
80
100
P en e t r a t i on ( % )
CA G R ( 0 4 - 0 9 )
= 1 2. 7 %
48.645.8
40.741.8
0
10
20
30
40
50
Mar-2004 Jun-2004 Sep-2004 Dec-2004
A R P U ( U S $ )
% C hange = 16. 2 %
Source: EMC Worldwide Source: EMC Worldwide
Mobile Players – Subscribers Mobile Players – Market Share
2,050
7,113
9,545
11,624
13,39514,598
15,26915,518
4,6304,0283,4042,8152,344
8,57610,038
11,19812,016 12,510
0
5,000
10,000
15,000
20,000
25,000
30,000
35,000
Dec-2004 Dec-2005 Dec-2006 Dec-2007 Dec-2008 Dec-2009
S u b s c r i b e r s ( ' 0
0 0 )
3C Telecommunications MTN Vodacom
18,708
22,544
26,248
29,20031,313 32,658
14.2%12.9%11.7%10.7%10.4%11.0%
38.3%38.4%38.3%38.2%38.0%38.0%
51.0% 51.6% 51.0%50.0% 48.8% 47.5%
0%
10%
20%
30%
40%
50%
60%
2004E 2005E 2006E 2007E 2008E 2009E
M a r k e t S h a r e ( % )
3C Telecommunications MTN Vodacom
Source: EMC Worldwide Source: EMC Worldwide
7/31/2019 South Africa Market Overview
http://slidepdf.com/reader/full/south-africa-market-overview 3/3
3
South AfricaPolitical and Regulatory Overview
Regulators & Key Regulations update
Independent Communications Authority South Africa - www.icasa.org.za
Department of Communications - www.gov.za
ICASA's key functions are to implement regulations and policies, issue licenses, monitor the environment and enforce compliance withrules, regulations and policies. It also acts as an adjudicator in disputes and for complaints brought by the industry or members of thepublic against licensees, and is responsible for the planning and control of the frequency spectrum and protecting consumers from unfair business practices
It promotes the attainment of universal service and access by issuing licenses requiring operator to roll out services in under-servicedareas and ensuring that they contribute to the Universal Service Fund
In May/June 2004 ICASA awarded temporary 3G concessions to Vodacom and MTN. Vodacom may convert this to a permanent license
for ZAR 6 million per annum, while MTN is for now testing, evaluating and demonstrating UMTS and EDGE on a live pilot network
Political Overview
South Africa is a republic with a bicameral parliament and an indirectly elected president as its executive. The constitution of 1997established a parliamentary political system with three tiers of government: national, provincial and local. Each of the nine provinces hasits own government, separate executive, judiciary and legislature
In the latest elections of April 2004, Mbeki was re-elected for a second five-year term following a landslide victory for the ANC. He haspromised to continue the state's market-oriented policies and has begun to introduce more concrete plans for privatization, public sector
restructuring and economic growth
South Africa has the largest economy in Africa and has an abundance of natural resources, well-developed financial, legal, commercialand communications sectors, and a modern infrastructure which, though at capacity, supports the efficient distribution of goods andservices throughout the country