south african reserve bank working paper series and publications/attachments... · 2020-03-30 ·...
TRANSCRIPT

South African Reserve BankWorking Paper Series
WP/20/01
Developments in bank funding costs in SouthAfrica
Mpho Rapapali and Daan Steenkamp
Authorised for distribution by Chris Loewald
March 2020

South African Reserve Bank (SARB) Working Papers are written by staff members ofthe SARB and, on occasion, by consultants under the auspices of the SARB. The pa-pers deal with topical issues, describing preliminary research findings and developingnew analytical and/or empirical approaches in their analyses. They are solely intendedto elicit comments and stimulate debate.The views expressed in this Working Paper are those of the author(s) and do not nec-essarily represent those of the SARB or SARB policy. While every precaution is takento ensure the accuracy of information, the SARB shall not be liable to any person forinaccurate information, omissions and/or opinions contained herein.
South African Reserve Bank Working Papers can be found athttp://www.resbank.co.za/Research/ResearchPapers/WorkingPapers/Pages/WorkingPapers-Home.aspxEnquiries
Head: Economic Research and Statistics DepartmentSouth African Reserve BankP O Box 427Pretoria 0001
Tel. no.: 012 313-39110861 12 SARB (0861 12 7272)
c© South African Reserve BankAll rights reserved. No part of this publication may be reproduced, stored in a retrievalsystem, or transmitted in any form or by any means without fully acknowledging theauthor(s) and this Working Paper as the source.

Developments in bank funding costs in SouthAfrica
Mpho Rapapali∗ Daan Steenkamp†
March 2020
Abstract
This paper provides an assessment of developments in South African bankfunding costs since the global financial crisis. We construct aggregate bankfunding cost proxies by weighting the average cost of different forms ofbank funding in South Africa and compare these to a summary measureof actual bank funding costs based on a one-off survey of major banks.We show that, in contrast to the behaviour of advanced economy banks,South African banks have not significantly adjusted their funding composi-tion since the global financial crisis. However, we show that bank fundingcosts have increased over recent years, in line with higher money marketliquidity premia, a higher policy rate and higher market interest rates. Aone-off survey of the six largest banks suggests that our average fundingcost proxy is within a plausible range of actual bank funding costs and fol-lows a similar profile over time.
JEL Classification: E40, E44, G21
Keywords: bank funding costs, composition of funding, financial market conditions
Corresponding author’s email address: [email protected]
∗South African Reserve Bank, PO Box 427, Pretoria, South Africa, 0001. Email:[email protected]. The views expressed are those of the author(s) and do not necessarilyrepresent those of the South African Reserve Bank or Reserve Bank policy. While every precaution istaken to ensure the accuracy of information, the South African Reserve Bank shall not be liable to anyperson for inaccurate information or opinions contained herein.†SARB. Corresponding author. Email: [email protected]
1

1 Introduction1
Banks fund loans by obtaining funding from several sources, the most important beingdeposits (from households, businesses, corporates and other banks) and issuances ofdebt. Bank funding costs are crucial to the transmission of monetary policy. Changesin the Reserve Bank repurchase (repo) rate affects the lending rates applying to bor-rowing by consumers and firms because of the impact of the policy rate on banks’ costof funding. The composition and cost of bank funding therefore have important impli-cations for the provision of credit and consequently for economic output and inflation.Bank funding costs also have financial stability implications. To the extent that bankspass-on funding cost changes to lending rates, debt service costs and the number ofnon-performing loans could be affected. Apart from impacting credit losses, changesin bank profitability will affect the level of bank capital, with associated solvency andfinancial stability implications. Monitoring bank funding costs helps the Reserve Bankunderstand changes in bank funding conditions and whether funding cost changes couldbe contributing to excessive risk taking or rapid growth of credit extension.
Before the global financial crisis (GFC), policy rates and global bank funding costswere closely correlated. The GFC, together with subsequent regulatory changes, sawbanks in many advanced economies shift to more stable sources of funding, such asretail deposits and long-term wholesale debt. Internationally, the spread between thecost of these types of funding and policy rates has become more volatile, driven inparticular by variation in funding conditions. This paper gives an overview of recentdevelopments in bank funding by constructing a bank funding cost proxies for the SouthAfrican banking sector.
In contrast to the behaviour of advanced economy banks, the funding compositionfor the South African banking sector has been relatively stable since the GFC, althoughthere have been important shifts at individual bank level. We show that bank fundingcosts have increased over recent years, in line with a higher policy rate and higher marketinterest rates.
This paper is the first in a series on a range of analytical questions related to theimpact of financial market conditions and regulatory changes on the banking sector andtransmission of monetary policy. In this paper, we construct aggregate bank fundingcost proxies by weighting the average cost of different forms of bank funding in SouthAfrica and compare these to a summary measure of actual bank funding costs based on aone-off survey of major banks. Our focus is on the cost of funding bank liabilities, futurework will provide an assessment of the impact of changes in prudential regulations since
1Thank you to Cristel Bakker, Lisa De Beer, Marlene Hugo, Danie Meyer, Wessel Mostert, PierreMananga, Mpho Moloto, Fox Mavuso, Susana Paulse, Witness Simbanegavi, Alex Smith, Marian VanDeventer and Myrtle van Jaarsveld for their comments and help with data and Mukelani Nkuna andEyollan Naidoo for help estimating debt issuance costs. We also acknowledge useful suggestions by twoanonymous referees.
2

the GFC on the asset side of bank balance sheets and the implications for the cost ofbank funding.
2 Background
Since the GFC, the margin between bank lending rates and the repo rate has steadily in-creased (Figure 1). This has led to concerns over the possibility that the pass-through ofmonetary policy to lending rates has weakened and that banks are abusing their marketpower. But to understand the drivers of changes in bank lending rates, it is importantto understand developments in bank funding costs. Bank funding costs are affected bymonetary policy because banks frequently need to borrow funds overnight at a marginover the repurchase rate. As a result, the current and expected levels of the repurchaserate affect both the yield curve and bank lending rates, even though banks only usetheir Reserve Bank settlement accounts for liquidity purposes (as opposed to a sourceof funding). But bank funding costs also depend on the costs of different forms of bankfunding, and banks may change their funding mix depending on changes regulationsand in the relative costs of such sources of funding. In response to changes in fund-ing costs, banks may, depending on the level of competition and economic conditions,choose to pass-on these changes to their customers or absorb them and accept a declinein the profitability of their lending business. This paper unpacks the drivers of changesin bank funding costs as measured using the Reserve Bank’s regular survey of banks(which provides data back to 2008), and discusses the impacts that regulatory changessince the GFC have had on the composition and cost of bank funding. Future papers willdevelop the data necessary to investigate the contributions of policy changes, fundingcosts and other factors to deposit and lending rates.
Figure 1: Average mortgage rate and the policy rate
0
50
100
150
200
250
300
350
0
2
4
6
8
10
12
14
16
2006 2008 2010 2012 2014 2016 2018
Ba
sis
po
ints
Per
cen
t
Mortgage rate less repo (rhs) Repurchase rate Mortgage rate
Note: Mortgage rates are calculated using the weighted sum of flexible and fixed mortgage rates. Source: BA930.
3

3 The composition of bank funding
In many advanced economies, banks’ use of short-term wholesale debt funding2 (de-fined here as debt maturing within 6 months or less) has substantially declined followingthe GFC as banks reshaped their liabilities towards deposits and long-term wholesalesources (defined here as funding with residual maturity of more than 6 months).3 Inpart, this reflected banks’ desire to reduce rollover risk associated with having to refi-nance wholesale funding as it matures. Another factor that contributed to this shift is areassessment of pricing and counter-party risk following the GFC. These developmentsalso reflect actions by banks to prepare to meet Basel prudential requirements beingphased in following the GFC that require a larger proportion of funding from relativelystable sources (Basel Committee on Banking Supervision 2014).
Figure 2 plots a decomposition of the nominal funding base of South African banks.Ahead of the GFC, South African banks had significant capital buffers and funded alarge share of their liabilities from relatively stable sources, so did not have to shifttheir funding base significantly in response to changes in global bank capital standardspost-GFC. In contrast to banks in advanced economies such as those in the euro areaor Australia, the composition of funding in South Africa has remained relatively un-changed since around the time of the GFC (Black and Titkov 2019 and European Cen-tral Bank 2016).4 In South Africa, banks have predominantly funded through deposits,representing over 70 percent of total South African bank liabilities. Wholesale deposits,defined here as deposits by non-bank financial and non-financial corporates, includinggovernment and parastatals (see full definitions in Table 1 in the Appendix), contributearound 65 percent of total deposits (Figure 4), which are generally less ‘sticky’ (i.e.more reactive to changes in interest rates) and expensive to source than household de-posits (Chiu and Hill 2018). Also in contrast to international experience, the share ofdeposits has not risen substantially since the GFC, although household deposits haveincreased somewhat as a proportion of total deposits (Figure 3).5 Figure 5 also showsthat there have not been any dramatic changes in the forms of deposits across the bank-ing sector since the disaggregated data became available in 2012. There are a number
2Such wholesale funding consists of repurchase agreements, collateralised borrowing, and foreigncurrency funding and debt securities issued by banks for a fixed term.
3Data constraints prevent an alternative definition of short- and long-term funding.4An international comparison is made difficult by the inclusion of Negotiated Certificate of deposits
(NCDs) in bank deposits in the official bank survey. In South Africa, NCDs are closer to commercialpaper than money market securities, overstating deposits as a share of total bank funding relative toequivalent calculations for some other economies. According to data from Strate, NCDs had a weightedmaturity of over 4 years in aggregate in 2014, which has fallen to closer to 1 year recently.
5Among the largest banks, the share of retail deposit funding has increased, while the share of insti-tutional funding (i.e. excluding corporate and retail deposits) has fallen since the GFC (and the share ofcorporate deposits has risen for some and fallen for other banks).
4

of potential explanations for the high share of deposits in South African banks’ fundingmix. These include a relatively low contractual savings rate, the precautionary savingbehaviour by households and corporates and the liquidity preference of the regulatedfunds management industry.
Figure 2: The composition of bank funding
0
10
20
30
40
50
60
70
80
90
100
2008 2010 2012 2014 2016 2018
per
cen
t
Deposits Long-term wholesale debt Short-term wholesale debt Equity
Note: The short-term is defined as maturities of 6 months or below, and the long-term has duration of greater than 6 months.
Source: BA900.
Figure 3: A breakdown of total deposits
0%
10%
20%
30%
40%
50%
60%
70%
80%
90%
100%
2008 2010 2012 2014 2016 2018
Wholesale deposits Household deposits
Note: Wholesale deposits consists of deposits of financial and non-financial companies at banks. Source: BA900.
5

Figure 4: A breakdown of total deposits (2018 average share)
33%
28%
3%
36%
Household sectordeposits
Non-financialcorporate sectordeposits
SA bank deposits(mostly NCD's)
Financial corporatesector deposits
Note: The financial corporate sector consists of the Public Investment Corporation (PIC), public financial corporates, insurers,
pension funds, money and non-money market unit trusts and fund managers. The non-financial corporate sector is made up of the
local government, public non financial corporates and private non financial corporates. Source: BA900.
Figure 5: The composition of deposits by type
0%
10%
20%
30%
40%
50%
60%
70%
80%
90%
100%
2012 2014 2016 2018
Call deposits Cheque deposits
Fixed deposits (long-term) Short-term notice deposits
Medium-term notice deposits
Source: BA930.
Wholesale debt funding, which consists of the issuance of bonds and other financialinstruments by banks to large institutional investors, tends to be an important marginalsource of bank funding (i.e. funding for new loans). Figure 2 shows that long termdebt issues has represented about 10 percent of total funding, a similar proportion toshort term wholesale debt long term wholesale funding. While the share of short termdomestic wholesale funding has not changed since the GFC, the share of long termwholesale funding that is domestically-sourced has increased (Figure 6). One factorthat has contributed to the reduction in the share of foreign funding is the rising costof such funding given the banking sector’s exposure to South African sovereign debt
6

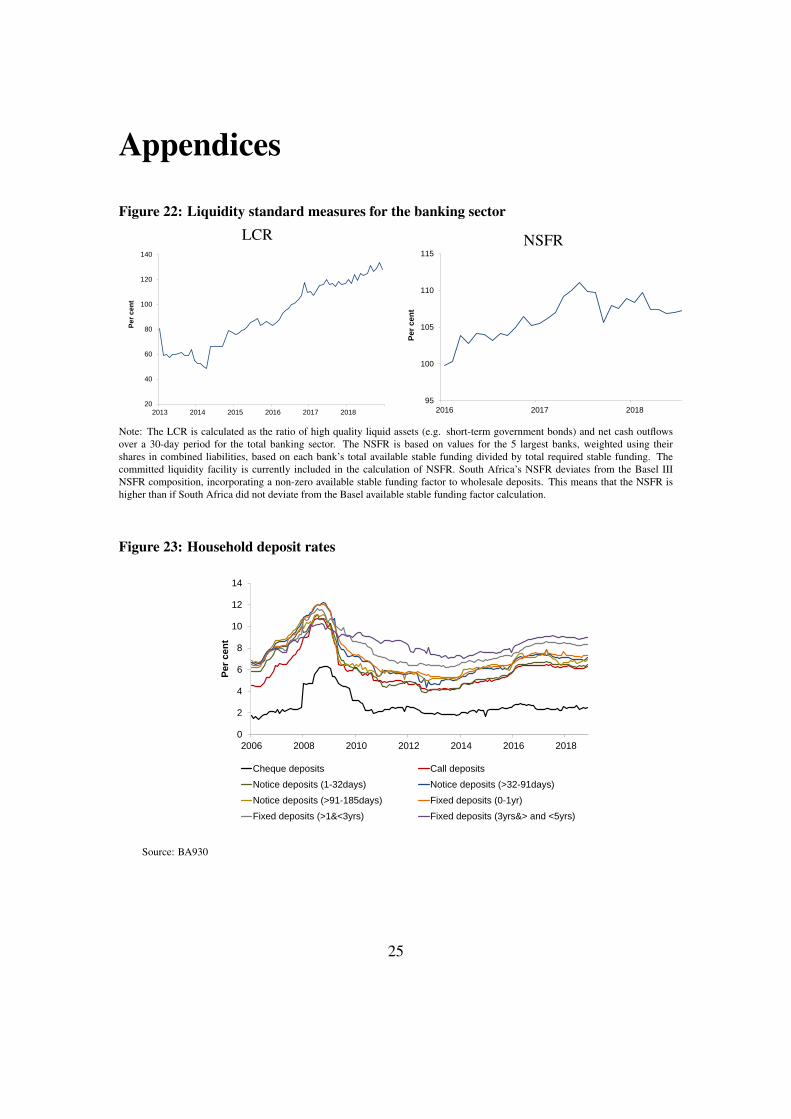
for liquidity purposes and recent sovereign rating downgrades. Unfortunately, the lackof granularity in data available prevents detailed assessment of the profile of wholesalefunding. However, Figure 7 shows that a relatively high proportion of wholesale fundinghas a short residual maturity, with around 50 percent of such funding having a maturityof less than 6 months, and over 35 percent of which having a residual maturity of 1month or less. Changes to bank regulation since the GFC require that banks increasetheir liquidity buffers and proportion of stable long-term funding. Figure 22 in theAppendix shows that the average Liquidity Coverage Ratio (LCR), which requires thatbanks hold a high proportion of high-quality liquid assets, has risen since early 2014,and is close to 120 percent currently. It also shows that the Net Stable Funding Ratio(NSFR) for the banking system has risen over time and exceeds the Basel III regulatoryminimum (100 percent from 1 January 2018) for the 5 largest banks.
Figure 6: Composition of banks’ wholesale funding
Domestic
0%
10%
20%
30%
40%
50%
60%
70%
80%
90%
100%
2008 2010 2012 2014 2016 2018Short-term Long-term
Foreign
0%
10%
20%
30%
40%
50%
60%
70%
80%
90%
100%
2008 2010 2012 2014 2016 2018Short-term Long-term
Short-term
0
10
20
30
40
50
60
70
80
90
100
2008 2010 2012 2014 2016 2018
Pe
r c
en
t
Domestic Foreign
Long-term
0
10
20
30
40
50
60
70
80
90
100
2008 2010 2012 2014 2016 2018
Pe
r c
en
t
Domestic Foreign
Note: Domestic currency and foreign currency wholesale funding is represented as a share of total bank funding (excluding
equity and securitisation). The short-term is defined as maturities of 6 months or below, and the long-term has duration of greater
than 6 months. Source: BA900.
7

Figure 7: Maturity profile of bank wholesale funding
0%
10%
20%
30%
40%
50%
60%
70%
80%
90%
100%
2008 2010 2012 2014 2016 2018
< 1month 1 months to 6months > 6 months
Source: BA900.
Unlike many banking systems with similar levels of sophistication and capital mar-ket depth, the contribution of foreign funding to total liabilities is low and has declinedsince the GFC to slightly over 10 percent currently (Figure 8).6 A large proportion offoreign funding is also in local currency terms. In part, this reflects South African ex-change control regulation that limits the foreign currency exposure of banks (defined asthe difference between total foreign currency assets and liabilities) to 10 percent of netqualifying capital and reserve funds. The foreign currency component of foreign loansis also around 10 percent, while the foreign currency share of total liabilities is around 8percent (Figure 9). This means that while the exposure of the banking sector to foreignshocks and the consequences of rand volatility are rather limited, the funding sourcesof South African banks is less diversified than in overseas banking systems. Data avail-ability prevents assessment of the maturity structure of banks’ foreign currency fundingor the extent to which there exists unhedged foreign exchange exposures.7
Bank funding comes in ‘unsecured’ or ‘secured’ forms, depending on whether fund-ing is secured against collateral. One example of the latter is repurchase agreements,which involve an agreement where a bank sells an asset, such as a government bond,to secure funding and buying it back at an agreed future date and agreed higher price.Repurchase agreements however make up less than 3 percent of total bank liabilities.Another way for banks to raise secured funding is by securitisation (such as pooling as-sets as collateral for secured funding through special purpose vehicles). In South Africa,
6A large proportion of the decline observed in Figure 8 reflect the consolidation of the foreign opera-tions of one of the large banks.
7South African banks do not raise a large proportion of their funding from foreign sources, and wherebanks raise foreign funding to originate foreign currency assets, they appear to run conservative mismatchpositions between foreign assets and liabilities. However, data on bank hedging practices is not availableat present.
8

this also represents a small proportion of total funding at around 3 percent of total bankliabilities, mainly reflecting securitisation of residential mortgages and vehicle loans.8
Shareholder equity currently represents about 8 percent of total bank liabilities. Equityis not a regular source of bank financing and has also varied little over time.9
Figure 8: The share of foreign liabilities in total liabilities
0
5
10
15
20
25
30
35
2008 2010 2012 2014 2016 2018
Per
cen
t
Share of foreign funding to total liabilities
Source: BA900.
Figure 9: Foreign currency liabilities and foreign currency loans
0
2
4
6
8
10
12
14
2008 2010 2012 2014 2016 2018
Per
cen
t
FX liablities to total liabilities FX loans to total loans
Source: BA100 and BA900.
8Issuance of covered bonds are not currently allowed in South Africa. Covered bonds have recourseto specific pools of assets (such as mortgages) in the event of a bank default while also representing aresidual claim on the assets of the issuing bank. Apart from attracting a more diversified investor base,covered bonds also allow banks to issue at longer maturities than conventional bonds. Risk premia inthe covered bond market can, however, increase dramatically during times of financial turmoil, raisingrefinancing costs.
9Future work could incorporate the cost of bank equity in additional bank funding cost proxies.
9

4 Developments in the cost of bank funding
The cost to banks of different forms of funding depend on several factors. On-calldeposit rates, for example, are affected by the repo rate, as well as government riskfree rates and the level of competition for deposits among banks. The relative costof wholesale debt funding depends on risk-free rates, the liquidity premium betweendeposits and longer-term debt and credit spreads on wholesale funding. These willvary depending on financial market conditions, while the credit spreads will depend onbank and instrument characteristics and the macroeconomic environment. Bank fundingcosts are therefore affected by monetary policy, conditions in the interbank market andthe strength of banks’ balance sheets.
Measurement of bank funding costs using market data is difficult in South Africa.There are, for example, no risk-free money market interest rate benchmarks currentlyavailable in South African financial markets (see South African Reserve Bank 2018).The secondary market for Treasury bills is also illiquid in South Africa, given the longtenor of most government debt issuance and prudential regulations that incentivise banksto hold these instruments until maturity. The 3 month Johannesburg Interbank AgreedRate (JIBAR) is the most commonly used reference rate against which financial marketcontracts are reset. As pointed out in South African Reserve Bank (2018), there areunfortunately several problems with the JIBAR as an interest rate benchmark. TheNCD rates which JIBAR is based on may not accurately reflect market pricing given thesporadic issuance at a 3 month tenor and the dominance of non-bank financial corporatedeposits as a source of funding at that maturity. Figure 10 shows how the spread betweenthe repo rate and the 3 month JIBAR rate increased from 2012 onwards. Two possibleexplanations are expectations of future monetary policy tightening and changes in bankcredit risk. But another factor that appears to have had a particularly large contributionto this spread has been an increase in the liquidity premium embedded in money marketrates. Figure 11, for example, shows how the cost of issuing a 12 month NCD has risenrelative to repo.
10

Figure 10: Spread between repo and 3 month JIBAR
0
2
4
6
8
10
12
14
-100
-80
-60
-40
-20
0
20
40
60
80
2006 2008 2010 2012 2014 2016 2018
Pe
r c
en
t
Basis
po
ints
3M JIBAR less repo Repo rate 3M JIBAR
Source: Bloomberg, author calculations.
Figure 11: Liquidity spread estimate (0-12 months)
0.0
0.2
0.4
0.6
0.8
1.0
1.2
1.4
1.6
2013 2014 2015 2016 2017 2018 2019
Pe
r c
en
t
Volument adjustment JIBAR Spread
12m FRN Spread Liquidity Spread
Source: Bloomberg, author calculations. A volume adjustment is added to account for an immediacy premium applying tolarge trades. The JIBAR spread is the difference between 3 month JIBAR and repo, and the 12 month Floating Rate Note (FRN)spread is the NCD spread over an equivalent swap rate.
The actual rates at which banks can fund in the short-term wholesale market tendto be lower than JIBAR, while they have tended to be higher for long-term wholesalefunding. By way of example, Figure 12 depicts the spread between deposit rates andmaturity matched money-market interest rates. Pre-GFC, rates on call deposits wereabout 250 basis points lower than the overnight repo rate, while the 1-month deposit ratewas around 120 basis points lower than the 1 month JIBAR. Competition for wholesaleterm and household deposits has intensified following the GFC, which has seen thesespreads narrow dramatically.10 Intensification of competition for retail deposits has
10Figure 23 in the Appendix shows that the spreads between different types of household deposit
11

benefitted savers and reflect the scarcity of savings in the economy. The spread on short-term wholesale funding relative to commonly used reference rates has been volatile butalso higher on average post-GFC (Figure 13). The failure of African Bank in 2014saw a tightening in financial conditions and spike in NCD spreads to JIBAR. Longer-term wholesale funding costs have been relatively stable since the GFC and higher thanmaturity matched reference rates (Figure 14).11
Figure 12: Spreads between deposits and money market rates of equivalent maturity
-350
-300
-250
-200
-150
-100
-50
0
50
100
150
200
2006 2008 2010 2012 2014 2016 2018
Ba
sis
po
ints
Call deposit rates less repo
1-month deposit rates less 1-month Jibar
3-month deposit rates less 3-month Jibar
Source: Bloomberg, author calculations.
rates has been reasonably steady since the GFC. Fixed-rate deposits are subject to penalties for earlywithdrawal, and tend to attract a premium over call deposits, depending on the regulatory classificationof the depositor.
11Unfortunately, bank credit default swaps are not actively traded in South Africa, so the spread of newunsecured wholesale issuance over existing bonds rates cannot be estimated. One factor that may havecontributed to the observed increase in some components of wholesale funding costs is South Africa’ssovereign downgrades by raising risk premia on bank debt and affecting the value and eligibility ofsovereign bonds as collateral for secured funding, repurchase agreements and derivative positions on across border basis. Prudential requirements to increase holdings of liquid assets has seen banks increasingtheir ownership of government bonds, leading to higher sovereign risk exposure.
12
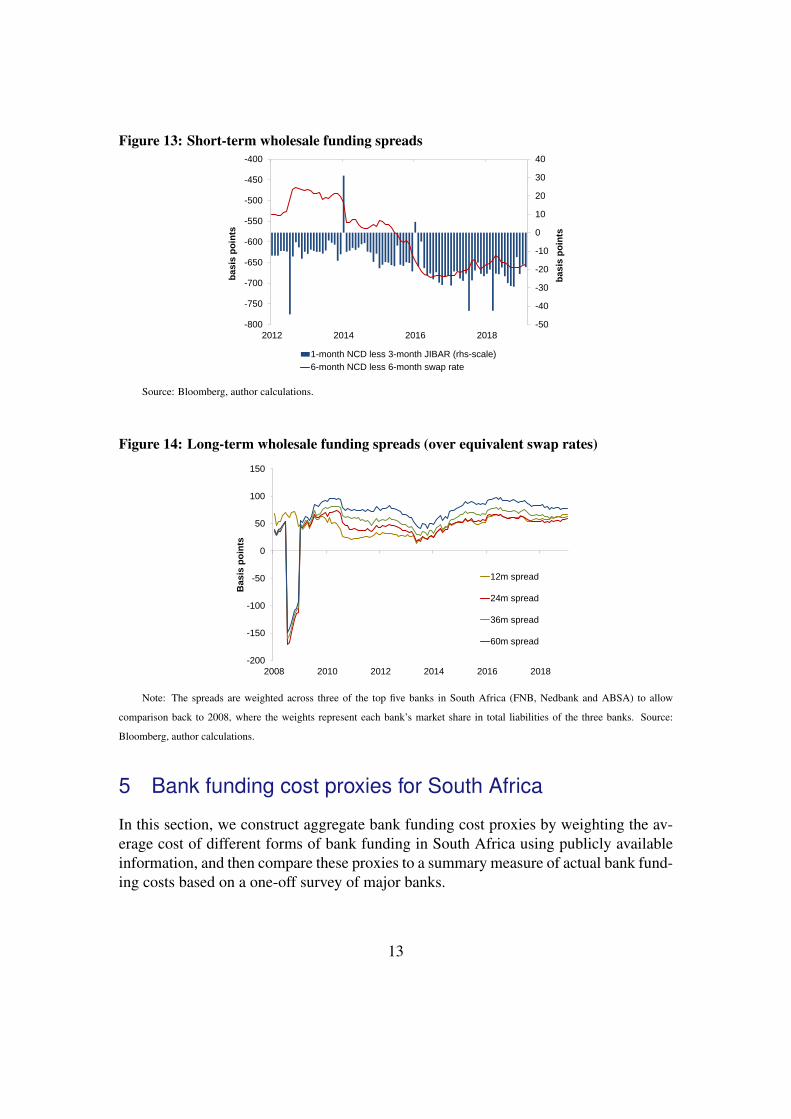
Figure 13: Short-term wholesale funding spreads
-50
-40
-30
-20
-10
0
10
20
30
40
-800
-750
-700
-650
-600
-550
-500
-450
-400
2012 2014 2016 2018
ba
sis
po
ints
ba
sis
po
ints
1-month NCD less 3-month JIBAR (rhs-scale)
6-month NCD less 6-month swap rate
Source: Bloomberg, author calculations.
Figure 14: Long-term wholesale funding spreads (over equivalent swap rates)
-200
-150
-100
-50
0
50
100
150
2008 2010 2012 2014 2016 2018
Ba
sis
po
ints
12m spread
24m spread
36m spread
60m spread
Note: The spreads are weighted across three of the top five banks in South Africa (FNB, Nedbank and ABSA) to allow
comparison back to 2008, where the weights represent each bank’s market share in total liabilities of the three banks. Source:
Bloomberg, author calculations.
5 Bank funding cost proxies for South Africa
In this section, we construct aggregate bank funding cost proxies by weighting the av-erage cost of different forms of bank funding in South Africa using publicly availableinformation, and then compare these proxies to a summary measure of actual bank fund-ing costs based on a one-off survey of major banks.
13

5.1 Weighted average bank funding costs
We construct a weighted average cost of bank funding (WACF) proxy by volume-weighting estimates of the cost of different forms of bank funding, r, by the share ofthe respective form of funding in banks’ total funding basket, w12:
WACFt =J
∑j=1
r j,tw j,t (1)
where j is a form of funding and t the relevant month. Weights are based on stocks ofoutstanding liabilities from banks’ balance sheets, and are dynamic in that they changeon a month-to-month basis. The liabilities included in our measure are household andwholesale deposits as well as wholesale debt funding (WSD). For each type of bankfunding, a matching reference rate is calculated from market-based interest rates. Weexpress our WACF proxy as spreads with a relevant reference rate for funding at differ-ent maturities. For funding sources with a maturity of less than 6 months, we calculatethe WACF as spreads over the 3 month JIBAR, as it is the most common benchmark rateused by banks when calculating their funding costs. Funding with a tenor longer than 6months are matched to maturity equivalent interest rate swaps. Our WACF is calculatedas:
WACFt =WACFDepositst +WACFWSD,ST
t +WACFWSD,LTt (2)
where the components are calculated as:
WACFDeposits,i, jt =
∑Ji, j=1 LDeposits
i, j,t
LTotalbanksi, j,t
∗ [SpreadDeposits,i, jt ] (3)
WACFWSD,STt =
LWS,STt +LWS,MT
t
LTotalbankst
∗ [SpreadWSD,STt ] (4)
WACFWSD,LTt =
LWS,LTt
LTotalbankst
∗ [SpreadWSD,LTt ] (5)
12For similar approaches see Illes et al. (2015) or Cook and Steenkamp (2018). Olds and Steenkamp(2020, forthcoming) will provide updated bank-level estimates of various funding costs proxies based onthe publicly available BA form data.
14

where Depositsi with i = Retail,Wholesale (includes government and interbankdeposits) and j = SST ,LT , where ST refers to deposit items with a residual maturityof up to 12 months, and LT reflects a residual maturity of more than 12 months. Forwholesale debt, SST is wholesale debt items with a residual maturity of up to one month,MT is a residual maturity of more than 1 month but less than 6 months and LT refersto debt with residual maturity of longer than 6 months. The costs of funding for thedifferent funding components used are calculated as follows:
SpreadDepositsi, jt =Weightedratei, j,t− JIBAR3m
t (6)
SpreadWSD,STt =
LWSD,STt
LWSD,SSTt +LWS,MT
t∗ [NCD1m
t − JIBAR3mt ]
+LWSD,MT
t
LWSD,SSTt +LWSD,MT
t∗ [NCD6m
t −Swap6mt ]
(7)
SpreadWSD,LTt =
14∗ [NCD12m
t −Swap12mt ]+
14∗ [NCD24m
t −Swap24mt ]
+14∗ [NCD36m
t −Swap36mt ]+
14∗ [NCD60m
t −Swap60mt ]
(8)
where the overall cost of deposits, SpreadDeposits,i, jt , is calculated by applying weighted
average rates to each deposit category from the BA930 survey of the South AfricanReserve Bank in which banks report their own weighted rates for each deposit category.These rates are then aggregated and weighted across all 36 registered banks based onoutstanding balances as a share of total bank liabilities (LTotalbanks
t ). The weights inSpreadWSD,ST
t and SpreadWSD,LTt are based on outstanding loan balances by category
from the BA900 survey. The deposit spread is based on the 3 month JIBAR since aweighted deposit rate is used. The funding spread for 1 month wholesale debt funding isbased on the 3 month JIBAR given the lack of an overnight index swap at this maturityin the South African market. At a 6 month maturity, Swap6m
t is calculated using thecombination of the 3 month JIBAR and the 3*6 forward rate agreement rate. NCDspreads for maturities of 12 months or more are calculated as the difference betweenNCD ask rates (of different maturities of three of the largest banks in South Africa forwhich data is available over a long sample) and rates on maturity matched interest rateswaps (Swap). The spreads are then weighted by the corresponding bank’s share ofliabilities to the total of these three banks. For each tenor, we use the average weightedspread of these three banks as indicative of the average market spread. Owing to a
15

lack of data describing the maturity structure of long-term wholesale debt in BA surveyforms, we are unable to determine whether South African banks have extended theirwholesale funding tenor to increase their proportion of stable funding and reduce therisk associated with rolling over maturing wholesale debt. We are also unable to assesshow these changes may have affected bank funding costs. For this reason, the long-termwholesale debt component of our funding cost proxy is calculated as a simple averageof the four reference rates for wholesale debt with maturities over 12 months (12, 24,36 and 60 month maturities, respectively). This implies an average maturity of about 3years for the long-term wholesale debt component of our proxy. Figure 15 shows theaverage original maturity of long term wholesale funding since 2013/4 when Basel 3regulations were implemented, which suggests that this is a reasonable approximation,at least on average over the sample considered. However, this data suggests that bankshave not, in aggregate, increased the tenor of their wholesale issuance since the GFC. Infact, banks’ most commonly used marginal funding source is issuance of NCDs, withissuances increasingly becoming focuses at a 12 month tenor, as can be seen in thedecline of the weighted average wholesale funding maturity.13
Figure 15: Estimated weighted average maturity of new long term wholesale funding
0
2
4
6
8
10
2008 2010 2012 2014 2016 2018
Years
Notes: Calculated as the weighted average of the original maturities of debt issuances (data from the Johannesburg Stock
Exchange (JSE)) and NCD issuances with maturity equal to or greater than 12 months (data from Strate from 2016 onwards).
13Under the Basel III LCR rules, banks must hold a larger proportion of liquid assets against NCDfunding with a residual maturity over 30 days, and that NCDs are viewed as less stable than other sourcesof funding in the calculation of the NSFR. Since the implementation of LCR and the NSFR, large bankshave complied with these regulations by funding a larger share of their wholesale deposits using NCDs,particularly at a 12 month tenor.
16

Figure 16 plots the weights of each of the components of the funding cost proxy.Around 2011, there was a shift to more long-term wholesale deposit funding (the yel-low component) and a decline in the proportions of short-and long-term wholesale debtfunding (the dark blue and green components), but since then the relative shares of thedifferent components have been fairly stable. Figure 17 shows that long-term wholesaledeposit spreads, as well as short-term and long-term retail deposit spreads, decreasedafter peaking around the end of 2009. However, these spreads have edged higher from2016 onwards, while the other component spreads have been relatively stable over re-cent years.
Figure 16: Weighted average bank funding component weights
0%
10%
20%
30%
40%
50%
60%
70%
80%
90%
100%
2008 2010 2012 2014 2016 2018
Short-term wholesaledebt
Short-term wholesaledeposits
Short-term retaildeposits
Long-term wholesaledebt
Long-term wholesaledeposits
Long-term retaildeposits
Source: BA900, BA930, author calculations.
Figure 17: Weighted average bank funding spreads
-500
-400
-300
-200
-100
0
100
200
300
2008 2010 2012 2014 2016 2018
Bas
is p
oin
ts
Long-term retail deposits
Long-term Wholesale deposits
Long-term wholesale debt
Short-term wholesale debt
Short-term retail deposits
Short-term wholesale deposits
Source: Bloomberg, author calculations.
17

5.2 Marginal bank funding costs
To assess how the costs of sourcing new bank funding has changed over time, we alsocreate an alternative proxy based on flows of new funding instead of total outstandingliabilities as in the previous sub-section.
To compute a weighted average marginal cost of bank funding (WAMCF) proxy, weuse deposit data from the BA930 survey and JSE data on bank debt issuance. Since thereis no data available on new deposits funding, we use monthly changes in outstandingdeposit balances to proxy the volume of new deposits. The WAMCF is thus calculatedas the sum of the estimated costs of these two components:
WAMCFt =WAMCF∆Depositst +WAMCFDebtissues
t (9)
where the components are calculated as:
WAMCF∆Deposits,m,nt =
∑Jm,n=1 ∆Depositsm,n,t
Marginal f undingt∗ [RateDeposit,m,n
t − JIBAR3mt ] (10)
WAMCFDebtIssues,t,wt =
∑Jp=1 DebtIssuesp,t
Marginal f undingt∗ [FundingspreadDebtIssues,p
t ] (11)
RateDepositsm,nt =Weightedratem,n (12)
where Depositsm is an aggregation of components m = Retail, Wholesale (includ-ing government and interbank deposits), where ∆ denotes the monthly change, for amaturity breakdown of n = STD,LTD, and STD refers to deposit items with an unexpiredmaturity of up to 12 months, and LTD reflects unexpired maturity of over 12 months.DebtIssuesp,t is the amount of debt issued by the banking sector in month t where p in-cludes floating rates notes (including callables), fixed rate notes and credit-linked notes.The two funding components together sum to total Marginal f undingt .
As with the WACF measure, weighted deposit rates are calculated by applyingweighted average rates to each deposit category from the BA930 survey. The bankingsector average funding cost for listed debt in a given month (FundingspreadDebtIssues,p
t )is estimated as the volume weighted funding cost of all listed debt instruments for thatparticular month. These spreads are easily observable from floating rate debt instru-ments linked to 3 month JIBAR, however for fixed rate debt instruments, these areestimated as a spread over a rate on an interest rate swap of similar maturity as the debtinstrument. Our methodology assumes that all non-zero coupon fixed rate debt instru-ments have vanilla bullet profiles and that they have no embedded optionality, i.e. they
18

pay fixed coupons on regular intervals before maturity and final coupon and notional atmaturity. The drawback to this methodology is that amortising or accreting profiles willalso be treated as bullet profiles and that nominal spreads on debt instruments with em-bedded options are taken as is without adjusting for optionality which might over- andunder-estimate the funding spreads for callable and puttable debt instruments, respec-tively.14 The spreads on zero coupon debt instruments are estimated as the differencebetween the rate on the zero coupon debt instrument and the zero coupon swap rate ofcorresponding maturity. The zero coupon swap curve is calculated by bootstrapping theinterest rate swap curve at issue date into zero coupon swap rates, with cubic splinesused for interpolation. When expressed as fixed rates instead, rates are calculated as thesum of the funding spread for a particular debt instrument and the rate on the interestrate swap with a similar maturity.
Figure 18 plots the weights used to construct the marginal proxy. Marginal fundingis usually dominated by wholesale deposits, which are predominantly NCD-based, al-though there have been some periods where a large proportion of marginal funding hascome from increases in deposits. Given the volatility of these weights, we present themarginal proxy as a 6 month rolling average of estimated marginal funding costs.
Figure 18: Marginal bank funding component weights
0%
10%
20%
30%
40%
50%
60%
70%
80%
90%
100%
2008 2010 2012 2014 2016 2018
Debt issuance >10 years
Debt issuance 7-10years
Debt issuance 3-6years
Debt issuance <3 years
Long-term wholesaledeposits
Short-term wholesaledeposits
Long-term householddeposits
Short-term householddeposits
Source: JSE, Strate, author calculations.
Figure 19 shows the component funding spreads for the marginal proxy. Post-GFC,funding short-term deposits has typically come at a cost below the 3 month JIBAR rate,
14Debt issuances with complex issuance terms (such as amortising structures) are excluded from oursample. Nevertheless, our estimates cover 98 percent of the volume of debt issuances over the sample. Afull description of the methodology and bank-level issuance information will be provided in Naidoo et al.(2020, forthcoming).
19

while issuing debt and long-term deposits have come at a cost greater than JIBAR.
Figure 19: Marginal bank funding spreads
-500
-400
-300
-200
-100
0
100
200
300
2008 2010 2012 2014 2016 2018
Basis
po
ints
Debt issues <3 yearsDebt issues 3-6 yearsDebt issues 7-10 yearsDebt issues >10 yearsShort-term household depositsLong-term household depositsShort-term wholesale depositsLong-term wholesale deposits
Source: Bloomberg, JSE, Strate, author calculations.
5.3 Actual funding costs proxy
Next, we construct an estimate of the average costs of funding bank liabilities from aone-off survey of South Africa’s six largest banks. The survey covers banks’ fundingmix and respective costs for different categories of funding for the period January 2006to December 2018. Given the sensitivity of the actual components funding costs atbank level, individual bank-level funding components are volume weighted and only anaggregate measure of actual funding costs presented.
Our actual funding cost (AFC) estimate is calculated as:
ACFt =6
∑b=1
ACFb,t (13)
which is the sum of the volume weighted ACF for each of the six banks in the one-off survey. The components are calculated as:
ACFb,t =J
∑j, f ,b=1
Liabilities j, f ,b,t
Totalliabilitiest∗ [Rate j, f ,b,t− JIBAR3m
t ] (14)
where j is the type of funding by product type (i.e. deposits, debt securities, repurchaseagreements and interbank funding), by funding sector f (i.e. households, banks, firms,institutional, government and foreign) for each of the six banks b, where t is the relevant
20

month and sum to Totalliabilitiest .15 Rate j, f ,b,t is the interest rate for each form offunding for each bank. Liabilitiest is the sum of all funding acquired by the six banks inthe survey. The survey data is based on SA bank level data, with funding cost valuationsin nominal terms. The actual funding cost proxy is expressed as a spread over the 3month JIBAR as we do not know the maturity structure of some liabilities of some ofthe banks in the survey.
5.4 Comparison of funding costs proxies
Figure 20 plots the average funding cost proxy (expressed as a spread to reference ratesused in the calculations described earlier), while Figure 21 re-expresses these in levelterms to make them more easily interpretable. Our measure based on the current stock offunding provides an indication of the average cost of bank funding, while the marginalcost measure provides an indication of the cost of new bank funding for South Africanbanks. Average bank funding costs, when expressed in funding spread terms, weremore than 130 basis points dearer in January 2019 than in January 2008. Expressed inlevel terms, average funding costs are however substantially lower than pre-GFC levels,having fallen by almost 300 basis points. The fall in the proxy in level terms reflectsthe fall in market interest rates since the GFC, although they have risen by slightly morethan market rates since troughing in late 2013. Between October 2013 and January2019, average bank funding costs rose by 171 basis points, compared with 175 and201 basis points in the case of the repo rate and the 3 month JIBAR, respectively.16 Incomparison, the latest datapoint for the marginal funding cost proxy is about 200 basispoints higher than its pre-GFC level when expressed as a spread to relevant referencerates, although in level terms it is 230 basis points lower. Since October 2013, it hasbeen volatile and the latest estimate is about 142 basis points higher in level terms, aslightly lower increase than in the case of the repo and JIBAR over the same period. Ourestimates of actual funding costs suggest that funding has become costlier for bankssince the GFC relative to reference rates. In spread terms, actual funding costs werealmost 200 basis points higher than their pre-GFC level in December 2018, while theyhave been relatively flat over recent history. In absolute level, actual funding costs were216 basis points lower than their pre-GFC level in December 2018. While our averagefunding cost proxy is slightly over 100 basis points higher than our estimates of actualfunding costs, it follows a similar profile over time and is within a plausible range ofactual bank funding costs.
15We have excluded the foreign funding component for one of the banks owing to anomalies in thedata.
16Part of the variation in the spread between the absolute level of funding costs and JIBAR will reflecttime variation in term and credit risk premia. Soobyah and Steenkamp (2020, forthcoming) show, forexample, that the term premium embedded in South African government bonds has risen substantiallyover recent years.
21

Figure 20: Bank funding cost spreadsAverage funding costs
-300
-250
-200
-150
-100
-50
0
0
2
4
6
8
10
12
14
2008 2010 2012 2014 2016 2018
Ba
sis
po
ints
Pe
r c
en
t
3M JIBAR Repo rate WACF
Marginal funding costs
-250
-200
-150
-100
-50
0
50
100
150
0
2
4
6
8
10
12
14
2008 2010 2012 2014 2016 2018
Ba
sis
po
ints
Pe
r c
en
t
3M JIBAR Repo rate WAMCF (rhs-scale)
Actual funding costs
-600
-500
-400
-300
-200
-100
0
2
4
6
8
10
12
14
2008 2010 2012 2014 2016 2018
Ba
sis
po
ints
Pe
r c
en
t
3M JIBAR Repo rate ACF (rhs-scale)
Note: Funding costs expressed as spread to reference rates as discussed in text.
Figure 21: Bank funding costs in levelsAverage funding costs
0
2
4
6
8
10
12
14
2008 2010 2012 2014 2016 2018
Pe
r c
en
t
Repo rate
3M JIBAR
WACF
Marginal funding costs
0
2
4
6
8
10
12
14
2008 2010 2012 2014 2016 2018
Pe
r c
en
t
Repo rate
3M JIBAR
WAMCF
Actual funding costs
0
2
4
6
8
10
12
14
2008 2010 2012 2014 2016 2018
Pe
r c
en
t
Repo rate
3M JIBAR
ACF
22

6 Conclusion
This paper gives an overview of recent developments in the composition and cost ofbank funding in South Africa. Unlike many advanced economy banking systems, thecomposition of bank funding has not changed considerably since the GFC. This is be-cause South African banks had funded a large share of their liabilities from relativelystable sources pre-GFC, and did not have to shift their funding base in response tochanges in global bank capital standards. Instead, developments in bank funding costshave been driven by changes in the cost of different forms of funding, with retail andwholesale deposits increasing the most since the GFC. Another factor that differentiatesSouth Africa’s banking system is that a large proportion of bank funding comes fromrelatively stable sources such as domestic deposits. This implies that the South Africanbanking sector is relatively sheltered from international funding conditions and volatil-ity in the rand, although this also implies that funding sources are also less diversifiedthan in overseas banking systems.
We construct indicators for monitoring funding conditions in the South African mar-ket. Our initial estimates suggest that aggregate bank funding costs have increased sig-nificantly since the GFC. Unfortunately, a lack of data prevents assessment of the extentto which this has reflected a correction from unusual levels or the impact that changesin prudential policy have had on bank funding costs. A one-off survey of the six largestbanks suggests that while our average funding cost proxy is higher than estimates of ac-tual funding costs, our proxy follows a similar profile over time and is within a plausiblerange of actual bank funding costs. Since our actual funding cost measure is based ona survey of large banks and smaller banks are likely to face higher funding costs, thismeasure likely represents a lower bound of actual funding costs for the industry as awhole.
Future papers will refine the methodologies used to construct our funding cost prox-ies and address a range of pertinent policy questions. Changes to banking liquiditystandards, for example, have affected the effective costs of lending for South Africanbanks by requiring banks to hold larger liquidity buffers. Papers in this series willdevelop more comprehensive funding cost measures, including ones that capture theimpact of prudential regulations on the asset side of banks’ balance sheets. This wouldallow the relationship between the policy rate, funding costs and bank lending rates tobe modelled to assess how prudential regulations such as LCR and NSFR have affectedfunding costs and the transmission of monetary policy. Future work could also considerthe implications of funding spreads for monetary policy.
23

References
Basel Committee on Banking Supervision (2014). Consultative Document Basel III:The Net Stable Funding Ratio. Technical report, Bank for International Settlements.
Black, S. and D. Titkov (2019, March). Developments in Banks’ Funding Costs andLending Rates. RBA Bulletin.
Chiu, C.-W. J. and J. Hill (2018, March). The Rate Elasticity of Retail Deposits in theUnited Kingdom: A Macroeconomic Investigation. International Journal of CentralBanking 14(2), 113–158.
Cook, B. and D. Steenkamp (2018, March). Funding cost pass-through to mortgagerates. Reserve Bank of New Zealand Analytical Notes series AN2018/02, ReserveBank of New Zealand.
European Central Bank (2016, April). Recent developments in the composition and costof bank funding in the euro area. ECB Economic Bulletin 1.
Illes, A., M. Lombardi, and P. Mizen (2015, February). Why did bank lending ratesdiverge from policy rates after the financial crisis? BIS Working Papers 486, Bankfor International Settlements.
Naidoo, E., M. Nkuna, and D. Steenkamp (2020 forthcoming). Developments in debtissuance costs for South African banks. SARB Working Paper.
Olds, T. and D. Steenkamp (2020 forthcoming). Estimates of bank-level funding costsin South Africa. SARB Working Paper.
Soobyah, L. and D. Steenkamp (2020 forthcoming). Term premium and rate expectationestimates from the South African yield curve. SARB Working Paper.
South African Reserve Bank (2018, August). Consultation paper on selected interestrate benchmarks in South Africa. Technical report.
24
Appendices
Figure 22: Liquidity standard measures for the banking sector
LCR
20
40
60
80
100
120
140
2013 2014 2015 2016 2017 2018
Pe
r c
en
t
NSFR
95
100
105
110
115
2016 2017 2018P
er
ce
nt
Note: The LCR is calculated as the ratio of high quality liquid assets (e.g. short-term government bonds) and net cash outflowsover a 30-day period for the total banking sector. The NSFR is based on values for the 5 largest banks, weighted using theirshares in combined liabilities, based on each bank’s total available stable funding divided by total required stable funding. Thecommitted liquidity facility is currently included in the calculation of NSFR. South Africa’s NSFR deviates from the Basel IIINSFR composition, incorporating a non-zero available stable funding factor to wholesale deposits. This means that the NSFR ishigher than if South Africa did not deviate from the Basel available stable funding factor calculation.
Figure 23: Household deposit rates
0
2
4
6
8
10
12
14
2006 2008 2010 2012 2014 2016 2018
Per
ce
nt
Cheque deposits Call deposits
Notice deposits (1-32days) Notice deposits (>32-91days)
Notice deposits (>91-185days) Fixed deposits (0-1yr)
Fixed deposits (>1&<3yrs) Fixed deposits (3yrs&> and <5yrs)
Source: BA930
25

Table 1: Data Definitions
Deposits Definition
Wholesale deposits All deposits (e.g. call, cheque, notice and fixed deposits) belongingto financial companies, non-financial companies, public corporations and the government.
Household sectorAll deposits (e.g. call, cheque, notice and fixed deposits) fromhouseholds, unincorporated business enterprises of householdsand non-profit organisations serving households.
Foreign deposits
All deposits belonging to South African banks,the government, financial and non-financial companies, and householdsdenominated in foreign currency. For reporting purposes, the BA900 reportsthese transactions in rand terms.
Interbank deposits Refers to funds held by one bank on behalf ofanother bank.
Wholesale funding
Other borrowed funds Consists of loans received under repurchasetransactions and loans secured by collateral.
Foreign currency funding Syndicated loans and collateralised borrowing inforeign currency.
Other liabilities to the public
Mostly comprises of debt securities issued bythe bank (i.e. commercial paper, medium term notes, bonds and floating ratenotes.) to obtain capital or funding. Other liabilities of public is alsomade up of transactions relating tocredit in transit, including amounts held against certified or initialledcheques, outstanding travellers cheques issued, outstanding drafts issued, stoporders or other or other credits in transit in respect of mail or telegraphictransfers.
Other liabilities Refers to liabilities in respect of derivativeinstruments, reported at market value.
Other types of funding
Equity Any amount obtained in respect of equityinstruments (shares) issues by the bank, reserves and retained earnings.
SecuritisationThe aggregate amount relating to investment bybanks in instruments issued in respect of a securitisation scheme, such asinvestments in asset-backed securities or mortgage backed securities.
26