south asia region - the world bank asia region a world bank document prem workingpaper series the...
TRANSCRIPT

SOUTH ASIA REGION
A WORLD BANK DOCUMENT
PREM WORKING PAPER SERIES
The findings, interpretations, and conclusions expressed in this paper are entirely those of the author(s) and should not be attributed in any manner to the
Structure and Performance of the Afghan Economy
Stephane GuimbertMay 2004Report No. SASPR-1
World Bank, to its affiliated organizations, or to members of its Board of Executive Directors or the countries they represent.
30861
Pub
lic D
iscl
osur
e A
utho
rized
Pub
lic D
iscl
osur
e A
utho
rized
Pub
lic D
iscl
osur
e A
utho
rized
Pub
lic D
iscl
osur
e A
utho
rized
Pub
lic D
iscl
osur
e A
utho
rized
Pub
lic D
iscl
osur
e A
utho
rized
Pub
lic D
iscl
osur
e A
utho
rized
Pub
lic D
iscl
osur
e A
utho
rized
STRUCTURE AND PERFORMANCE OF THE AFGHAN ECONOMY
By
STEPHANE GUIMBERT *
* Stéphane Guimbert is Economist in the South Asia Region of the World Bank and works on Afghanistan. The paper represents the view of the author and should not be attributed to the World Bank, its Executive Directors, or its affiliated organizations.


About the SASPR Working Paper
The purpose of the SASPR Working Paper Series is to provide a quick outlet for sharing more broadly research/analysis of issues related to development in South Asia. Although the primary source of such research/analysis in SASPR staff, other contributors are most welcome to use this outlet for rapid publication of their research that is relevant to South Asia’s development. The papers are informal in nature and basically represent views/analysis of the concerned author(s). All papers submitted for publication are sent for an outside review to assure quality. I provide only a very light editorial touch. For enquiries about submission of papers for publication in the series or for copies of published papers, please contact Naomi Dass (telephone number 202-458-0335).
Sadiq Ahmed Sector Director South Asia Poverty Reduction and Economic Management World Bank, Washington D.C.


SUMMARY
Most of the Afghan economy’s output comes from agriculture. A major part of this production is wheat, and more generally cereals, produced for domestic consumption. Some diversification has been achieved with the production of other crops and vegetables, including raisins, almonds and dried fruits, that generate income from exports. Industry is still largely at its infant stage, based on resilient small-scale handicraft activities, notably rug weaving, and modest exploitation of mineral resources. Services are largely underdeveloped, a main example coming from the financial sector where most of the services are provided by informal dealers, the hawalas. Another significant part of the informal economy comes from smuggling goods into neighboring countries. But its main component is the drug economy, from poppy culture to opium and heroin trafficking. This background paper collects available data to flesh out this description. While these data are incomplete, cross-country regressions suggests that countries similar to Afghanistan and with should institutions and policies grow on average at a rate around 9% per annum. Such a growth rate is certainly critical to bring the country out of a drug economy trap, generating alternative sources of income for farmers to abandon their poppy production and additional revenues for the Government to implement social policies and maintain law and order. It will also be critical if Afghanistan is to significantly reduce the incidence of poverty. Additional analysis provides an illustration of what such a scenario could imply in terms of investment, in physical and human capital, and in terms of economic activity by sector.
The first three sections of this paper have been posted on www.af/recosting as an annex to the Securing Afghanistan’ Future study presented in the Berlin Conference in March 2004. I thank William Byrd for his support and guidance in drafting this paper. I also thank Edgardo Favaro for helpful comments. The analysis in this paper does not necessarily reflect the position of the World Bank or its affiliated institutions.


TABLE OF CONTENTS
Chapter 1: Introduction ...............................................................................................1
Chapter 2: Overview of the Afghan economy..............................................................2 Output .............................................................................................................................................................. 2 Prices................................................................................................................................................................. 4 Poverty.............................................................................................................................................................. 5 Growth pattern ............................................................................................................................................... 7 Issues................................................................................................................................................................. 8
Informal economy............................................................................................................................................ 8 Population...................................................................................................................................................... 9
Chapter 3: Trade, Investment and Consumption .......................................................9 Household consumption ............................................................................................................................. 10 Foreign Trade ................................................................................................................................................ 10 Government Expenditures.......................................................................................................................... 12 Private Investment........................................................................................................................................ 14
Chapter 4: The Afghan economy by sector ............................................................... 15 Agriculture ..................................................................................................................................................... 15
Agricultural production since 1960............................................................................................................... 16 Main constraints on production and prospects ................................................................................................ 17
Industry .......................................................................................................................................................... 19 Manufacturing Industry ................................................................................................................................ 20 Mining ......................................................................................................................................................... 21 Oil, gas and power........................................................................................................................................ 21 Construction ................................................................................................................................................. 22 Main constraints on industrial production and prospects ................................................................................ 23
Services ........................................................................................................................................................... 23
Chapter 5: Growth Prospects.....................................................................................24 Estimate of growth potential based on cross-country regressions ....................................................... 24 Impact of growth on poverty...................................................................................................................... 26 Sectoral analysis............................................................................................................................................. 27 Implications for human and physical capital............................................................................................ 29
Annexes ..................................................................................................................35 Data from Angus Maddison ....................................................................................................................... 33 Governance.................................................................................................................................................... 33 Cross-country regression analysis............................................................................................................... 34 Growth accounting analysis ........................................................................................................................ 35
References ..................................................................................................................39

LIST OF TABLES
Table 1: Gross Domestic Product .................................................................................................................... 2 Table 2: Prices and exchange rates (average annual growth rates)............................................................... 5 Table 3: Poverty indicators................................................................................................................................. 6 Table 4: Growth 1960-2002 ............................................................................................................................... 7 Table 5: Poppy culture in Afghanistan............................................................................................................. 8 Table 6: Structure of GDP................................................................................................................................ 9 Table 7: Foreign trade by trading partner and commodity ......................................................................... 12 Table 8: Fiscal Framework ............................................................................................................................... 13 Table 9: GDP per sector................................................................................................................................... 15 Table 10: Agriculture Production (estimates)................................................................................................ 16 Table 11: Cereal production in Afghanistan and Neighboring Countries................................................ 18 Table 12: Cash Crop (income per hectare in US $)...................................................................................... 19 Table 13: Industry.............................................................................................................................................. 20 Table 14: Growth in Manufacturing – 1978-1988........................................................................................ 20 Table 15: Annual Production in the Mining Sector (US $ million) ......................................................... 21 Table 16: Energy resources .............................................................................................................................. 22 Table 17: Services............................................................................................................................................... 23 Table 18: Growth over 1960-2001 (1960 GDP per capita in 1960 US $ and annual average growth, 2002 US $) 25 Table 19: Growth estimates and prospects based on cross-country regression...................................... 26 Table 20: Growth potential by sector............................................................................................................. 28 Table 21: Growth accounting 1960-2000 (annual average growth rates) ................................................. 30 Table 22: Output per worker in 2002............................................................................................................. 30
LIST OF CHARTS
Chart 1: Afghan GDP......................................................................................................................................... 3 Chart 2: Prices and exchange rates.................................................................................................................... 4 Chart 3: Prices and wages – 1996-2003............................................................................................................ 5 Chart 4: Income Poverty and Income per capita............................................................................................ 6 Chart 5: Household final expenditures and value added in agriculture (billions of 1975 Af)..................... 10 Chart 6: Foreign Trade...................................................................................................................................... 11 Chart 7: Government revenues and expenditures – 1960-2001 (logarithmic scale)..................................... 13 Chart 8: Agriculture – Cereal production and employment ....................................................................... 17 Chart 9: Agriculture – Number of living animals ......................................................................................... 19 Chart 10: Mining and Energy Production (Index 100 = 1985) .................................................................. 22 Chart 11: Growth in selected countries – 1962-2001 .................................................................................. 25 Chart 12: Income distribution, Poverty, and Growth.................................................................................. 27

1
Introduction Growth will be a critical element of any strategy to secure peace and improve human development in Afghanistan. Afghanistan’s economic performance prior to the late 1960s was not very promising,1and since the late 1970s the country has suffered internal coups, external invasion, and persistent civil conflicts, resulting in virtually no growth in the aggregate economy in the 1980s and 1990s. This meant declining per-capita gross domestic product (GDP). Today, almost two years after the end of the conflict, Afghanistan remains one of the poorest countries in the world, with an economy largely dependent on agriculture, an almost non-existent industrial sector with the exception of handicrafts, and very limited services (at least in the official economy). Despite a strong economic recovery in 2002, growth remains uncertain because of the persistence of security, political, and drug-related risks. High growth will be essential if Afghanistan is to reduce poverty and address its other problems over the coming decade are longer. What are Afghanistan’s prospects for economic growth under these conditions? The purpose of this paper is to summarize available data on the structure and the performance of the Afghan economy and to discuss some preliminary analysis on the Afghan economy’s outlook. None of this work can be based on satisfactory statistics. The often quoted study from Louis Dupree in 1980 said that statistics in Afghanistan are “wild guesses based on inadequate data”. Nevertheless, it is hoped that the information and analysis presented in this paper will contribute toward a clearer quantitative picture of the Afghan economy. By design, this paper largely ignores the institutional and political aspects of growth, which have been recently viewed as critical determinants of growth in general, and which are likely to be even more critical in the Afghanistan context. The main conclusions of the paper are as follows. Afghanistan has been primarily an agricultural economy; hence its evolution can be largely described by the trends in its agricultural output. Before the Soviet invasion in 1979, growth only accelerated around the mid-1970s, with Afghanistan reaching cereal food self-sufficiency in good years. For many reasons (including decrease in labor, destruction of irrigation infrastructure, disruption in transport and trade), the protracted conflict in the 1980s and 1990s led to a significant decrease in output. Only massive provision of foreign aid from and export of natural gas to the Soviet Union maintained some growth. Compared to other countries, poverty incidence is very high, with probably at least 15 million people living on less than $2 a day – in Purchasing Power Parity (PPP) terms (a conventional definition of poverty) and with very poor outcomes in health and education. Although this should be put in perspective – many countries with characteristics similar to Afghanistan had very limited growth over the same period – Afghanistan starts the new century with a very low level of output, adding to its political difficulties the consequences of low education, low infrastructure, a large drug economy, and a non-existent industry. Yet, economic growth has been significant over the last two years, driven by large increases in agricultural output, but also a surge in services. Turning to the future, the main source of growth in the near term is probably still in agriculture. While it is difficult to assess with precision the contribution of industry and services, a cross-country analysis suggests that countries similar to Afghanistan and with sound policies and institutions have been growing at around 7% per annum and per capita. Besides, experiences in post-conflict economies suggest that, a couple of years after the end of the conflict, growth could be even higher for several years, reflecting a catch-up period after a delay due to peace settlement, initial lack of capital (human and physical), and initial low government capacity. The paper starts with a brief overview of the Afghan economy, describing available data. The next two sections focus on two different approaches to GDP in order to assess growth so far and to discuss the potential for future growth: the first method is based on supply and use, while the second
1 In the late 1960s, two development economists designed a procedure to evaluate “economic development potential” and ranked Afghanistan in the “low prospect group” (Adelman and Morris, 1968).

2
is based on production in three sectors (agriculture, industry, and services). The last section analyzes the Afghan economy’s growth potential and its implications in terms of poverty reduction.
Overview of the Afghan economy
Output The Afghan Central Statistics Office recently released an estimate of 2002 GDP (see IMF, 2003).2With a GDP slightly above $4 billion (Table 1), income per capita would only have recovered its 1975 level in nominal terms, that is about $186 per capita, one of the lowest in the world.
Table 1: Gross Domestic Product
1975 2002 1975 2002Agriculture 1,196 2,105 51 52 Industry 373 976 16 24 Services 798 967 34 24 Total 2,367 4,048 100 100
Household Consumption 2,038 4,360 22 60 Public Consumption 136 349 1 5
Final Consumption 2,173 4,709 24 65 Gross Capital Formation 231 654 3 9
Exports 300 2,290 3 32 Imports 338 3,605 4 50
Net Trade (38) (1,315) (0) (18)Total 2,367 4,048 100 100
Population (m) 14.0 21.8 GDP per capita 169 186
(% of total)Level GDP Structure
(current US $ million)
Note: Agriculture includes fishing, hunting, and forestry; industry includes mining, manufacturing, electricity, gas and water, and construction. See below a discussion on the sectoral breakdown. Source: 1975 from WDI (2003) and 2002 from CSO/IMF, 2003.
This was the first official estimate of GDP for years, and it is based on very limited information. The estimate is largely built on the expenditure side, while the sectoral break-down is mostly based on shares observed in the early 1990s. Estimates of public consumption and official trade have a stronger basis, while estimations for private consumption, investment, and unofficial trade are more uncertain. For instance, private consumption is based on an estimate of the number of households and a survey of a few households. Regarding historical data, three national accounts series are available (Chart 1). In its internal database (GDF/WDI), the World Bank has time series from 1960 to 1981, in current Afghanis, in constant Afghanis (base year is 1975), and in current US dollars. These series are backed up by a breakdown by sector and an expense breakdown. In the United Nations database, there is a time series from 1973 to 1990 in constant Afghanis only (with 1978 as the base year). This series is only backed up by a breakdown by sector. Maddison (2001) has also compiled estimates for 1950-1998 in constant international dollars (see Annex). As illustrated in Chart 1, the three time series do not fully
2 The year 2002 refers to the solar year 2002/03.

3
reconcile (1978 point in current Afghanis is 3% higher for the GDF/WDI estimate than the UN estimate).3
Chart 1: Afghan GDP
-
500
1,000
1,500
2,000
2,500
3,000
3,500
4,000
4,500
1960 1965 1970 1975 1980 1985 1990 1995 2000WB - current USD WB - constant 1975 USDUN - constant 1978 USD ADB - current USDMaddisson - rebased to 1975 USD
US $ million
Sources: World Bank data from GDF/WDI database. United Nations data from the UN National Accounts. 1960 is the 1960/61 fiscal year, starting in March 1960. ADB data from ADB (2003). Maddison (2001).
Regarding data quality after 1979, two issues can be raised. First, technically, it seems that it would have been difficult for the Government to produce statistics covering areas that were not under its control. However, to the extent that these data are supposed to describe the official economy (including the resources available to the Government), this might not be an issue. Second, and more important, there are debates about the independence of the statistical office and the politicization of statistics (see Nyrop, 1986). Comparing these data with the agriculture data shown on Chart 8 raises doubts as to whether there was significant growth in the early 1980s (the only explanation could be the contribution of natural gas production), but one would not necessarily doubt that the level of GDP shown at the end of the 1980s was reasonably accurate: in other words, the inverted V-shape of GDP growth statistics might mask a steady path of output decrease. As in other countries in the region and other post-conflict countries, it is likely that income per capita is higher than gross product per capita due to a positive net inflow of remittances. Most of this income is transferred through the hawala system, the informal money dealers, with no monitoring system (see Maimbo, 2003). Transfers on the order of $1 billion have been mentioned, but this amount is in gross terms. The IMF estimate of the balance of payments indicates only $206 million in net current transfers in the private sector (IMF, 2003). Based on these estimates ($0.2 to 1.0 billion in total), income per capita could be $10-50 higher than the GDP per capita.
3 The difference between these two series mainly reflects the absence of indirect taxes and subsidies in the UN series (GDP is measured at factor cost). It probably also reflects a couple of corrections that Bank staff did (as related in the 1978 report): while, as written in this report, the authorities agreed with these recommendations in principle, it seems that they have not put them in practice. These recommendations included: different production coefficients for handicrafts, a different valuation for transport, and a different estimate for depreciation.
4
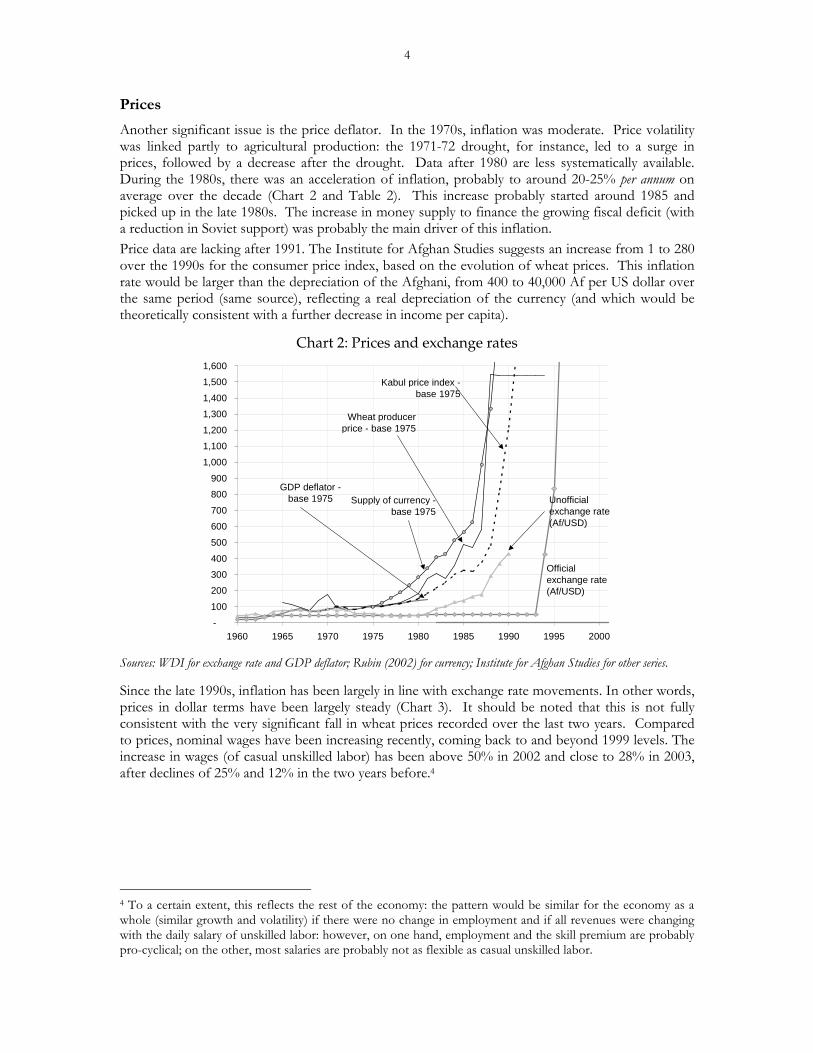
Prices Another significant issue is the price deflator. In the 1970s, inflation was moderate. Price volatility was linked partly to agricultural production: the 1971-72 drought, for instance, led to a surge in prices, followed by a decrease after the drought. Data after 1980 are less systematically available. During the 1980s, there was an acceleration of inflation, probably to around 20-25% per annum on average over the decade (Chart 2 and Table 2). This increase probably started around 1985 and picked up in the late 1980s. The increase in money supply to finance the growing fiscal deficit (with a reduction in Soviet support) was probably the main driver of this inflation. Price data are lacking after 1991. The Institute for Afghan Studies suggests an increase from 1 to 280 over the 1990s for the consumer price index, based on the evolution of wheat prices. This inflation rate would be larger than the depreciation of the Afghani, from 400 to 40,000 Af per US dollar over the same period (same source), reflecting a real depreciation of the currency (and which would be theoretically consistent with a further decrease in income per capita).
Chart 2: Prices and exchange rates
-
100
200
300
400
500
600
700
800
900
1,000
1,100
1,200
1,300
1,400
1,500
1,600
1960 1965 1970 1975 1980 1985 1990 1995 2000
GDP deflator - base 1975
Official exchange rate (Af/USD)
Wheat producer price - base 1975
Unofficial exchange rate (Af/USD)
Supply of currency - base 1975
Kabul price index - base 1975
Sources: WDI for exchange rate and GDP deflator; Rubin (2002) for currency; Institute for Afghan Studies for other series.
Since the late 1990s, inflation has been largely in line with exchange rate movements. In other words, prices in dollar terms have been largely steady (Chart 3). It should be noted that this is not fully consistent with the very significant fall in wheat prices recorded over the last two years. Compared to prices, nominal wages have been increasing recently, coming back to and beyond 1999 levels. The increase in wages (of casual unskilled labor) has been above 50% in 2002 and close to 28% in 2003, after declines of 25% and 12% in the two years before.4
4 To a certain extent, this reflects the rest of the economy: the pattern would be similar for the economy as a whole (similar growth and volatility) if there were no change in employment and if all revenues were changing with the daily salary of unskilled labor: however, on one hand, employment and the skill premium are probably pro-cyclical; on the other, most salaries are probably not as flexible as casual unskilled labor.

5
Table 2: Prices and exchange rates (average annual growth rates) 1970-80 1980-90 1990-2000
Exchange rate (Af per US $)Official (0.2) 1.4 50.4 Official plus black market premium (6.2) 25.1 60.3
Supply of currency at year end 23.1 25.4 n/a
Price indexGDP deflator 4.8 n/a n/aKabul CPI 6.0 23.4 n/aWheat price 0.6 23.6 n/aUS CPI 7.0 4.3 2.2
Sources: GDP deflator and official exchange rate: WDI; unofficial market rate from GDN growth database; Wheat producer price in local currency: FAO (data after 1990 do not look reliable); Kabul Consumer Price Index: ILO (in 1990 base); supply of currency at year’s end: Rubin (2002).
Chart 3: Prices and wages – 1996-2003
-
0.5
1.0
1.5
2.0
2.5
3.0
Jan-
96
Jul-9
6
Jan-
97
Jul-9
7
Jan-
98
Jul-9
8
Jan-
99
Jul-9
9
Jan-
00
Jul-0
0
Jan-
01
Jul-0
1
Jan-
02
Jul-0
2
Jan-
03
Jul-0
3
US
$
0
50
100
150
200
250
300
350
400
100
=D
ecem
ber
2002
(CP
I)
Retail prices (US $ per kg):
Wheat Bread
Daily wage of unskilled casual labour(US $ per day)
CPI (in US $)
Note: WFP measures prices of several items (and daily wages) every week in 5 cities. The data on the chart are the monthly average of the 5 cities. Sources: World Food Program (and Maletta, 2002) and CSO for the CPI.
With the great volatility in prices since the 1980s, it is difficult to do a proper international comparison. In fact, the International Comparison Program never surveyed Afghanistan. The appropriate methodology would require a short time series of national accounts. However, since about two thirds of the variance of the PPP exchange rate can be explained by income per capita, the Afghan PPP exchange rate is probably around 5, that is a GNI per capita of about $200 in 2002 would be equivalent to a PPP value around $1,000: in other words, it would be close to the income per capita in a number of African countries.5
Poverty In the absence of a recent census or household surveys, it is difficult to assess poverty in Afghanistan. However, a number of indicators are available, through measures from UNICEF,
5 This equation is: PPP exchange rate = 10.1 – 0.922 x ln(GNI per capita), R2 = 65%. The Cepii estimates the exchange rate at 5.12 PPP dollars per US dollar in 1995. Maddison (2001)’s estimate for 1990 is close to 4.

6
FAO, or UNESCO (see Table 3). Based on an international comparison based on PPP income per capita (see Chart 4), 65-75% of the population would live on less than $2 per day.6 An assumption on the current income distribution would lead to a similar estimate (see below). Depending on the population data used (including or excluding refugees living abroad), this would represent 14 to 21 million people living with less than $2 a day. Both for methodological reasons and due to the informal economy which provides additional revenues, this estimate must be considered very crude.
Chart 4: Income Poverty and Income per capita
NGAMLI
ZMB INDBFANER PAKCAFMDG GMBNPL
GHAMOZ BGDETH
LAO
MRTSENLSOIDNCMR ZWE
KENTZA
NAM
EGY CHNECUMNGCIV PRY
VENLKAYEM HND SLVTKM
PERTTOMDA MEX
COLBOL ARM GTM
UKRPAN THAROM BRAUZB CRIJAM RUS
BGR
TURDOMKAZDZA
TUNAZE CHLLVA LTUMAR JOREST
POLHRVBLRGEO-
10
20
30
40
50
60
70
80
90
100
- 1,000 2,000 3,000 4,000 5,000 6,000 7,000 8,000 9,000
GNI per capita PPP $
%p
op
ula
tio
nb
elo
w$2
day
Latest estimate of population below $2 day. GNI per capita in current international PPP $ for 2001. Source: WDI (2003).
Data are summarized in Table 3. On the income side, on the education side, and on the health side of poverty, the situation in Afghanistan is very bad, compared to its neighbors and compared to the average of all developing countries – in many cases, the relevant comparator would be Sub-Saharan Africa.
Table 3: Poverty indicators
MDG Indicator Afghanistan Five Neighbors
Sub-Saharan Africa
Developing countries
GNI per capita in 2001 – PPP $ a����� 3,118 1,952 4,4021 Population below $2 day (%) a�� 52 73 421 Children under 5 moder./severely underweight (%) 48 23 26 182 Net primary enrollment 29 90 58 803 Ratio of girls to boys in prim. and sec. education (%) 43 88 82 914 Under five mortality rate (per 1,000 births) 257 50 155 745 Maternal mortality rate (per 100,000 live births) 1,600 115 1,100 4696 Incidence of tuberculosis (per 100,000 people) 321 105 341 192Simple averages over all available data. Source: All data from WDI (2003), except population below $2 day in Afghanistan (see above).
6 The equation is: Pov = 254 – 26 x log(income), R2=63%. Including a Gini coefficient measuring income distribution improves the fit of the regression (R2=67%): assuming that the coefficient for Afghanistan is equal to the average in developing countries (0.42), the poverty incidence rate is estimated at 73 to 78% (with GNI per capita estimate varying from $800 to $1,000). With a Gini at 0.28 (as observed in the NWFP of Pakistan), this range would be 64% to 69%.

7
Growth pattern One can identify five episodes of growth in Afghanistan since the 1960s. The country started at a level of per-capita GDP similar to that of other developing countries in the 1960s, but with GDP growth of only 2% in real terms, income per capita was not growing. Data from Maddison (2001, see Annex 1) suggests that, using “international dollars”, GDP per capita in Afghanistan was indeed similar to GDP per capita in other Asian countries and in Africa in the 1960s. On this base, growth of GDP per capita over 1960-1970 was actually negative (-0.4%), after a decade of positive growth (+1.4%) in the 1950s. During a second period, the first part of the 1970s, despite a drought, growth accelerated, leading to some increase in income per capita.7 Nonetheless, the income per capita gap with other developing countries widened during this period.
Table 4: Growth 1960-2002 1960-1970 1970-1978 1978-1990 1990s 2002
AfghanistanGDP - current AF billion 48.3 101.2 n/a 180 GDP - constant 1975 AF billion 83.2 102.7 138.4 n/aAnnual growth 2.0 3.6 (1.8) 28.6 GDP - US $ million 1,277 2,794 n/a 3,043 4,048 Population (million) 11.2 14.6 16.2 19.3 23.5 GDP per capita ($) 114 191 n/a 158 172
GDP per capita ($) - Cross-country comparisonSouth Asia 100 152 288 366 448 Africa 147 300 522 544 470 Developing Countries 125 290 620 1,038 1,170
Annual growth (%) - Comparison across sourcesWorld Bank - 1975 Af 2.0 3.6 n/a n/aUN - 1978 Af n/a 3.8 (1.8) n/aMaddison - 1990 Int. $ 2.0 2.5 (1.6) 4.6
Sources: World Bank data from GDF/WDI database for population, GDP per capita in other countries, and Afghan GDP for the first 2 columns. United Nations data from the UN National Accounts for the next column of Afghan GDP. CSO (IMF & ADB 2003) for the last two columns. Maddison (2001, see Annex).
Growth then fluctuated in the early 1980s, and became severely negative in the late 1980s, most likely leading to an even worse picture in terms of international comparison. The apparent change around 1986 might not have actually happened (see below), with reality probably being closer to a more steady decrease from 1979 to 1990. While the economic data should be interpreted with even more caution since 1979, this decrease largely reflects the disruption caused by the political situation – shortage in labor (especially skilled labor) due to departure of refugees and enrollment into armies / factions, disruption in transport, production and infrastructure (e.g., irrigation), etc. The fourth period, in the 1990s, is the least documented. This period could be decomposed into two sub-periods. From 1992 to 1995, the civil war led to a further fragmentation of the country; however, it seems that the economy grew in several parts of the country (Rubin, 2002, mentions Mazar-e-Sharif and Kandahar, where local authorities were strong enough to maintain some stability and local trade, including with Central Asia and Iran, which stimulated economic activity). The lowest point in Maddison (2001) is 1994, with GDP per capita at 2/3 of its 1990 level in real terms. Based on these data, Afghanistan was the poorest country in the world in the middle of the 1990s, 8% below Chad and at a level of per-capita GDP that was only 8% of the world average. From 1995 to 2001, the Taliban regime maintained a higher degree of control, but with protracted fighting and with very restrictive policies (from social sectors to international relations).
7 This acceleration is reflected in the difference between the last two economic reports prepared by the World Bank in Afghanistan, in which the tone dramatically changed towards optimism at the end of the 70s.

8
Since 2001, the new Government has been trying to reconstruct the country with the support of the donor community. Better economic management and strong donor support combined with the end of a four-year-long drought generated significant economic growth in 2002 (+28.6% in real terms, after a further 9% contraction in 2001). At an estimated level of $186 GDP per capita in 2002, Afghanistan would have an income similar to Malawi, Niger or Tajiskistan, and only above Ethiopia, Burundi, Congo DR, Eritrea, Sierra Leone, Liberia, and Guinea-Bissau.
Issues Two specific issues – the size of the informal economy and the size of the population including returning refugees – have an impact on any analysis of growth prospects, and on cross-country comparisons.
Informal economy The current GDP estimate has been prepared by estimating expenses: in particular household consumption, the main component, must include some element of the non official economy. Yet it is not clear that this estimate includes a comprehensive estimate of the informal economy. Using Bhatia and Goodhand (2003) definitions, three components of the informal economy can be analyzed. The war economy mainly includes opium and poppy culture, which has been growing since the 1980s and is now prevalent in the South (Helmand), East (Nangarhar), and Northeast (Badakshan). While less than 3% of the area under cereal production is used for poppy (but a larger share of the irrigated area), the gross income generated at the farm level was more than US$ 1 billion in 2002 and, despite the January 2002 ban, stayed at this level in 2003. Net income for the farmers is certainly smaller, but the Afghan economy also benefits from the trade chain of opium (including the preparation of heroin, which increasingly occurs in country). In total, it is estimated that in 2002 the drug economy generated as much as $2.5 billion (IMF, 2003). In 2003, some growth in volume was offset by lower prices, but the drug economy still represents some 40% of the official economy. There are estimates that up to 20% of the population is dependent on poppy culture (3 to 4 million, see Goodhand, 2003). In 2003, UNODC estimated the number of families growing poppies at 264,000, which would be equivalent to about 7% of the population directly linked to poppy culture.
Table 5: Poppy culture in Afghanistan 1994 1995 1996 1997 1998 1999 2000 2001 2002 2003
Production tons 3,416 2,335 2,248 2,804 2,693 4,565 3,276 185 3,422 3,600 Market share % 61 52 52 58 62 79 70 11 74 Area with poppy tons 71,470 53,759 56,824 58,416 63,674 90,583 82,171 7,606 74,045 80,000 Share of world surface % 26 22 22 23 27 42 37 5 40 Surface / area under cereal prod. % 2.7 2.0 2.2 2.1 2.3 3.6 3.2 0.4 3.3 Gross income per ha (farmers) US $ 1,456 1,016 1,356 1,619 1,649 2,012 1,107 7,363 16,100 12,700
Source: UNODC (2003).
Less is known about gems. Trading of gems is known to have provided substantial resources to the mujahidin in the 1980s. Recent estimates place the annual production value at around $3 million, the value added being considerably less than the drug economy (World Bank, 2003b). Obviously, the war economy also included large amounts of military expenditures, some funded by the drug economy, but also, especially in the 1980s, some funded by external sources. The black economy, in addition to several similar components, includes cross-border smuggling, which was estimated at one billion dollars in 2001, that is about ¼ of GDP. However, since it is mainly re-export, the impact on GDP (value added of this activity) is much smaller than that of the

9
drug economy.8 The black economy also includes the hawala system, which provides most if not all banking services in Afghanistan. Last, the informal economy is likely to include some subsistence agriculture that is not recorded by the FAO statistics. In addition, a widespread strategy is labor migration, and, correspondingly, remittances. The latter are difficult to measure since most of these funds are sent through hawalas (see above), but remittances could amount to as much as US $ 1 billion per year.
Population To calculate income per capita, it is important to be consistent in the numerator and the denominator. Since it is difficult to calculate foreign income, it is easier to compute GDP divided by population in the country (which is significantly lower than total population). The official estimate of the total population living in Afghanistan has recently been set at 21.8 million for 2002 (see IMF, 2003).9 Aside from the direct effect on the denominator of per-capita GDP, the impact of the return of refugees on GDP per capita should be positive: while direct income generation in Afghanistan from these returnees would offset lower remittances they were sending when abroad, it is expected that their return will also have a positive multiplier effect on the domestic economy. Population projections indicate a 1.9% annual natural growth in population over the next 20 years, with population reaching 30 million around 2015. Labor force growth would be slightly higher since the population growth is driven by an increase in life expectancy offset by a reduction in the birth rate.
Trade, Investment and Consumption In this section, the structure of the Afghan economy is looked at from the expenditure side. GDP can be defined as the sum of private consumption and investment, public consumption and investment, and net foreign trade. Household consumption is clearly the most significant part of the equation. Public expenditures (final consumption, but also capital formation, which probably constitutes a large part of the total capital formation) were quite dynamic in the 1970s. Afghanistan had an increasing trade deficit. The recent estimate by the IMF takes a more comprehensive view of trade (including smuggling), which increases its weight in the economy.
Table 6: Structure of GDP
1960 1970 1978 2002 1960-1970 1970-1978Household Consumption 89.2 83.9 107.7 - 2.8 Public Consumption 4.1 6.1 8.6 - 8.7
Final Consumption 90.9 93.3 89.9 116.3 2.2 3.1 Gross Capital Formation 9.7 8.1 13.9 16.2 0.1 10.7
Exports 2.6 5.2 16.0 56.6 9.1 19.2 Imports 3.3 6.6 19.8 89.1 9.3 18.7
Net Trade (0.7) (1.4) (3.8) (32.5) 10.0 17.1 Discrepancy 0.0 0.0 0.0 - - - Total GDP 100.0 100.0 100.0 100.0 2.0 3.6
Annual growthValue added
Sources: World Bank data from GDF/WDI database (underlying data in 1975 constant Afghanis). CSO/IMF (IMF, 2003) for 2002.�
8 Yet, the impact on the Government’s revenues is significant. Indeed, this is not transit trade – which would be tax free. Goods are imported through Pakistan and taxed at the border. They are then smuggled back to Pakistan in violation with the trade agreement between Afghanistan and Pakistan. 9 The last census, in 1979, was not completed. In 1999/2000, the UN supported a large survey of population.
10
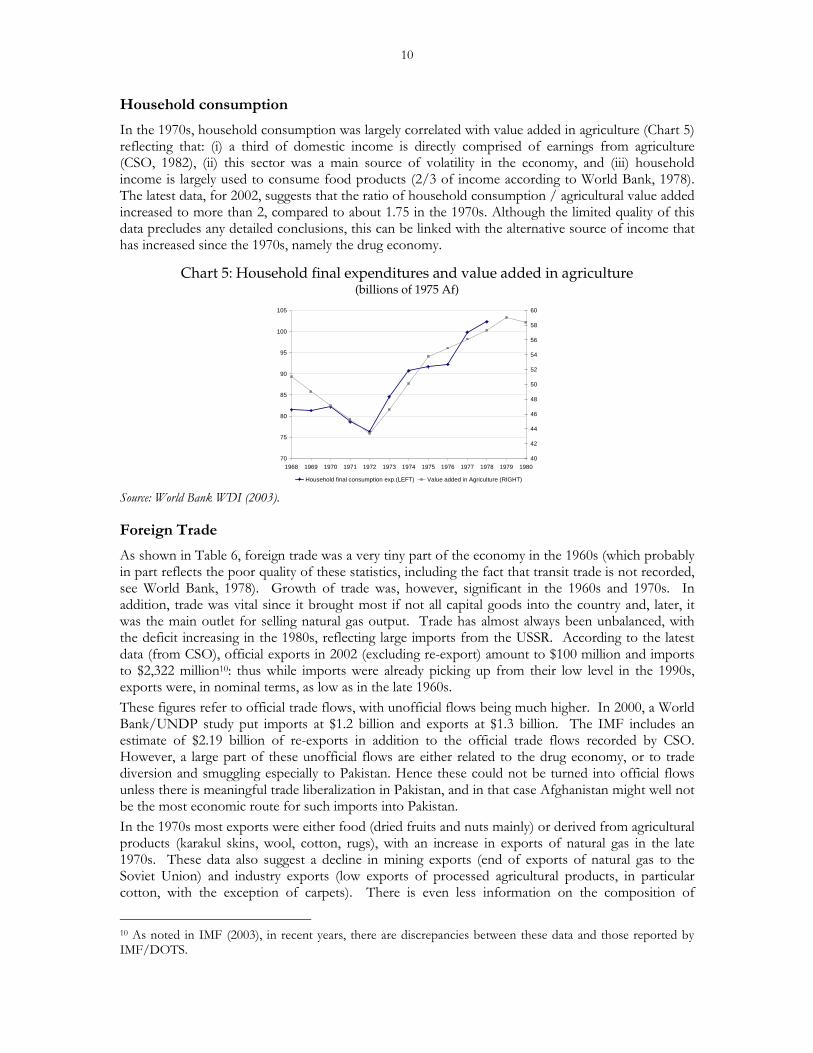
Household consumption In the 1970s, household consumption was largely correlated with value added in agriculture (Chart 5) reflecting that: (i) a third of domestic income is directly comprised of earnings from agriculture (CSO, 1982), (ii) this sector was a main source of volatility in the economy, and (iii) household income is largely used to consume food products (2/3 of income according to World Bank, 1978). The latest data, for 2002, suggests that the ratio of household consumption / agricultural value added increased to more than 2, compared to about 1.75 in the 1970s. Although the limited quality of this data precludes any detailed conclusions, this can be linked with the alternative source of income that has increased since the 1970s, namely the drug economy.
Chart 5: Household final expenditures and value added in agriculture (billions of 1975 Af)
70
75
80
85
90
95
100
105
1968 1969 1970 1971 1972 1973 1974 1975 1976 1977 1978 1979 198040
42
44
46
48
50
52
54
56
58
60
Household final consumption exp.(LEFT) Value added in Agriculture (RIGHT) Source: World Bank WDI (2003).
Foreign Trade As shown in Table 6, foreign trade was a very tiny part of the economy in the 1960s (which probably in part reflects the poor quality of these statistics, including the fact that transit trade is not recorded, see World Bank, 1978). Growth of trade was, however, significant in the 1960s and 1970s. In addition, trade was vital since it brought most if not all capital goods into the country and, later, it was the main outlet for selling natural gas output. Trade has almost always been unbalanced, with the deficit increasing in the 1980s, reflecting large imports from the USSR. According to the latest data (from CSO), official exports in 2002 (excluding re-export) amount to $100 million and imports to $2,322 million10: thus while imports were already picking up from their low level in the 1990s, exports were, in nominal terms, as low as in the late 1960s. These figures refer to official trade flows, with unofficial flows being much higher. In 2000, a World Bank/UNDP study put imports at $1.2 billion and exports at $1.3 billion. The IMF includes an estimate of $2.19 billion of re-exports in addition to the official trade flows recorded by CSO. However, a large part of these unofficial flows are either related to the drug economy, or to trade diversion and smuggling especially to Pakistan. Hence these could not be turned into official flows unless there is meaningful trade liberalization in Pakistan, and in that case Afghanistan might well not be the most economic route for such imports into Pakistan. In the 1970s most exports were either food (dried fruits and nuts mainly) or derived from agricultural products (karakul skins, wool, cotton, rugs), with an increase in exports of natural gas in the late 1970s. These data also suggest a decline in mining exports (end of exports of natural gas to the Soviet Union) and industry exports (low exports of processed agricultural products, in particular cotton, with the exception of carpets). There is even less information on the composition of
10 As noted in IMF (2003), in recent years, there are discrepancies between these data and those reported by IMF/DOTS.

11
imports: Afghanistan imports some food (wheat, sugar, tea, salt), mineral fuel, primary goods (e.g., metal) and manufactured goods (including machinery and transport equipment). But, the low level of imports also suggests that capital investment has been very limited since the early 1980s.
Chart 6: Foreign Trade
-
500
1,000
1,500
2,000
2,500
1960 1965 1970 1975 1980 1985 1990 1995 2000
Val
ue
of
trad
e(U
SD
mill
ion
)
0
25
50
75
100
125
150
Ter
ms
of
trad
ean
du
nit
valu
e(1
00=
1990
)
Imports Exports Unit value indices of exports Terms of trade Note: UNCTAD labeled these series “tentative” unit values. Source: IMF/DOTS for values (except 2002: CSO), UNCTAD for unit values and terms of trade.

12
Table 7: Foreign trade by trading partner and commodity 1960 1970 1978 1990 2002
Exports (USD million) 49.9 84.6 269.2 131.1 100.0 % to USSR / Russia 28 39 44 7 4
% to Industrialized countries 46 28 24 67 23 % to India 14 16 14 10 27 % to Iran - 1 - - n/a
% to Pakistan 9 7 15 4 26 % to other 3 9 3 12 20
Composition of exports (%)Natural gas - 17 14 - n/a
Cotton 10 10 14 1 n/aWool 14 8 2 4 1
Carpets 14 8 11 19 47 Fruits and nuts 26 34 39 40 46
Karakul skins 28 12 5 1 1 Other 9 10 14 35 5
Imports (USD million) 80.9 109.5 450.5 479.3 2,322.0 % from USSR / Russia 51 35 53 1 n/a
% from Industrialized countries 31 37 35 43 50 % from India 10 12 8 13 2 % from Iran - 3 - - n/a
% from Pakistan 3 3 4 0 9 % from other 6 11 0 41 40
Composition of imports (%)Machinery and equipment - - - - 37
Petroleum, oil, etc. - - - - 1 Primary goods - - - - 10
Food - - - - 9 Household consumption goods - - - - 44
Balance (USD million) (31.0) (24.9) (181.4) (348.2) (2,222.0)
Note: USSR includes USSR, East Germany and Czechoslovakia until 1990, only Russia in 2002. Industrialized countries include Japan the European Union, the United States, and Canada. Source: IMF/DOTS totals and for partners and IMF/IFS for composition of exports (totals differ for 1990); CSO for 2002 (IMF, 2003).
Trade potential is difficult to estimate. It is likely that a regularization of the trade agreement with Pakistan will reduce trade diversion generated by the current agreement and therefore reduce smuggling. This reduction could be offset by an increase in transit trade with the recent signing of a “good neighboring agreement” (Afghanistan has borders totaling 5,592 km with six countries). Regarding imports, acceleration in the reconstruction program should bring additional inflows of capital equipment. In addition, at least temporary imports of petroleum and electricity will be necessary. Food imports will in part depend on the performance of agriculture. Regarding exports, a sectoral analysis in Section 3 suggests that potential avenues for export growth come from the diversification in agriculture, and maybe a few industrial products. Even if situated far from developed markets, experiences in other landlocked countries indicate a trade potential through specialization in labor-intensive manufacturing productions or through the benefit of international production sharing (Ng and Yeats, 2003), but it is too early to draw such conclusions in the case of Afghanistan.
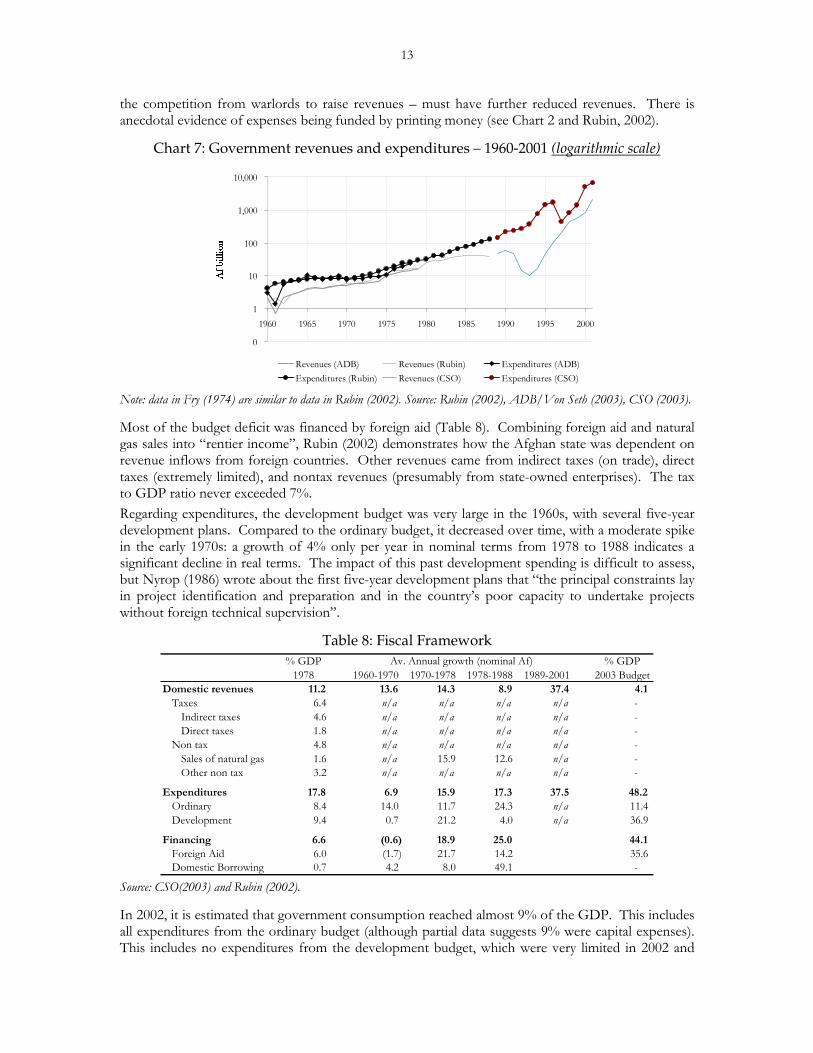
Government Expenditures Despite the long period of conflict, the Government of Afghanistan largely retained the capacity to measure its own revenues and expenditures. There are differences in the numbers available (Chart 7), but they probably reflect different concepts (e.g. budget versus execution). The trends are straightforward. The fiscal deficit has always been significant, and further ballooned in the 1980s while inflation and the “National Reconciliation” program boosted expenses and natural gas sales were decreasing. The absence of an effective government from the late 1980s to the late 1990s – and
13
the competition from warlords to raise revenues – must have further reduced revenues. There is anecdotal evidence of expenses being funded by printing money (see Chart 2 and Rubin, 2002).
Chart 7: Government revenues and expenditures – 1960-2001 (logarithmic scale)
0
1
10
100
1,000
10,000
1960 1965 1970 1975 1980 1985 1990 1995 2000
$I�ELOOLRQ
Revenues (ADB) Revenues (Rubin) Expenditures (ADB)Expenditures (Rubin) Revenues (CSO) Expenditures (CSO)
Note: data in Fry (1974) are similar to data in Rubin (2002). Source: Rubin (2002), ADB/Von Seth (2003), CSO (2003).
Most of the budget deficit was financed by foreign aid (Table 8). Combining foreign aid and natural gas sales into “rentier income”, Rubin (2002) demonstrates how the Afghan state was dependent on revenue inflows from foreign countries. Other revenues came from indirect taxes (on trade), direct taxes (extremely limited), and nontax revenues (presumably from state-owned enterprises). The tax to GDP ratio never exceeded 7%. Regarding expenditures, the development budget was very large in the 1960s, with several five-year development plans. Compared to the ordinary budget, it decreased over time, with a moderate spike in the early 1970s: a growth of 4% only per year in nominal terms from 1978 to 1988 indicates a significant decline in real terms. The impact of this past development spending is difficult to assess, but Nyrop (1986) wrote about the first five-year development plans that “the principal constraints lay in project identification and preparation and in the country’s poor capacity to undertake projects without foreign technical supervision”.
Table 8: Fiscal Framework % GDP % GDP
1978 1960-1970 1970-1978 1978-1988 1989-2001 2003 BudgetDomestic revenues 11.2 13.6 14.3 8.9 37.4 4.1
Taxes 6.4 n/a n/a n/a n/a - Indirect taxes 4.6 n/a n/a n/a n/a - Direct taxes 1.8 n/a n/a n/a n/a -
Non tax 4.8 n/a n/a n/a n/a - Sales of natural gas 1.6 n/a 15.9 12.6 n/a - Other non tax 3.2 n/a n/a n/a n/a -
Expenditures 17.8 6.9 15.9 17.3 37.5 48.2 Ordinary 8.4 14.0 11.7 24.3 n/a 11.4 Development 9.4 0.7 21.2 4.0 n/a 36.9
Financing 6.6 (0.6) 18.9 25.0 44.1 Foreign Aid 6.0 (1.7) 21.7 14.2 35.6 Domestic Borrowing 0.7 4.2 8.0 49.1 -
Av. Annual growth (nominal Af)
Source: CSO(2003) and Rubin (2002).
In 2002, it is estimated that government consumption reached almost 9% of the GDP. This includes all expenditures from the ordinary budget (although partial data suggests 9% were capital expenses). This includes no expenditures from the development budget, which were very limited in 2002 and

14
were mainly executed by donors directly. Public investment has probably been low since the mid-1980s, as suggested by the analysis of public expenditures. But the large development budget presented by the Interim Government of Afghanistan for 2003-2005, on the other hand, suggests prospects for significant increases in public investment over the next few years.
Private Investment Little is known about private investment. In 2002, total investment was very tentatively estimated at 16% of GDP (including public investment). This level seems quite high, even though it probably includes initial public investments in reconstruction, potential small-scale private investments in agriculture and maybe industry, as well as some inventory investment by traders. There may have been a rebound in the latter two categories following years of uncertainties. Obviously, the potential for growth should be high if the investment climate, starting with security, improves in Afghanistan. The Afghan Investment Support Agency, in the Ministry of Commerce, recorded a value of $4.2 billion of investment projects in 1382. While this gives an interesting sectoral indication (with the agri-livestock industry being the overwhelming part of this amount), this data is difficult to use, because it represents approvals rather than actual investments.

15
The Afghan economy by sector In this section, data available for each sector of the economy are scrutinized to better understand the GDP trends and assess constraints on growth. Table 9 shows the structure of the economy in terms of GDP for the years for which data are available.11 It shows that agriculture is still the dominant sector of the economy. Its share decreased during the 1980s, as confirmed by data on the labor force (source ILO), indicating a decrease in population active in agriculture from 80% in 1960, to 76%, 73%, and 70% in the next decades, offset by an increase mainly in services, but also in industry.
Table 9: GDP per sector
1965 1978 1978 1990 1991 2001 2002Agriculture 60.0 47.0 57.1 51.9 49.7 53.2 52.0 Industry 10.0 6.8 29.1 33.0 29.8 35.6 24.1 Services 30.0 46.2 13.8 15.1 20.5 11.2 23.9 Total 100.0 100.0 100.0 100.0 100.0 100.0 100.0
WDI UN ADB / CSO
Sources: World Bank data from GDF/WDI database. United Nations data from the UN National Accounts. ADB data from ADB (2003). Agriculture includes fishing, hunting, and forestry; industry includes mining, manufacturing, electricity, gas and water, and construction.
Agriculture With more than 50% of GDP directly linked to agriculture (plus a large part of industry that depends on agricultural inputs), Afghanistan’s economy is still primarily an agricultural economy. Yet, of its 652,000 square kilometers of total land area, only 12% is arable and 4% irrigated.12 A significant part of agricultural production is for own consumption (wheat, milk); the size of this subsistence economy might well be underestimated. In the late 1970s, Afghanistan was approaching self-sufficiency in basic food grains and was a net exporter of agricultural products, with significant exports of raisins and nuts (see World Bank, 1978). Another significant part of agricultural production is used as inputs, either for agriculture (most seeds are self-provided, power is a significant output of livestock), or in the very small Afghan industry (cotton – although this industry has almost collapsed over the last decade or two, cf. data on trade – wool, hides and skins for textile and carpets, cotton-seed for soap industries). Some of these processed products, as well as fruits and nuts, were exported: Afghan dried fruits, mainly apricots and almonds, used to account for a very significant part of the world export market (almost 60% according to FAO, 2002).
11 It is likely that the sector classifications are inconsistent. This might be due to the absence of some services, including housing, in the UN data (see World Bank, 1978, statistical annex), and to the inclusion of indirect taxes net of subsidies in the World Bank data (difference between GDP at factor / market costs). 12 An additional 46% is under permanent pastures and 3% under forest cover. The remaining 39% is mountainous.

16
Table 10: Agriculture Production (estimates) Production
2002 1965-78 1978-90 1990-2002Wheat 38.7 1.6 (4.3) 4.1 Rice, paddy 6.1 0.9 (2.1) 1.3 Maize 5.0 0.6 (4.0) (3.9)
Cereals 49.7 1.3 (4.0) 2.8 Potatoes 2.5 5.0 (0.9) 0.2 Grapes 3.3 3.3 (1.5) (0.8) Vegetables, other 7.3 0.8 (0.4) 3.0
Crops 62.8 1.9 (3.2) 2.1 Cow Milk 29.4 1.3 0.4 6.6 Sheep Milk 4.0 (0.1) (0.1) (2.1)
Livestocks 33.4 2.1 0.1 1.7 Food 96.2 2.0 (1.3) 2.8
Cotton Lint - 4.4 (12.1) 5.9 Wool, Greasy 0.5 0.4 (2.9) (0.3) Linseed 3.4 (0.6) (3.8) 1.2
Non Food 3.8 1.2 (6.3) 2.3 Agriculture 100.0 2.0 (1.6) 2.9
Annual growth
Note: annual growth refers to volumes (measured in metric tons). Sub-totals are based on indexes developed by FAO. To give a sense of values, when prices are available for 1975, metric tons for 2002 weighted by these prices have been added (see first column – but a number of prices are missing and livestock production seems overestimated). Source: FAO.
Agricultural production since 1960 Cereals, and wheat in particular, are the main outputs of agriculture (Table 10). The main food output of livestock is milk. Non-food production, which is an important source of cash, is largely linked to the textile industry. Cotton production in particular has been controversial, since during the 1980s the Kabul Government was pushing farmers to grow cotton to sell to government factories, while resistance commanders were pushing them to grow subsistence food (and even forbad the culture of cotton, Rubin, 2002). The shift from cash to subsistence crops was also driven by the overall decrease in agricultural output (see below). Output in fishery and forestry is very limited.13 As Chart 8 highlights for cereals, a significant part of output volatility has been related to weather and climate, such as droughts in 1971-72, 1977, 1982-83, and in the late 1990s-early 2000s. In addition, changes in production factors such as employment and land have been important, and the conflict in the 1980s had a strong negative impact.14 In addition to a decrease in labor, the area under cereal production was damaged by the “scorched earth” strategy of the Soviet occupying forces. Subsequently, as noted in Rubin (2002), the use of Stinger missiles by resistance forces starting in 1986-87 eased a little bit the condition of agricultural production, and the fall in agricultural output stopped around 1987 (based on FAO indexes). The more or less aborted land reform also affected incentives. The conflict destroyed irrigation structures and other infrastructure. It also largely affected transport, both of inputs (such as fertilizers) and outputs. As a result, the area under cultivation and output both declined over the 1980s.
13 As noted by the UN Environment Program, however, there is a large illegal trade of timber across the Afghan-Pakistan border. 14 It should be noted that there is disagreement on data during the 80s, with the Government claiming strong production, while many observers describing a very murky trend (see Nyrop, 1986).

17
Chart 8: Agriculture – Cereal production and employment
2.0
2.5
3.0
3.5
4.0
4.5
5.0
5.5
6.0
6.5
1960 1965 1970 1975 1980 1985 1990 1995 2000
Employment (million)
Cereal production
(million tons)
Area under cereal prod. (million ha)
Source: FAO.
After a spike in the mid-1990s, these two indicators again fell to historically low levels at the end of the 1990s, the result of a protracted drought. The most recent data indicate that, with precipitation back to normal levels, agricultural output sharply rose in 2002 (+75%) and 2003 (+50%). Nevertheless, these figures imply almost no annual growth from 1968 to 2002, while population is estimated to have increased 140%, leaving Afghanistan probably far from food self-sufficiency.15 In 2003, preliminary estimates suggest that Afghanistan would be, in aggregate, self-sufficient for wheat. It should be stressed however that diversification to high value labor-intensive cash crops is a better target for Afghanistan than food self-sufficiency if the country is to develop and eradicate poppy culture.
Main constraints on production and prospects Turning to the outlook, four main constraints on agricultural production are generally identified (these are not new, see World Bank, 1978, and Nyrop, 1986, nor unusual in developing countries). A primary constraint is water. Afghanistan is an arid and mountainous country, which makes it highly dependent on snow precipitation and on irrigation. Official statistics record 2.4 million hectares of irrigated land, less than a third of crop land, but this total is difficult to estimate due to the extensive use of traditional systems (the underground tunnels called karez work on a small scale, and many have likely been destroyed or fallen into disuse during the period of conflict16), while recorded large systems (such as the Helmand Valley) may have aged17. FAO estimates that only 44% of all irrigation systems are currently productive (FAO, 2002). Knowing that the irrigated sector traditionally
15 FAO measures the prevalence of undernourishment: it was 37% in 1981, 63% in 1992, 70% in 2000. While the causes of undernourishment are numerous (high prices, lack of transport), these data are in line with the small increase in production (or the decrease on a per capita basis). 16 According to surveys done by the Swedish Committee on Afghanistan, more than a quarter of the farmers in Afghanistan reported the destruction of irrigation systems in 1985 (Rubin, 2002, p.227). 17 Infrastructure in the Helmand Valley probably still works since it produced in 2000 39% of the world’s heroin (UNDCP cited by Goodhand, 2003). However, it is not functioning at anywhere near full capacity and is in need of rehabilitation.

18
provided 85% of all crops, this is clearly a serious barrier to production. This first constraint is also responsible for the large volatility of production and the vulnerability of agriculture to droughts. The second constraint is the limited use of modern techniques, i.e. the so-called Green Revolution. Moving in that direction will require access to training (e.g. crop rotation, seed selection), to credit (to buy tractors), and to markets (e.g. to buy fertilizers). The other two constraints, land tenure arrangements (and high insecurity in land rights) and access to markets (few rural roads), also impede growth by reducing incentives to improve productivity and to diversify production from subsistence to cash crops. Focusing on cereal production, Table 11 underlines some of these points. In 2002, with employment in agriculture similar to Iran, Afghanistan produced five times less than its neighbor; with agricultural land area more than 50% higher than that of Pakistan, Afghanistan produced seven times less in the same year. This gap in productivity is related to a less intensive use of irrigation18, fertilizer, and machinery. Table 11 shows that the “Green Revolution” had a smaller impact on Afghanistan, with 2001 yield lower than in the 1960s, and the 2002 yield only 40-50% above the level in the 1960s, and still lower than its neighbors (except Uzbekistan in 2002). The increase in production in 2003 (+50%) results from a higher cultivated area (+27%) and from an increase in yield to 1.9 metric ton per hectares (+18%). The remaining potential for cereal production is unclear: gaps in yields with neighboring countries seem to have been largely closed by 200319, and 2003 wheat production might be sustainable, given that it was associated with excellent weather and utilization of marginal lands on hillsides which may result in environmental deterioration.
Table 11: Cereal production in Afghanistan and Neighboring Countries Afghanistan Iran Pakistan Uzbekistan Turkmenistan Tajikistan
1960s 3.8 4.2 13.6 n/a n/a n/a2001 6.1 6.5 25.0 3.0 0.7 0.8 1960s 38 59 24 n/a n/a n/a2000 38 60 27 28 32 4 1960s 3.7 5.5 8.6 n/a n/a n/a2001 2.0 11.9 27.8 3.5 1.3 0.3 1960s 3.3 6.2 8.8 n/a n/a n/a2001 2.6 7.0 12.7 1.6 0.8 0.4
GDP per capita, PPP (current international $) 2000 ~1,000 6,000 1,890 2,460 4,320 1,170
1960s 1,130 873 966 n/a n/a n/a2001 978 1,536 2,287 2,920 1,578 858 1960s 9 34 77 n/a n/a n/a2000 6 921 1,392 1,625 647 123 1960s 0.000 0.003 0.001 n/a n/a n/a1999 0.000 0.036 0.013 0.057 0.074 0.037 1960s 29 32 64 n/a n/a n/a2000 30 46 82 88 106 84
Employment in agriculture (million)
Agricultural land (million ha)
Agricultural machinery per 1,000 agricultural workers Land use, irrigated land (% of cropland)
Cereal prod. (million tons)
Cereal yield (kg per hectare)
Fertilizer consumption (100 grams per ha of arable land)
Land under cereal production (million ha)
Sources: WDI/FAO.
In addition to any potential to increase yields in cereals, there is clearly a potential to generate additional income through diversification. As an illustration, Table 12 lists yields for a number of cash crops that have been tested by UNODC in Helmand Province in 2000. This reveals significant potential revenue gains, which is consistent with the fact that poppy culture is known to be quite intensive in Afghanistan in contrast with most other producers. This highlights that labor and know-
18 It can be noted that a significant part of the water used in Pakistan comes from Afghan mountains. 19 They decreased to only 5% with Iran and 10% with Pakistan in 2003. However, it might be inappropriate to compare 2003 yields in Afghanistan with 2002 yields in other countries: comparing 2002, gaps were about 25% with Iran, 30% with Pakistan. Similar gaps were and are still found when comparing labor productivity in agriculture.

19
how are available and can be productive with an effective combination with capital (e.g., irrigation and fertilizers), if incentives (and access to markets) are in place.20
Table 12: Cash Crop (income per hectare in US $)
Crop Location Year Income before intervention
Income after intervention
Winter crop Wheat Helmand 2000 432 840 Black cumin Helmand 2000 3,185 4,778 White cumin Helmand 2000 700 1,300 Onion Helmand 2000 2,220 3,552
Summer crop Maize Helmand 2000 276 621 Bean Helmand 2000 400 666
Orchards Grape Helmand 2000 3,000 6,000 Pomegranate Helmand 2000 1,845 4,428 Apple Helmand 2000 3,330 4,625 Almond Helmand 2000 9,053 14,814 Apricot Helmand 2000 2,632 4,277
Poppy culture Poppy Helmand 2000 790 Poppy Afghanistan 2000 1,107 Poppy Afghanistan 2003 12,700
Source: UNODC (2002 and 2003).
In addition, there is good potential for growth in livestock. A specific constraint in this case is the major reduction in the stock of living animals as a result of the 1999-2001 drought and more generally due to conflict (Chart 9). Based on historical experience, farmers may need another three years to rebuild their stock of living animals. Then, production of milk and meat, as well as non-food outputs, could grow by about 40-50%.
Chart 9: Agriculture – Number of living animals
10,00012,500
15,00017,50020,000
22,50025,00027,500
30,00032,500
1960 1965 1970 1975 1980 1985 1990 1995 2000
�����OLYH�DQLPDOV
0
50
100
150
200
250
300
350
,QGH[������ ����
# of live animals
Index of non-food agri. output
Index of livestock output
FAO notes that there has been no census for years and a comprehensive census in under way. Source: FAO.
Industry Based on CSO data, this sector of the Afghan economy consists of ¾ for manufacturing, power, oil, and mining, and ¼ for construction.
20 It also highlights the difficulty to provide alternative crops as lucrative as poppy.

20
Table 13: Industry
1965 1978 1978 1990 1991 2001 2002Industry 10.0 6.8 29.1 33.0 29.8 35.6 24.1
Manufacturing 8.2 2.2 n/a n/a 20.3 19.7 17.8 Handicrafts n/a 6.3 n/a n/a n/a n/a n/aPower, mining, oil n/a 0.8 23.1 26.5 n/a n/a n/aConstruction 1.7 2.5 6.0 6.5 3.2 6.3 6.3
Total 100.0 100.0 100.0 100.0 100.0 100.0 100.0
WDI UN ADB / CSO
Source: See Table 9.
Manufacturing Industry In the 1970s, Afghanistan’s industry was still at an infant stage, contributing 10-13% of GDP. A significant part of industry was in the public sector (either through direct nationalization, or through the nationalization of banks in 1975-76). These industries were mainly processing primary goods (cotton textile industry, urea fertilizer, cement and other construction materials, food processing). Nonagricultural private enterprises were small-scale in nature (largely family based), in particular the handicrafts industry (according to official statistics, it contributed to 9% of the GDP and employed 300,000 persons in 1981, see Nyrop, 1986). Based on employment data from UNIDO, in 1988 textiles represented a third of industry, while food products and the chemical industry each represented 15-20% of employment in industry. While growth was significant in the 1960s-1970s (almost 5% per year from 1965 to 1978), the adverse effects of the war have been dramatic. First, agricultural production declined, and the non-subsistence part declined even more severely (see above), which correspondingly reduced the output of industries dependent on agriculture. Second, deteriorating infrastructure – transport, power – further reduced industrial production. Lastly, the labor supply decreased. The UN statistics recorded a 0.7% annual decline in GDP in industry between 1978 and 1990 in real terms. The UNIDO statistics recorded a 6% increase in manufacturing output over the same period (in nominal US dollars, see Table 7), with most growth strangely in an “other” category.
Table 14: Growth in Manufacturing – 1978-1988 Annual Employment
1978 1988 Growth 1988Food and beverages 61.9 87.7 3.6% 5,950Textiles 132.6 109.0 -1.9% 12,948Chemicals 32.6 42.2 2.6% 5,610Other 24.5 195.6 23.1% 12,722Total 251.7 434.6 5.6% 37,230
Value (US $m)
Source: UNIDO.�By all indications, industry further declined during the 1990s. State-owned enterprises (see ASI, 2003) have been mainly under the supervision of the Ministry of Heavy Industry and the Ministry of Light and Food Industries. According to UNIDO (2003), the latter controls 27 state-owned firms. Of these, UNIDO reviewed the textile factories: 10 of the 34 factories in existence twenty years ago are still existing, but they are aged and suffer substantial damages. Another report, by the Adam Smith Institute, records 140 SOEs, of which many are defunct. In other words, the main part of the industrial sector, as of now, is probably small businesses like handicrafts (little is know about this activity during the 1990s, but data on trade suggest that the export of rugs remained rather strong over the 1980s). Investment data recorded by the Ministry of Commerce indicates some increase in investment in 2002, which should translate into higher output over time.

21
Mining Afghanistan has strong potential in the mining industry (although the ground has not been fully surveyed). The limited part of the potential that has been exploited has been mainly in the public sector since the 1977 Constitution stated that “large industries, energy, mines, and banks are national property” (the new draft Constitution only states that underground resources are the property of the State). Afghanistan has a wide variety of non-energy mineral resources, including iron, chrome, copper, silver, gold, barite, sulfur, talc, magnesium, mica, marble, lapis lazuli, as well as (revealed by a 1985 Soviet survey) asbestos, nickel, mercury, lead, zinc, bauxite, lithium, and rubies (Nyrop, 1986). No significant efforts have been made to exploit Afghanistan’s large reserves (among the world’s largest) of iron and copper, since the iron deposits are located in the Hindu Kush mountains at some 4,000 meters altitude. Trade in precious and semi-precious stones was an important industry (80% of the world’s lapis lazuli came from Afghanistan), but has declined since the Soviet invasion (or turned to unofficial trade, in particular in the main site of extraction, the Panjsher Valley in the Hindu Kush). A recent World Bank report estimates that there is indeed a significant potential in the mining sector (see Table 15). Coal is used mainly for generation of power, but the cement industry could also become a significant source of demand. The demand for gravel, construction and industrial materials is also expected to increase very quickly with the reconstruction effort. There are deposits of limestone, marble, gravel and clay currently under exploitation, but with further growth potential. The main additional potential would come from copper, with a very large deposit in the Logar Province (in Aynak). Deposits of iron and gold could also be a source of growth. In addition, it should be noted that exploitation of salt, the large demand for which is currently being met though imports, is also a source of growth.
Table 15: Annual Production in the Mining Sector (US $ million)
Current production Potential production
Potential value increase
Coal 140,000 tons 800,000 tons 30 Quarries 2,840,000 tons 5,160,000 tons 10 Salt imported 54,000 tons 20 Gemstones unofficial N/a 5 Copper metal none 50,000 tons 100 Iron N/a Gold N/a Total 150-200
Source: World Bank (2003b).
Oil, gas and power Reserves in oil and gas represent another significant potential source of growth for the Afghan economy. The main resource, natural gas, began to be exploited in 1967 in the North (Jowzjan Province). Production was mainly exported (consumption only started in 1975, with 2% of the output utilized for thermal power generation). Production mainly increased when foreign demand increased, that is after the Soviet invasion, thus becoming a major source of both export receipts and fiscal revenue (with annual exports worth about $300 million, revenues financed up to 33% of budgetary expenditures in the first half of the 1980s, see Chart 10). This trade was advantageous for the USSR, with the price set below world market levels (according to Nyrop, 1986, the USSR paid for this gas half the price it charged for gas piped to Western Europe), and output probably underestimated (volumes were only measured after the border, in the Soviet Union). After the Soviet Union withdrew from Afghanistan, production felt dramatically, probably due to lack of technical skills and other necessary inputs for maintenance, and due to the absence of demand resulting from the absence of pipeline or other distribution mechanism.

22
Current production is estimated at only 400 barrels per day for oil and 21.2 million cubic feet per day for gas, while potential production could be respectively 25 and 10 times higher. According to EIA (2002), Russia has helped open a training center for natural gas workers in Mazar-i-Sharif, and the use of an existing pipeline to export a small quantity of natural gas into Uzbekistan is being considered. In addition, a small quantity of crude oil is produced in Sar-e-Pol Province (and there is a uranium mine to the north of Kabul, and two others in Herat and Qandahar Provinces). However, since all neighboring countries have their own resources, the potential for development in the sector is mainly for domestic production.
Chart 10: Mining and Energy Production (Index 100 = 1985)
0
25
50
75
100
125
150
1960 1965 1970 1975 1980 1985 1990 1995 2000
Coal Production Electricity Production
Natural gas production Export of natural gas
Source: IMF/IFS for export of natural gas; ADB (2003) for other data.�Beyond the extraction of energy resources, the generation and distribution of power is expected to grow. The historical trend of electricity production reflects the changes in economic activity described above. Electricity production has recently increased, but still falls far short of demand. Unfortunately, imports are still low due to the bad track record of Afghanistan in paying for its purchases. Electricity production in 2002, at 26 kwh per capita, is very low compared to electricity consumption of around 350 kwh per capita in Pakistan and in the 1,000-2,000 range in the other neighboring countries. Demand in the sector will further grow as economic activity recovers, and value added in the power sector will be constrained by the investment program.
Table 16: Energy resources Location Reserves Distribution
Maximum Today
Natural Gas Jowzjan Province Up to 5 trillion cubic feet
100 billion cubic feet per day (late
80s)
8 billion cubic feet per day
70-90% to USSR via Uzbekistan, small local
distribution
Coal North between Herat and Badakshan 73 million tons 1,000,000 short
tons (early 90s) 1,000 short tons Power generation
Oil and Condensates Sar-i-Pol Province 95 million barels None 300 barels/day Internal consumption
Uranium North of Kabul & in the Herat and Qandahar Provinces ? ? 0? All sent to USSR
Production
Source: EIA (2002).
Construction Construction is estimated at around 6% of GDP and is one of the most dynamic components of the economy, reflecting the need to rebuild the country’s infrastructure. CSO estimated that construction increased 150% in 2002, with in particular a very high activity in Kabul: this is highlighted by imports of construction materials (mainly cement, glass, and hard wood) increasing from $4 million in 2001 to an estimated $54 million in 2002.

23
Main constraints on industrial production and prospects Security and political uncertainty is certainly the first constraint currently, threatening any investment, especially visible investments. Beyond this aspect, there are probably two main constraints on industrial output: the lack of capital and credit, and the lack of infrastructure (power and transport mainly). Lack of skilled labor also appears to be a major constraint. Created in 1932, Bank-i-Milli stimulated the growth of Afghan industry in the 1930s. Since then, however, despite attempts by the Government through five-year development plans, through the Foreign and Domestic Private Investment Law in 1967, and through credits distributed by nationalized banks, access to credit and capital has been fairly limited. The situation deteriorated during the two decades of conflict, and as of now, the only well-functioning source of finance is the hawala system (see below), which does not appear to be conducive to financing of major industry. The recent Banking Law and the licenses already given to international banks should start addressing this constraint. Turning to the second constraint, lack of infrastructure, Afghanistan’s power grid has been severely damaged by conflict (currently only 6% of the population has access to electricity), and has been, since 2001, still subject to attacks. The poor condition of roads and associated transport difficulties and high costs also significantly reduce the size of the market available to an entrepreneur. These constraints also apply to the energy sector. However, there are two additional growth potentials for energy production. First, at present value added from power generation is extremely limited. The current generation capacity comes from thermal power and from hydropower (several dams, although the potential is allegedly underexploited), while much supply is imported from Turkmenistan, Uzbekistan, and Iran (to neighboring Provinces). The second source of growth potential would be a possible gas pipeline that would transit through Afghanistan from Central Asia to the Arabian Sea.
Services This last sector is relatively difficult to assess. Based on World Bank data, services accounted for more than a third of 1978 GDP and were quite dynamic compared to the rest of the economy. Trade (wholesale and retail) comprised a third of the services sector. At first glance, more recent data from the United Nations National Accounts suggest a decrease in the value added of the service sector over the 1980s. This could easily be linked to the high level of disruption in the economy, in particular regarding trade. It is likely that not much growth occurred during the 1990s, with ongoing conflict. However, growth is estimated to be have been very strong in 2002, with increases in public administration and trade.
Table 17: Services
1965 1978 1978 1990 1991 2001 2002Services 27.8 37.5 9.5 11.0 20.5 11.2 15.2
Trade, hotel/rest. 8.7 12.4 8.0 9.1 13.6 4.6 4.7 Public admin n/a n/a n/a n/a 5.3 5.1 9.0 Other Services 19.1 25.2 1.5 1.8 1.6 1.5 1.5
Total 100.0 100.0 100.0 100.0 100.0 100.0 100.0
WDI UN ADB / CSO
Source: See Table 9.
Regarding transport, the Communist government in the 1980s did not invest significantly in infrastructure (although the Soviets maintained communications in the North to guarantee their military supplies), but it created a state-owned transportation organization. In the early 1990s, UNDP estimated that 60% of the total of 2,500 km of paved roads were in poor condition (EIU, 2002). Recently, CSO reported a 13% increase in taxicabs in 2001 and 74% in 2002; and a 95% increase in transport of goods by roads in 2001 and 36% in 2002. Progress on road construction, but also progress on security, will certainly generate further growth in the transport sector.

24
Some telecommunication lines have survived conflicts, bombings and sabotages, and wired lines are operated (with also a wireless service): however, there were still only 2 telephones per 1,000 people, compared to 24 in Pakistan, 83 in Turkmenistan, 35 in Tajikistan and 68 in Uzbekistan. In 2002, CSO reported an increase in fixed telephone lines of more than 300%, which still only brought the ratio to 7 fixed lines per 1,000 people. Banking is now mainly the affair of money exchange dealers in bazaars, the hawalas, that belong to the informal economy (see above), while the state-owned banks have been largely moribund (with the exception of the central bank, Da Afghanistan Bank, which provides some commercial bank services). Some banking services (including credit, advance payments) are provided through the drug economy. The new licensed foreign banks are now opening branches in Afghanistan, which should increase output in the sector. In the 1970s, tourism was small but nevertheless brought significant receipts to the country. About 100,000 persons crossed the border each year (at least officially), probably in part for business (a significant proportion coming from Pakistan), but also for tourism, with significant arrivals from Europe (France, Germany, and United Kingdom), United States and Australia. These flows almost completely stopped in the 1980s-1990s. However, with the development of international tourism in the meantime, growth in tourism can be expected in the medium term. As an illustration, if only 500,000 persons were to come to Afghanistan every year (which is less than 0.1% of the world total of 625 million persons crossing borders every year, approximately the share observed in 1970) if they spend $500 on average, this would add $250 million to the country’s income, more than 5% of the current GDP. Turning to the social sectors, the experience in the 1980s and 1990s was certainly that there was a reduction in the production in these sectors – with basic health services in particular provided largely by NGOs. In these sectors, as well as in entertainment, the restrictions imposed by the Taliban further reduced output. While this section does not provide a proper assessment of the services sector, it is sufficient to illustrate the low level of output in services and correspondingly the potential for future development. The potential comes first from a necessary catching-up phase and the imperative to deliver social services; in addition, there is a potential for growth linked to growth in agriculture and industry (with impact on trade and banking), and, from a longer term perspective, growth in tourism.
Growth Prospects Any discussion on Afghanistan’s growth prospects necessarily must be highly speculative. The most common methodology, relying on historical trends, is obviously not recommended in the case of Afghanistan. This section first analyzes growth experience in countries comparable to Afghanistan. The section then tries to assess to what extent the growth rate suggested by international comparison will reduce poverty over the medium term. Then the last two parts of the section speculate about the implications of such a growth rate, in terms of sectoral growth and in terms of capital accumulation.
Estimate of growth potential based on cross-country regressions In current US dollars, the size of the economy in Afghanistan in 1960 and its growth until the mid-1970s were similar to the average of other developing countries. However, economic growth in Afghanistan since 1981 is likely to have been negative.
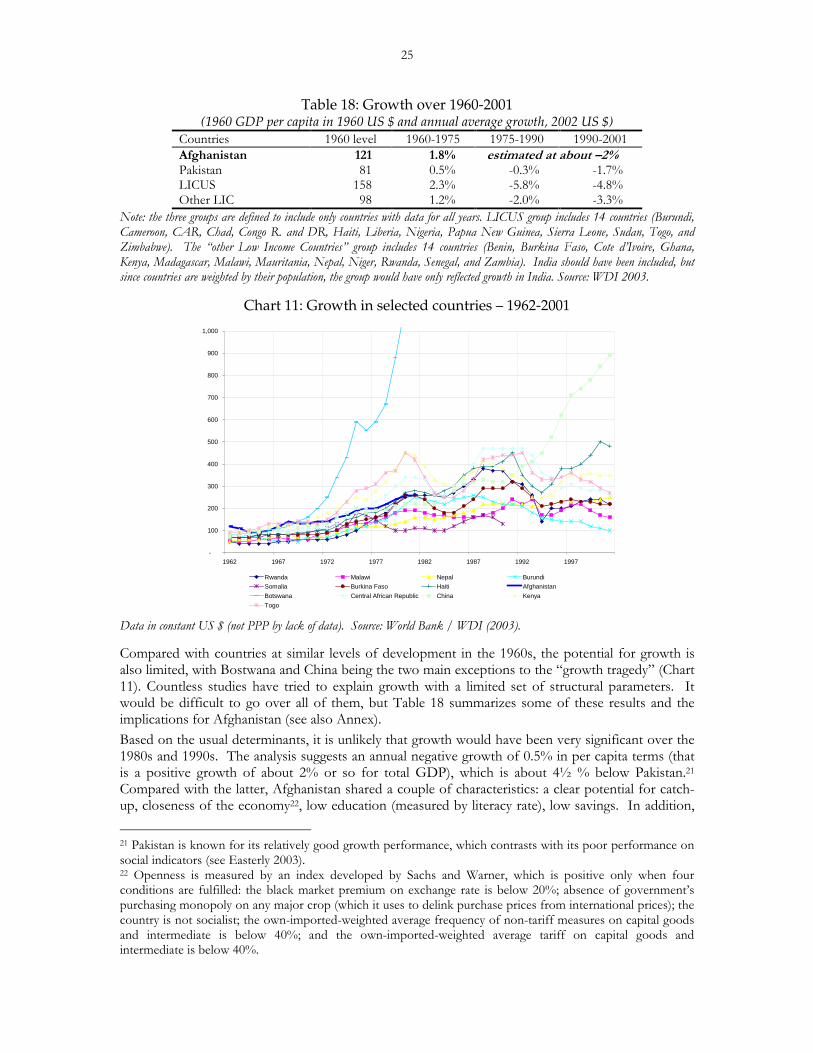
25
Table 18: Growth over 1960-2001 (1960 GDP per capita in 1960 US $ and annual average growth, 2002 US $)
Countries 1960 level 1960-1975 1975-1990 1990-2001 Afghanistan 121 1.8% HVWLPDWHG�DW�DERXW�²���Pakistan 81 0.5% -0.3% -1.7% LICUS 158 2.3% -5.8% -4.8% Other LIC 98 1.2% -2.0% -3.3%
Note: the three groups are defined to include only countries with data for all years. LICUS group includes 14 countries (Burundi, Cameroon, CAR, Chad, Congo R. and DR, Haiti, Liberia, Nigeria, Papua New Guinea, Sierra Leone, Sudan, Togo, and Zimbabwe). The “other Low Income Countries” group includes 14 countries (Benin, Burkina Faso, Cote d’Ivoire, Ghana, Kenya, Madagascar, Malawi, Mauritania, Nepal, Niger, Rwanda, Senegal, and Zambia). India should have been included, but since countries are weighted by their population, the group would have only reflected growth in India. Source: WDI 2003.
Chart 11: Growth in selected countries – 1962-2001
-
100
200
300
400
500
600
700
800
900
1,000
1962 1967 1972 1977 1982 1987 1992 1997
Rwanda Malawi Nepal Burundi
Somalia Burkina Faso Haiti Afghanistan
Botswana Central African Republic China Kenya
Togo Data in constant US $ (not PPP by lack of data). Source: World Bank / WDI (2003).
Compared with countries at similar levels of development in the 1960s, the potential for growth is also limited, with Bostwana and China being the two main exceptions to the “growth tragedy” (Chart 11). Countless studies have tried to explain growth with a limited set of structural parameters. It would be difficult to go over all of them, but Table 18 summarizes some of these results and the implications for Afghanistan (see also Annex). Based on the usual determinants, it is unlikely that growth would have been very significant over the 1980s and 1990s. The analysis suggests an annual negative growth of 0.5% in per capita terms (that is a positive growth of about 2% or so for total GDP), which is about 4½ % below Pakistan.21 Compared with the latter, Afghanistan shared a couple of characteristics: a clear potential for catch-up, closeness of the economy22, low education (measured by literacy rate), low savings. In addition,
21 Pakistan is known for its relatively good growth performance, which contrasts with its poor performance on social indicators (see Easterly 2003). 22 Openness is measured by an index developed by Sachs and Warner, which is positive only when four conditions are fulfilled: the black market premium on exchange rate is below 20%; absence of government’s purchasing monopoly on any major crop (which it uses to delink purchase prices from international prices); the country is not socialist; the own-imported-weighted average frequency of non-tariff measures on capital goods and intermediate is below 40%; and the own-imported-weighted average tariff on capital goods and intermediate is below 40%.

26
the geography of Afghanistan (landlocked) further worsens its prospects. The protracted civil war was a major factor contributing to poor outcomes in Afghanistan. Bad institutions and ethnic fragmentation were also a contributor. Applying the crude methodology above to guesstimate an income per capita of around $525 in PPP terms in 1980, this regression suggests an income per capita around $850 in 2000, which is largely consistent with the actual outcome.23 Turning now to prospects, three factors are worth mentioning. It should be noted that these factors capture a number of conditions, and policy actions, and should not be interpreted literally as the impact of a specific policy: for instance, the “openness” measure captures many issues and this can not be interpreted as “trade liberalization will generate xx points of growth”. Based on this crude analysis, it appears that countries with characteristics similar to Afghanistan have experienced growth at about 9% per annum (about 7% p.a. per capita plus 2% population growth). This is based on: a potential for catching-up, an open economy, good institutions (including security and rule of law), average literacy rates, and strong savings.
Table 19: Growth estimates and prospects based on cross-country regression
Determinant Coefficient T stat 1980- 2000 Prospects
Constant 0.17 7.50 Initial output per capita PPP (0.02) (5.76) 525 1,000 Openness (0.02) (3.09) - 1 Geography 0.16 3.36 L & NT a/ L & NT a/Institutions (0.01) (2.92) (1.26) - Ethnic Fractionalization 0.02 4.53 0.77 0.02 Years of civil war (0.0013) (1.69) 20 - Literacy 0.005 1.28 23 36Dependency on primary exports (0.03) (2.07) 5 5 Savings 0.0004 2.76 11 15 Total calculated growth -0.6% 6.8%a/ Geography: landlocked and non tropical
Regression Afghanistan
Regarding the timing of this growth, Collier and Hoeffler (2002) suggest that post-conflict countries enjoy “supra-normal” growth a few years after the end of the conflict, generally between the fourth and the seventh year This pattern reflects the initial low capacity in the country to grow and implement projects and the time required to stabilize the political situation, and even, sometimes, to completely settle the conflict. After several years, the basis for growth has been built and the country experiences a temporary period of “supra-normal” growth. Controlling for policy, institutions, governance and aid, this study found that growth was 1.1 percentage points higher in post-conflict situations on average during (approximately) the decade following the end of the conflict. This means that, in addition to growth “generated by” or “related to” better policy and institutions and larger aid flows after a conflict, a post-conflict country usually grows faster than average during this period. While it is difficult to be more specific about this effect, the Collier and Hoeffler study suggests that in fact this effect occurs largely between the 4th and the 7th year after the end of the conflict (which would be 2005-2008 in the case of Afghanistan), where growth could be two percentage points above average. This study, however, stresses that such a growth spurt is dependent on the country receiving more aid in this period.
Impact of growth on poverty While poverty is multi-faceted and meeting the Millennium Development Goals (MDGs) requires a comprehensive approach, the economic growth rate mentioned above will be a critical driver of poverty reduction, by directly generating income for poor people, as well as by increasing resources 23 A regression based on current US dollars values (instead of PPP dollars) leads to a similar formula, but to an even lower estimate for 2000 GDP.

27
available to the Government to finance social service delivery. A critical question is how fast growth can reduce poverty incidence. The answer will obviously depend on the source of growth and the development of the poppy economy. Yet, assuming, as a baseline, that the income distribution remains unchanged, it can be shown that there is an arithmetic linkage between growth and poverty (see Bourguignon, 2002). This arithmetic relationship indicates that the poverty-reduction impact of growth is lower in poor and unequal countries. For Afghanistan, it is assumed that:
• income distribution follows a “log-normal” distribution and inequalities are similar to the average across developing countries (Gini coefficient equal to 0.4);
• the poverty line ($2 per day in 1985 PPP terms) is equal to 75% of the mean income (about $1,000 in PPP terms).
Based on these assumptions, currently, about two thirds of the population would be living below the poverty line. The decomposition proposed by Bourguignon (2002) then indicates that the elasticity of poverty to growth would be 1: to halve current poverty incidence, income per capita would need to grow 50%. For instance (as illustrated in Chart 12), increasing the average income per capita from the current $186 to $500 would reduce poverty incidence from 65% to 25%.24 While these numbers are only an illustration, they convey the conclusion that growth could have a strong impact on poverty incidence.
Chart 12: Income distribution, Poverty, and Growth
1 10 100 1,000 10,000
% of poverty line
% p
op
ula
tio
n
$2 a day
Initial distribution Projected distribution
Source: based on Bourguignon (2002).
Sectoral analysis25 Based on the analysis in section 4, there is clear growth potential in the short to medium term in agriculture, both from catching up (e.g., rebuilding the livestock) and from investment (e.g., renovating and expanding the irrigation infrastructure). Obviously this potential will be realized only
24 If initially the distribution is more equal, for instance if the Gini coefficient is equal to 0.28 as in the neighboring North West Frontier Province in Pakistan (see World Bank 2002), current poverty incidence would be somewhat higher (more people have an income close to average, which is below the poverty line), but the elasticity would also be higher (bringing the average beyond the poverty line has a much higher impact on poverty): thus, the same increase in average income would reduce poverty from 71% to 16%. 25 This scenario is outlined in the “Securing Afghanistan’s Future” report.

28
if proper financial, trade, and transport services are available to farmers. Similar arguments can be formulated for other sectors, but due to a lack of data, it is more difficult to quantify these scenarios. Table 22 illustrates an optimistic scenario in line with the good policy/good institution analysis presented above. It is optimistic by assuming that: �� there is a significant infrastructure investment program, funded, properly implemented and
operated, that provides power, transport, irrigation, and other main services; �� key policy decisions have been made, for instance regarding trade, banking, or price control, to
improve the investment climate; �� security and law and order improve quickly and the drug economy is eradicated in the medium
term; and �� private investment is responsive to these favorable conditions.
Table 20: Growth potential by sector Sector Sub-Sector Short-medium term (1-5y) Longer term (~10y) Growth Source Growth Source Agriculture 10-15% 5-6% Cereals 10-20% 3% Marginal technical progress Livestock 10% Rebuilding stock 3% Other 10-15% 8-10% Diversification Industry 10-12% 10-12% Transport 12% Road construction 10% Power 8-10% Catch up to match demand 8-10% General economic growth (demand)
Oil and gas, mining 8-10% 8-10% New exploitation Construction 15-20% Reconstruction activity 8-10% General economic growth Manufacturing 5-10% 8-10% Result of private investment Services 12-15% 9-10% Trade 10-15% Catch up 8-10% General economic growth Public Adm. 15-25% Reconstruction 5-10% Steady state Other 5-10% 10-12% Growth in finance and tourism Total 10-15% 7-9%
Agriculture would grow at almost 10 percent over the next five years, then slowing down to 5 percent. This assumes significant investments in water conservancy, to bring the surface of cultivated land from less than 1.5 million ha to 3 million in twelve years. This scenario also assumes that other constraints on growth are addressed (including access to markets, access to credits, land arrangements, increase in yield through the use of modern techniques). Growth in cereal production, the main component, would reflect: an increase in irrigated areas (yields in irrigated areas are 2 to 3 times higher than in rain-fed areas26); a general augmentation in yield resulting from better techniques (e.g., fertilizer use) and incentives (e.g., access to market through rural roads); and an increase in total area under cereal production (back to levels observed in the 1970s). Growth in other crops (vegetables, grapes, cotton, seeds, etc.) and non-food production will depend on the effectiveness of the diversification strategy (and will also be linked to alternative livelihoods in the drug eradication strategy). The critical assumptions here are also a significant investment in irrigation schemes, investment in orchards, higher yields, and access to markets. Current livestock production is depressed by the low stock of animals. Currently, products of the livestock (meat and milk) are extremely low (around 5-10 percent of the sector), reflecting a low stock of animals after years of conflict and drought. It is assumed that the livestock can recover at a 10 percent annual growth rate (level observed in the 1970s after a severe drought), and then grow at a more modest 3 percent.
26 This is observed in years without drought. The whole projection assumes there is no drought.

29
Industrial growth is assumed to have a slower start than agriculture, but to sustain a 10 percent growth rate over the medium term. This component is highly dependent on private investment and on infrastructure. In the short to medium term, it is also very much dependent on agriculture, with manufacturing activities being largely upstream or downstream agriculture outputs. With the rehabilitation and construction of a road infrastructure network, transport activities could grow by an average of 10 percent. Growth in construction would be fast over the first few years (beyond 15 percent), driven by significant activities of reconstruction, but slow down afterwards. Growth in the mining and energy sector could reach 10-20 percent on average, benefiting from the implementation of various energy generation projects as well as from the rehabilitation and exploitation of the country’s mineral resources and mines. All these investments will help pave the way for a resumption of activity in the manufacturing sector, which is envisaged to grow by about 10 percent on average after a few years. A positive fall out from the expansion of the industrial sector is the growth in the services at more than 10 percent on average. The public administration sector will be strengthened by public investments, and is expected to grow on average by more than 10 percent. The construction of a road network, combined with the emergence of manufacturing, will boost local trade, commerce, and transit activity. Growth would reach an average of 8-9 percent per year. Growth in other services (including financial services) would be in the same order of magnitude. Additional growth is expected in services like finance or tourism in the outer years of the projections, with the broader development of the economy and securing of the country.
Implications for human and physical capital This paragraph tries to draw some implications of the growth scenario for human and physical capital requirements, assuming a production function combining technology with these two capital stocks. This entails a number of assumptions that are detailed in the Annex. First, the growth in output per worker in Afghanistan can be assessed vis-à-vis other countries (Table 21). In the 1960s and 1970s, moderate growth in Afghanistan in real terms was associated with a stagnation of output per worker. While there was some investment, even though at a rate much lower than in most other developing countries, improvements in education were very moderate: average number of years of schooling was low, around 1.2 years, and not increasing (while despite a lower start in 1960, it went beyond two years in Pakistan in 1980). In addition, it seems that the efficiency of the economy was quite low, with total factor productivity decreasing.27 There is very limited data for the period since 1980. The current output per worker is difficult to estimate in real terms. The estimated level (see Annex) suggests negative growth on a per worker basis. Human capital has increased very moderately (still less than 2 years of schooling). Assuming no change in total factor productivity, this would mean that there was a decrease in the stock of physical capital per capita of 4% per year, which is equivalent to a 30% decline in the total stock of capital (this can, for instance, be compared with the stock of living animal, which decreased by 70% over these two decades), Afghanistan remaining a very capital-scarce country.
27 This statistic, however, is calculated as a residual and is dependent on several parameters in the estimation (see annex).

30
Table 21: Growth accounting 1960-2000 (annual average growth rates)
Period OutputOutput per
workerHuman capital
Physical capital
Total Factor Productivity
Developing 1960s 5.4 3.3 0.7 3.5 1.6 countries 1970s 5.2 2.6 0.7 3.8 0.8
1980s 2.7 0.0 1.3 0.1 (0.9)1990s 3.3 0.9 0.9 0.5 0.1
Overall 4.1 1.7 0.9 2.0 0.4 Iran 1960s 8.9 6.8 0.6 9.3 3.3
1970s 0.7 (2.2) 0.9 8.2 (5.6)1980s 3.7 0.8 1.5 (1.8) 0.4 1990s 4.0 1.8 1.4 1.1 0.5
Overall 4.3 1.8 1.1 4.2 (0.3)Pakistan 1960s 7.0 4.7 0.8 9.3 1.1
1970s 4.6 1.2 0.5 1.6 0.4 1980s 6.1 3.4 2.0 1.1 1.7 1990s 3.9 0.9 (0.3) 1.9 0.5
Overall 5.4 2.6 0.7 3.5 0.9 Afghanistan 1960s 1.9 0.1 (0.2) 2.7 (0.7)
1970s 2.4 0.1 (0.0) 1.7 (0.5)
1980-90s 1.2 (1.2) 0.3 (4.2) - Overall 1.7 (0.6) 0.1 (1.9) -
Growth accounting in per capita terms, see Annex.
Turning to the level of output, the decomposition in Table 21 shows that the low output per worker in developing countries (21% of the level in rich countries) results from the combination of lower human capital, lower physical capital, and lower productivity: while none of these factors is more than 50% below its level in rich countries, the combination of these three gaps generates a large gap in output per worker. With such a decomposition, Afghanistan scores below developing countries, or Africa, on each of these three components, leading to a massive cumulative impact on output per worker (which is now less than 1% of the level in rich countries).
Table 22: Output per worker in 2002 Output per
workerHuman capital
Physical capital Total Factor Productivity
Rich countries 1.00 1.00 1.00 1.00 Developing countries exc. Africa 0.21 0.60 0.80 0.43 Africa 0.08 0.47 0.39 0.45 India /China 0.20 0.55 0.79 0.45 Iran 0.37 0.52 0.30 2.38 Pakistan 0.10 0.45 0.25 0.87 Afghanistan 0.01 0.37 0.04 0.32
All terms are divided by the corresponding statistics for rich countries. See Annex and Cohen and Soto (2002).
If Afghanistan is to double output to $500 per capita, this will imply an increase in these three components. According to the ILO, the labor force was 11.8 million in 2002, which is consistent with the UN estimate of population between 20 and 59 years. Labor force is assumed to grow at a 2.5% in the short to medium term (actually slightly above the overall population growth rate given the age structure of the population). It is in addition assumed that, by 2015, the number of years of schooling doubles from 1.7 to 3.5 (the current level in Pakistan is 4, but a faster increase would be difficult since this statistic is based on the whole labor force and is therefore very persistent). Without growth in total factor productivity, capital per worker would have to double, which represents a gross investment in the order of $35 billion by 2015. If factor productivity was to sustain a 3% growth rate, the investment would be reduced to around $10 billion. It should be noted

31
that if the current estimate of GDP includes a significant component of income from opium, then drug eradication would lead to a “decrease in total factor productivity” (the sector is currently comparatively productive), making the latter scenario less plausible. It is critical to stress again the role of the numerous assumptions behind these calculations. Beyond general technical assumptions (on the production function, on the calculation of the stock of human and physical capital), there are specific assumptions for Afghanistan, regarding its current real GDP and capital stock, and specific assumptions for the projection in terms of education and factor productivity. However, these uncertainties should not mask that, to reach the projected growth rate, Afghanistan needs to make progress on three fronts: robust improvements in education, massive investment, and efficient use of these inputs.

32

33
Annexes
Data from Angus Maddison For Afghanistan 1990 per capita GDP (the base year) is “assumed” to be $600 (see p. 208). From 1960 to 1998, data are consistent with the two time series discussed in the text. Since, Maddison records negative growth from 1990 to 1994, then a 26% increase, and then steady growth of 6% per year over the last three years. It is
Table A1: Cross-country comparison 1950-1973 1973-1990 1990-1998 1998
Level (1990 int $)Afghanistan (1.7) (0.8) (1.9) 514
Pakistan 1.7 3.1 2.4 1,935 Iran 5.1 (2.4) 2.2 4,265 Tajikistan (1.8) (14.8) 830 Turkmenistan (1.6) (8.9) 1,723 Uzbekistan (1.1) (3.2) 3,296
Neighbors 5.3 (0.5) 0.9 2,681 World 2.9 1.3 1.3 5,709
Annual growth rate (%)
Source: Maddison (2001).
Governance Kaufmann, Kraay, Mastruzzi (2003) have produced detailed governance indicators summarizing a number of surveys and indicator. The value and the underlying data are indicated in the table below.
Table A2: Governance indicator Indicator Percentile Estimate Std Surveys / Polls
Rank (0-100) (-2.5 to + 2.5) Dev Source Publication11.1 -1.31 0.23
Columbia University State Capacity ProjectFreedom House Freedom in the WorldState Department / Amnesty International Human Rights ReportReporters Without Borders Reporters Without BordersWorld Markets Research Center World Markets Online
1.1 -2.21 0.28Columbia University State Capacity ProjectGlobal Insight's DRI McGraw-Hill Country Risk ReviewState Department / Amnesty International Human Rights ReportWorld Markets Research Center World Markets Online
5.2 -1.39 0.25Columbia University State Capacity ProjectGlobal Insight's DRI McGraw-Hill Country Risk ReviewWorld Markets Research Center World Markets Online
2.6 -1.82 0.29Global Insight's DRI McGraw-Hill Country Risk ReviewWorld Markets Research Center World Markets Online
2.6 -1.61 0.24Columbia University State Capacity ProjectGlobal Insight's DRI McGraw-Hill Country Risk ReviewState Department / Amnesty International Human Rights ReportWorld Markets Research Center World Markets Online
2.6 -1.35 0.27Columbia University State Capacity ProjectGlobal Insight's DRI McGraw-Hill Country Risk ReviewWorld Markets Research Center World Markets Online
AVERAGE -1.62
Rule of Law
Control of Corruption
Voice and Accountability
Political Stability
Government Effectiveness
Regulatory Quality
Note: all indicators for 2002; all indicators are polls. Source: Kaufmann, Kraay, Mastruzzi (2003).

34
Cross-country regression analysis The analysis in the text is based on the regression described in Table A3.
Table A3: Cross-country regression Variable Source Coefficient T stat Constant 0.167 7.50 Initial output per capita WDI (PPP $ for 1980; in log) -0.018 -5.76 Openness x output -0.018 -3.09 Openness EL, based on Sachs and Warner 1995 0.157 3.36 Tropic SW -0.007 -1.64 Landlocked SW -0.013 -2.92 Institutions Kaufman, Kray, and Zoido-Lobaton 0.018 4.53 Ethnic Fractionalization Alesina et alii -0.028 -3.57 Years of civil war Collier and Hoeffle, 2002 -0.001 -1.69 Literacy SW (around 1970) 0.005 1.28 Dependency on primary
exports SW (export of primary products on GDP) -0.035 -2.07 Savings SW (gross domestic savings on GDP) 0.0004 2.76 Notes: EL = Eastery and Levine, 2002; SW = Sachs and Warner, 1997.
This analysis was cross-checked by applying results derived by Doppelhofer, Miller and Sala-i-Martin (2000). They use a methodology to determine statistically which of all the possible variables in cross-country regressions are significant. As shown in Table A4, based on their most significant variables, growth in Afghanistan (per capita, in PPP terms, over 1960-1992) would have been slightly below the average in their sample, that is approximately 1 ½ pt per year. Adding civil war as a determinant, the result would have been similar to the regression in Table A3.
Table A4: Regression based on Doppelhofer, Miller and Sala-i-Martin (2000)
Variables Afghanistan Mean in sample Coeff AF growth vs.
average growthVariables strongly and robustly related to growth
Initial GDP 500 1,521 (0.013) 1.4%Mining 1 5 0.065 -0.3%# of years the econony was open - 0.3616 0.018 -0.7%Fraction of confucians - 0.01 0.058 -0.1%
Variables robustly related to growthLife expectancy (in 1960) 38 53.42 0.0008 -1.2%Primary school enrollment (in 1960) 34 71 0.012 -0.5%Sub-Sahara African dummy - 0.327 (0.007) 0.2%Fraction of muslims 98 20 0.008 0.6%Latin America dummy - 0.225 (0.006) 0.1%Fraction of protestant - 17 (0.006) 0.1%Primary exports in 1970 in total exp. 90 73 (0.006) -0.1%Real Exchange Rate distorsions 125 125 (0.000) 0.0%
Total calculated growth -0.3%
1960-1992
Another measure, developed by the World Bank and called Policy-Based Growth Projection Model, suggests negative growth of 6% over the 90s. However, this approach apparently puts a very high weight to the consequences (or origins) of a high black market premium, which was indeed very high for Afghanistan over the 90s.

35
Growth accounting analysis Let’s first assume that the production function is a Cobb-Douglas function, the output Q being produced with a physical capital stock K and a human capital H, augmented by the total factor productivity A:
(1) Q = A . K α . H 1−α
The elasticity α can be calculated as the share of income from capital in the GDP and is usually approximated by 1/3. Human capital is based on the number of year of studies S, with a return to education estimated at 9.5 (Cohen and Soto, 2002):
(2) H = a . exp (b . S) With L the labor force. (1) can be rewritten:
(3) Q / L = A . (K / H) α. H / L Cohen and Soto (2002) discusses the choice to use the K/H ratio (instead of the more usual K/Q ratio), discussion this decomposition as a way to compare two firms, with more or less human capital, more or less physical capital in the hands of this human capital, and a more or less good efficiency at using these capitals. For an analysis on variance, the formulation (4) is probably more intuitive:
(4) Growth(Q / L) = growth(A) + α . growth(K / L) + (1 - α). growth(H / L) The data used in this note are: �� Output in 1987 prices (local currency) from Mahajan (2002), based on WDI data; �� Labor force from the same source; �� Physical capital stock from the same source; �� Human capital defined by the number of years of schooling for the population aged
15-64 who is not studying (based on Cohen and Soto, 2001). For 2002, the index is based on 2000 data.
�� The total factor productivity is calculated as a residual. The three groups of countries are listed in Cohen and Soto (2002).
For Afghanistan, the following assumptions are made: ��Output in 1975 prices (local currency) from WDI is used; for 2002, the CSO estimate is used,
assuming that after the currency reform prices are at a similar level than in 1975 (which is supported by evidence on the price of wheat);
�� Labor force from the same source; �� It is assumed that the 1960 capital to output ratio was one, which consistent with similar
countries in the database above; subsequent years for the capital years are calculated with the perpetual inventory method, with the new capital stock being the previous year’s stock minus a depreciation rate (4%) plus the gross capital formation from the previous year (from the same source, also in 1975 prices);
��The human capital index is based on the Barro Lee (2000) database. The last approximation is also used for Pakistan for which Cohen and Soto have no estimate. The analysis includes: �� 24 rich countries: Australia, Austria, Belgium, Canada, Denmark, Finland, France, Germany,
Greece, Iceland, Ireland, Israel, Italy, Japan, Netherlands, New Zealand, Norway, Portugal, Singapore, Spain, Sweden, Switzerland, United Kingdom, United States.
�� 43 developing countries excluding Africa and India/China: Algeria, Argentina, Bangladesh, Bolivia, Brazil, Bulgaria, Colombia, Costa Rica, Dominican Republic, Ecuador, Egypt, El Salvador, Guatemala, Guyana, Haiti, Honduras, Hungary, Indonesia, Iran, Jamaica, Jordan,

36
Korea, Malaysia, Mexico, Morocco, Nepal, Nicaragua, Pakistan, Panama, Papua New Guinea, Paraguay, Peru, Philippines, Romania, Slovakia, Sri Lanka, Syria, Thailand, Trinidad and Tobago, Tunisia, Turkey, Uruguay, Venezuela.
�� 27 African countries: Benin, Botswana, Cameroon, Congo, Cote d’Ivoire, Ethiopia, Gambia, Ghana, Guinea-Bissau, Kenya, Lesotho, Madagascar, Malawi, Mali, Mauritius, Mozambique, Niger, Nigeria, Rwanda, Senegal, South Africa, Swaziland, Togo, Uganda, Zambia, Zimbabwe.

37
References
ADB (2003), indicators. Adelman, I., Morris, C.T. (1968), “Performance Criteria For Evaluating Economic Development Potential: an Operational Approach”, Quarterly Journal of Economics, 82, 2, May. Barro, R., Lee, J.W. (2000), “International Data on Educational Attainment: Updates and Implications”, CID Working Paper. 42. Bhatia, N., Goodhand, J. (2003), “Profits and Poverty: aid, livelihood and conflict in Afghanistan”, HPG Background Paper, 13, Overseas Development Institute, February. Bourguignon, F. (2002), “Growth and Inequality: Issues and Policy Implications”, CESifo, January. Cohen, D., Soto, M. (2002), “Why are some countries so poor? Another look at the evidence and a message of hope”, OECD Development Centre Technical Paper, 197. Cohen, D., Soto, M. (2001), “Growth and human capital: good data, good results”, CEPR Discussion Paper Series, 3025. Collier, P., Hoeffler, A. (2002), “Aid, Policy and Growth in Post-Conflict Societies”, World Bank Policy Research Working Paper, 2902, October. CSO, (1982), “ Statistical year book – March 1981 – March 1982)”. Dupree, L. (1980), Afghanistan, Princeton University. Easterly, W. (2003), Pakistan, in In search of Prosperity, edited by Dani Rodrik. EIU (2002), Afghanistan: Country Profile, The Economist. Energy Information Administration (2002), Afghanistan Fact Sheet , http://www.eia.doe.gov/emeu/cabs/afghan.html (updated in October 2002). FAO/WFP, “FAO/WFP Crop and Food Supply Assessment Mission to Afghanistan”, 16 August 2002, and 2003 Fry, M.J. (1974), The Afghan Economy. Goodhand, J. (2003), “Frontiers and Wars: a study of the opium economy in Afghanistan”, mimeo, Univesity of London, January. IMF (2003), “Islamic State of Afghanistan: Rebuilding a Macroeconomic Framework for Reconstruction and Growth”, IMF Country Report, 03/299, September. Kaufmann, D., Kraay, A., Mastruzzi, M. (2003), “Governance Matters III: Governance Indicators for 1996-2002”, World Bank Institute. Maddison, A. (2001), The World Economy: a Millennial Perspective, OECD. Mahajan, S. (2002), “Total Factor Productivity Tool”, World Bank mimeo. Maimbo, S. (2003). “The Money Exchange Dealers of Kabul”, World Bank Working Paper, 13. Maletta, H. (2002), “The wages of war: Food prices and labour pay in Afghanistan, 1996-2002”, mimeo, FAO. Ng, F., Yeats, A. (2003), “Export Profiles of Small Landlocked Countries: A Case Study Focusing on their Implications for Lesotho”, World Bank Policy Research Paper, 3085, June. Nyrop, R.F., Seekings, D.M. (1986), Afghanistan: a Country Study, Foreign Area Studies. Rubin, B. (2002), The Fragmentation of Afghanistan, Princeton University. UNIDO (2002), “Options for Afghanistan’s State-Owned Enterprises”, Report for the Transitional Government of Afghanistan, August. United Nations (2003), National Accounts, extracted from SIMA in July 2003.

38
United Nations Office on Drugs and Crime (2003), The Opium Economy in Afghanistan – An International Problem. Von Seth, H. (2003), “Review of Afghanistan’s Fiscal Management”, mimeo ADB, February. World Bank (2003a), World Development Indicators, extracted from SIMA in July 2003. World Bank (2003b), “Mining as a source of growth”, World Bank report. World Bank (2002), Structural Adjustment Credit for the Government of the North West Frontier Province, Technical annex. World Bank (1978), “Afghanistan: the journey to development”, report 1777a-AF.