south asian j exp biol; 3 (2): 71 83; 2013 et al... · 2013-05-21 · 72 mbar tine et al., south...
TRANSCRIPT

71
South Asian J Exp Biol; 3 (2): 71‐83; 2013
ISSN: 2230‐9799 Vol. 3, Issue 2, Page 71‐83 http://www.sajeb.org REGULAR ARTICLE
Genetic diversity of Callosobruchus maculatus Fabricus (Cowpea weevil) populations in various agro‐ecological areas of five countries in West African sub‐region Eugène Mbar Tine1, 2,Toffène Diome1, 2, Kebe Khadim1, 2, Assane Ndong1, 2, Ali Douma3, Guil‐laume Ketoh5, Antoine Sanon4 and Mbacké Sembene1, 2
1Départment of Animal Biology, Faculty of Science and Technology, University C.A. Diop, P. Box 5005 Dakar, Senegal 2BIOPASS UMR 022 IRD‐CBGP Bel‐Air, P.O. Box. 1386 Dakar, Senegal 3University Abdou Moumouni of Niamey, Faculty of Science, P. Box. 10662, Niamey, Niger 4Laboratory of entomology, University of Ouagadougou, Burkina Faso 5Laboratory of entomology, Faculty of Science, University of Lome, P. Box. 1515, Lome, Togo
ART ICLE INFO Article History: Received: 11 Mar 2013 Revised: 22 Apr 2013 Accepted: 22 Apr 2013 *Corresponding Author: Telephone: (00221) 77 408 59 28 Email: [email protected] Keywords: Callosobruchus macula‐tus, Cytochrome b, 28S ribosomal gene, Sequencing, West Africa
ABSTRACT The cowpea (Vigna unguiculata (L) Walp) is a legume of African origin. It is source of very important nutritional needs like protein and vitamins for the developing countries especially countries of West Africa. The attack by the Bruchinae seed‐beetle Callosobruchus maculatus (Fab) whose larvae develop in seeds causes losses ranging from 30 to over 80% of the harvest between 6‐7months of storage. The objectives of this study were to identify the differ‐ent haplotypes of the weevils’ West African sub‐region, to study genetic di‐versity in different agro‐ecological zones and then highlight the phylogenetic affinities between the weevils from these different areas. In this study, we have analysed the sequences of the mitochondrial gene cytochrome b and 28S ribosomal gene in 75 individuals. 42 haplotypes for cytochrome b have been identified in three clades against 30 for the 28S divided into two clades. Individual haplotypes were mainly from the Guinean zone. Genetic distance and nucleotide diversity showed a trend of population structure of weevils between the different agro‐ecological zones. This work is corroborated by low values of diversity within the zones and highly significant between them. Although Sudanian’ zone seemed not to confirm this view because of a rela‐tively small percentage of alignment for individuals from Tenkodogo (Burkina Faso). The phylogenetic reconstructions have thus shown that gene flow was maintained even if it remained within narrow zones between agro‐ecological zones for the populations of West African C. maculatus.
1. Introduction
The cowpea (Vigna unguiculata L. Walp), plant of African origin, is after the peanut (Arachis hypo‐gaea L.), the most cultivated leguminous in Africa and Asia. It presents an important source of pro‐
teins and vitamins for the populations in develop‐ing countries especially in West Africa (Ndiaye et al., 2011). However due to a number of diseases and pests which attacks the cowpea, its yields are low despite the attempts to varietal improvements
72
Mbar Tine et al., South Asian J Exp Biol; 3 (2): 71‐83; 2013
brought on the plant (Diaw, 1999). Of these pests, the most harmful to cowpea is the Bruchinae Bee‐tle Callosobruchus maculatus Fabricus (Ndiaye et al., 2011). The larvae feed on the cowpea’s seeds especially in the fields and during storage (Seck, 1994). In Senegal, Seck (1994) estimated that 50% of the seeds are destroyed within six months stor‐age. Approximately 30% of the annual cowpea pro‐duction in Niger and 80% in Togo and Burkina Faso is destroyed by C. maculatus (Alzouma, 1995; Ngamo and Hance, 2007).
Climate change has conditioned an increase in rain‐fall variability in the equatorial regions (Dore, 2005). West Africa offers three principal agro‐ecological zones: the Sahelian dry zone, the Su‐danian semi‐arid zone and Guinean humid zone. Cowpea is cultivated in all these zones because it is adapted to many types of agro‐climates because of the multiplicity of these cultivars and the varietal improvement technology (Brink and Balay, 2006). The variability of rainfall and therefore of vegeta‐tion in these various zones would impact on biodi‐versity induced by changes in the natural environ‐ment (Saïdou, 2011). Thus the current gene flow between populations is likely to be interrupted as adaptability to the agro‐climatic conditions would change the operating mode and the morphology of individuals subject to the laws of natural selection. Differences between these zones may lead to a restructuring of C. maculatus populations’ in the West African sub‐region.
While analyzing’s DNA samples from individuals of C. maculatus infesting cowpea in various agro‐ecological zones in West Africa, our particular ob‐jectives were: i) to evaluate the number of differ‐ent haplotypes found in the sub‐region, ii) to evalu‐ate their genetic diversity from the parameters of genetic distances and nucleotide diversity and phy‐logenetic affinities between populations. This will allow us to see if these bruchids are structured or not depending on the agro‐ecological zones consid‐ered. To reach those objectives we performed the PCR‐Sequencing of the mitochondrial cytochrome b gene and 28S ribosomal gene.
2. Materials and Methods
2.1. Sampling
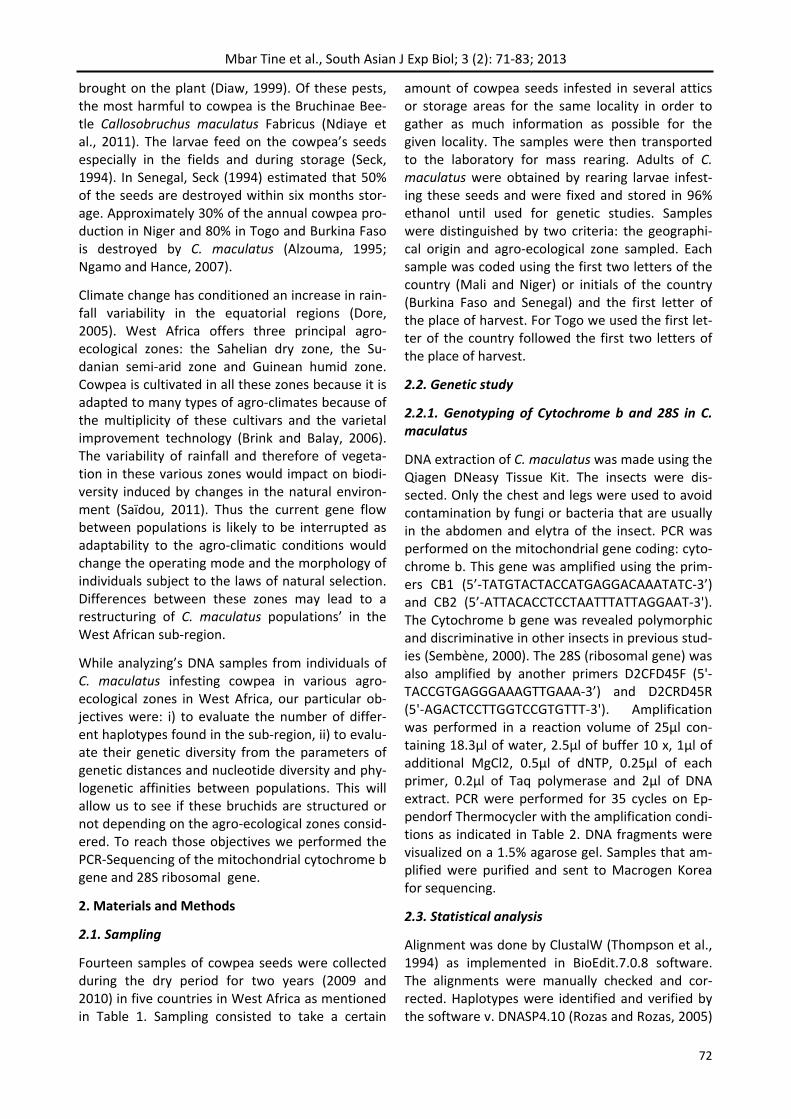
Fourteen samples of cowpea seeds were collected during the dry period for two years (2009 and 2010) in five countries in West Africa as mentioned in Table 1. Sampling consisted to take a certain
amount of cowpea seeds infested in several attics or storage areas for the same locality in order to gather as much information as possible for the given locality. The samples were then transported to the laboratory for mass rearing. Adults of C. maculatus were obtained by rearing larvae infest‐ing these seeds and were fixed and stored in 96% ethanol until used for genetic studies. Samples were distinguished by two criteria: the geographi‐cal origin and agro‐ecological zone sampled. Each sample was coded using the first two letters of the country (Mali and Niger) or initials of the country (Burkina Faso and Senegal) and the first letter of the place of harvest. For Togo we used the first let‐ter of the country followed the first two letters of the place of harvest.
2.2. Genetic study
2.2.1. Genotyping of Cytochrome b and 28S in C. maculatus
DNA extraction of C. maculatus was made using the Qiagen DNeasy Tissue Kit. The insects were dis‐sected. Only the chest and legs were used to avoid contamination by fungi or bacteria that are usually in the abdomen and elytra of the insect. PCR was performed on the mitochondrial gene coding: cyto‐chrome b. This gene was amplified using the prim‐ers CB1 (5’‐TATGTACTACCATGAGGACAAATATC‐3’) and CB2 (5’‐ATTACACCTCCTAATTTATTAGGAAT‐3'). The Cytochrome b gene was revealed polymorphic and discriminative in other insects in previous stud‐ies (Sembène, 2000). The 28S (ribosomal gene) was also amplified by another primers D2CFD45F (5'‐TACCGTGAGGGAAAGTTGAAA‐3’) and D2CRD45R (5'‐AGACTCCTTGGTCCGTGTTT‐3'). Amplification was performed in a reaction volume of 25µl con‐taining 18.3µl of water, 2.5µl of buffer 10 x, 1µl of additional MgCl2, 0.5µl of dNTP, 0.25µl of each primer, 0.2µl of Taq polymerase and 2µl of DNA extract. PCR were performed for 35 cycles on Ep‐pendorf Thermocycler with the amplification condi‐tions as indicated in Table 2. DNA fragments were visualized on a 1.5% agarose gel. Samples that am‐plified were purified and sent to Macrogen Korea for sequencing.
2.3. Statistical analysis
Alignment was done by ClustalW (Thompson et al., 1994) as implemented in BioEdit.7.0.8 software. The alignments were manually checked and cor‐rected. Haplotypes were identified and verified by the software v. DNASP4.10 (Rozas and Rozas, 2005)
73
Mbar Tine et al., South Asian J Exp Biol; 3 (2): 71‐83; 2013
and Arlequin 3.0. (Excoffier et al., 2005). Correla‐tion tests of the genetic distance and the geo‐graphical distance between populations (Mantel test) were conducted by the Pearson bilateral cor‐relation in the software XLSTAT 2011. The resulting data were subsequently used to calculate the stan‐dard clues of genetic variations such as the position and the nature of the mutations, the genetic dis‐tance intra/inter groups, the number of polymor‐phic sites, conserved sites, singleton sites, segre‐gating sites and parsimony informative sites. The transitions/transversions rate bias (R) and the fre‐quency of nucleotides are also calculated with the very software MEGA4 by the substitution Pattern test. Phylogenetic relationships were reconstructed with MEGA4 software v.4.0.0.162 using the Neighbor‐Joining method (N‐J), (Saitou and Nei, 1987) based on ecotypes’ matrix of genetic dis‐tance (the Kimura‘s distance 2‐parameter) was taken two by two in order to model the evolution‐ary processes. The Maximum Parsimony method (MP), (Ficht, 1971) was carried out with the heuris‐tic search option with random stepwise taxon addi‐tion replicates, using the branch swapping tree bi‐section‐reconnection option. A bootstrap proce‐dure (500 iterations with the same option of heu‐ristic search) was used to establish the score of
each node (Felsenstein, 1981) by retaining groups compatible with the 50% majority rule consensus. A strict consensus tree was computed whenever multiple equally parsimonious trees were obtained. The Maximum Likelihood method (ML, Felsenstein, 1981) was used to test all the stories that may have led to the current data set analysed. This analysis was performed by MEGA version5.0. Node stability was evaluated using 100 bootstrapping replica‐tions, and the majority‐rule consensus trees were conducted. In all phylogenetic analyses Caryedon serratus was considered as out‐group.
3. Results
3.1. Nucleotide variability
Of the 110 starting sequences, only 75 sequences were chosen, because after alignment, there were individuals which were in the sequences of cyto‐chrome b and they were not sequenced in 28S gene and vice versa. Thus, we found it necessary to work on the sequences obtained in both portions of the two genes. Allowing to have the 75 individu‐als sampled, three from Burkina Faso, 16 from Mali, 6 from Niger, 26 from Senegal and 24 from Togo. Cytochrome b with 451 base pairs has 280 conserved sites, 171 variable sites, 107 singletons and 64 parsimony informative sites (Figure 1). The
Country Locality Number of Individuals
Code of Individuals
Agro‐ecological zone
Year of sampling
Burkina Faso Tenkodogo 3 Bf Sudanian 2010
Mali Benkorowéré 8 MaB Sahelian 2010
Sikasso 8 MaS Sudanian 2009
Niger Niamey 6 NiN Sahelian 2009
Sénégal
Coki 3 SnC Sahelian 2010
Kébémer 9 SnK Sahelian 2009
Fouta 5 SnF Sahelian 2010
Tambacounda 9 SnT Sudanian 2009
Togo
Adidogome 2 TAd Guinean 2010
Assigame 4 TAs Guinean 2010
Dapaong 4 TDa Guinean 2010
Gbossine 5 TGb Guinean 2010
Mango 5 TMa Guinean 2010
Tsevié 4 TTs Guinean 2010
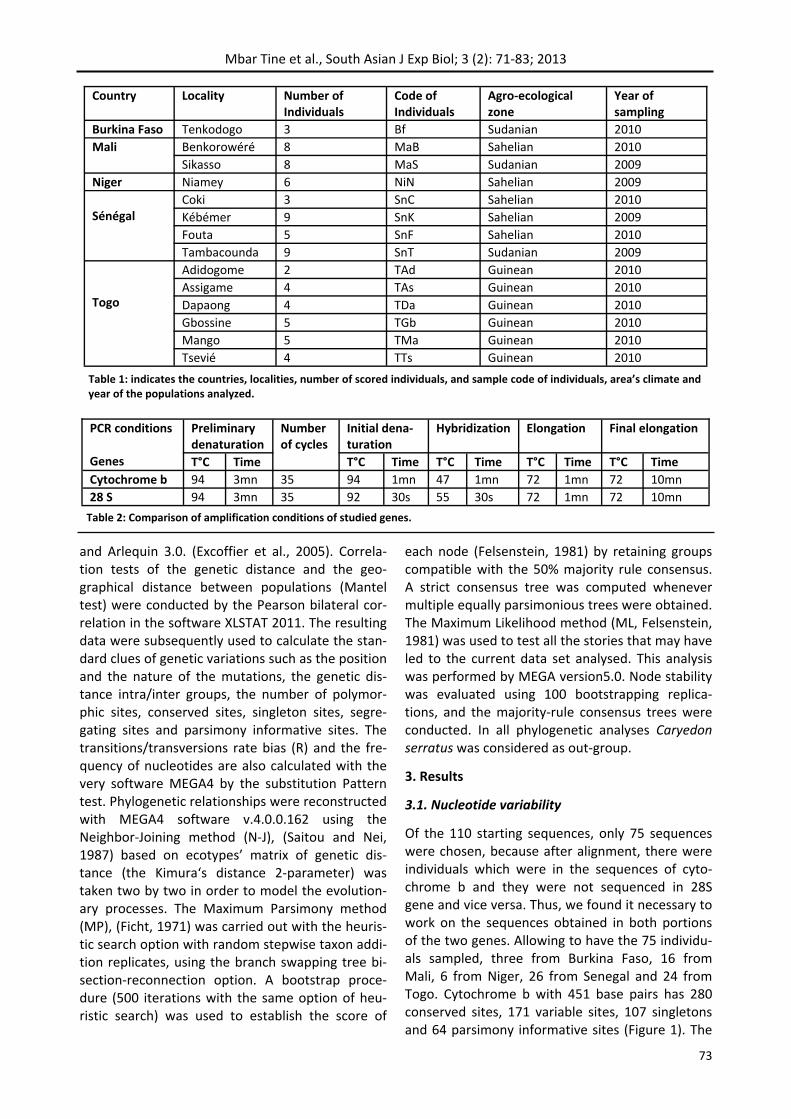
Table 1: indicates the countries, localities, number of scored individuals, and sample code of individuals, area’s climate and year of the populations analyzed.
PCR conditions Preliminary denaturation
Number of cycles
Initial dena‐turation
Hybridization Elongation Final elongation
T°C Time T°C Time T°C Time T°C Time T°C Time
Cytochrome b 94 3mn 35 94 1mn 47 1mn 72 1mn 72 10mn
28 S 94 3mn 35 92 30s 55 30s 72 1mn 72 10mn
Genes
Table 2: Comparison of amplification conditions of studied genes.
74
Mbar Tine et al., South Asian J Exp Biol; 3 (2): 71‐83; 2013
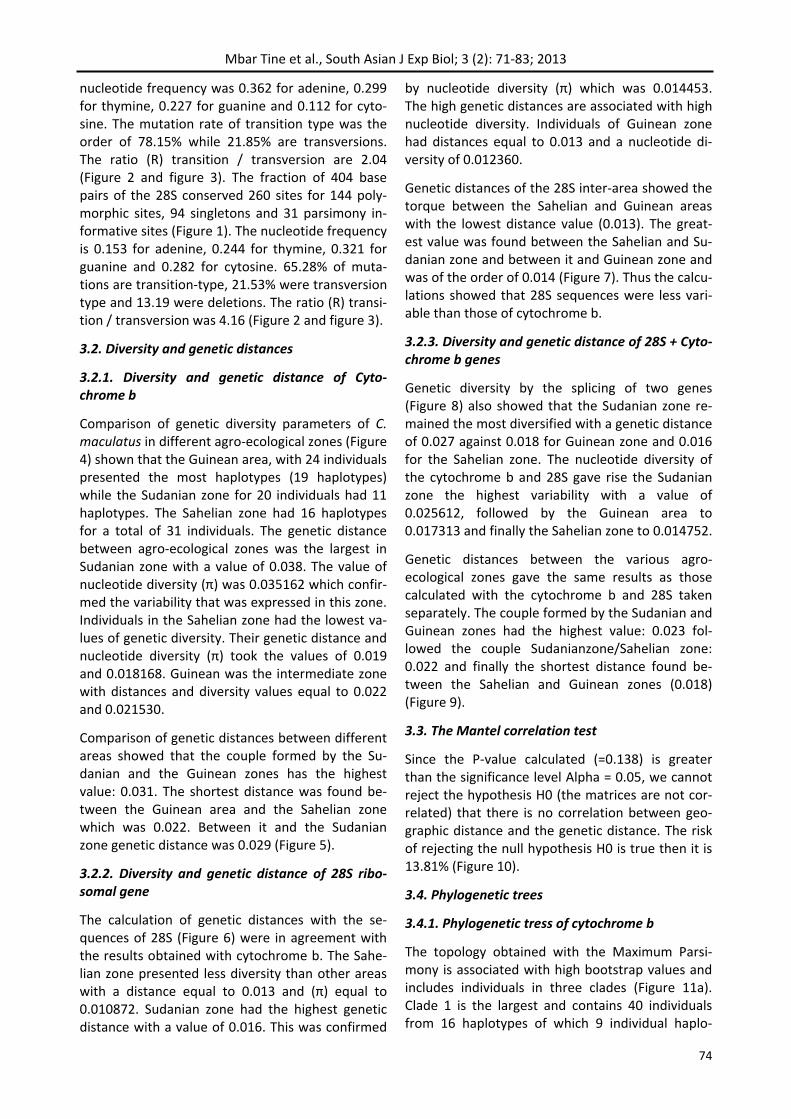
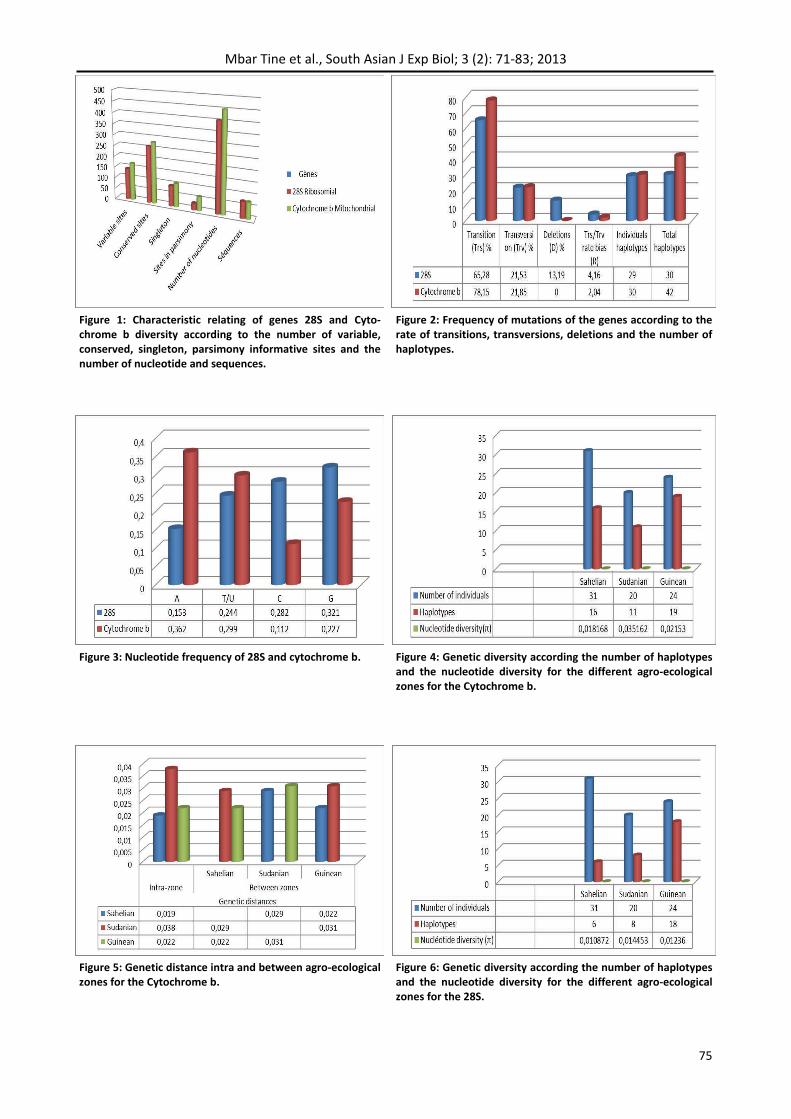
nucleotide frequency was 0.362 for adenine, 0.299 for thymine, 0.227 for guanine and 0.112 for cyto‐sine. The mutation rate of transition type was the order of 78.15% while 21.85% are transversions. The ratio (R) transition / transversion are 2.04 (Figure 2 and figure 3). The fraction of 404 base pairs of the 28S conserved 260 sites for 144 poly‐morphic sites, 94 singletons and 31 parsimony in‐formative sites (Figure 1). The nucleotide frequency is 0.153 for adenine, 0.244 for thymine, 0.321 for guanine and 0.282 for cytosine. 65.28% of muta‐tions are transition‐type, 21.53% were transversion type and 13.19 were deletions. The ratio (R) transi‐tion / transversion was 4.16 (Figure 2 and figure 3).
3.2. Diversity and genetic distances
3.2.1. Diversity and genetic distance of Cyto‐chrome b
Comparison of genetic diversity parameters of C. maculatus in different agro‐ecological zones (Figure 4) shown that the Guinean area, with 24 individuals presented the most haplotypes (19 haplotypes) while the Sudanian zone for 20 individuals had 11 haplotypes. The Sahelian zone had 16 haplotypes for a total of 31 individuals. The genetic distance between agro‐ecological zones was the largest in Sudanian zone with a value of 0.038. The value of nucleotide diversity (π) was 0.035162 which confir‐med the variability that was expressed in this zone. Individuals in the Sahelian zone had the lowest va‐lues of genetic diversity. Their genetic distance and nucleotide diversity (π) took the values of 0.019 and 0.018168. Guinean was the intermediate zone with distances and diversity values equal to 0.022 and 0.021530.
Comparison of genetic distances between different areas showed that the couple formed by the Su‐danian and the Guinean zones has the highest value: 0.031. The shortest distance was found be‐tween the Guinean area and the Sahelian zone which was 0.022. Between it and the Sudanian zone genetic distance was 0.029 (Figure 5).
3.2.2. Diversity and genetic distance of 28S ribo‐somal gene
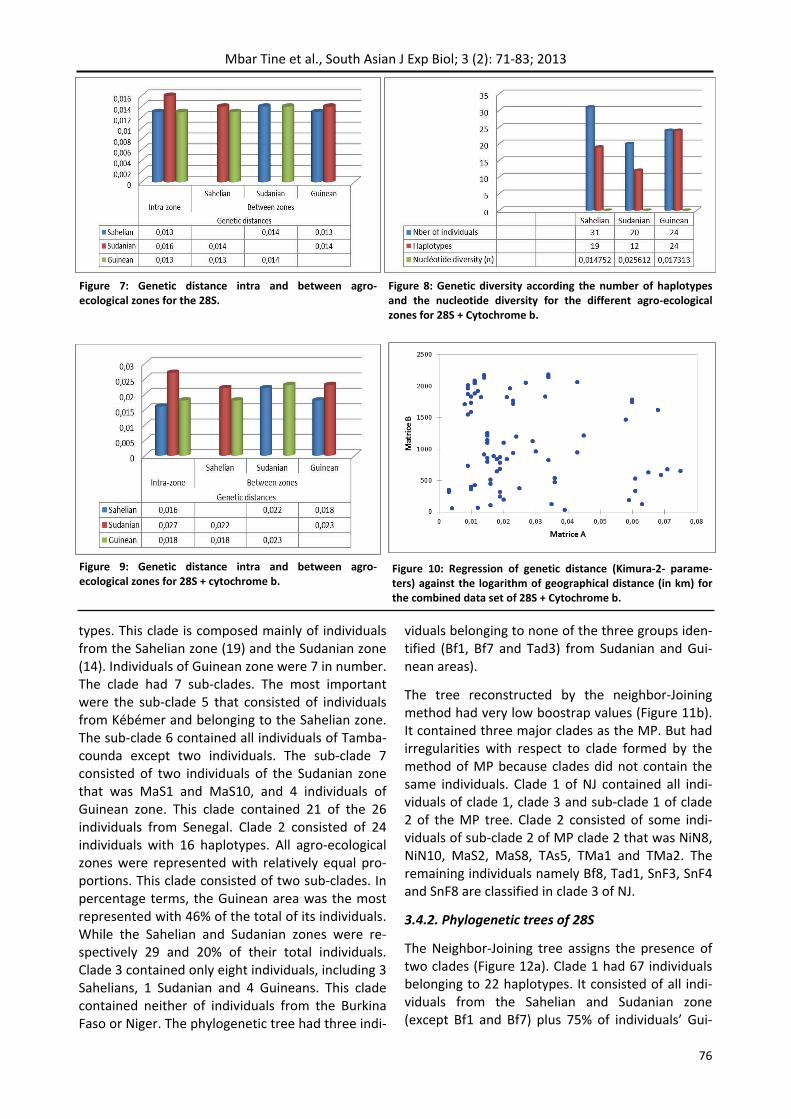
The calculation of genetic distances with the se‐quences of 28S (Figure 6) were in agreement with the results obtained with cytochrome b. The Sahe‐lian zone presented less diversity than other areas with a distance equal to 0.013 and (π) equal to 0.010872. Sudanian zone had the highest genetic distance with a value of 0.016. This was confirmed
by nucleotide diversity (π) which was 0.014453. The high genetic distances are associated with high nucleotide diversity. Individuals of Guinean zone had distances equal to 0.013 and a nucleotide di‐versity of 0.012360.
Genetic distances of the 28S inter‐area showed the torque between the Sahelian and Guinean areas with the lowest distance value (0.013). The great‐est value was found between the Sahelian and Su‐danian zone and between it and Guinean zone and was of the order of 0.014 (Figure 7). Thus the calcu‐lations showed that 28S sequences were less vari‐able than those of cytochrome b.
3.2.3. Diversity and genetic distance of 28S + Cyto‐chrome b genes
Genetic diversity by the splicing of two genes (Figure 8) also showed that the Sudanian zone re‐mained the most diversified with a genetic distance of 0.027 against 0.018 for Guinean zone and 0.016 for the Sahelian zone. The nucleotide diversity of the cytochrome b and 28S gave rise the Sudanian zone the highest variability with a value of 0.025612, followed by the Guinean area to 0.017313 and finally the Sahelian zone to 0.014752.
Genetic distances between the various agro‐ecological zones gave the same results as those calculated with the cytochrome b and 28S taken separately. The couple formed by the Sudanian and Guinean zones had the highest value: 0.023 fol‐lowed the couple Sudanianzone/Sahelian zone: 0.022 and finally the shortest distance found be‐tween the Sahelian and Guinean zones (0.018) (Figure 9).
3.3. The Mantel correlation test
Since the P‐value calculated (=0.138) is greater than the significance level Alpha = 0.05, we cannot reject the hypothesis H0 (the matrices are not cor‐related) that there is no correlation between geo‐graphic distance and the genetic distance. The risk of rejecting the null hypothesis H0 is true then it is 13.81% (Figure 10).
3.4. Phylogenetic trees
3.4.1. Phylogenetic tress of cytochrome b
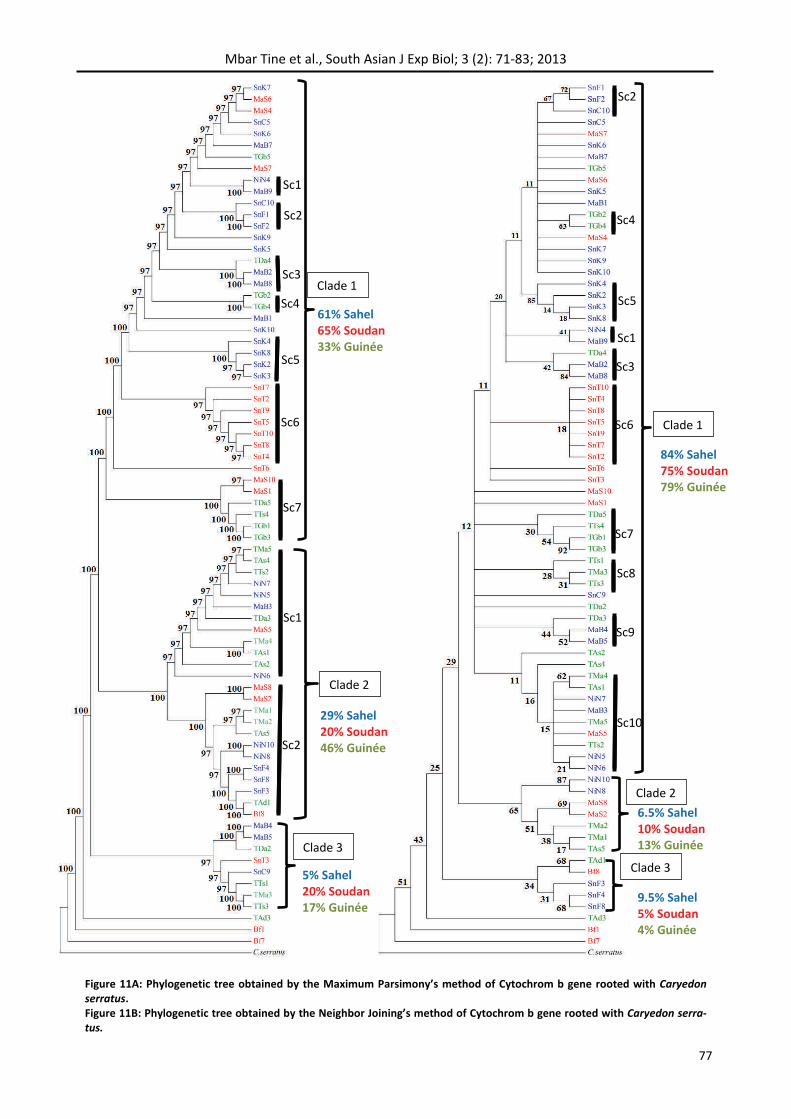
The topology obtained with the Maximum Parsi‐mony is associated with high bootstrap values and includes individuals in three clades (Figure 11a). Clade 1 is the largest and contains 40 individuals from 16 haplotypes of which 9 individual haplo‐
75
Mbar Tine et al., South Asian J Exp Biol; 3 (2): 71‐83; 2013
Figure 1: Characteristic relating of genes 28S and Cyto‐chrome b diversity according to the number of variable, conserved, singleton, parsimony informative sites and the number of nucleotide and sequences.
Figure 2: Frequency of mutations of the genes according to the rate of transitions, transversions, deletions and the number of haplotypes.
Figure 3: Nucleotide frequency of 28S and cytochrome b. Figure 4: Genetic diversity according the number of haplotypes and the nucleotide diversity for the different agro‐ecological zones for the Cytochrome b.
Figure 5: Genetic distance intra and between agro‐ecological zones for the Cytochrome b.
Figure 6: Genetic diversity according the number of haplotypes and the nucleotide diversity for the different agro‐ecological zones for the 28S.
76
Mbar Tine et al., South Asian J Exp Biol; 3 (2): 71‐83; 2013
types. This clade is composed mainly of individuals from the Sahelian zone (19) and the Sudanian zone (14). Individuals of Guinean zone were 7 in number. The clade had 7 sub‐clades. The most important were the sub‐clade 5 that consisted of individuals from Kébémer and belonging to the Sahelian zone. The sub‐clade 6 contained all individuals of Tamba‐counda except two individuals. The sub‐clade 7 consisted of two individuals of the Sudanian zone that was MaS1 and MaS10, and 4 individuals of Guinean zone. This clade contained 21 of the 26 individuals from Senegal. Clade 2 consisted of 24 individuals with 16 haplotypes. All agro‐ecological zones were represented with relatively equal pro‐portions. This clade consisted of two sub‐clades. In percentage terms, the Guinean area was the most represented with 46% of the total of its individuals. While the Sahelian and Sudanian zones were re‐spectively 29 and 20% of their total individuals. Clade 3 contained only eight individuals, including 3 Sahelians, 1 Sudanian and 4 Guineans. This clade contained neither of individuals from the Burkina Faso or Niger. The phylogenetic tree had three indi‐
viduals belonging to none of the three groups iden‐tified (Bf1, Bf7 and Tad3) from Sudanian and Gui‐nean areas).
The tree reconstructed by the neighbor‐Joining method had very low boostrap values (Figure 11b). It contained three major clades as the MP. But had irregularities with respect to clade formed by the method of MP because clades did not contain the same individuals. Clade 1 of NJ contained all indi‐viduals of clade 1, clade 3 and sub‐clade 1 of clade 2 of the MP tree. Clade 2 consisted of some indi‐viduals of sub‐clade 2 of MP clade 2 that was NiN8, NiN10, MaS2, MaS8, TAs5, TMa1 and TMa2. The remaining individuals namely Bf8, Tad1, SnF3, SnF4 and SnF8 are classified in clade 3 of NJ.
3.4.2. Phylogenetic trees of 28S
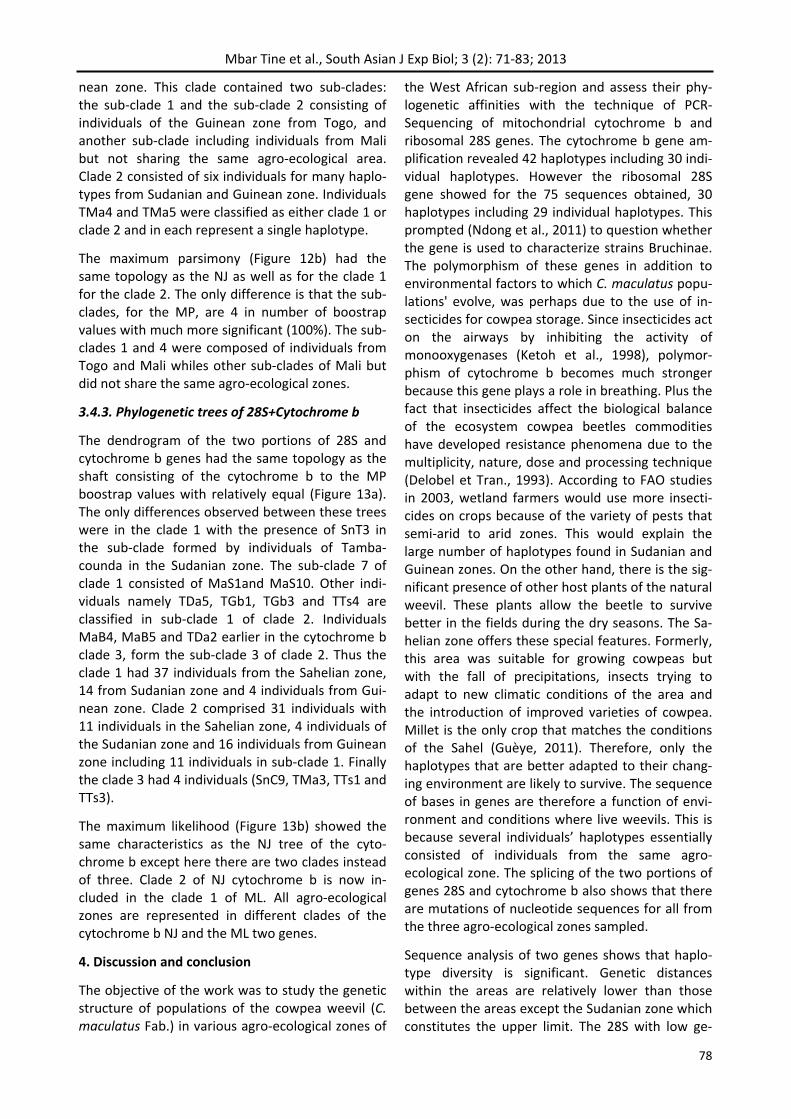
The Neighbor‐Joining tree assigns the presence of two clades (Figure 12a). Clade 1 had 67 individuals belonging to 22 haplotypes. It consisted of all indi‐viduals from the Sahelian and Sudanian zone (except Bf1 and Bf7) plus 75% of individuals’ Gui‐
Figure 9: Genetic distance intra and between agro‐ecological zones for 28S + cytochrome b.
Figure 10: Regression of genetic distance (Kimura‐2‐ parame‐ters) against the logarithm of geographical distance (in km) for the combined data set of 28S + Cytochrome b.
Figure 8: Genetic diversity according the number of haplotypes and the nucleotide diversity for the different agro‐ecological zones for 28S + Cytochrome b.
Figure 7: Genetic distance intra and between agro‐ecological zones for the 28S.
77
Mbar Tine et al., South Asian J Exp Biol; 3 (2): 71‐83; 2013
Clade 3
Clade 2
Clade 1
Sc1
Sc3
Sc6
Sc7
Sc5
Sc4
Sc2
Sc8
Sc9
Sc10
Clade 1
Clade 3
Clade 2
Sc7
Sc6
Sc5
Sc4
Sc3
Sc2
Sc1
Sc1
Sc2
61% Sahel 65% Soudan 33% Guinée
29% Sahel 20% Soudan 46% Guinée
5% Sahel 20% Soudan 17% Guinée
84% Sahel 75% Soudan 79% Guinée
6.5% Sahel 10% Soudan 13% Guinée
9.5% Sahel 5% Soudan 4% Guinée
Figure 11A: Phylogenetic tree obtained by the Maximum Parsimony’s method of Cytochrom b gene rooted with Caryedon serratus. Figure 11B: Phylogenetic tree obtained by the Neighbor Joining’s method of Cytochrom b gene rooted with Caryedon serra‐tus.
78
Mbar Tine et al., South Asian J Exp Biol; 3 (2): 71‐83; 2013
nean zone. This clade contained two sub‐clades: the sub‐clade 1 and the sub‐clade 2 consisting of individuals of the Guinean zone from Togo, and another sub‐clade including individuals from Mali but not sharing the same agro‐ecological area. Clade 2 consisted of six individuals for many haplo‐types from Sudanian and Guinean zone. Individuals TMa4 and TMa5 were classified as either clade 1 or clade 2 and in each represent a single haplotype.
The maximum parsimony (Figure 12b) had the same topology as the NJ as well as for the clade 1 for the clade 2. The only difference is that the sub‐clades, for the MP, are 4 in number of boostrap values with much more significant (100%). The sub‐clades 1 and 4 were composed of individuals from Togo and Mali whiles other sub‐clades of Mali but did not share the same agro‐ecological zones.
3.4.3. Phylogenetic trees of 28S+Cytochrome b
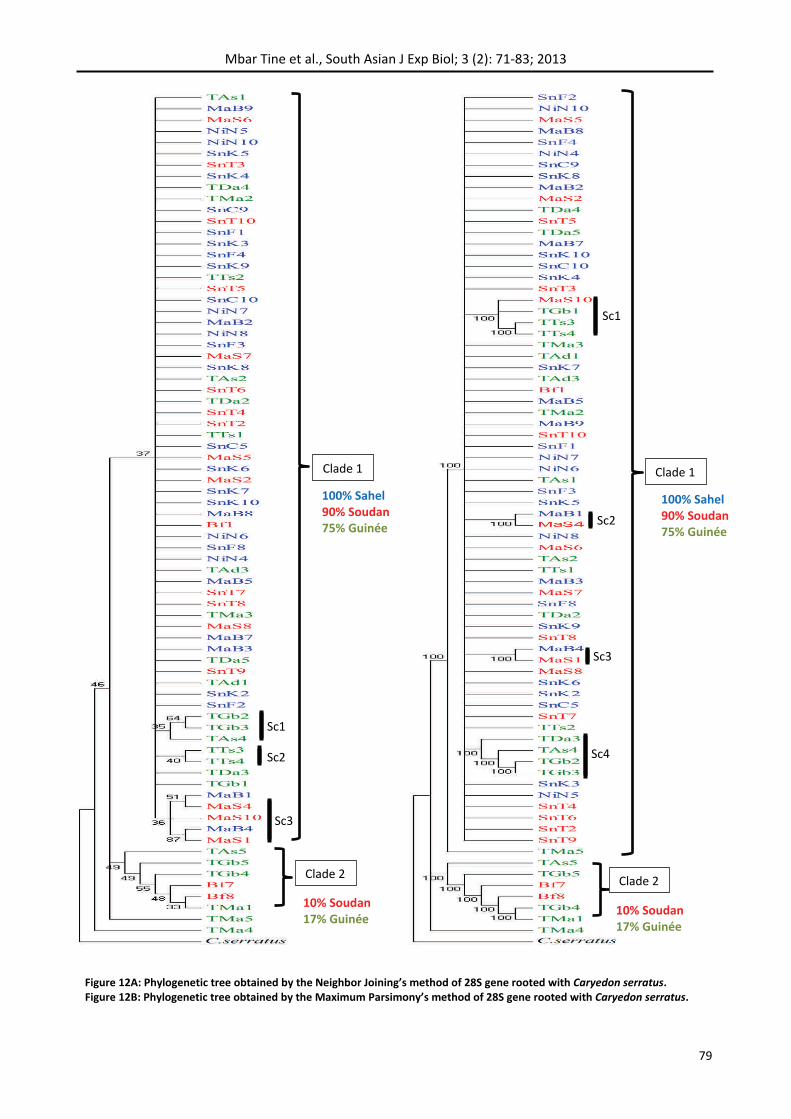
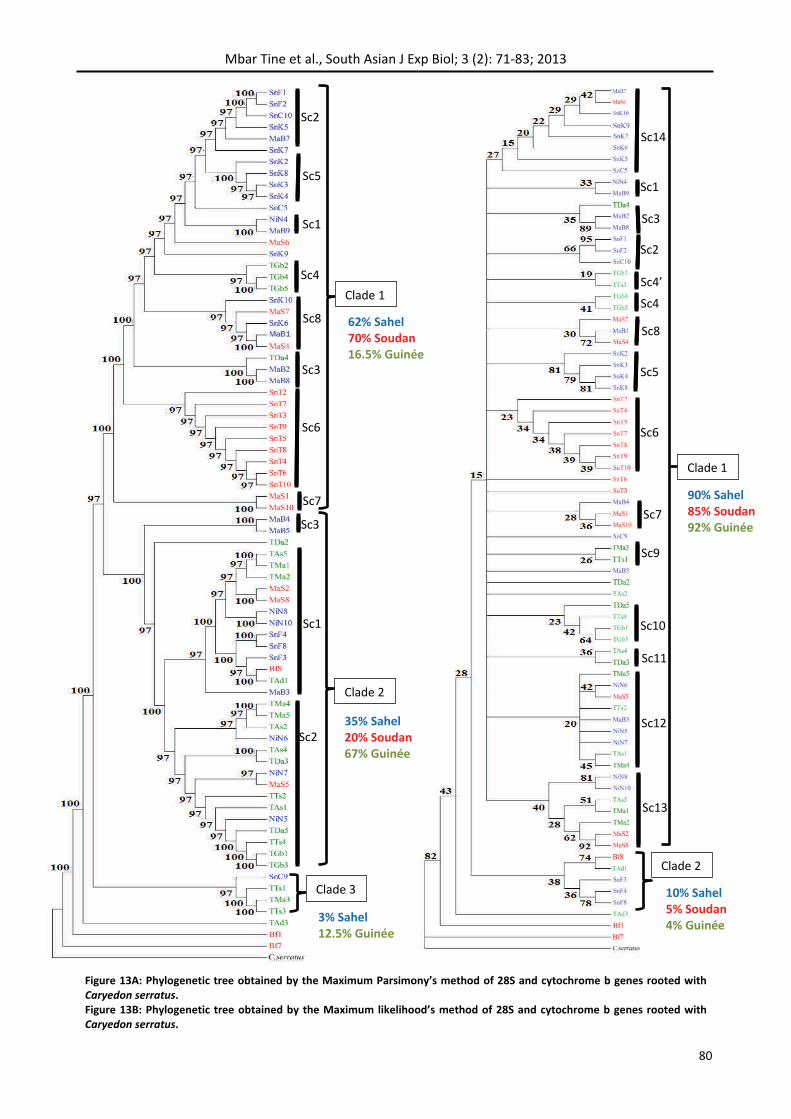
The dendrogram of the two portions of 28S and cytochrome b genes had the same topology as the shaft consisting of the cytochrome b to the MP boostrap values with relatively equal (Figure 13a). The only differences observed between these trees were in the clade 1 with the presence of SnT3 in the sub‐clade formed by individuals of Tamba‐counda in the Sudanian zone. The sub‐clade 7 of clade 1 consisted of MaS1and MaS10. Other indi‐viduals namely TDa5, TGb1, TGb3 and TTs4 are classified in sub‐clade 1 of clade 2. Individuals MaB4, MaB5 and TDa2 earlier in the cytochrome b clade 3, form the sub‐clade 3 of clade 2. Thus the clade 1 had 37 individuals from the Sahelian zone, 14 from Sudanian zone and 4 individuals from Gui‐nean zone. Clade 2 comprised 31 individuals with 11 individuals in the Sahelian zone, 4 individuals of the Sudanian zone and 16 individuals from Guinean zone including 11 individuals in sub‐clade 1. Finally the clade 3 had 4 individuals (SnC9, TMa3, TTs1 and TTs3).
The maximum likelihood (Figure 13b) showed the same characteristics as the NJ tree of the cyto‐chrome b except here there are two clades instead of three. Clade 2 of NJ cytochrome b is now in‐cluded in the clade 1 of ML. All agro‐ecological zones are represented in different clades of the cytochrome b NJ and the ML two genes.
4. Discussion and conclusion
The objective of the work was to study the genetic structure of populations of the cowpea weevil (C. maculatus Fab.) in various agro‐ecological zones of
the West African sub‐region and assess their phy‐logenetic affinities with the technique of PCR‐Sequencing of mitochondrial cytochrome b and ribosomal 28S genes. The cytochrome b gene am‐plification revealed 42 haplotypes including 30 indi‐vidual haplotypes. However the ribosomal 28S gene showed for the 75 sequences obtained, 30 haplotypes including 29 individual haplotypes. This prompted (Ndong et al., 2011) to question whether the gene is used to characterize strains Bruchinae. The polymorphism of these genes in addition to environmental factors to which C. maculatus popu‐lations' evolve, was perhaps due to the use of in‐secticides for cowpea storage. Since insecticides act on the airways by inhibiting the activity of monooxygenases (Ketoh et al., 1998), polymor‐phism of cytochrome b becomes much stronger because this gene plays a role in breathing. Plus the fact that insecticides affect the biological balance of the ecosystem cowpea beetles commodities have developed resistance phenomena due to the multiplicity, nature, dose and processing technique (Delobel et Tran., 1993). According to FAO studies in 2003, wetland farmers would use more insecti‐cides on crops because of the variety of pests that semi‐arid to arid zones. This would explain the large number of haplotypes found in Sudanian and Guinean zones. On the other hand, there is the sig‐nificant presence of other host plants of the natural weevil. These plants allow the beetle to survive better in the fields during the dry seasons. The Sa‐helian zone offers these special features. Formerly, this area was suitable for growing cowpeas but with the fall of precipitations, insects trying to adapt to new climatic conditions of the area and the introduction of improved varieties of cowpea. Millet is the only crop that matches the conditions of the Sahel (Guèye, 2011). Therefore, only the haplotypes that are better adapted to their chang‐ing environment are likely to survive. The sequence of bases in genes are therefore a function of envi‐ronment and conditions where live weevils. This is because several individuals’ haplotypes essentially consisted of individuals from the same agro‐ecological zone. The splicing of the two portions of genes 28S and cytochrome b also shows that there are mutations of nucleotide sequences for all from the three agro‐ecological zones sampled.
Sequence analysis of two genes shows that haplo‐type diversity is significant. Genetic distances within the areas are relatively lower than those between the areas except the Sudanian zone which constitutes the upper limit. The 28S with low ge‐
79
Mbar Tine et al., South Asian J Exp Biol; 3 (2): 71‐83; 2013
Clade 1
Clade 2 Clade 2
Clade 1
Sc3
Sc4 Sc2
Sc1
Sc1
Sc2
Sc3
100% Sahel 90% Soudan 75% Guinée
10% Soudan 17% Guinée
10% Soudan 17% Guinée
100% Sahel 90% Soudan 75% Guinée
Figure 12A: Phylogenetic tree obtained by the Neighbor Joining’s method of 28S gene rooted with Caryedon serratus. Figure 12B: Phylogenetic tree obtained by the Maximum Parsimony’s method of 28S gene rooted with Caryedon serratus.
80
Mbar Tine et al., South Asian J Exp Biol; 3 (2): 71‐83; 2013
Sc2
Sc5
Sc1
Sc4
Sc8
Sc3
Sc6
Sc7
Sc1
Sc3
Sc2
Sc9
Sc7
Sc10
Sc14
Sc1
Sc3
Sc2
Sc4’
Sc4
Sc8
Sc5
Sc6
Sc11
Sc12
Sc13
Clade 2
Clade 1
Clade 1
Clade 2
Clade 3
62% Sahel 70% Soudan 16.5% Guinée
35% Sahel 20% Soudan 67% Guinée
3% Sahel 12.5% Guinée
90% Sahel 85% Soudan 92% Guinée
10% Sahel 5% Soudan 4% Guinée
Figure 13A: Phylogenetic tree obtained by the Maximum Parsimony’s method of 28S and cytochrome b genes rooted with Caryedon serratus. Figure 13B: Phylogenetic tree obtained by the Maximum likelihood’s method of 28S and cytochrome b genes rooted with Caryedon serratus.

81
Mbar Tine et al., South Asian J Exp Biol; 3 (2): 71‐83; 2013
netic distances do not structure weevil populations. However, with a value of 0.031 between the Gui‐nean and the Sudanian area and 0.029 between the last and the Sahelian zone, cytochrome b gives more information on structuring bruchids accord‐ing to the areas in which they originate. These ge‐netic distances are nearly equal to the distance found by Sembène (2006) which is of the order of 0.035. This distance structures biotypes population of Caryedon serratus subservient to Piliostigma reticulatum, Bauhinia rufescens and Arachis hypo‐gaea from Senegal. The splicing of genes can con‐firm this structuring by its high values of genetic distances between the various areas sampled. All of which leads that geographical distance would have no effect on the Bruchinea’s structural but different haplotypes can be met within a biotype thus constituting different ecotypes (Diome et al., 2011). This is confirmed by the Mantel test indicat‐ing that the risk to reject the hypothesis that there is no correlation between genetic distance and geo‐graphic distance is 13.81%. Indeed, individuals of a species are often grouped naturally subject to dif‐ferent local evolutionary processes (natural selec‐tion, mutation, drift and migration) of different in‐tensities, resulting in distinct genetic compositions for each group. Thus, the variation in flowering time is evolving strategies related to crop adapta‐tion to different environmental conditions and therefore agro‐ ecological (Roux et al., 2006). Therefore, to ensure that the pest offspring adjust their life cycles in harmony with that of the host plant. This change in cycle induced by the genome gives each individual the ability to survive in the environment to which it evolves. It’s named co‐evolution. Thus approaching the individuals with whom he lives while away from other individuals who do not share the same agro climate. This is what makes the genetic diversity within the zones is small compared to the diversity between areas. However, Burkina Faso has a high variability possi‐bly due to the multiplicity of varieties grown and the fact that the authors suggest that this is the starting point of infestation by the cowpea weevil in Africa.
The cytochrome b phylogenetic reconstructions by parsimony showed two major clades. The same number of clades has been revealed on the ground‐nut bruchid (Caryedon serratus) by Ndiaye and Sembène (2011). The distribution of bruchid does not fully explain the structure revealed by the ge‐netic diversity parameters because although differ‐ent ecotypes are found in every country, it is clear
that there’s a significant gene flow between them. In this, is the fact that several genetically distinct populations may be more or less bound by the movement of individuals and thus form a meta‐population in which each population is influenced by other (Hanski and Simberloff, 1997), especially between the CILSS (Comité permanent Inter‐Etats de Lutte contre la Sécheresse dans le Sahel) mem‐ber country such as Burkina Faso, Mali, Niger and Senegal linked by trade. This is affirmed by the dis‐tribution of Niger individuals’ in the cladograms that have an affinity with individuals from Mali and Togo. Niger, a major producer of cowpea serves as a crossroads between West, East and North Africa by trade, is none the less significant importer of cowpea from Benin which is a country also practic‐ing trade with Togo (Adigoun, 2002). However, within a clade, it there’s an internal structure that can highlight the central role of agro‐ecological zone. This is true of the population of Tamba‐counda, which is encountered in a clade. This is explained by the fact cowpea in the eastern part of Senegal is mainly food and this place is very iso‐lated. This is more likely in the Guinean area where physical barriers (trees, rivers, etc.) play a role in the migration of the weevil. The country maintains trade links with Ivory Coast and Benin, which is a major producer of cowpea.
Weevils from different agro‐ecological zones of West Africa were genetically characterized by the technique of PCR‐Sequencing of mitochondrial cy‐tochrome b gene and ribosomal 28S gene. This helped get the weevils are divided into three clades for a total of 42 haplotypes for cytochrome b and 30 haplotypes for 28S. Individual haplotypes are more numerous in Guinean area.
Genetic diversity is much more pronounced in Su‐danian zone especially in Burkina Faso. This genetic diversity tends to give a structure of different populations of weevils in ecotypes because the ge‐netic distances separating the various areas are higher than those in areas and have very significant values.
The current study, verified by phylogenetic recon‐structions did stink be fully confirmed, but never‐theless it remains valid because the ecotypes‐groups are much more accentuate in the clado‐grams.
Diversity between populations of cowpea weevils from the same country and same locality worth studied for a better strategy of protection the
82
Mbar Tine et al., South Asian J Exp Biol; 3 (2): 71‐83; 2013
stocks of cowpea in the sub‐region:
By studying the genetic diversity of the C. maculatus’ populations according cowpea varieties grown in West Africa especially in Burkina Faso and Niger.
By studying the genetic diversity of C. macu‐latus’ populations indentured to different host plants.
Estimating differentiation, the genetic struc‐ture of populations, genes flow at different special scales by selectively neutral markers, and variables that are informative microsa‐tellite loci.
In determining populations of C. maculatus to design control methods other than the chemical method which is dangerous and expensive.
Acknowledgements
This publication was produced with financial sup‐port from IRD‐DSF and the International Founda‐tion for Science (IFS) and Observatoire Homme Mi‐lieu (OHM‐Tessékéré).
References
Adigoun FA (2002) Impact des traitements phytosanitaires du niébé sur l’environnement et la santé des populations : cas de Klouékanmé et de la basse vallée de l’Ouémé (Bénin). Mémoire de Maitrise Professionnelle Option Environnement. Université d’Abo‐mey Calavi.
Alzouma I (1995) Connaissance et contrôle des coléoptères Bruchi‐dae ravageurs des légumineuses alimentaires au Sahel. Sahel Inte‐grated Pest Management (I.P.M)/Gestion Phytosanitaire Intégrée. Revue Institut CILSS du Sahel 1: 2‐16.
Brink M, Balay G (2006) Ressources végétales de l’Afrique tropicale 1. Céréales et légumes secs. PROTA, Wageningen, Pays‐Bas / Back‐huys Publishes, Leiden, Pays‐Bas / CTA, Wageningen, Pays‐Bas. 328p.
Delobel A, Tran M (1993) Les Coléoptères des denrées alimentai‐res entreposées dans les régions chaudes. ORSTOM/CTA. pp : 312‐316.
Diome T, Ndiaye A, Ndong A, Doumma A, Sanon A, Ketoh GK, Sem‐bene M (2011) Genetic identification of West African ecotypes of the groundnut seed‐beetle Caryedon serratus Ol. (Coleoptera, Chrysomelidae). South Asian Journal of Experimental Biology 1 (2): 88‐93.
Diaw SC (1999) Evaluation de la résistance variétale du niébé (Vigna unguiculata L. Walp.) à Callosobruchus maculatus (F.). Mé‐moire d’Ingénieur Agronome : Productions Végétales. ENSA (Thiès/ Sénégal).
Dore MHI (2005) Climate change and changes in global precipita‐tion patterns: What do we know? Environment International 31
(8): 1166‐1181.
Excoffier L, Laval G, Schneider S (2005) Arlequin ver. 3.0: An inte‐grated software package for population genetics data analysis. Evolutionary Bioinformatics Online 1: 47‐50.
United Nations Organization for Food and Agriculture (2003) Ga‐rantir la sécurité sanitaire et la qualité des aliments. Directives pour le renforcement des systèmes nationaux de contrôle alimen‐taire. Rome 2003.
Felsentein J (1981) Evolutionary trees from DNA sequences: A maximum likelihood approach. Journal of Molecular Evolution 17:368‐376.
Fitch WM (1971) Toward defining the course of evolution: Mini‐mum change for a specific tree topology. Systematic and Zoology 20:406‐416.
Gueye MT, Seck D, Wathelet JP, Lognay G (2011) Lutte contre les ravageurs des stocks de céréales et de légumineuses au Sénégal et en Afrique occidentale : synthèse bibliographique. Biotechnology, Agronomy, Society and Environment 15(1): 183‐194.
Hanski I, Simberloff D (1997) The metapopulation approach, its history, conceptual domain and application to conservation. pp. 5‐26. In I. A. Hanski and M. E. Gilpin (eds.), Metapopulation Biology. Academic Press, San Diego, Californina.
Ketoh GK, Glitho IA, Nuto Y, Koumaglo HK (1998) Effets de six huiles essentielles sur les œufs et les larves de Callosobruchus maculatus F. (coleoptera : bruchidae). Revue CAMES. 00.
Ndiaye A, Sembene M (2011) Haplotypic diversity of West African populations of groundnut seed‐beetle, Caryedon serratus Ol. (Coleoptera, Chrysomelidae, Bruchinae): Results from geographical and DNA sequences data. Journal of Cell and animal Biology 5: 187‐195.
Ndiaye A, Gauthier P, Sembene M (2011) Genetic discrimination of two cowpeas (Vigna unguiculata L.) (Walp) Bruchid (Coleoptera, Chrysomelidae, Bruchinae): Callosobruchus maculatus (F.) and Bruchidius atrolineatus (PIC.). International Journal of Plant, Ani‐mal and Environmental Sciences 1:196‐201.
Ndong A, Diome T, Thiaw C, Ndiaye A, Kebe K, Douma A, Ketoh G, Sanon A, Sembene M (2011) Several haplotypes of groundnut (Arachis hypogaea L.) seed‐beetle, Caryedon serratus Ol. (Coleoptera: Chrysomelidae, Bruchinae), in West Africa: Genetic identification using 28S sequences. African Journal of Biotechnolo‐gy 10 : 11409‐11420.
Ngamo LST, Hance T (2007) Diversité des ravageurs des denrées et méthodes alternatives de lutte en milieu tropical. Tropicultura 25: 215‐220.
Roux F, Touzet P, Cuguen J, Corre VL (2006) How to be early flow‐ering: an evolutionary perspective. Trends in Plant Science 11: 1360‐1385.
Rozas J, Rozas R (2005) DnaSP version 4: an integrated program for molecular population genetics and molecular evolution analysis. Bioinformatics 15: 174‐175.
Saïdou A‐A (2011) Etude moléculaire, évolution et caractérisation de gènes impliqués dans l’adaptation du mil (Pennisetum glaucum [L.] R. Br.) aux changements climatiques. Thèse de doctorat en Evolution, Ecologie, Ressources génétiques Paléontologie. Sup Agro Montpellier.
Saitou N, Nei M (1987) Neighbor‐joining Method. Molecular Biolo‐gy and Evolution 4 : 406‐425

83
Mbar Tine et al., South Asian J Exp Biol; 3 (2): 71‐83; 2013
Seck D (1994) Développement de méthodes alternatives de contrôle des principaux insectes ravageurs des denrées emmagasi‐nées au Sénégal par l’utilisation de plantes indigènes. Thèse de doctorat, Faculté des sciences Agronomiques de Gembloux (Belgique).
Sembene M (2000) Variabilité de l’Espaceur Interne Transcrit (ITS) de l’ADN ribosomique et polymorphisme des locus microsatellites chez la bruche Caryedon serratus (Olivier) : différenciation en ra‐ces hôtes et infestation de l’arachide au Sénégal. Thèse de Docto‐rat d’Etat en Sciences Université Cheikh Anta Diop, 180p.
Sembene M (2006) The origin of groundnut infestation by the seed beetle Caryedon serratus (Olivier) (Coleoptera: Bruchidae): Results from cytochrome b and ITS1 gene sequences. Journal of Stored Products Research 42: 97‐111.
Thompson J, Higgins D, Gibson T (1994) CLUSTAL W: improving the sensitivity of progressive multiple sequence alignment through sequence weighting, position‐specific gap penalties and weight matrix choice. Nucleic Acids Research 22: 4673‐4690.