south dakota department of education ... -...
TRANSCRIPT

South Dakota Department of Education Accountability and School Performance Index
Technical Manual
2018-19 School Year

Updated July 22, 2019
2
Contents Chapter 1: Accountability System/School Performance Index Overview ..................................................... 4
Introduction to SD-DOE Accountability System ....................................................................................... 5
School Performance Index ........................................................................................................................ 6
Confidentiality: Protection of Student Information on Public Reports (N-Size of 10 Rule) ..................... 7
FAY Definition and Rules .......................................................................................................................... 8
Federally Recognized Student Groups ...................................................................................................... 8
Gap and Non-Gap Subgroups ................................................................................................................... 8
Subgroup Membership ........................................................................................................................... 10
Federally Recognized Subgroups ....................................................................................................... 10
Special Education Subgroups: ............................................................................................................ 13
Participation Rules for Testing ................................................................................................................ 15
State All-Assessed Report ....................................................................................................................... 17
Small Schools .......................................................................................................................................... 18
Special Schools ........................................................................................................................................ 19
New Schools ........................................................................................................................................... 20
Feeder/Receiver Schools ........................................................................................................................ 21
SPI Points Details ................................................................................................................................ 21
District/State Level Data Rules and Details for Feeder/Receiver Schools ......................................... 23
School Support Classification for Feeder/Receiver Schools ............................................................... 23
Redistribution of SPI Points .................................................................................................................... 27
Chapter Two: The Elementary and Middle School Accountability System ................................................. 30
Indicator #1: Student Performance ........................................................................................................ 31
Indicator #2: Student Progress ............................................................................................................... 36
Indicator #3: English Language Learners Progress ................................................................................. 38
Indicator #4: School Environment (Attendance) .................................................................................... 46
Earning SPI Points ............................................................................................................................... 46
Chapter Three: The High School Accountability System ............................................................................. 50
High School Accountability System Indicators ....................................................................................... 51
Indicator #1: Student Performance ........................................................................................................ 51
Indicator #2: On-Time Graduation Rate (4-yr adjusted cohort) ............................................................. 51
Indicator #3: High School Completion .................................................................................................... 54
High School Completer Rate Calculation Procedures ............................................................................. 54
Dropout Definition ............................................................................................................................. 54

Updated July 22, 2019
3
Dropout Rules ..................................................................................................................................... 54
GED Rules ........................................................................................................................................... 54
Indicator #4: College and Career Readiness ........................................................................................... 56
Indicator #5: English Language Learners Progress ................................................................................. 61
Chapter Four: Additional Reported Data (Enrollment Demographics, Office of Civil Rights Data Elements and Postsecondary Education Data) ........................................................................................................... 62
Additional Data Required by ESSA .......................................................................................................... 63
Enrollment Demographics Data and Sources ......................................................................................... 63
Postsecondary Enrollment Rates ............................................................................................................ 67
Chapter Five: Educator Qualifications ........................................................................................................ 70
Educator Qualifications .......................................................................................................................... 71
Chapter Six: Long Term Goals ..................................................................................................................... 87
SDDOE Accountability Goals ................................................................................................................... 88
I. Long Term Goals ............................................................................................................................. 88
Goals by Indicator ................................................................................................................................... 88
Chapter Seven: Equity Report ..................................................................................................................... 91
The Equity Report ................................................................................................................................... 92
Disproportionate Rates of Access to Educators ...................................................................................... 92
Chapter Eight: School Support Identification, Classifications and Supports .............................................. 97
School Support Identification ................................................................................................................. 98
Chapter Nine: Preparing the Data ............................................................................................................. 103
Preparing the Data ................................................................................................................................ 104
Chapter Ten: Timeline and Appeals Process ............................................................................................. 109
Setting the Report Card Timeline ........................................................................................................ 110
Things to Consider ........................................................................................................................... 110
End of Year Checklist and Memo for Districts .................................................................................. 111
Formal Appeals ..................................................................................................................................... 112
2019 ARC Timeline ................................................................................................................................ 113
Appendix A: Accountability Rounding Rules ............................................................................................. 115

Updated July 22, 2019
4
Chapter 1: Accountability System/School Performance Index Overview

Updated July 22, 2019
5
Introduction to SD-DOE Accountability System The state transitioned to the new requirements under Every Student Succeeds Act (ESSA) for the 2017-2018 school year report card. The ESSA State plan was approved by the US Department of Education in January 2018. Minor revisions made by SDDOE in March 2019 are reflected in this document. Updates to ESSA Guidance made in March 2019 are integrated into this manual.
South Dakota’s accountability model takes a thoughtful, balanced approach to defining the indicators of a strong education system. Rather than focusing almost exclusively on student proficiency on a single assessment, it encompasses multiple indicators that are critical pieces in preparing students for the rigors of a 21st century world. The accountability system holds schools accountable through annual public reporting and classification based on school performance. The model is used to inform school leaders, teachers and the public as to how schools are progressing. With its emphasis on continuous improvement, it sets a high bar for ongoing reflection and goal setting. The accountability system shall apply to all public schools whose primary purpose is to provide academic instruction. Schools will follow policies and procedures in state Administrative Rule to define the grade spans of elementary, middle, and high school.
Administrative Rule 24:55:01:04. Public school accountability system defined. For purposes of this article, the term, accountability system, means a system established by the state to ensure that all public schools make yearly progress in continuously and substantially improving the performance of their students and make yearly progress in increasing the quality of instruction and leadership. The accountability system shall:
1. Be implemented and administered for all public schools through department policies and procedures consistent with SDCL 13-3-62 to 13-3-69, inclusive, and the requirements of this article;
2. Be based upon the content standards in English language arts and mathematics approved by the Board of Education Standards;
3. Include measurements of student achievement in English language arts and mathematics based on the state academic assessment;
4. Include four levels of student achievement for English language arts and mathematics, as referenced in SDCL 13-3-66, that are based on mastery of the content standards as measured by academic achievement tests, with cut scores for each level established by the department;
5. Include multiple indicators of public school performance; 6. Include annual measurements and public reporting based on the data collected
pursuant to SDCL 13-3-51; and 7. Include a system of classification, sanctions, rewards, and recognition

Updated July 22, 2019
6
School Performance Index While other information is publicly reported on the report card, South Dakota’s accountability system is based on a 100-point index, called the School Performance Index (SPI), consisting of multiple indicators, each assigned a numeric value. These values are summed to create a total SPI score out of 100 points. Two distinct indexes will be used: one for high school (secondary) accountability, and one for elementary and middle school (pre-secondary) accountability. Elementary and Middle School SPI Points Distribution:
Indicator Maximum Points Possible
Acad
emic
Indi
cato
rs
Student Achievement Math 20
English Language Arts 20 Total 40
Academic Growth English Language Arts – All Students 10 Math – All Students 10 English Language Arts – Lowest Quartile 10 Math – Lowest Quartile 10
Total 40 English Language Proficiency
10
School Quality 10 Total 100
Administrative Rule 24:43:01:01, a school is defined as “a public or nonpublic organization or entity which is approved or accredited by the secretary for the purpose of instructing children of compulsory school age as provided in SDCL 13-27-1 or for children attending school as provided in SDCL 13-13-1, or both.” The following definitions also apply: • "School, elementary," a school consisting of any combination of grades from kindergarten
through eighth grade; • "School, public," a school operated by a school district; • "School, secondary," a school consisting of any combination of three or more consecutive
grades, including ninth grade through twelfth grade; • "School system," all of the schools and supporting services operated by a governmental
agency or by any private organization; • "School, middle," a school consisting of any combination of two or more consecutive
grades, five through eight.

Updated July 22, 2019
7
High School SPI Points Distribution:
Confidentiality: Protection of Student Information on Public Reports (N-Size of 10 Rule) South Dakota has long used an N-size of 10 students to publicly report and hold schools accountable. This established number has been demonstrated through research and peer review as effective in complying with the Family Educational Rights and Privacy Act (FERPA) to protect student information. For the purposes of protecting student information, suppression is applied to public reporting when the subgroup has fewer than 10 students. Accountability uses an asterisk (*) to denote suppression when the N-size of a subgroup is fewer than 10. The exception to the N-size rule of 10 is the reporting of Office of Civil Rights/CDRC data which is publicly accessible data and the demographic data that is sourced from the Fall Enrollment Census Count. SDDOE does not use suppression for private, secure reporting available to districts and schools in SD-STARS.
Additional Suppression Rules South Dakota uses additional suppression rules to further provide protection against disclosure or identification of an individual student’s outcomes. The N-size of 10 students will apply to All Students and each subgroup. This rule allows for inclusion of many small schools. Using an N-size greater than 10 students would exclude many schools from accountability and would decrease transparency in the state. These rules are:
• Suppression of small group outcomes, suppression of complementary group outcomes, and suppression of small category outcomes.
• Suppression is also applied in the case of all students in a subgroup having the same student achievement level (across all indicators) have a rate that is below 7% (range is 0% to 6.9999%).
Indicator Maximum Points Available
Acad
emic
Indi
cato
rs Student Achievement Math 20
English Language Arts 20 Total 40
Four-Year Cohort Graduation 12.5
College and Career Readiness 25
English Language Proficiency 10 High School Completion 12.5 Total 100
Administrative Rule 24:55:07:05. Student group size. To conform with the requirements of the Family Educational Rights and Privacy Act, 20 U.S.C. § 1232g, 34 C.F.R. Part 99 (March 8, 2012), the department shall use a minimum group size of 10 students for each student group of § 24:55:01:05 when publicly reporting accountability results. If a student group has fewer than 10 students, that group's accountability results may not be publicly reported. The department may not report student group results if all of the students in a group have the same student achievement level as defined in § 24:55:01:04(4).

Updated July 22, 2019
8
• Where suppression is applied in the report card, the message in the report card will read: “In accordance to South Dakota Department of Education’s suppression rules, this information is not available.”
FAY Definition and Rules Full Academic Year (FAY) is defined as a student enrolled from October 1 through May 1 with an enrollment gap of no more than 15 consecutive school days. If either of these dates fall on a weekend or holiday, the next business day will apply. This assures the annual progress of a student is attributed to a single school. The statewide student information management system makes it possible for the SDDOE to track and determine that students test in only one school. FAY is applied in four SPI indicators: Student Performance, Student Progress (only in the current year), English Language Learner Progress, and Attendance. State academic assessment scores of FAY students are also used for setting school-level Long Term Goals. FAY is calculated at three levels: school, district, and state. Students will be FAY across school, district, and state levels if they don’t move during the year. Students who move during the year may not count at school-level or district-level depending on where they moved. Federally Recognized Student Groups SDDOE will report and base accountability decisions on the following federally recognized student groups, also noted as subgroups in this manual.
Gender Race/Ethnicity Program Participation Female American Indian/Alaska Native English Learners Male Asian Economically Disadvantaged Black/African American Foster Care Hawaiian/Pacific Islander Homeless Hispanic/Latino Migrant Two or More Races Military Connected White/Caucasian Students with Disabilities
Gap and Non-Gap Subgroups In additions to the above accountability subgroups, South Dakota also uses the super subgroups of Gap and Non-Gap. The Gap group was conceived as a means of improving transparency in public reporting. Defining the Gap group has resulted in schools across South Dakota reporting information for an additional 1,052 subgroups. A student is only counted once – either as one Gap group student or as one Non-Gap group student. The performance of students in each subgroup was compared to the performance of the All Students group. Those groups that performed consistently under the All Students group became part of the Gap group; those that performed above comprised the Non-Gap group.
South Dakota’s Gap group combines the following historically underperforming subgroups:
• American Indian/Alaska Native • Black/African American
• Economically Disadvantaged • English Learners

Updated July 22, 2019
9
• Hispanic/Latino • Students with Disabilities
The following subgroups make up the Non-Gap group:
• Asian • Native Hawaiian/Pacific Islander
• Two or More Races • White/Caucasian
The Gap group composition was calculated based on the achievement results from the 2008-09, 2009-10, and 2010-11 school years. The department re-ran results following issuance of the 2014-15 Report Card and determined that the Gap group composition should remain the same. The composition of the Gap group will be re-examined every five years, based on the previous three years’ performance. Following implementation of ESSA, SDDOE will next reexamine the Gap group composition following the 2019-20 school year. How exactly does the use of the Gap and Non-Gap groups increase transparency? South Dakota suppresses based on the N-size of 10 Rule. Any group with fewer than 10 members is not published on the public report card. (That data does remain available to schools and districts through a secure private report card). A school with 100 students might break out like this:
• American Indian/Alaska Native: 9 • White/Caucasian: 55 • Asian: 9 • Black/African American: 9 • Hispanic/Latino: 9 • Two or More Races: 9
• Economically Disadvantaged: 9 • English Learners: 2 • Students with Disabilities: 5 • All Students: 100
In this scenario, two subgroups, All Students and White/Caucasian, are the only ones with more than 10 members, and, therefore, the only groups whose data would be publicly reported. That means 45 percent of the school’s students would not have their data publicly reported, and their performance would essentially be masked. Here is what happens when the Gap group and Non-Gap groups are considered:
• American Indian/Alaska Native: 9 • Asian: 9 • Black/African American: 9
• Economically Disadvantaged: 9 • English Learners: 2 • Students with Disabilities: 5
• Hispanic/Latino: 9 • Two or More Races: 9
• All Students: 100 • Gap group (unduplicated count): 50
• White/Caucasian: 55 • Non-Gap group (unduplicated count): 50 With this scenario, 45 percent of students left out of the first example are counted and reported via the super subgroup – which includes an unduplicated count of the students represented in the Black/African American, Hispanic/Latino, American Indian/Alaska Native, Economically Disadvantaged, and Students with Disabilities subgroups. Although the public cannot access how individual subgroups within the Gap group fared in the example above, creating this super subgroup provides more transparency than the previous comparison, which

Updated July 22, 2019
10
was limited to White/Caucasian versus the All Students group. Again, the super subgroup increases transparency to allow SDDOE to report on the performance of more students. SDDOE will continue to publicly report on all subgroups with an N-size of 10 or more, in addition to the Gap and Non-Gap subgroups. DOE End of Academic Year Process for Database Systems used for Accountability School districts are required to have their year-end data finalized no later than the 2nd Friday in June of each year. Data needed for the report card is pulled after this date and after the DOE has had a chance to verify the data. Where May 1st is listed in the tables below it does not mean the data was pulled from Infinite Campus on May 1st. Rather it means that the report card looks at the data after the year-end sign off and determines what was true for the student as of May 1st. Race and gender do not have any dates associated with it. For these subgroups, the report card looks at the student’s enrollment as of May 1st to see how the student is identified.
Subgroup Membership Federally Recognized Subgroups Below is a table that summarizes the subgroup definition and/or identification date.
Student Subgroups SPI Roster Definition Other Notes Female All rosters Gender as of May 1st Male All rosters Gender as of May 1st American Indian/Alaska Native
All rosters Race as of May 1st
Asian All rosters Race as of May 1st Black/African American
All rosters Race as of May 1st
Hispanic/Latino All rosters Race as of May 1st Native Hawaiian/Pacific Islander
All rosters Race as of May 1st
Two or More Races All rosters Race as of May 1st White/Caucasian All rosters Race as of May 1st Economically Disadvantaged
All rosters Student received free or reduced-price lunch record at any point in the year, including if the student had a prior year
Administrative Rule 24:17:03:02. Student data submission. The due date for submission of the fall student data through the student information system is 15 days following the last Friday of September of each school year. State aid fall enrollment count is final on the last business day of October and no additional students may be added after this date but may be removed if found to be reported in error. The December child count data is due 10 days following December 1 of each school year. If a due date falls on a weekend or state holiday, the due date is the next business day following the scheduled due date. The final student record forms for each school year must be submitted no later than the second Friday in June of each school year.

Updated July 22, 2019
11
Student Subgroups SPI Roster Definition Other Notes record that has an end date in the current year OR If the student attended a school identified as CEP OR Provisional based on the list provided by CANS at any point in the year
English Learners • Student Performance • Student Progress • Participation • All Assessed Proficiency • Attendance • High School Completion • On-Time Graduation • College and Career
Readiness
Student had an active EL record at any point in the year except those who exited EL as “misidentified” OR Students was identified as 1st or 2nd year monitoring except those who are 1st or 2nd year monitoring who exited EL as “misidentified”
• English Language Learners Progress
Student had an active EL record at any point in the year except those who exited EL as “misidentified”
Foster Care All rosters Student was identified as in foster care at any point in the year
DOE receive two files from DSS that identifies foster students.
Homeless All rosters Student had homeless record at any point in the year
Migrant All rosters Student was identified as migrant at any point in the year
Military Connected All rosters Student was identified as military connected at any point in the year
Students with Disabilities
• Student Performance • Student Progress • Participation • All Assessed Proficiency
Special Ed status as of May 1
• Attendance • High School Completion • On-Time Graduation • College and Career
Readiness
Special Ed status as of May 1

Updated July 22, 2019
12
Student Subgroups SPI Roster Definition Other Notes • English Language
Learners Progress Gap • Student Performance
• Student Progress • All Assessed Proficiency • Participation
If the student is identified to any of the following student subgroup in the roster, then they are identified as gap: economically disadvantaged, students with disabilities, English learners, Hispanic/Latino, American Indian/Alaska Native, and Black/African American
Even though the EL subgroup includes 1st and 2nd year monitoring students, monitoring EL students will not affect the Gap flag. In other words, only active EL affects the Gap flag.
• Attendance • High School Completion • On-Time Graduation • College and Career
Readiness • English Language
Learners Progress
If the student is identified to any of the following student subgroup in the roster, then they are identified as gap: economically disadvantaged, students with disabilities, English learners, Hispanic/Latino, American Indian/Alaska Native, and Black/African American
Even though the EL subgroup includes 1st and 2nd year monitoring students, monitoring EL students will not affect the Gap flag. In other words, only active EL affects the Gap flag.
Non-Gap • Student Performance • Student Progress • All Assessed Proficiency • Participation
If the student is identified to any of the following student subgroup in the roster, then they are identified as non-gap: White/Caucasian, Two or more races, Asian, Hawaiian/Pacific Islander
Even though the EL subgroup includes 1st and 2nd year monitoring students, monitoring EL students will not affect the Gap flag. In other words, only active EL affects the Gap flag.
• Attendance • High School Completion
If the student is identified to any of the following student
Even though the EL subgroup

Updated July 22, 2019
13
Student Subgroups SPI Roster Definition Other Notes • On-Time Graduation • College and Career
Readiness • English Language
Learners Progress
subgroup in the roster, then they are identified as non-gap: White/Caucasian, Two or more races, Asian, Hawaiian/Pacific Islander
includes 1st and 2nd year monitoring students, monitoring EL students will not affect the Gap flag. In other words, only active EL affects the Gap flag.
English Learner Subgroups In addition to the above subgroups, further refined subgroups are required under ESSA for the English learner subgroup. The subgroups are noted below.
English Learner Subgroups
SPI Roster Definition Other Notes
On Track EL English Language Learners Progress
Active EL
EL All SPI indicator rosters Active EL Long-term EL All SPI indicator rosters Has been an active EL for 5 or
more years
Former EL All SPI indicator rosters Coded monitoring years 1-4, except those who exited due to misidentification
SWD EL All SPI indicator rosters Dually identified Special Ed/EL
Sometimes students are mistakenly identified as EL. In these situations, the EL record in Infinite Campus is exited with the reason of “Exited EL due to EL Misidentification.” When a student exits, Infinite Campus automatically populates the first through fourth year monitoring dates. Therefore, even if the student had an EL record and even if the student has monitoring dates, students who exit due to “misidentification” will not be identified for the EL subgroup nor any of the English Learner Subgroup for any roster. In addition, since EL is a subgroup included in the Gap flag, the EL record for students who exit due to “misidentification” should not impact the Gap flag. Special Education Subgroups: The Special Education program also needs to break down special education subgroup into smaller groups based on the assessment the student took and whether the student received accommodations.

Updated July 22, 2019
14
Special Ed Subgroups SPI Roster Definition Other Notes
Assessment Accommodations Regular With no
accommodations Participation All Assessed Proficiency
Students identified as Special Ed status as of May 1 using the state SIS (ICSE) data extract from the second Friday in June, who also are noted in the test file with no accommodations
With Accommodations
Participation All Assessed Proficiency
Students identified as Special Ed status as of May 1 using the state SIS (ICSE) data extract from the second Friday in June, who also are noted in the test file with accommodations
Alternate Participation All Assessed Proficiency
Students identified as Special Ed status as of May 1 using the state SIS (ICSE) data extract from the second Friday in June, and who took the alternate assessment

Updated July 22, 2019
15
Participation Rules for Testing ESSA mandates that all students must participate in statewide assessments (ESSA 1111 (b) (2)(A) & (B) (i) (I), (II)). These statewide assessments are:
South Dakota English Language Arts Assessment (SD-ELA) or South Dakota English Language Arts Alternate Assessment (SD-ELA Alt) South Dakota Math Assessment (SD-MATH) or South Dakota Math Alternate Assessment (SD-MATH Alt)
Students in South Dakota also take the South Dakota Science Assessment (SD-SCI) or the South Dakota Science Alternate Assessment (SD-SCI Alt)
Administrative Rule is at least 95% of all students will be assessed including 95% of students in a subgroup who are enrolled in a tested grade. Schools must meet the 95% participation requirement in the current year to receive points for the student performance key indicator and for a school to meet its Long-Term Goals. Meeting the 95% participation rule means testing at least 95% (94.50% with rounding) of students enrolled in the school as of May 1. Calculating the Participation Rate The participation rate is calculated using the total enrollment of eligible students (denominator) and the number of students who have valid test scores (numerator).
• An eligible student is one that is enrolled in the school as of May 1 for ELA, math and science. • Only students who are enrolled more than 50 percent at a school or district will be counted in
the participation rate for that school or district. • The participation rate calculation is based on the all-assessed student count (Not FAY student
count). • The participation rate is calculated separately for the state, each school, and each subgroup. • If a student moves during the testing window and has not yet been tested, the receiving school
is obligated to test the student. • Students who tested at their previous school and have moved to a new school during the testing
window are not required to retest. • Invalidated test scores will count in the denominator for the participation rate calculation
Administrative Rule 24:55:07:02. At least 95 percent assessed. A school shall administer the state academic assessment to at least 95 percent of the students and 95 percent of students within a student group who are enrolled in the tested grades for the state academic assessment on May 1. If a school fails to administer the state assessments to 95 percent of students or of the members of a student group, those students necessary to be counted to reach 95 percent shall receive a value of zero in calculating the student achievement key indicator.

Updated July 22, 2019
16
Calculation Numerator = *Count of students with valid scores
Denominator = Count of eligible students enrolled as of May 1
*Count of students tested includes all students who attempted to take the test by logging in and attempting both portions of the test for ELA or math.
The percent not participating is calculated as: 1 minus the participation rate (ex. If there is a 98% participation rate this would be:
1- 0.98 =.02 or 2% not participating in testing
Participation impacts the SPI points. Schools not meeting the 95% participation rule will receive zero points for the portion(s) of the indicator (math and/or English language arts) for which they did not meet the 95% participation in testing rule. Additional Details Students with Disabilities
• Students who qualify for the alternate assessment in one subject area should be assessed on the alternate assessment in all (math, ELA, science) subject areas.
• If a student takes the South Dakota Math Alternate Assessment but does not take the alternate assessment for ELA, that student will be counted in the denominator for both ELA and Math, but only in the numerator for Math.
• If the student takes the South Dakota Math Alternate Assessment but takes the South Dakota English Language Arts Assessment for ELA, that student will be counted in the denominator for both ELA and Math, but only in the numerator for Math.
First year in Country Students A special participation exemption is granted for students who are English Learners (ELs) and in their first year of enrollment in the United States (First Year in Country students) for the ELA portion of the state assessment only. Rules are listed below.
• Must be an identified EL student who has not attended schools in the United States for more than 12 months (Puerto Rico students are included if they are identified as EL).
• Student is first year in country if a student is EL and first entered the United States between May 2 of the previous spring and May 1 of the current school year.
• Must take ACCESS 2.0 if enrolled during the testing window to get the first-year exemption from the ELA portion of the state assessment.
• If student arrives after ACCESS 2.0 testing window the school needs to administer the WIDA screener.
• FYIC students are reported in participation rate calculation for the all-assessed report.

Updated July 22, 2019
17
Participation Exemptions for Medical Emergency SDDOE considers exemptions for students who are not able to test in state assessment/s due to an emergency medical situation. Documentation of the medical emergency is required for a medical exemption to be granted. Students granted a medical exemption are removed from both the numerator and the denominator of the participation calculation. Medical Exempt Approval Process
• District administrators will notify DOE’s Assessment office and provide documentation of the student’s emergency medical situation that resulted in their inability to take a state assessment/s.
• DOE’s Assessment office will provide information to SSARS team members to review and approve or deny exemptions based on a case-by-case review.
• DOE’s Assessment office will follow up with districts on the approval or denial of the exemption (letter to district).
• Assessment office will provide a data file with student ID, district ID, school ID to Accountability and vendor for the approved exemptions.
• Accountability will add medically exempt student data to the overrides data file that is shared with the vendor.
• Vendor uses the overrides file to make changes to the report card data. • Assessment office will work with Accountability to validate medical exempt students flagged in
data reports and rosters.
State All-Assessed Report In addition to calculating and reporting accountability results, South Dakota is also required to produce a State Assessment Report, otherwise known as the “All-Assessed Report.”
Administrative Rule 24:55:07:11. Participation of students who are English learners. A student who is an English learner and in the student's first year of enrollment in a school in the United States is not required to take the state academic assessment in English language arts, if the student has participated in the annual test of English language proficiency as referenced in 20 U.S.C. 6311 (2015). Participation in the annual test of English language proficiency meets the requirement of 95 percent participation referenced in § 24:55:07:02. A student is exempt from only one iteration of the state academic assessment in English language arts. If a student who is an English learner enrolls for the first time after the testing window for the English language proficiency test has ended, the student counts toward the requirement of 95 percent participation in English language arts referenced in § 24:55:07:02 by completing the English learner eligibility assessment. A student who is an English learner and in the student's first year enrolled in a school in the United States is required to take the state academic assessment in mathematics. The results are not included in the calculation of the student achievement SPI key indicator. However, the student counts toward the requirement of 95 percent participation as referenced in § 24:55:07:02.

Updated July 22, 2019
18
Student data included in the All Assessed calculation is the same as Accountability (math, ELA) minus the Full Academic Year (FAY) requirement. The All-Assessed Report includes the current-year scores of all students enrolled for more than 50% in the school/district/state as of May 1 who completed an assessment.
• Reports must be generated for each public school, district and state to include the N-size. Standard N-size suppression rules apply.
• Data must be reported for each subgroup and testable grade level (3-8 and 11) served by the school or district.
• The student's enrollment status as of May 1 indicates how the student is reported for the school, district, and/or the state.
• A student’s subgroup participation is determined based on the rules outlined in Chapter 1. • The All-Assessed Report is not created for Feeder schools, which have no tested grades. • Assessment data is from the current-year South Dakota Assessments and South Dakota
Alternate Assessments. • The All-Assessed Report should also include comparisons to prior year performance for each
subject and grade, where available. • The All-Assessed Report includes data for each level of performance.
Percent Not Tested The percent of students not tested must be calculated and reported for all reporting categories. The inverse of the percent not tested should equal the participation rate. Small Schools A small school or district is defined as having fewer than 10 students tested over three years. The basis of this designation is the school or district is deemed to not have enough data points to evaluate using statistical methods alone and is evaluated using an audit process.
Audit Method
1. Schools with fewer than 10 students tested over three years are identified by conducting a data analysis of all public schools in the state.
2. The small schools list is added to a tab in the annual Master Spreadsheet file; and the school type is added to the all schools tab as well.
3. If a small school is also identified as a special school, it will remain on the special school list and be removed from the small school list.
4. Schools designated as small will be evaluated by a SDDOE cross-divisional team. The team will evaluate the school’s performance over the past three years to identify trends. For the accountability indicators that can be examined, such as attendance, standardized data will be
Administrative Rule 24:55:07:06 Insufficient group size. Accountability determinations for public schools may not be required if the number of students in a group is insufficient to yield statistically reliable information, or the results would reveal personally identifiable information about an individual student. Schools with fewer than ten students tested over the three years considered for student achievement must undergo a small school audit process to determine progress towards academic goals.

Updated July 22, 2019
19
examined. The teams will also evaluate three years of the additional data to evaluate the school against the criteria established through the application process. Should promising or concerning trends become evident through this individualized examination, small will be eligible for school improvement designation.
Special Schools Schools scattered throughout the state meet unique needs and challenges of students beyond a student’s education such as schools that are tending to the needs of students with the most severe disabilities, schools structured to attend specifically to behavioral needs of children with the intent of preparing them to be ready to re-enter traditional buildings, or schools focusing on English Language acquisition for students who have recently arrived in the country with the express purpose of building up English skills rapidly so that students acquire the baseline English skills needed to enter the traditional classroom. It is inappropriate or even impossible to apply the rules of the SPI process as laid out above to these schools. Yet SDDOE continues to ensure that these schools are not forgotten in overall accountability through the Small and Special School Audit process, a process run annually. Administrative Rule 24:55:07:16 provides guidance on designating special school status.
Students Attending Unique Facilities: In certain circumstances, students attend institutions whose mission is not primarily education, but rather to address unique needs students may have (i.e., behavioral, incarceration, etc.).
• Where district controls the enrollment of a student in the program-students are counted at both school and district levels through the special school audit.
• Where district doesn’t control the enrollment, students are counted at both state and school levels through the special school audit; i.e., state placement students are counted only at the state.
Special School Definition
Administrative Rule 24:55:07:16. Special considerations. For accountability purposes, students are assigned as follows: (1) If a student is placed at any of the following, with tuition paid by an entity other than the resident district, the student is counted only at the state level: (a) An attendance center or program other than an attendance center in the district; (b) A private, nonprofit facility; (c) A state or privately-operated school, and the placement was made by the Unified Judicial System, Department of Corrections, Department of Social Services, or another state agency authorized to place students; or (d) Out-of-state students placed in a South Dakota facility to serve the special needs of the student; (2) If a student is placed at an alternative school as an academic extension of the public school, the student is counted at the resident school; or (3) If a student attends the South Dakota School for the Blind and Visually Impaired or the South Dakota School for the Deaf, the student is counted at the resident district and the state level, but not at the school level.

Updated July 22, 2019
20
Special Schools are: Schools serving special populations for whom an accountability determination could not otherwise be made will be determined on a case-by-case basis using the special school audit process. DOE Audit Process
1. A team of representatives from across SDDOE will review and evaluate the school’s performance using up to three years to see if there are any promising or concerning trends that may make them eligible for this designation.
2. Additional data points will be identified to review (i.e., local assessments of English Proficiency gains for a school catering to the acquisition of English and transition to the general classroom for newly arrived Els; or transition plan completion data for a school operating solely to meet the special education transition needs of their students).
3. If school is deemed eligible based on the team’s review, DOE’s Title I team will contact the superintendent with an invitation to apply for special school status.
a. Through the application, the superintendent will outline the mission of the school, how the school can or cannot meet traditional accountability requirements, and how the district would propose SDDOE hold the school accountable.
4. A cross-divisional team (SSARS) at SDDOE will review and determine which schools that apply for special school status will be approved.
5. Once a school successfully receives a “special” designation, that designation will remain with the school for three years.
6. School improvement designation will be established based on the team’s recommendation if within the three years the school’s performance has not improved.
DOE will follow the same audit process for any school or district requesting special school status that is eligible. Report Card Details for Small and Special Schools Schools and districts designated as small and special schools will receive Accountability indicator data, long term goals, and other accountability data in a private report card. While these schools and districts will not be ranked or rated with other schools in the state on the SPI index, small and special schools will be able to see the SPI points by indicator in their private report cards (only district administrators with permissions to access school and district data will be able to review data reported in the private report card data). The public report card will show only Contact Information for these schools. Also, a list of small and special schools will be publicly reported on the SDDOE website. New Schools A new school is defined as:
1. A public school that is in its first year of operation and has no historical connection to an existing school.
2. Or is a public school where 50 percent of the student population of the school building – or grade spans tested in that building - has been removed and replaced with students from another school within the district.

Updated July 22, 2019
21
Regardless of the changes made in student population, a school identified as CSI, TSI or ATSI is not eligible for a new school status while in the identified classification (see Chapter Four). In the event two or more schools join in which either has been identified as a CSI, TSI or ATSI school, the school support classification will be applied to the restructured school. If a CSI, TSI or ATSI school joins with a progressing, status, or reward school, resulting in more than 50 percent of the student body in the “new” school coming from the CSI, TSI or ATSI school, the “new” school will adopt a CSI, TSI or ATSI classification. In all other instances, the first year of the newly restructured school will become its first accountability status year. In a case where two or more districts consolidate, prior status for all districts and schools involved will be void. The newly formed district and its schools will obtain their first status and Long Term Goals targets based upon assessment results of the first full year of operation. When Progress is added as a component in the SPI process, the Student Performance Indicator will be weighted more heavily to account for the SPI points associated with student Progress at new schools. A school cannot receive Progress points until two years of assessment data is available. Feeder/Receiver Schools Schools with no tested grades serve PK-2 grades. If a school has no tested grades, it will be designated as a “Feeder School.” Feeder Schools will then be paired with a school that has tested grades and into which the majority of the Feeder School’s students enroll. The paired school will be designated as a “Receiver School.” SPI Points Details When that Feeder/Receiver relationship is established, these rules should apply towards calculating Student Performance and Progress.
• Feeder Schools will receive the SPI points of their Receiver Schools for Student Performance. The Report Card will report math and ELA proficiency rates for Feeder School from its Receiver School.
• Feeder School will report the Receiver School’s Student Progress unless the Receiver School does not provide services past 3rd grade since Student Progress calculations require two years of assessment data. In this case, both Feeder and Receiver schools will display a “data not available” message on Student Progress page.
For other indicators: • Attendance points should not be combined. Each school shall maintain its own separate
attendance SPI points for school environment indicator. • Each school will maintain its own distinct performance for the English Language Learner
Progress indicator.
24:55:07:07. Public schools with no grades assessed. For accountability purposes, the department shall link public schools that have no grades assessed with public schools into which their students feed.

Updated July 22, 2019
22
• Feeder School’s science rate bar graphs will display an asterisk (*) even if Receiver School has a science performance rate. This is because science is not calculated in the SPI points for performance (grades 5, 8, 11 take science assessments)
Additional details: • Each school has its own calculated SPI points for the Overall Score • A Feeder School shall automatically receive the same school support designation as its Receiver
School, except when the Feeder is not a Title I school. • SD DOE will provide a list to the vendor of the list of Feeder and Receiver schools • The rosters should NOT be combined
o Receiver School’s students should NOT appear in the Feeder School’s Student Performance roster or Student Progress roster.
o Feeder School’s students should NOT appear in a Receiver School’s Attendance roster. • A Feeder School should NOT report All-Assessed data.

Updated July 22, 2019
23
District/State Level Data Rules and Details for Feeder/Receiver Schools The Student Performance and the Student Progress data for the Receiver School should not be double counted at the district and state levels
• For district percentages, the Performance and Progress data associated with a Feeder School should not be included.
• For the state percentages, like the district, the Performance and Progress data associated with Feeder Schools should not be included.
School Support Classification for Feeder/Receiver Schools For example, where a kindergarten through grade two school feeds into a grade three through six school, the school support determination will apply to the Feeder school. If the Feeder School is not a Title I School, then the Feeder shall be classified as General Support. Example – Public ARC In School District X, Elementary A is a Feeder for Elementary B (Receiver). All kids from Elementary A continue onto Elementary B for 3rd grade. Therefore, according to ESSA, the Student Performance and Student Progress rates from Elementary B will be reported in Elementary ARC.
1. Elementary A (Feeder) and Elementary B (Receiver) have the same School Support classification-listed as General Support.

Updated July 22, 2019
24
2. Elementary A (Feeder) reports Elementary B (Receiver) SPI points for Performance and Progress. Both schools have the same SPI points for Student Performance and Student Progress but will differ in School Environment (Attendance), English Language Learners Progress rates, and earned SPI points. Thus, overall SPI points for Feeder/Receiver schools might be different.
3. Student Performance rates (math and ELA) are the same for both Feeder and Receiver schools.
See images below: Elementary A (Feeder) Student Performance by subject area. Elementary B does not have tested grades for science so reports the science proficiency rate as an asterisk.

Updated July 22, 2019
25
4. Student Progress is reported the same rates as Receiver School. When a Receiver School does not report Student Progress, the Feeder School will not report Student Progress. Rather, a “data not available” or “less than 10 students” message will show on the report card page for progress.

Updated July 22, 2019
26
5. School Environment indicator is Attendance. Data are based on school’s own data.

Updated July 22, 2019
27
Feeder School Rosters in Private Report Card In the private report card, Elementary A will have access to rosters for English Language Learner Progress, Attendance, and Educator Qualifications that displays only the students enrolled at Elementary A. Elementary A does NOT display a Student Performance roster or a Student Progress roster.
Receiver School Rosters in Private Report Card Elementary B will have rosters for Student Performance, Student Progress, English Language Learner Progress, and Attendance. Each roster will include only the students enrolled at Elementary B. No Elementary A students should appear on Elementary B’s rosters. Redistribution of SPI Points Consistency with the 100-point School Performance Index (SPI) is particularly important when conducting the calculations for classifying school support, small and special schools, and for the fidelity of calculating the overall SPI points for individual schools. For that reason, the SDDOE created rules for reallocating SPI points to other academic indicators. Rules for redistribution of SPI points:
• If the N-size is below 10 for an indicator • If there are no students for an indicator
Redistribution of SPI points for elementary and middle schools is applied: • If a school is not accountable for the English Language Learner Progress indicator, then those 10
points will be redistributed equally to all other academic indicators: 1. Student Performance would be 45 Points (22.5 for English language arts, 22.5 for
mathematics) 2. Student Progress would be 45 Points (12.25 Points for English Language arts, 12.25
Points for mathematics, 12.25 Points for English language arts Lowest Quartile, 12.25 Points for mathematics Lowest Quartile.
3. Attendance would stay as 10 Points, because it is a non-academic/School Quality measure
• If a school is not accountable for the Student Progress Indicator, then those 40 points will be redistributed equally to all other academic indicators:
1. Student Performance would be 72 Points (36 for English Language Arts, 36 for Mathematics)
2. English Language Learner Progress would be 18 Points 3. Attendance would stay as 10 Points, because it is a non-academic/School Quality
measure

Updated July 22, 2019
28
• If a school is not accountable for English Language Learner Progress (10 pts) AND Student Progress (40 pts), then those 50 Points will be redistributed equally to Student Performance (45 for English Language Arts, 45 for mathematics).
Redistribution of SPI points for high schools is applied: • If a School is not accountable for the English Language Learner Progress Indicator, then those 10
points will be redistributed equally to all other academic indicators: o Student Performance would be 43.34 Points (21.67 for English Language Arts, 21.67 for
Mathematics) o College and Career Readiness would be 28.33 Points o On-Time Graduation would be 15.83 Points o High School Completion would stay as 12.5 Points, because it is a non-academic/School
Quality measure. • If a high school has no students in CCR, then those 25 points are redistributed equally to the
other three Academic Indicators: o Student Performance would be 48.3 Points (40 + 8.3 = 48.3) o On-Time Graduation would be 20.83 Points (12.5 + 8.3 = 20.8) o English Language Learner Progress would be 18.4 Points (10 + 8.4 = 18.4) o High School Completion would stay as 12.5 Points, because it is a non-academic/School
Quality measure
Redistribution of SPI points when a school has no students in an SPI indicator: o No students in Student Performance-those points are redistributed to Student Progress
and/or English Language Learner Progress o No students in On-Time Graduation-those points are redistributed to Student
Performance

Updated July 22, 2019
29
Image of SPI points redistribution from ELP (10 pts) & Student Progress (40 pts) to Student Performance: Image of SPI points from ELP to other academic indicators:

Updated July 22, 2019
30
Chapter Two: The Elementary and Middle School Accountability System

Updated July 22, 2019
31
Elementary and Middle School Accountability System The Elementary and Middle School Accountability System incorporates four key indicators of school performance, described in this section. Indicator #1: Student Performance Elementary, middle and high schools are accountable for the Student Performance indicator. This indicator measures students’ performance on the South Dakota English Language Arts Assessment and the South Dakota Math Assessment or the South Dakota Alternative Assessments in both English Language arts (ELA) and math. Only those students with the most severe cognitive disabilities take an alternate assessment. First Year in Country students in tested grades are required to participate in the math and science assessments. The Accountability Report Card also reports proficiency rates that include the science assessment and science alternative assessment scores. Science test scores are not included in the SPI calculation. Note: High school grades (11 and 12) are referred to in this section since performance measure details are the same for elementary and middle schools. The South Dakota Assessments are single snapshot, summative assessments designed to measure each student’s mastery of South Dakota’s content standards in ELA and math. A student receives a scale score which falls into four achievement levels: Level 1 being the lowest level, Level 3 indicating proficiency, and Level 4 indicating advanced performance. Levels 1 and 2 are considered not proficient; levels 3 and 4 are proficient and above. Proficiency Rate Rules
• All students who tested in grades 3-8 and 11 are included in the proficiency rate calculation for a school or district if they met Full Academic Year (FAY).
• Test scores for Grade 12 students who did not take assessments in 11th grade, are included.
Counting FAY Students who Transfer at School, District or State Level Students who are counted only at the district or state level do NOT count at the school level; and will not be included in the calculations that determine SPI points. NOTE: when SPI points are awarded at the school level only; the state and the districts don’t get SPI points. Transfer students:
• Performance scores of FAY students who transfer from one public school to another public school within the same school district in South Dakota between October 1 and May 1 with an enrollment gap of no more than 15 consecutive school days are counted at the district-level and state-level. Those students will not be counted at the school-level.
• Performance scores of FAY students who transfer from one public school district to another public school district in South Dakota between October 1 and May 1 with an enrollment gap of no more than 15 consecutive school days are counted at the state-level for student performance and used for setting the state long term goals. Those students will not be counted at the school-level or district-level.

Updated July 22, 2019
32
Collection, Processing, Loading Schedule for State Assessments Data Element Test Window Provider
of data file
File Received
File Processing
Loaded in SD-STARS
Data Year
ACCESS 2.0 Jan 28 - Mar 1 May 15 May 20 July 9 2019 ACCESS 2.0 Alt Jan 28 - Mar 1 May 15 May 20 July 9 2019 SD-ELA Mar 4 – May 3 AIR June 15 July 3 July 9 2019 SD-MATH Mar 4 – May 3 AIR June 15 July 3 July 9 2019 SD-ELA Alt Mar 18 – May 3 AIR June 30 July 3 July 9 2019 SD-MATH Alt Mar 18 – May 3 AIR June 30 July 3 July 9 2019 SD-SCI April 1 – May 3 June 15 July 3 July 9 2019 SD-SCI Alt April 1 – May 3 June 15 July 3 July 9 2019
Results on the South Dakota Assessments and the South Dakota Alternate Assessments will be returned three ways:
• Multi-Year Proficiency • Current Year Proficiency • Current Year Participation
Multi-Year Proficiency Multi-year proficiency is reported for English language arts, math, and science. Note, science will be made available once at least two years of data are available. Multi-Year Proficiency Rate Calculation Numerator = Count of FAY students who tested at Level 3 or 4 in 2016-17 + count of FAY students who
tested at Level 3 or 4 in 2017-18 + count of FAY students who tested at Level 3 or 4 in 2018-19
Denominator = Count of FAY students who tested in 2016-17 + count of FAY students who tested in 2017-18 + count of FAY students who tested in 2018-19
Current Year Proficiency The proficiency rate for students on the current school year assessments for ELA, math and science are calculated and presented for informational purposes. Schools can compare their current year performance to prior years’ performance. First Year in Country students with a scale score in math or science and who met FAY are included in the calculations for current year proficiency rates. Calculation
Numerator = Count of FAY students who tested at Level 3 or 4 in current school year
Denominator = Count of FAY students who tested at any level in current school year
Current Year Participation The final component of Student Performance is the participation rate. All students enrolled in a South Dakota public school as of May 1 are required to participate in the ELA, math and science assessments.

Updated July 22, 2019
33
Federal and state law requires that 95 percent of students, at the school, district, and state levels, and across every subgroup, participate in the state assessment.
Administrative Rule 24:55:07:02. At least 95 percent assessed. A school shall administer the state academic assessment to at least 95 percent of the students and 95 percent of students within a student group who are enrolled in the tested grades for the state academic assessment as of May 1. If a school fails to administer the state assessments to 95 percent of students or of the members of a student group, those students necessary to be counted to reach 95 percent shall receive a value of zero in calculating the student achievement key indicator.
Refer to pages 15 -18 for additional details and rules for participation in testing. Earning SPI Points for Performance Student Performance Points (SPI) are awarded based on a school’s performance over the course of three years for ELA and math. The N-size of 10 is applied over the three years used for the indicator, rather than an N-size of 10 for each individual year. If a school has fewer than 10 students over three years, the school is considered a Small School (see Small and Special Schools section, Chapter One, pages 18-21). Points are awarded by looking at the performance of all students on the statewide assessment in ELA and mathematics. The percentage of students scoring at each performance level is calculated and then multiplied by the point value given to that performance level. The point values applied to each performance level details are provided in the table below.
Performance Level Point Values Level 1 0.25 Level 2 0.50 Level 3 1.00 Level 4 1.25
To comply with the 95% participation in testing rule, untested students above the amount allowed in the SD Administrative Rule are included in the calculation and assigned a value of zero points for the percent of tests not taken above the five percent allowed. The below steps reflect how to calculate the percent of points earned based on the performance level of students on the assessments for ELA and math. Note that all calculations are based on adding together the most recent consecutive three years of data. Phase I steps for calculating points achieved by performance level for ELA and math
1. Determine the denominator for the calculation. This number reflects the larger of either those students assessed or 95 percent of eligible students, as identified in participation rate (current year only for ELA and math assessments).
a. If a school met participation requirements for All Students group, continue to Step 4. b. If a school did not meet participation requirements for All Students group, determine
the number of students required to bring the school up to the 95 percent bar. The students represented here are given a value of zero point value.

Updated July 22, 2019
34
2. Determine the number of students scoring at Level 1 and translate into a percent of students using the denominator arrived at in Step 3. These students are given a value of 0.25 point value.
3. Determine the number of students scoring at Level 2 and translate into a percent of students using the denominator arrived at in Step 3. These students are given a value of 0.50 point value.
4. Determine the number of students scoring at Level 3 (proficient) and translate into a percent of students using the denominator arrived at in Step 3. These students are given a value of 1.00 point value.
5. Determine the number of students scoring at Level 4 (proficient) and translate into a percent of students using the denominator arrived at in Step 3. These students are given a value of 1.25 point value.
6. Add up the percent of points earned for each of the above steps to arrive at the total percent of points earned. If this is greater than 100%, cap this at 100% of points earned.
Example of above steps calculation results:
Nonparticipants to get up to 95%
Level 1 Level 2 Level 3 Level 4 Total Total Points Earned (% x 20 points possible by subject area)
N-size 2 27 50 100 21 200 Percent of total 1.00% 13.50% 25.00% 50.00% 10.50% 100% Point value 0.00 0.25 0.50 1.00 1.25
% of points earned 0.00% 3.38% 12.50% 50.00% 13.13% 79.01% 15.80 Phase II steps to calculate the total points earned for each subject area:
1. Multiply the percentage of points earned by 20, which is the possible points for each subject area: (see Appendix A for rounding rules)
a. 79% multiplied by 20 = 15.80 for Math b. 88% multiplied by 20 = 17.60 for ELA
2. Total earned points for Student Performance for this school is 33.40, which is the sum of 15.80 and 17.60.
3. There are 40 points possible for the Student Performance indicator; to calculate the percentage of points earned: divide 33.40 by 40 = 84% of the possible points were earned by the school. No school may earn more points than maximum possible.
Example of above steps calculation results:
% of Points Earned Points Earned
Total Points for Student
Performance Math 79.00% 15.80
33.40 ELA 88.00% 17.60

Updated July 22, 2019
35
Report card image for Student Performance indicator showing current year proficiency rates:
Invalidated Test Scores SDDOE process for invalidating test scores based on a unique situation at a school resulting in the invalidation of test scores. Invalidated test scores will count in the denominator when calculating student proficiency.
The invalidation of test scores may impact the school’s SPI points for the student performance indicator if the school did not test 95% of their students in the current school year.
24:55:02:06. Calculation of student achievement SPI key indicator score. The department shall base the student achievement SPI key indicator score for all public presecondary and secondary schools on the percentage of students at each of the four levels on the state academic assessment for the three most recent school years. The department shall calculate this score separately for the presecondary school level and the secondary school level. To calculate the SPI key indicator score for a public school, the department shall first divide the maximum points for this indicator in half, in order to count English language arts and mathematics scores equally. The department shall then calculate the percentage of students scoring at each performance level. In the event that a school did not assess at least 95% of the tested population, the number of students needed to reach a 95% participation rate is added to this calculation. Students not testing shall be assigned a value of 0 percent. Full academic year students scoring at level 1 shall be assigned a value of 0.25 percent, full academic year students scoring at level 2 a value of 0.50 percent, full academic year students scoring at level 3 a value of a full percent, and full academic year students scoring at level 4 a value of 1.25 percent. This process shall be completed separately for math and English language arts.

Updated July 22, 2019
36
Indicator #2: Student Progress Student Progress is based on the Student Growth Percentiles model. In this model, every student is compared to his or her peers. Test scores of students in grades 4 – 8 are used to capture two successive years of test scores for this measure. Student Progress is based on the students who meet Full Academic Year (FAY) in the current school year. Measure Details
• Students are grouped with other South Dakota students based on their performance on previous year’s assessment. Then their scores for current year assessment are compared to determine how much they grew.
• Those students who have a relatively higher year two score (i.e., they grew more) will have a higher Student Growth Percentile (SGP).
• Those with a relatively lower year two score (i.e., they grew less than their peers) will have a lower SGP.
• The modeling through Student Growth Percentiles is then used to project how the student will perform in three years.
• Three categories of students are factored into the numerator of the Student Progress calculation. These categories qualify for meeting the growth standard:
1. Those students who are currently proficient and projected to stay proficient receive a designation of “Keeping Up.”
2. Those who are not yet proficient but for whom the model projects will become proficient in three years are “Catching Up.”
3. Those who are not proficient and not projected to become proficient, but who are achieving significant progress (defined as a Student Growth Percentile of 70 or above, i.e., growing at a rate of better than 70 percent of his or her peers), are designated as having “Very High Growth.”
• The above three categories of students, plus the students Not Meeting the Growth standard, are the denominator.
Definition of Student Progress Designations
Designation Current Year Proficiency
In 3 Years Proficiency Current Growth
Keeping Up Proficient Will stay proficient Catching Up Not Proficient Will be proficient Very High Growth Not Proficient Will not be proficient SGP of 70 or above
Others Proficient Not Proficient
Will not be proficient Will not be proficient SGP of below 70

Updated July 22, 2019
37
Calculation
Numerator: Number of current year FAY students with a previous year’s assessment score who also earned a designation of Keeping Up, Catching Up, or Very High Growth
Denominator: Number of current year FAY students with a previous year’s assessment score
The report card displays rates for both the All Students and the Lowest Quartile groups. The Lowest Quartile is comprised of those students who achieved the lowest 25 percent of scores on the previous year’s assessment. Earning SPI Points Points are awarded based on the performance of the All Students group in both ELA and math, as well as the performance of the Lowest Quartile students in ELA and math. Lowest Quartile is calculated on the lowest 25% of the previous year’s assessment scores. An example of calculating Student Progress points:
Student Groups ELA Math
Total SPI Points % Meeting Standard
SPI Points % Meeting Standard
SPI Points
All Students 78.00% 7.80 61.33% 6.13 27.40
Lowest Quartile 73.68% 7.68 57.89% 5.79
Administrative Rule 24:55:02:12. Academic growth key indicator. The department shall calculate the academic growth SPI key indicator score of each public school using student growth percentiles to calculate growth in English language arts and in mathematics, based on the percentage of students achieving tier one, tier two, or tier three growth. The department shall calculate the academic growth key indicator as follows:
1. Multiply ten points by the percentage of all full academic year students in the school who reached tier one, tier two, or tier three growth in English language arts;
2. Multiply ten points by the percentage of all full academic year students in the school who reached tier one, tier two, or tier three growth in mathematics;
3. Multiply ten points by the percentage of full academic year students in the lowest one fourth of students in the school based on prior year assessment scores for whom growth is calculated in English language arts who reached tier one, tier two, or tier three growth in English language arts;
4. Multiply ten points by the percentage of full academic year students in the lowest one fourth of students in the school based on prior year assessment scores for whom growth is calculated in mathematics who reached tier one, tier two, or tier three growth in mathematics; and
5. Add the numbers obtained subsections (1) through (4), inclusive.

Updated July 22, 2019
38
Image of Student Progress rates/3-yr Trend for ELA and Math:
Processing, Loading Schedule for Calculating Growth
Data Element Provider of Growth Percentile Measure data file
File Received Timeline
File Processing Timeline
Loaded in STARS
Data Year
SD-ELA eMetric 3-day turnaround July 8 July 9 current SD-MATH eMetric 3-day turnaround July 8 July 9 current SD-ELA Alt eMetric 3-day turnaround July 8 July 9 current SD-MATH Alt eMetric 3-day turnaround July 8 July 9 current
Indicator #3: English Language Learners Progress English Language Learners Progress (ELP) indicator is designed to focus on the progress of English Language Learner students assessed by state English language assessment, specifically the ACCESS 2.0. Students who take ACCESS Alt are not included in this indicator. The English Language Learners Progress indicator is based on the students who meet Full Academic Year (FAY) in the current school year.

Updated July 22, 2019
39
The point structure for the English Language Learners Progress indicator is like the Student Performance indicator point structure. Schools earn a percentage of points based on how English Language Learner
Administrative Rule 24:55:02:15. Calculation of English language proficiency key indicator score. The department shall calculate an English language proficiency key indicator score for each public school based on the performance of full academic year English learner students in grades kindergarten through twelfth grade on the English language proficiency assessment who are either identified for the first time in the current academic year and who met exit criteria or who are in the second or subsequent year of identification as an English learner. The department shall consider separately the students in the first year of identification who met exit criteria in year one of identification as an English learner, and the students in the second or subsequent year of identification as an English learner. The department shall calculate an English language proficiency key indicator score for each public school as follows: (1) For students in their first year of identification, calculate the percent of English learners included in the calculation who took the English language proficiency assessment and achieved a score of proficiency and assign a value of one full percent; (2) For students in their second and subsequent year of identification, calculate the percent of students scoring at each of the following benchmarks: (a) An English learner who did not take the English language proficiency assessment shall be assigned a value of zero; (b) An English learner whose composite score on the English language proficiency assessment is the same or lower than the prior year's score, who took the assessment but failed to receive a composite score, shall be assigned a value of 0.25 percent; (c) An English learner whose composite score on the English language proficiency assessment is above the English learner's previous year's score but which does not meet the target calculated as per 24:55:05:07, or who took the assessment in the current year but does not yet have a target to meet as calculated per 24:55:05:07, shall be assigned a value of 0.50 percent; (d) An English learner whose composite score on the English language proficiency assessment meets or exceeds the target calculated as per 24:55:05:07, or who achieved a score of proficiency on the English language proficiency assessment, shall be assigned a value of one percent; (e) An English learner who achieved a score of proficiency on the English language proficiency assessment ahead of the target calculated as per 24:55:05:07 shall be assigned a value of 1.25 percent; (3) Add the values achieved in (1) and (2) and multiply by the possible points for the indicator to arrive at the English language proficiency key indicator points earned; and (4) Hold accountable for the English language proficiency key indicator all schools with a student group size of ten or more students over the most recent three years of English language proficiency assessment scores. If a school has at least one English learner in the three years considered but fewer than ten, and the district has ten or more English learners over the three years considered, the following shall apply: (a) The department shall combine the results from every English learner in the district according to the methodology set out in 24:55:02:15(2) in order to arrive at a district-level point total; and (b) Every school in the district with at least one English learner over three years but fewer than ten English learners over three years then shall receive the same English learner proficiency key indicator point total derived from (a). If a district has fewer than ten English learners over the three years considered, the points allotted for the English learner proficiency key indicator at the school level shall be distributed evenly among the remaining academic indicators.

Updated July 22, 2019
40
students are performing towards the state’s goals for reaching language proficiency, which is a composite score of 5.0 or more on the ACCESS 2.0 assessment.
• The point of entry to the indicator is a student’s first ACCESS 2.0 assessment. • The indicator is structured to consider separately students taking ACCESS 2.0 for the first time
and students’ progress on the ACCESS 2.0.
All English Learner students who have been in the program before the 2016-17 Academic Year will have their progress trajectories set on their 2016-17 ACCESS 2.0 Composite Score, regardless of how long they have been in the English Learner program (Linear Growth cannot be accurately calculated using scores from two different tests). For English Learner students identified after 2016-2017, their first ACCESS 2.0 Composite Score will become the baseline score used to calculate their progress trajectories. When English Learner students take the ACCESS 2.0 assessment for the first time, the Composite Score they get is used to determine the number of years it will take for individual students to exit the English Learner program. The diagram below shows the number of years for an English Learner student to exit the program after taking their first ACCESS 2.0 assessment.
First ACCESS 2.0 Score
Years to Exit after First ACCESS 2.0
1.0 to 1.9 5 years 2.0 to 2.9 5 years 3.0 to 3.9 4 years 4.0 to 4.9 3 years 5.0 to 6.0 Exit
Once an English Learner student has their first ACCESS 2.0 Composite Score, a Linear Progress Trajectory is calculated based on the number of years they are expected to remain in the English Learner program. The equation used to calculate the Linear Progress Trajectory is: Calculation
Numerator: 5.0 – First Score
Denominator: Years to Exit based on first ACCESS 2.0 Composite Score The Linear Progress Trajectory is used as annual target scores a student must achieve to receive full points each time they take the ACCESS 2.0 Assessment. Below is an example of what an individual student targets would look like:
Initial ACCESS 2.0 Level
Years to Exit
Year 1 Target
Year 2 Target
Year 3 Target
Year 4 Target
Year 5 Target
2.2 5 years 2.7 3.3 3.8 4.4 5.0 The student’s second assessment score is used to categorize the student’s progress, as detailed below:
• If the student didn’t test -> Returning EL, not tested -> 0 Point Value

Updated July 22, 2019
41
• If the student scored a 1.9 on his/her next test -> Returning EL, tested, no growth -> 0.25 Point Value
• If the student scored a 2.5 on his/her next test -> Returning EL, growing but not meeting goals -> 0.50 Point Value
• If the student scored a 3.1 on his/her next test -> Returning EL, tested, meeting growth goals -> 1.00 Point Value
• If the student scored a 5.2 on his/her next test -> Returning EL, tested, early exit -> 1.25 Point Value
Earning SPI Points Points will be awarded based on the performance of English Language Learner students on the ACCESS 2.0 assessment. Students can fall into one of seven growth categories, whether they are first identified as an English Learner, or they are a returning English Learner without a test. First-identified students (students without a previous ACCESS 2.0 test score):
• Students who both took the ACCESS 2.0 assessment for the first time, and who met the exit criteria within their first year of receiving services are assigned to the category worth 1.0 point value.
• Other students who took the ACCESS 2.0 for the first time and did not exit within their first year of services are given a Progress trajectory but are NOT INCLUDED in this indicator until the second year of identification when progress towards growth can be calculated.
Students with at least one previous ACCESS 2.0 score:
• Students required to take ACCESS 2.0 but did not will be assigned to the category worth zero point value.
• Students who took ACCESS 2.0 as required but either lost proficiency or failed to make progress will be assigned to the category worth 0.25 point value.
• Students who are not on track to exit within the prescribed time frame but who have nevertheless progressed in proficiency OR students who did NOT take the ACCESS 2.0 when first identified but then took the assessment for the first time this year will be assigned to the category worth 0.50 point value.
• Students who are either on track to exit within the prescribed time frame OR students who exited on time are assigned to the category worth 1.0 point value.
• Students who exit ahead of the prescribed timeframe are assigned to the category worth 1.25 point value.
The table below describes the seven categories and points:
Growth Category Point Value Newly-Identified EL, not tested 0.00 Returning EL, not tested 0.00 Returning EL, tested, no growth 0.25 Returning EL, growing but not meeting goals 0.50 Newly-Identified EL, exiting 1.00 Returning EL, tested, meeting growth goals 1.00 Returning El, tested, early exit 1.25

Updated July 22, 2019
42
SPI Points Awarded Once all English Learner students have been assigned to the appropriate category as denoted above, the cumulative percentages of students in each point category are multiplied by the point level, and by the points available for the indicator to create a calculated ELP indicator score. Rounding Rule for ELP Progress Goals The Linear Growth Trajectory is measured to the hundredth decimal place and the ACCESS 2.0 Assessment measures scores by the tenth decimal place. We calculate targets using the hundredth, but the student’s score is rounded down to the tenth (Rounding up would mean they would have to earn a higher than intended score with a linear progress trajectory).
An example for calculating points for the English Language Learners Progress Indicator:
Newly-identified EL, not tested
Returning EL, not tested
Returning EL, tested, no growth
Returning EL, growing but not meeting goals
Newly-identified EL exiting
Returning EL, tested, meeting growth goals
Returning EL, tested, early exit Totals
Total Points Earned (lesser of 10.0 or sum of all points)
N-size 10 10 20 20 10 20 10 100 Percent of total EL 10.00% 10.00% 20.00% 20.00% 10.00% 20.00% 10.00% 100% Point value 0 0.25 0.5 1.00 1.25
% of Points Earned 0 5.00% 10.00% 30.00% 12.50% 57.5% 5.75
N-Size of 10 Rule for English Language Learner Progress Indicator South Dakota’s districts vary widely in the number of ELs they serve. Any school meeting an N-size of 10 will be held accountable and receive points based on the performance of its students for the English Language Learner Progress indicator. In this way, SDDOE will be able to hold the maximum number of districts accountable for the progress of their EL students.
If a school in a district does not meet the EL N-size of 10 over three years, but the district as a served 10 or more ELs over three years, that school will receive the percentage of points earned at the district level for the indicator.
If a school and district did not meet the N-size of 10 in those three years, the points for the ELP indicator will be redistributed to the other academic indicators. (See Redistribution of SPI points section for details and examples).
Progress Details for the English Language Learner Progress page in report card The English Learners On-Track progress measures the rate of EL students that have met annual target goals. The English Learners Exited progress measures the percentage of EL students that score a 5.0 or higher on the ACCESS 2.0 and exited the program. These rates will reflect district data if the N-size for the school is less than 10 students.

Updated July 22, 2019
43
Image of the ELP page in the 2017-18 report card:
Image of the circle shows the rates of students disaggregated by progress (growth) categories and the number of EL students based on the Fall Enrollment count:

Updated July 22, 2019
44
Image of the English Language Learner Progress breakdown by category/points table in view details:
Procedures and Processing Schedules for EL Assessments Collection, Processing and Loading Schedule for English Learner Assessments
Assessment Type Source DOE Processing Details
File Process Timeline
Loaded in STARS
Data Year
ACCESS 2.0 DRC Title III to DM May 30 June Current ACCESS 2.0 Alt DRC Title III to DM May 30 June Current
Procedures for Review and Validation for First in Country (FYIC) Students
Title III Review & Validation Process
Source DOE Processing Details
File Process Timeline
Loaded in STARS
Data Year
Title III request Adhoc report from DM
ICSE DM to Title III May 20 No Current
KG WAPT ICSE Title III June 4 No Current WIDA Screener-Grades 1-12
WIDA Management System
Title III June 4 No Current
Details for correcting student data
Title III Title III Accountability
May 30 No Current
Override details Accountability Accountability to vendor
June 4 Yes Current
WAPT Review and Validation Procedures for FYIC Students Accountability works with Title III to ensure the accuracy of First Year in Country student data in the EL student rosters and in report cards through a series of data reviews and validation procedures. Title III works with Data Management (DM) to correct data in ICSE based on districts notifying Title III about student records that might need corrected in ICSE (ongoing throughout academic year). Title III works

Updated July 22, 2019
45
with Accountability to identify any corrections needed; details for those corrections are added to the Overrides file which is then sent to vendor to correct student data in the database system for the report card. WAPT Report Review is scheduled in mid-May after the ACCESS 2.0 testing window closes. Title III reviews FYIC students who enrolled after the ACCESS 2.0 testing window closes using the WAPT Adhoc report from ICSE and the WIDA Screener Assessment Management System (system that houses WIDA screener assessment results). The WIDA Screener Grades 1-12 is a screener test used by districts to determine if a student qualifies as an English Learner. Title III reviews the WIDA Screener scores for newly arrived (FYIC) EL students taking the screener assessment to make sure students were assessed with the WIDA Screener. Title III verifies that student scores are in WIDA AMS. Title III provides technical assistance to districts and schools for entering WIDA Screener results into correctly into the EL tab (under the comments section) in Infinite Campus. The review only looks at students in tested grades. Procedures are:
1. Data Management pulls the WAPT Adhoc data report from ICSE and sends that report to Title III in mid-May. This report should only include FYIC students based on details below. a. Criteria for FYIC students are:
i. Must be an identified EL student who has not attended schools in the United States for more than 12 months (Puerto Rico students are included if they are identified as EL).
ii. Student is first year in country if a student is EL and first entered the United States between the end of the ACCESS testing window of the previous spring and the May 1 of the current school year.
b. Parameters for the WAPT report are: i. Date first entered US after May 1 of current school year AND
ii. Date first entered US school, after testing window in previous school year OR iii. Date first entered SD school, after testing window in current school year iv. Only students who are identified as EL and fit FYIC criteria are included
2. Title III uses ICSE and the WIDA Assessment Management System (system that houses WIDA screener assessment results) to validate FYIC student data in WAPT Adhoc report.
3. Title III contacts districts and schools as needed to validate EL student data in WAPT report (i.e., two districts that use a paper screener).
4. Title III provides a detailed spreadsheet with student data that needs corrections to Accountability (drop file into FTP Accountability folder in N drive).
5. Accountability creates the overrides file and provides that to the vendor to make changes in database files used for the report card.
EL Student Roster Review is scheduled in late June. Vendor will provide a data file to Accountability and Title III to review and validate EL student data in the student rosters for the ELP indicator. Procedures are:
1. Title III reviews data files provided by the vendor to validate EL students in the district and school student rosters for ELP indicator.

Updated July 22, 2019
46
2. Title III provides review results to Accountability 3. Accountability creates the overrides file and provides that to the vendor to make changes in
database files used for the report card.
Indicator #4: School Environment (Attendance) The attendance rate is based on the percentage of students attending school for 90% or more of enrolled days. All students who are FAY and enrolled in grades kindergarten (including junior kindergarten – K1) through grade 8 are included in the attendance rate calculation for the SPI indicator. NOTE: The attendance rate of 94% was the standard in past years (before 2017-18) and FAY was not applied. In 2017-18, the attendance rate benchmark changed to 90% and FAY is applied to measure.
Calculation
Numerator = Count of FAY students who attended at least 90% of his or her enrolled days
Denominator = Count of all FAY students who were enrolled for at least 15 consecutive school days Note: This rate is calculated out and rounded up to two decimal places. See Appendix A for rounding rules. Earning SPI Points SPI points are earned by taking the percentage of FAY students who attended at least 90% of enrolled days multiplied by 10. For example, a hypothetical school with 83.54 percent of students attending at least 90% of enrolled days will receive 8.35 points out of a possible 10. Attendance rates are calculated based on every unique student enrollment record (a student can have multiple enrollment records) at grades kindergarten (including junior kindergarten – K1) through eighth grade, reduced by students incarcerated at the state penitentiary, students attending school out-of-state, private school, summer school, home school, foreign exchange students, and students attending out-of-state on a contract basis. A unique student enrollment record is defined as unique student/ district/school/enrollment period. There could exist in Infinite Campus multiple enrollment records for the same student at the same district/school for the same enrollment period – if this is so, only one of these is retained for analysis.
Administrative Rule 24:55:02:07. Calculation of student attendance SPI key indicator score. The department shall calculate the student attendance SPI key indicator score for all public presecondary schools as follows: (1) For each full academic year student, divide the number of days the student was in attendance by the number of days the student was enrolled to obtain the attendance percentage; (2) Count the number of students who have attained at least a ninety percent target attendance percentage; (3) Divide the number obtained in subdivision (2) by the total number of full academic year students; and (4) Multiply the number obtained in subdivision (3) by the maximum points for this indicator.

Updated July 22, 2019
47
Students can be accountable at the school/district/state levels, or district/state levels, or state level only, determined by the process involving district type and funding codes used for academic performance. For each level, the attendance rate is calculated by the (sum of membership days – sum of absent days) / (sum of membership days), summed over each unique enrollment record. This gives each unique enrollment record an attendance percentage). Rules for Dually Enrolled Students In certain cases, a student may have two (or more) enrollment records at the same school. In such cases, if it is indeed the same student and the same school, only if the enrollment records meet FAY should they be included for purposes of accountability. Similarly, any consecutive enrollments, irrespective of the length on either/any, should be combined to form one attendance record. For example, a student may have one enrollment record running from August 18 through December 7 (14 days) and another record in the same school from December 8 through May 15. Although the business rules above dictate that the first enrollment record should be dropped, in fact these two enrollment records should be combined as one continuous enrollment. Since that students would be considered continuously enrolled from August 18-May 15, they are also considered FAY and will count in attendance. Rules for Partially Enrolled Students For the Attendance Indicator only, students who are only partially enrolled in a school are counted; meaning that some students will count, for attendance calculation purposes only, at more than one school. Rules for SPED Attendance Students dually-enrolled will be counted at each school in which they are enrolled for attendance purposes only, except for SPED students with enrollments equaling more than 100 percent.
• SPED students can be dually enrolled between their resident school district at 1% and their out-of-district placement school at 100%.
• The attendance at the 100% enrolled school is used for Accountability. • The 1% enrollment should not be considered for Accountability. • The percent enrolled must be > 0 (no placeholder enrollments). • For students to count at the school level, the student must have been enrolled for 15 or more
consecutive school days (see Attendance Exceptions below for special circumstances).

Updated July 22, 2019
48
Attendance Exceptions There may be extenuating situations, such as a severe medical condition of the student or a member of the student’s immediate family, which cause a student to miss a considerable number of days of schools (see Administrative Rule 24:17:3:06, page 46). Note: Chronic Absenteeism is reported in the elementary and middle school report cards, but no SPI points are applied for this measure for school environment. Chronic Absenteeism measures the percentage of students that have attended more than 10 days and have missed 10% or more enrolled days in the school year.
Image of Attendance and Chronic Absenteeism in Report Card:
Administrative Rule 24:55:07:03. Dually enrolled students. For purposes of the student achievement, academic growth, high school completion, graduation rate, English language proficiency, and college and career readiness key indicators, a student who is dually enrolled is counted at the public school where the student spends greater than 50 percent of the school day. For purposes of the student attendance key indicator, a student is counted based on the student's attendance percentage, as referenced in § 24:55:02:07, in each attendance center. Administrative Rule 24:55:07:04. Student transfers during the academic year. Results of students who transfer from one public school to another public school within the same public school district between October first and May first are counted at the district level for student achievement, academic growth, English language proficiency, and attendance SPI key indicator scores. Results of students who transfer from one public school district to another public school district between October first and May first are counted at the state level for student achievement, academic growth, English language proficiency, and attendance SPI key indicator scores. Administrative Rule 24:17:3:06: Any student who has an unexcused absence of 15 consecutive school days shall be dropped from the count of the attendance center retroactive to the last day the student attended school or had an excused absence. An excused absence includes medical illness and enrollment in a short-term group care education program for up to 90 consecutive school days. This is the responsibility of the districts to drop the student.

Updated July 22, 2019
49
Collection, processing, load data files for Attendance Data Element Available in IC File Processed File Loaded Data Year Attendance June 30 Current year FAY Attendance June 30 Current year Chronic Absenteeism June 30 Current year

Updated July 22, 2019
50
Chapter Three: The High School Accountability System

Updated July 22, 2019
51
High School Accountability System Indicators The High School Accountability System incorporates five key indicators including: student performance, on-time graduation, high school completion, college and career readiness, and English language learner progress. Indicator #1: Student Performance High schools are accountable for the Student Performance indicator. This indicator measures student proficiency levels on the South Dakota English Language Arts Assessment and the South Dakota Math Assessment or the South Dakota Alternative Assessments in both English Language arts (ELA) and math. Science proficiency rates are also reported in the report card per ESSA requirements; however, science is not included in the SPI points for this indicator. Refer to the details for the Student Performance indicator on page 31. Indicator #2: On-Time Graduation Rate (4-yr adjusted cohort) The On-Time Graduation rate is based on the number of students who graduate in four years with a regular high school diploma, divided by the number of students who form the “adjusted cohort” for that graduating class. The adjusted cohort is defined as the students who entered ninth grade for the first time four years ago, minus those who transferred out of the cohort (i.e., moved out of state, transferred to a private school, etc.), plus students who joined the cohort (i.e., students who began four years ago as a ninth grader in a private school, out of state, etc.). As opposed to the completer rate, only students who graduate with a regular diploma are counted positively in this measure. Those who continue their education beyond four years, those who finish with a GED, and those who drop out are all counted against the Four-Year On-Time Graduation Rate. The state’s graduation rate goal for All Students group and all subgroups is 100 percent. Rules are below.
Rules for On-Time Graduation Rate The Graduation Rate is defined as the number of students who graduate in four years with a regular high school diploma divided by the number of students who formed the adjusted cohort for that graduating class.
1. If students did not attend at least 50% of their senior year at one school, students count at the high school they attended the longest, or the last enrolled if there are multiple with equal enrollment lengths.
2. A student who takes longer than four years to graduate with a regular high school diploma o Must be included in the denominator of the four-year graduation rate but may not
be included in the numerator.
o May not be removed from the cohort in the four-year graduation rate (i.e., cohort year reassignment is not permitted).
Administrative Rule Definitions #18: Graduation rate," the four-year adjusted cohort graduation rate for students who attended at least 50 percent of the last year of enrollment at the same attendance center or who did not attend at least 50 percent of the last year of enrollment at the same attendance center but attended a given attendance center for the longest period in which they were enrolled in a South Dakota secondary school, as defined in Title I, Part A, of the ESEA, 20 U.S.C. § 8101(25) (December 10, 2015).

Updated July 22, 2019
52
Early Graduate A student who graduates in less than four years is “banked” for a year or until the year that his or her cohort is expected to graduate. The student is then included in both the numerator and the denominator the year his or her cohort is included in accountability calculations. Newly enrolled students who subsequently drop are counted in the calculation as a drop for the serving school and district if they were enrolled in the serving district for 15 or more consecutive school days.
• If the newly enrolled student has been in a school less than 15 consecutive school days, the drop is counted at the state level only.
• Conversely, if a student is enrolled for less than 15 consecutive school days and graduates, the student counts as a graduate only at the state level.
On-Time Graduation Exceptions (4-year adjusted cohort) To remove a student from a cohort, a school or district must enter details in Infinite Campus by the second Friday in June, that the student:
1. Transferred out b) Documentation must consist of official written notice that the student is enrolled in another
school or an educational program which culminated in the award of a regular high school diploma.
c) Official written documentation includes: o Evidence of transfer recorded in Infinite Campus (state’s data system) o Request for records from the receiving high school (documentation should be
entered into Infinite Campus system by the second Friday in June o An approved application for home school for the current school year sent to state
by the second Friday in June o Letter from an official in the receiving high school acknowledging the student’s
enrollment NOTE: A student who is retained in a grade, enrolls in a General Educational Development (GED) program, or leaves school for any other reason may not be counted as having transferred out for calculating graduation rate and must remain in the adjusted cohort.
2. Emigrated to another country d) A school or district must confirm in writing that a student has emigrated to another country,
but it does not need to be official documentation. e) Example of written confirmation might include:
o Memo to the student’s file based on a phone conversation with a parent stating that the student is leaving the country.
3. Died f) A school or district must confirm in writing that a student has passed away but does not
need to provide official documentation. g) Examples of written confirmation might include:
o An obituary o Letter from a parent
South Dakota is required to follow the Title I Four-Year Adjusted Cohort methodology in determining Graduation Rate, as defined in 34 C.F.R. § 200.19(b). (Source: Elementary and Secondary Education Act of 1965-ESEA).

Updated July 22, 2019
53
• This measure is based on the number of students who graduate in four years with a regular high school diploma, divided by the number of students who form the “adjusted cohort” for that graduating class.
• The adjusted cohort is defined as the students who entered ninth grade for the first time four years ago, minus those who transferred out of the cohort (i.e., moved out of state, transferred to a private school, etc.), plus students who joined the cohort (i.e., students who began four years ago as a ninth grader in a private school, out of state, etc.)
• Only students who graduate with a regular diploma are counted positively. • Those who continue their education beyond four years, those who finish with a GED, students
with disabilities that completed IEP team modified course requirements, and those who drop out are all counted against the Four-Year Graduation Rate.
Calculation Numerator = Number of cohort members who graduate in 2018-19 within four years from their first
point of entry into 9th grade (fall 2015) with a regular high school diploma
Denominator = Number of first-time ninth graders (starting cohort year-fall 2015), plus students who transfer in, minus students who are removed from the cohort during the school years 2015-16, 2016-17,
2017-18, and 2018-19 Earning SPI Points The points for On-Time Graduation are calculated and earned based on the Four-Year Cohort Graduation Rate multiplied by 12.5 Points. Image of the High School Completion page in the 2017-18 report card:

Updated July 22, 2019
54
Indicator #3: High School Completion The High School Completion indicator measures the percent of students in the most recently completed school year who have attained a diploma or a GED. This includes students who graduated outside of the traditional four-year timeframe (both early and late graduates). Students that dropped out in the current school year are also included in the calculation of the SPI points for this indicator. High School Completer Rate Calculation Procedures The completer rate allows the addition of GED completers to be added to the number of graduates in the numerator of the calculation. The denominator is the sum of graduates + GED completers + 9th grade dropouts 3 years earlier + 10th grade dropouts 2 years earlier + 11th grade dropouts’ previous year + 12th grade dropouts’ current year. The below is an explanation of the process. Dropout Definition SDDOE uses the dropout definition provided in Administrative Rules: Definitions Section (see Appendix D). A student is counted as a dropout if she or he:
a) Was enrolled in school at some time during the school year and was expected to be enrolled the following year but was not enrolled;
b) Has not graduated from high school or completed a state or district approved educational program; and
c) Has not met any of the following exclusionary conditions: i. Transfer to another public school district, private school, or state or district-approved
educational program ii. Temporary school-recognized absence due to suspension or illness
iii. Death
Dropout Rules A dropout is a student who never re-enrolls nor completes a GED. The dropout counts are based on exit codes that are used to calculate the dropout rate:
• 02-Discontinued education-dropped out • 01: Expelled, did not return to any school • 07: Reached maximum age for special ed • 18-Discontinued Education/exceeds compulsory age • Exception is the GED completer 17 -Discontinued Education-Completed GED (SPED Code 8-
Dropped out) • SPED exit codes are not considered when calculating dropouts. Only the General Education
exit codes are used for SPED students.
Enrollment records for the relevant grades and years above, would determine the initial dropout count. • Subsequent enrollments in both the same year as a dropout occurred and succeeding years
following the dropout year would constitute a return-to-school and effectively zero out the dropout for that given year.
• This return-to-school examination process would reduce the dropout count and increase the completer rate.
GED Rules Students who obtained an alternate completion credential before age 21, namely the GED are included.

Updated July 22, 2019
55
This can be noted in one of two places: exit codes of 17 in Infinite Campus or in data files of GED students. In Infinite Campus, schools can note GED recipients via an exit code. This exit code is 17. Districts do not always know if a former student has completed a GED. Subsequently, the last exit code in Infinite Campus has not been updated to = ‘17’. Therefore, the SDDOE received data on GED recipients from the Department of Labor and Regulation. There are two files, and both files are loaded into SD-STARS, and both files are considered for accountability. By considering both the Infinite Campus exit codes and the DLR files, there are two ways accountability will mark a student as a GED completer. A few things about the GED files
• Department of Labor and Regulation provides GED data files two times during a school year. • To match students in the GED file to a student in Infinite Campus, the name and date of birth
must match to the most recent enrollment year of enrollment. Without this match, the student may not be counted as a GED completer.
• Any schools with students who completed a GED outside of South Dakota can submit that record to the SDDOE through the appeal process available to districts which requires documentation from the serving institution. The Department of Labor and Regulation can only pull records from GED attainment within the state. Districts that can present proof of GED attainment from another state may do so during the appeal window for inclusion in the completer count.
Completer Rules • The Completer Rate is defined as the percent of students in the most recently finished school
year who have attained a diploma or a GED. The premise behind the Completer Rate is to give schools credit for working with students to obtain completion in some fashion. This may include obtaining the traditional diploma regardless of the time it takes to complete their high school course work (beyond the traditional four years) or by working with students to prepare them to get a GED.
• If students did not attend at least 50% of their last enrolled year at one school, students count at the high school they attended the longest, or the last enrolled if there are multiple enrollments with equal enrollment lengths (new rule in 17-18).
Collection, Processing, Loading Schedule for On-Time and High School Completion Data Files Data Element Provider of
data file File Received Timeline
File Processing Timeline-OES
Loaded in STARS
Data Year
On-Time Graduation
OES June 30 July July 9 current
High School Completion
OES June 30 July July 9 current
Adjusted Cohort DM Analyst May 30 June July 9 current Dropout DM Analyst April 30 July July 9 Previous
year GED (2 files) DLR/DM
Analyst May July July 9 current

Updated July 22, 2019
56
Calculation Numerator = Number of students who obtained a high school diploma or GED in the most recently
completed school year
Denominator = Dropouts (Grade 9 dropouts in 2015-16 + Grade 10 dropouts in 2016-17 + Grade 11 dropouts in 2017-18 + Grade 12 dropouts in 2018-19) +
the number of students who obtained a high school diploma or GED in the most recently completed school year
Earning SPI Points The points for High School Completion are calculated based on the Completer Rate multiplied by 12.5 Points. Image of the High School Completion page in the 2017-18 report card:
Indicator #4: College and Career Readiness The College and Career Readiness indicator changed in 2017-18 school year, and the indicator for 2018-19 stayed the same as 2017-18. The CCR indicator is a comprehensive measure that includes assessments and coursework for both college and career readiness. students are required to meet Assessment Readiness and Coursework Readiness. Three measures are reported in the report card for CCR: assessment readiness, coursework readiness, and both assessment AND coursework readiness. Unlike other indicators, the student cohort is comprised of the previous year’s completer roster.

Updated July 22, 2019
57
Administrative Rule 24:55:02:09. Calculation of college and career readiness SPI key indicator score. The department shall base the college and career readiness SPI key indicator score for public secondary schools on postsecondary preparedness for college and career through two pathways: assessment of readiness and progress towards post high school credentials. Assessment of readiness shall be evidenced by participation in and performance on: The South Dakota Assessments, the American College Test (ACT) for high school achievement, the College Board Accuplacer test, and the National Career Readiness Certificate/ACT Work Keys (NCRC). Progress towards post-high school credentials shall be evidenced by performance on an Advanced Placement exam, completion of a dual credit course sponsored by the state or earning Career and Technical Education Concentrator status. The department shall calculate the college and career readiness SPI key indicator score for a public secondary school by adding together the numbers obtained via the calculations in §§ 24:55:02:09.04 and 24:55:02:09.05. CCR Data Elements and Measures Table (view details in report card)
Assessment Readiness for College or Career Coursework Readiness for College or Career*
Student must meet 1 readiness indicator Student must meet 1 readiness indicator • College English Readiness- meet 1 of 3 options:
1. SD-ELA Level 3 or 4 in ELA 2. ACT English sub-score of 18 3. Accuplacer score on Sentence Skills of
86 or higher • College Math Readiness- meet 1 of 3 options:
1. SD-MATH Level 3 or 4 in math 2. ACT math sub-score of 20 3. Accuplacer score on Algebra of 76 or
higher
• CTE Concentrator- career course readiness 2 credits within 1 career cluster
• Dual credit- college course readiness 1 course completed with a C or higher
• Advanced Placement exam- college course readiness 1 course completed with an exam score of 3
or higher
• Career English and Math Readiness- earn silver or higher National Career Readiness Certificate
* Progress towards post-high school credentials is labeled as “Coursework Readiness for College or Career” in this table.
Details of CCR indicator measures in the above table as reported on the report card:
1. Coursework Readiness (includes college and career coursework options) a. Students must meet one of the following criteria to be counted as coursework ready:
i. Career and Technical Education concentrator, which means the student completed 2 credits within 1 career cluster
ii. Completion of a state-sponsored dual credit course with a C or higher iii. Score of 3 or higher on an Advanced Placement exam
2. Assessment Readiness (includes college and career assessment options) 3. Students are Assessment Ready if they meet the benchmark on one of the four assessment
options for both English/Reading and math. See section about Assessment Readiness for more information.

Updated July 22, 2019
58
4. College AND Career Readiness a. This measure reflects students who met both the criteria for Coursework Readiness AND
Assessment Readiness measures. CCR Rules
1. Use Completer roster from previous year. 2. A student will count for the college and career readiness key indicator at the school for
which the student counted for the purposes of the prior year completer rate 3. Identify all assessment and coursework taken anytime during a student’s high school career
for each student by matching student ID. 4. Identify if the student met any of the benchmarks. Each of the assessment readiness and
coursework readiness measures has its own benchmark. 5. If an assessment or course is taken multiple times, only the best mark is considered; only C
or better for courses-see table above.
Earning SPI Points The College and Career Readiness indicator has a value of 25 points. To award points for this indicator, the prior year’s completer roster data will be examined, and students will be classified into one of three categories with their point value:
• No Indicators met = 0 point • Either Assessment Readiness met OR Coursework Readiness met = 0.5 points • Both Assessment Readiness AND Coursework Readiness measures met = 1.0 point
This is an example of how to calculate College and Career Readiness indicator:
No Indicators Met One Indicator Met Both Indicators Met Totals Total Points Earned N-size 20 60 120 200
% of All Students 10.00% 30.00% 60.00% 100% Point value 0.00 0.50 1.00 % of Points Earned 0.00 15.00% 60.00% 75.00% 18.75
The points for College and Career Readiness are calculated by taking the total percentage of points earned multiplied by 25. N-Size Rule of 10 N-sizes and subgroup information will be reported for this indicator-both for assessment and coursework readiness. N-size suppression rules will apply. If the number of students who met the different measures (ex:South Dakota Assessments, ACT, Accuplacer, and/or NCRC) is less than 10, the percentage of students will be suppressed in the public report card. SPI points associated with college and career readiness will still be calculated and displayed, regardless of N-size. Redistribution of SPI Points for CCR Sometimes a school will have no students in assessment readiness. That means no students took the South Dakota Assessments, the ACT, Accuplacer, or NCRC. Sometimes a school will have no students in coursework readiness. That means no students participated in state-sponsored dual credit program, took the AP exam, or was a CTE concentrator. In these cases, schools are exempt from this part of the indicator.

Updated July 22, 2019
59
• If a high school has no students in CCR, then those 25 points are redistributed equally to the
other three Academic Indicators: o Student Performance would be 48.3 Points (40 + 8.3 = 48.3) o On-Time Graduation would be 20.83 Points (12.5 + 8.3 = 20.8) o English Language Learner Progress would be 18.4 Points (10 + 8.4 = 18.4) o High School Completion would stay as 12.5 Points, because it is a non-academic/School
Quality measure
Assessment Readiness TheSouth Dakota Assessments, ACT, and Accuplacer assessments are used to measure college assessment readiness, a component of the College and Career Readiness key indicator in the SPI. The state’s goal is that 100 percent of students taking a college readiness assessment will meet the Board of Regents cut scores:
• South Dakota Assessments: o ELA: Level 3 or 4 o Math: Level 3 or 4
• ACT: o English: 18 o Math: 20
• Accuplacer o Sentence Skills: 86 o Algebra: 76
South Dakota Assessments Procedures: The vendor will use the South Dakota Assessment scores on file from the appropriate years for the cohort, including possibilities that the student took the assessment either as an 11th or 12th grader. If the student took the South Dakota Assessments multiple times, the maximum score for ELA and the maximum score for math will be used. ACT Procedures: Two types of ACT files are received by SDDOE and loaded into SD-STARS:
1. Test-taker files– received in December, February, April, June, and September – which include all tested students, regardless of year of graduation, and all test results
2. Graduating class (graduate) file from previous year, which contains public school students who indicated a year of graduation. Test scores in this file are from the most recent test a given student has taken- August of previous year
Both types of files are loaded into SD-STARS and are considered for accountability. When SDDOE loads the file, records in the ACT file are matched to a student in Infinite Campus. Analysis for this indicator is based on the percentage of school students who received a math sub score of 20 or greater and the percentage of students who received an English sub score of 18 or higher.

Updated July 22, 2019
60
Accuplacer Procedures: To ensure consistency, the SDDOE requests Accuplacer files covering the span during which students in the previous year would have taken the Accuplacer (16-month date range). The Board of Regents file is requested by the Office of Learning and Instruction and the BOTE (technical institutes) files are requested by the Accountability Office. All Accuplacer files are loaded into SD-STARS and considered for accountability. When SDDOE loads the file, records in the Accuplacer file are matched to a student in Infinite Campus. Like the ACT, analysis for this indicator is based on the percentage of students taking the Accuplacer sentence skills assessment who scored at an 86 or above, and the percentage of students taking the Accuplacer algebra assessment who scored at a 76 or higher, out of the total number of students who took each respective assessment. National Career Readiness Certificate (NCRC): National Career Readiness Certificate file is loaded into SD-STARS and considered for accountability. When SDDOE loads the file, records in the NCRC file are matched to a student in Infinite Campus. Compiling Assessment Readiness The prior year high school completion roster is matched against the South Dakota Assessment files, the ACT graduate and testing files, the Accuplacer files, and NCRC. When a student appears in the roster and in any of these files, data are combined. This measure will use the maximum test scores achieved in the areas of math and English forSouth Dakota Assessments, ACT, Accuplacer, and NCRC. For example:
• If a student earned an ACT English sub-score of 19 and an Accuplacer Algebra score of 81, then the student is considered Assessment Ready
• If a student earned a Silver or higher on the NCRC, then the student is considered Assessment Ready
Collection Schedule -CCR Data Files
Data Element Provide data file
Request data file/ provide file specs
Date for data file
Timeline File Load
Data Year
NCRC Department of Labor and Regulation
Accountability Team
2017-18
January Previous year
SD Assessments AIR Assessment Team
2017-18 June 30 Previous year
Accuplacer/BOR BOR Division of Learning and Instruction
July 1, 2017 to Aug 1, 2018
January Previous year
Accuplacer/BOTE BOTE Accountability Team
July 1, 2017 to Aug 1, 2018
January Previous year
ACT test files Clive/DM SD-STARS Team 2017-18 September Previous year

Updated July 22, 2019
61
August Composite File
State-Sponsored Dual Credit
BOTE/BOR via CTE Team
SD-STARS Team 2017-18
October Previous year
AP Exams College Board Division of Learning and Instruction
2017-18
January Previous year
Career Concentrator
Perkins CTE Team 2017-18
December Previous year
Image of CCR page in 2017-18 public report card:
Indicator #5: English Language Learners Progress This indicator is the same for high schools as the elementary/middle schools; see pages 38-45 for details.

Updated July 22, 2019
62
Chapter Four: Additional Reported Data (Enrollment Demographics, Office of
Civil Rights Data Elements and Postsecondary Education Data)

Updated July 22, 2019
63
Additional Data Required by ESSA ESSA requires states to report additional data elements in the report card including enrollment demographics. However, SPI points are not awarded for these data elements. Data elements are described in this section based on where these data can be found in the report card. Enrollment Demographics Data and Sources Demographical characteristics are reported on the About the School page in the report card. Data sources include Fall Enrollment Count and Office of Civil Rights/CRDC data survey results (preschool enrollment, chronic absenteeism and AP coursework). ESSA requires counts/rates disaggregated by subgroups where data are available. OCR/CRDC data results are two years behind the current year report card. ESSA also requires states to breakout per pupil expenditures data at the school, district and state levels. Expenditures data will be reported once these data become available (2019-20). Currently, SDDOE reports general fund expenditures for districts, schools, and the state. Those reports are available at https://doe.sd.gov/ofm/statdigest.aspx.
About the School page Fall Enrollment Census Data (Source: Data Management and SD-STARS
Team) Data Element Business Rule/Numerator
Source Denominator Source
Fall Student Enrollment count
Fall enrollment count only Not applicable
School diversity enrollment rate
Subgroups by Race/Ethnicity
Fall enrollment count
Gap rate 3-year trend rate (Gap groups)
Enrollment by Gap over 3-years
Fall enrollment count over 3-years
Non-Gap rate 3-year trend rate (Non-Gap groups)
Enrollment by Non-Gap over 3-years
Fall enrollment count over 3-years
Economically Disadvantaged rate school comparison to state rate
Enrollment by Economically Disadvantaged-school/state
Fall enrollment count-school/state
English Learners rate school comparison to state rate
Enrollment by English Learners- school/state
Fall enrollment count-school/state
Students with Disabilities rate school comparison to state rate
Enrollment by Students with Disabilities –school/state
Fall enrollment count-school/state
Gap rate school comparison to state rate (Gap group)
Enrollment by Gap-school/state
Fall enrollment count-school/state
Non-Gap rate school comparison to state rate (Non-Gap group)
Enrollment by Non-Gap-school/ state
Fall enrollment count-school/state

Updated July 22, 2019
64
Data Elements Elem/Middle
Business Rule Source
Preschool Enrollment count
Count OCR/CDRC (biennially-April release) https://ocrdata.ed.gov/DistrictSchoolSearch#
Data Elements High Schools
Business Rule Source
Chronic Absenteeism Rate
The number of students who attended school for more than 10 days and who also missed 10% or more of the enrolled days in school year
SD-STARS (Attendance data file)
Chronic Absenteeism Count
The number of students who are absent 15 or more days
OCR/CDRC (biennially -April release) https://ocrdata.ed.gov/DistrictSchoolSearch#
Dropout Rate for District and State
Use EdFacts definition (7th – 12th grades)
SD-STARS (Dropout data file from DM)
Dropout Rate for High Schools
Use 9th – 12th grades SD-STARS (Dropout data file from DM)
Advanced Placement Enrollment Count
Number of students that took AP courses (two years behind in reporting year)
OCR/CDRC (biennially-April release); https://ocrdata.ed.gov/DistrictSchoolSearch#
School/district contact information; interactive school/district location map
Administrator name/school/district address/phone; URL to school/district webpage; latitude/longitude data file to locate schools on map
SD-STARS (Ed Directory data file); SD-STARS (latitude/longitude data file)

Updated July 22, 2019
65
Elem/Middle School image of About the School page:

Updated July 22, 2019
66
High School Image-About the School page:

Updated July 22, 2019
67
Postsecondary Enrollment Rates ESSA law requires states to report postsecondary enrollment rates for students that graduated from high school in a given school year, including students that graduated in the summer session. DOE defines a program of postsecondary education as: in and out of State higher education institutions including technical institutions, two and four -year institutions. States must report the rate of graduates enrolled in postsecondary institutions by subgroups including: all students, race/ethnicity, students with disabilities, English learners, and economically disadvantaged. Enrollment rates must be disaggregated by private, public in-state, and if data are available, out-of-state types and by two and four year and public technical institutions. DOE also reports the top four institutions that graduates attended and the average ACT composite score comparisons for school and state. DOE uses “higher education institution” instead of postsecondary in the report card because the public is more familiar with that term. Three data elements are reported on the CCR report card page. These are described below. Data Element I: Rates of graduates enrolling in higher education Data collection sources and procedures:
• Students who graduated in the previous year, are matched with student information from the National Student Clearinghouse (NSCH).
• SD-STARS receives this data from NSCH multiple times a year. These data show if the student enrolled in any higher education institution in the nation, given that institution is a data sharing member of NSCH.
• If the student has an enrollment record in NSCH within a 16-month period of completing high school, the student will count as enrolling in higher education.
• DOE may not be able to easily track students enrolled in a postsecondary institution that is out of State, however, the denominator includes those students whom we were unable to track.
Calculation
Numerator = Number of graduates who enrolled in postsecondary institution within 16 months of completing high school
Denominator = students that graduated in the previous school year including summer graduates

Updated July 22, 2019
68
Image of CCR Page/Percentage of Graduates Attending Higher Education within 16 months following Graduation:
Data Element II: Top Four Higher Education Institutions Attended by Graduates Data collection sources and procedures:
• Based on NSCH data, Accountability analyst selects the top four most frequently attended institutions from a list of all the institutions attended by graduates during the 16- month date range.
• Use first institution attended by student to avoid students who attended multiple institutions in the 16-month date range (eliminates duplications in count).
Most frequently attended high education institutions (see image below)
Data Element III: Average ACT Scores Comparison Data collection sources and procedures:
• Data Management’s data analyst provides average ACT scores for school, district, and state.

Updated July 22, 2019
69
Average ACT composite score comparison for school/state
Average ACT composite score comparison for district and state

Updated July 22, 2019
70
Chapter Five: Educator Qualifications

Updated July 22, 2019
71
Educator Qualifications The report card includes data measures for educator qualifications as required by ESSA and described in SD-DOE’s ESSA State Plan approved in June 2018 (https://doe.sd.gov/ESSA/). Data measures include: number and rate of inexperienced (3 or less years of experience); number and rate of out of field (teaching or leading without correct credentials for the subject or grade level in which they are teaching or for the position they hold); number and rate with no certification; number and rate with provisional or temporary certification; and number and rate with alternative certification or educator permit. There are five types of certification (teacher, administrator, education specialist, educator permit and alternative certification p. 87 State Plan). The certification status categories are: valid, expired, invalid, temporary, provisional, p. 87). The data source for all educator qualifications is the Personnel Record Form (PRF) system. The DOE’s Data Analyst for the PRF database system provides the data file used to calculate the measures for educator qualification for teachers and administrators per ESSA State Plan. Comparisons for school, district and state are provided in the report card for each of the measures for educator qualification. Data results are disaggregated by teachers and administrators in the report card. Staffing data are sourced from the PRF and Certification database systems by the Certification Office Data Analyst and provided to Office of Accountability. Each year the PRF system closes on the second Friday of June. Individuals working in the schools across the state are responsible for monitoring their data in the system; and can contact the Certification office to provide documentation or to make inquiries about their data. The following tables outline the column headings, descriptions and business rules for data in the PRF Database and used in the calculations. The left column of each table uses abbreviations for teacher and administrator, T and A.
Column Heading Description Business Rule (Formula) T, A Academic Year School Year "2017-" & [School Year] T, A Unique ID Unique Idea for staff based on a
combination of SSN and Birthdate Right([DE69(2018)]![SSN],4) & Mid([DE69(2018)]![Birthdate],1,2) & Mid([DE69(2018)]![Birthdate],4,2) & Mid([DE69(2018)]![Birthdate],7,4)
SSN Social Security Number This is used in initial pull of data but is deleted before the data is given to the contractor.
T, A First Name First name of staff person T, A Middle Name Middle name or initial of staff person T, A Last Name Last name of staff person T, A District Name Full Name of District T, A District ID District Number Five-digit district number T, A School Name School/Attendance Center T, A School ID Combination of 5-digit district
number and 2-digit school number. Ombudsman school in Sioux Falls is removed.
[District Number] & [Attendance Center No] <>"49005999" Ombudsman

Updated July 22, 2019
72
Column Heading Description Business Rule (Formula) T, A
Schools Removed Identifies when schools are included in the file for other purposes but should be removed from Report Card calculation. • Ombudsman School is
removed from the file
Y = Yes, school should be removed N = No, school should not be removed (IIf([School ID]="49005999","Y","N"))
T, A
Highest Degree Identifies the highest degree the individual has received.
No Degree/Unknown Associate degree Bachelor’s degree Master’s degree Education Specialist Degree Doctorate Degree Highest Degree Earned: (((((IIf([Doctorate Degree] Is Not Null,"Doctorate",(IIf([Specialist Degree] Is Not Null,"Specialist",(IIf([Masters Degree] Is Not Null,"Masters",(IIf([bachelors Degree] Is Not Null,"Bachelors",(IIf([associate Degree] Is Not Null,"Associate","Unknown"))))))))))))))
T, A
Salary Assignment Salary EDEN 059 File: Report staff in terms of FTE (full-time equivalent). FTE should be counted in hundredths. For example, if a teaching position is filled by 4 people, each working the same amount of time, each person would count as a .25 FTE. The total FTE counts for instructional staff must be reported to the nearest hundredth, with an EXPLICIT decimal (e.g., 59.20).
For full time employees, the assignment salary based on the % of FTE for the assignment multiplied by the full salary
For part time employees, calculate their overall full-time equivalency (FTE) to determine their part-time wage per assignment. The overall FTE represents the total number of actual paid hours during a period, so it is divided by the total salary (Total Salary/Total FTE]). Then calculate the assignment salary by taking your base rate of pay and multiplying it by the assignment FTE ((Total Salary/Total FTE) *Assignment FTE).
Tchr Assignment Salary: IIf([Total Instructional FTE]<0.009,0,IIf([Total Instructional FTE]<1,[Instructional Salary]/[Total Instructional FTE]*[Assignment FTE],[Instructional Salary]*[Assignment FTE]))
Admin Assignment Salary: IIf([Total Admin FTE]<0.009,0,IIf([Total Admin FTE]<1,([Administrative Salary]/[Total Admin FTE])*[Assignment FTE],[Administrative Salary]*[Assignment FTE]))
Column Heading Description Business Rule (Formula)
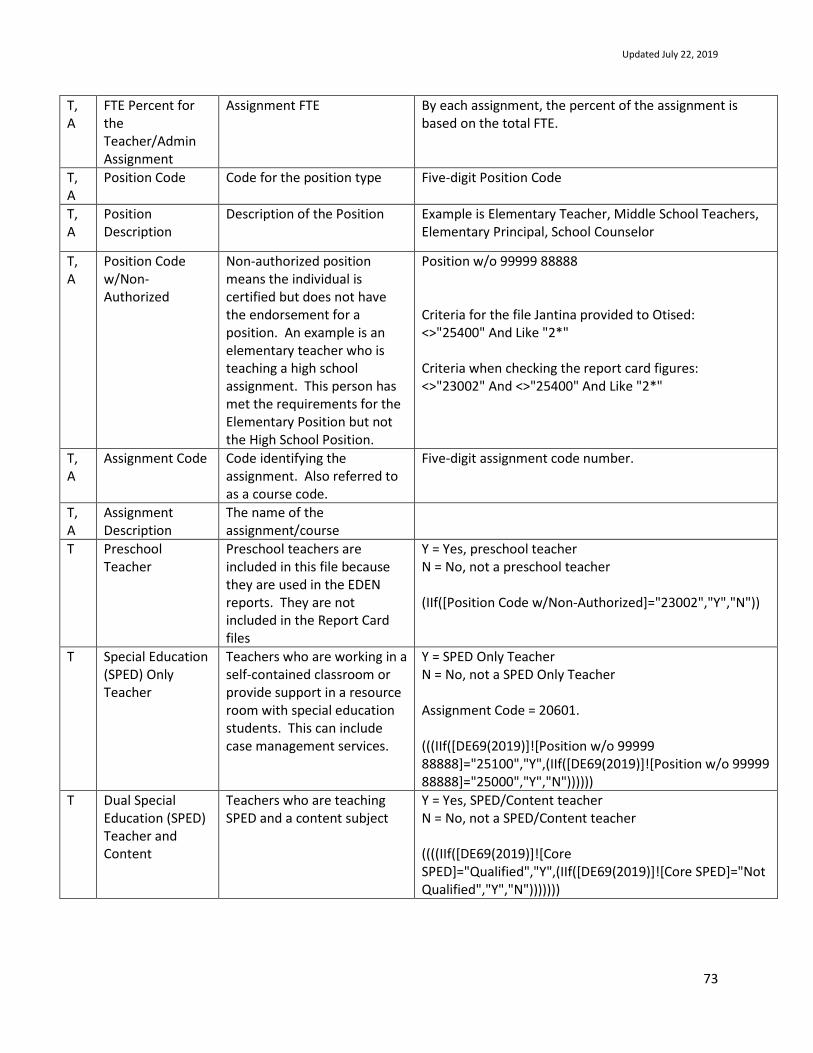
Updated July 22, 2019
73
T, A
FTE Percent for the Teacher/Admin Assignment
Assignment FTE By each assignment, the percent of the assignment is based on the total FTE.
T, A
Position Code Code for the position type Five-digit Position Code
T, A
Position Description
Description of the Position Example is Elementary Teacher, Middle School Teachers, Elementary Principal, School Counselor
T, A
Position Code w/Non-Authorized
Non-authorized position means the individual is certified but does not have the endorsement for a position. An example is an elementary teacher who is teaching a high school assignment. This person has met the requirements for the Elementary Position but not the High School Position.
Position w/o 99999 88888 Criteria for the file Jantina provided to Otised: <>"25400" And Like "2*" Criteria when checking the report card figures: <>"23002" And <>"25400" And Like "2*"
T, A
Assignment Code Code identifying the assignment. Also referred to as a course code.
Five-digit assignment code number.
T, A
Assignment Description
The name of the assignment/course
T Preschool Teacher
Preschool teachers are included in this file because they are used in the EDEN reports. They are not included in the Report Card files
Y = Yes, preschool teacher N = No, not a preschool teacher (IIf([Position Code w/Non-Authorized]="23002","Y","N"))
T Special Education (SPED) Only Teacher
Teachers who are working in a self-contained classroom or provide support in a resource room with special education students. This can include case management services.
Y = SPED Only Teacher N = No, not a SPED Only Teacher Assignment Code = 20601. (((IIf([DE69(2019)]![Position w/o 99999 88888]="25100","Y",(IIf([DE69(2019)]![Position w/o 99999 88888]="25000","Y","N"))))))
T Dual Special Education (SPED) Teacher and Content
Teachers who are teaching SPED and a content subject
Y = Yes, SPED/Content teacher N = No, not a SPED/Content teacher ((((IIf([DE69(2019)]![Core SPED]="Qualified","Y",(IIf([DE69(2019)]![Core SPED]="Not Qualified","Y","N")))))))

Updated July 22, 2019
74
T English as a Second Language (ESL) Only Teacher
Teachers who are working a self-contained classroom or provide support in a resource room with ESL students.
Y = ESL Only Teacher N = No, Not an ESL Only Teacher Assignment Code = 01508 or 01008 or 01608 (((IIf([DE69(2019)]![Assignment Code]="01008","Y",(IIf([DE69(2019)]![Assignment Code]="01508","Y",(IIf([DE69(2019)]![Assignment Code]="01608","Y","N"))))))))
T Dual English as a Second Language (ESL) Teacher and Content
Teachers who are teaching ESL and a content subject
Y = Yes, ESL/Content teacher N = No, not an ESL/Content teacher ((((IIf([DE69(2019)]![Core ESL]="Qualified","Y",(IIf([DE69(2019)]![Core ESL]="Not Qualified","Y","N")))))))
Column Heading Description Business Rule (Formula) T Dual
Blind/Visually Impaired Teacher (BV) and Content
Teachers who are teaching BV and a content subject
Y = Yes, BV/Content teacher N = No, not an BV/Content teacher ((((IIf([DE69(2019)]![Blind/Visually Impaired]="Qualified","Y",(IIf([DE69(2019)]![Blind/Visually Impaired]="Not Qualified","Y","N")))))))
T Dual Deaf/Hearing Impaired (DH)Teacher and Content
Teachers who are teaching DH and a content subject
Y = Yes, DH/Content teacher N = No, not an DH/Content teacher ((((IIf([DE69(2019)]![Deaf/Hearing Impaired]="Qualified","Y",(IIf([DE69(2019)]![Deaf/Hearing Impaired]="Not Qualified","Y","N")))))))
T, A
National Board Certification
Teachers or Administrators who have completed National Board Certification
Y = Yes, have received National Board Certification N = No, have not completed National Board Certification
T Average Years of Experience – Teaching
Years of Experience as a Teacher Years of experience includes teaching experience at the school, district, another district in South Dakota or out-of-state, and time on the alternative certification program.
0 = 0 to 1 year of experience as a teacher 1 = 1 to 2 years of experience as a teacher 2 = 2 to 3 years of experience as a teacher Multiply each “years of experience” times the weight, then all products together then divided by total headcount. SUMPRODUCT($D$1:$BA$1,D2:BA2)/C2
T First Year Teacher First year of Teaching Y = Yes, the teacher is in their first year of teaching N = No, the teacher is not in their first year of teaching Tchr First-Year Flag: IIf([Instructional Experience]=0,"Y","N")

Updated July 22, 2019
75
A First Year Administrator
First year as an Administrator Y = Yes, the administrator is in their first year of being an administrator N = No, the administrator is not in their first year of being an administrator Admin First-Year Flag: IIf([DE69(2018)]![Administrative Experience]=0,"Y","N")
Column Heading Description Business Rule (Formula)
T,A Inexperienced 3 or less years of experience.
Y = Yes, the staff person is inexperienced N = No, the staff person is not inexperienced
Includes all teachers or administrators where years of experience = 0, 1, or 2
Teacher Inexperienced: IIF([Instructional Experience]<3,”Y”,”N”)
Administrator Inexperienced: IIF([Administrative Experience]<3,”Y”,”N”)
T,A Certified Flag Staff person has an educator certificate. Staff who are certified include individuals with a valid, provisional, or temporary certificate. Staff who have an Alternative Preliminary Certificate are not included.
Y = Certified N = Non-Certified Not to include a staff person who has only the Alternative Preliminary Certificate. Certificate status is Y (yes). (IIf([DE69(2018)]![CertificateStatus]= "certified","Y","N"))
T Required Dual-Certification Flag
When staff teach double courses, for example SPED/Algebra I, the staff person must be authorized for both SPED and the content to receive a Yes in this column. These teachers are required to hold dual-certification in the content area plus additional certification in special education (SPED), English as a second language (ESL), Blind/ Visually Impaired, or Deaf/Hearing Impaired.
Y = Certified N = Not Certified in SPED, or ESL, or Blind/ Visually Impaired, or Deaf/Hearing Impaired Blank = Not required to be Dually Certified IIf([DE69(2019)]![Core SPED]="Not Qualified","N",(IIf([DE69(2019)]![Core ESL]="Not Qualified","N",(IIf([DE69(2019)]![Blind/Visually Impaired]="Not Qualified","N",(IIf([DE69(2019)]![Deaf/Hearing Impaired]="Not Qualified","N",IIf([DE69(2019)]![Core SPED]="Qualified","Y",(IIf([DE69(2019)]![Core ESL]="Qualified","Y",(IIf([DE69(2019)]![Blind/Visually Impaired]="Qualified","Y",(IIf([DE69(2019)]![Deaf/Hearing Impaired]="Qualified","Y",""))))))))))))))

Updated July 22, 2019
76
T,A Authorized Flag Staff are certified and have the endorsement required for the assignment.
Y = Yes authorized N = No, not authorized
No - Staff person has a Plan of Intent or Position Code is non-authorized.
(((((((IIf([position code]="00000","N",(IIf([position code]="11111","N",(IIf([position code]="55555","N",(IIf([position code]="66666","N",(IIf([position code]="77777","N",(IIf([position code]="88888","N","Y"))))))))))))))))))
T,A Plan of Intent Staff are on a Plan of Intent for the assignment
Y = Yes N = No Plan-of-Intent: IIf([DE69(2019)]![Position w/o 99999 88888]="30002","N",(IIf([DE69(2019)]![Position w/o 99999 88888]="30102","N",(IIf([DE69(2019)]![Position w/o 99999 88888]="30202","N",(IIf([DE69(2019)]![Position w/o 99999 88888]="30302","N",(IIf([Out of Field]="Y","Y","N"))))))))) Plan-of-Intent: IIf([DE69(2019)]![Position w/o 99999 88888]="23002","N",(IIf([Out of Field]="Y","Y","N")))
Column Heading Description Business Rule (Formula) T Out of Field Staff who do not have the
endorsement required for an assignment/course and are on a Plan of Intent.
Required Dual Certification Recommendation: Whether they are on a POI for one, or both areas, it should be identified as one Yes.
Note: This requirement impacts teachers who are teaching SPED, ESL, Deaf, and Blind cohorts of students and the content area such as math. Example:
Y = Yes, Out of field N = No, not out of field
Out of Field: IIf([Certified Flag]="N","Y",(IIf([Authorized Flag]="N","Y",(IIf([Required Dual-Certification Flag]="N","Y","N"))))) The following formula was used for the 17-18 school year: IIf([Certified Flag]="Y" And [Authorized Flag]="N","Y","N")

Updated July 22, 2019
77
1. A staff person is teaching SPED /Math for.25 FTE: • Authorized (not on a
POI) to teach SPED but not authorized (on a POI) to teach Math = .25 FTE is used in the calculation for Out-of-Field.
• Not authorized to teach SPED or Math = .25 FTE is used in the calculation for Out-of-Field.
• Authorized to teach SPED and Math = .00 FTE is used in the calculation for Out-of-Field.
A Out-of-Field Staff who do not have the endorsement required for an assignment/course and are on a Plan of Intent.
Y = Yes, Out of field N = No, not out of field Out of Field2: IIf([Certified Flag]='N',"Y",(IIf([Authorized Flag]='N',"Y","N")))

Updated July 22, 2019
78
Column Heading Description Business Rule (Formula) T,A Inexperienced and
Out-of-Field Staff who are both inexperienced and are out-of-field.
Y = Yes, inexperienced and out-of-field N = No, not inexperienced and out-of-field Staff person will have both indicators: Inexperienced Column = Y Out-of-Field Column = Y IIf([Out of Field]="Y" And [Inexperienced]="Y","Y","N")
T, A Provisional Staff, who have a Provisional Certificate and have previously received an educator certificate in another state.
Must currently have a valid Provisional certificate.
Provisional Certificate includes individuals who have requested a South Dakota Educator Certificate through reciprocity with another state, and, need to complete the South Dakota Indian Studies course required by state statute. Applicants may renew this certificate one time. This is referred to as Provisional Renewal.
Y = Yes, Provisional Certificate N = No, does not have a Provisional Certificate Provisional: (IIf([reason]="Provisional (1 year)" And [Certificate Status]="certified","Y","N"))
T, A Temporary Certificate
Staff who have a Temporary Certificate have previously received an educator certificate in South Dakota. Must currently have a valid Temporary certificate. Temporary Certificate includes individuals who have previously met the South Dakota certification requirements but did not renew their certificate by the date that it became Invalid. When this occurs, the individual may apply for a Temporary Certificate in order to complete the increased renewal requirements resulting from their certificate becoming invalid.
Y = Yes, Temporary Certificate N = No, does not have a Temporary Certificate Temporary Certificate: (IIf([reason]="Temporary (1 year)" And [Certificate Status]="certified","Y","N"))

Updated July 22, 2019
79
Column Heading Description Business Rule (Formula) A Alternative
Certification Superintendent
Staff who have an Alternative Superintendent Preparation with a Not Completed Level. Must have a valid certificate.
Y = Yes, has a Superintendent Alternative Certificate N = No, does not have a Superintendent Alternative Certificate Alt Cert Superintendent: IIf([Alt Cert]="Y" And [Superintendent]="Y" And [Certified Flag]="Y","Y","N")
A Alternative Certification Principal
Staff who have an Alternative Principal Preparation with a Not Completed Level. Must have a valid certificate.
Y = Yes, has a Principal Alternative Certificate N = No, does not have a Principal Alternative Certificate Alt Cert Principal: IIf([Alt Cert]="Y" And [Principal]="Y" And [Certified Flag]="Y","Y","N")
A Administrator Alternative Certification
Staff who have Not Completed Alternative Certification Principal or Not Completed Alternative Certification Superintendent
This gets deleted before we give the file to Otis Ed. Y = Yes, has a Alternative Certificate that is not complete N = No, does not have a Principal Alternative Certificate Alt Cert: (IIf([Cert Type Code 1]="Administrator Alternative Certification - Not Completed","Y",(IIf([Cert Type Code 2]="Administrator Alternative Certification - Not Completed","Y",(IIf([Cert Type Code 3]="Administrator Alternative Certification - Not Completed","Y",(IIf([Cert Type Code 4]="Administrator Alternative Certification - Not Completed","Y","N"))))))))
A Principal Staff has a Position Code of a Principal. This data is used specifically for the administrator data table.
This gets deleted before we give the file to Otis Ed. Principal: (IIf([DE69(2018)]![Preparation 1]="AC40","Y",(IIf([DE69(2018)]![Preparation 2]="AC40","Y",(IIf([DE69(2018)]![Preparation 3]="AC40","Y",(IIf([DE69(2018)]![Preparation 4]="AC40","Y",(IIf([DE69(2018)]![Preparation 5]="AC40","Y",(IIf([DE69(2018)]![Preparation 6]="AC40","Y",(IIf([DE69(2018)]![Preparation 7]="AC40","Y","N"))))))))))))))

Updated July 22, 2019
80
Column Heading Description Business Rule (Formula) A Superintendent Staff has a Position Code of
Superintendent. This data is used specifically for the administrator data table.
This gets deleted before we give the file to Otis Ed. Superintendent: (IIf([DE69(2018)]![Preparation 1]="AC39","Y",(IIf([DE69(2018)]![Preparation 2]="AC39","Y",(IIf([DE69(2018)]![Preparation 3]="AC39","Y",(IIf([DE69(2018)]![Preparation 4]="AC39","Y","N"))))))))
A CEO Staff has a Position Code of CEO. This data is used specifically for the administrator data table. Staff is identified as an administrator and preparation is CEO.
Must have a valid certificate.
Y = Yes, is reported as a CEO N = No, staff is not reported as a CEO CEO: IIf([Position w/o 99999 88888]="33333" And [CEO]="Y" And [Certified Flag]="Y","Y","N")
T Teacher Permit Staff has a certificate type of Educator Permit with a certificate type of: • CTE Instructor; • Performing Artist; • Expert Lecturer; • American Sign Language
Instructor; • Braille Education Instructor; • Eminent Scholar; • International Teacher; • Junior ROTC; or • Native American Language
and Culture certificate type Must have a valid certificate.
Y = Yes, is teaching with a valid Educator Permit N = No, is not teaching based on a valid Educator Permit Teacher Permit2: IIf([Teacher Permit]="Y" And [Certified Flag]="Y","Y","N")
T Alternative Certification for Teachers
Staff who have an Alternative Certification Preparation with a Not Completed Level.
Must have a valid certificate.
Alternative Certification Options for Teachers: • General Education Alternative
Certification • Teach for America Alternative
Certification CTE Alternative Certification
Yes – Yes, holds a valid Alternative Certificate No – No, doesn’t hold an Alternative Certificate Alt Cert2: IIf([Alt Cert]="Y" And [Certified Flag]="Y","Y","N")

Updated July 22, 2019
81
T, A Provisional or Temporary
Staff who have either a Provisional or Temporary Certificate.
Yes = Yes, has a Provisional or Temporary Certificate No = No, does not have a Provisional or Temporary Certificate. IIf([Provisional]='Y',"Y",(IIf([Temporary Certificate]='Y',"Y","N")))
T Alt Cert OR Permit Staff who have either an Alternative Certificate or a Teacher Permit
Yes = Yes, has an Alternative Certificate or Teacher Permit No = No, does not have an Alternative Certificate or Teacher Permit. IIf([Alt Cert2]='Y',"Y",(IIf([Teacher Permit2]='Y',"Y","N")))
A Alt Cert OR CEO Administrators who are on Alternative Certification or have a CEO Educator Permit
Yes = Yes, has an Alternative Certificate for Administrators or a CEO Educator Permit No = No, does not have an Alternative Certificate for Administrators or a CEO Educator Permit. IIf([Alt Cert Superintendent]='Y',"Y",(IIf([Alt Cert Principal]='Y',"Y",(IIf([CEO2]='Y',"Y","N")))))

Updated July 22, 2019
82
The Teacher Qualifications table below consists of data elements reported on the Report Card. Data are pulled from the Staffing Table in the database system.
Data Element Reporting
Level Business Rule (number and rate reported)
Preschool Teachers
State District School
Preschool Teachers column = Y then do not include.
Schools Removed
State District School
If Schools Removed column = Y then do not include.
Number of teachers
State District School
Total FTE of teacher table and round to the nearest hundredth. • All teachers by FTE
o Column - FTE Percent for the Teacher/Admin Assignment Total the FTE and round to the nearest hundredth.
o Included Librarians in 2017-18. Need to determine if we will exclude librarians in 2018-19. Librarians will be excluded going forward.
Average years of experience
State District School
This was not on the report card for SY 2017-18.
This is a weighted calculation that will be done by the following: Step 1: Multiply each “years of experience” times the weight, then add all the
products together. Step 2: The number from Step 1 will be divided by the total headcount to calculate
the average years of experience by state, district and school. The business rule is =SUMPRODUCT($D$1:$BA$1,D2:BA2)/C2.
Office of Educator Certification will calculate average years of experience and report these to Accountability.
Inexperienced (3 or less yrs)
State District School
Inexperienced Teacher column = Y. • Total FTE and round to the nearest hundredth. • Determine percentage based on FTE of Number of Teachers Column and FTE of
Inexperienced column. Out-of-Field State
District School
Out-of-Field Column = Y. • Total FTE and round to the nearest hundredth. • Determine percentage based on FTE of Number of Teachers Column and FTE of
Out-of-Field column.
NOTE: Use new definition per 2019 amended State Plan Out-of-field teacher is a teacher who is not properly certified to teach the subject to which he is assigned and who is placed on a Plan of Intent pursuant to state administrative rules. The Plan of Intent outlines the steps the teacher will take to become properly certified for a specific subject.

Updated July 22, 2019
83
Data Element Reporting Level
Business Rule (number and rate reported)
Inexperienced and Out-of-Field
State District School
Inexperienced and Out-of-Field column = Y. • Total FTE and round to the nearest hundredth. • Determine percentage based on FTE of Number of Teachers Column and FTE of
Inexperienced/Out-of-Field column. 3 or Less Years Experienced AND Outside of Certification Area Flag: IIf([Out of Field]="Y" And [Inexperienced]="Y","Y","N")
Additional Information South Dakota will provide according to the amended State Plan: The district and school report cards provide information about teachers and administrators. The report cards help paint a picture of teacher effectiveness including: • Number of teachers • Average years of experience • Highest degrees attained by educators Report cards will include information about: • Total number of teachers teaching outside their area of certification • Number of teachers teaching on Special Permits • Number of teachers within their first three years in the classroom The rates of teachers in each of these categories will be examined by the state to ensure that Title I schools do not have disproportionate rates. Provisional or Temporary cert
State District School?
Provisional or Temporary Column = Y. • Total FTE and round to the nearest hundredth. • Determine percentage based on FTE of Number of Teachers Column and FTE of
Provisional/Temporary Column. Alternative Certification and Educator Permit
State District School
Alt Cert or Permit for Teachers Column = Y. • Total FTE and round to the nearest hundredth. Determine percentage based on FTE of Number of Teachers Column and FTE of Alt Cert or Permit Column.
Certified teachers
State District School
Certified Flag Column = Y. • Total FTE and round to the nearest hundredth. • Determine percentage based on FTE of Number of Teachers Column and FTE of
Certified Teachers Column.
Highest degree earned
State District School
Highest degree by type; Disaggregate by No Degree/Unknown, Associate, Bachelors, Masters, Doctorate, Specialist. Headcounts are used as denominator; number of degrees by degree type is numerator. Reported by headcount to the hundredth.

Updated July 22, 2019
84
Image of the Teacher Qualifications Data in report card:
Image of the highest degree earned by degree type in the 2017-18 report card:

Updated July 22, 2019
85
Administrator Qualifications. The following data elements are reported on the Report Card. Data is pulled from the Staffing Table.
Data Element Reporting
Level Business Rule (number and rate reported)
Schools Removed
State District School
If Schools Removed column = Y then do not include.
Number of administrators
State District School
Total FTE of administrator table and round to the nearest hundredth. Number of full-time equivalent KG-12 teaching positions to the nearest hundredth. • All administrators by FTE
o Column - FTE Percent for the Teacher/Admin Assignment Total the FTE and round to the nearest hundredth.
Inexperienced (3 or less yrs)
State District School
Inexperienced Administrator column = Y. • Total FTE and round to the nearest hundredth. • Determine percentage based on FTE of Number of Administrators Column and
FTE of Inexperienced column. Out-of-Field State
District School
Out-of-Field Column = Y. • Total FTE and round to the nearest hundredth. • Determine percentage based on FTE of Number of Administrators Column and
FTE of Out-of-Field column. Inexperienced & Out of field
State District School
Inexperienced and Out-of-Field column = Y. Total FTE and round to the nearest hundredth. • Total FTE and round to the nearest hundredth. • Determine percentage based on FTE of Number of Administrators Column and
FTE of Inexperienced/Out-of-Field column.
3 or Less Years Experienced AND Outside of Certification Area Flag: IIf([Out of Field]="Y" And [Inexperienced]="Y","Y","N")
Provisional or Temporary cert
State District School?
Provisional or Temporary Column = Y. • Total FTE and round to the nearest hundredth. • Determine percentage based on FTE of Number of Administrators Column and
FTE of Provisional or Temporary Cert column.

Updated July 22, 2019
86
Data Element Reporting Level
Business Rule (number and rate reported)
Alternative Certification and CEU Educator Permit
State District School
Alternative Certification or CEO column = Y. Total FTE and round to the hundredth. • Total FTE and round to the nearest hundredth. Determine percentage based on FTE of Number of Administrators Column and FTE of Alternative Certification or CEO column
Certified Administrators
State District School
Certified Flag Column = Y. Total FTE and round to the hundredth. • Total FTE and round to the nearest hundredth. • Determine percentage based on FTE of Number of Administrators Column and
FTE of Certified Administrators Column.
Highest degree earned
State District School
Highest degree by type; Disaggregate by No Degree/Unknown, Associate, Bachelors, Masters, Doctorate, Specialist. FTEs used as denominator; number of degrees by degree type is numerator (degree type rate does not add up to 100%). Reported by headcount to the hundredth.
Image of Administrators data:

Updated July 22, 2019
87
Chapter Six: Long Term Goals

Updated July 22, 2019
88
SDDOE Accountability Goals I. Long Term Goals
SDDOE worked with its Technical Advisory Committee, Regional Education Lab partners, and experts from the Council of Chief State School Officers (CCSSO) to re-evaluate the state’s long- and interim accountability goals to better align with the ultimate aspiration that all students leave the K-12 system college, career and life ready, and incorporating the following milestones:
• Students enter 4th grade proficient in reading. • Students enter 9th grade proficient in math. • Native American students experience increased academic success, and the performance gap for
this population will be closed. • Students graduate high school ready for postsecondary and the workforce.
At the outset, SDDOE has set a preliminary trajectory for where it wants the educational system to be in 13 years, when the fall cohort of kindergarteners is ready to leave the educational system. The long term goals will not be reset. However, every 13 years, the state will evaluate the goals holistically in assessing how well schools performed in meeting their trajectories.
II. Interim Goals
Inherent in the design is a system of continuous improvement for all students and all schools. Interim progress goals are set to both: ensure that all groups are expected to grow or maintain proficiency levels and set the expectation that those student groups and schools with the lowest levels of proficiency will grow more quickly as they work to close the performance gap. Goals by Indicator
A. Long Term Goals – Student Performance
These goals are aspirational in nature and are directly aligned to the above goals such that in 2030-31, 100 percent of students will be proficient in English language arts and math, detailed as:
• 100 percent of 3rd graders will demonstrate proficiency on the statewide summative English language arts assessment, regardless of subgroup membership.
• 100 percent of 8th graders will show proficiency on the statewide summative mathematics assessment, regardless of subgroup membership.
• There will no longer be a performance gap as measured by graduation or proficiency rates for our Native American student population.
B. Interim Goals – Student Performance
In this trajectory of milestone years and grades, 4th and 9th grades are slated as the five and ten -year markers in a student’s educational experience and serve as key markers in the state’s continuous improvement model. Interim targets are aligned to these grade expectations:
• In five years (2022-23), the proficiency expectation will be that all student groups, schools, and subgroups will demonstrate both mathematics and English language arts proficiency levels equal

Updated July 22, 2019
89
to the all students performance percentage as measured at the 50th percentile of public schools on the 2017 summative assessment.
• In ten years (2027-28), the proficiency expectation will be that the all students group, subgroups and schools will demonstrate both mathematics and English language arts proficiency levels equal to the all students performance percentage as measured at the 75th percentile of public schools on the 2017 summative assessment.
• Goals are set with the expectation that all student groups and subgroups will perform at these levels with the intent that in 2030-31, the aspirational goal is that All Students will demonstrate both English language arts and mathematics proficiency.
For schools performing above the 50th percentile and 75th percentile, respectively, interim goal targets will be set to meet the next milestone. A school’s trajectory will be reset at five and ten-years to align with annual targets each school will need to hit to meet the next milestone. Goals are set to ensure that all groups are expected to grow or maintain proficiency levels and set the expectation that those student groups and schools with the lowest levels of proficiency will grow more quickly as they work to close the performance gap. The aspirational goal is such that there will be no performance gap, but that all groups of students will be performing at the same level.
C. Long Term Goals – On-Time Graduation
Baseline data were set with the 2016-17 cohort graduation rates. The long term goals are aligned to the state’s goals such that in 2030-31:
• 100 percent of students will graduate on time. • There will no longer be a performance gap as measured by graduation or proficiency rates for
South Dakota’s Native American student population.
D. Interim Goals – On-Time Graduation Interim goals set for On-Time Graduation are five and ten years and serve as key markers in the state’s goal system. Interim targets are aligned to these expectations:
• In five years (2022-23), the expectation will be that the all students group, subgroups and schools will demonstrate graduation rates equal to the all students graduation rate as measured at the 50th percentile of public schools in 2017.
• In 10 years (2027-28), the expectation will be that the all students group, subgroups and schools will demonstrate graduation rates equal to the all students graduation rate as measured at the 75th percentile of public schools in 2017.
• Goals are set with the expectation that the all students group and subgroups will graduate in 2030-31, the aspirational goal is that all students will graduate on time.
For schools performing above the 50th percentile and 75th percentile, respectively, interim goal targets will be set to meet the next stepping stone. A school’s trajectory will be reset at the five and ten -year marks to align with what yearly targets each school will need to hit to meet the next milestone.
E. Long-Term ELP Goals – English Language Learner Progress (state, district, school-level)

Updated July 22, 2019
90
South Dakota’s overall goals for English language learner progress will use baseline data beginning with the 2016-17 assessment results. The 2017-18 assessment results will be re-examined to ensure that targets remain appropriate. The long term goals for ELP are 100 percent of students will be on track to exit ELP status on time by 2030-31. Inherent in the design is a system of continuous improvement for all students and all schools. Every 13 years, the state will evaluate the goals holistically in assessing how well schools performed in meeting their trajectories.
F. Interim ELP Goals Similar to milestone years for Student Performance goals, 4th and 9th grades are interim targets in a student’s educational experience and serve as key markers in the state’s goal system. Interim targets are:
• In five years (2022-23), the expectation will be that all schools will demonstrate at least 50 percent progress towards meeting ELP proficiency expectations.
• In 10 years (2027-28), the expectation will be that all schools will demonstrate at least 75 percent progress towards meeting ELP proficiency expectations.
• Goals are set with the expectation that All Students will be on track to exit EL status on time by the 2030-31 school year.
For schools performing above 50 percent progress and 75 percent progress, respectively, towards meeting ELP proficiency expectations, interim goal targets will be set to meet the next stepping stone. A school’s trajectory will be reset at the five and ten -year marks to align with yearly targets each school will need to hit to meet the next milestone.

Updated July 22, 2019
91
Chapter Seven: Equity Report

Updated July 22, 2019
92
The Equity Report The Equity Report is a new addition to the Accountability Report Card in response to ESSA law and the State Plan. The report provides data analysis results for several elements of the ESSA law including disproportionate rates of access to educators. Disproportionate Rates of Access to Educators ESSA requires states to ensure how low-income and minority students in Title I schools are not served at disproportionate rates by inexperienced, out-of-field, and inexperienced and out-of-field teachers (i.e., ineffective as described in ESSA). Three years of enrollment data are used to identify schools in the lowest and highest quartile for percentage of minority students and percentage of students in poverty. The calculation will include three years of teacher data for each of the three teacher characteristics; inexperienced, out-of-field, and inexperience and out-of-field.
1. Calculate the averages and standard deviation by the lowest and highest grouping of schools to determine if there are disproportionate rates of access to teachers by each of the three teacher characteristics. 2. Report teacher characteristics for the high-minority/high-poverty schools compared to the low-minority/low-poverty schools.
The structure of the Equity Report by school, district and state level report cards are described below. School Level Equity Report includes data describing (see image below):
• School support classification (comprehensive, targeted, additional targeted or general support)
• Title I Designation (Title I or non-Title I) • Subgroup performance on SPI Indicators as compared to the All Students group (colors refer
to measure results) • Poverty and minority designation (high/low poverty, high/low minority or neither) • Teacher qualifications for the School • High-poverty/high minority schools with disproportionate rates of access to teachers.
The district and state Level reports consist of (see images below): • The number of schools by school support classification in a district (comprehensive,
targeted, additional targeted and general support) • poverty and minority designation (high/ low poverty, high/low minority or neither) • Title I status by high/low poverty, Title I high/low minority, Title I neither • Interactive dashboards allow users to filter on title status, poverty status, minority status,
disproportionate rates of access to teachers and school support status by the teacher qualifications measures
Additional Details for above classifications and measures:
1. School Support Classification details (including subgroup comparison with All Students subgroup) are provided in this manual.

Updated July 22, 2019
93
2. Title I designation (refer to Title I information 3. Poverty designation for a school is based on the percentage of students receiving free and
reduced lunch (FRL%) as compared to all other public schools in the state 4. Minority designation is based on the percentage of students who are members of the below
groups as compared to all other public schools in the state: a. American Indian/Alaska Native b. Black/African American c. Hispanic/Latino d. Native Hawaiian/Pacific Islander e. Two or more Races

Updated July 22, 2019
94
Image School Level Equity Report:

Updated July 22, 2019
95
Image of a District Level Equity Report (view details tab takes user to dashboard:

Updated July 22, 2019
96
Image of District Level Equity Report Interactive Dashboard:

Updated July 22, 2019
97
Chapter Eight: School Support Identification, Classifications and
Supports

Updated July 22, 2019
98
School Support Identification Identification Schools are identified for one of the following four categories of support on an annual basis.
General Support All schools not identified for extra support Targeted Support and Improvement (TSI)
Schools with subgroups that are underperforming across all indicators at the same school Additional Targeted Support and Improvement (ATSI)
Schools with subgroups that are underperforming on all indicators than the aggregate performance of Title I schools whose SPI score is at or below the bottom 5%
Comprehensive Support and Improvement (CSI) Title I school whose SPI score is at or below the bottom 5%
OR High schools with On Time Graduation Rate below 67%
OR Title I ATSI schools not meeting exit criteria within four years of identification
Comprehensive Support and Improvement In accordance with ESSA, the South Dakota Department of Education (DOE) will identify the lowest-performing five percent of Title I schools as CSI based on the results of the School Performance Index1 (SPI) indicators. Also, the DOE will examine the four-year cohort graduation rates of all public high schools in the state. Those public high schools that do not graduate at least one-third of their students will be identified as CSI. Additionally, any Title I school identified as ATSI that does not meet the exit criteria within a 4-year period will be designated as CSI. Targeted Support and Improvement Using three years of data, the DOE will review the results of the SPI indicators to determine which subgroups are underperforming across all eligible indicators at each school. Only those subgroups with 10 or more students in the current school year will be used to identify underperformance. Subgroup underperformance is determined using a 95% confidence interval between the subgroup and the All Students group at the school. If the Upper Bound confidence interval on an indicator for a subgroup is lower than the Lower Bound confidence interval for the All Students group, then the subgroup is flagged for that indicator. If the subgroup is flagged on all accountable indicators, then the DOE will determine the subgroup performance to be disproportional and identify the school as TSI. Confidence Interval Calculation Details
The confidence interval equation is:
1 SPI indicators for elementary and middle schools are student performance, student progress, English language learners progress, and attendance; high schools indicators are student performance, high school completion, on-time graduation, college and career readiness, English language learners progress (see Calculation Guide for more details)

Updated July 22, 2019
99
Where p^ is the indicator rate, z = 1.96 and n is the size of the (sub)group. To see a full example of this equation, let’s say for English Language Arts Proficiency the All Students Group achieved a 44% and there are 300 students and the Economically Disadvantaged subgroup achieved a 30% and there are 50 students. Both of their equations would look like this:
Next, you calculate everything to the right of the ±. The number you get is then used to calculate the Upper Bound and Lower Bound for that indicator and subgroup. Running through both equations you get:
The below example demonstrates how confidence intervals are used to determine if a subgroup is flagged for an indicator. In this example, the DOE is comparing the Student Performance on the state assessment on English Language Arts for the All Students group and the Economically Disadvantaged subgroup. The All Students group is 60% Proficient on English Language Arts while the Economically Disadvantaged subgroup is 44% proficient. The DOE then calculates the confidence intervals for both subgroups. The confidence interval finds the Upper Bound and Lower Bound of a subgroup’s performance on an indicator. In this example, the Lower Bound of the All Students group is 55% and the Upper Bound for the Economically Disadvantaged subgroup is 52%. Once the Lower and Upper bounds are calculated, the DOE checks to see if the Upper Bound of the subgroup is higher or lower than the Lower Bound of the All Student group. If the subgroup’s Upper Bound is higher than the All Students’ Lower Bound, then the subgroup would not be flagged for the indicator. If the subgroup’s Upper Bound is lower than the All Student’s Lower Bound, then the subgroup would be flagged for the indicator. Going back to the example, the subgroup’s Upper Bound is 52% and the All Students’ Lower Bound is 55%. Since the Upper Bound is lower than the Lower Bound, the Economically Disadvantaged subgroup would be flagged on the English Language Arts Student Performance indicator.
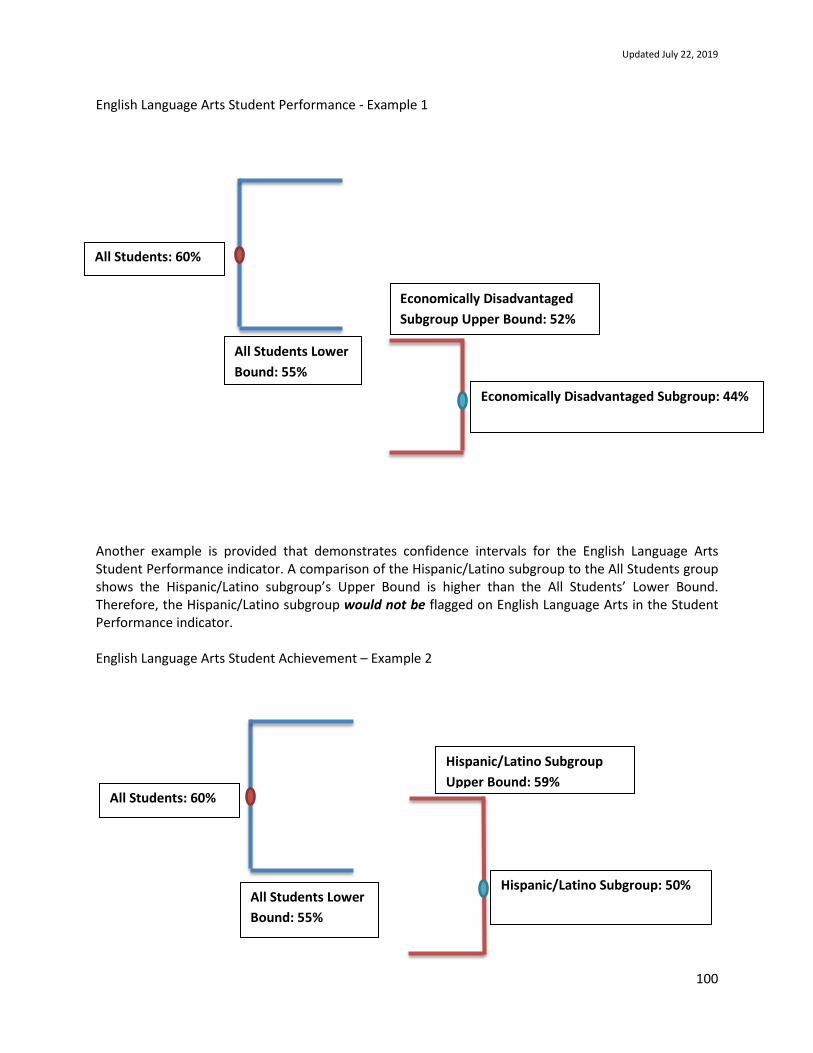
Updated July 22, 2019
100
English Language Arts Student Performance - Example 1
Another example is provided that demonstrates confidence intervals for the English Language Arts Student Performance indicator. A comparison of the Hispanic/Latino subgroup to the All Students group shows the Hispanic/Latino subgroup’s Upper Bound is higher than the All Students’ Lower Bound. Therefore, the Hispanic/Latino subgroup would not be flagged on English Language Arts in the Student Performance indicator. English Language Arts Student Achievement – Example 2
All Students: 60%
All Students Lower Bound: 55%
Economically Disadvantaged Subgroup: 44%
Economically Disadvantaged Subgroup Upper Bound: 52%
All Students Lower Bound: 55%
Hispanic/Latino Subgroup: 50%
Hispanic/Latino Subgroup Upper Bound: 59%
All Students: 60%

Updated July 22, 2019
101
Additional Targeted Support and Improvement From the list of schools with consistently underperforming subgroups (TSI schools), any public school with a federally defined subgroup or a Gap group performing no better on all eligible indicators than the aggregate performance by schools designated for the bottom 5% of Title I schools in that academic year over a period of three years. Only those subgroups with 10 or more students in the current school year will be used to identify underperformance. Like the confidence intervals are applied to targeted support schools, a 95 percent confidence interval will be used when applying this calculation. Any subgroup whose upper confidence bound for all indicators is less than the lower confidence bound for bottom 5% of Title I schools will flag a school for additional targeted support. Exit Criteria for Comprehensive Support and Improvement Schools identified as CSI will have a period of four years to improve their performance. Exit Criteria are:
• School is no longer in the bottom 5% of overall SPI points; Graduation rate is above 67%; and/or subgroup performance has improved.
• School performance on all SPI indicators over the period of designation demonstrate a positive overall trajectory.
• School demonstrated improvement on the SPI indicators of highest need, based on comprehensive needs assessment results conducted in the first year of designation; and through collaboration with School Success Facilitator.
Exit Criteria for Targeted Support and Improvement Schools identified as TSI have a period of two years to improve the performance of underperforming identified subgroup(s). Exit Criteria are:
• School no longer meets the definition under which it was identified as TSI. • Subgroup SPI indicator that led to the initial designation demonstrates a positive overall
trajectory. Exit Criteria for Additional Targeted Support and Improvement Schools identified as ATSI have a period of two years to improve the performance of underperforming subgroup(s). Exit Criteria are:
• School no longer meets the definition under which it was identified as TSI. • Subgroup SPI indicator that led to the initial designation demonstrates a positive overall
trajectory. Administrative Rules Reference for School Support Identification when EdStructure for school or district changes: Administrative Rule 24:55:08:01. Public school or district changing grade span or physical status. A public school or public school district that proposes to change its grade span or physical building capacity must submit a request to the department to explain the reasons for the proposed change. The department shall review the request and either approve or deny. Regardless of changes made in student population, a school identified as a comprehensive support and improvement, or targeted

Updated July 22, 2019
102
support and improvement school is not eligible for a new accountability status while in the identified classification. Administrative Rule 24:55:08:02. Students attending public school or district in first year of operation -- Included in accountability classification. Students attending a public school district in its first year of operation are included in the accountability classification at the public school level. Administrative Rule 24:55:08:03. Accountability classification determination starts with first year of operation. Accountability classifications for new public schools are made by the department within their first year of operation. Administrative Rule 24:55:08:04. Public school boundaries altered -- Prior academic progress goals and targets recalculated. If a public school district that has two or more attendance centers per grade span changes boundaries such that at least 50 percent of the student population of the attendance center, or students in the grade spans assessed in that attendance center, moved and have been replaced with students from another attendance center within the district: 1. The academic progress goals and targets of the affected public schools shall be recalculated using the methodology in § 24:55:05:03 and shall be applied for the remaining years of the current cycle; and 2. If one or more of the affected schools has been classified as a comprehensive support and improvement school, the classification shall be removed by the department, notwithstanding the provisions of § 24:55:04:06. Administrative Rule 24:55:08:05. School district consolidation -- Prior academic progress goals and targets recalculated. If two or more public school districts consolidate under the provisions of SDCL chapter 13-6: 1. The academic progress goals and targets of the affected public schools shall be recalculated using the methodology in § 24:55:05:03 and shall be applied for the remaining years of the current cycle; and 2. If one or more of the affected schools has been classified as a comprehensive support and improvement school, the classification shall be removed by the department, notwithstanding the provisions of § 24:55:04:06.

Updated July 22, 2019
103
Chapter Nine: Preparing the Data

Updated July 22, 2019
104
Preparing the Data Accountability and SPI determinations are required for all public districts and schools in South Dakota. The state’s Student Information Management System (SIMS) (Infinite Campus) is used to collect the data for public school districts as well as private and BIE districts within the state. It is therefore necessary to designate business rules for pulling only the public school student data out of Infinite Campus. Within Infinite Campus are different sort codes for the districts and the schools. We use the sort codes along with the state funding codes (or enrollment status) that are found on the enrollment tab to help create business rules for including or excluding students. In general, most students in public school districts will count at the state level, at their attending district, and at their attending school. However, there are some exceptions in which public school students being served at a non-public facility or program need to be counted at their resident district and at the state levels. Enrollment Record Rules The below rules are based on the May 1 enrollment record for the student. Y = Yes N = No A = Attending District R = Resident District For students enrolled in public school districts (district type 10) as of May 1: NOTE: Once appeals are completed, SDDOE will work with vendor to handle coding exceptions.
Students enrolled >50% in Public School Districts • Default to All Students counted at their Attending School,
Attending District and State Level
includeInState = ‘Y’ includeInDistrict=’A’ includeInSchool = ‘Y’
EXCEPTIONS:
Student enrollments at the following schools within a public district are excluded completely:
• School number 88 (JDC’s - students will have another enrollment record at their resident districts where they will be counted). **Exception – Parkston Our Home is coded with a school number of 88 but is NOT a JDC.
• School number 99 (home-schooled students) • School numbers 61, 73, 77, 98, 97
includeInState = ‘N’ includeInDistrict=’N’ includeInSchool = ‘N’
Exclude Foreign Exchange Students, Citizenship Status =2 includeInState = ‘N’ includeInDistrict=’N’ includeInSchool = ‘N’
Exclude All Students in district ID 36001 (this is a dummy district (Alpena) used for testing)
includeInState = ‘N’ includeInDistrict=’N’ includeInSchool = ‘N’

Updated July 22, 2019
105
All Students in District 49005, School Number 64 should be included in the state numbers only (the State Penitentiary)
includeInState = ‘Y’ includeInDistrict=’N’ includeInSchool = ‘N’
Exclude all Summer School Enrollments School numbers 69, 95, and 98
includeInState = ‘N’ includeInDistrict=’N’ includeInSchool = ‘N’
• Exclude All Students with Funding Code of B includeInState = ‘N’ includeInDistrict=’N’ includeInSchool = ‘N’
Students with State Funding Code of E, J or S These students are included at the State Level only
includeInState = ‘Y’ includeInDistrict=’N’ includeInSchool = ‘N’
• When the funding code is P, exclude from the school level but count at State and Resident district
includeInState = ‘Y’ includeInDistrict=’R’ includeInSchool = ‘N’
When the funding code is P for Iowa students enrolling in SD public school; Resident District = 99087; Attending District = 61001, count students at school, district and state levels.
includeInState = ‘Y’ includeInDistrict=’Y’ includeInSchool = ‘Y’
If Attending District is 49002 (Brandon Valley) and the funding code is T, exclude from the school level but count at State and Resident district (School for the Deaf students)
includeInState = ‘Y’ includeInDistrict=’R’ includeInSchool = ‘N’
Students with State Funding Code of G: Whole Grade Sharing in District 26002 (Burke and South Central)
includeInState = ‘Y’ includeInDistrict=’R’ includeInSchool = ‘Y’
For students in Non-Public districts (district type 20):
Students with State Funding Code of E, J or S Include at the State Level only
includeInState = ‘Y’ includeInDistrict=’N’ includeInSchool = ‘N’
Students whose funding code is not E, J, S, or P are excluded includeInState = ‘N’ includeInDistrict=’N’ includeInSchool = ‘N’
When the funding code is P, exclude from the school level but count at State and Resident district
includeInState = ‘Y’ includeInDistrict=’R’ includeInSchool = ‘N’

Updated July 22, 2019
106
For student in tribal districts (district type 30): If attending District ID is 20302, Resident District is 20001 and State Funding Code is T, student will count at the Resident District (20001 Eagle Butte)
includeInState = ‘Y’ includeInDistrict=’R’ includeInSchool = ‘Y’
All other students are excluded includeInState = ‘N’ includeInDistrict=’N’ includeInSchool = ‘N’
For student in Non-public tribal contract school districts (district type 93):
If attending District ID 54302 (Tiospa Zina is now a BIE funded school), District Type 93, students are excluded from all rosters
includeInState = ‘N’ includeInDistrict=’N’ includeInSchool=‘N’
For students in Cooperative/Multi-districts (district type 40), Special Population districts (district type 60), Community Support Providers (district type 70), and Alternative Programs (district type 90):
Students whose funding code is not E, J, P, or S are excluded completely
includeInState = ‘N’ includeInDistrict=’N’ includeInSchool = ‘N’
Students whose funding code is E, J, or S are excluded from the district and school count but included at the State
includeInState = ‘Y’ includeInDistrict=’N’ includeInSchool = ‘N’
When the funding code is P, then exclude from the school level but count at State and Resident district
includeInState = ‘Y’ includeInDistrict=’R’ includeInSchool = ‘N’
For students in State Special Schools (district type 80) e.g. School for the Blind:
Students whose funding code is not E, J, S, or W are excluded completely
includeInState = ‘N’ includeInDistrict=’N’ includeInSchool = ‘N’
Students whose funding code is E, J or S are excluded from the district and school count but included at the State
includeInState = ‘Y’ includeInDistrict=’N’ includeInSchool = ‘N’
Students who are attending SD School for the Blind and whose funding code is “W” are included at the State level and at their Resident district, not at the school level
includeInState = ‘Y’ includeInDistrict=’R’ includeInSchool = ‘N’
For out of state students:
If the attending district ID starts with 99 (e.g. ‘99xxx’) then the student is excluded completely
includeInState = ‘N’ includeInDistrict=’N’ includeInSchool = ‘N’
If Resident District is out of state but the Attending district type is 10, count them at state, district, and school level
includeInState = ‘Y’ includeInDistrict=’Y’ includeInSchool = ‘Y’

Updated July 22, 2019
107
Data Management Assessment Procedures
• In December/January/February of each school year the SDDOE Data Management (DM) office prepares pre-id files for ACCESS 2.0 -ACCESS 2.0 ALT (English Learner assessments), SD-SCI, SD-SCI Alt (science assessments), and South Dakota Alternate Assessments based on the specifications and file layouts received from the Division of Assessments (DA) via Data Request forms. For the South Dakota Assessments, pre-id files are created through nightly extract process that was developed. The extracts come from SD-STARS and are passed to the South Dakota Assessments vendor. Depending on the type of assessment, either the DM Data Analyst or other DM staff submit the finalized and approved files to the appropriate testing vendors by placing the files on each vendor state SFTP sites established by BIT. Each pre-id file includes the current demographic and enrollment information required for all students in testable grades in all South Dakota schools.
• After the test administration period has ended, each vendor provides the SDDOE Assessment Team a “results file.” The Assessment Team reviews and saves each file to a predetermined Assessment folder on the N Drive where DM reviews and cleans the file before placing a final file to the same folder for DA approval. Once approved, the DA informs STARS Team that the results files are ready for loading. This is considered the final data.
• Then all assessment files other than ACCESS are prepared for and sent to eMetric for additional calculations not done by SDDOE or OtisEd via their own SFTP site with SDDOE (secured shared folder used to share data files among DOE staff and vendors).
• Once eMetric has finalized their data, DM prepares an additional results file for each assessment for BIE, and places it on the BIE SFTP site.
• All results files are loaded into SD_STARS. • DM begins the process of loading the student scores to Infinite Campus-State Edition (ICSE),
then pushing them down to each student’s record in Infinite Campus – District Edition (ICDE).
Preparing Test Results for Infinite Campus • Prior to the opening of the test windows, DM staff create the Test Setups within ICSE. These
test structures are used to upload the test results to IC. There are individual Test Setups for each of the student assessments given each year.
• DM receives and saves Data Request Forms including file specification documents from the DA who receive final assessment results files from various vendors based on the assessment type.
• DM opens and saves each file to a working EXCEL database and cleans each file based on the file specs, to include but not limited to: identifying any duplicate records which go to the DA for adjudication, confirmation of filled and accurate data elements, i.e. gender, race, and another program match.
• Once approved by the DA, DM loads the test results for each given assessment to the ICSE and then pushes down the test results to each student’s record on the District Edition of Infinite Campus.
Misidentified EL Students Procedures Data Management works with Title III staff to examine English learner student records as needed to see if there are students who are misidentified as EL. These procedures are:

Updated July 22, 2019
108
• DM works with Title III director to validate EL student roster and identify students who were misidentified by districts (ongoing throughout the school year)
• Per Title III staff, DM will correct the information in the student record in Infinite Campus • For Accountability purposes, Title III/DM will provide a list of misidentified students to
Accountability to use for validation of report card data (rosters) • Accountability provides a list of misidentified students in the Overrides file for the vendor to
make changes in the data results files used for reporting data in the report card.

Updated July 22, 2019
109
Chapter Ten: Timeline and Appeals Process

Updated July 22, 2019
110
Setting the Report Card Timeline The new Every Student Succeeds Act Law requires states to report more than 2000 data points in Accountability Report Cards. The Accountability Report Card requires cooperation from multiple vendors, multiple Department teams, districts, and schools to be successful. The first step of establishing cooperation is to set a timeline that has key dates and tasks. This timeline is a high-level document that is disseminated to all parties involved with the Accountability Report Card and throughout the Department. See an example of an annual Accountability Report Card timeline on page 108.
Things to Consider Key considerations for creating the annual report card timeline are listed below.
1. Timeline for Data Loads
• Perkins data is due May 31st. Then the Perkins Team works with districts to clean up any data and address any concerns. Typically, it takes an additional 3-weeks.
• Per SD Administrative Rule 24:17:03:02: School districts are required to have their year-end data finalized no later than the 2nd Friday in June of each year (June 14, 2019). Then Data Management and the PRF Teams review the data and work with districts to resolve any outstanding items. Typically, it takes an additional 2-week to verify and validate the data in Infinite Campus and PRF are correct.
• Assessment files come from various vendors. Typically, this isn’t until late-June, early-July. Sometimes the assessment files have errors like wrong scores or missing students. Therefore, the timeline should consider a deadline for loading corrected assessment data OR the Department must decide that the first file is the final file.
• Growth calculations cannot be done until after the assessment files are loaded into SD-STARS. This is because an extract of the SD-STARS assessment data is used to produce the growth calculations.
2. Beginning of the School Year
Districts are very busy in mid-August through the end of September. In addition to the workings of a school to start a new school year with new staff, new students, and new systems, schools also are required to report key data to the Department needed for State Aid and to comply with state statutes. One key district stakeholder is the STARS Account Manager (SAM). These people are responsible for assigning the accountability permissions to their districts’ users. Many of the SAMs are school or district secretaries that are off during the summer and don’t return until August. If the report card is released during the summer or before the SAMs come back to the district, it can cause problems for districts users who need to review the data. See the section on Private Report Card Security. The beginning of a new academic year is also busy for key teams at the Department.
• Data Management monitors, supports, and validates that the data for the new school year is correctly entered. They also offer beginning-of-the-year trainings to districts.
• SD-STARS Team rolls over the SD-STARS system to the new school year on August 1st. This takes a few days to confirm and validate.

Updated July 22, 2019
111
3. Work Schedules
When considering the timeline, consider district staff and DOE staff work schedules. A few things to note:
• DOE and district staff typically do not work on weekends. • Many district staff do not work during June-August. These staff only have 9-month contracts.
They include principals, school secretaries, counselors, and more. • Friday releases cause issues with how to handle user tickets/issues (ex: locked out, forgotten
passwords) over the weekend. Consider non-Friday releases if possible. There are conferences that occur during the typical report card release schedule that affect the availability of the Department and key district/school personnel. These dates should be considered.
• CTE Conference – Typically the last Monday-Tuesday of July. Attendees include teachers as well as school and district administrators.
• ASBSD/SASD – Typically the first or second Thursday-Friday of August. Attendees include school and district administrators and school boards.
• Labor Day – The first Monday in September. Data Accuracy and Sign Off with Districts SDDOE sends out the annual End of Year Signoff form with instructions to districts in early May as a requirement for districts to finalize their schools’ data in several database systems (Infinite Campus, PRF and Perkins). These database systems close on the second Friday of June each year. (see timeline table on page 108). SDDOE uses these database systems as the data source for state and federal reports (report cards, EdFacts, Title programs, etc.). End of Year Checklist and Memo for Districts In preparation for the end of the year, the DOE sends to districts three documents
i. Memo ii. Checklist
iii. Directions for assigning the Accountability Permissions in SD-STARS End of Year Updates Relevant to SDDOE Offices and Program Teams
• Data Management Team –information relevant to Infinite Campus, EdStructure, and Safe Drug and Gun Free
• Title Program Managers • PRF Manager - Certification Office • CTE Team - Perkins data manager • SD-STARS Team (provide updated information on how to assign the accountability permissions)
Process and Timeline • End of January – Report Card Team creates draft ARC timeline with Vendor input • Early February – SSARS reviews draft timeline and gives feedback • Mid-February - DOE leadership reviews and approves timeline • March 15 – DOE staff provide any changes needed for the end of year signoff document • March 30 - Accountability finalizes timeline and end of year signoff document • Early May – Communications office sends memo and signoff checklist to districts.

Updated July 22, 2019
112
• 2nd Friday in June – Districts send signed completed checklists to the Data Management Office. • June 30 – DOE’s Data Management Office finalize review of the data and communicate issues to
districts.
Formal Appeals SDDOE follows state administrative rules to establish timelines for district to review, validate and as needed, to appeal student level data in the report card.
Private Report Card Release to Districts and Appeals Process The SDDOE determines and releases the preliminary Accountability/SPI determinations for all districts and schools (see timeline table above). Within 10 business days of the initial public release of the report card, the district/school reviews its data and may challenge student level data based on documentation that a student’s data should or should not be counted in the accountability indicator calculation/s that determines SPI points. The Accountability office provides a set of concise instructions for districts and schools to appeal indicator data and responds directly to report card and appeals questions by phone or through email- [email protected]. Within 30 calendar days of the receipt of the appeal, the SDDOE is tasked with reviewing all appeals and making final Accountability/SPI determinations. The SDDOE works with the Accountability vendor to make the final changes to the Accountability Report Cards and validate SPI points for each school. Releasing the Accountability Report Card The Accountability office coordinates the release of the Accountability Report Card to the public with the department’s Communications office and BIT. When possible, we try to ensure that districts have time to share annual report cards with their school boards a few days prior to the public release. Communication Process SDDOE will establish a communication plan that outlines when these determinations will be released so that both districts and SDDOE can make internal personnel work schedule arrangements and districts can determine their own communication strategies. Tentative release dates will be announced prior to the end of the school year.
Administrative Rule 24:55:09:01. Public schools may review data. A public school district on behalf of a public school may review the results and classification of the school under the accountability system. If the public school district believes the results or classification to be incorrect for statistical or other reasons, it may appeal the accuracy of the data to the department. Administrative Rule 24:55:09:02. Public school district to appeal not later than 10 days after notification. A public school district on behalf of a public school must submit an appeal form provided by the department and supporting documentation not later than ten business days after the initial public release of the accountability system report card. Administrative Rule 24:55:09:03. Final determination by department. Following review of the materials submitted pursuant to § 24:55:09:02, the department shall make a final determination regarding the accuracy of the data. The public school district must be notified in writing by the department of the final decision within thirty calendar days after receipt of the appeal.

Updated July 22, 2019
113
2019 ARC Timeline Activity Due Date
ARC timeline and enhancements finalized January 31 (end of April finalized) MicroStrategy Upgrades in STARS and Public April (3 wk process) Testing and review of report card systems End of April CCR Calculations by OtisEd Feb 25- March 31 (March 27
completed) OES-Minority & Poverty measure calculations April-May ELP calculations begin (ACCESS 2.0/Alt loaded) May - June DM provides adjusted Cohorts list Early May OES processes Graduation Rates/Completer May-June EdStructure 2019-2020 June (finalized) District Data Entry in Infinite Campus Closes June 14-19 (5-day period) Infinite Campus and PRF Closes June 14 ICSE finalized and PRF cleanup June 30 ELP Data process complete June 30 GED data files received and processed April - May OES Performance/eMetric Progress (Growth) July 3 Finalize Small and Special schools & No ARC lists July 1 PRF analyst provides Admin/Teacher Roster data files July 3 Assessment data loaded into STARS July 9 Complete data processing: assessments, attendance, HS Completion, Long Term Goals, SPED performance; Small & Special Schools audit
July 1 - 20
OES calculates SPI/initial School Support for 2019; Resets for Targeted/ATSI
July 22
DOE review/testing (subgroup flags signoff by respective departments in the private report card)
June - July
DOE review and finalize School Support list/resets August 1 OES Equity Report data processing May - July IC Scope Year Change June OES pulls validated data into public report card August -September Draft Release of Private Report Card August 5 Formal Appeals Window (10 days) August 12 - 23 DOE review and approve appeals August 15 – Sept 1 Overrides applied in data files August 26 – Sept 3 OES stored procedures completed August 30 OES processes appeals-related SPI points August 30 Appeals overrides processed in report cards September 2-3 Private report card ready for testing September 3 DOE review/validate data private report card (2 day) Sept 3 - 4 Notify districts that appealed to review corrections in report cards September 5 OES pulls data changes into public report card (2 day) September 4 - 5 Public report card ready for testing September 4-5 DOE review/validate public report card (7 day) September 9 - 12 Release Public Report Card September 16

Updated July 22, 2019
114
Additional Accountability Reports
End of year Report Card tables completed September 30 MicroStrategy Reports (SSRS reports) January - May Training Environment redaction (previous year data) January Reset system for new academic year TBD EdFacts CSPR 1 Reporting Deadlines December 2019 EdFacts CSPR 2 Reporting Deadlines January 2020

Appendix A: Accountability Rounding Rules

Updated July 22, 2019
116
Attendance A student met the 90% if the student’s attendance percentage can be rounded to the nearest one hundredth decimal to equal 90%.
• 90% equals 89.99999% 89.51000% 89.50000%
• 90% does NOT equal 89.49999% Determining SPI Points:
Numerator = Count of FAY students who attended at least 90% of his or her enrolled days
Denominator = Count of all FAY students who were enrolled for at least 15 consecutive school days
• Example:
o 56/57 = 0.982456 or Rounded to 98.25%
Multiple the Attendance Rate by the points allocated to the indicator. This will arrive at the Total Attendance SPI Points. The SPI Points are rounded to the hundredth decimal place. • Example:
o 0.9825 * 10 = 9.825 or 9.80 Total Attendance SPI Points
Student Performance Determining SPI Points: Step #1: Calculate the Total FAY Multi-Year (3 Years) Student Population
• Example: o 65 FAY Students Tested in 2015-2016 + 75 FAY Students Tested in 2016-2017 + 60 FAY
Students Tested in 2017-2018 = 200 Students in Denominator
Step #2: Take the number of Students that are non-participants, Level 1, Level 2, Level, and Level 4 and divide each of those numerators by the Total Student Population Denominator. This gets you the Percent of Total. The Percentages are rounded to the hundredth decimal place.
• Example: o 2 out of 200 Students are Nonparticipants = 1.00% of Total o 27 out of 200 Students Achieved Level 1 = 13.50% of Total o 50 out of 200 Students Achieved Level 2 = 25.00% of Total o 100 out of 200 Students Achieved Level 3 = 50.00% of Total o 21 out of 200 Students Achieved Level 4 = 10.50% of Total

Updated July 22, 2019
117
Step #3: Multiple the Percent of Totals by their weight. The Percentages are rounded to the hundredth decimal place.
• Example: o 0.01 * 0.00 = 0.00% of Points Earned o 0.1350 * 0.25 = 3.38% of Points Earned o 0.2500 * 0.50 = 12.50% of Points Earned o 0.5000 * 1.00 = 50.00% of Points Earned o 0.1050 * 1.25 = 13.13% of Points Earned
Step #4: Add the percentages from Step #3 together and multiple by the points available for that subject area. The Subject Area Points are rounded to the hundredth decimal place.
• Example: o 0.00% + 3.38% + 12.50% + 50.00% + 13.13% = 79.01% o 79.01% * 20 = 15.80 Points
Step #5: Add the Total Points from both Subject Areas to arrive at the Student Performance SPI Points. The SPI Points are rounded to the hundredth decimal place. If the SPI Points are over the maximum points allocated to the indicator, then they are defaulted to the maximum.
• Example: o 15.80 + 17.60 = 33.40 Student Performance SPI Points
Nonparticipants to get up to 95%
Level 1 Level 2 Level 3 Level 4 Total Total Points Earned (% x 20 points possible by subject area)
N-size 2 27 50 100 21 200 Percent of total 1.00% 13.50% 25.00% 50.00% 10.50% 100% Point value 0.00 0.25 0.50 1.00 1.25
% of points earned 0.00% 3.38% 12.50% 50.00% 13.13% 79.01 15.80 Student Progress Determining SPI Points:
Numerator: Number of FAY students with a previous year’s assessment score who also earned a designation of Keeping Up, Catching Up, or Very High Growth
Denominator: Number of FAY Students with a previous year’s assessment score
% of Points Earned Points Earned
Total Points for Student
Performance Math 79.00% 15.80
33.40 ELA 88.00% 17.60

Updated July 22, 2019
118
Step #1: Add the number of students who are Keeping Up, Catching Up or Very High Growth in English Language Arts divided by the Number of FAY Students for English Language Arts with a previous year’s assessment score. This percent is rounded to the hundredth decimal place.
• Example: o 150 Total Number of FAY Students with a previous year’s assessment score o 50 Students are Keeping Up, 60 Students are Catching Up and 7 Students are Very High
Growth = 117 Students have Met Growth for English Language Arts o 117 / 150 = 78.00% Met Growth for English Language Arts
Step #2: Add the number of students who are Keeping Up, Catching Up or Very High Growth in Mathematics divided by the Number of FAY Students for Mathematics with a previous year’s assessment score. This percent is rounded to the hundredth decimal place.
• Example: o 150 Total Number of FAY Students with a previous year’s assessment score o 40 Students are Keeping Up, 50 Students are Catching Up and 3 Students are Very High
Growth = 93 Students have Met Growth for Mathematics o 93 / 150 = 61.33% Met Growth for Mathematics
Step #3: Determining Lowest Quartile – Take the Number of FAY Students with a previous year’s assessment score English Language Arts and Mathematics and multiple it by 0.25. This will be the number of students in the Lowest Quartile for English Language Arts and Mathematics respectively.
• Example: If the number is a decimal with .5000 or above, round up to the next whole number. If the number is a decimal with .49999 or below, round down to the nearest whole number.
o If the calculation yields 78.501, the school’s lowest quartile would be comprised of 79 students.
o If the calculation yields 23.49, the school’s lowest quartile would be comprised of 23 students.
Step #4: Add the number of students who are Keeping Up, Catching Up or Very High Growth in English Language Arts Lowest Quartile divided by the Number of FAY Students Lowest Quartile for English Language Arts with a previous year’s assessment score. This percent is rounded to the hundredth decimal place.
• Example:
o 38 Total Number of FAY Students Lowest Quartile with a previous year’s assessment score
o 10 Students are Keeping Up, 15 Students are Catching Up and 3 Students are Very High Growth = 28 Students who have Met Growth for Lowest Quartile English Language Arts
o 28 / 38 = 73.68% Met Growth for Lowest Quartile English Language Arts

Updated July 22, 2019
119
Step #5: Add the number of students who are Keeping Up, Catching Up or Very High Growth in Mathematics Lowest Quartile divided by the Number of FAY Students Lowest Quartile for Mathematics with a previous year’s assessment score. This percent is rounded to the hundredth decimal place.
• Example: o 38 Total Number of FAY Students Lowest Quartile with a previous year’s assessment
score o 5 Students are Keeping Up, 15 Students are Catching Up and 2 Students are Very High
Growth = 22 Students who have Met Growth for Lowest Quartile Mathematics o 22 / 38 = 57.89% Met Growth for Lowest Quartile Mathematics
Step #6: Take all the Percentage Met Growth for all 4 sub-indicators above and multiple them by the allocated points to that subsection to get the SPI Points for that subsection. Then, you add all those subsection points together to equal the Total Student Progress SPI Points. The SPI Points are rounded to the hundredth decimal place.
• Example: o 78.00% x 10 points = 7.80 Points (rounded to the hundredth decimal place) o 61.33% x 10 points = 6.13 Points (rounded to the hundredth decimal place) o 73.68% x 10 points = 7.68 Points (rounded to the hundredth decimal place) o 57.89% x 10 points = 5.79 Points (rounded to the hundredth decimal place) o 7.80 + 6.13 + 7.68 + 5.79 = 27.40 Total Student Progress SPI Points
English Language Learner Progress Rounding Rule for Growth Goals: Growth Goals are rounded down after the Linear Growth Trajectory has been calculated.
• Example: o A Student achieves a 2.2 Composite First ACCESS 2.0 Score. A Composite Score of 5.0 is
required to exit the English Learner Program o (5.0 – 2.2) / 5 = 0.56 Linear Growth Trajectory o 2.2 + 0.56 = 2.76 or 2.7 Year 1 Goal o 2.76 + 0.56 = 3.32 or 3.3 Year 2 Goal o Etc.…
Student Groups ELA Math Total SPI
Points % Meeting Standard SPI Points % Meeting Standard SPI Points
All Students 78.00% 7.80 61.33% 6.13 27.40
Lowest Quartile 73.68% 7.68 57.89% 5.79

Updated July 22, 2019
120
Determining SPI Points: Step #1: Determine the number of students that are in each category and divide by the total number of English Learner Students accountable by the indicator. This percent is rounded to the hundredth decimal place. Step #2: Multiple the Percent of Total ELs in the category by the Point Value by that category. This percent is rounded to the hundredth decimal place. Step #3: Add together the Percent of Points Earned for each category. Step #4: Multiple the Total Percent of Points Earned by the total number of points allocated by the indicator. This will arrive at the Total English Language Learner Progress SPI Points. The SPI Points are rounded to the hundredth decimal place. If the SPI Points are over the maximum points allocated to the indicator, then they are defaulted to the maximum.
Newly-identified EL, not tested
Returning EL, not tested
Returning EL, tested, no growth
Returning EL, growing but not meeting goals
Newly-identified EL exiting
Returning EL, tested, meeting growth goals
Returning EL, tested, early exit Totals
Total Points Earned (lesser of 10.0 or sum of all points)
N-size 10 10 20 20 10 20 10 100 Percent of total EL 10.00% 10.00% 20.00% 20.00% 10.00% 20.00% 10.00% 100% Point value 0 0.25 0.5 1.00 1.25
% of Points Earned 0 5.00% 10.00% 30.00% 12.50% 57.5% 5.75
College and Career Readiness Determining SPI Points: Step #1 – Determine the unduplicated number of students who are proficient in English Language Arts and Mathematics with any combination of South Dakota Assessments, ACT or Accuplacer scores AND the students that have achieved a Silver Certificate or Higher on NCRC. These are the students that are Assessment Ready. Step #2 – Determine the unduplicated number of students who achieved CTE Concentrator Status, Completed Dual Credit with a C or better and Completed an Advanced Placement Exam with a score of 3 or higher. These are the students that are Coursework Ready. Step #3 – Add the number of students who are NEITHER Assessment and Coursework Ready divided by the Number of Students in the previous year’s High School Completion Roster (rounded to the hundredth decimal place). Then, multiple that percentage by 0.00 Points. This is the percent of points earned for students with No Indicators Met.

Updated July 22, 2019
121
• Example: o 200 Total Students from the previous year’s High School Completion Roster o 20 Students have No Indicators Met o 20 / 200 = 10.00% o 0.1000 * 0.00 = 0.00% of Points Earned
Step #4 – Add the number of students who are ONLY Assessment Ready and ONLY Coursework Ready divided by the Number of Students in the previous year’s High School Completion Roster (rounded to the hundredth decimal place). Then, multiple that percentage by 0.50 Points. This is the percent of points earned for students with One Indicator Met.
• Example: o 200 Total Students from the previous year’s High School Completion Roster o 60 Students have One Indicator Met o 60 / 200 = 30.00% o 0.3000 * 0.50 = 15.00% of Points Earned
Step #5 – Add the number of students who are BOTH Assessment Ready and Coursework Ready divided by the Number of Students in the previous year’s High School Completion Roster (rounded to the hundredth decimal place). Then, multiple that percentage by 1.00 Points. This is the percent of points earned for students with Both Indicators Met.
• Example: o 200 Total Students from the previous year’s High School Completion Roster o 120 Students have Both Indicator Met o 120 / 200 = 60.00% o 0.6000 * 1.00 = 60.00% of Points Earned
Step #6 – Add up the percentage of points earned in the steps above and multiple that by the points allocated to this indicator. This will arrive at the Total College and Career Readiness SPI Points. The SPI Points are rounded to the hundredth decimal place.
• Example: o 0.00 + 15.00 + 60.00 = 75.00% o 0.7500 * 25 = 18.75 Total College and Career Readiness SPI Points
No Indicators Met One Indicator Met Both Indicators Met Totals Total Points
Earned N-size 20 60 120 200 % of All Students 10.00% 30.00% 60.00% 100% Point value 0.00 0.50 1.00 % of Points Earned 0.00 15.00% 60.00% 75.00% 18.75
On-Time Graduation Determining SPI Points:

Updated July 22, 2019
122
Step #1: Determine the number of Students that are in the adjusted cohort and who graduated on time with a High School Diploma. Take the students that graduated on time divided by the students in the adjusted cohort. This percentage is rounded to the hundredth decimal place.
• Example: o Original Cohort – Transfer Out – Removed from Cohort = Adjusted Cohort o 70 – 3 – 2 = 65 o 62 Students Graduated on time o 62 / 65 = 95.38%
Step #2: Multiple the Graduation Rate by the points allocated to the indicator. This will arrive at the Total On-Time Graduation SPI Points. The SPI Points are rounded to the hundredth decimal place.
• Example: o 0.9538 * 12.50 = 11.92 Total On-Time Graduation SPI Points
High School Completion Step #1: Determine the number of Students that are in the High School Completer Roster and whop completed High School with a High School Diploma or GED. Take the students that Completed High School divided by the students in the High School Completer Roster. This percentage is rounded to the hundredth decimal place.
• Example: o 80 Students in the High School Completer Roster o 70 Students Completed High School o 70 / 80 = 87.50%
Step #2: Multiple the High School Completion Rate by the points allocated to the indicator. This will arrive at the Total High School Completion SPI Points. The SPI Points are rounded to the hundredth decimal place.
• Example: o 0.8750 * 12.50 = 10.94 Total High School Completion SPI Points
Participation Rate The number of students tested divided by the number of students eligible to be tested equals the Participation Rate. This percentage is rounded to the hundredth decimal place.
• 194 / 200 = 97.00% Participation Rate