south east aggregates monitoring report 2013 - gov.uk€¦ · this am2013 report for the south east...
TRANSCRIPT
South East Aggregates Monitoring Report 2013 South East England Aggregates Working Party SEEAWP 14/01 AUGUST 2014

Aggregates Monitoring 2013 South East England SEEAWP 14/01
CONTENTS Executive Summary ......................................................................................................................... 4 1. SCOPE OF THIS REPORT ..................................................................................................... 7 2. PLANNING POLICY AND GUIDANCE ................................................................................... 7 3. QUARRIES .............................................................................................................................. 8
Land-won Sand and Gravel ........................................................................................ 8 Local Crushed Rock .................................................................................................... 9
4. WHARVES ............................................................................................................................. 10 Sales of Marine-Dredged Sand and Gravel .............................................................. 10 Imports of Crushed Rock by Sea .............................................................................. 10
5. RAIL DEPOTS ....................................................................................................................... 11 Crushed Rock and Sand and Gravel ........................................................................ 11
6. CONSUMPTION OF PRIMARY AGGREGATES ................................................................. 11 7. SECONDARY AND RECYCLED MATERIAL ...................................................................... 12 8. ENVIRONMENT .................................................................................................................... 12 9. LOCAL PLANS & LOCAL AGGREGATE ASSESSMENTS ................................................ 12 TABLES Table 1: Sand and Gravel Sales, Permissions and Reserves 2013 (000s tonnes) ...................... 14 Table 2: Sales of Soft Sand and Sharp Sand and Gravel 2004- 2013 ......................................... 15 Table 3: Sands and Gravels Sales, Permissions and Reserves 2004-2013 ................................ 16 Table 4: Sand and Gravel Landbank at end 2013 ........................................................................ 17 Table 5: Crushed Rock Sales, Permissions and Reserves in 2013 ............................................. 18 Table 6: Crushed Rock Sales, Permissions, Reserves 2004-2013 .............................................. 19 Table 7: Sales of Marine Dredged Sand and Gravel from Wharves 2004-2013 .......................... 20 Table 8: Imports of Crushed Rock by Sea 2004-2013 .................................................................. 21 Table 9: Sales of Aggregate at SE Rail Depots 2004-2013 ......................................................... 21 FIGURES Figure 1: South East Mineral Planning Authorities ....................................................................... 23 Figure 2: Sand and Gravel sales and permissions 2004 - 2013 .................................................. 24 Figure 3: Sand and Gravel permitted reserves at the end of 2013 .............................................. 24 Figure 4: South East sand and gravel reserves 2004 - 2013 ....................................................... 25 Figure 5: Sales of local crushed rock 2004 - 2013 ....................................................................... 25 Figure 6: Reserves of local crushed rock 2004 - 2013 ................................................................. 26 Figure 7: Landings of marine dredged sand and gravel 2004 - 2013 .......................................... 26 Figure 8: Imports of crushed rock by sea 2004 - 2013 ................................................................. 27 Figure 9: Sales of aggregate at rail depots 2004 - 2013 .............................................................. 27 Figure 10: Primary aggregate consumption 2013 (South East Region) ....................................... 28 APPENDICES APPENDIX A: Permissions, Refusals, Undetermined and Withdrawn Applications in 201329
Applications Permitted in 2013 ................................................................................. 29

Aggregates Monitoring 2013 South East England SEEAWP 14/01
Applications Refused in 2013 ................................................................................... 30 Undetermined Applications at end 2013 ................................................................... 31 Withdrawn Applications in 2013 ................................................................................ 32
APPENDIX B: Key Milestones for Minerals Local Plans in the South East, July 2014 ......... 33 APPENDIX C: Active and Inactive Aggregate Sites, Wharves, Rail Depots, and Recycling and Secondary Aggregate sites in 2013 ................................................................................... 37
Sand & Gravel ........................................................................................................... 37 Crushed Rock ........................................................................................................... 40 Wharves .................................................................................................................... 41 Rail Depots ................................................................................................................ 43 Sites Producing Secondary & Recycled Aggregates ................................................ 44

Aggregates Monitoring 2013 South East England SEEAWP 14/01
4
Executive Summary
This AM2013 report for the South East has been prepared from returns made by quarry, wharf and rail depot operators to Mineral Planning Authorities (MPAs). Recycling and alternative materials data has also been included, together with a record of how applications have been permitted, refused or withdrawn in 2013, or remain undetermined at the end of 2013. Where possible, trend comparisons are made with previous AM reports.
Planning Policy and Guidance
• The National and Regional Guidelines for Aggregates in England 2005-2020 was
published in 2009. But with the revocation of the South East Plan there is no apportionment of the land-won elements to MPAs.
• The National Planning Policy Framework (NPPF) now requires MPAs to prepare an annual Local Aggregate Assessment (LAA), with the forecast of demand for aggregates to be based on an average of 10 years sales data and other relevant local information. MPAs are to submit their LAA to the Aggregates Working Party (AWP) and take its views into account when providing for aggregates in its minerals plan.
• The AWPs will forward the sum of the MPA’s LAA figures to the National Coordinating Group (NCG) which will consider whether these figures make appropriate national and regional provision for a steady and adequate supply of aggregate.
Land-won Sand and Gravel
• Sand and gravel sales in the last 5 years average some 5.8Mt, some 35% less than in the previous 5 years. Land-won sales at 5.4Mt in 2013 continue to constitute less than 50% of the sand and gravel sales from the region.
• Reserves have declined to 77.6Mt, 4Mt less than at the end of 2012, with sales exceeding tonnage in new permissions. However, there were some 19.6Mt of sand and gravel in undetermined applications.
• At the adopted plan levels of provision, or as indicated in draft LAAs, 8 of the 11 authorities at the end of 2013 had landbanks in excess of 7 years. The regional landbank was some 9.2 years
Local Crushed Rock
• Sales of crushed rock were some 1.2Mt in 2013, some 0.4Mt more than in 2012, but this was an estimate as the largest producer declined to give actual sales figures.
• 2013 was marked by a large permission in Kent of some 16.2Mt of ragstone, which exceeds the tonnage in all other permissions for rock in the last 10 years.

Aggregates Monitoring 2013 South East England SEEAWP 14/01
5
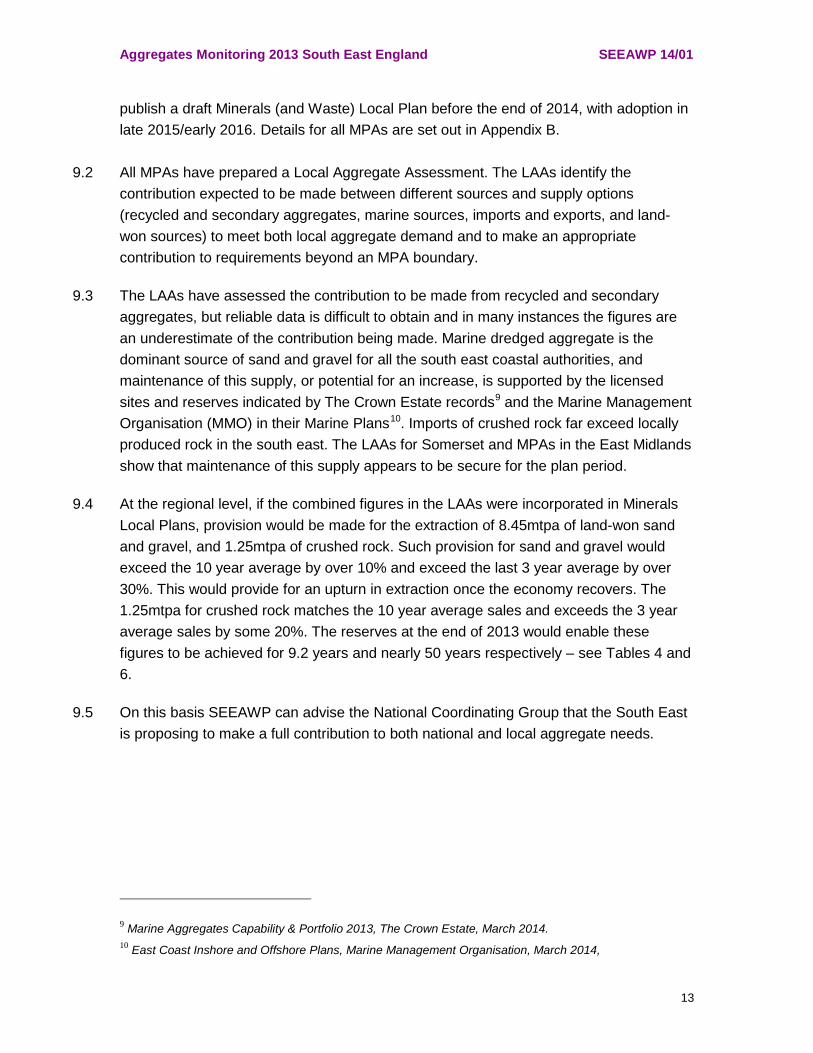
• With some 60Mt of reserves at the end of 2013, there are some 48 years for working at 1.25mtpa, the LAA figures for Kent and Oxfordshire.
Landings of Marine-dredged Sand and Gravel
• Some 6.4Mt of marine dredged sand and gravel was sold from wharves in 2013, the
highest tonnage since 2006 and continuing a rising level of sales over the last 4 years. . • Marine dredged aggregate was providing over 50% of the sand and gravel supply from
the region.
Landings of Sea-Borne Crushed Rock
• Landings of crushed rock in 2013 at 1.5Mt were slightly more than in 2012. • Over 90% of the crushed rock was landed at wharves in Medway and Kent.
Rail Aggregate Depots
• Some 3.0Mt of crushed rock and 0.5Mt of land-won sand and marine sand and gravel
was sold from rail depots in 2013.
Consumption of Primary Aggregates
• AM2009 established that the South East consumed some 15.8Mt of primary aggregates that year and was a small net exporter of both land-won sand and gravel and marine aggregate, principally to London, but a major importer of hard rock, principally from the South West.
• AM2013 returns indicate the same pattern, with overall consumption between 16Mt and 17Mt.
Secondary and Recycled Materials
• The 2013 returns show that over 3.3Mt of CD&EW was being recycled at fixed sites and
used for aggregate, and approaching 0.4Mt from other secondary sources. However, returns were incomplete and these figures need to be treated with caution.
Environment
• In 2013 there were some 21 quarries within or partly within a National Park/AONB, and 12 within or partly within an NNR/SSSI or SPA/SAC.

Aggregates Monitoring 2013 South East England SEEAWP 14/01
6
• Sales figures or reserves within or partly within these designations were not available this year.
Minerals Plans and Local Aggregate Assessments
• Only Buckinghamshire, East Sussex, West Sussex, Hampshire, Isle of Wight and Surrey
have an adopted Minerals Local Plan. • At the regional level, if the figures in the LAAs were incorporated into Minerals Local
Plans, provision would be made for the extraction of 8.45mtpa of land-won sand and gravel and 1.25mtpa of crushed rock.
• Such provision would be in excess of the 10 year sales average for land-won sand and gravel (7.8Mt), and matches the 10 year sales average for crushed rock. On this basis SEEAWP can advise the NCG that the region is proposing to make a full contribution to both national and local aggregate needs.

Aggregates Monitoring 2013 South East England SEEAWP 14/01
7
1. SCOPE OF THIS REPORT
1.1 AM2013 is the eighteenth Aggregates Monitoring report to be produced for South East England from 1996. Data on primary aggregate sales, permissions and reserves from quarries have been provided by operators via the Mineral Planning Authorities (MPAs) that collated individual returns. Data has similarly been obtained for sales from wharves and rail depots, and for recycled and secondary aggregates. A schedule of all the recorded active or inactive sites, are set out in Appendix C.
1.2 The tables in the report are presented for eight geographical counties1 and three Unitary
Authorities2.
1.3 MPAs have also provided details of applications in 2013, those permitted or refused and those undetermined or withdrawn. A summary of the data for each MPA is set out in Appendix A.
1.4 The report also seeks to track how far MPAs have progressed with the preparation,
submission and adoption of Minerals Local Plans. The position at July 2014 is illustrated in Appendix B.
2. PLANNING POLICY AND GUIDANCE
2.1 National and Regional Guidelines for Aggregates Provision in England 2005-2020 was published in June 20093. This set out figures for land-won production together with assumptions for levels of marine sand and gravel, alternative materials and net imports at the regional level. With the revocation of the South East Plan4 there is no apportionment of the land-won elements to MPAs.
2.2 The National Planning Policy Framework (NPPF)5 was issued in March 2012 setting out that the responsibility for minerals planning rests with MPAs. The NPPF recognises minerals as a strategic priority in Local Plan preparation. MPAs should plan for a steady and adequate supply of aggregates by:
- preparing an annual Local Aggregates Assessment (LAA), either individually or jointly by agreement with other MPAs;
1 Berkshire (including Bracknell Forest, Reading, Slough, West Berkshire, Windsor & Maidenhead, and Wokingham), Buckinghamshire, East Sussex (including Brighton and Hove), Hampshire (including Portsmouth, Southampton and New Forest National Park), Kent, Oxfordshire, Surrey, and West Sussex. 2 Isle of Wight, Medway, and Milton Keynes SDNP figures are included in those for East Sussex, Hampshire and West Sussex 3 National & Regional Guidelines for Aggregate Provision in England 2005-2020. DCLG June 2009 4 Regional Strategy for the South East(Partial Revocation) Order 2013 5 National Planning Policy Framework, DCLG March 2012.

Aggregates Monitoring 2013 South East England SEEAWP 14/01
8
- participate in the operation of an Aggregates Working Party and taking the advice of the AWP into account when preparing their LAA;
- make provision for the land won or other elements of their LAA in their mineral plans, taking account of the advice of the AWPs and the National Aggregate Coordinating Group (NCG) as appropriate.
2.3 The National Planning Practice Guidance published in March 20146 confirmed the
government’s intention that the supply of aggregates should be delivered by decentralising more power to MPAs to determine the appropriate level of aggregate extraction. It gives advice to MPAs on the supply options on which an LAA should be based and advice on aggregate landbanks and their use. The LAA forecast of demand for aggregates should be based on the rolling average of 10 years sales data and other relevant local information.
2.4 The Guidance sets out a ‘bottom up’ process in which LAAs are a key element. The AWP will draw together the figures for all the LAAs of the MPAs in its area and assess whether, in its view, the area is proposing to make a full contribution towards meeting both national and local aggregate needs. The AWP will forward the figures and assessment to the NCG. The NCG will consider whether the totals provided by the AWPs propose to make appropriate provision to maintain a steady and adequate supply of aggregate.
3. QUARRIES
3.1 In 2013 there were over 80 quarries producing aggregates, of which 12 were quarries producing crushed rock, the remainder being worked for sand and gravel. There were also over 30 inactive sand and gravel sites and 5 inactive crushed rock quarries which contained reserves and either could be re-opened or had not yet started production. The list of sites is set out in Appendix C.
Land-won Sand and Gravel
3.2 Sales, permissions and reserves data for sand and gravel are shown in Table 1 by
county. Sales are shown to be some 5.4 million tonnes (Mt) in 2013, 100,000 tonnes less than in 2012. A further 600,000 tonnes of sand and gravel was sold for non-aggregate uses.
6 National Planning Practice Guidance, DCLG March 2014.

Aggregates Monitoring 2013 South East England SEEAWP 14/01
9
3.3 Table 2 shows the contribution of soft sands and sharp sands and gravels to the sales totals for the ten year period 2004-2013. The ratio between the sales has remained constant with sharp sands and gravels accounting for over 70% of sales, and soft sand providing less than 30%. In 2013 some 4% of the sharp sands and gravels were sold as constructional fill.
3.4 The trends in sand and gravel sales in the region are shown in Table 2 and Figure 2.
The overall trend is one of decline, with 5.4Mt of sales in 2013. Whereas the average sales 2004-2008 were some 8.9Mt, sales in the last 5 years have averaged 5.8Mt, a 35% fall. Sales of land-won sand and gravel continue to supply less than 50% of the primary sand and gravel supply contribution from the region.
3.5 The permitted reserves of land-won sand and gravel in the region at the end of 2013
were recorded as some 77.6Mt, some 4Mt less than in 2012, as sales exceeded the tonnage in new permissions – see Table 3 and Figure 4. However, there are some 19.6Mt of sand and gravel in undetermined applications. The details of applications in 2013 are set out in Appendix A.
3.6 The permitted reserves of sand and gravel are shown by county/unitary authority in
Table 4 and Figure 3. Set against the adopted plan figures or in LAAs, 8 of the 11 authorities have a landbank in excess of 7 years, and one other has a landbank only just below 7 years. On these figures, the regional landbank at the end of 2013 was 9.2 years. However, this is the total for all sand and gravel, and could mask a shortfall in soft sand reserves.
3.7 In addition there were over 6Mt of reserves suitable for non-aggregate uses.
3.8 Setting aside extensions of time at existing sites, in 2013 permissions were granted for
only 450,000 tonnes of sand and gravel in an Area of Search, but over 3Mt in ‘other’ non-designated areas - see Appendix A. Of the tonnage in undetermined applications over 10Mt was in preferred areas, and over 9Mt in ‘other’ non-designated areas. It is notable that nearly all the 10Mt was in Surrey which has an up to date Minerals Local Plan. Local Crushed Rock
3.9 In 2013 sales of local crushed rock in the South East were some 1.2Mt, some 0.4Mt more than in 2012. This was the highest sales since 2009 reversing the recent decline in sales - see Tables 5 and 6 and Figure 5. But the 1.2Mt figure is an estimate as the largest producer has declined to give actual sales figures. The increase is accounted for by an additional 0.4Mt of crushed rock being sold for construction fill compared with 2012. This resulted in less than

Aggregates Monitoring 2013 South East England SEEAWP 14/01
10
half the sales in 2013 being for uncoated roadstone, railway ballast, concrete aggregate, armourstone and other screened and graded aggregate.
3.10 The reserves of local crushed rock at the end of 2013 were some 60Mt, a substantial
increase over 2012 – see Figure 6. This was due to a single large permission for an extension of a ragstone quarry in Kent. The 16.2Mt permission exceeds the tonnage in all other permissions in the South East in the last ten years. At the LAA figures for Kent and Oxfordshire, 1.25Mt, the rock landbank would last for some 48 years - see Table 6.
3.11 Sales and reserves of chalk are not included in the tables in order to maintain comparison with earlier years. Chalk is not normally regarded as an aggregate material, but is used in some circumstances for construction fill in place of aggregate.
4. WHARVES
4.1 There were 31 wharves in the region handling aggregates in 2013. 26 handled marine dredged sand and gravel, 5 crushed rock - see Appendix C. Twelve wharves were inactive.
Sales of Marine-Dredged Sand and Gravel
4.2 In 2013 sales of marine dredged sand and gravel from wharves in the south east amounted to 6.4Mt. – see Table 7 and Figure 7.This is an increase of 0.3Mt over 2012, the highest level of sales since 2006 and continuing a rising level of sales over the last 4 years. Marine aggregate provide over 50% of sand and gravel supply to the South East. Wharves in Kent and Medway handle 50% of marine dredged sand and gravel landings.
4.3 The marine dredged sand and gravel landed in the South East continues to be received from the East Coast, Thames, South Coast, and East English Channel licensed dredging areas. In 2013 it also included a substantial tonnage from R Thames to deepen access to the development of Thames Gateway port. This latter tonnage was from outside The Crown Estate licensed areas and partly accounts for The Crown Estate landing figures for 2013 at 4.6Mt being so much lower than the AM 2013 returns.
Imports of Crushed Rock by Sea
4.4 Sales of crushed rock from wharves in the south east amounted to some 1.5Mt in 2013 – see Table 8 and Figure 8. This was100,000t more than the 2012 figure, but sales in the last 5 years remain at some 40% less than that in the previous 5 years. Nearly 90% of the crushed rock was sold for roadstone, railway ballast, concrete aggregate and other screened and

Aggregates Monitoring 2013 South East England SEEAWP 14/01
11
graded aggregate, the rest for construction fill. Over 90% of crushed rock imports were received at wharves in Medway and Kent.
4.5 Rock by sea to the south east has a variety of sources, from Norway and Scotland (Glensanda), to N Wales, Northern Ireland and France.
5. RAIL DEPOTS
Crushed Rock and Sand and Gravel
5.1 Some 3.5Mt of aggregates was recorded as sold from 24 rail depots in the region in 2013, compared with 3.1Mt in 2012 - see Table 9, Figure 9 and Appendix C. Sales have continued to increase since 2009 and the 2013 sales are at a level comparable with the first 5 of the last 10 years. Some 3.0Mt of the 2013 sales was crushed rock, of which 84% of sales was for roadstone, railway ballast, concrete aggregate, armourstone and other screened and graded aggregate, a larger proportion than in previous years.16% was sold for construction fill.
5.2 Sales of sand and gravel from rail depots in 2013 amounted to some 0.5Mt, 0.1Mt more than in 2012. Some 66% was land-won sand and gravel, a larger proportion than last year, and 33% marine sand and gravel - largely from landings at wharves in London.
6. CONSUMPTION OF PRIMARY AGGREGATES
6.1 AM2009 established that the South East consumed some 15.8Mt of primary aggregates that year and was a small net exporter of both land-won sand and gravel and marine aggregate, principally to London, but a major importer of hard rock, principally from the South West.
6.2 AM2013 records some 18.0Mt of primary aggregate supply to the South East. Local land-won sand and gravel and crushed rock accounts for some 6.6Mt. Some 7.9Mt is imported by sea; 6.4Mt of this is marine sand and gravel and 1.5Mt of crushed rock from outside England. Imports by rail totalled some 3.5Mt, some 85% (3.0Mt) of which was crushed rock, some 75% of which was from the South West, 17% from the East Midlands, and the remainder from Wales, Ireland and Scotland.
6.3 AM2013 did not include comprehensive data on imports or exports to the South East by
road. However, it did record that 1.6Mt (some 1.2Mt of the marine aggregate and some 0.4Mt of crushed rock) landed at wharves in Kent and Medway was exported to London, most of which was transported by road. Some 0.2Mt of marine aggregate was imported

Aggregates Monitoring 2013 South East England SEEAWP 14/01
12
from landings at wharves in London. It can be assumed from these figures that primary aggregate consumption in the South East in 2013 was between 16Mt and 17Mt.
7. SECONDARY AND RECYCLED MATERIAL
7.1 The AM2013 survey asked operators at fixed sites to provide data on CD&EW and secondary materials. The returns record over 130 sites – see Appendix C - from which over 3.3Mt of CD&EW was recycled as aggregate, with approaching a further 0.4Mt from secondary sources – rail ballast, PFA, FBA and IBA in descending order of tonnage. However, it was clear from many MPA returns that the data was incomplete and must be treated with caution.
7.2 The AM2013 survey cannot be directly compared with the national 20057 and 20088 survey data for the region, as the national surveys included recycling by mobile plant. The 2005 survey report suggested that some 6Mt was a ‘reasonable indication’ of the tonnage recycled as aggregate in the south east region, and the 2008 WRAP survey did not offer sufficient data to indicate a different figure. However, the current state of the economy and reduced activity in the construction sector suggests that recycling is likely to be a lesser figure than 6Mt in 2013. Nonetheless, at the 3.7Mt incomplete figure it would contribute over 20% of aggregate consumption in this region.
8. ENVIRONMENT
8.1 The AM2013 survey identifies that there were 21 active or inactive quarries in the New Forest, South Downs National Parks or an AONB and 12 in or partly within an NNR/SSSI or SPA/SAC. Over 35 quarries were in the Green Belt.
8.2 Sales figures and reserves in quarries within or partly within these designations were published in the AM2009 survey, but were not available for 2013.
9. LOCAL PLANS & LOCAL AGGREGATE ASSESSMENTS
9.1 Buckinghamshire, East Sussex, Hampshire, West Sussex, Isle of Wight and Surrey have an adopted Minerals Local Plan. Of the other MPAs, only Kent and Wokingham intend to 7 Survey of Arisings and Use of Alternatives to Primary Aggregates in England, 2005: Construction, Demolition and Excavation Waste, Capita Symonds for DCLG, November 2006, and Survey of Arisings and Use of Alternatives to Primary Aggregates in England, 2005: Other Materials, Capita Symonds for DCLG, December 2006. 8 Survey on Construction, Demolition and Excavation Waste (CDEW) Arisings, Use and Disposal in England 2008. WRAP for DCLG, April 2010.
Aggregates Monitoring 2013 South East England SEEAWP 14/01
13
publish a draft Minerals (and Waste) Local Plan before the end of 2014, with adoption in late 2015/early 2016. Details for all MPAs are set out in Appendix B.
9.2 All MPAs have prepared a Local Aggregate Assessment. The LAAs identify the contribution expected to be made between different sources and supply options (recycled and secondary aggregates, marine sources, imports and exports, and land-won sources) to meet both local aggregate demand and to make an appropriate contribution to requirements beyond an MPA boundary.
9.3 The LAAs have assessed the contribution to be made from recycled and secondary
aggregates, but reliable data is difficult to obtain and in many instances the figures are an underestimate of the contribution being made. Marine dredged aggregate is the dominant source of sand and gravel for all the south east coastal authorities, and maintenance of this supply, or potential for an increase, is supported by the licensed sites and reserves indicated by The Crown Estate records9 and the Marine Management Organisation (MMO) in their Marine Plans10. Imports of crushed rock far exceed locally produced rock in the south east. The LAAs for Somerset and MPAs in the East Midlands show that maintenance of this supply appears to be secure for the plan period.
9.4 At the regional level, if the combined figures in the LAAs were incorporated in Minerals
Local Plans, provision would be made for the extraction of 8.45mtpa of land-won sand and gravel, and 1.25mtpa of crushed rock. Such provision for sand and gravel would exceed the 10 year average by over 10% and exceed the last 3 year average by over 30%. This would provide for an upturn in extraction once the economy recovers. The 1.25mtpa for crushed rock matches the 10 year average sales and exceeds the 3 year average sales by some 20%. The reserves at the end of 2013 would enable these figures to be achieved for 9.2 years and nearly 50 years respectively – see Tables 4 and 6.
9.5 On this basis SEEAWP can advise the National Coordinating Group that the South East
is proposing to make a full contribution to both national and local aggregate needs.
9 Marine Aggregates Capability & Portfolio 2013, The Crown Estate, March 2014. 10 East Coast Inshore and Offshore Plans, Marine Management Organisation, March 2014,

Aggregates Monitoring 2013 South East England SEEAWP 14/01
14
TABLES Table 1: Sand and Gravel Sales, Permissions and Reserves 2013 (000s tonnes)
County Soft Sand (Building Sand) Sharp Sands and Gravels Total: All Sands and Gravels
Reserves at start of year
Sales during year
Permissions during year
Reserves at end of year
Reserves at start of year
Sales during year
Permissions during year
Reserves at end of year
Reserves at start of year
Sales during year
Permissions during year
Reserves at end of year
Berkshire Unitaries c c 0 c c c 2,400 c 8,117 792 2,400 10,272 Buckinghamshire 1,415 62 0 1,303 8634 711 0 7,840 10,040 773 0 9,143 East Sussex c c 0 c c c 0 c c c 0 c Hampshire 2,427 119 0 1,914 12,083 728 0 11,171 14,610 847 0 13,085 Isle of Wight 310 c 0 180 1358 c 0 1,530 1,668 62 0 1,710 Kent 14,717 483 0 14,465 3810 273 0 4,118 18,527 756 0 18,583 Medway c c 0 c c c 0 c c c 0 c Milton Keynes c c 0 c c c 450 c c c 450 c
Oxfordshire 2,415 165 0 2,164 5,836 401 873 6,619 8,251 566 873 8,783 Surrey 7,281 430 0 4,366 2,093 366 0 1,759 9,374 796 0 6,125 West Sussex 3,876 277 0 3,534 925 0 0 925 4,801 277 0 4,459 Totals 32,666 1,560 0 28,401 48,822 3,839 3,723 49,203 75,297 5,399 3,723 77,604 Source: AM2013 Survey
c = confidential figure or figure which cannot be recorded without revealing a confidential figure 0 = nil sales or less than 500 tonnes The figures include estimates for sites for which returns were not received The reserves for Hants, Kent and Surrey do not include over 6.4Mt allocated for non aggregate use Reserves of an unspecified type have been allocated to soft sand & sand & gravel in the same % as for known reserves. The figures for sharp sands and gravels include some 4% sold for construction fill and 9% of the reserves are recorded as only suitable for fill.

Aggregates Monitoring 2013 South East England SEEAWP 14/01
15
Table 2: Sales of Soft Sand and Sharp Sand and Gravel 2004- 2013
(000s tonnes)
Soft Sand Sharp Sands and
Gravels All Sands and
Gravels Sales %
change on
previous year
Sales % change
on previous
year
Sales % change
on previous
year YEAR 2004 2,624 0 7,781 -2 10,405 -2% 2005 1,749 -33 7,604 -5 9,713 -6% 2006 1,776 1 7,027 -8 8,804 -9% 2007 1,906 7 6,596 -4 8,502 -3% 2008 2,268 19 5,031 -24 7,229 -14% 2009 1,387 -39 4,620 -8 6,007 -18% 2010 1,676 21 *4,504 -3 *6180 3% 2011 1,524 -9 4,300 -5 5,824 -6% 2012 1,593 0 3,975 -8 5,514 -5% 2013 1,560 -2 3,839 -3 5,399 -2%
Percentage Change 2004-2013 -41%
-51%
-48% Note: aggregate for construction fill has been included with sharp sand and gravels * includes corrected figure for Berkshire

Aggregates Monitoring 2013 South East England SEEAWP 14/01
16
Table 3: Sands and Gravels Sales, Permissions and Reserves 2004-2013
(million tonnes)
Year Sales Planning
permissions
Reserves 2004 10.4 2.9 80.8 2005 9.7 4.6 87.3 2006 8.8 *0.6 76.4 2007 8.5 #9.9 78.1 2008 7.3 8.8 84.7 2009 6.0 11.7 ^83.5 2010 ~6.2 10.2 88.1 2011 5.8 4.1 84.9 2012 5.5 5.3 81.5 2013 5.4 3.7 77.6
10 year total 73.6
61.8
10 year average 7.4
6.2
last 3 year average 5.6 4.4
Sources: AM2012 Table 3, AM2013 survey * includes +0.3 correction by Surrey from AM2006 published figure # includes -0.7 correction by Berks from AM2007 published figure ^ increased by +4.4Mt arising from Hants & Oxfordshire corrections ~ includes+0.1 correction for Berkshire from AM2010 published figure

Aggregates Monitoring 2013 South East England SEEAWP 14/01
17
Table 4: Sand and Gravel Landbank at end 2013
Area All Sands and Gravels
Adopted Local Plan or
LAA figure (million tonnes)
Reserves (thousand
tonnes)
Landbank at end of
2013 (years)
Berkshire 0.88* 10,272 11.7 Buckinghamshire 0.96* 9,143 9.5 East Sussex 0.1* c >35 Hampshire 1.56 13,085 8.4 Isle of Wight 0.1* 1,710 17.1 Kent 1.6* 18,583 11.6 Medway 0.18** c <7 Milton Keynes 0.17** c <7 Oxfordshire 1.0* 8,783 8.8 Surrey 1.4 6,125 4.4 West Sussex 0.5* 4,459 8.9 TOTAL 8.45 77,604 9.2
Sources: Adopted Local Plans or *LAA with 10 year average sales, ** LAA with different figure to 10 year average sales Footnote to Table 4 c = confidential figure, or to maintain confidentiality

Aggregates Monitoring 2013 South East England SEEAWP 14/01
18
Table 5: Crushed Rock Sales, Permissions and Reserves in 2013
(000s tonnes)
County
Reserves at start of year
Sales during
year Permissions during year
Reserves at end of the year
Kent c c 16,210 c Oxfordshire c c 0 c Totals 45,000* 1,200* 16,210 60,000*
Source: AM2012 Table 5 and AM2013 survey *figures rounded as substantial Kent sales and reserves are estimates Footnotes to Table 5 Sales in other MPAs are less than 50,000tpa, and reserves total less than 1Mt. Some 31% of sales and 13% of reserves were for constructional fill The majority of sales and reserves in Oxfordshire were undifferentiated between screened and graded aggregate and construction fill; they were assigned in the same % as the known figures. Undifferentiated sales in Kent were assigned equally between screened and graded aggregate and construction fill To be comparable with previous years, figures do not include chalk.
Aggregates Monitoring 2013 South East England SEEAWP 14/01
19
Table 6: Crushed Rock Sales, Permissions, Reserves 2004-2013
(million tonnes)
Year Sales Permissions Reserves Years life** 2004 1.4 5.6 56.4 25.6 2005 1.6 2.3 53.8 34.5 2006 1.3 0 51.5 33.0 2007 1.5 0.4 50.5 32.4 2008 1.4 0.6 48.5 31.1 2009 1.3 0.5 47.9 33.3 2010 1.1 0 47.6 33.1 2011 0.9 0.4 48.0* 33.3 2012 0.8* 0 45.0* 36 0 2013 1.2* 16.2 60.0* 48.0
10 year total
12.5 26.0
10-year average
1.25 2.6
last 3 year average
1.0
5.5
Source: AM2012 and AM2013 Footnotes for Table 6 Figures are for locally won rock to be comparable with Table 5 *Figure rounded to preserve confidentiality **at 2.2mpa from 2001, 1.56mtpa from 2005, 1.44mtpa from 2009, and 1.25mtpa, the 10 year sales average for 2012 and the LAA figures for Kent and Oxfordshire in 2013.

Aggregates Monitoring 2013 South East England SEEAWP 14/01
20
Table 7: Sales of Marine Dredged Sand and Gravel from Wharves 2004-2013
(000s tonnes) County 2004 2005 2006 2007 2008 2009 2010 2011 2012 2013 Hampshire & Isle of Wight
1853
1,687
1,992
1,908
1,669
1,157
1,213
1,279
1,190
1,511
Kent & Medway 3,498 3,291 4,319 3,425 2,850 3,127 2,680 3,012 3,229 3,215
East Sussex & West Sussex
1133
977
1,390
799
1,062
701
686
1,475
1,734 1,694
Totals 6,484 5,955 7,701 6,132 5,581 4,985 4,579 5,766 6,153 6,420 Source: AM surveys 2003-2012 Footnotes to Table 7 Note: The Crown Estate landings in 2013 were only 4.6Mt, partly reflecting dredgings landed from outside licensed areas in connection with the Thames Gateway port project Guideline assumption for marine dredged sand and gravel landings in SE 2005-2020 = 7.6mtpa

Aggregates Monitoring 2013 South East England SEEAWP 14/01
21
Table 8: Imports of Crushed Rock by Sea 2004-2013
(000s tonnes) County 2004 2005 2006 2007 2008 2009 2010 2011 2012 2013 Hampshire & Isle of Wight 385 385 313 50* 32 25* 44 34 33 31 Kent & Medway 2,561 1980 2,098 2,780 2,067 1,344 1,602 1,724 1,194 1,402 East Sussex & West Sussex 219 140 120* 200* 206 108 235 186 249 95 Totals 3165 2505 2530* 3,030* 2,305 1,480* 1881 1,944 1,476 1,528
Source: AM2012 Table 8 and AM2013 survey Footnotes to Table 8 * = figure rounded to avoid revealing a confidential figure Guideline assumption for net imports of aggregate to SE from outside England 2005-2020 = 1.9mtpa Table 9: Sales of Aggregate at SE Rail Depots 2004-2013
(000s tonnes) County 2004 2005 2006 2007 2008 2009 2010 2011 2012 2013 Berks and Hants 2,299 1,762 1737 1,935 1369 1094 1054 1215 1,222 1,090 Bucks, Milton Keynes and Oxfordshire 689 790 791 887 733 447 729 659 552 762 Kent and Medway 582 575 572 594 581 414 356 446 313 465 Surrey & West Sussex 587 557 557 669 657 621 888 949 1,000 1,192 Totals 4,157 3,685 3,657 4,085 3,340 2,576 3,027 3,269 3,087 3,509
Source: AM2012 Table 9 and AM2013 survey Footnotes to Table 9 85% of the aggregate received in 2013 at rail depots was crushed rock, 10% land-won sand & gravel and 5% marine aggregate.

Aggregates Monitoring 2013 South East England SEEAWP 14/10
22
FIGURES

Aggregates Monitoring 2013 South East England SEEAWP 14/10
23
Figure 1: South East Mineral Planning Authorities
1
3
4
5
6
1 – Bracknell Forest 2 – Brighton & Hove 3 – Reading 4 – Slough 5 - Windsor and Maidenhead 6 - Wokingham
2
Boundary of New Forest NPA not shown

Aggregates Monitoring 2013 South East England SEEAWP 14/10
24
Figure 2: Sand and Gravel sales and permissions 2004 - 2013
Figure 3: Sand and Gravel permitted reserves at the end of 2013

Aggregates Monitoring 2013 South East England SEEAWP 14/10
25
Figure 4: South East sand and gravel reserves 2004 - 2013
Figure 5: Sales of local crushed rock 2004 - 2013

Aggregates Monitoring 2013 South East England SEEAWP 14/10
26
Figure 6: Reserves of local crushed rock 2004 - 2013
Figure 7: Landings of marine dredged sand and gravel 2004 - 2013

Aggregates Monitoring 2013 South East England SEEAWP 14/10
27
Figure 8: Imports of crushed rock by sea 2004 - 2013
Figure 9: Sales of aggregate at rail depots 2004 - 2013

Aggregates Monitoring 2013 South East England SEEAWP 14/10
28
Figure 10: Primary aggregate consumption 2013 (South East Region)
Land won sand and gravel: Unknown
Crushed rock: 3Mt (from England and
Wales)
Marine sand and gravel:
1Mt Crushed rock:
0.4Mt Crushed rock: 1.5Mt
(from outside England and Wales)
Marine sand and gravel: 6.4Mt
LONDON
Land won sales sand & gravel and crushed rock: 6.6Mt

Aggregates Monitoring 2013 South East England SEEAWP 14/10
29
APPENDIX A: Permissions, Refusals, Undetermined and Withdrawn Applications in 2013 S = site identified as (part of) Specific Site in Minerals Plan PA = site in Preferred Area AS = site in Area of Search O = other
Applications Permitted in 2013
Quarries Mineral
NGR
Applicant Company Site type Reserves
(tonnes) Nat. Park AONB SSSI/
NNR SPA/ SAC
Green Belt
W Berks: Wasing Lower Farm O
Sand & gravel
Lafarge/Tarmac & Marley Tiles
New quarry 2,400,000
Bucks: The Lea O New Denham PA
Sand & gravel Sand & gravel
504800 186000 040000 847000
Harleyford Aggregates Summerleaze Ltd
Quarry lateral extension(time) Lateral Extension(time)
0 0
GB GB
Hants: Fawley Quarry (Badminton Farm)
Sand & gravel
SU 467 021
Mid Hants Ltd Quarry – time extension
0 NFNP
Kent: Hermitage Quarry Hermitage Lane, Aylesford O
Crushed rock (ragstone)
TQ572235 156028
Gallagher Aggregates
Lateral Extension
16,210,000
Medway: Hoo/Kingsnorth Sand & gravel
TQ 795 725
Lafarge Tarmac Quarry time extension
0
Milton Keynes: Land s of Caldecote Farm Newport Pagnell AS
Sand & gravel
SP 878 422
SGS Construction Ltd
Extension 450,000
Oxon : Wicklesham Farm, Farringdon O Moorend Lane Farm, Thame O
Sand & gravel Sand& gravel
SU 286 939 SC 067 713
Grundon David Einig Contracting Ltd
Lateral extension New quarry
853,000 20,000
W Sussex: Washington Sandpit Philpots Stone Quarry
Soft sand Dimension stone
- -
Britannia Crest Recycling Ltd Sussex Sandstone Ltd
Extension of time Lateral extension
0 (20,000)
TOTALS: Soft Sand S&G Rock
0 3,723,000 16,210,000
Wharves Capacity W Sussex: Kingston Railway Wharf
- Day Group Extension in time

Aggregates Monitoring 2013 South East England SEEAWP 14/10
30
Rail Depots None Secondary/Recycling W Berks: Old Stocks Farm Colthrop processing plant Copyhold Farm (Granted on appeal)
C&D C&D C&D
- - -
Aldermaston Recycling Grundon Aggregates Raymond Brown
Existing site New site Existing site
20,000 15,000 10,000
Bucks: Chiltern View Nurseries
C&D SU 847 099
Mr James Bone - 25,000
East Sussex: Polegate Yard Unit 13, Dittons Road, Polegate R/o Reprodux House, Beach Close, Newhaven
C&D C&D C&D
TQ 581 069 TQ 598 046 TQ 598 046
Haulaway Ltd Paul’s Mini skips KSD Environmental Services Ltd
Other Other other
45,000 Part of 15,000 Part of 50,000
Isle of Wight: Blackwater Quarry, St Georges Down
C&D road planings
451 389 8/86222.1
Wight Building Materials Ltd
Existing site 34,000 + 46,000
Oxon: Hanson Building Products, Sutton Courtenay
C&D SU 517 931
Hanson UK In quarry 80,000
Surrey: The Gas Holding Station, Whyteleaf
C&D 533680 159239
LMD Services Other 75,000
TOTAL 400,000tpa
Applications Refused in 2013
Quarries Mineral NGR
Applicant Site type Reserves (tonnes)
Nat. Park AONB SSSI/
NNR SPA/ SAC
Green Belt
TOTAL: S&G
0
Wharves Capacity
Rail Depots None

Aggregates Monitoring 2013 South East England SEEAWP 14/10
31
Secondary & Recycled
W Berks: Red Shute Hill C&D Harwood Recycling
New site 5,000
Hants: Kingslere Quarry, Wolverton
Recycling 455974 157521
John Stacey & Sons Ltd
Disused chalk pit
200,000 AONB
TOTAL 205,000tpa
Undetermined Applications at end 2013
Quarries Mineral NGR Site type Reserves
(tonnes) Nat. Park AONB SSSI/
NNR SPA/ SAC
Green Belt
Bucks Park Lodge Quarry O All Souls Farm O Land adjacent to Uxbridge Road, George Green O
Sand & gravel Sand & gravel Sand & gravel
501821 183502 504215 184631 499402 180866
Brett Aggregates Lafarge Tarmac Brett Aggregates
Lateral extension time Lateral extension time New Quarry
0 0 900,000
AONB
GB GB GB
Hants: Mortimer Quarry, (Benyons Enclosure)
Sand & gravel
SU 627 646
Hanson Aggregates
Quarry –time extension
0(2,000,000 permitted 2011)
Kent: Dungeness Shingle Borrow Pit O
Sand & gravel
TR 096 171
Environment Agency
Borrow pit 1,442,000 SSSI/ NNR
SPA/ SAC
Milton Keynes: Land to e of Haversham Road, Wolverton AS
Sand & gravel
SP 820 420
Hanson Quarry Products
New quarry 340,000
Oxon: CAMAS land Sutton Wick Quarry PA Caversham Quarry, Caversham O Gill Mill Quarry, Ducklington O
Sand & gravel Sand & gravel Sand & gravel
SU 486 948 SU 751 767 SP 368 082
J Curtis & Sons Lafarge Tarmac Smith & Sons Bletchington
Lateral extension Lateral extension Lateral Extension
350,000 1,860,000 5,000,000
Surrey:Milton Park Farm, Egham PA Manor Farm, Laleham PA Watersplash Farm, Shepperton PA Homers Farm, Bedfont PA
Sand & gravel Sand & gravel Sand & gravel Sand & Gravel
501000 169940 505101 169848 509340 167591 507090 173190
Hanson UK Brett Aggregates Ltd Cemex UK Henry Streeter Ltd
New quarry New quarry New quarry New Quarry
2,142,000 1,500,000 1,260,000 752,000
GB GB GB GB

Aggregates Monitoring 2013 South East England SEEAWP 14/10
32
Mercers South, Nutfield PA Addlestone Quarry, New Haw O Farnham Quarry(Alton Road), Wrecclesham O
Soft Sand Sand & Gravel Soft Sand
530660 151740 505929 163521 481581 144385
J&J Franks Ltd Cappagh Aggregates Earthline Ltd
New Quarry Renew expired quarry permiss Renew expired quarry permiss
4,100,000 0 (30,000) 0 (770,000)
GB GB GB
TOTAL: Soft Sand S&G Rock
4,100,000 15,546,000 0
Wharves Capacity None Rail Depots Surrey: Salfords Rail Depot, Salfords
Primary aggregates
528563 145777
Day Aggregates Upgrade largely derelict depot
100,000 -but not operate in short term
Secondary & Recycled W Berks: Theale Quarry C&D - Hadleys New site 100,000 Bucks: All Souls Quarry C&D In active quarry 110,000 Oxon: Shipton on Cherwell Quarry
C&D SP 477 175
Shipton Ltd In active quarry 85,000 SSSI/NNR GB
Surrey:: Salfords Rail Depot, Salfords
Secondary IBA & HBM (75% C&D)
528511 145995
Day Aggregates At rail sidings 110,000IBA 25,000 HBM
TOTALS C&D IBA & HBM
295,000tpa 135,000tpa
Withdrawn Applications in 2013
Quarries Mineral NGR
Applicant Site type Reserves (tonnes)
Nat. Park AONB SSSI/
NNR SPA/ SAC
Green Belt
None Wharves & Rail Depots Capacity None Secondary & Recycled TOTAL
Aggregates Monitoring 2013 South East England SEEAWP 14/10
33
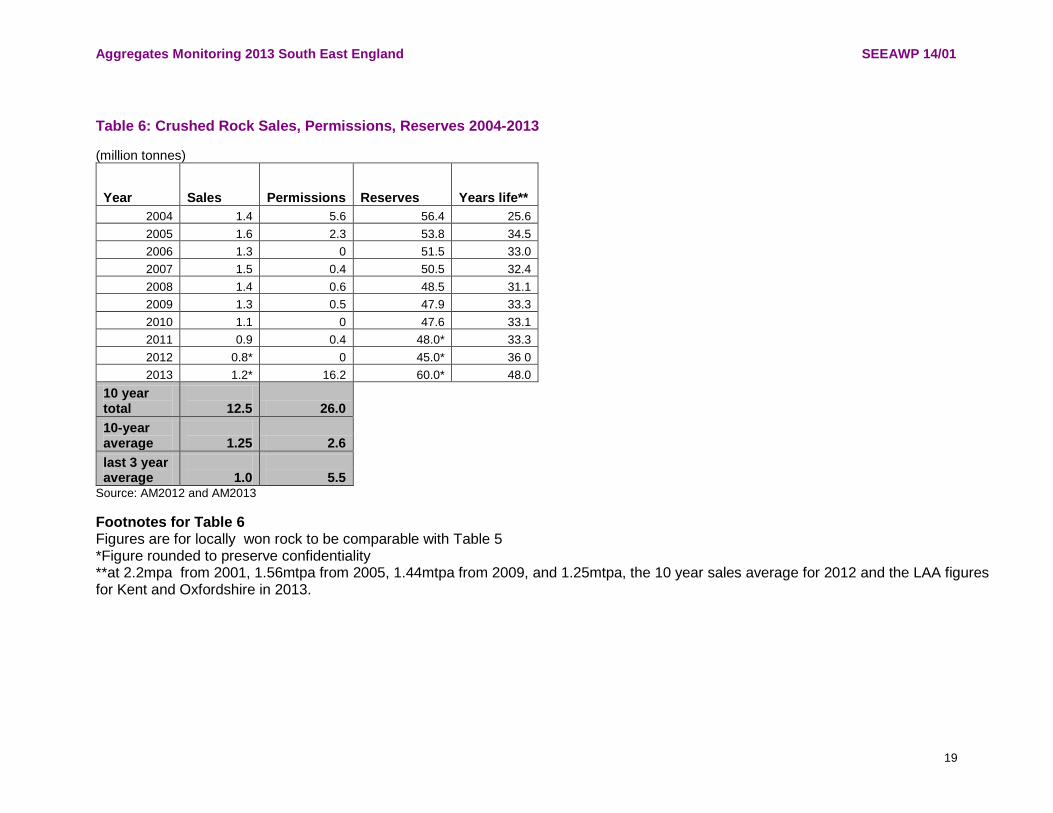
APPENDIX B: Key Milestones for Minerals Local Plans in the South East, July 2014 Bold = future dates.
MPA Local Plan, DPD or SPD title
Public Participation (Reg 18)
Publish Draft (Reg
19)
Submission to S of State
(Reg 22) Estimated date of EIP
Estimated date for
Adoption Comments
Bracknell Forest
Comprehensive Local Plan
Sep-Oct 2016
Mar-Apr 2018
Oct 2018 Nov 2018 - Apr 2019
July 2019 A Comprehensive Local Plan is included in the LDS (Jan 2014). This states that it will include consideration of the need for minerals & waste management policies.
Reading
Local Plan Options consultation July-Aug 2014
Nov-Dec 2015
Feb 2016 May-June 2016
Nov 2016 LDS 2013 sets out a timetable for a Local Plan to include minerals policies- unless agreement is reached on a joint plan.
Slough
A composite Local Plan is now in place demonstrating compliance with NPPF. It incorporates recently adopted DPDs and any saved Local Plan policies (including those from the 2001 Replacement Berks Minerals Plan).
West Berkshire
West Berkshire Minerals & Waste Development Plan Document
Dec 2013-May 2015
May-June 2015
Sept 2015 Dec 2015 Sept 2016 The Key Milestones are under review and it is likely that this timetable will be revised. An updated LDS is likely to be published over the summer of 2014.

Aggregates Monitoring 2013 South East England SEEAWP 14/10
34
MPA Local Plan, DPD or SPD title
Public Participation (Reg 18)
Publish Draft (Reg
19)
Submission to S of State
(Reg 22) Estimated date of EIP
Estimated date for
Adoption Comments
Windsor and Maidenhead
Borough Local Plan
Summer 2013-March 2014
- - - - Saved policies in RMLP apply until reviewed in Borough Local Plan. Consultation on draft BLP preferred options closed in March 2014.
Wokingham
Minerals & Waste Local Plan
SA scoping report & consultation Apr-May 2014. Issues & Options consultation Jun-July 2014
Sept-Oct 2014
Feb 2015 Summer 2015
Winter 2015 A new Minerals & Waste Local Plan is included in the current LDS (March 2013). The LDS indicates that the authority may produce a joint plan with other authorities in central Berkshire and further discussions are continuing.
Buckingham shire
Minerals & Waste Core Strategy; Minerals Local Plan
July-Aug 2007 Feb-Mar 2007
Sept 2011 Not to be continued
Nov 2011 Not to be continued
Feb 2012
Not to be continued
Nov 2012
Core Strategy adopted Nov 2012 Revised Minerals and Waste Local Development Scheme published March 2014 shows intention to commence work on a Replacement Minerals & Waste Local Plan in Autumn 2014.
E Sussex
Waste & Minerals Plan; Waste and Minerals Sites Plan
Feb-Apr 2008 Oct-Dec 2011 July 2014
Feb 2012 Aug 2015
June 2012 Nov 2015
18-28 Sept 2012 Mar 2016
Feb 2013 June 2016
Adopted 19 Feb 2013 Three partners to the Plan - East Sussex CC, Brighton & Hove City Council and SDNPA

Aggregates Monitoring 2013 South East England SEEAWP 14/10
35
MPA Local Plan, DPD or SPD title
Public Participation (Reg 18)
Publish Draft (Reg
19)
Submission to S of State
(Reg 22) Estimated date of EIP
Estimated date for
Adoption Comments
Hampshire
Minerals & Waste Plan
Feb-Mar 2011
Oct-Nov 2011
Feb 2012
6-15 June 2012 to 13-14 Mar 2013
Adopted 15 October 2013
The Hampshire Minerals & Waste Plan (HMWP) prepared jointly by 5 MPAs/WPAs- Hants CC, Soton & Ports UAs, NFNPA & SDNPA
Isle of Wight
Isle of Wight Core Strategy (including waste and minerals) and Development Management DPD
Oct-Dec 2010
Apr-May 2011
June 2011 Oct 2011 Mar 2012 The Island Core strategy was adopted on 21 March 2012. The Core Strategy, Adoption and Environmental Statements can be viewed via the Council’s website.
Kent
Minerals & Waste Plan Mineral Sites Plan
Jan 2009-Jan 2014 Apr 2009-Apr 2015
Jan-Aug 2014 Apr-May 2015
Sept 2014 Aug 2015
Late 2014-early 2015 Jan 2016
Early 2016 July 2016
Revision (May 2014) to estimated timetable differs from the MWDS. This programme follows the approval of the Pre- Submission Draft MWLP by the County Council on 12 December 2013
Medway
The coverage of the existing Kent Minerals Local Plans is the effective mineral development plan for the area.
Core Strategy withdrawn in November 2013. Local Plan now being worked on with LDS due to be published June 2014.
Milton Keynes
Minerals Local Plan Aug-Nov 2014
Mar 2015 June 2015 Sept 2015 Early 2016

Aggregates Monitoring 2013 South East England SEEAWP 14/10
36
MPA Local Plan, DPD or SPD title
Public Participation (Reg 18)
Publish Draft (Reg
19)
Submission to S of State
(Reg 22) Estimated date of EIP
Estimated date for
Adoption Comments
Oxfordshire
Minerals & Waste Local Plan - Core Strategy;
Feb-Apr 2014
Jan 2015
Apr 2015
July 2015
Dec 2015
This is a slightly revised timetable to that in the MWDS. The MWDS does not include a site allocations DPD, but the need for such a document will be kept under review.
Surrey
Minerals Core Strategy DPD;
Primary Aggregates DPD; Minerals Proposals Map; Aggregates Recycling Joint DPD for the Minerals and Waste Plans Minerals Site Restoration SPD
Prefer Option Apr 06 Partial consultation April 2008 Preferred Option Apr 06 Nov 2009 Nov 2009
Nov 2009 Nov 2009 Nov 2009 Aug 2011
N/A
June 2010
June 2010 June 2010 Dec 2011 N/A
Oct/Nov 2010 Nov 2010- Jan 2011 Mar-June 2012
N/A
July 2011 July 2011 Dec 2012 July 2011
Adopted 19 July 2011 Adopted 19 July 2011
Consultation on Main Mods/compliance with NPPF Aug-Sept 2012 Adopted 12 Feb 2013 Adopted 19 July 2011
W Sussex
Waste Local Plan Minerals Local Plan
Jun/July 2012 June-Sept 2015
Nov 2012 – Jan 2013 Mar-Apr 2016
March 2013 July 2016
July 2013 Oct 2016
Apr 2014 Apr 2017
Joint plans in partnership with South Downs NPA. Minerals Plan dates subject to confirmation.

Aggregates Monitoring 2013 South East England SEEAWP 14/10
37
APPENDIX C: Active and Inactive Aggregate Sites, Wharves, Rail Depots, and Recycling and Secondary Aggregate sites in 2013 Sand & Gravel Berkshire Unitaries Horton Brook Quarry Aggregate IndustriesJayflex TQ 025 775 s&g
Eversley Quarry, (Fleethill Farm) CEMEX SU 850 625ssand/s&g
Kingsmead Quarry, Horton CEMEX TQ 010 753 s&g
Kennetholme Quarry, Midgham S Grundon Ltd SU 552 661 s&g
Harts Hill Copse, Upper Bucklebury Harleyford Aggregates Ltd SU 531 687ssand/s&g
Midgham Quarry, Bath Road Marley Eternit Ltd SU 552 666 s&g
Copyhold Farm, Curridge Raymond Brown SU 490 729 s&g
Sheephouse Farm, Maidenhead Summerleaze Ltd SU 890 835 s&g
Craven Keep, Hampstead Marshall Earthline Ltd SU 417 665 s&g
Star Works, Knowl Hill S Grundon Ltd SU 815 797 s&g
Lower Farm, Wasing Lafarge Tarmac Ltd SU 581 658 s&g
Poyle Quarry Rayner Family Trust TQ 015 770 s&g
Bray (Monkey Island Lane),Horton Summerleaze SU 903 790 s&g
Buckinghamshire Park Lodge, Iver Heath Brett Aggregates TQ 018 835 s&g
Harleyford Marina Harleyford Aggregates SU 834 851 s&g
The Lea, Denham Harleyford Aggregates TQ 050 860 s&g
Springfield Farm, Beaconsfield Springfield Farms SU 930 894sand/s&g
Berryhill Farm, Taplow Summerleaze Ltd SU 913 820 s&g
New Denham Summerleaze TQ 044 844 s&g
All Souls Farm, Wexham Lafarge Tarmac Ltd TQ 000 820ssand/s&g
Wapseys Wood (Hyde Farm), Beaconsfield Aggregate Industries SU 965 894 s&g
Denham Park Farm Harleyford Aggregates TQ 022 897 s&g
Spade Oak (Little Marlow) Lafarge Tarmac Ltd SU 871 880 s&g
Beechwood Nurseries, East Burnham Summerleaze Ltd SU 955 838 s&g
East Sussex and Brighton & Hove Scotney Court, Lydd Brett Aggregates TR 001 199 s&g

Aggregates Monitoring 2013 South East England SEEAWP 14/10
38
Nook Beach Simpson (Rye Harbour) Ltd TQ 927 178 s&g
Hampshire, Portsmouth & Southampton Bleak Hill Quarry, Harbridge CEMEX Materials Ltd - South East SU 131 110ssand/s&g
Bramshill (Warren Heath) Quarry CEMEX Materials Ltd - South East SU 775 597 s&g
Frithend (Grooms Farm) Quarry, Sleaford Grundon Waste Management Ltd SU 813 390 ssand
Mortimer Quarry, Mortimer West End Hanson Aggregates SU 627 646 s&g
Eversley Common Quarry, Eversley Lafarge Tarmac Ltd SU 792 591 s&g
Kingsley (Rookery Farm) Quarry Lafarge Tarmac Ltd SU 776 375 ssand
Plumley Wood, Ringwood Forest Lafarge Tarmac Ltd SU 119 099 s&g
Marchwood (Bury Farm) Quarry,Marchwood Marchwood Aggregates SU 377 112 s&g
Avon Tyrell (Ripley) Quarry, Ringwood New Milton Sand & Ballast SU 160 928 s&g
Downton Manor Farm New Milton Sand & Ballast SZ 274 931 s&g
Eversley (Chandlers Farm) Quarry CEMEX Materials Ltd - South East SU 808 618 s&g
Roke Manor Quarry, Shootash Raymond Brown SU 332 226 s&g
Isle of Wight Shorwell Sand Pit, Shorwell BR & GA Draper SZ 446 822 ssand
Cheverton Down, Shorwell Cheverton Aggregates Ltd SZ 440 840 s&g
Knighton Sand Pit Knighton Sandpit Ltd SZ 457 865ssand/s&g
St Georges Lane, Newport Wight Building Materials Ltd SZ 510 876 s&g
Hale Manor Farm Wight Building Materials Ltd SZ 454 843 s&g
Kent Aylesford Quarry, Aylesford Aylesford Heritage Ltd TQ 725 595ssand/sils
Borough Green Sand Pit, Borough Green Borough Green Sandpits Ltd TQ 617 576ssand
Charing Quarry, nr Ashford Brett Aggregates Ltd TQ 936 492ssand
Conningbrook Quarry, Ashford Brett Aggregates Ltd TR 031 437 s&g
Faversham Quarries Brett Aggregates Ltd TR 014 626 s&g
Lydd Quarry (Scotney Court Farm), Lydd Brett Aggregates Ltd TR 020 201 s&g
Shepherd’s Farm Quarry (Lenham) Brett Aggregates Ltd TQ 592 150 s&g
Denge Quarry, Dungeness CEMEX UK TR 775 220 s&g
Ightham Sand Pit H & H Celcon Ltd TQ 560 195 ssand
Wrotham Quarry (Addington Sand Pit) Hanson Aggregates TQ 647 594ssand/sils
Darenth & Joyce Green, Dartford J Clubb Ltd TQ 560 724 s&g
East Peckham Quarry, E Peckham J Clubb Ltd TQ 679 492 s&g
Nepicar Sand Quarry, nr Sevenoaks J Clubb Ltd TQ 625 579 ssand
Greatness Farm (Sevenoaks Quarry), S’oak Tarmac Ltd TQ 537 573 ssand

Aggregates Monitoring 2013 South East England SEEAWP 14/10
39
Allens Bank, Lydd Brett Aggregates Ltd TR 044 217 s&g
Joyce Green Quarry Hanson (Joyce Green Aggregates) TQ 539 759s&g
Stone Castle Farm, nr Tonbridge Lafarge Tarmac Ltd TQ 651 470 s&g
Ham Hill Sand Pit (Snodland Quarry) Lafarge Tarmac Ltd TQ 693 610 ssand
Medway Stoke Road, Hoo St Werburgh Lafarge Tarmac Ltd TQ 795 725 s&g
Perrys Farm, Isle of Grain J Clubb Ltd TQ 880 763 s&g
Milton Keynes Caldecote Farm, Newport Pagnell SGS Construction Ltd SP 876 422 s&g
Manor Farm, Old Wolverton Hanson Aggregates SP 803 421 s&g
Land s of Caldecote Farm, Newport Pagnell SGS Construction Ltd SP 878 422 s&g
Calverton, E of Passenham Quarry GRS Roadstone Ltd SP 778 392 s&g
New Forest National Park Fawley (Badminston Farm) Quarry Mid Hants Ltd SU 467 021 s&g
Oxfordshire Sutton Wick Quarry, Abingdon J Curtis & Sons Ltd SU 491 951 s&g
Shellingford Quarry Earthline Ltd SU 327 937 ssand
Wicklesham Quarry, Faringdon Grundon SU 293 941 s&g
Sutton Courtenay Quarry (Bridge Farm) Hanson Aggregates SU 517 943 s&g
Hatford Quarry, Hatford Hatford Quarry Ltd SU 334 954 ssand
Chinham Farm, Faringdon Hills Quarry Products Ltd SU 313 948 ssand
Upwood Quarry, Besselsleigh Hills Quarry Products Ltd SP 453 005 ssand
Duns Tew Quarry Smiths Bletchington Ltd SP 455 276 ssand
Gill Mill Quarry, Ducklington Smiths Bletchington Ltd SP 369 074 s&g
Moorend Lane Farm, Thame David Einig Contracting Ltd SC 067 713 s&g
Stanton Harcourt Quarry, Stonehenge Farm Hanson Aggregates SP 408 022 s&g
Worton Rectory Farm, Cassington Hanson Aggregates SP 475 110 s&g
Chinham Hill, Faringdon Hills Quarry Products Ltd SU 314 952 ssand
Caversham Quarry Lafarge Tarmac Ltd SU 739 749 s&g
Finmere Quarry Opes Industries SP 628 322ssand/s&g
South Downs National Park West Heath Quarry, West Harting CEMEX/RMC Agg. (Southern) Ltd SU 784 228 ssand

Aggregates Monitoring 2013 South East England SEEAWP 14/10
40
Minsted Sandpit, Minstead Dudman Aggregates Ltd SU 855 215 ssand
Novington Sand Pit Dudman Group of Companies TQ 367 145 ssand
Heath End Quarry, Duncton Dudman Aggregates Ltd SU 963 188 ssand
Coates Sand Pit, Coates, nr Fittleworth Birlington Estate SU 998 176 sand Pendean
Quarry, Pendean, West Lavington CEMEX/RMC Agg. (Southern) Ltd SU 890 200 sand
Surrey Tapwood Quarry, Buckland Hanson Aggregates TQ 230 510 s&g
Reigate Road Quarry, Betchworth J & J Franks Ltd TQ 206 505 ssand
Queen Mary Reservoir, Ashford Reservoir Aggregates TQ 071 696 s&g
Home Farm Quarry Extension, Shepperton Shepperton Aggregates TQ 056 688 s&g
North Park Quarry, Godstone Sibelco UK TQ 341 517 ssand
Runfold South Quarry, Farnham SITA SU 863 470 ssand
Hengrove Farm, Staines Henry Streeter Ltd TQ 052 721 s&g
Moorhouse Sandpits, Limpsfield Titsey Estates TQ 419 534 ssand
Hithermoor Quarry, Stanwell Moor Brett Aggregates Ltd TQ 037 745 s&g
Farnham Quarry (Alton Road) CEMEX UK SU 820 449 ssand
Homefield Sandpit, Runfold Chambers Runfold plc SU 876 475 ssand
Shepperton Quarry, Shepperton Shepperton Aggregates TQ 058 674 s&g
West Sussex Sandgate Park Quarry, Sullington CEMEX/RMC Agg.(Southern) Ltd TQ 103 141 ssand
Chantry Lane Quarry, Sullington Dudman Aggregates Ltd TQ 094 139 sand
Rock Common Sandpit, Washington Dudman Aggregates Ltd TQ 126 135 ssand
Hampers Lane Sandpit, Sullington Britannia Crest Recycling TQ 107 138 sand
Kinsham Dudman Aggregates Ltd SU 862 033 s&g
Boxgrove - TQ 916 082 s&g
Hambrook Hanson Aggregates TQ 770 082 s&g
Crushed Rock Berkshire Unitaries Buckinghamshire East Sussex and Brighton & Hove Hampshire, Portsmouth and Southampton Medway
Aggregates Monitoring 2013 South East England SEEAWP 14/10
41
Milton Keynes Surrey None
Kent Hermitage Quarry, Maidstone Gallagher Aggregates TQ 722 560 rag
Blaise Farm, West Malling Hanson Aggregates TQ 660 560 rag
Isle of Wight Prospect Quarry Wight Building Materials Ltd SZ 438 866 limes
Oxfordshire Alkerton Quarry Peter Bennie Ltd SP 387 431 irons
Wroxton Fields Quarry, Wroxton Peter Bennie Ltd SP 405 415 irons
Shellingford Quarry Earthline Ltd SU 327 937 limes
Shipton on Cherwell Quarry Earthline Ltd SP 476 175 limes
Hatford Quarry, Hatford Hatford Quarry Ltd SU 334 954 limes
Chinham Farm, Faringdon Hills Quarry Products Ltd SU 313 948 limes
Upwood Quarry Hills Quarry Products Ltd SP 453 005 limes
Burford Quarry Smiths Bletchington Ltd SP 277 099 limes
Ardley (Dewars Farm) Quarry Smiths Bletchington Ltd SP 540 250 limes
Rollright Quarry Phase 2 Smiths Bletchington Ltd SP 284 306 limes
Rollright Quarry Phase 1 Hanson Aggregates SP 284 306 limes
Whitehill Quarry Smiths Bletchington Ltd SP 270 108 limes
South Downs National Park Bognor Common Stone Quarry, Fittleworth Local Stone Co. Ltd TQ 007 215 sstone
Winters Pit, Easebourne, nr Midhurst Shropshire Stone & Granite Ltd TQ 894 236 sstone
Wharves
Berkshire Unitaries Buckinghamshire Milton Keynes Oxfordshire South Downs National Park Surrey None

Aggregates Monitoring 2013 South East England SEEAWP 14/10
42
East Sussex and Brighton & Hove Rastrums Wharf, Rye Brett Aggregates Ltd TQ 939 192 cr
North Quay, Newhaven (Berth 1) Newhaven Roadstone/Tarmac TQ 447 016 m
North Quay, Newhaven (Berth 4) European Metal Recycling TQ 447 019
North Quay, Newhaven (Berth 2) Lafarge Tarmac Ltd?? TQ 447 017 m
North Quay, Newhaven (Berth 5) Newhaven ERF TQ 445 021
North Quay, Newhaven (Berth 3) - TQ 447 018
Rye Wharf Hanson Aggregates TQ 930 197
Brittania Wharf, Shoreham port - TQ 264 047
Ferry Wharf, Shorehamport - TQ 264 047
Hampshire, Portsmouth and Southampton Kendall’s Wharf, Portsmouth Kendall Bros SU 675 032 m
Fareham Wharf, Fareham Lafarge Aggregates SU 580 059 m
Marchwood Wharf, Marchwood Lafarge Aggregates SU 399 112 m
Leamouth Wharf, Southampton CEMEX Materials Ltd - South East SU 433 123 m
Bedhampton Wharf, Havant Lafarge Tarmac Ltd SU 705 056 m
Burnley Wharf, Southampton Lafarge Tarmac Ltd SU 430 117 m Supermarine Quay, Woolston, S’hampton Aggregate Supplies SU 435 118 m
Dibles Wharf, Southampton Dudman Group SU 432 122 m&cr
Tipner Wharf, Portsmouth Lafarge Tarmac Ltd SU 640 036 m
Isle of Wight Kingston South, East Cowes Isle of Wight Aggregate SZ 450 943 m&cr
Medina Wharf, West Cowes Isle of Wight Aggregate SZ 449 946 m
Blackhouse Quay, Newport Blackhouse Quay Aggregate SZ 450 898 m
Kent Robins Wharf, Northfleet Aggregate Industries TQ 561 174 cr
Dunkirk Jetty, Dover Wharf Brett Aggregates Ltd TR 320 404m
East Quay, Whitstable Wharf Brett Aggregates Ltd TR 108 671 cr
Ramsgate New Port, Ramsgate Brett Aggregates Ltd TR 379 639 cr
Ridham Dock, Ridham Brett Aggregates Ltd TQ 592 168 cr
Robins Wharf (Grove Road), Northfleet Brett Aggregates Ltd TQ 616 751 m
Northfleet Wharf (Botany Marshes), N’fleet CEMEX UK TQ 611 759 m
Denton Wharf (Clubb Marine) Gravesend J Clubb Ltd TQ 667 742 m
Johnsons Wharf, Greenhithe Lafarge Tarmac Ltd TQ 582 751 m

Aggregates Monitoring 2013 South East England SEEAWP 14/10
43
Ridham Dock, Sittingbourne Lafarge Tarmac Ltd TQ 919 687 m
Red Lion Wharf, Gravesend Stema Shipping (UK) Ltd TQ 617 750 m&cr
Medway Cliffe Terminal Brett Aggregates Ltd TQ 720 755 m
Isle of Grain, Grain Foster Yeoman Ltd TQ 875 741 cr
Eurowharf, Frindsbury, Rochester Hanson Aggregates TQ 754 695 m&cr
West Sussex Hall Aggregate Wharf, Shoreham CEMEX UK TQ 263 046 cr&m
Turberville/Penneys Wharf, Southwick Dudman Aggregates Ltd TQ 240 049 cr&m
Free Wharf, Shoreham Menelco Specialities Ltd TQ 222 050 m
New Wharf, Shoreham Kendall Bros (Portsmouth) Ltd TQ 224 050 m
Solent /ARC Wharf, Portslade Lafarge Tarmac Ltd TQ 254 048 m&cr
Kingston Wharf, Shoreham formerly UMA TQ 230 050 m
ARC/LDF Wharf, Shoreham Lafarge Tarmac Ltd TQ 256 048
Railway Wharf, Littlehampton Lafarge Tarmac Ltd TQ 019 023 cr
Rail Depots East Sussex and Brighton & Hove Isle of Wight Medway South Downs National Park None Berkshire Unitaries Colnbrook Aggregate Industries TQ 042 777 s&g/cr
Theale Aggregate Industries SU 635 706 s&g/cr
Theale Hanson Aggregates SU 635 704 cr
Buckinghamshire Thorney Mill Road, West Drayton Aggregate Industries TQ 049 795 cr
Hampshire, Portsmouth and Southampton Botley Rail Depot, Botley Aggregate Industries SU 520 133 cr
Eastleigh Rail Depot, Eastleigh Aggregate Industries SU 461 183 cr
Fareham Rail Depot, Fareham Kendall Bros SU 570 063 cr
Kent Allington Rail Sidings, Allington Hanson Aggregates TQ 574 157 s&g/cr
Aggregates Monitoring 2013 South East England SEEAWP 14/10
44
Hothfield Works, Westwell Lafarge Tarmac Ltd TQ 598 146 s&g/cr
East Peckham Rail Depot J Clubb Ltd TQ 679 492 cr
Sevington, Waterbrook, Ashford Brett Aggregates Ltd TR 035 402 cr
Milton Keynes Full Goods Yard, Bletchley Station CEMEX UK SP 869 338 s&g/cr
Oxfordshire Appleford Sidings, Sutton Courtenay Hanson Aggregates SP 518 932 cr/s&g
Oxford Road, Kidlington Hanson Aggregates SP 119 503 cr
Hennef Way, Banbury Lafarge Tarmac Ltd SP 461 419 cr/s&g
Shipton on Cherwell Quarry Earthline Ltd SP 476 175 cr
Hinksey Sidings, Oxford Network Rail SP 513 045 cr
Surrey British Rail Down Yard, Woking Day Aggregates TQ 001 582 cr/s&g
Salfords Rail Aggregate Depot Day Aggregates TQ 285 459 s&g
West Sussex Tinsley Goods Yard, Crawley CEMEX UK TQ 287 390 cr
Railway sidings, Chichester Dudman Aggregates Ltd SU852 104 cr
Crawley Rail Depot Day Aggregates TQ 286 389 cr
Crawley Goods Yard, Crawley Aggregate Industries TQ 286 389 cr
Ardingly Rail Depot, Ardingly Hanson Aggregates TQ 339 276 cr
Sites Producing Secondary & Recycled Aggregates Berkshire Unitaries Colnbrook Rail Depot Aggregate Industries TQ 042 777 C&D Old
Stocks Farm Alderemaston Aldermaston Recycling SU 586 631 C&D
Copyhold Fm Quarry, Priors Ct Road, Curridge Copyhold WTS SU 493 729 C&D
Herons Nest WTS, Sheffield Bottom, Theale Hadleys SU 676 706 C&D
Barton Court Farm, Station Road, Kintbury Hills Waste SU 387 676 C&D
Reading Quarry, Berry Lane, Pingewwod J Mould SU 686 697 C&D
Simpson Way, Slough Simpson Environmental Services SU 969 805 C&D

Aggregates Monitoring 2013 South East England SEEAWP 14/10
45
Whitehouse Farm, Silchester Road, Tadley J Stacey SU 608 627 C&D
Bray Quarry Summerleaze SU 903 790 C&D
Hindhay Quarry, Maidenhead Summerleaze SU 867 830 C&D
Avon Site, Colthrop United Asphalt SU 535 670 C&D
Poyle Recycling Centre Wiggins Transport Ltd TQ 027 760 C&D
Unconfirmed whether active or inactive:
Horwoods Yard, Green Lane, Maidenhead Horwoods SU 895 806 C&D
St Georges Lane, Ascot Shorts Transfer Station SU 927 685 C&D
Buckinghamshire Thorney Mill Road, West Drayton Aggregate Industries TQ 049 795 C&D
Unit 13 Bisons Industrial Estate, Iver Cappagh Public Works Ltd TQ 033 801 C&D
Lockharts Farm G Ives SP862 228 C&D/Ind
Spade Oak (Little Marlow) Lafarge Tarmac Ltd SU 871 880 C&D
Summerleys Farm, Princes Risborough C Putnam & Sons SP 796 037 C&D
Wapseys Wood Quattro SU 985 894 C&D
Chiltern View Nursery Westside Land Ltd SP 847 099 C&D
Unit 53 Binders Industrial Estate Wycombe Recycling Ltd SU 878 971 C&D
Unit 44 Binders Industrial Estate Wycombe Traders & Skip Hire SU 878 971 C&D
Park Lodge, Iver Heath Brett Aggregates TQ 018 835 C&D
All Souls Farm, Wexham Laqfarge Tarmac Ltd TQ 000 820 C&D
New Denham Quarry Summerleaze Ltd TQ 042 846 C&D East Sussex and Brighton & Hove Wealden Worms Mr Allen TQ 527 320 C&D
Hazelbank, Maresfield AM Skips TQ 459 255 C&D
Brett Drive, Bexhill Brett Concrete TQ 759 078 C&D
Hollingdean Depot Brighton & Hove Council TQ 317 061 C&D
Woodland House R French & Sons TQ 793 108 C&D
Units 2G/H Hawthorn Estate, Newhaven Greenacre Recycling Ltd TQ 451 020 C&D
Diplocks Way, Hailsham Haulaway Ltd TQ 581 091 C&D
Ashdown Brickworks Ibstock Ltd TQ 720 095 C&D
Unit 3, Cradle Hill Ind Est, Seaford Martin James TQ 497 003 C&D
Tarmac Topblock, Ninfield Lafarge Tarmac TQ 688 122 C&D
Cophall Wood, nr Polegate PJ Mini Skip Hire TQ 576 067 C&D
Newhaven Roadstone Newhaven Roadstone Ltd TQ 448 016 C&D

Aggregates Monitoring 2013 South East England SEEAWP 14/10
46
Pebsham Waste & Recyclables, Pebsham Pebsham Waste & Recyclables TQ 769 088 C&D
City Recycling Centre Skip it TQ 265 046 C&D
The Old Timber Yard, Newhaven Skip It TQ 446 091 C&D
Down Barn Farm, Ninfield Mr D Stone TQ 717 110 C&D
North Quay Road, Newhaven Sussex Skips TQ 448 016 C&D
Unit 19 Bellbrook Industrial Estate Wealden District Council TQ 464 206 C&D
Broad Farm, Hellingly Woollard Earth Moving TQ 574 126 C&D
Hampshire, Portsmouth and Southampton Yokesford Hill, Romsey Ace Liftaway SU 358 239 C&D
Eastleigh Rail Depot, Eastleigh Aggregate Industries SU 461 183 C&D
Harts Farm Way, Havant Conroy’s Group SU 705 057 C&D
Beacon Hill, Ewshot Cranston Bros SU 819 501 C&D
Thruxton Airfield, Thruxton Earthline Ltd SU 280 455 C&D
Eastleigh Rail Sidings, Eastleigh Network Rail SU 458 186 C&D
Waterbrook Road, Alton Hutchings & Carter Ltd SU 730 398 C&D
Four Dell Farm HWM Group SU 454 244 C&D
Dock Gate 20, Southampton Docks K&B Crushers SU 386 125 C&D
Lode Farm, Kingsley Lafarge Tarmac Ltd SU 776 375 C&D
Blashford Quarry, Ellingham Lafarge Tarmac Ltd SU 146 082 C&D
Farlington Redoubt, Portsmouth/Havant L&S Waste Management SU 687 064 C&D
Bury Farm, Marchwood Marchwood Aggregates SU 377 112 C&D
Caird Avenue, New Milton New Milton Sand & Ballast SZ 255 454 C&D
Manor Farm, Pennington New Milton Sand & Ballast SZ 312 304 C&D
Lee Lane, Nursling Raymond Brown SU 361 168 C&D
Rookery Farm, Swanwick Raymond Brown SU 512 092 C&D
Barton Stacey, Longparish Raymond Brown SU443 430 C&D
Blue Haze, Ringwood Raymond Brown SU 119 074 C&D
Gold Farm, Aldershot R Collard Ltd SU 883 518 C&D
Warren Heath, Bramshill R Collard Ltd SU 784 494 C&D
Mortimer Lane, Fairoak R&R Contractors and CWM SU 503 187 C&D
Wallington Depot, Fareham SITA SU 591 069 C&D
Hollybush Lane, Aldershot Taurus SU 885 524 C&D
Bunny Lane, Timsbury Waltet Materials & RFSF SU 355 251 C&D
Bury Farm, Curbridge Wessex Demolition & Salvage SU 525 112 C&D
Wade Road Depot, Basingstoke Basingstoke Skip Hire SU 651 535 C&D
Bleak Hill, Harbridge Cemex Materials Ltd - South East SU 131 110 C&D
Aggregates Monitoring 2013 South East England SEEAWP 14/10
47
Hollybush Lane, Aldershot Chambers Ltd SU 885 524 C&D
Calf Lane, Odiham Comley & Sons Ltd SU 773 498 C&D
Manor Farm, Tadley GB Foot/Basingstoke Skip Hire SU 608 556 C&D
Down Barn Farm, Fareham Graham Moyse SU 591 073 C&D
Empress Road, Southampton - SU 428 132 C&D
Eversley Haulage Park, Eversley R Collard Ltd SU 788 591 C&D
Charity Farm, Fareham TJ Landfill SU 577 088 C&D
Isle of Wight Blackhouse Quay, Newport Blackhouse Quay Aggregate SZ 450 898 C&D
Knighton Sand Pit Knighton Sand Ltd SZ 475 865 C&D
Duxmore Quarry Reynolds & Read Ltd SZ 445 875 C&D
Kent Ridham Dock, Sittingbourne Ballast Phoenix TQ 920 682 C&D
Borough Green Sand Pit, Sevenoaks Borough Green Sandpits Ltd TQ 617 576 C&D
Conningbrook Quarry Brett Aggregates Ltd TR 031 437 C&D
Faversham Quarries Brett Aggregates Ltd TR 014 626 C&D
Clubbs Marine Wharf, Gravesend (Denton) J Clubb & Sons Ltd TQ 557 742 Ind
East Peckham Rail Depot J Clubb & Sons Ltd TQ 680 489 C&D
FM Conway Works, Dartford FM Conway TQ 513 736 C&D
Hermitage Quarry, Maidstone Gallagher Aggregates Ltd TQ 722 560 C&D
Allington Depot Hanson Aggregates TQ 744579 C&D
Hothfield Works, Ashford Lafarge Tarmac Ltd TQ 981 462 ind
Snodland (Ham Hill Quarry) Lafarge Tarmac Ltd TQ 693 610 C&D
Manor Way, Swanscombe Lancebox TQ 607 749 C&D
Tilmanstone Works RH Ovenden Ltd TR 625 150 C&D
Pinden Quarry, nr Dartford Pinden Plant & Processing TQ 559 169 C&D
Richborough Hall, Sandwich Thanet Waste Services TR 333 608 C&D
Shelford Landfill, Canterbury Viridor Waste Management TR 163 601 C&D
Sevington Rail Depot Brett Aggregates Ltd TR 035 402 C&D/ind
Greatness Integrated Waste Manage. Facility Cory Environmental TQ 536 577 C&D
Stonelees Golf Course Ovenden Earthmoving Co Ltd TR 335 626 C&D
Medway Isle of Grain Ballast site Aggregate Industries Ltd TQ 871 743 C&D
Kingsnorth Power Station E.0n (closed in 2013) TQ 810 720 PFA&BFA

Aggregates Monitoring 2013 South East England SEEAWP 14/10
48
George Summers Close, Medway City Estate Lisa Langley Ltd TQ 697 755 C&D
Milton Keynes Bletchley Landfill FCC Environment SP 863 320 C&D
Oxfordshire Grove Park, Wantage Aasvogel SU 385 894 C&D
Ferris Hill Farm, Hook Norton Banbury Skips SP 355 350 C&D
Prospect Farm, Chilton Chilton Waste Services SU 496 848 C&D
Shellingford Quarry Earthline Ltd SU 330 938 C&D
Shipton on Cherwell Quarry Earthline Ltd SP 476 175 C&D
Worton Rectory Farm, Cassington David Einig Contracting Ltd SP 475 112 C&D
Playhatch Quarry, Sonning Grabloader Ltd SU 741 761 C&D
Ewelme Landfill No 2 Grundon Waste Management SU 645 906 C&D
Appleford Sidings, Sutton Courtenay Pit Hanson Aggregates SU 490 946 C&D
Rumbold’s Pit, Ewelme Hazell & Jeffries SU 647 942 C&D
Shipton Hill, Fulbrook Hickman Bros. SP 268 139 C&D
Tubney Wood Quarry, Tubney Hills Quarry Products Ltd SP 448 008 C&D
New Wintles Farm, Eynsham McKenna Plant Hire (Oxford) Ltd SP 432 108 C&D
Lakeside Industrial Park Standlake Micks Skips Ltd SP 409 056 C&D
Sandfields Farm, Chipping Norton KJ Millard Plant Hire & Sales Ltd SP 322 293 C&D
Drayton Depot Oxfordshire County Council SU 486 935 C&D
Burford Quarry Pavestone Ltd SP 278 095 C&D
Dix Pit ,Stanton Harcourt Sheehan Haulage & Plant Hire Ltd SP 404 052 C&D
Slape Hill Quarry, Glympton Sheehan Haulage & Plant Hire Ltd SP 422 197 C&D
Didcot ‘A’ Power Station RWE Npower SU 505 924 PFA
Gill Mill Quarry, Ducklington Smiths Bletchington Ltd SP 374 070 C&D
Upwood Quarry, Besselsleigh Hills Quarry Products Ltd SP 453 005 C&D
Old Brickworks, Bletchingdon MR Miller (Plant Hire) SP 518 158 C&D
Hundridge Farm, Ipsden GD Parker SU 669 858 C&D
Milton Road, Bloxham Smiths of Bloxham SU 439 352 C&D
South Downs National Park Shoreham Cement Works, Upper Beeding Dudman Group Ltd TQ 201 089 C&D
Valdoe Quarry Dudman Group Ltd TQ 878 084 C&D
Herberdens Farm, Finchdean A Fisk SU 739 140 C&D
Aggregates Monitoring 2013 South East England SEEAWP 14/10
49
Greystone Quarry, Southerham Lane, Lwes MDJ Light Bros Ltd TQ 432 091 C&D
Newtimber Chalk Works, Pyecombe Robins of Herstmonceux TQ 277 137 C&D
Butser Hill Lime Quarry, Buriton George Ewen SU 726 203 C&D
Slindon Bottom Gravel Pit Taylor Plant & Haulage Ltd TQ 950 082 C&D
Surrey Hithermoor Quarry, Stanwell Moor Brett Aggregates Ltd TQ 035 749 C&D
Land west of Queen Mary Reservoir, Ashford Brett Aggregates TQ 059 698 C&D
Little Orchard Farm, Hookwood Britaniacrest Recycling Ltd TQ 259 445 C&D
Capital House, Woodham Capital Demolition Ltd TQ 034 627 C&D
Stanwell Quarry Cappagh TQ 052 746 C&D
Homefield Sandpit, Runfold Chambers Runfold plc SU 875 474 C&D
20-24 Westfield Road, Guildford Chambers Waste Management Ltd TQ 003 523 C&D
Runfold South Quarry, Runfold R Collard Ltd SU863 472 C&D
Normans Corner, Smallfield R&S Etherington TQ 320 441 C&D
Reigate Road Quarry, Betchworth J&J Franks Ltd TQ 203 504 C&D
Kill Copse Farm, Shamley Green Guildford Tipper Hire Ltd TQ 043 420 C&D
Shepperton Quarry, Shepperton Killoughery Ltd TQ 059 677 C&D
Oakleaf Farm, Stanwell Moor Charles Morris (Fertilizer) Ltd TQ 044 743 C&D
Plough Industrial Estate, Leatherhead D&E Roberts TQ 163 573 C&D
2 Perrylands Lane, Smallfield Blockade Services Ltd TQ 308 427 C&D
Weylands Treatment Works, Hersham General Demolition Ltd TQ 125 656 C&D
Sunnyside, Worplesdon John Gunner & Co Ltd SU 951 526 C&D
West Sussex Holmbush Farm, Faygate, Crawley PJ Brown TQ 235 351 C&D
Burleigh Oaks Farm, Turners Hill Cox Skips 534596 136398 C&D
(Former) Hurstpierpont WWTW Edburton Contractors TQ 279 182 C&D
Northwood Farm, Yapton Envirowaste Southern Ltd TQ 986 025 C&D
Monks Way, Lancing Penfold Verrall TQ 197 058 C&D
South Coast Skips, Ford The Rabbit Group 499897 102500 C&D
Portfield Quarry, Chichester TJ Waste Ltd 488101 105297 C&D
Tangmere Compost Site The Woodhorn Group 491901 105396 C&D
Portfield Quarry, Chichester Lafarge Tarmac Heavy Ltd TQ 881 053 C&D